
Submitted:
28 September 2024
Posted:
29 September 2024
You are already at the latest version
Preprints on COVID-19 and SARS-CoV-2
Abstract
Background: The COVID infection became the source of serious disagreements between scientists, doctors, politicians and private citizens, directly after it’s detection in the population in January 2020. The pandemic had some very unusual properties as well as the people’s reaction to it. It was feared, that the virus might be used, intentionally or accidentally, to interfere with the usual, democratic way of the upcoming election. Objective: Re-search the original COVID statistic and metadata to obtain better understanding of the pandemic including the biological (viral) as well as the social (human) aspects of it. Provide a professional, independent, non-biased view of the pandemic, that is not polluted by political and media suggestions. Methods: Publicly available data – covering the first 5 months of the COVID pandemic, 2020 Jan-May - were collected and analyzed with the usual, common statistical methods, like student’s t-test and regression analyses.The political attitude of the states were characterized by a ratio (D/R) of the number of left, democrat (D) and right, republican (R) oriented citizens in the respective states, as determined by opinion research. Results: De novo statistical analyzes of publicly available data (covering the initial five months of the pandemic) suggests that the negative medical consequences of COVID pandemic were significantly more expressed in “democrat-dominated” (D) states than in “republican-dominated”, (R) states. The proportion of COVID test positive persons was higher in D-states (6.831 +/- 1605, n=14 and 1,165 +/- 323, n=13 respectively, p<0.001). The difference in mortality was even more striking, 8-times more person/million population died in COVID related conditions in solid D states than in solid R states (438 +/- 128, and 59 +/- 13; p<0.001, respectively). The COVID associated mortality increased two fold from right to left on the political scale of the states (2.7% +/- 0.3 vs. 5.3% +/- 0.5, p<0.001). The correlation between COVID deaths (mortality) and the age/pre-existing medical condition(s) of the diseased is very strong (R2= 0.98) and the overwhelming majority of COVID “victims” are persons who were close to death even independently of the epidemic. Conclusions: Alarming signals regarding the dangerousness of COVID infection seems to have originated in a few states with predominantly left oriented citizens (high D/R ratio). The COVID mortality statistic seems to be seen and analyzed with little or no respect for the context of mortality caused by other well-known diseases or even by the natural, age related deaths. We conclude that it is absolutely necessary to pay serious attention to the correct analyses and interpretation of the epidemic data to avoid being misled or manipulated by false circumstances.
Keywords:
COVID-19
; pandemic
; political
; mortality
; age
; aging
; co-morbidity
; underlying cause of death
; UCOD
; USA
; States
Summary
De novo statistical analyzes of publicly available data suggests that the negative medical consequences of COVID pandemic are significantly more expressed in “democrat-dominated” (D) states than in “republican-dominated”, (R) states. The proportion of COVID test positive persons is higher in D-states (6.831 +/- 1605 [mean+/-S.E.M], n=14 and 1,165 +/- 323, n=13 respectively, p<0.001). The difference in mortality is even more striking, 8-times more person/million population died in COVID related conditions in solid D states than in solid R states (438 +/- 128, and 59 +/- 13; p<0.001, respectively). The COVID associated mortality increases two fold from right to left on the political scale of the states (2.7% +/- 0.3 vs. 5.3% +/- 0.5, p<0.001).
The correlation between COVID deaths (mortality) and the age/pre-existing medical condition(s) of the diseased is very strong (R2= 0.98) and the overwhelming majority of COVID “victims” are persons who were close to death even independently of the epidemic. Indeed, most of the COVID deaths are “subtractive” i.e. they didn’t increase the annually expectable number of “normal” or “regular” deaths. Only a few states with the highest number of cases (NY, NJ, CT, MA and MI) were “additive” to the number of expected deaths and, by that way, exerted some unusually negative effect on the average death-rate of the American population.
These novel and controversial observations request (and even demand) critical, independent, unbiased review and external confirmation.
Introduction
We became painfully familiar with some facts regarding the nature of COVID-19 and the trouble – real and manmade – it could case to us. There are more lessons to learn.
At about 84K deaths in USA are associated with COVID infection today (2020.05.13), the 134th day of year 2020, that is in average ca. 630 a day (max 2,683/d on April 21, declining; ca 2,000/d last 30 days).
However people are dying every day even without COVID: the average number or “regular” (here: non-COVID) deaths were 5,739/d, there 4,335/d persons (75%) were >65 years in 2018 [1].
Subjectively every deaths is a tragedy and should be prevented, objectively it is not possible. Consequently the medical impact of COVID depends on the number of additional, extra (not “regular” or not “expected”) deaths it might have caused.
America is slowly recovering from COVID epidemics and its socio-economic consequences. It begins to be possible to see the real events and objectively evaluate the impact of the virus itself and the consequences of our reaction to it. What is/was the cost of the infection itself – in terms of life and suffering – compared to the cost of the “cure” – in terms of saved life and life-quality? Is it possible that the “cure costs more than the disease itself?
The only meaningful approach to this cost/benefit calculation is to see facts with cold rational objectivity and distance us from the distorting influence of the media and political wish-thinking.
This review of COVID statistic is focusing on the possible “political bias” in interpretation of data and influencing the American response to the situation. Are “We, the People” altogether, winners (in relative terms) or big losers (in absolute terms) at the end of the epidemic?
Materials and Methods
Publicly available data (covering the first 5 months of the COVID pandemic, 2020 Jan-May) were used as indicated in the related footnotes and analyzed with the usual, common statistical methods, like student’s t-test and regression analyses.
Discovery and Statistical Findings
- COVID is observed in every country of the World with functioning media services (212 countries and territories around the world and 2 international conveyances) [2].
- COVID is preferentially associated with the death of sick and vintage population.
THE SEVERITY OF COVID DISEASE – INCLUDING ITS MORTALITY – IS STRONGLY DEPENDENT ON THE AGE AND PRE-EXISTING CONDITIONS OF THE INFECTED PERSONS.
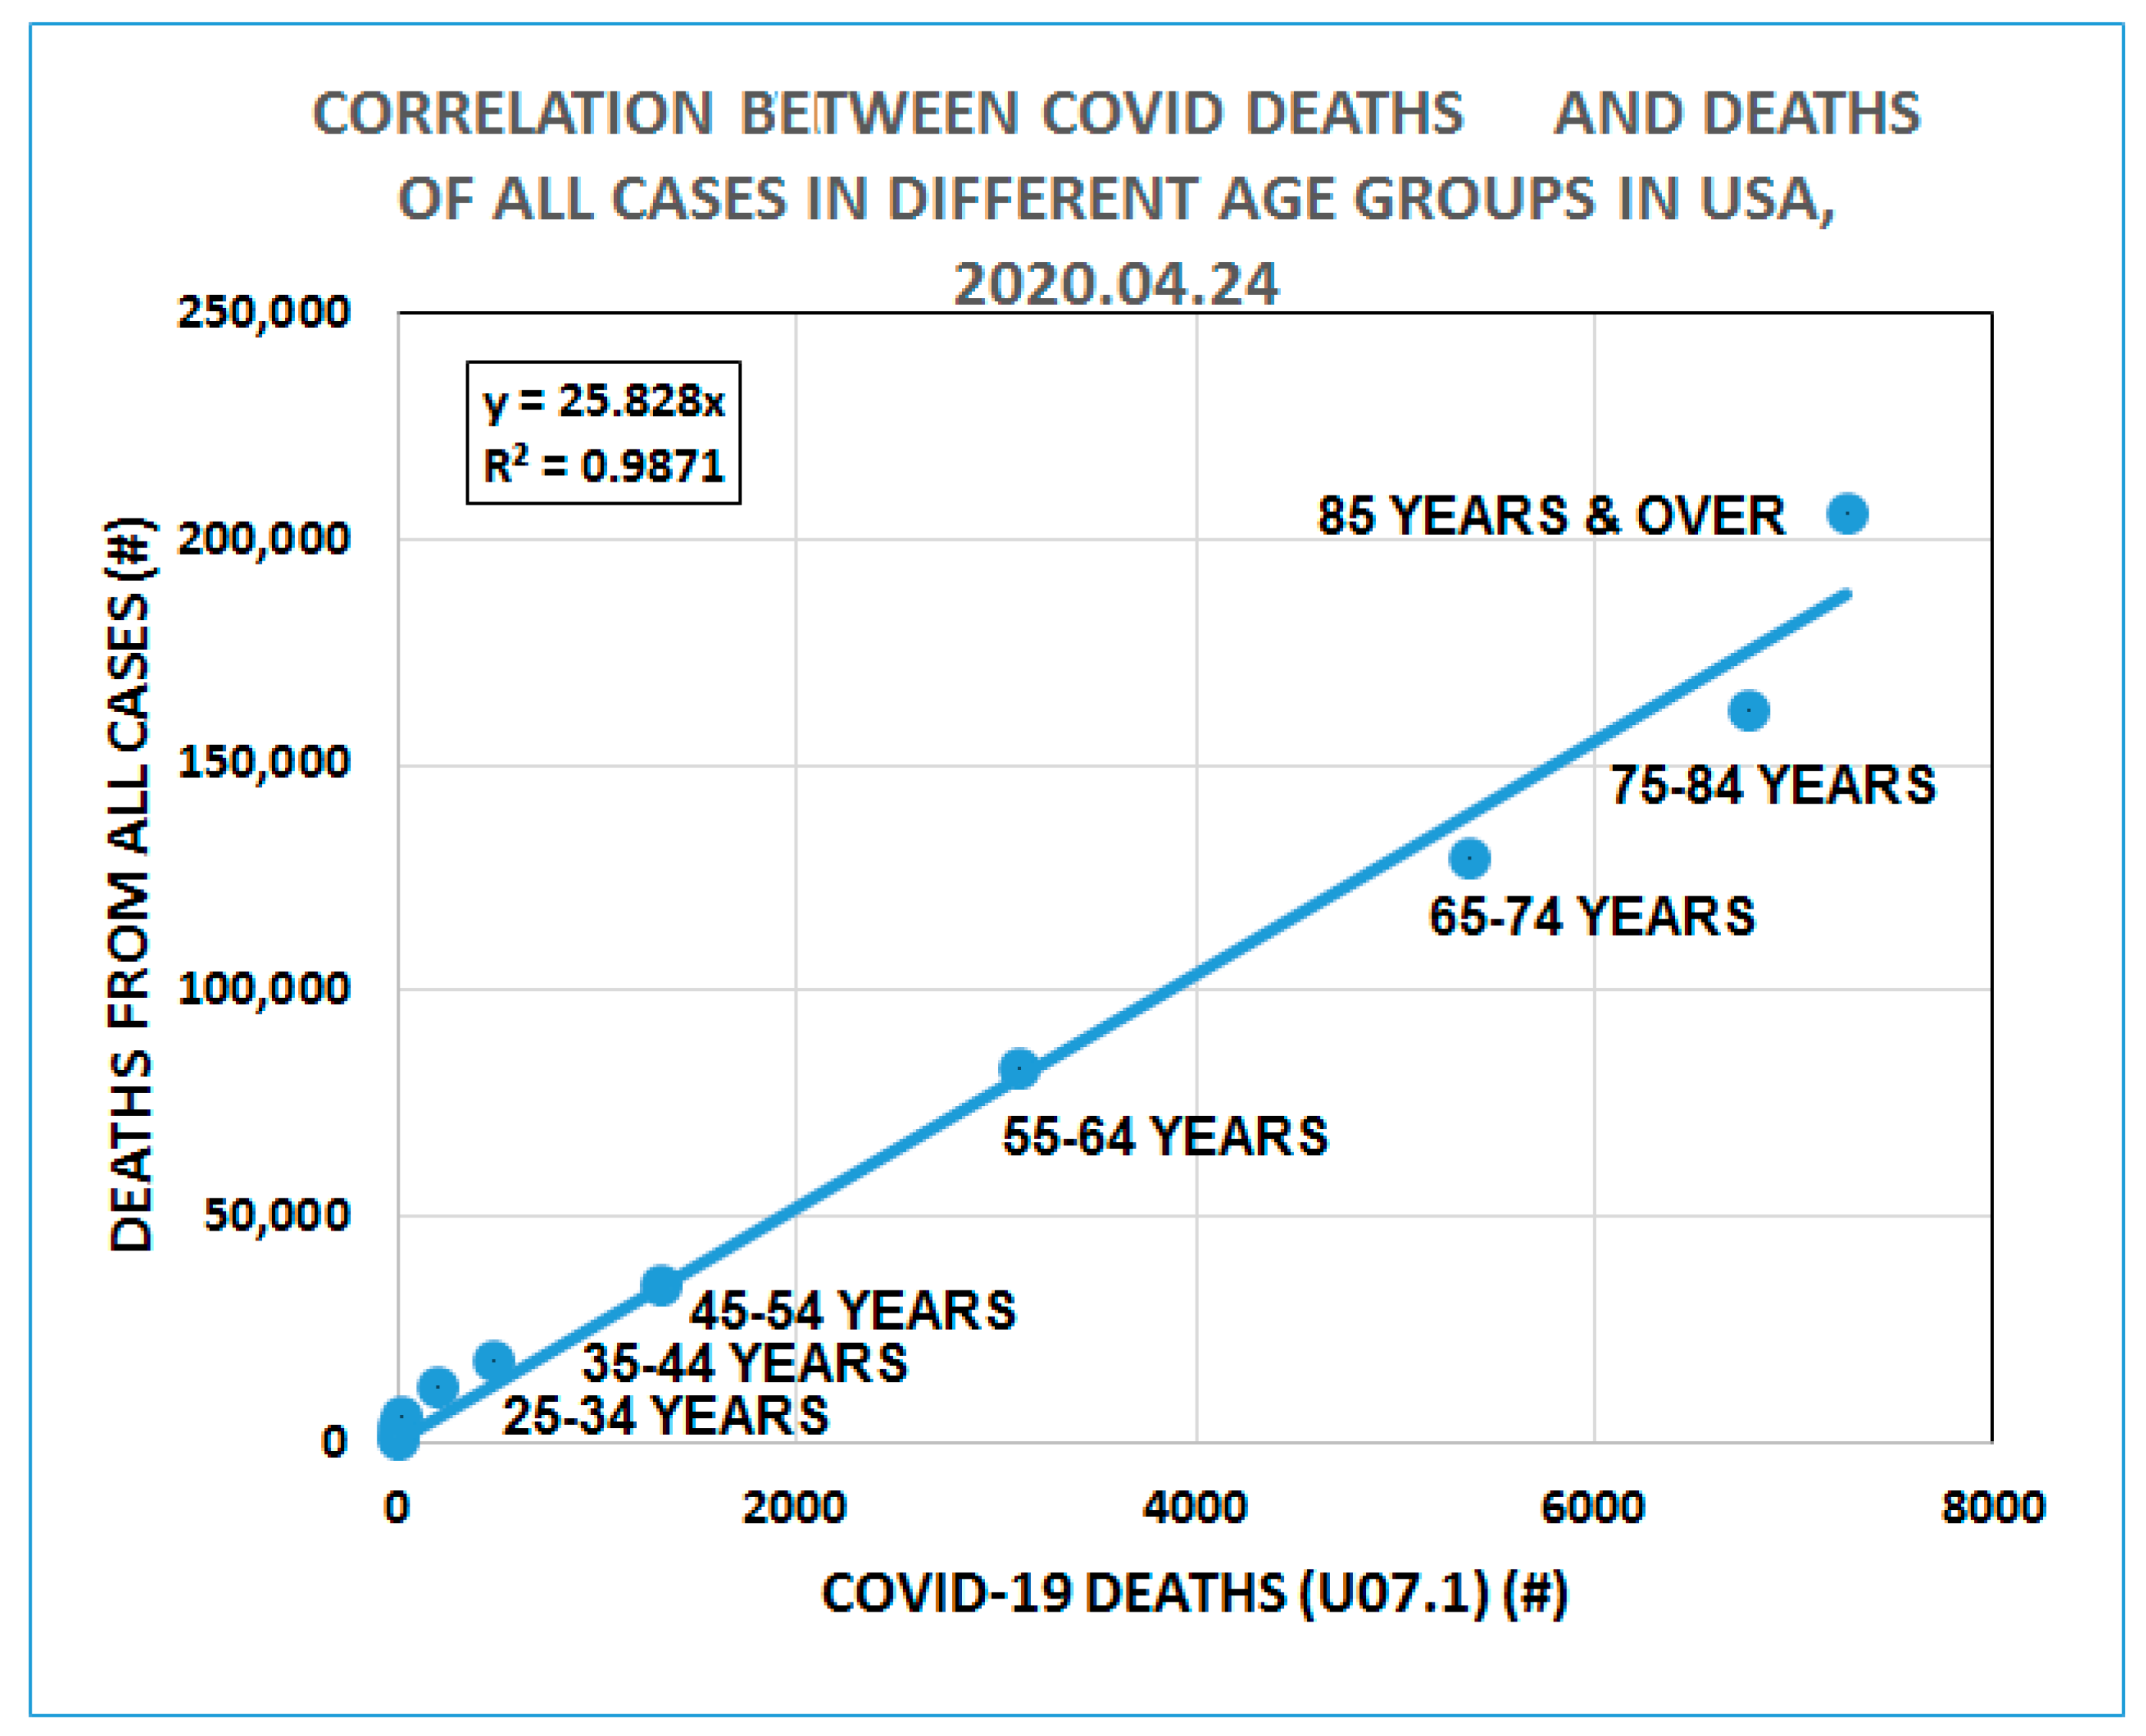
This is one of the first observations regarding the COVID pandemic: it is selective, targeting physically weakened individuals, elderly and sick. However the degree of correlation between the age and mortality risk is surprisingly strong (r2=0.98) Figure 1.
Figure 1.
Correlation between COVID & ALL Deaths in Different Age Groups in USA. Source of original data: https://cdc.gov/nchs/nvss/vsrr/covid19/ – April 24th 2020.
Figure 1.
Correlation between COVID & ALL Deaths in Different Age Groups in USA. Source of original data: https://cdc.gov/nchs/nvss/vsrr/covid19/ – April 24th 2020.
- 3.
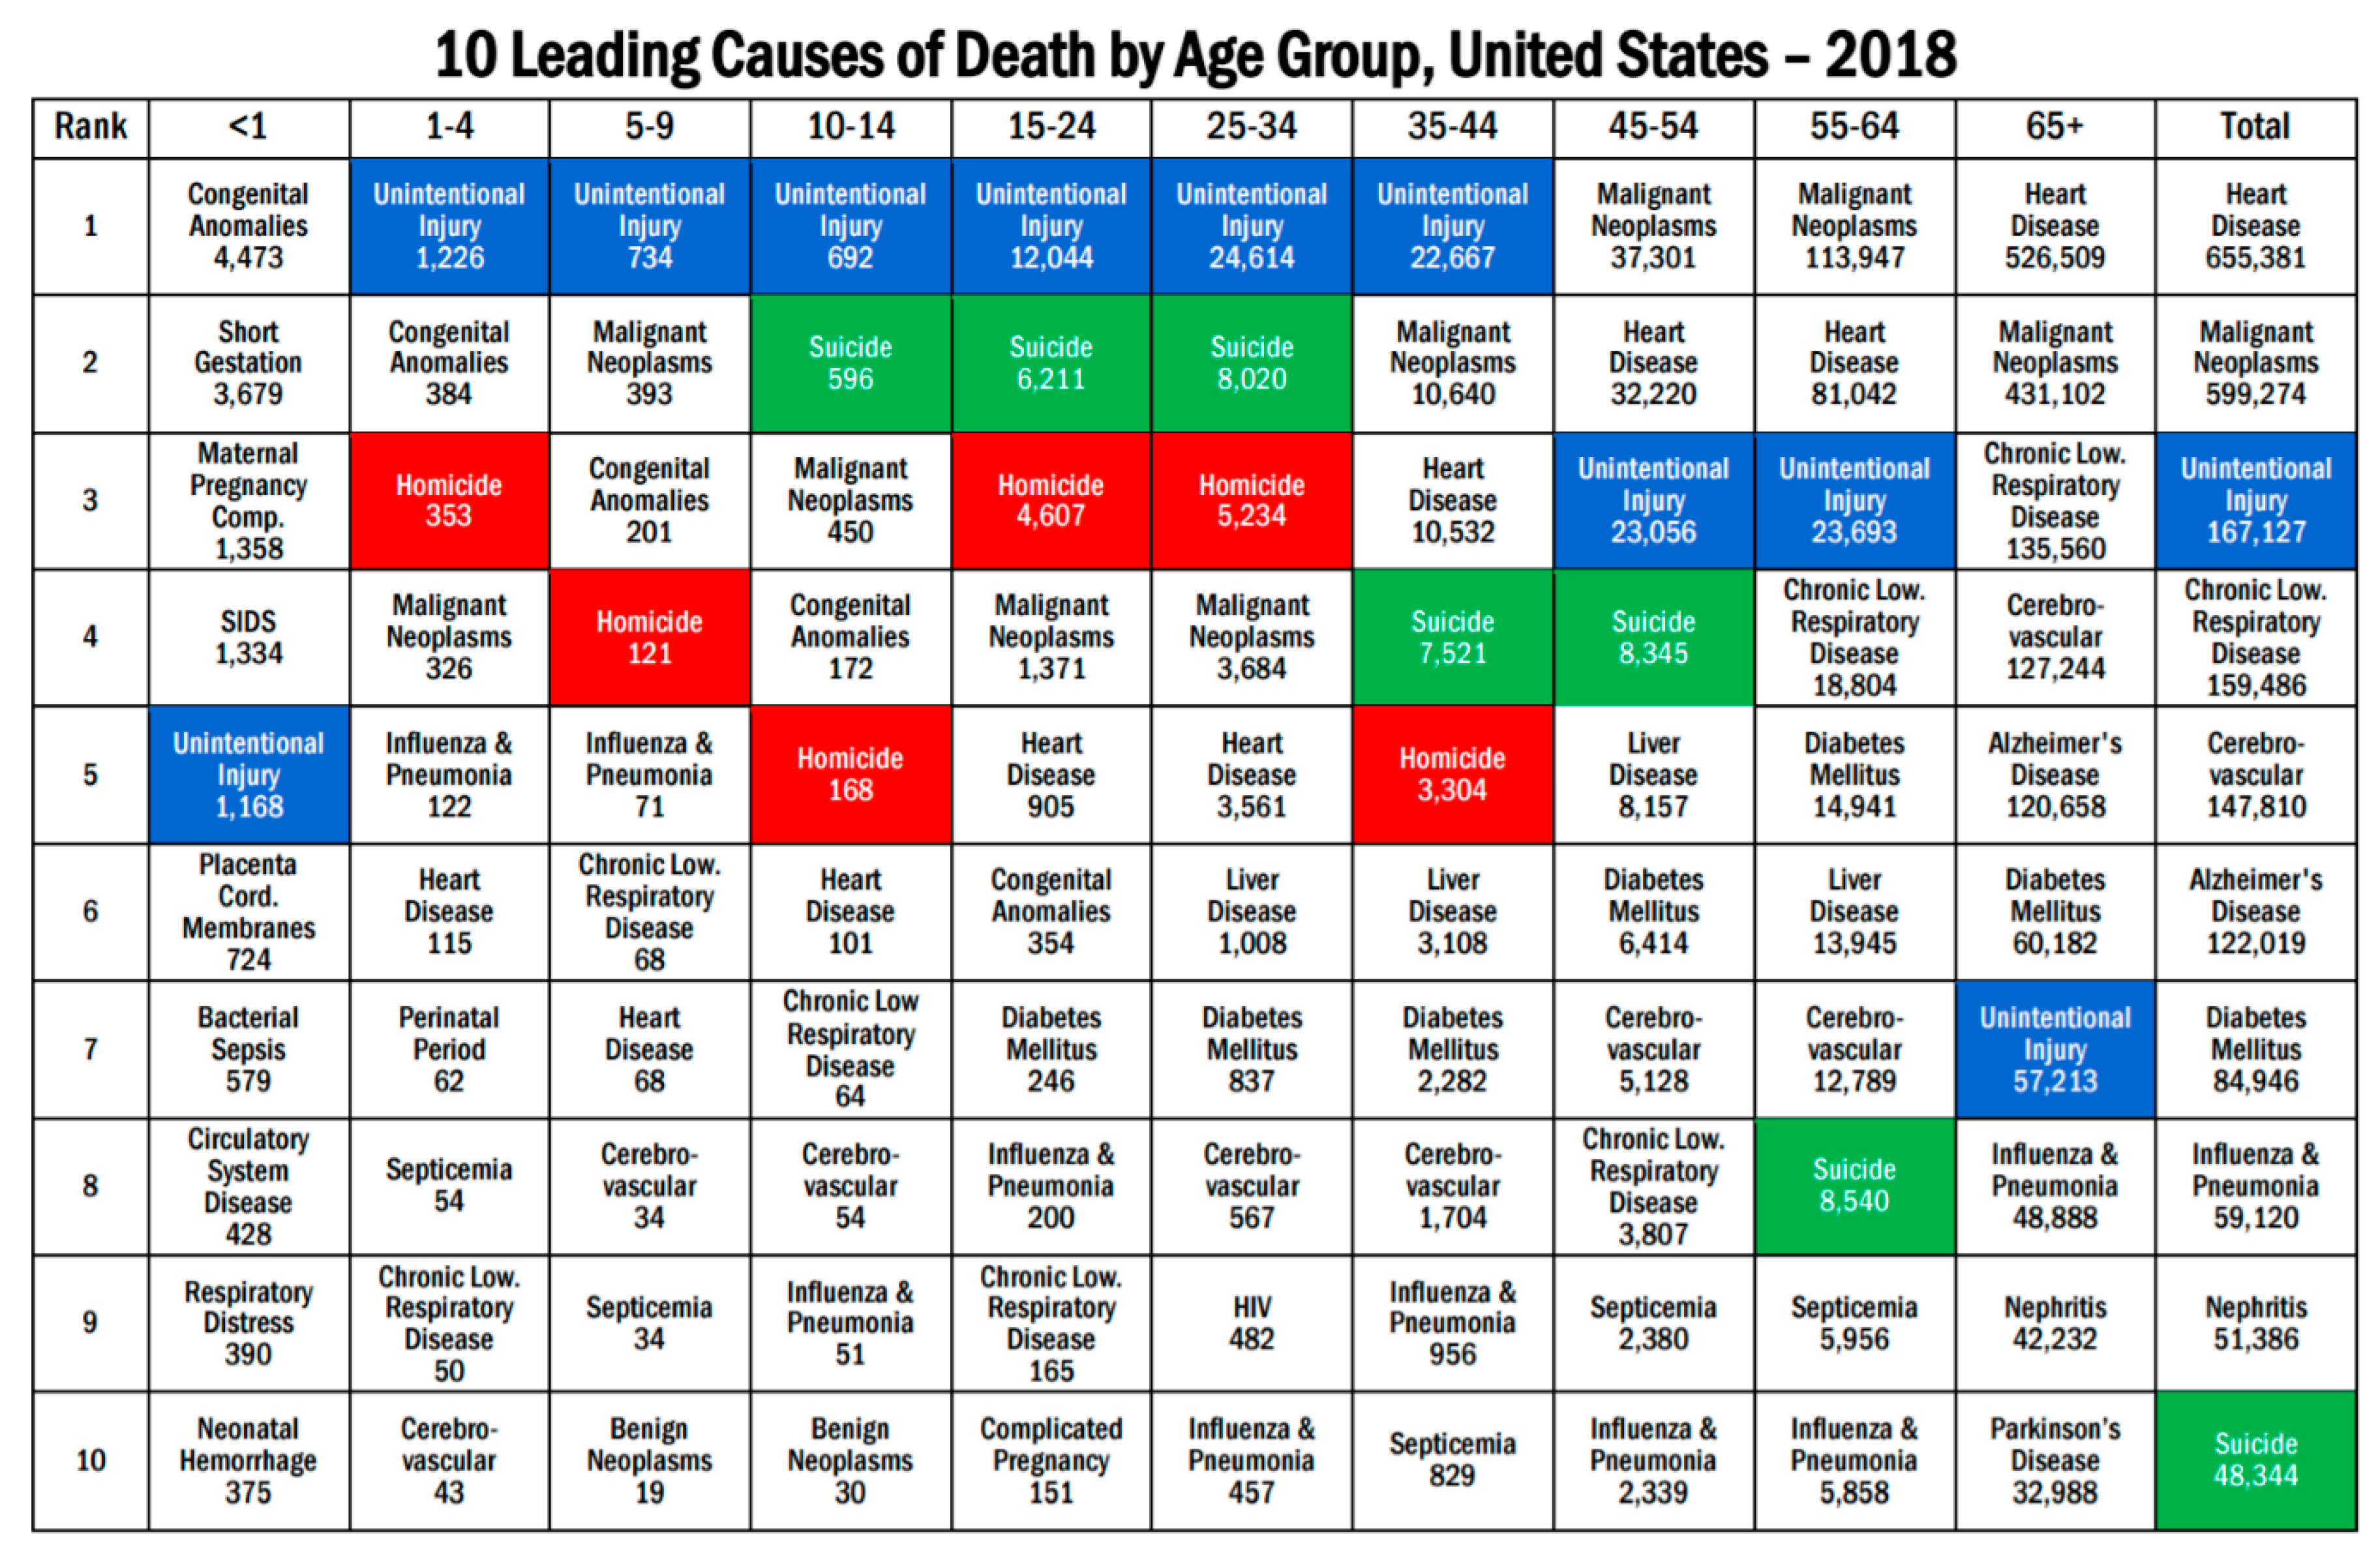
- Comparison of the effects of COVID with other serious and life-threatening diseases might provide a good insight into the seriousness of the ongoing epidemic. The first and very important understanding should be that COVID is not the worst killer. Assuming that the rate of COVID deaths continued on the same level as today, (ca. 1,400/day that is 20% of the total, “regular”, “usual” non-COVID deaths) it comes on the third place after heart diseases (ca. 1.800/day) and malignant tumors (ca. 1650/day). Figure 2. Table 1.
Figure 2.
Leading causes of death in USA and the theoretical effect of Coronavirus (CV). .
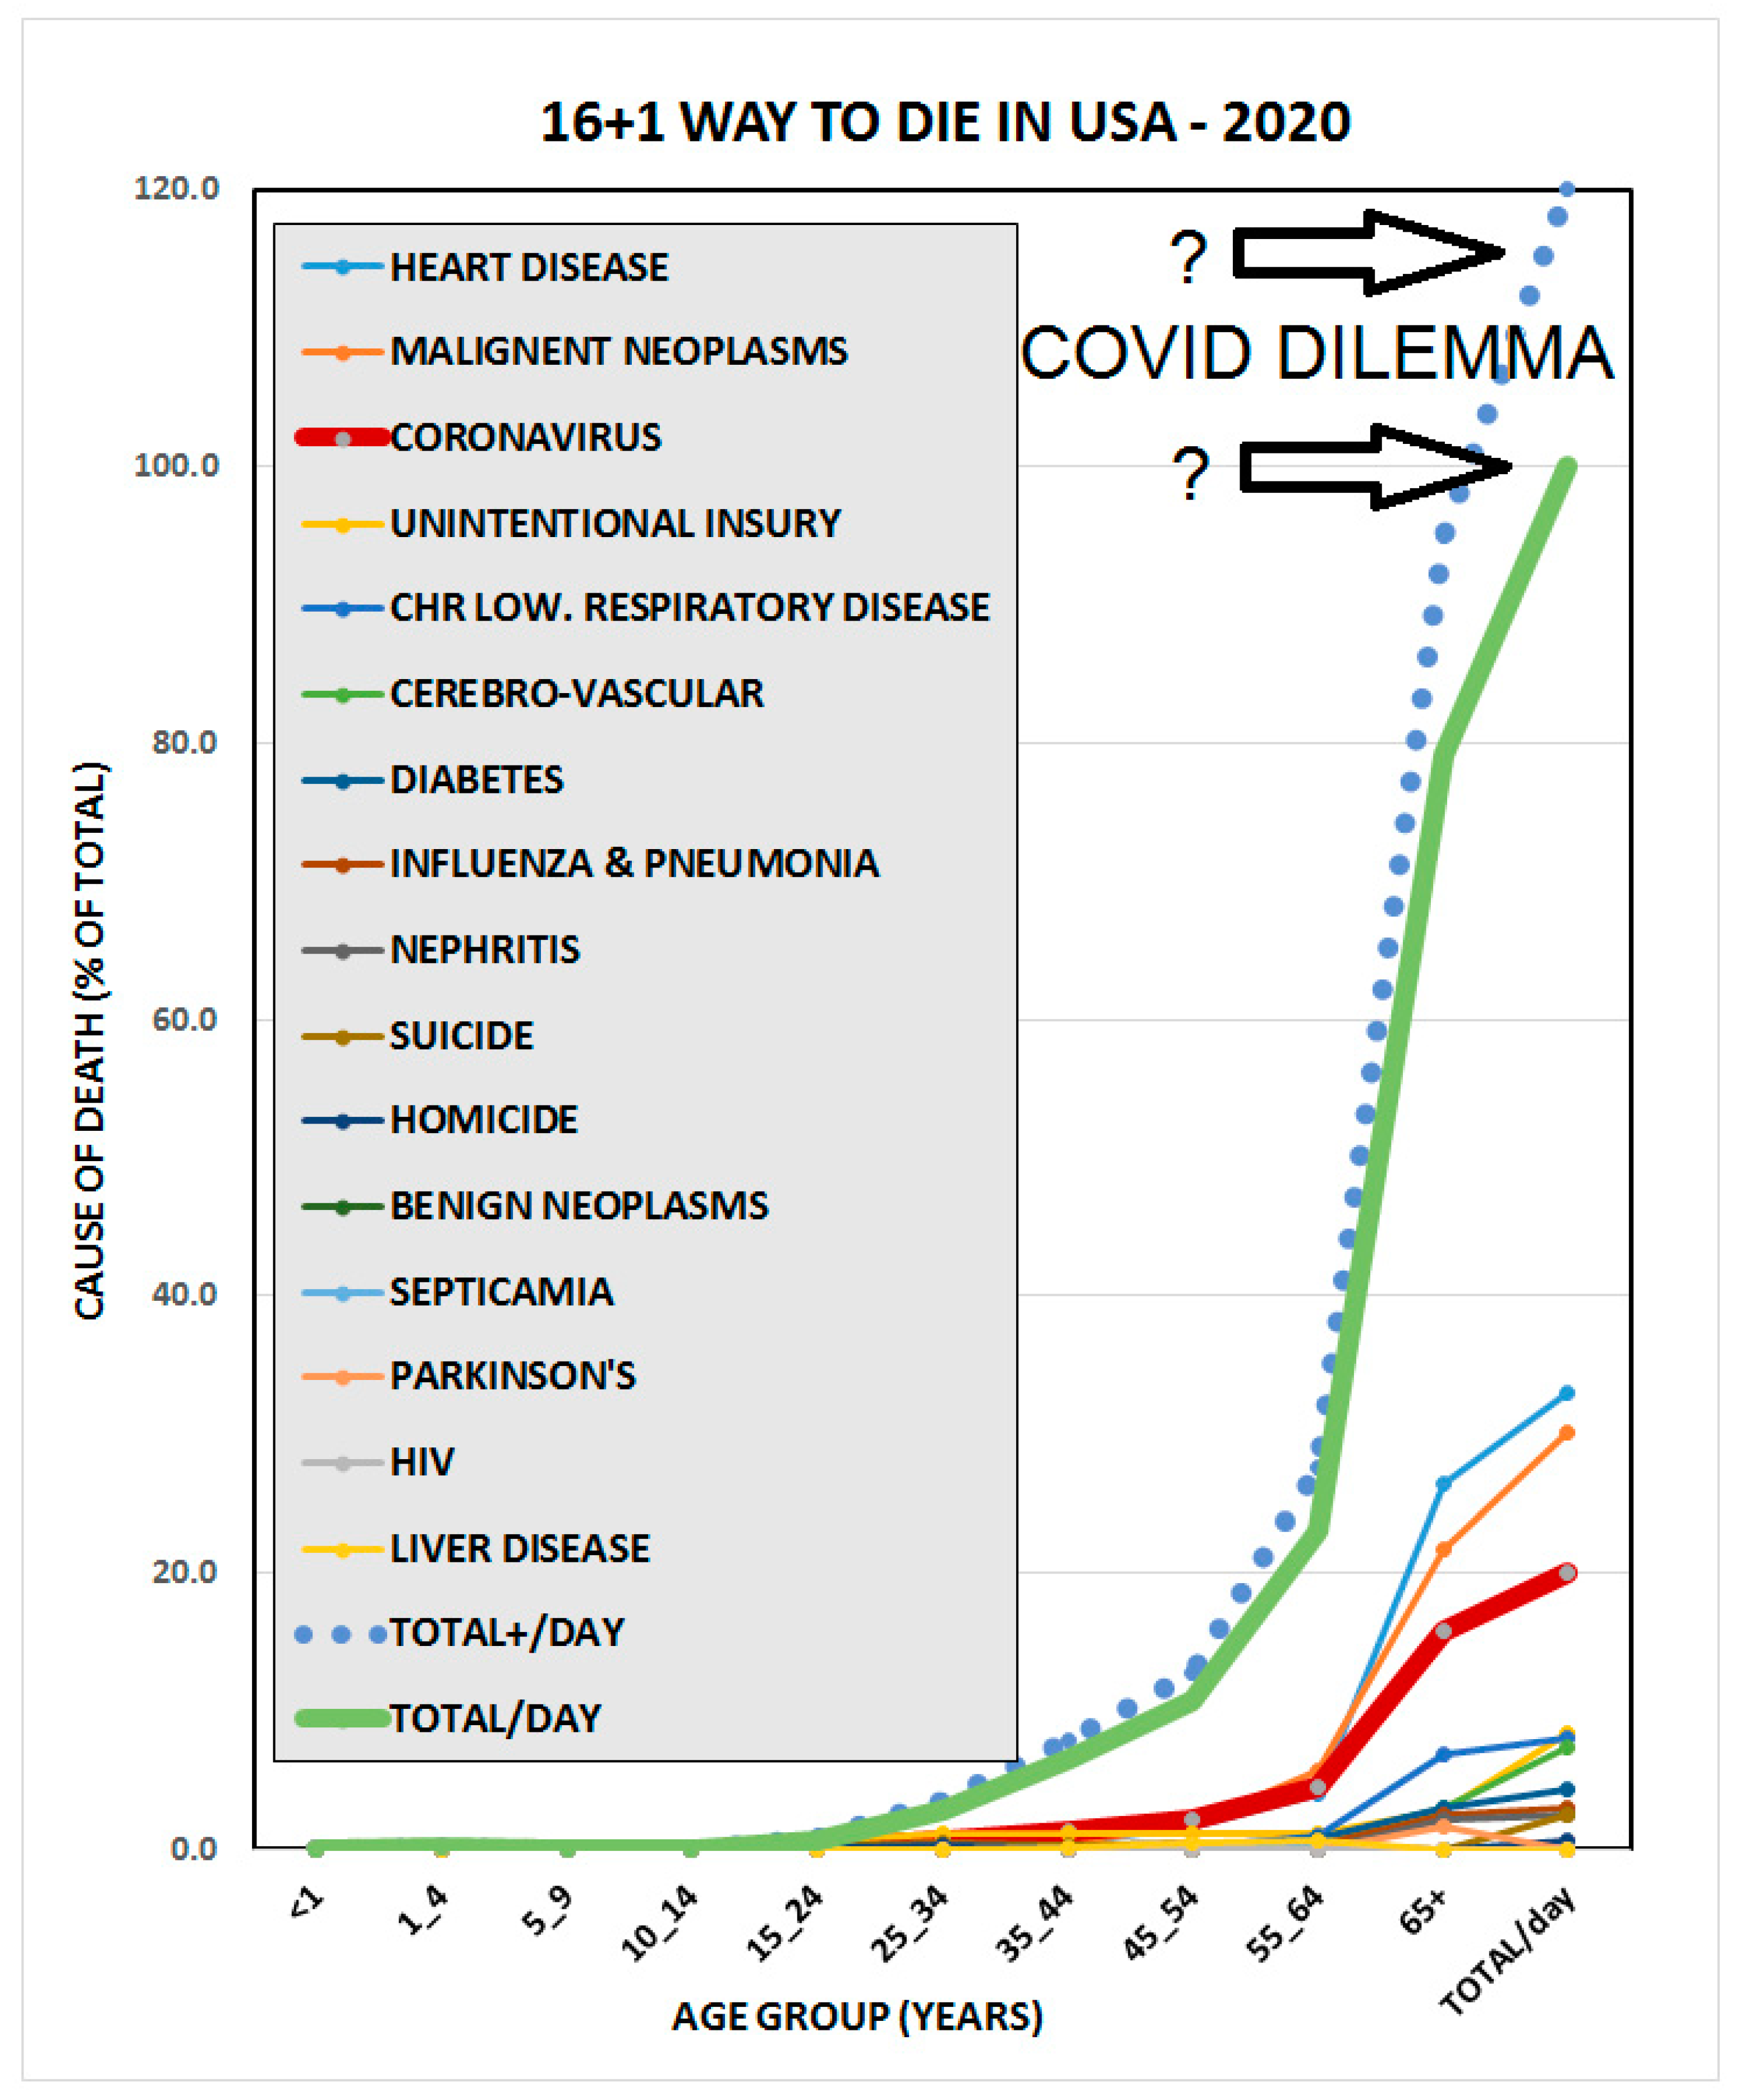
The frequency (% of total) of the leading causes of death (16 from the table, above) in USA, 2018 were indicated in different age groups. The sum of all deaths in the indicated causes and all age groups were regarded to be 100% = 2,094,893 deaths/yea = 5,739 deaths/day. The corresponding deaths were calculated from the available data and regarding a single day, 2020.04.06.

Table 1.
[3].
Table 1.
[3].
 |
- 4.
- The CV dilemma is - if the virus epidemic continues a year – a) will it add, say 20%, (as today), to the deaths caused by the already existing and known causes or, alternatively b) the national mortality remains unchanged, i.e. statistically speaking (!) “only” those will pass away who would die anyway in the coming 12 months?
- 5.
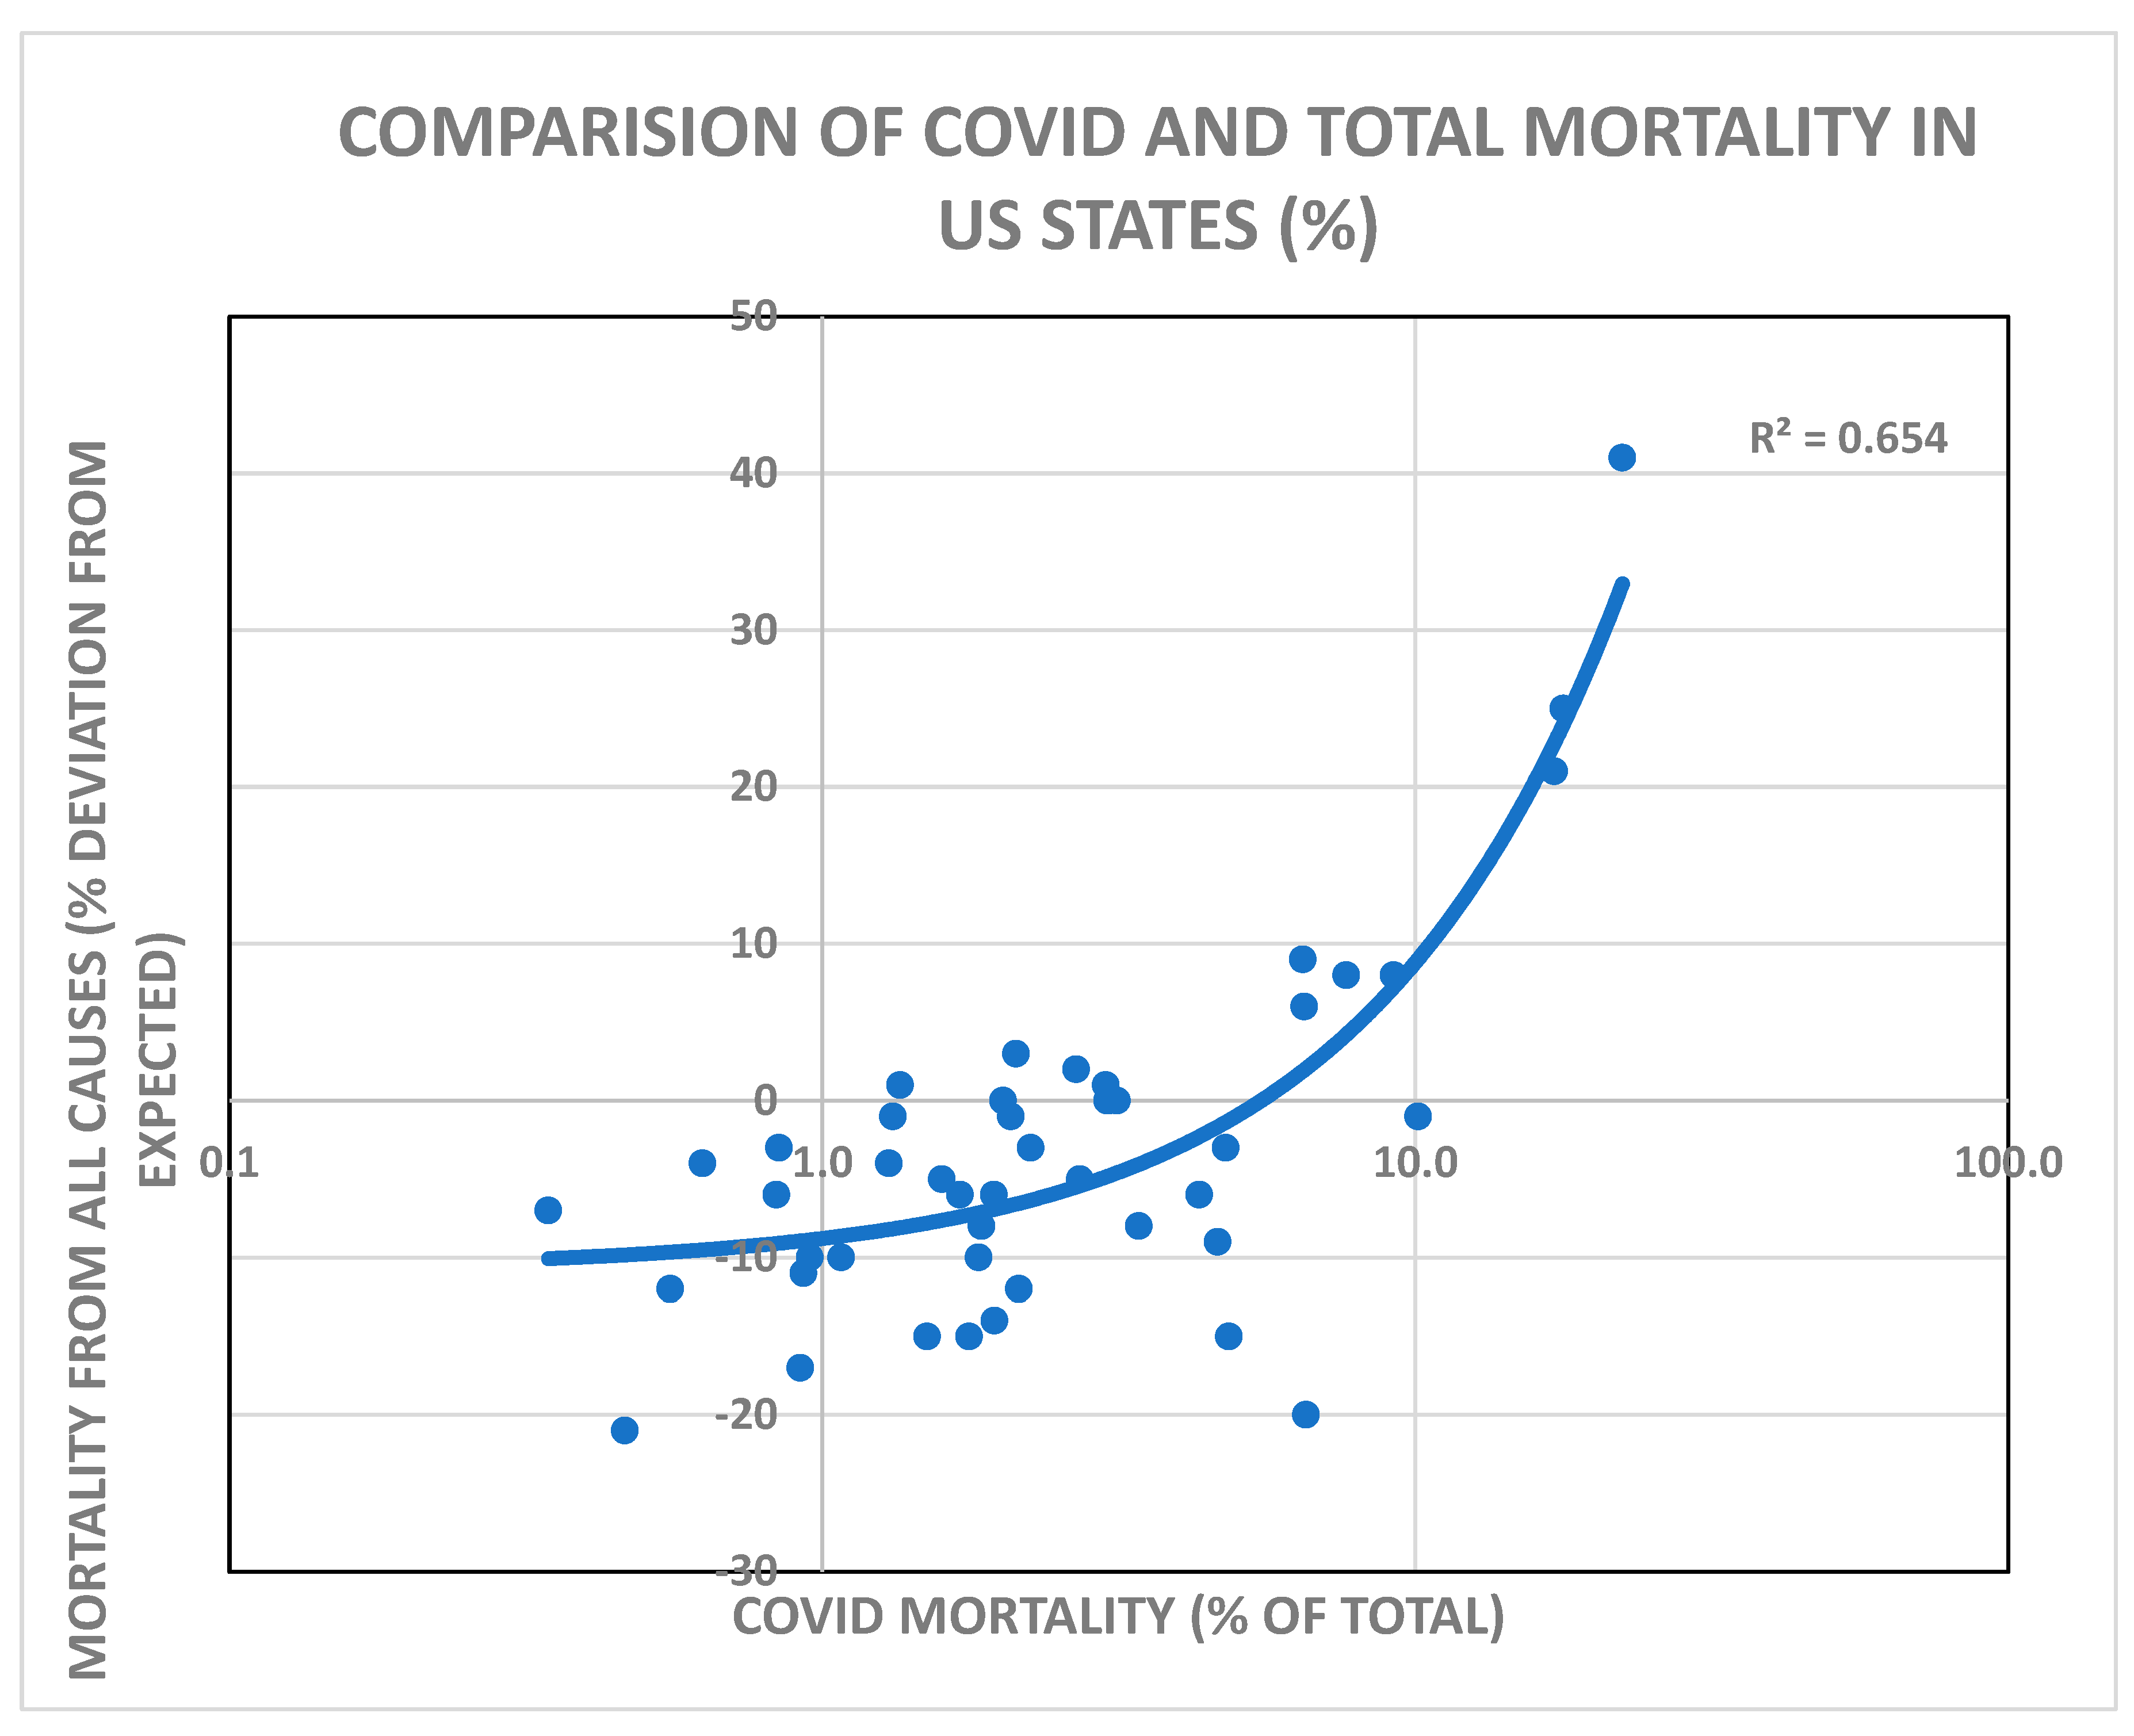
- The negative economic and biological impact of the COVID pandemic is exceptionally large but varies from one state to another. Figure 3. COVID increased the number of total (expected, ALL) deaths in some, but not in every states. It is most noticeable in the most infected areas (NY, NJ, MA, MI, IL, MD, CO).
- 6.
- The selective nature of the medical consequences of COVID disease is a significant difficulty to determine the exact mortality of the disease. It targets almost exclusively seniors and/or persons with serious pre-existing conditions, i.e. persons with increased risk of death even without COVID infection. No one completely healthy young person diseased due to exclusively COVID infection. Consequently the virus is more likely a minor contributing factor in (many) deaths, "the last drop makes the cup run over" and not the sole responsible agent.
Figure 3.
Comparison of the number of COVID and total deaths in US States based on period 02/01/2020 to 05/09/2020. The expected number of ALL deaths was regarded 100% and the average frequency of COVID deaths was 3.7% of total (at the end of the period). Source of original data: Provisional death counts Coronavirus Disease (COVID-19) [4]. – See even Figure 5.
- 7.
- Comparison of the preliminary mortality statistics in the 50 US States suggests that the number of total deaths were significantly increased by COVID only in a few states, it remained at or below the expected level (same as in previous years).
- 8.
- This very un-uniform effect of COVID in different states motivated further search for explanation in other subgroup characteristics of the states. USA is divided not only by geography and climate, but even racial, religious and political affiliations and the related lifestyles.
- 9.
- Novel – previously unexperienced – aspects of an infectious disease was statistically well visible, namely that COVID seems to be “POLITICALLY BIASED” (SIC!).
- 10.
- The 50 states can be sorted into 5 subgroups [5] accordingly to the main political attitude of the citizens: 1) Strong Democratic/SD [13: CA, DE, HI, IL, ME, MD, MA, NH, NJ, NM, NY, VT, WA]; 2) Lean Democratic/LD [8: CO, MI, MN, NV, OR, PA, RI, VA; 3); Competitive/C [10: AZ, FL GA IA KY NE NC OH TX WI]; 4) Lean Republican/LR [5: IN, LA, MO, MT, OK]; 5) Strong Republican/SR [13: AL, AK, AR, ID, KS, MS, ND, SC, SD, TN, UT, WV, WY].
(Gallup asked all poll respondents to indicate whether they identify as a Republican, a Democrat or as independent. Independents were then probed as to whether they lean toward the Republican or the Democratic Party. States in which there is a 10-percentage-point or greater advantage for one party are considered "solid" for that party. States in which there is an advantage for a party of more than five points but fewer than 10 points are considered "leaning" toward the party, while those in which the parties are within five points of each other are considered competitive).
- 11.
- We used the SD + LD (%) / SD + LD (%) ratio (D/R, #) as the measure of the “political bias” of the states. This continuous scale determined the place of every state in the solid-left-to-solid-right political space of the USA, (Figure 4).
Figure 4.
“POLITICAL” BIAS IN THE COVID STATISTICS – USA, 2020.
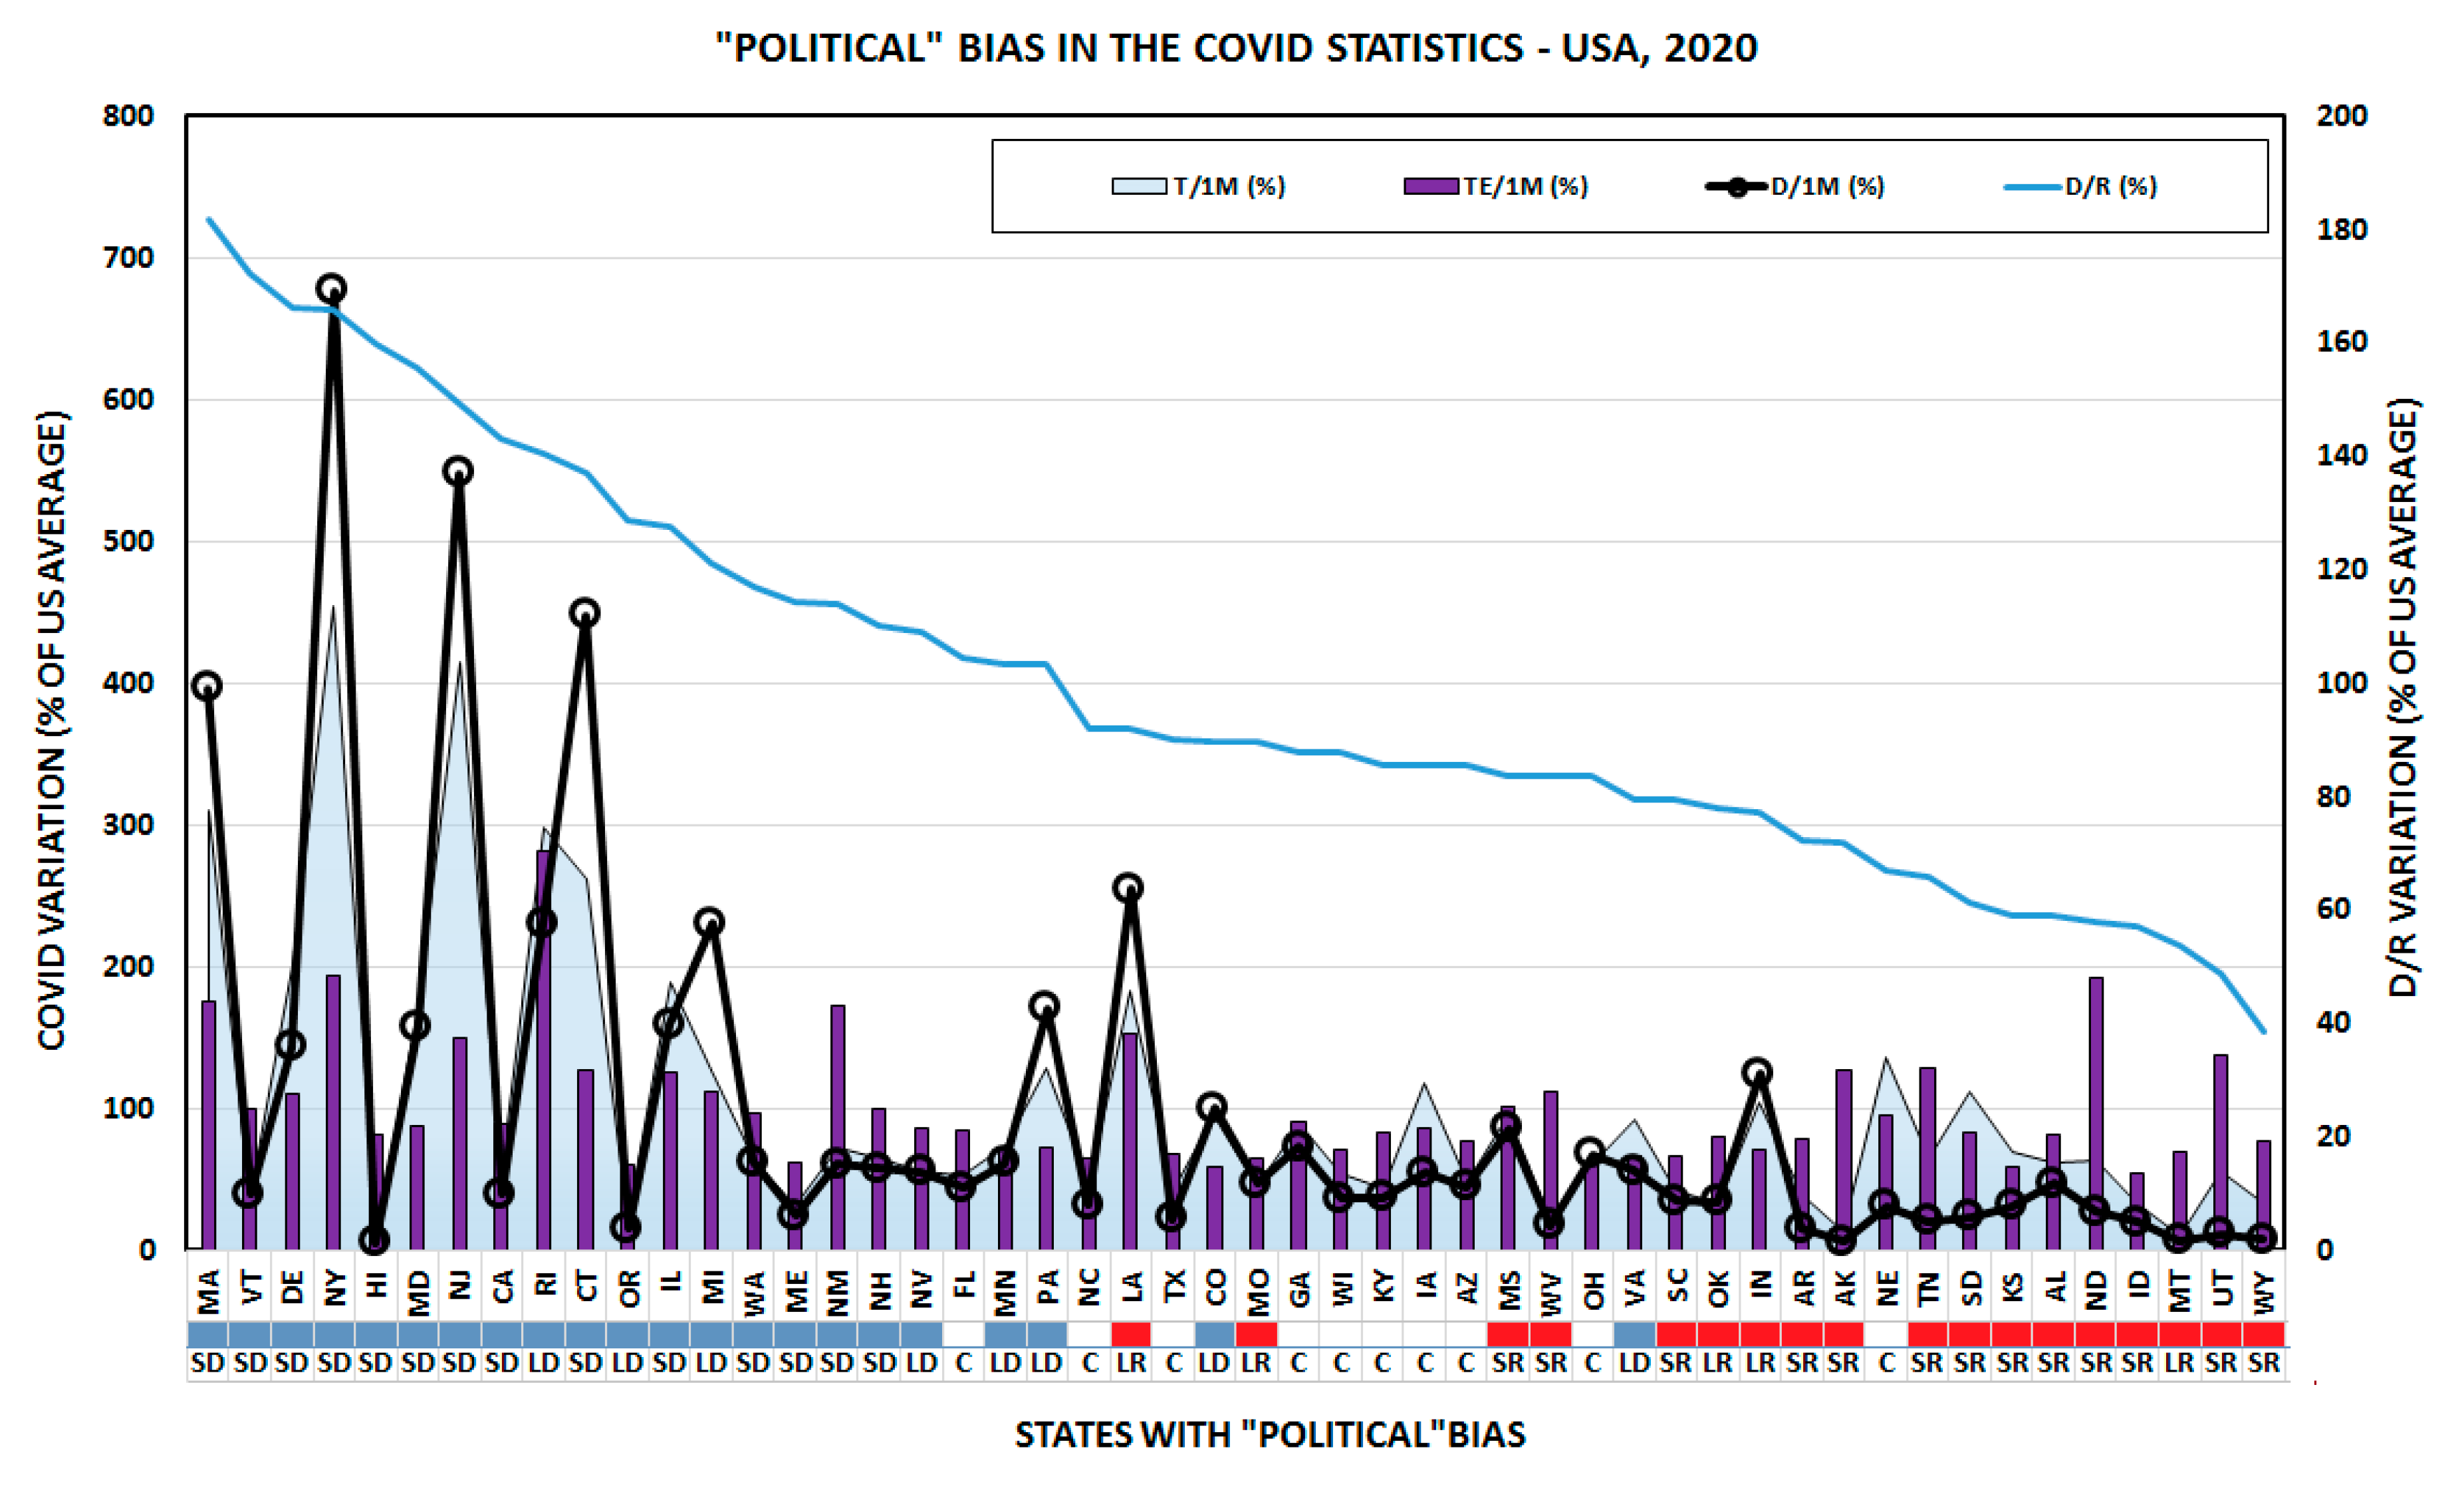
Detailed graph to illustrate how the political attitude of the states correlate with the total number of COVID cases (T/1M, test positives), the number of COVID related deaths (D/1M) and the total number of tests (TE/1M, both positives and negatives). The D/R ratio indicates the proportion of [solid democrats + lean democrats] to [solid republican + lean republicans], D/R = (SD + LD) / (SR + LR). The values are relative to the average in USA, that was regarded to be 100%, i.e. T/1M (100%) = TE/1M (100%) = D/1M (100%) = and D/R (100%) = 1.0 respectively.
Table 2 contains the statistical evaluation of the results.
- 12.
- The D/R (%) ratio provided a wide scale of political attitudes of the residents and clearly separated the 50 states from each other: “democrat oriented” with ratios ~100-180%, “republican oriented” between ratios ~30-90% and the “competitive” states between (with a few overlaps). The most striking feature of this graph is the visualization of 6 large picks corresponding to the most seriously affected states. The graph reveals that the total number of COVID cases, the number of total COVID deaths as well as the COVID mortality is far larger and above national average in democrat committed states than in republican or competitive states. There is a large variation in the number of COVID tests in different states but without any statistically significant difference in this respect.
- 13.
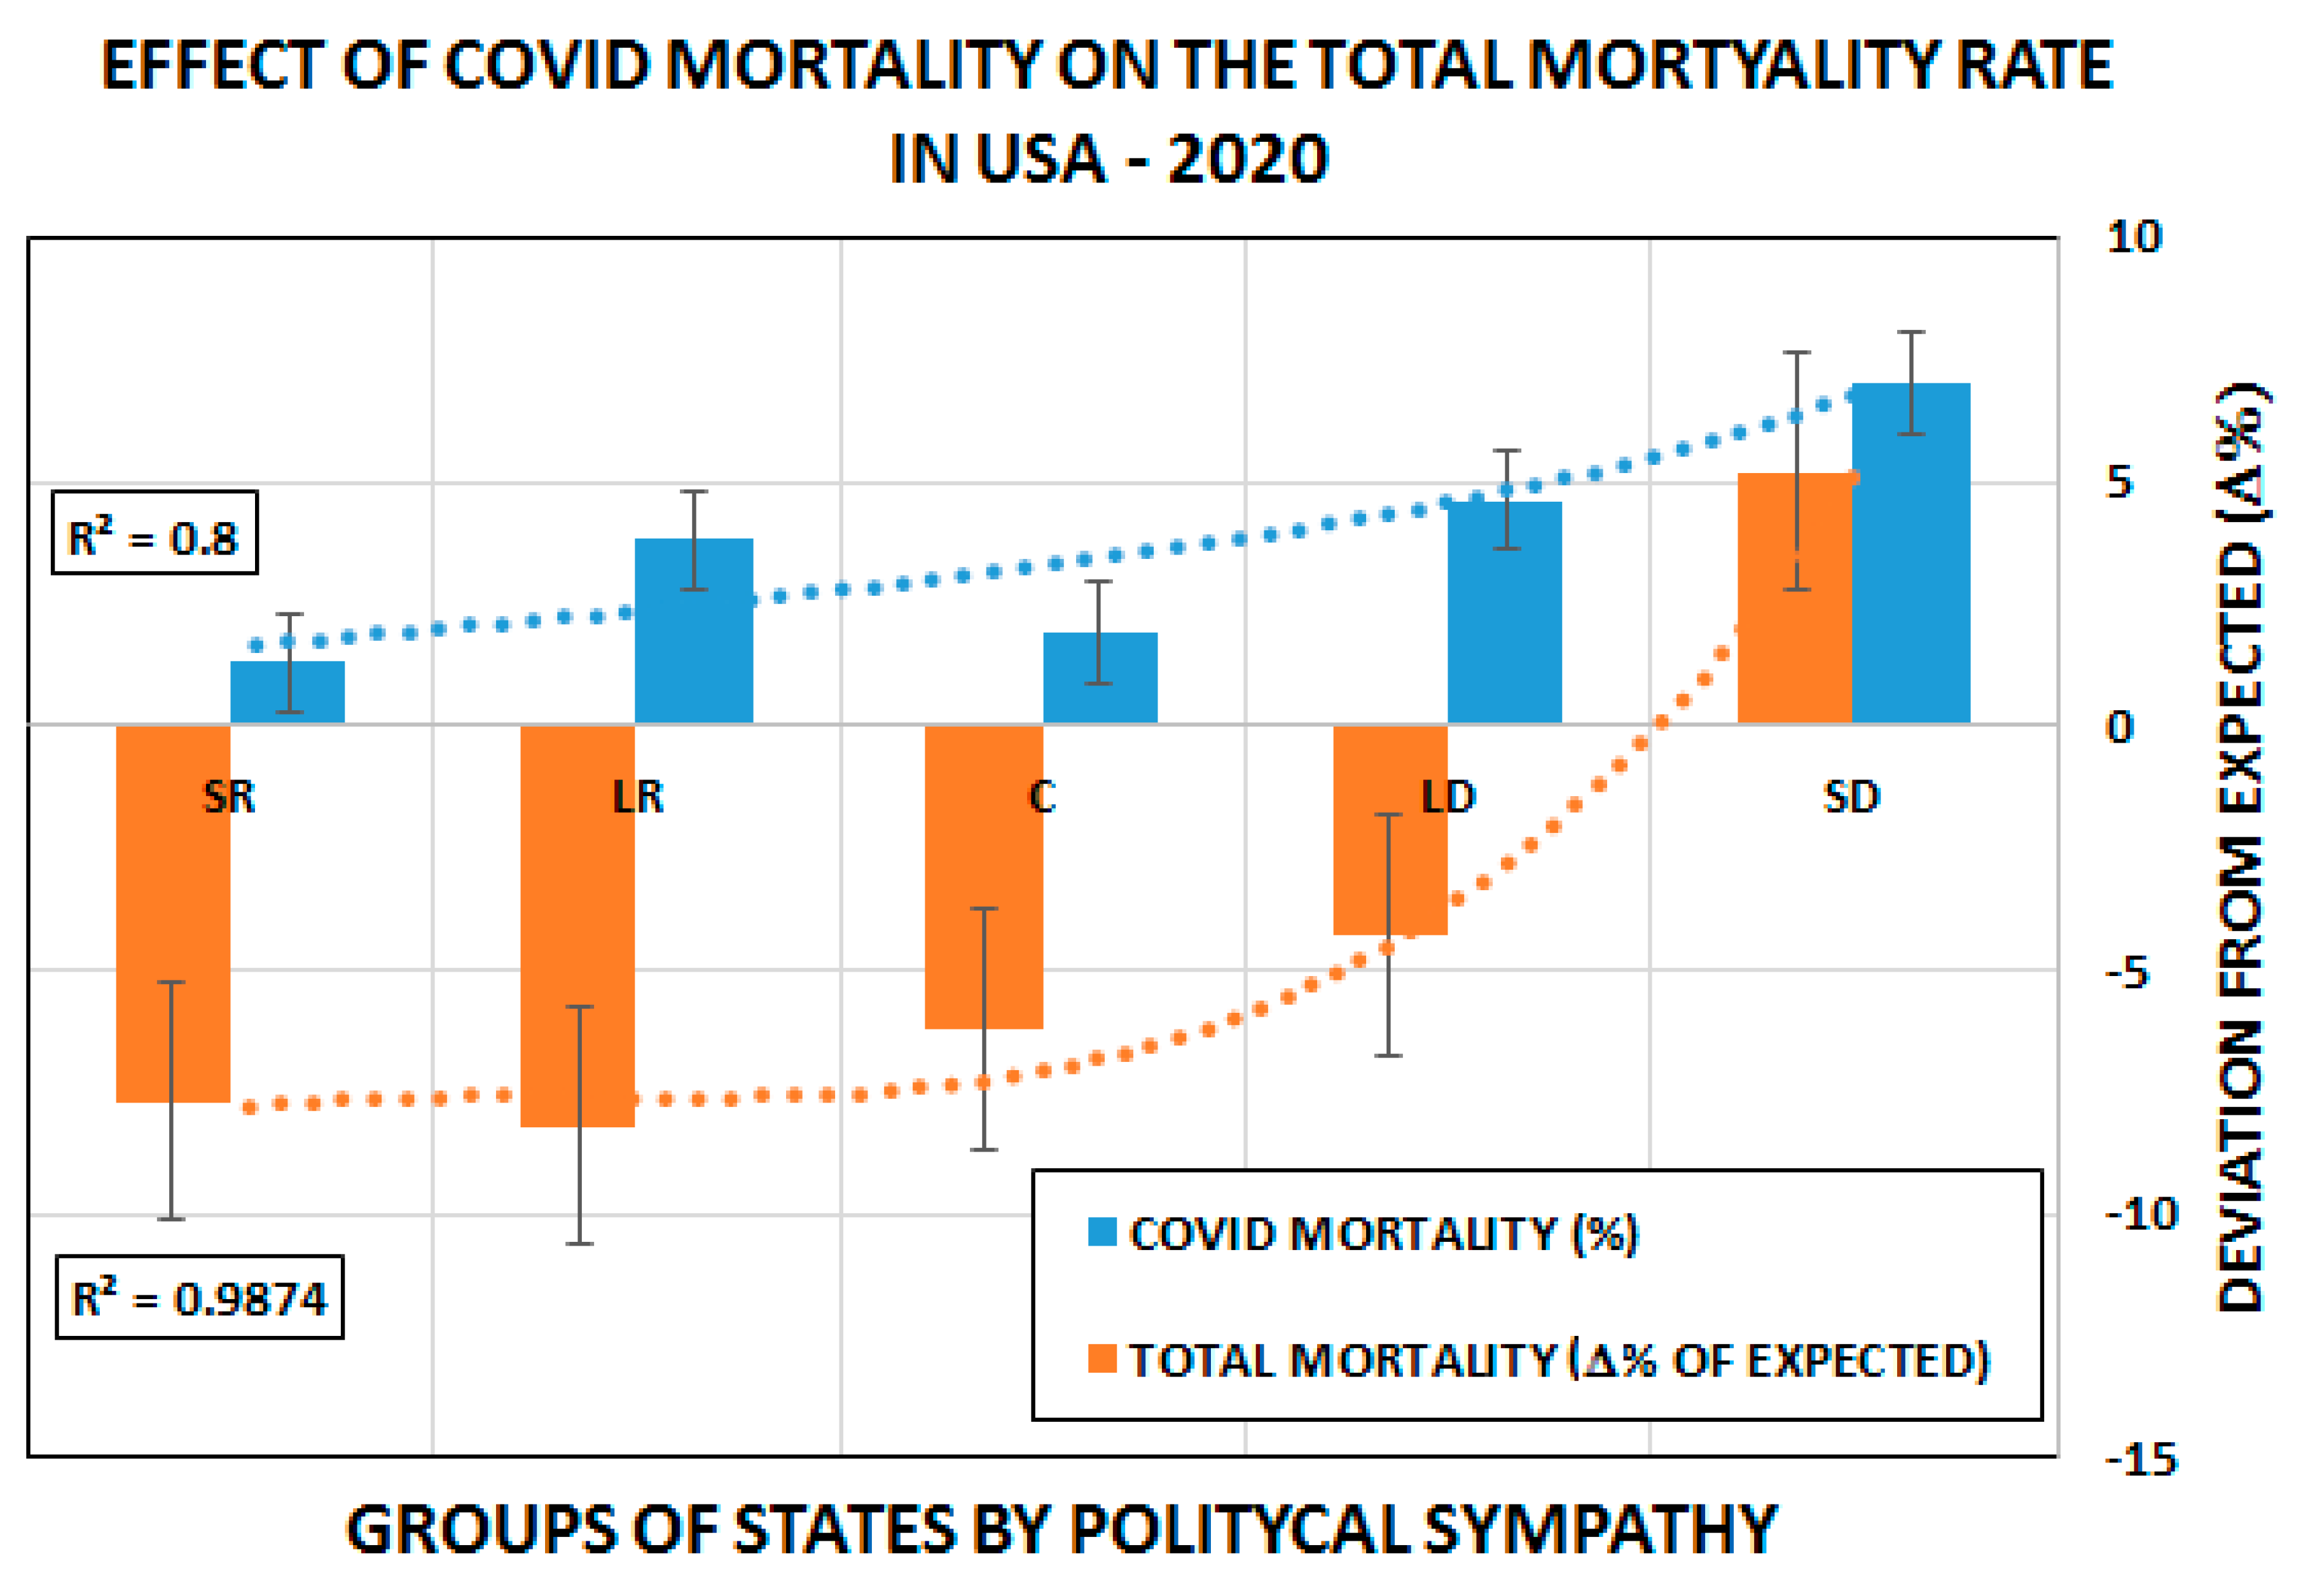
- There is a significant increase of the total (all cases) mortality from 92.3% (-7.7% under) of expected to 107% (7% over) of expected from right-to-left on the political scale of the states.
- 14.
- This increase of ALL DEATHS is accompanied by corresponding increase of the average COVID mortality from 1.3% to 7% in the same left-to-right order. Figure 5
Figure 5.
EFFECT OF COVID MORTALITY ON THE TOTAL (EXPECTED) MORTALITY IN US STATES, 2020.
- 15.
- Individual (states-based) as well as category-based (political groups) comparison of all COVID related parameters displays the same major differences: left (democrat) oriented, blue states suffered significantly more damage of the recent epidemic than the right (republican) oriented, red states. (Figures 6–9).
Figures 6–9.
EFFECT OF “POLITICAL” BIAS ON MAIN STATISTICAL PARAMETERS OF COVID EPIDEMIC: NUMBER OF CASES, NUMBER OF DEATHS, FREQUENCY OF TEST-POSITIVES AND MORTALITY. See even Table 2 for statistical evaluation.
Figures 6–9.
EFFECT OF “POLITICAL” BIAS ON MAIN STATISTICAL PARAMETERS OF COVID EPIDEMIC: NUMBER OF CASES, NUMBER OF DEATHS, FREQUENCY OF TEST-POSITIVES AND MORTALITY. See even Table 2 for statistical evaluation.
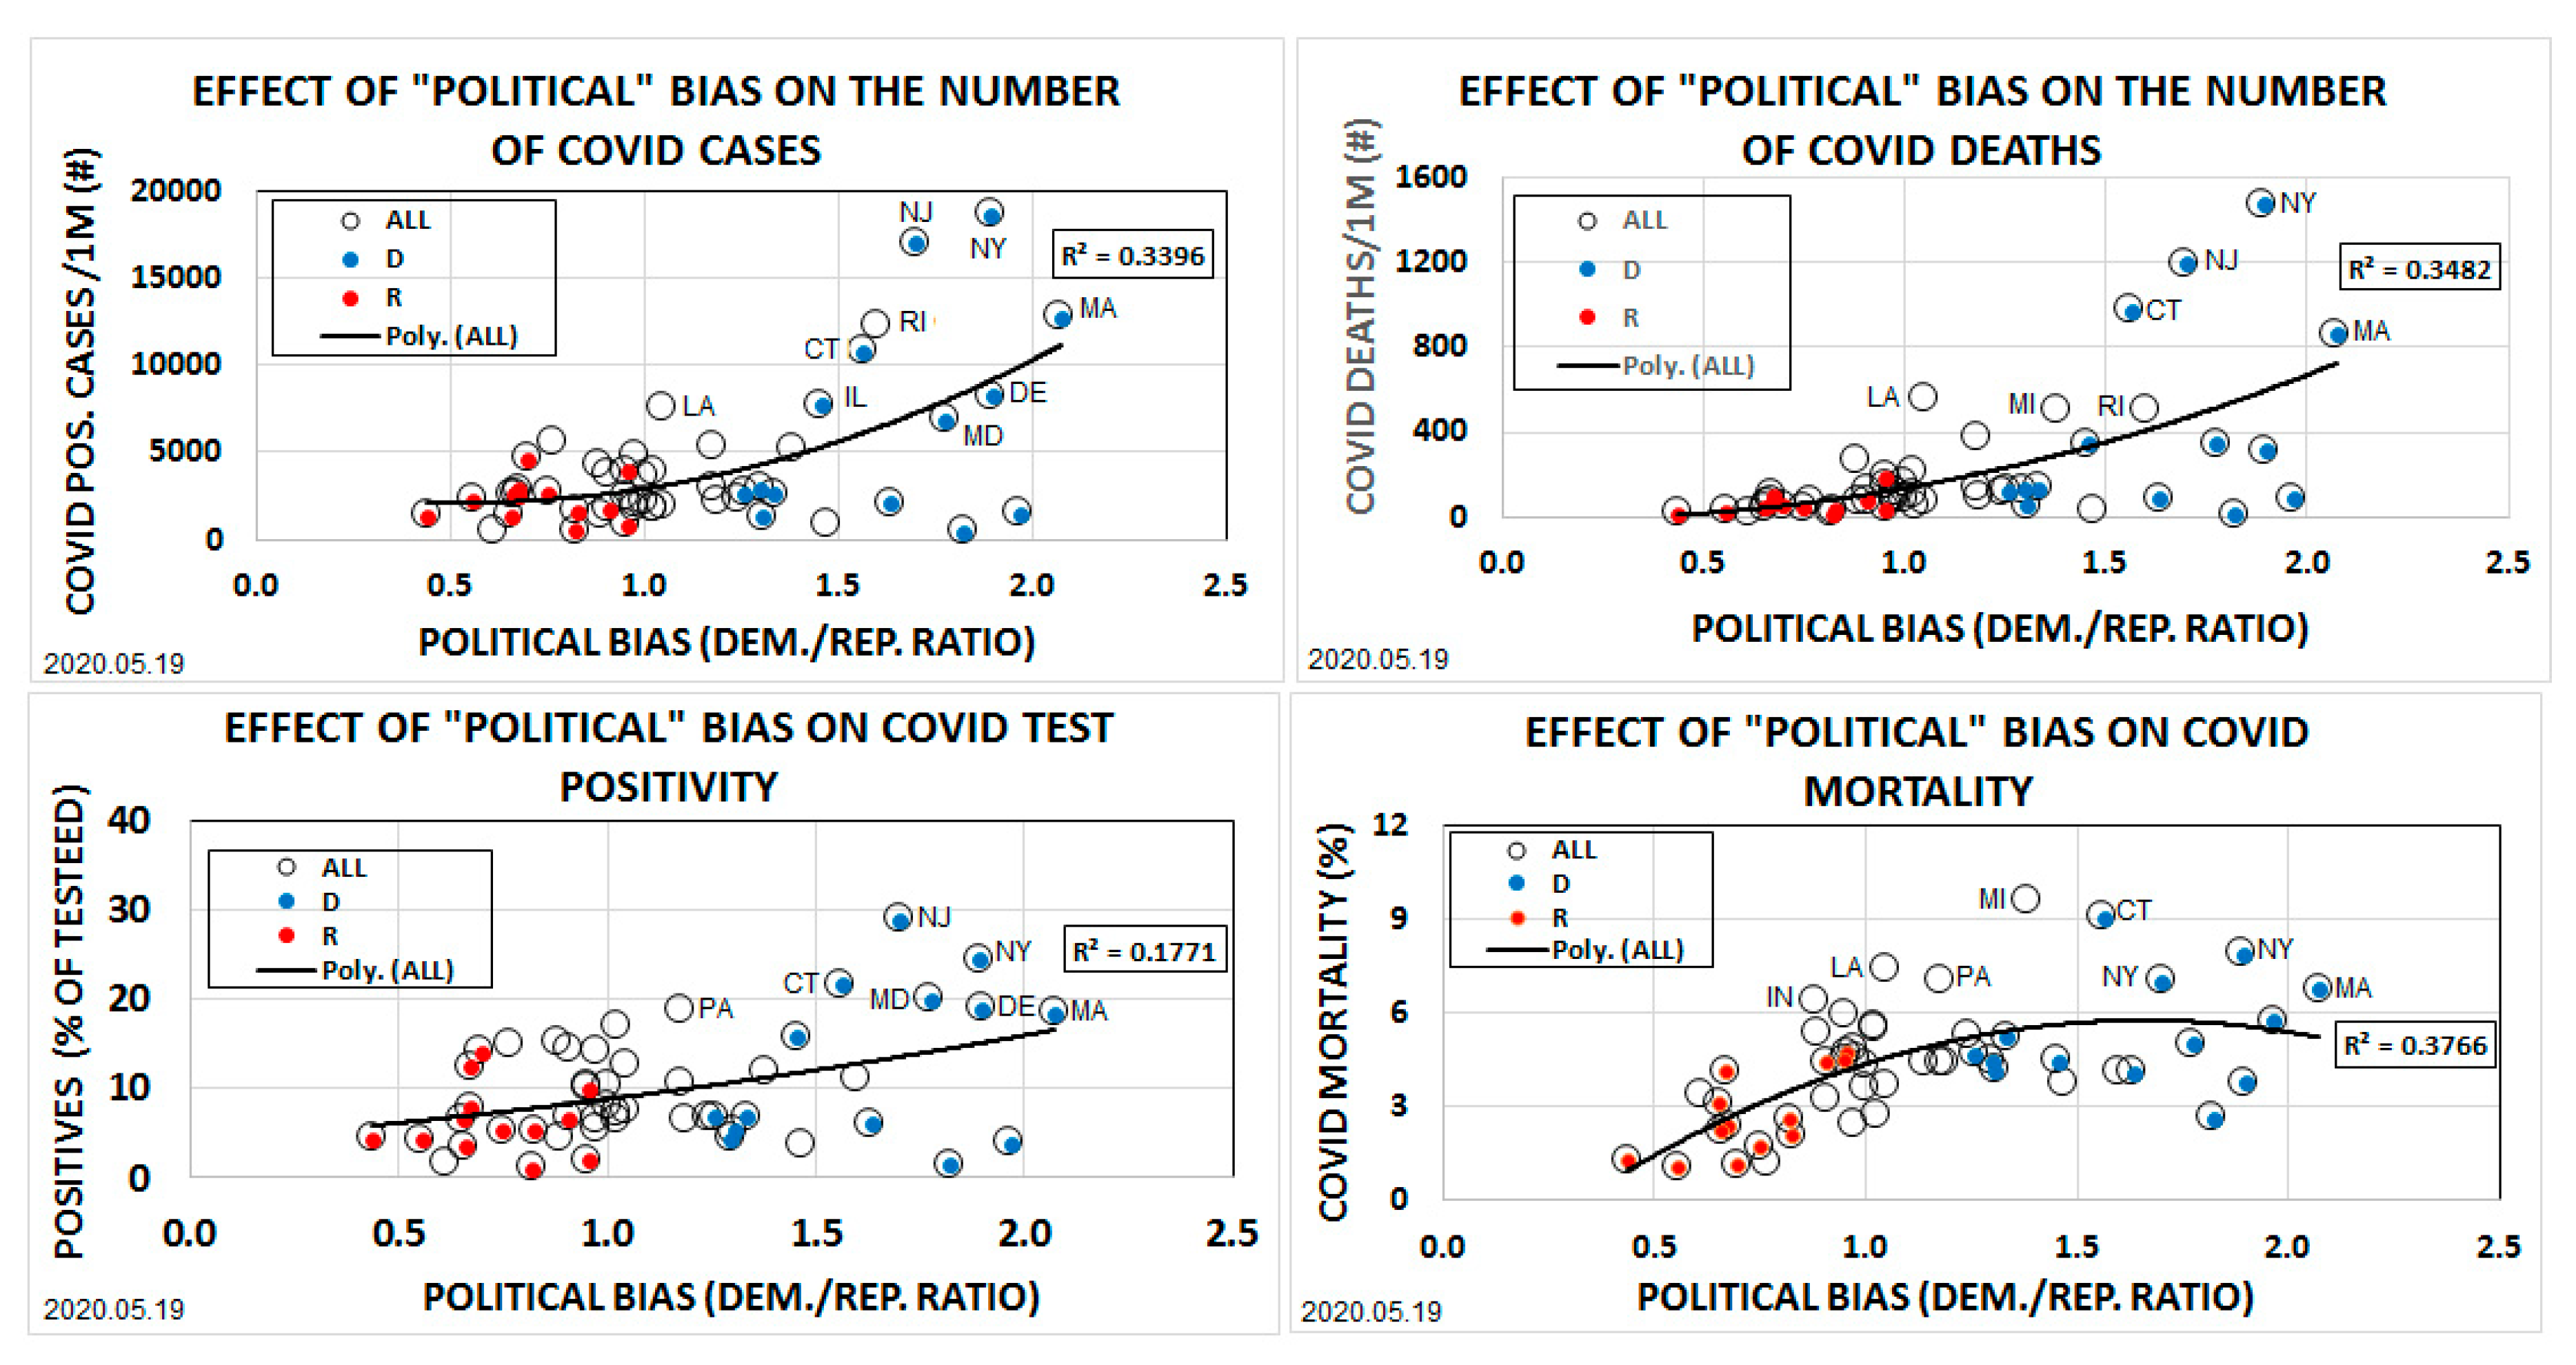
Table 2.
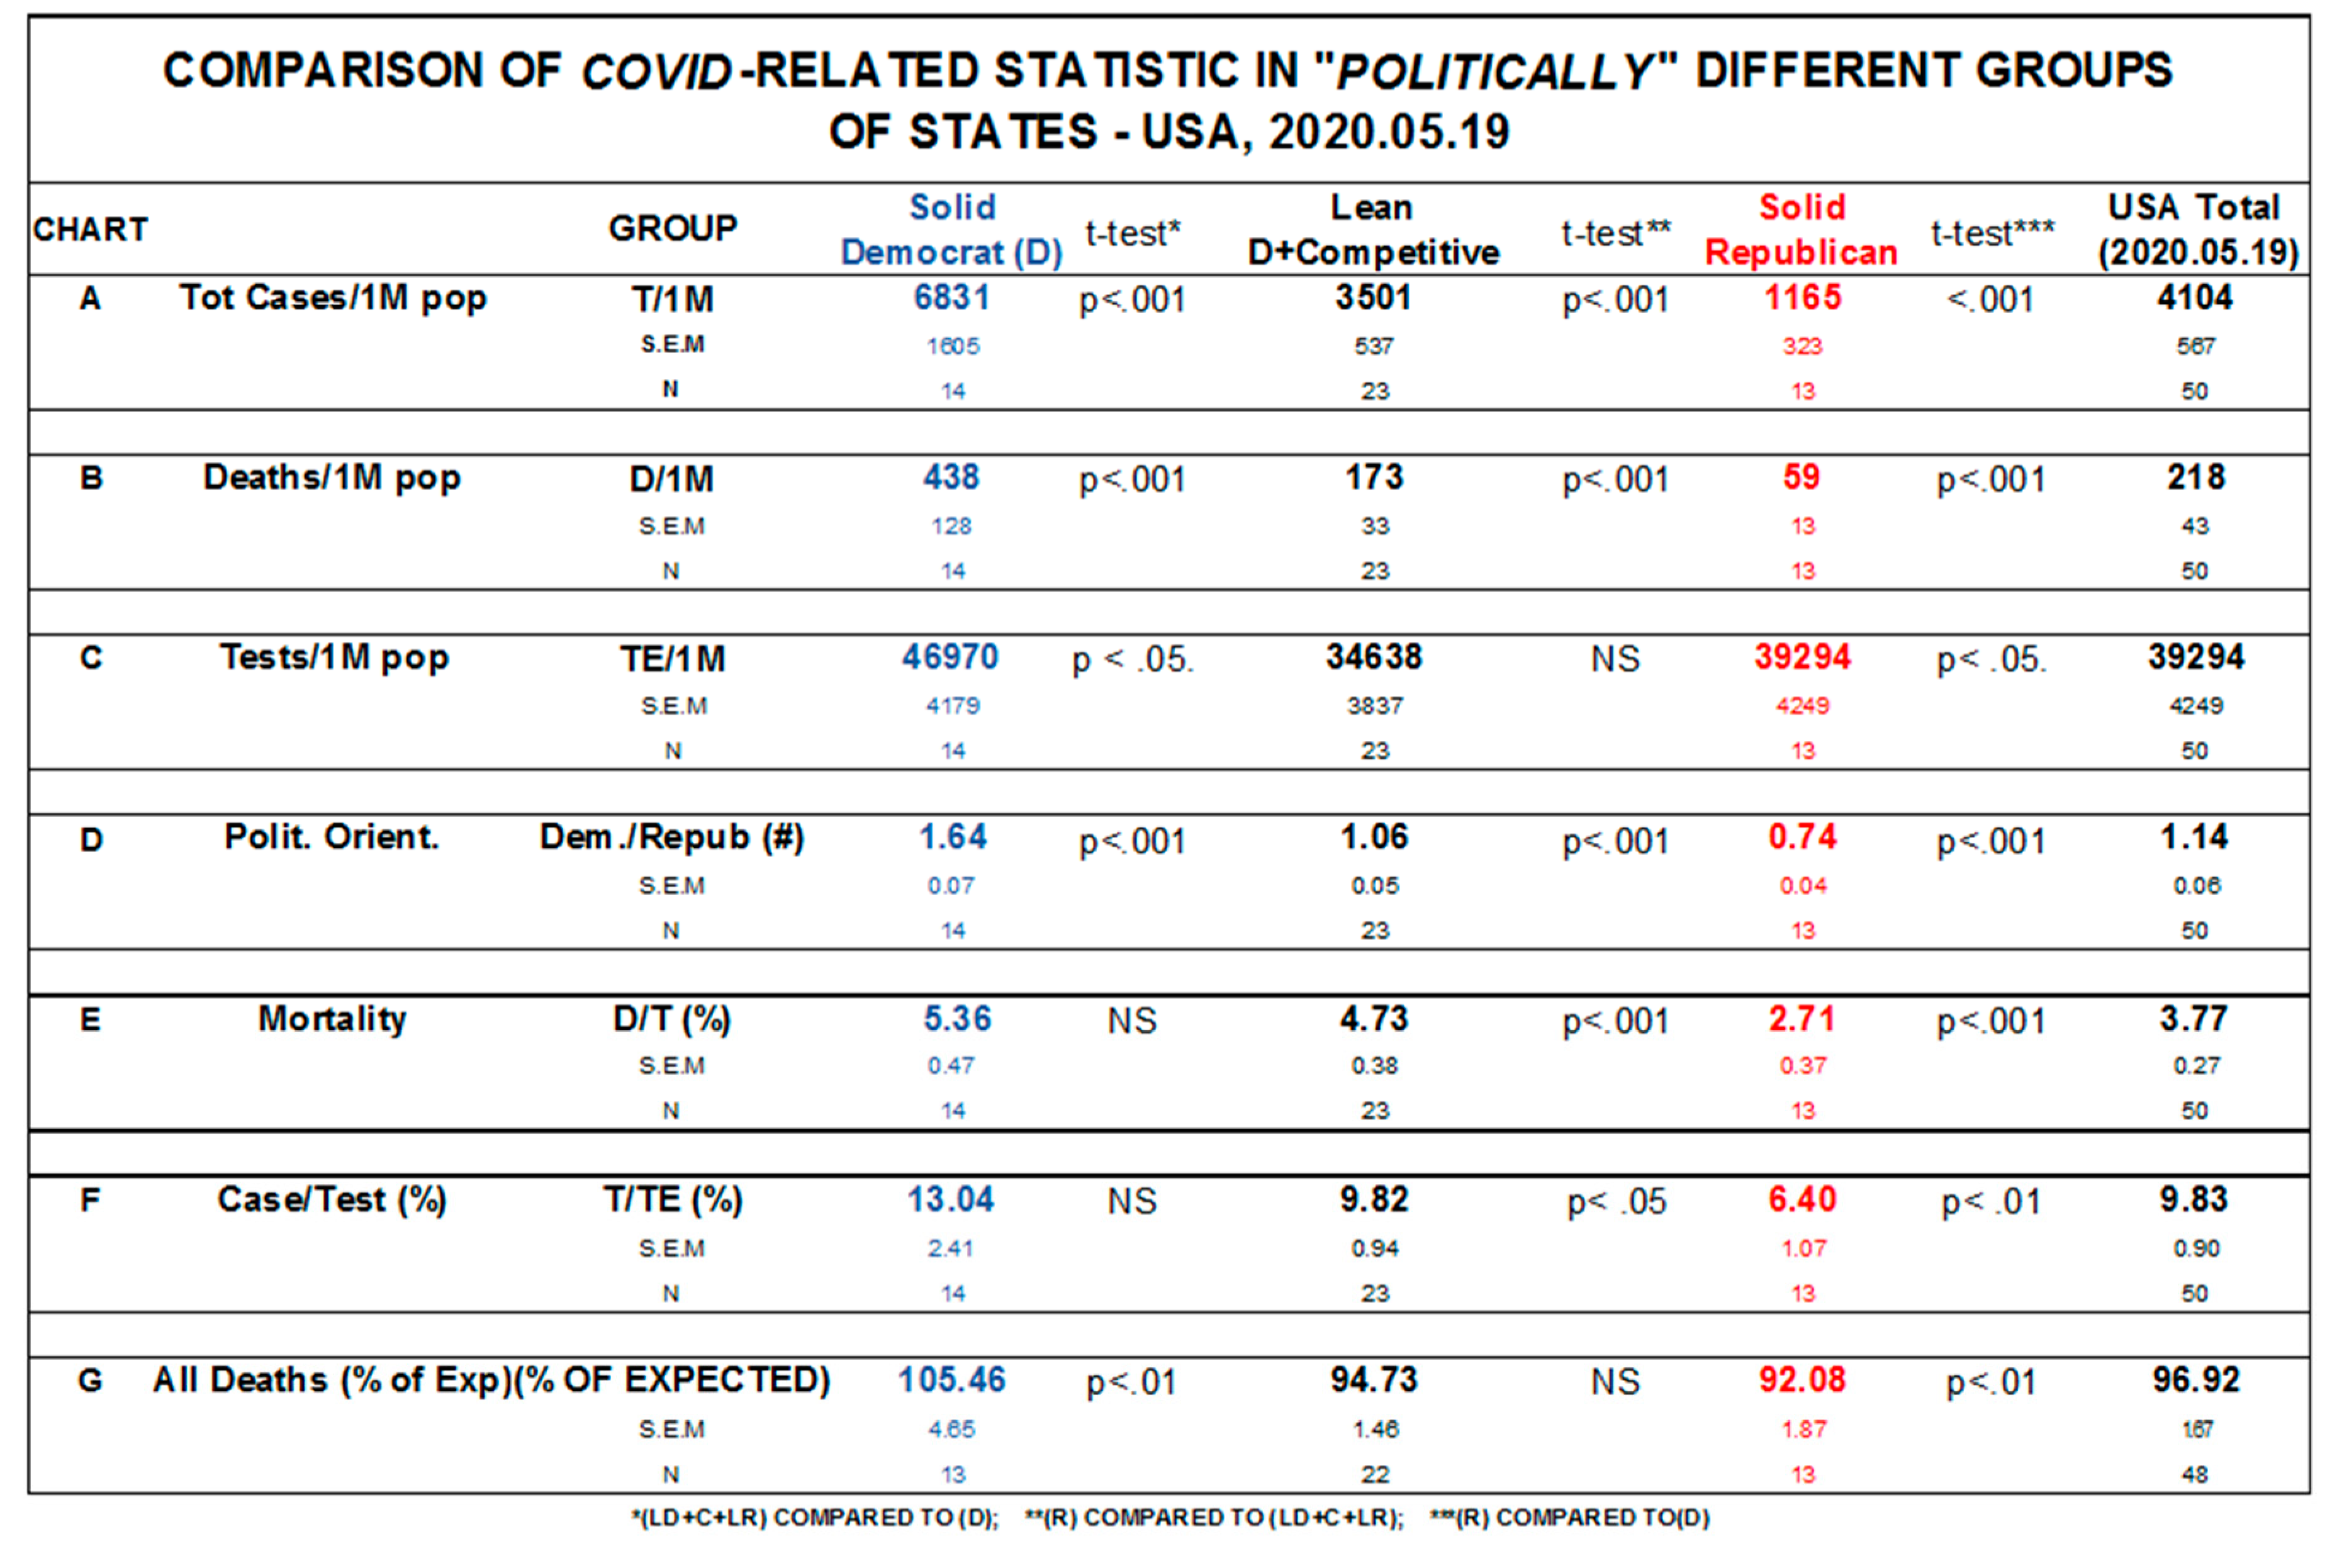 |
Discussion
There are physical and biological factors which are known to determine the infectivity of a virus. Physical factors are geography, climate, urban or rural environment, population density, et cetera. Biological factors effecting the response of individuals are age, health condition and genetic factors including sex.
The involvement of human factors, like “policy”, COVID did something absolutely exceptional that no epidemic or tragic historical event ever was able to do: it stopped the World. Today, - after 2 months, ~15% unemployment, ~4 T$ spending and more than 100,000 reported deaths we started to return to the life as it used to be.
There is a very important and very sensitive question to answer: did we react adequately to the uninvited situation? What was/is so special with this virus?
- 1)
- Epidemic experts predicted the death of >1M persons in USA, hospitals let us believe that unprecedented number of infected persons will need respirators to survival and we started with unemployment and social distancing. The initial alarming predictions turned out to be false but it was too late to mitigate the initial reaction: we remained on the ‘million-deaths’ level of alert.
- 2)
- The diagnosis of COVID disease seemed to be simple, it lead to non-specific, flu-like symptoms. Doctors tended to regard all flu-like cases as COVID, even when the specific test became widely available. The differential diagnoses of COVID from seasonal flu became blurred, poorly defined.
- 3)
- Doctors are often facing a dilemma, when determining the immediate cause of death [6]. It is not difficult to understand, that - in times when all medical attention of the public was focused on the pandemic – COVID became a “popular” as “immediate cause, final disease or condition resulting in death” [Item 26, Part I/(a) on the doctors report sheet]. Death is death.
(A striking illustration of the tremendous un-certainty around the diagnoses of COVID disease and deaths had been provided by New York. The state (NYS) reports only test-confirmed cases while the city (NYC) is adding “probable” cases. Consequently the COVID cases in NYS are only about 1/3rd of cases in NYC [7].)
- 4)
- A unique property of COVID is that it targets almost exclusively sick an elderly with often numerous preexisting conditions. Obviously many diseased were accidentally listed under COVID death category even when that person was close to death anyway.
- 5)
- Another probable reason of over-diagnosing COVID might have been the significant federal economic incentives to hospitals in “fighting the un-visible enemy”
- 6)
- Consequently the statistical data seems to be intentionally or accidentally inflated due to the – probably – well-meaning (but misleading) information from epidemic experts and media.
- 7)
- There were warning signs against the magnitude of the country’s reaction but they were ignored and even suppressed. a) COVID antibodies were detected in large part of the population telling us that most of the infections were silent [8]; b) independent emergency doctors reported that their hands on experience didn’t match with the suggestions of “administrative” doctors who have never seen any patient, neither alive, nor dead [9]; c) It was also reported, that healthcare administrators (non-doctors) were pressing doctors to list COVID as immediate cause of death wherever and whenever it was possible; d) states started reporting “likely” or “probable” cases in April 2020 (not only test-confirmed cases) [10].
- 8)
- Replacing the exact laboratory (test) and x-ray diagnosis of COVID disease and cause of deaths’ with permitting the strongly subjective, discretionary “best judgment” of thousands of doctors strongly and unevenly diluted the statistical data. The difference between exact and “hearsay” diagnoses is 300% (SIC!, see statistic from NY State and NY City). Consequently our public understanding of the COVID epidemic and the reason of our introverted defense policy to it is highly unreliable.
Main Findings
- A.
- The recent study confirmed the well-known fact, that COVID almost exclusively targeted elderly and already sick persons with preexisting condition(s). Almost no young and healthy person became life-threateningly ill or died due to the epidemic. This part of the study seems to be solid and widely accepted.
- B.
- The novel observation in this study is the discovery of signs of “political bias” in the statistical data. Our results suggest that D states with dominating orientation toward ‘democrat’ ideology (life-style?) are more receptive for COVID disease and the outcome is more often terminal in these states, than R states, those more committed to ‘republican’ ideology (and lifestyle?).
The association between infectious diseases and social condition and lifestyle is not new, it is well known, for example in the case of tuberculosis, AIDS, polio, et cetera). However it is probably one of the early and novel observations related to the recent virus infection.
- C.
- Another important, but probably controversial suggestion in this study is that the impact of COVID on the total mortality rate of the country is not or minimally influenced by the virus deaths. Even if there will be some increase in the total deaths at the end of this year, we can expect a compensatory reduction of the total mortality of the next year. It seems to be unlikely that any young and healthy person was killed by the COVID.
Conclusions
The real medical impact of COVID on our society is very difficult to objectively estimate. However it is more and more likely that the 100.000 epidemic related deaths are only a fraction of the prize we has to pay for this tragedy. The big prize is
- -
- the serious disturbance of the normal life of the majority of the people, there the recovery might take considerable time;
- -
- the serious damage of our relation to China;
- -
- the serious damage of our relation to WHO;
- -
- acceleration of social tensions, incl. violance.
We are aware of the importance of our suggestion of the existence of “political bias in the American “mutation” of COVID disease, especially in the “pre-election” period of USA. Strict confirmation” of our results by independent experts is necessary. It is strongly suggested, that we pay serious, objective, non-partisan attention to the events during the epidemic.
References
- Jiaquan Xu ET AL., Mortality in the United States, 2018. NCHS Data Brief No. 355, January 2020 - https://www.cdc.gov/nchs/products/databriefs/db355.htm#:~:text=Between%202017%20and%202018%2C%20death,(4%2C472.6%20to%204%2C386.1)%2C%20and.
- Worldometer - COVID-19 CORONAVIRUS PANDEMIC - https://www.worldometers.info/coronavirus/#countries – Accessed 2020.05.11.
- National Vital Statistics System, National Center for Health Statistics, CDC. Produced by: National Center for Injury Prevention and Control, CDC using WISQARS™ - https://www.cdc.gov/injury/wisqars/pdf/leading_causes_of_death_by_age_group_2018-508.pdf - Accessed 2020.04.20.
- National Vital Statistics System – CDC, Centers for Disease Control and Prevention – Updated: May 6, 2020, Accessed 2020.05.19.
- 2018 Gallup tracking and 2018 Gallup Poll Social Series surveys. – Cited in State Party Identification and Leaning, 2018 - Politics, Feb.22, 2019 -https://news.gallup.com/poll/247025/democratic-states-exceed-republican-states-four-2018.aspx - Accessed. 2020.05.10.
- U.S. DEPARTMENT OF HEALTH AND HUMAN SERVICES. Centers for Disease Control and Prevention National Center for Health Statistics - Instructions for Completing the Cause-of-Death Section of the Death Certificate for Injury and Poisoning - https://www.cdc.gov/nchs/data/dvs/red_form.pdf.
- Begley S. Influential COVID-19 model uses flawed methods and shouldn’t guide U.S. policies, critics say, April 17, 2020. https://www.statnews.com/2020/04/17/influential-covid-19-model-uses-flawed-methods-shouldnt-guide-policies-critics-say /. Accessed 7 June 2020.
- New York State study (published April 23rd, 2020) indicates that the actual fatality rate of epidemic in NYS could be as low as 0.78%. Is rises the possibility that COVID-19 is just another regular flue under the microscope of mass hysteria.
- Dr Dan Erickson & Dr Artin Massihi: Press Conference on April 24th, 2020 – 23ABC NEWS - https://www.turnto23.com/news/coronavirus/watch-controversial-press-conference-held-by-two-bakersfield-doctors-that-was-pulled-down-by-youtube.
- New York City started counting "probable deaths" - deaths without a confirmed positive coronavirus test but with "COVID-19 or an equivalent" listed on a death certificate - on April 13. Data before April 13 includes confirmed coronavirus deaths only. – Source: NYC Government.
Disclaimer/Publisher’s Note: The statements, opinions and data contained in all publications are solely those of the individual author(s) and contributor(s) and not of MDPI and/or the editor(s). MDPI and/or the editor(s) disclaim responsibility for any injury to people or property resulting from any ideas, methods, instructions or products referred to in the content. |
© 2024 by the authors. Licensee MDPI, Basel, Switzerland. This article is an open access article distributed under the terms and conditions of the Creative Commons Attribution (CC BY) license (http://creativecommons.org/licenses/by/4.0/).
Copyright: This open access article is published under a Creative Commons CC BY 4.0 license, which permit the free download, distribution, and reuse, provided that the author and preprint are cited in any reuse.


