Submitted:
27 September 2024
Posted:
29 September 2024
You are already at the latest version
Abstract
A novel approach for designing acceptance sampling plans is presented. It is based on the Bayesian conformity assessment framework from JCGM 106. In particular, the concept of conformance probability plays a central role in the new approach. The new approach takes into account both the producer's and the consumer's perspective by allowing each to have their own prior. In parallel, the JCGM 106 framework allows the definition of Bayesian consumer's and producer's risks which complement the "classical" risks defined in the ISO 2859 and ISO 3951 series. The new approach also casts a new light on the plans from the ISO standards.
Keywords:
acceptance sampling plan
; conformity assessment
; Bayesian statistics
; producer's risk
; consumer's risk
; conformance probability
; lot inspection by attributes
1. Introduction
The question whether the contents of a given production lot (shipment, container, batch) meet specified quality criteria plays a central role in many areas. For instance, in industry, lot inspection is a quality control measure adopted in monitoring a manufacturing process; in international trade, lot inspection is performed to evaluate the quality of purchased goods and decide whether to accept an individual lot; and a governmental food safety agency inspects lots to ensure contaminant levels are below legal limits. Inspecting the entire lot is seldom a viable option. Instead, a random sample is taken from the lot and an acceptance rule is applied to the test results (whether qualitative or quantitative) obtained from the sample. The activity of inspecting lots in this manner is referred to as acceptance sampling. An acceptance sampling plan thus consists of instructions for taken a sample (in particular, a requirement regarding sample size) and an acceptance rule. In Schilling (2008) [1], acceptance sampling plans are described as “…specific sampling plans, which, when instituted, prescribe conditions for acceptance or rejection of the immediate lot inspected.”
The first elaborate acceptance sampling schemes were developed in connection with military procurement applications during World War II. The MIL-STD-105 series [2] was a United States defense series of standards that provided procedures and tables for inspection by attributes, i.e. for the case that the sampled units are classified either as conforming or nonconforming. The statistical theory was based on contributions by Harold F. Dodge and Harry Romig. This series (in particular MIL-STD-105E) served as the basis for ASTM E2234 [3], the ISO 2859 series [4] and the Z1.4 standard [5]. The MIL-STD-414 standard [6] is the pendant for inspection by variables, i.e. for the case that a quantitative test results are obtained from the sampled units. This series served as the basis for the ISO 3951 series [7] and the Z1.9 standard [8]. For further details regarding the history of these first schemes, the reader is referred to Dodge (1969a, 1969b) [9,10].
In the US military standards and the derivative ISO and ASTM standards, frequentist (‘classical’) statistics are applied. The central statistical parameter is the probability of acceptance at a certain quality level, calculated on the basis of an assumption regarding the distribution of test results at a given quality level. The quality level thus plays the role of a parameter in the chosen statistical distribution, such as the probability parameter governing a binomial distribution: . Lot quality is expressed e.g. as proportion nonconforming or the number of nonconformities (defects) per 100 units. The probability of acceptance plotted against lot quality is called the operating characteristic (OC) curve and encapsulates the main properties of the acceptance sampling plan. In particular, the plan is often characterized in terms of the probability of acceptance—i.e. the OC curve value—at carefully chosen quality levels. The producer risk quality level (PRQ)—called acceptance quality level (AQL) in the ISO standards—is often singled out as representing acceptable lot quality; while the consumer risk quality level (CRQ)—called limiting quality level (LQ) in the ISO standards—indicates unacceptable lot quality. In parallel, values are chosen for the producer’s risk (typically 5%) and the consumer’s risk (typically 10%). Plans ‘indexed for AQL’ are then designed in such a manner that the probability of acceptance at PRQ is at least ; and, for plans ‘indexed for LQ,’ the probability of acceptance at CRQ is at most .
In the frequentist (or ‘classical’) approach codified in the US military and subsequent ISO and ASTM standards, the sample size is often quite large. Accordingly, in parallel to the frequentist approach, Bayesian approaches to acceptance sampling were described in the statistical literature. It stands to reason that any prior information regarding the quality of the lot or underlying production process should be incorporated in the design of accepting sampling plans. Many proposals focus on minimizing average costs, see Hald (1960, 1968, 1981) [11,12,13], Pfanzagl (1963) [14], Lindley and Singpurwalla (1991, 1993) [15,16] and Facchinetti et al. (2022) [17]. Other authors focus on the definition of producer’s risk and consumer’s risk, see Brush (1986) [18] and Chun et al. (1998) [19]. Despite the number of articles on this topic, the description of Bayesian approaches in acceptance sampling standards and guidelines remained marginal in the 20th century. This is mainly due to two reasons: the amount of computation required in Bayesian calculations, and the perception that resorting to prior information inevitably introduces a subjective element. The accessibility to powerful computers in the 21st century has essentially removed the first hurdle and Bayesian methods have enjoyed a revival in recent years. The question of the subjectivity or arbitrariness of prior information can be addressed in several ways: first, by proposing specific proposals for expert knowledge elicitation and deriving prior distributions from available data; secondly, by allowing the consumer and producer to independently derive their own priors and to take both into consideration in the design of plans. The Lindley and Singpurwalla articles (1991, 1993) [15,16] describe one method for doing this (by means of utility functions). In the present article, another option for doing so will be described. Indeed, in the approach presented here, not only are different producer and consumer priors allowed, but this intrinsic duality is mobilized to refine the procedure for designing the plans. More generally, if the quality of the process is not well documented, default or policy-driven priors can be used, corresponding to broad levels of trust (“neutral” versus “optimistic”) in the process or lot quality—and protocols for deriving such default or policy-driven priors could be developed. Finally, an approach for proposing simplified priors as a compromise between the ‘classical’ and ‘Bayesian’ approaches is described in Göb (1992) [20].
In 2012, JCGM 106 [21] was published. This guideline discusses how to take measurement uncertainty into consideration in conformity assessment, i.e. in determining whether an individual test item fulfills specified requirements. A Bayesian framework is proposed along with new definitions of the producer’s and consumer’s risks which, considered together with those proposed in Brush (1986) [18] and Chun et al. (1998) [19], will be (loosely) referred to as ‘Bayesian’ risks. An overview of these risks will be provided in this paper along with a common framework in which the classical risks (which will also be referred to as parametric risks, for reasons explained below) and the Bayesian risks can be understood as complementary. Moreover, in JCGM 106, the concept of conformance probability is defined. This concept will play a central role in the approach for designing acceptance sampling plans described here. Just like the risks, the acceptance sampling plans obtained via the approach described in the following can be referred to as ‘Bayesian.’ It should be noted, however, that a plan obtained by means of the procedures described here may have the same sample size and acceptance number as a plan from e.g. ISO 2859-1. What remains different, however, is the assessment of the plans in terms of consumer’s and producer’s risk.
Even though the focus in this paper is on the inspection of isolated lots, there is often an underlying production process. The question thus arises how information regarding the quality of the process or the quality of previous lots should inform the design of the acceptance sampling plan for the lot currently under inspection. This aspect will be discussed in a subsequent article.
The approach presented here can be extended for use in connection with lot inspection by variables. This extension will be described in a subsequent paper. Before describing an approach to acceptance sampling based on the JCGM 106 concept of conformance probability, a brief discussion of the three levels of conformity, the relationship between conformity assessment and acceptance sampling and definitions and notation is provided.
1.1. Three levels of conformity
In sampling-based conformity assessment, there are three levels of conformity (or conformance): the conformity of the process, of the lot and of individual items (or units). The central question is whether the lot is conforming, and the main difference between the approach described here and the ISO approach is that a conformity region for lot quality must be defined prior to acceptance sampling. The conformity of the process is not directly taken into account; rather, it plays a role in the background insofar as it underlies the quality of the lot. No criterion for process conformity need be defined. Finally, the quality of individual items plays a role insofar as the criterion for lot acceptance is expressed in terms of number of nonconforming items. The criterion for the conformity of an individual item can be expressed e.g. in terms of specification limits1.
1.2. Brief discussion of the relation between conformity assessment and acceptance sampling
Comparing JCGM 106 with the ISO standards on acceptance sampling, it would seem reasonable to draw the following distinction between conformity assessment (CA) and acceptance sampling (AS):
- in CA as per JCGM 106, testing is performed on the basis of one single item
- in AS as per ISO standards, testing is performed on the basis of a sample of several discrete items taken from the lot. In inspection by variables, it is not the conformity of each item which is determined; rather, one test result is obtained per item, and the proportion nonconforming is estimated on the basis of the distribution of the test results.
A related difference between the two is as follows:
- In CA, measurement uncertainty is taken into account in the decision rule2. Thus, in CA, the focus is on the measurand (in the strict metrological sense).
- In AS for inspection by variables as per ISO standards, the rule for lot acceptance or rejection takes into account the lot standard deviation, which describes how the property of interest varies in the lot, rather than variation between test results, which may reflect other effects such as analytical uncertainty, effects due to the sampling procedure, etc. Thus, in AS, the acceptance rule is expressed in terms of the statistical properties of the lot and – if at all possible – measurement uncertainty is ignored.
The following points highlight conceptual similarities between conformity assessment and acceptance sampling:
- Acceptance sampling can be “re-interpreted” in such a way that the entire framework is formulated in terms of a “measurand” – thus achieving a common conceptual framework with conformity assessment. In this re-interpretation, the measurand consists of the relevant summary statistics (e.g. proportion nonconforming, lot mean, lot standard deviation) for the lot.
- In the classical CA framework, conformity often requires the measurement uncertainty to be sufficiently low, e.g. in the case of a decision rule such as . Similarly, in AS, one could formulate requirements regarding sufficiently low specific producer or consumer’s risks.
- For both CA and AS, one can define both parametric versus specific risks, corresponding to precision versus measurement uncertainty.
Finally, if acceptance sampling takes the form of applying a criterion for the lot mean and if only one test result is obtained from a unique composite sample obtained from the lot, then there may not be any meaningful distinction between conformity assessment and acceptance sampling. Hence, in clarifying the relationship between conformity assessment and acceptance sampling, the distinction between plans for the proportion nonconforming and plans for the lot mean should be borne in mind. This may be equivalent to distinguishing plans where the criterion is formulated in terms of a measurand in the strict metrological sense and plans where the criterion relates to the proportion nonconforming.
A procedure for taken measurement uncertainty into account in acceptance sampling is described in Pennecchi (2024) [22].
1.3. Terminology and notation
Much of the terminology and notation used in this paper is taken from or closely reflects JCGM 106.
- For lots consisting of discrete items, acceptance sampling by attributes involves taking a sample of individual items (units) from the lot and assessing the conformity of each item against a specified requirement. If the number of nonconforming items in the sample of items is greater than the acceptance number , the lot is rejected. Thus, a pair constitutes an acceptance sampling plan for lot inspection by attributes.
- The two parties to the trade are the producer and the consumer. The producer is the manufacturer or supplier who sells the lot to the consumer. The producer is mainly interested in whether the lot is accepted, whereas the consumer is mainly interested in whether the lot is conforming.
- PR denotes the producer’s risk.
- CR denotes the consumer’s risk.
- The random variable denotes the “true” quality of the lot or process. In the framework of inspection by attributes, this means that denotes either the number of defects in the lot (in which case it takes on integer values between 0 and the number of items in the lot) or the proportion nonconforming of the lot under inspection or of the underlying process (in which case it takes on values in the real number interval (corresponding to 0% and 100%). In order to avoid an inflation of symbols, we will only consider the latter case. In the discrete case, integration can be reinterpreted via a dominating measure . A realization of is denoted . This random variable corresponds to the measurand in JCGM 106. Where relevant, lot and process proportion nonconforming will be distinguished via the notation and .
- The random variable denotes the test or measurement outcome. In the case of inspection by attributes, is typically the number of nonconforming results obtained after performing tests on a sample of items. thus takes on integer values between 0 and 3. A realization of is denoted .
-
denotes the prior distribution of the proportion nonconforming .Note: the consumer and producer may have different priors, denoted and , respectively.
-
denotes the posterior distribution.Note: just as in the case of the prior, the consumer and producer may have different posteriors, denoted and , respectively.
- denotes the conformance or tolerance region for the “true” proportion nonconforming , expressed as the closed interval , where lies in and denotes a specified maximum value for . For instance, if is specified as 10%, this means that a lot whose true proportion nonconforming is greater than 10% does not comply with the criterion regarding lot quality – no matter whether or not it has been accepted.
- denotes the acceptance region, expressed as the closed interval , where lies in and denotes the acceptance number, a specified maximum value for (the number of items determined to be nonconforming during inspection). For instance, if is specified as 0 and is obtained during the lot inspection, the lot will be rejected – no matter whether or not it actually complies with the criterion regarding lot quality.
- Given a test outcome , denotes the conformance probability, i.e. the probability of lot conformance, calculated on the basis of the posterior distribution:
- For (the lot is accepted), SCR() denotes the specific consumer’s risk, defined as the complement of the conformance probability, evaluated at . Thus, for , the specific consumer’s risk is calculated as .
- CRBayes denotes the threshold for SCR(). For example, if CRBayes is chosen as 5%, this means that only plans with SCR() 5% are admissible.
Note: In JCGM 106 the realizations of random variables were denoted via Greek letters (eta). For the sake of legibility, the notation has been changed as described above.
2. Definition and interpretation of risks
In this paper, various definitions of producer and consumer’s risks (PR and CR) will be presented. In particular, it will be seen that the traditional definitions from the ISO 2859 and ISO 3951 series of standards only represent one perspective, and that these definitions can be extended quite naturally via a simple change in perspective which will be illustrated via contingency tables.
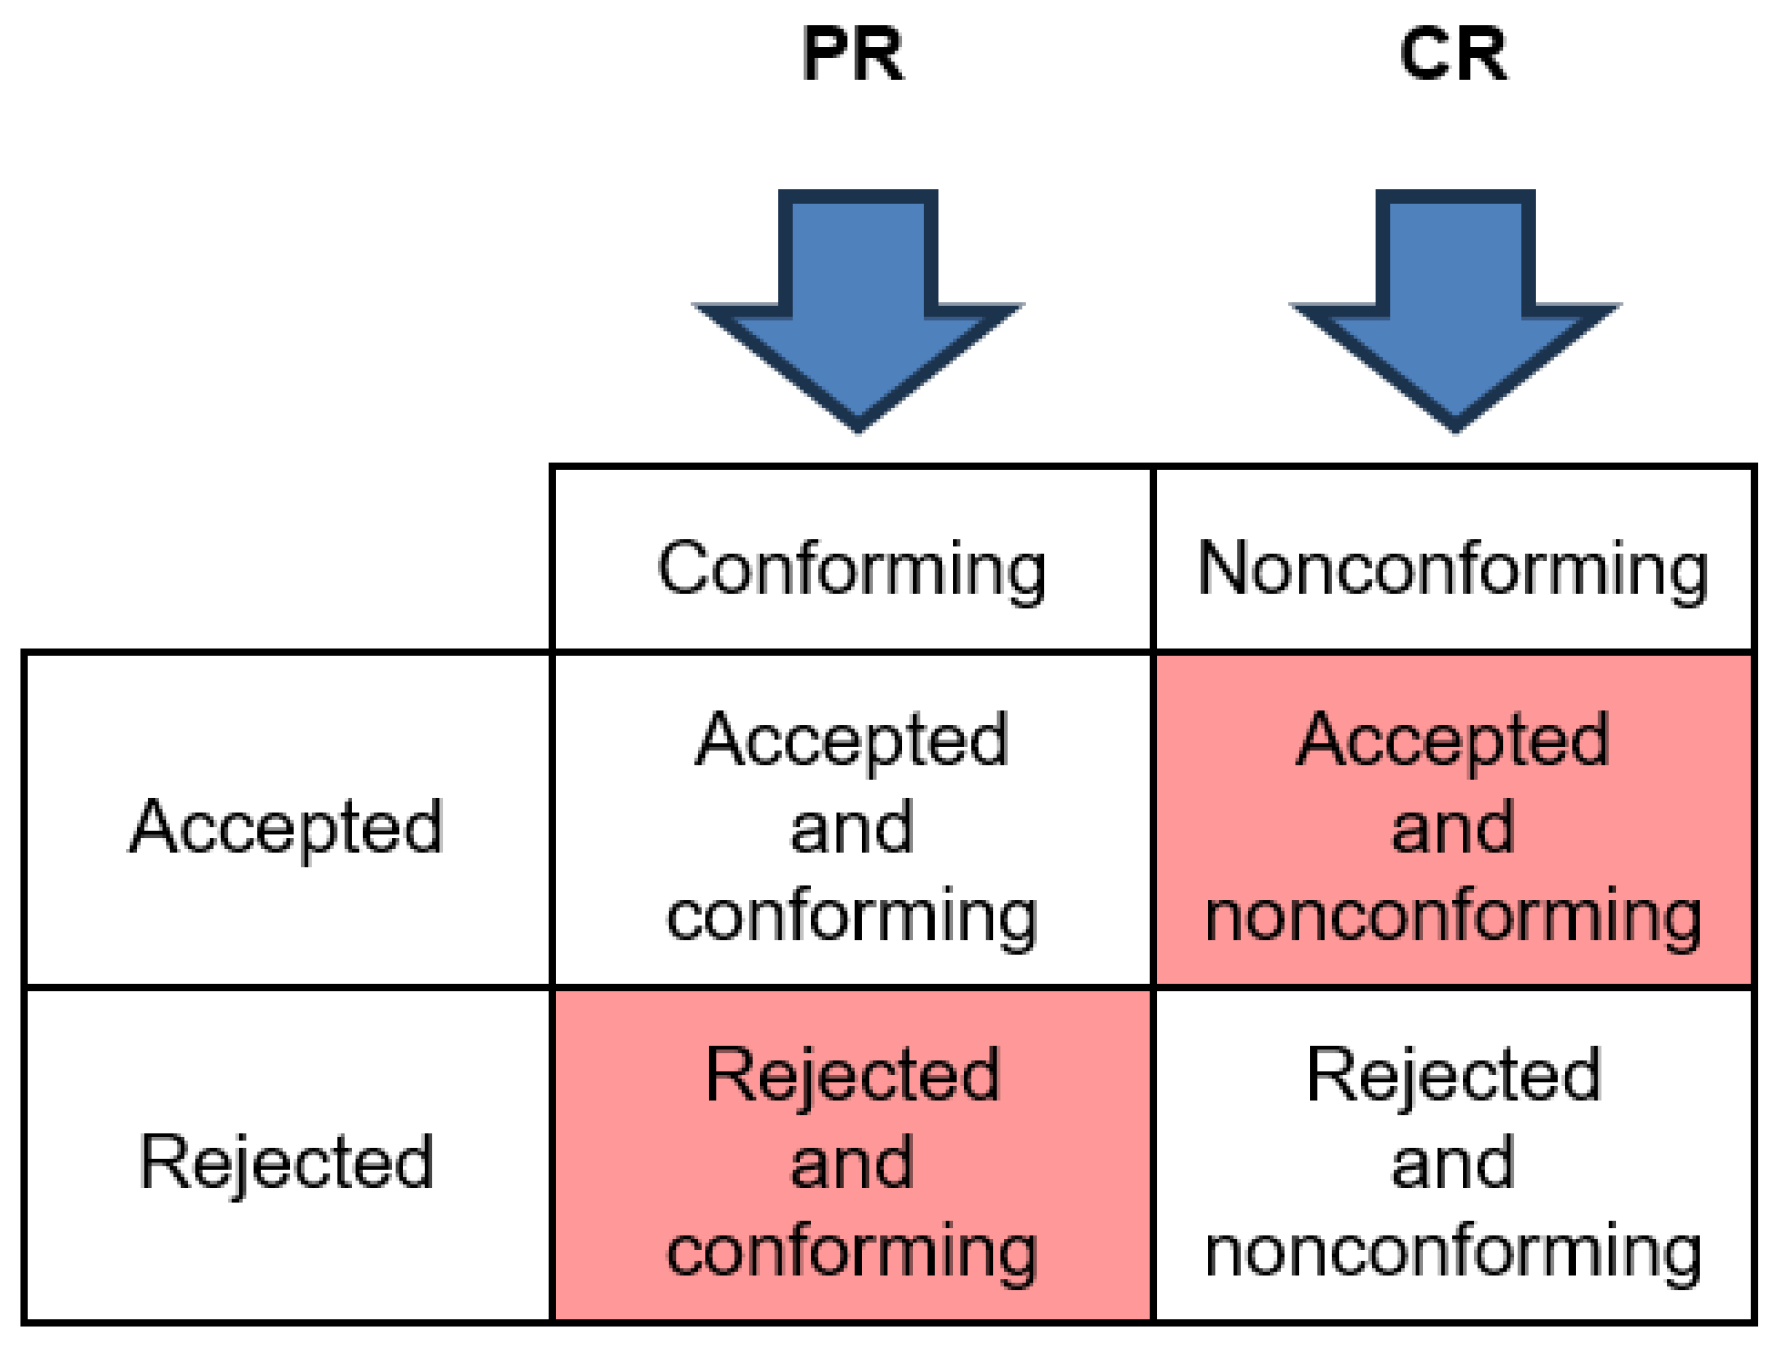
In the ISO standards, the risks are defined in terms of the probability of acceptance given a certain quality level. The following diagram illustrates the ISO definitions of PR and CR. As can be seen, the ISO PR is obtained by looking at the probability of rejection given a conforming lot, and the ISO CR is obtained by looking at the probability of acceptance given a nonconforming lot.
Figure 1.
ISO definitions of producer’s risk (PR) and consumer’s risk (CR) – vertical direction (column-wise).
Figure 1.
ISO definitions of producer’s risk (PR) and consumer’s risk (CR) – vertical direction (column-wise).
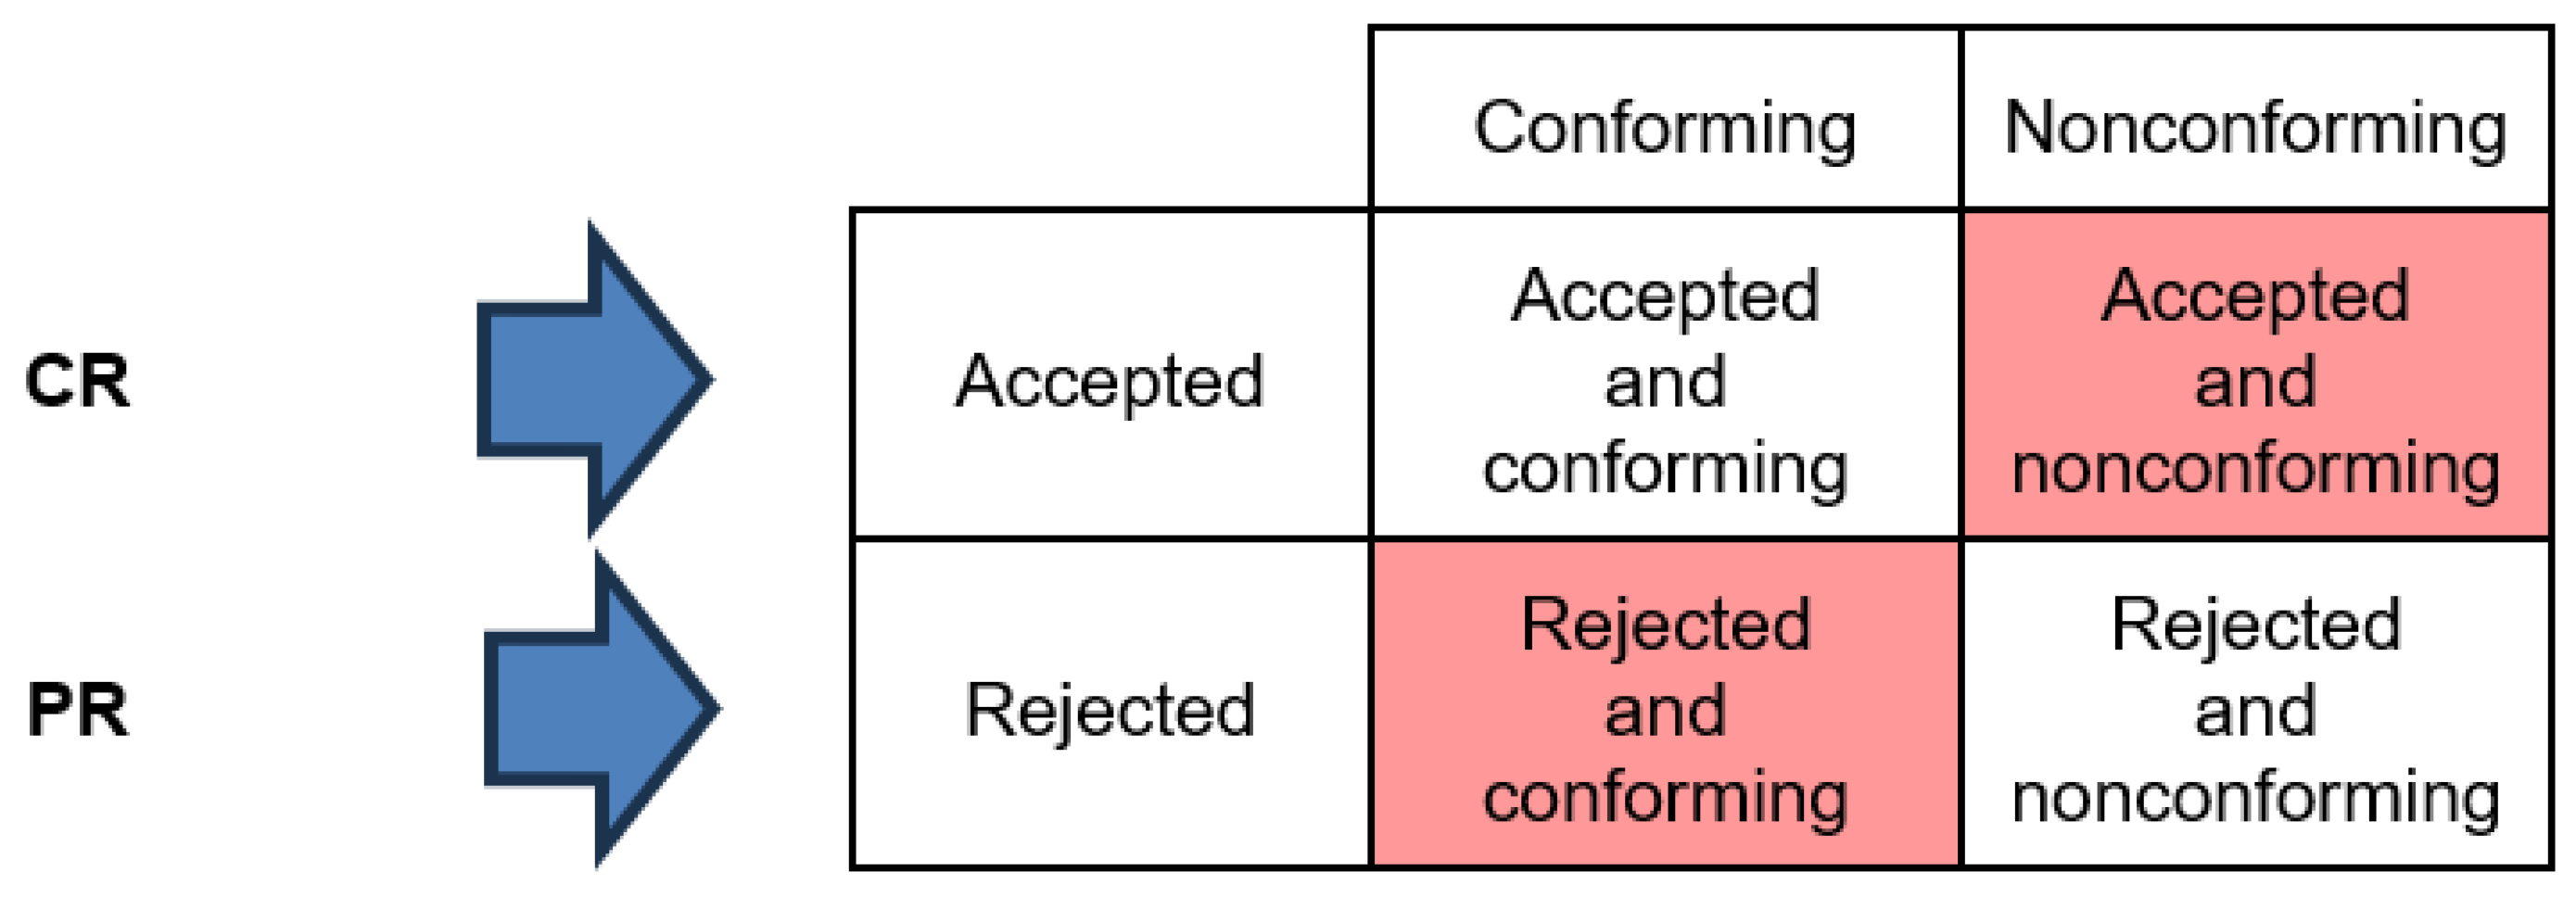
By contrast, the Bayesian producer and consumer’s risks go in the horizontal direction. Indeed, the Bayesian PR is obtained by looking at the probability of conformance given lot rejection and the Bayesian CR is obtained by looking at the probability of nonconformance given lot acceptance.
Figure 2.
Bayesian definitions of producer’s risk (PR) and consumer’s risk (CR) – horizontal direction (row-wise).
Figure 2.
Bayesian definitions of producer’s risk (PR) and consumer’s risk (CR) – horizontal direction (row-wise).
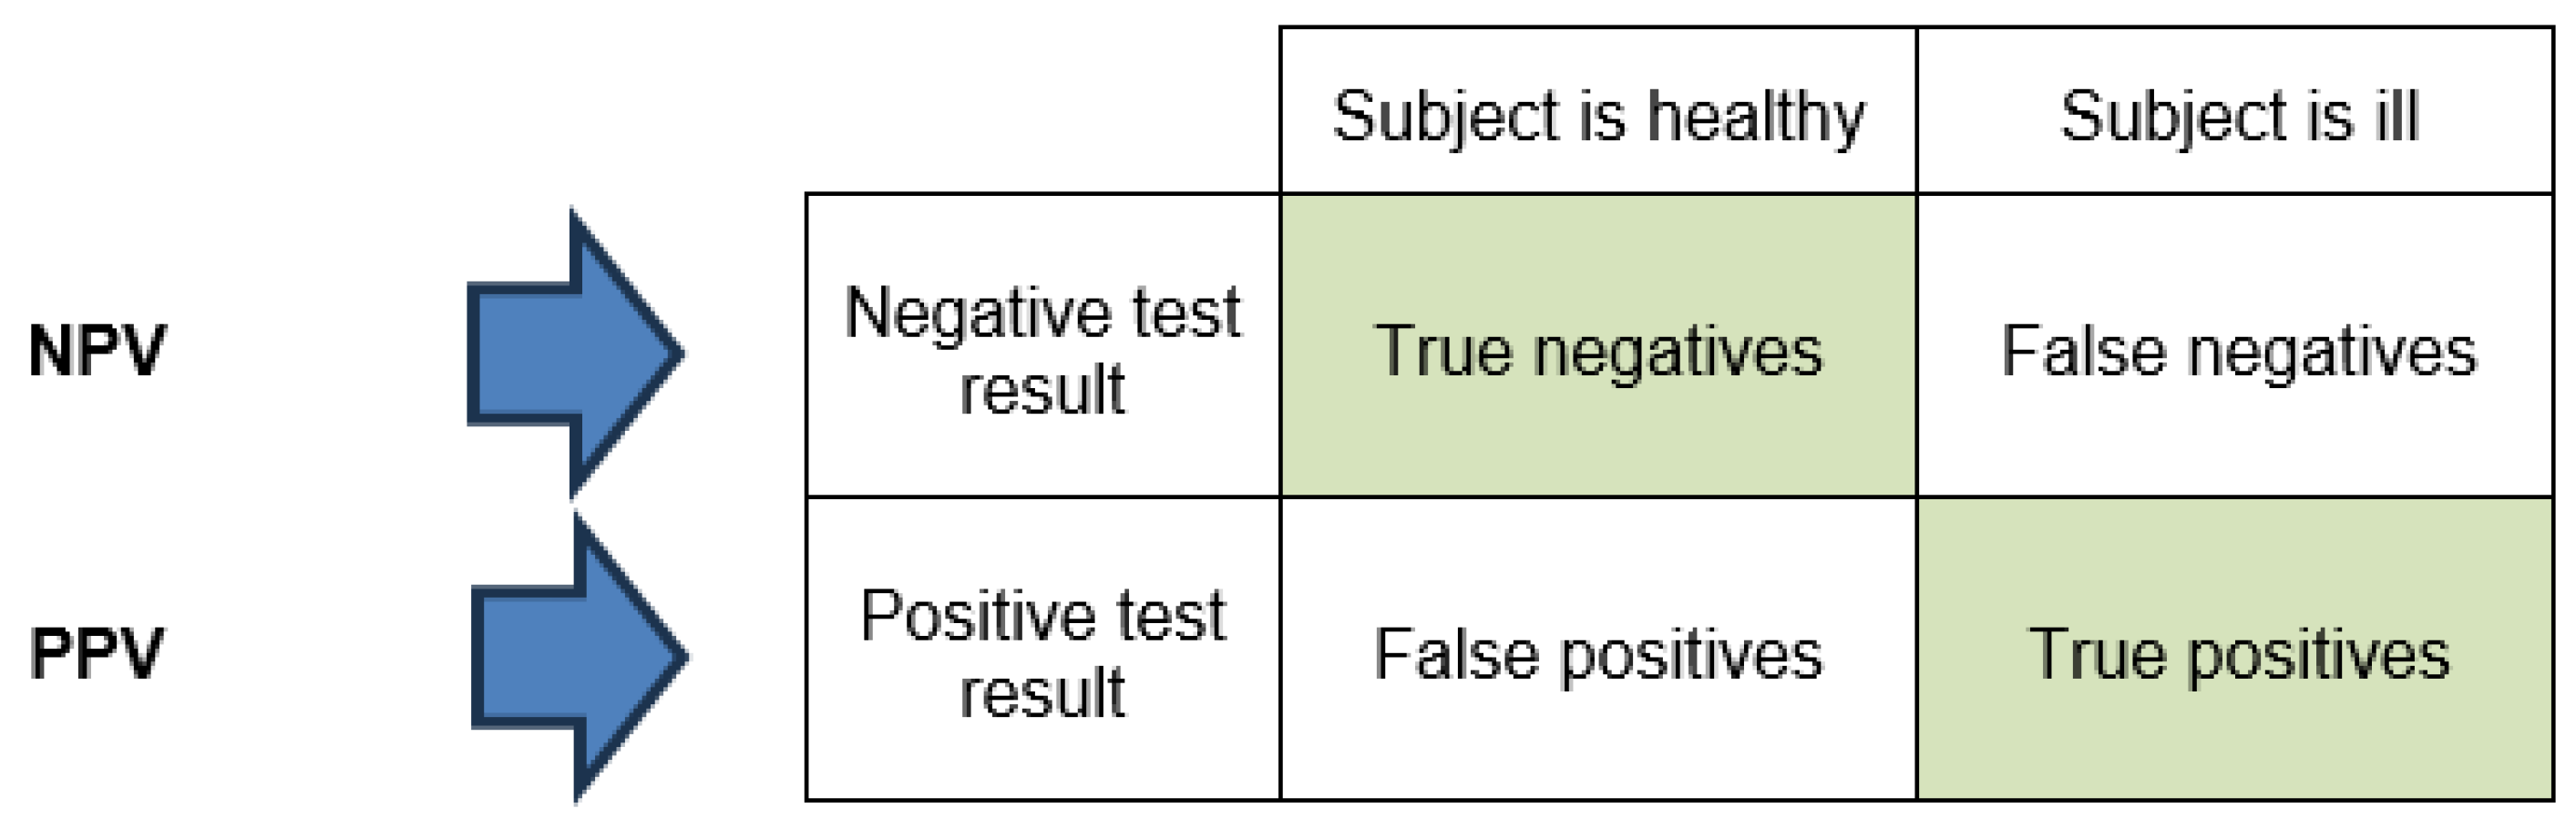
The Bayesian perspective may remind the reader of the calculation of negative and positive predictive values in medical diagnostics.
Figure 3.
Just as in the case of the Bayesian risks, the negative predictive value (NPV) and the positive predictive value (PPV) are calculated row-wise.
Figure 3.
Just as in the case of the Bayesian risks, the negative predictive value (NPV) and the positive predictive value (PPV) are calculated row-wise.
In the following, the ISO risks will be referred to as parametric risks4. There are different Bayesian risks, and they will be discussed in Section 6. For now, it is sufficient to look at one Bayesian risk: the specific risk (adapted here from JGCM 106 [1], where they are originally defined for individual items).
The parametric PR for a lot with a given quality level inside the conformance region is the probability of rejection:
Parametric PR =
The specific PR for a lot with test outcome outside the acceptance region (the number of nonconforming items in the sample taken from the lot is greater than the acceptance number ) is the probability of conformance:
Specific PR =
The parametric CR for a lot with a given quality level outside the conformance region is the probability of acceptance:
Parametric CR =
The specific CR for a lot with test outcome inside the acceptance region (the number of nonconforming items in the sample taken from the lot is less than or equal to the acceptance number ) is the probability of nonconformance:
Specific CR =
The following numerical example is provided to illustrate these definitions. In each of the two columns corresponding to conforming and nonconforming lot quality, the probabilities sum to 100%. Accordingly, the parametric risks (bottom row) are straightforward to calculate. However, for the two rows corresponding to accepted and rejected lots, the percentage values do not sum to 100% (in the Bayesian perspective, these values are likelihoods rather than probabilities). In order to calculate the specific risks, we require prior information (assumption) regarding the probability that the lot is conforming. The last two columns provide the specific risks for two different assumptions regarding lot quality: 20% versus 4% proportion nonconforming.

Table 1.
Numerical example to illustrate the definitions of parametric and specific risks along with their column- versus row-wise calculations.
Table 1.
Numerical example to illustrate the definitions of parametric and specific risks along with their column- versus row-wise calculations.
| Conforming Quality level i.e. |
Nonconforming Quality level i.e. |
Prior information (assumption): 20% probability that the lot is nonconforming |
Prior information (assumption): 4% probability that the lot is nonconforming |
|
| Accepted Test outcome i.e. |
Accepted and conforming 95% |
Accepted and non-conforming 25% |
Specific CR: = 6.2% |
Specific CR: = 1.1% |
| Rejected Test outcome i.e. |
Rejected and conforming 5% |
Rejected and non- conforming 75% |
Specific PR: = 21.1% |
Specific PR: = 61.5% |
|
Parametric PR: 5% |
Parametric CR: 25% |
The following table illustrates how prior information can be derived from past inspection results of lots whose true quality level (proportion nonconformity value ) is known. As can be seen, the proportion nonconforming is calculated as 20%.
Table 2.
Theoretical example illustrating how prior information can be obtained from the results of past inspections. In this case, a prior of 20% nonconforming could be reasonably proposed.
Table 2.
Theoretical example illustrating how prior information can be obtained from the results of past inspections. In this case, a prior of 20% nonconforming could be reasonably proposed.
| Conforming | Nonconforming | Total | |
| Accepted | 76 lots | 5 lots | 81 lots |
| Rejected | 4 lots | 15 lots | 19 lots |
| Total | 80 lots | 20 lots | 100 lots |
| Parametric risk | PR = 5% | CR = 25% |
It should be noted that while the contingency tables are primarily intended to illustrate the difference between parametric and specific risks, the above calculation of specific risks is mathematically correct under the following assumptions: = 1, = 0 and two-point prior with A) = 80% and = 20% and B) = 96% and = 4%. The calculation is illustrated in the following.
A) The prior is = 80% and = 20%. The specific consumer’s risk and the specific producer’s risk are highlighted in red and blue, respectively.
Table 3.
Bayesian calculation of specific risks for a two-point prior corresponding to 20% probability nonconforming. Note that the entries in the likelihood column correspond to the rows of the contingency matrix (Table 1).
Table 3.
Bayesian calculation of specific risks for a two-point prior corresponding to 20% probability nonconforming. Note that the entries in the likelihood column correspond to the rows of the contingency matrix (Table 1).
| Accepted | = 0 | |||||
| X | Prior | Likelihood | Prior x Likelihood | Posterior | ||
| Conforming | 5% | 80% | 95% | 76% | 93.8% | |
| Nonconforming | 75% | 20% | 25% | 5% | 6.2% | |
| Sum | 100% | 81% | 100.0% | |||
| Rejected | = 1 | |||||
| X | Prior | Likelihood | Prior x Likelihood | Posterior | ||
| Conforming | 5% | 80% | 5% | 4% | 21.1% | |
| Nonconforming | 75% | 20% | 75% | 15% | 78.9% | |
| Sum | 100% | 19% | 100.0% | |||
A) The prior is = 96% and = 4%. The specific consumer’s risk and the specific producer’s risk are highlighted in red and blue, respectively..
Table 4.
Bayesian calculation of specific risks for a two-point prior corresponding to 4% probability nonconforming. Note that the entries in the likelihood column correspond to the rows of the contingency matrix (Table 1).
Table 4.
Bayesian calculation of specific risks for a two-point prior corresponding to 4% probability nonconforming. Note that the entries in the likelihood column correspond to the rows of the contingency matrix (Table 1).
| Accepted | = 0 | |||||
| X | Prior | Likelihood | Prior x Likelihood | Posterior | ||
| Conforming | 5% | 96% | 95% | 91% | 98.9% | |
| Nonconforming | 75% | 4% | 25% | 1% | 1.1% | |
| Sum | 100% | 92.2% | 100.0% | |||
| Rejected | = 1 | |||||
| X | Prior | Likelihood | Prior x Likelihood | Posterior | ||
| Conforming | 5% | 96% | 5% | 5% | 61.5% | |
| Nonconforming | 75% | 4% | 75% | 3% | 38.5% | |
| Sum | 100% | 7.8% | 100.0% | |||
3. Designing acceptance sampling plans on the basis of conformance probability
A lot is conforming if the true proportion nonconforming is less than a specified tolerance limit . Typically, the true proportion nonconforming is unknown (indeed, if it were known, there would be no need for acceptance sampling). For this reason, the criterion for accepting a lot is not expressed in terms of but rather in terms of a test outcome . The lot is accepted if . An acceptance sampling plan thus consists of a pair (,) = (sample size, acceptance number).
While the test outcome is intended to provide a reliable indication of the lot’s quality, it is possible for a nonconforming lot to be accepted and for a conforming lot to be rejected. Hence, determining the producer and consumer’s risks (PR and CR) associated with a given plan plays a central role in acceptance sampling.
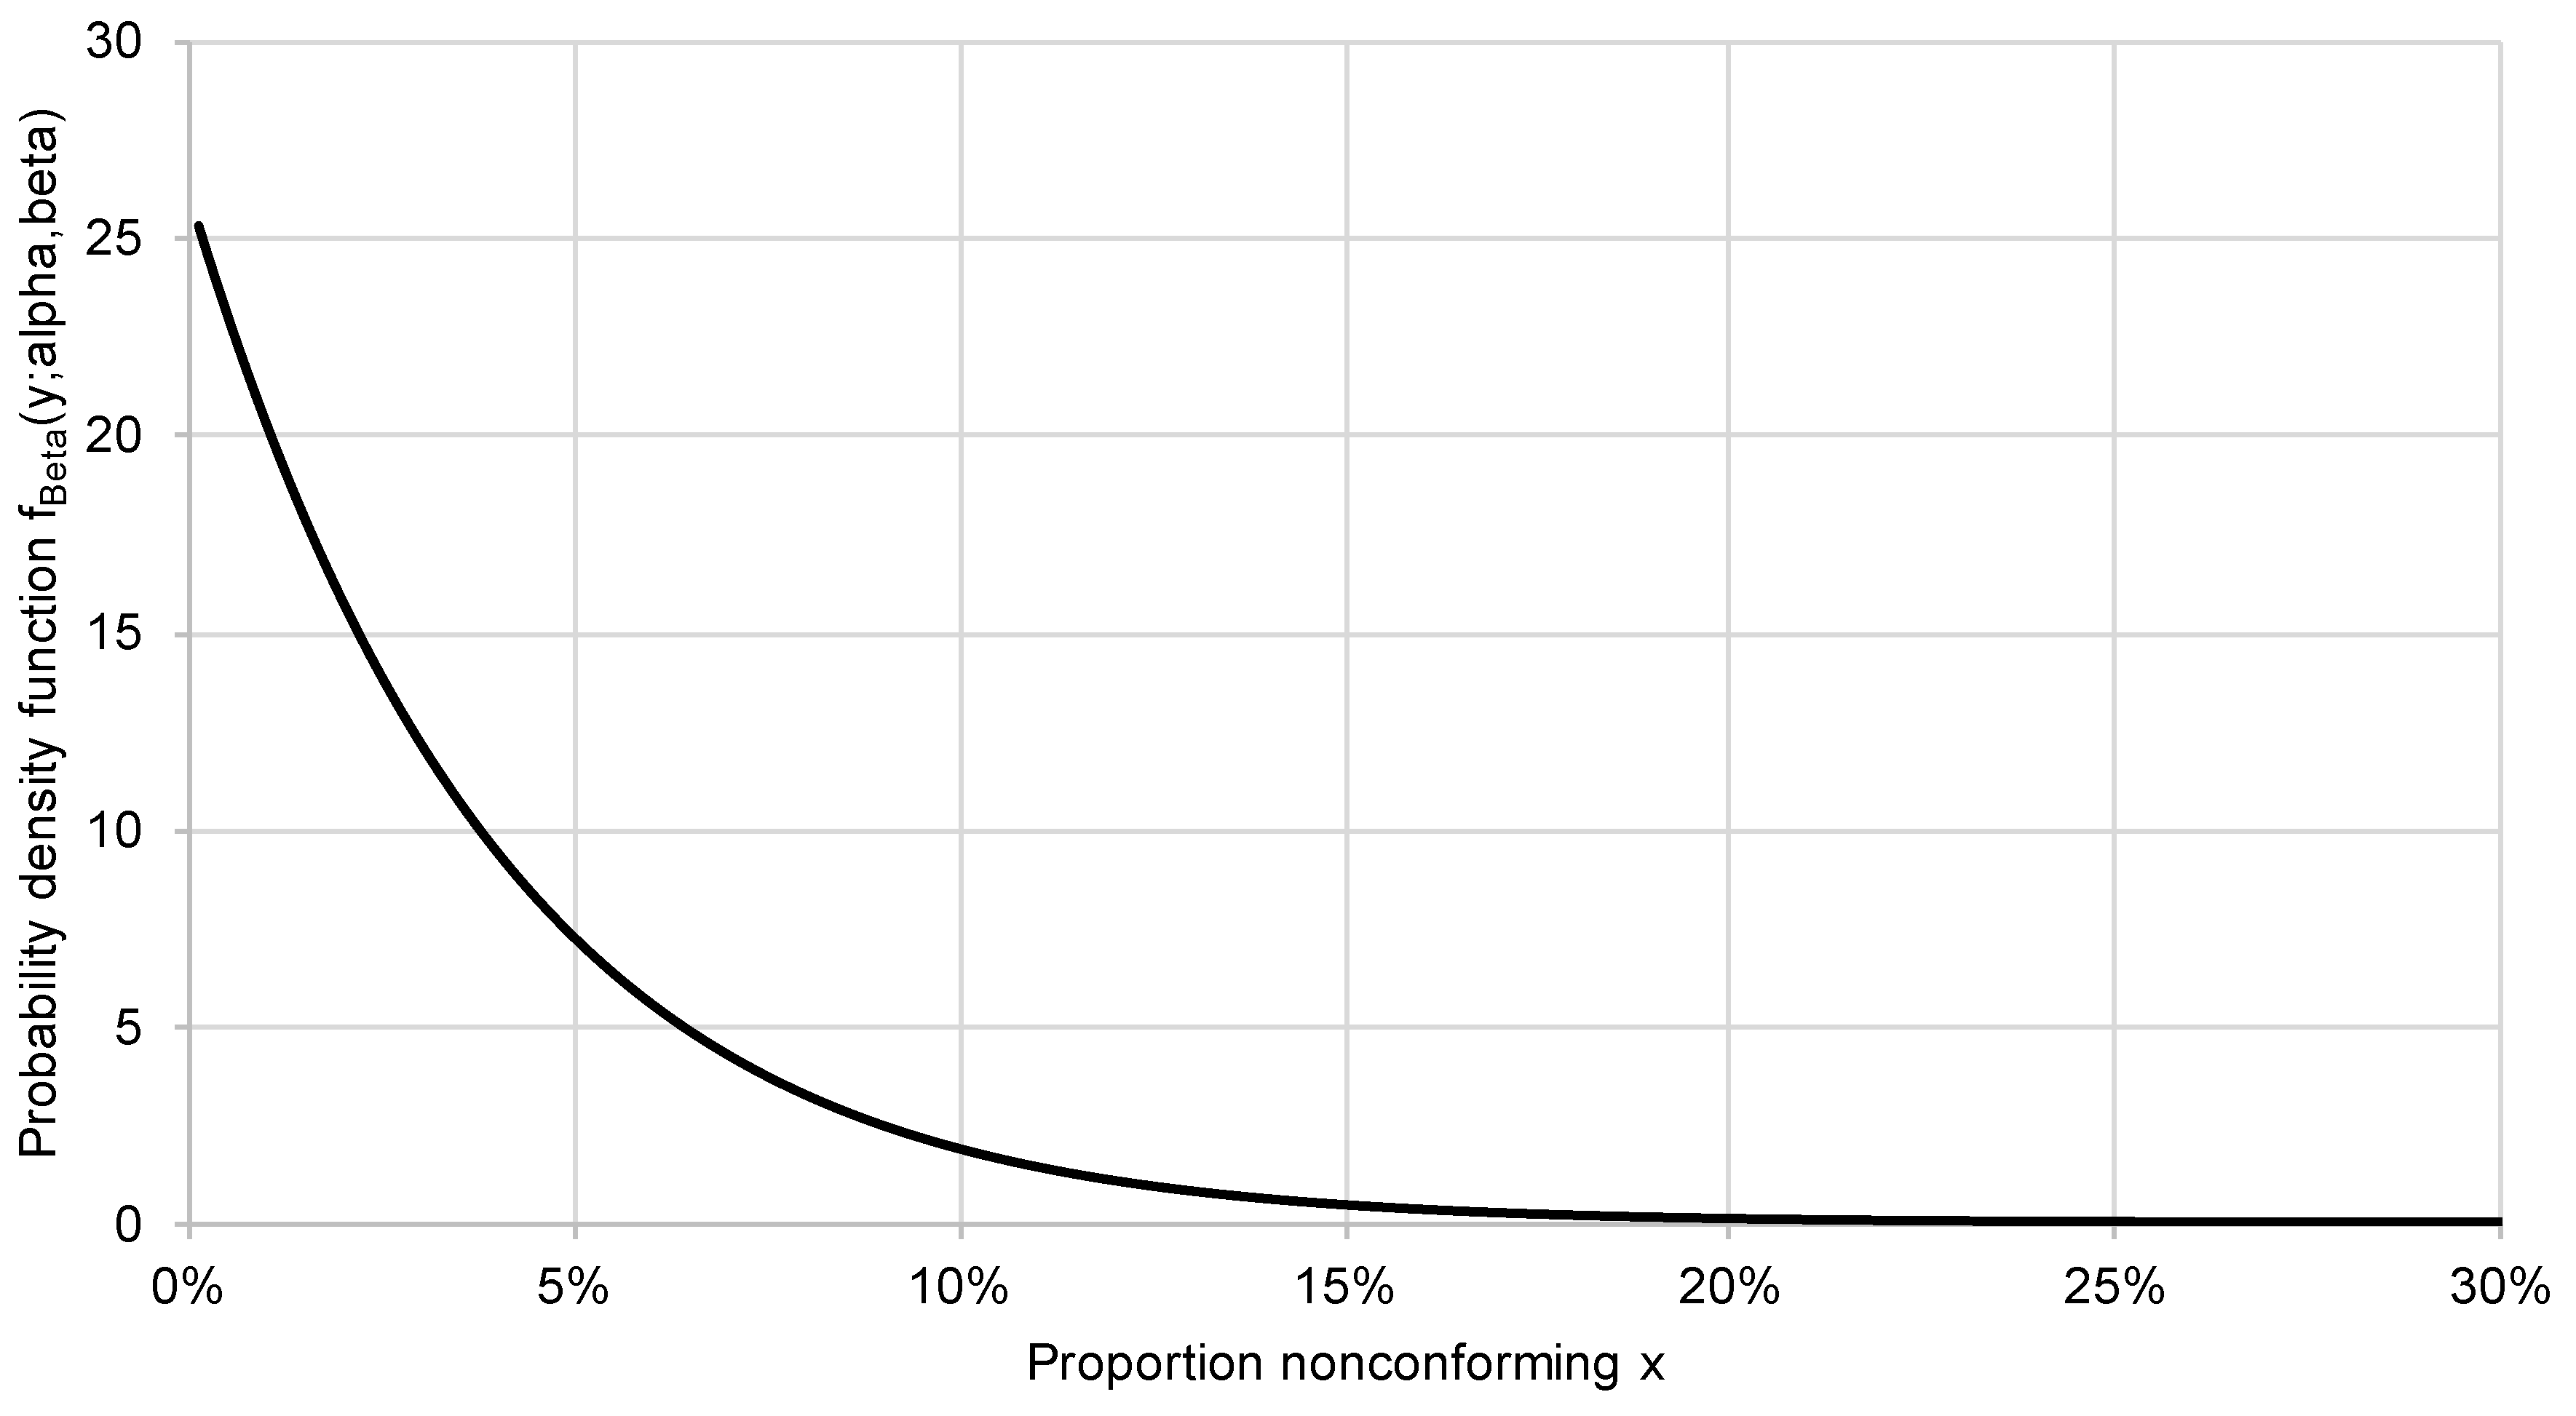
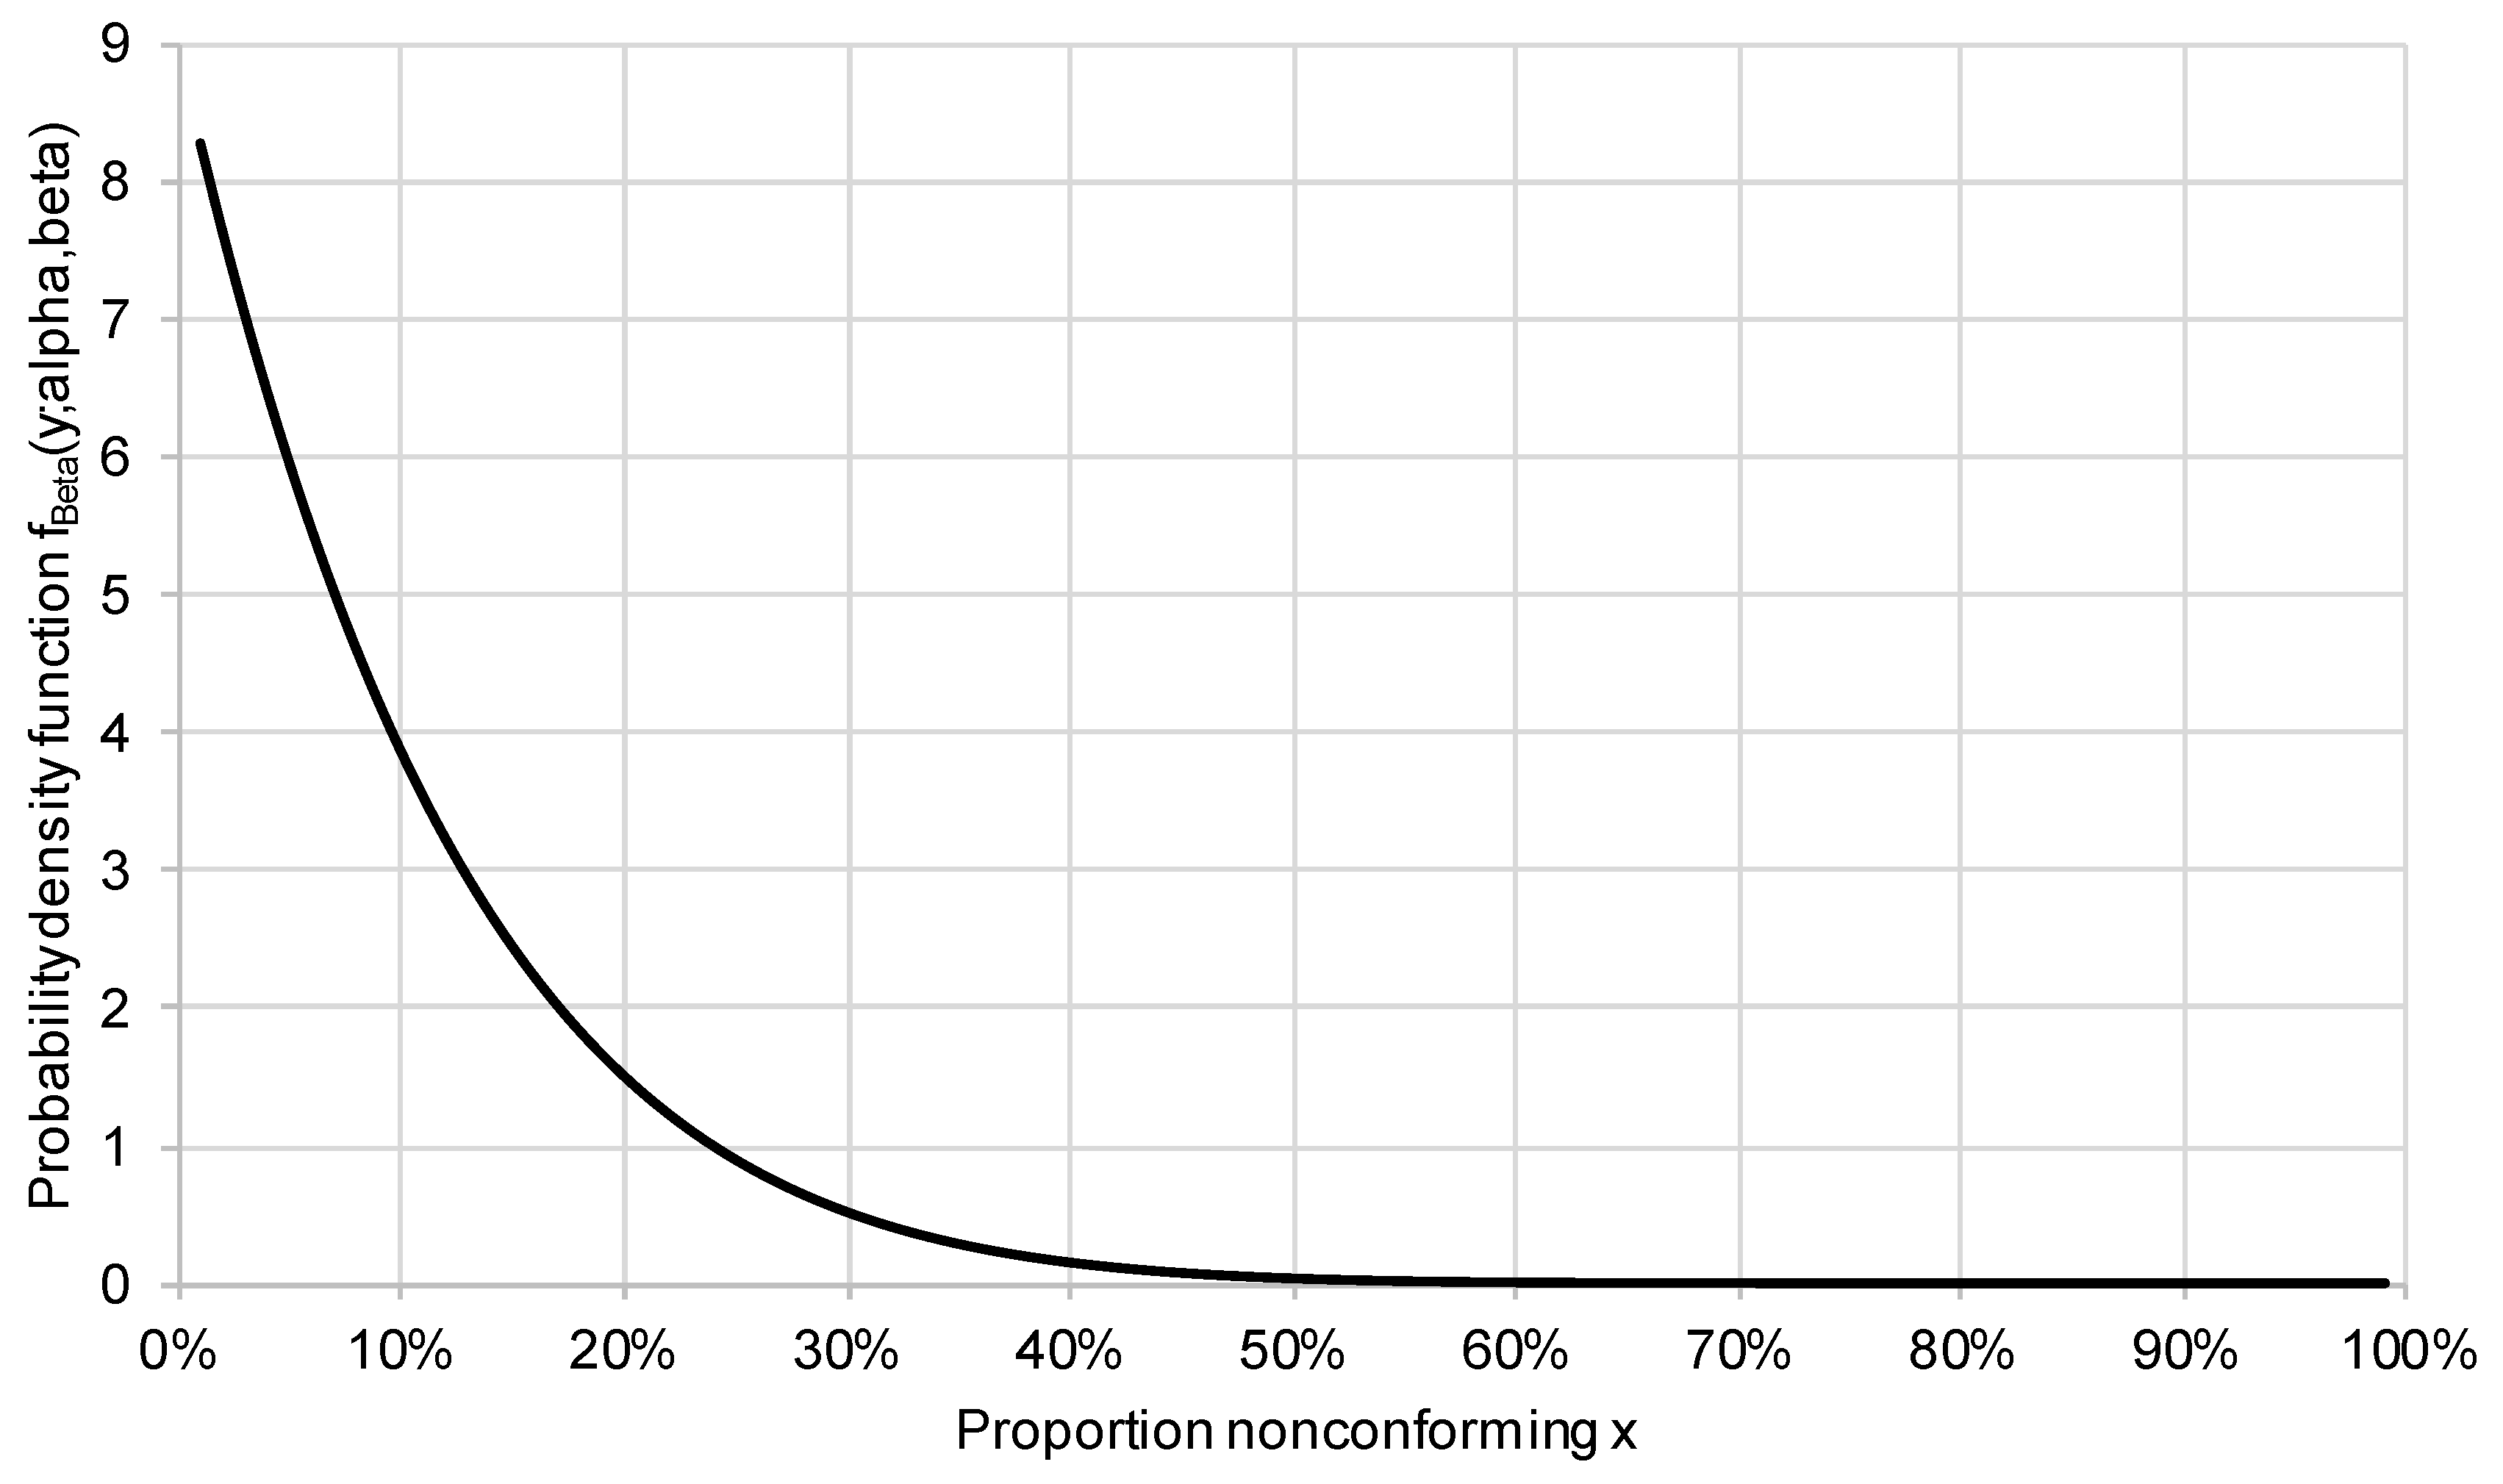
Given a sample size , the consumer can calculate the posterior and the conformance probability separately for every possible test outcome . The curve obtained by plotting against for all possible outcomes (i.e. for ) is called the conformance probability curve. Figure 4 shows the conformance probability curve for = 10%, the prior Beta(1,9) and = 20.
As can be seen, a conformance probability curve is always decreasing, i.e. the maximum is always at .
It is proposed to design acceptance sampling plans on the basis of . In order do so, we will need three definitions.
Definition 1: specific consumer’s risk at the outcome– denoted SCR()
For , the specific consumer’s risk SCR(y) is defined as .
Definition 2: threshold CRBayes for the SCR
This threshold plays the role of a “Bayesian CR.” In the ISO standards for acceptance sampling, the consumer’s risk CRISO (i.e. the CR value at quality level CRQ or LQ) is typically 10%, whereas the producer’s risk (i.e. the PR value at quality PRQ or AQL) is typically 5%. In the present paper, the same value for CRBayes and PRBayes will be chosen (typically either 5% or 10% for both PR and CR).
Definition 3: admissible conformance probability curve (with respect to a specified threshold CRBayes)
A conformance probability curve is admissible with respect to a specified threshold CRBayes if CRBayes. Equivalently, a conformance probability curve is admissible with respect to a specified threshold CRBayes if SPR() CRBayes. For instance, if CRBayes = 10% has been specified, then the conformance probability curve shown in Figure 4 is admissible since 90%. Indeed, this curve is also admissible with respect to CRBayes = 5%.
The procedure for designing an acceptance sampling plan can now be described.
It is assumed that CRBayes has been specified and that the consumer is equipped with a prior . The aim is to determine a plan (). The procedure consists of two steps.
Step 1: determine the minimal sample size such that the conformance probability curve is admissible with respect to the specified threshold CRBayes.
Step 2: for the sample size from step 1, determine the highest outcome such that
CRBayes (or, equivalently, SCR() CRBayes).
The acceptance sampling plan is then: sample size from step 1 and from step 2.
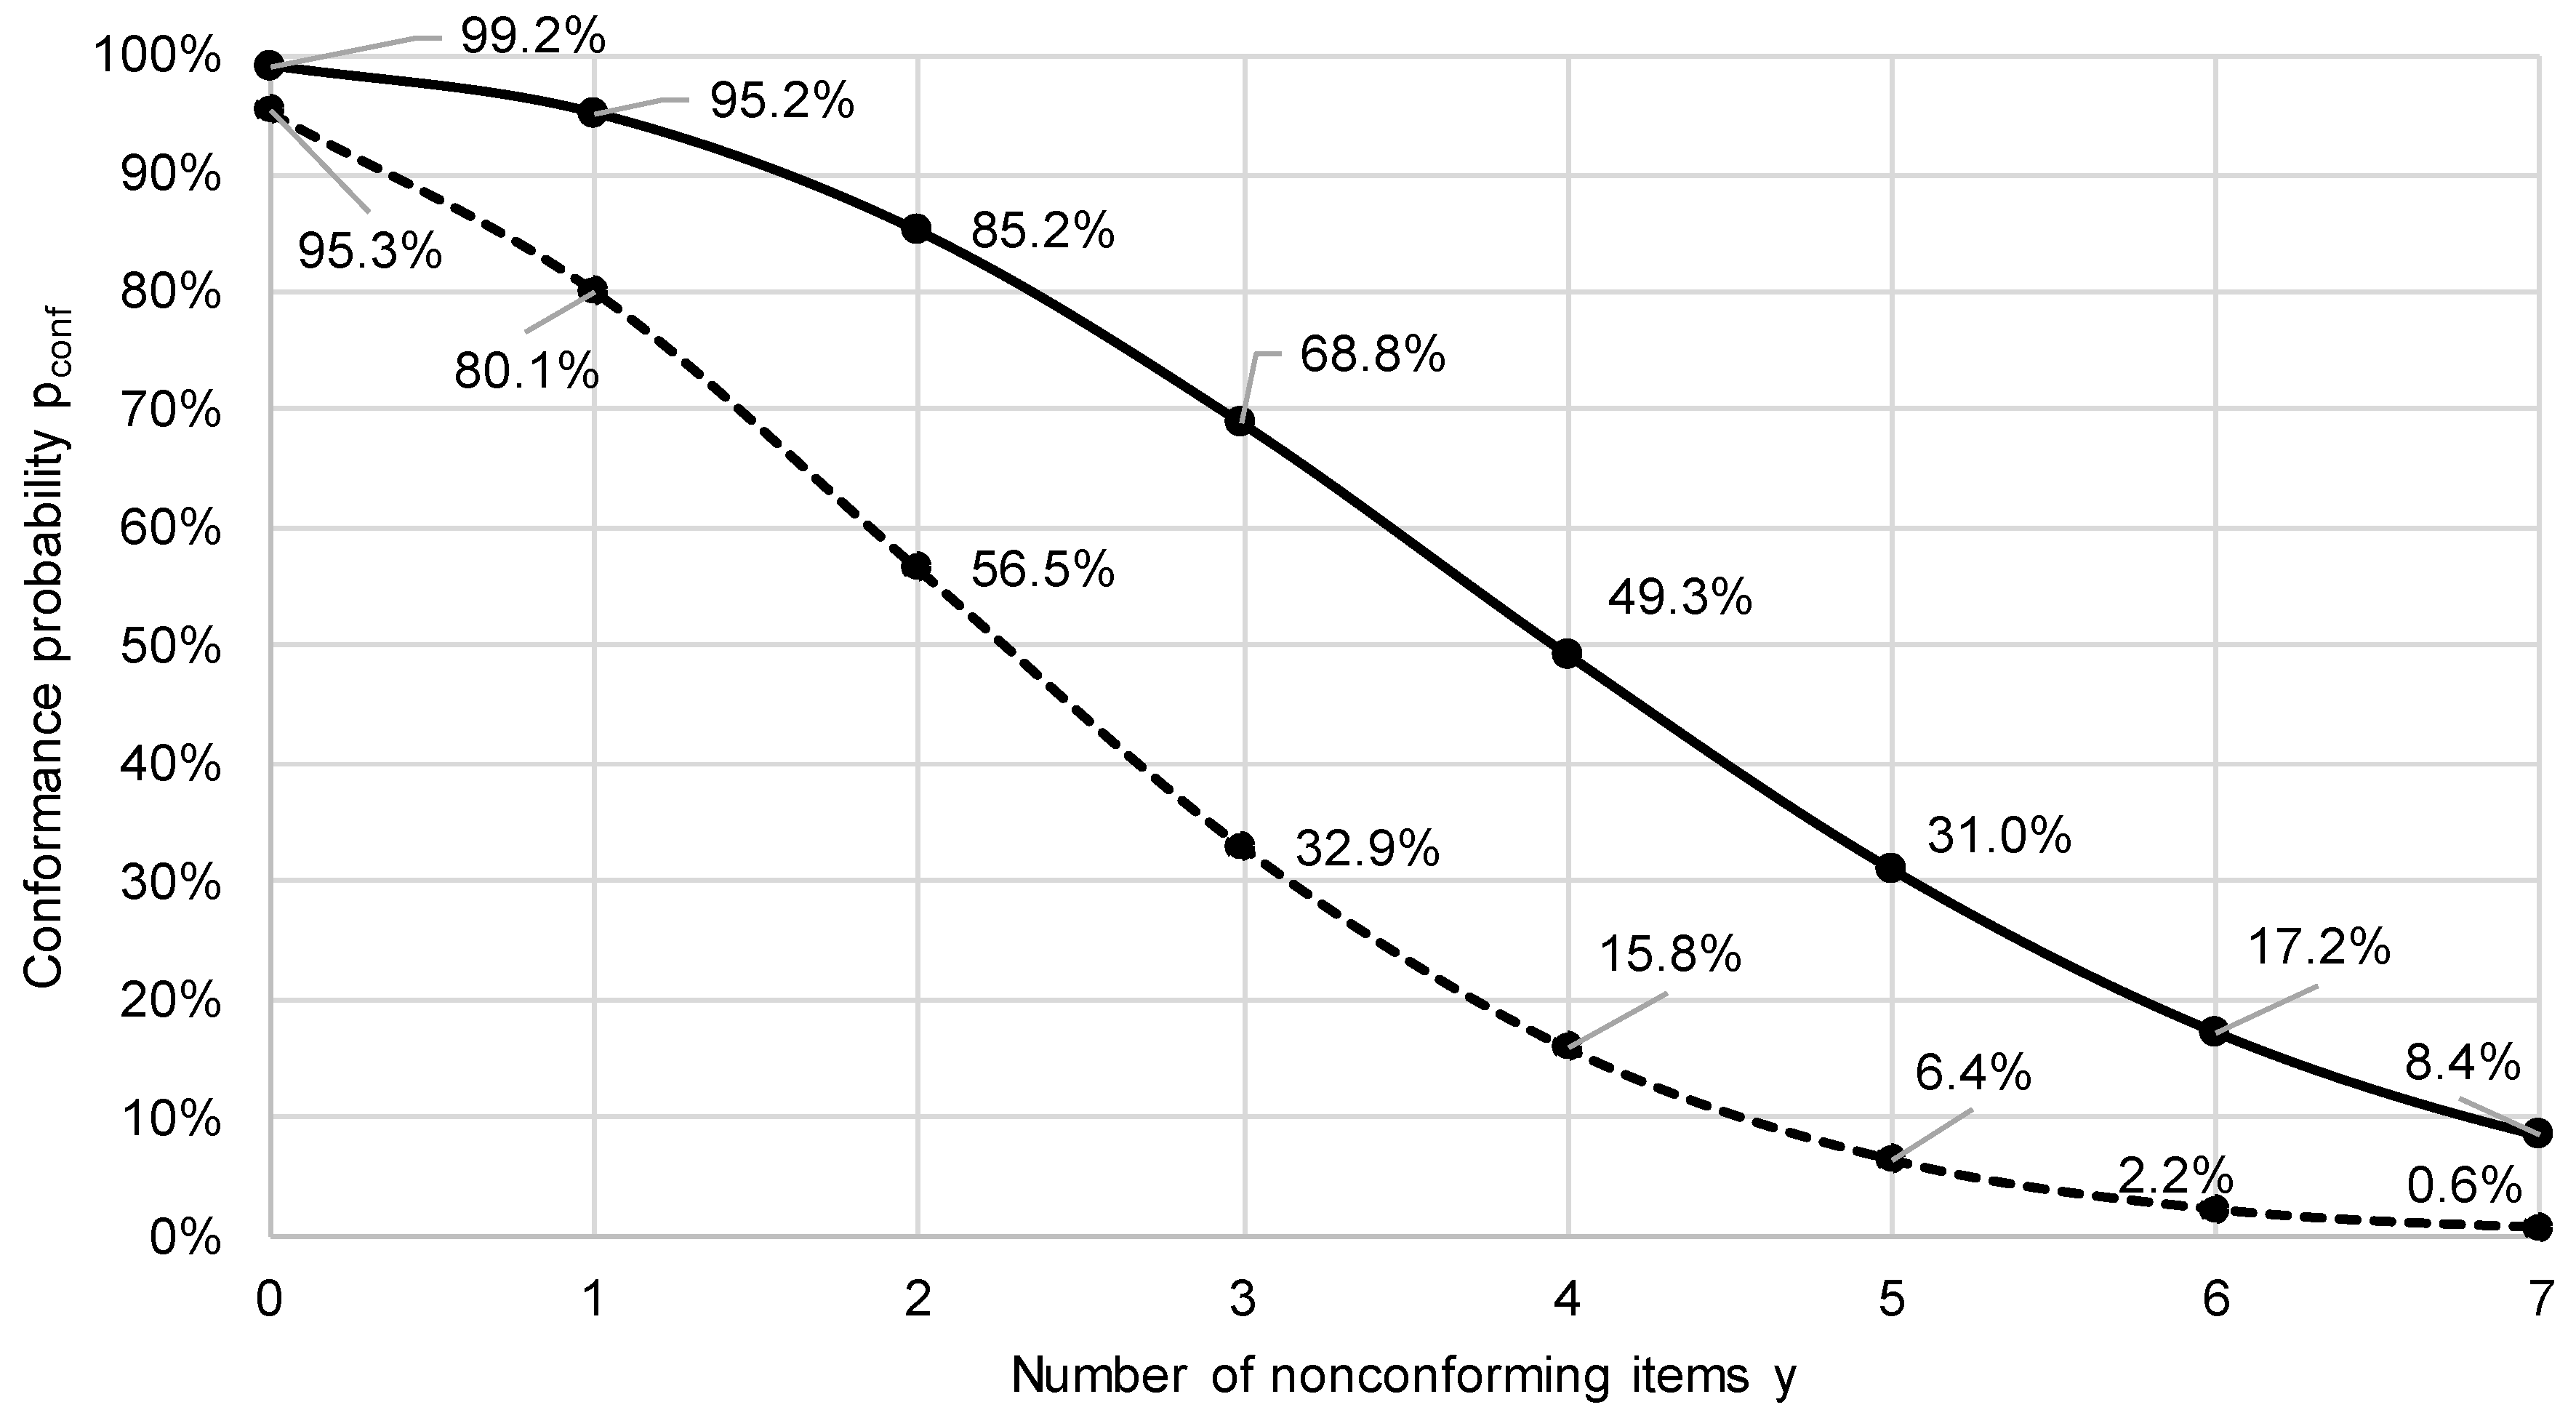
Consider the case that = 10%, CRBayes = 5% and the consumer prior is Beta(1,9). The values are shown in the following table for sample size .
| 1 | 65.1% | 11 | 87.8% |
| 2 | 68.6% | 12 | 89.1% |
| 3 | 71.8% | 13 | 90.2% |
| 4 | 74.6% | 14 | 91.1% |
| 5 | 77.1% | 15 | 92.0% |
| 6 | 79.4% | 16 | 92.8% |
| 7 | 81.5% | 17 | 93.5% |
| 8 | 83.3% | 18 | 94.2% |
| 9 | 85.0% | 19 | 94.8% |
| 10 | 86.5% | 20 | 95.3% |
As can be seen, the conformance probability curves are not admissible (with respect to CRBayes = 5%) for . Thus, is chosen as sample size. The conformance probability curve for is shown in Figure 4. As can be seen, the probability of conformance is less than CRBayes = 95% for . Hence we have .
It is instructive to compare the conformance probability curve to the OC curve used to characterize the ISO acceptance sampling plans in the ISO 2859 standards. In the OC curve the probability of acceptance is plotted against the “true” proportion nonconforming. The following diagram shows the OC curve for the plan (, ).
Figure 5.
Classical OC curve for the acceptance sampling plan (n=20, c=0). The probability of acceptance is calculated via by means of the binomial distribution.
Figure 5.
Classical OC curve for the acceptance sampling plan (n=20, c=0). The probability of acceptance is calculated via by means of the binomial distribution.
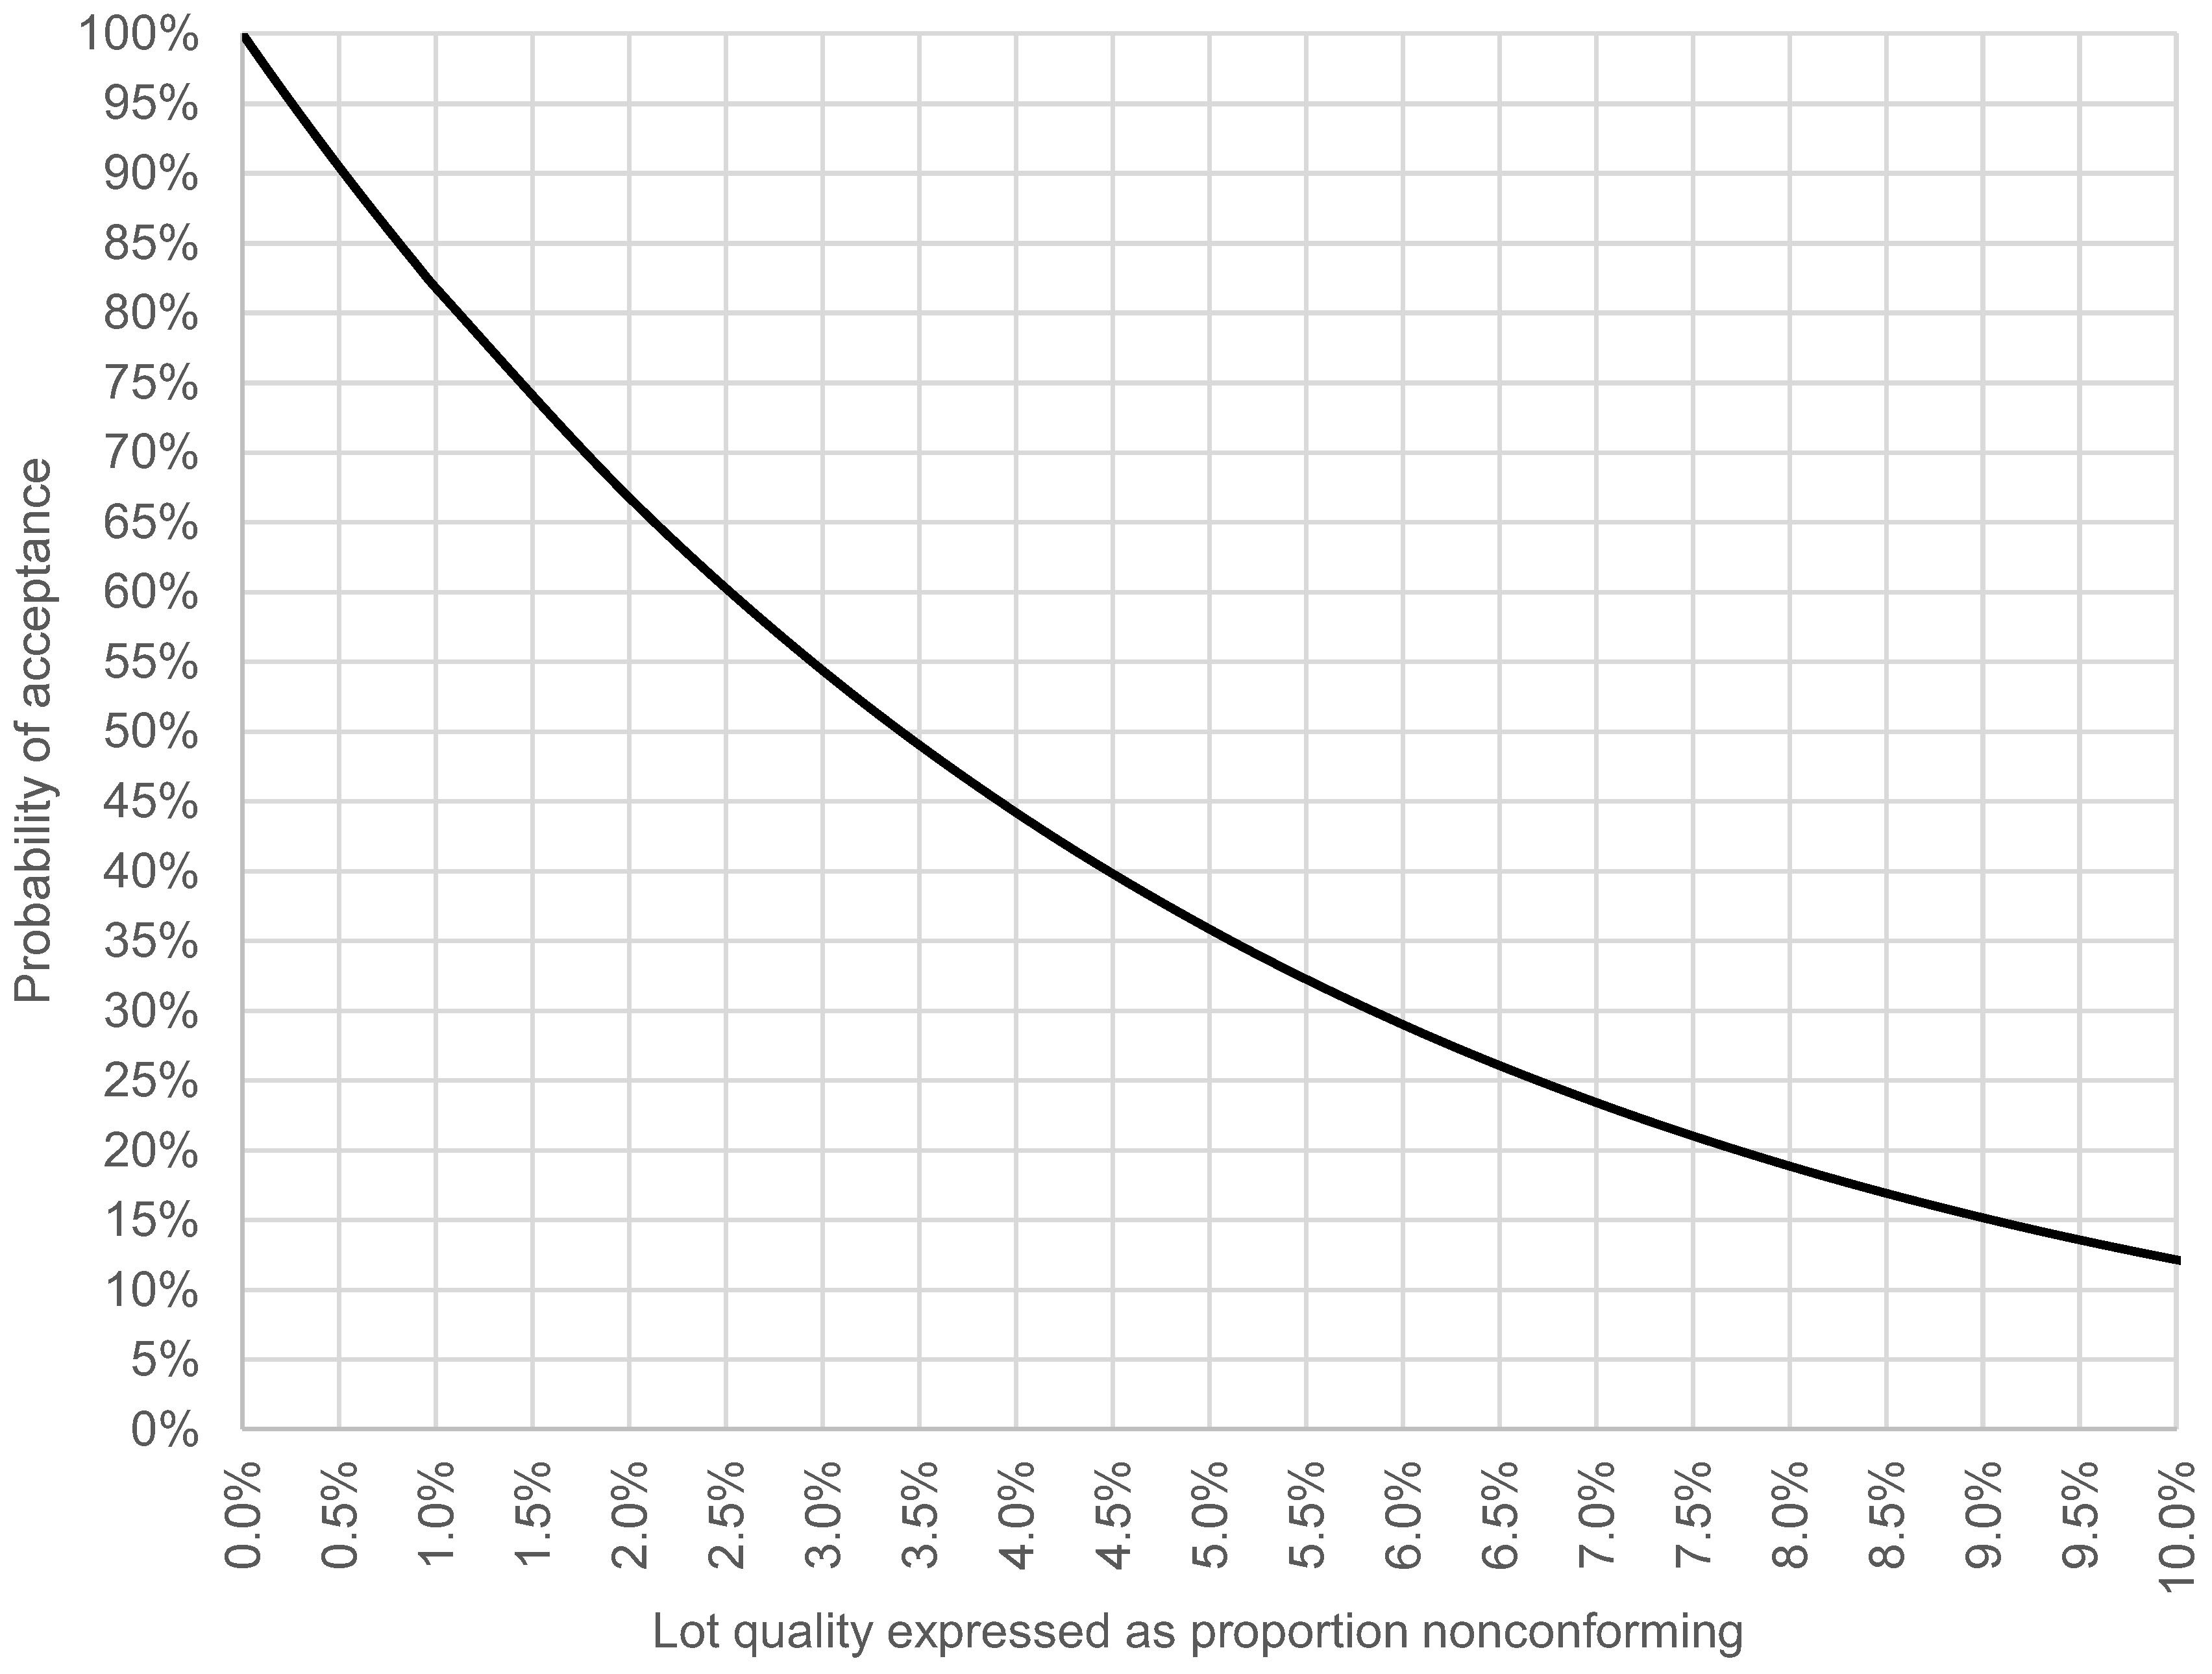
As can be seen, the probability of acceptance at proportion nonconforming is just above 10%. This raises the question whether, in general, lies close to CRQ (LQ).
The focus so far has lain entirely on the consumer’s risk. It is now time to consider acceptance sampling from the producer’s perspective.
4. Overview of Bayesian risks
Besides the parametric risks (i.e. the risks used in the ISO acceptance sampling standards [4,7]), there are a further 5 Bayesian producer’s risks and 5 Bayesian consumer’s risks. This section provides a convenient overview of the Bayesian risks and proposes simple and consistent terminology and notation. Not all the risks listed here will be discussed or used in the current paper. Some of the producer’s risks will be applied and discussed in the next section. CPRx and CCRx will be discussed in Section 7.
It is important to note that any given Bayesian risk can be calculated with any prior. In particular, any one of the 5 Bayesian producer’s risks can be calculated with a prior that reflects the producer’s perspective or information, or with a prior that reflects the consumer’s perspective or information—or, indeed, with a prior which represents a compromise between both perspectives.
The following table provides an overview of all Bayesian producer’s risks.
Table 5.
Bayesian producer’s risks – notation and interpretation.
| Risk | Notation | Definition |
|---|---|---|
| Specific PR (evaluated for test outcome ) | SPR() | How likely is it that a lot is conforming, given that it is rejected? |
| Conditional PR (conditioned on the lot quality ) | CPRx | How likely is it that a lot is rejected, given that it is conforming? |
| Conditional PR (conditioned on the test outcome ) | CPRy | How likely is it that a lot is conforming, given that it is rejected? |
| Global PR | GPR | How likely is it that a lot is both conforming and rejected? |
| Global probability of rejection | GPrej | How likely is it that a lot is rejected – no matter whether it is conforming or not? |
The following table provides a convenient classification of these 5 producer’s risks.
Table 6.
Classification of Bayesian producer’s risks. The random variable X (with realization x) denotes the true proportion nonconforming of the lot, while the random variable Y (with realization y) denotes the test outcome (number of nonconforming items in the sample taken from the lot).
Table 6.
Classification of Bayesian producer’s risks. The random variable X (with realization x) denotes the true proportion nonconforming of the lot, while the random variable Y (with realization y) denotes the test outcome (number of nonconforming items in the sample taken from the lot).
| Conditional on | Unconditional | ||
| Conditional on one point | SPR() |
||
| Conditional on a region | CPRx |
CPRy |
|
| Global | GPR |
||
| Global probability of rejection | GPrej |
||
It should be noted that some of these risks have already been defined in the literature – e.g. in Brush [18] and Chun et al. [19] – albeit under different names. In Brush [18], the CPRy is called the Bayes Producer’s risk (BPR) and the CPRx is called the Classical Producer’s risk* (CPR*), where the superscript * is introduced to distinguish it from the parametric PRx.
The following table provides an overview of all Bayesian consumer’s risks.
Table 7.
Bayesian consumer’s risks – notation and interpretation.
| Risk | Notation | Interpretation |
|---|---|---|
| Specific CR (evaluated for test outcome ) | SCR() | How likely is it that a lot is nonconforming, given that it is accepted? |
| Conditional CR (conditioned on the lot quality ) | CCRx | How likely is it that a lot is accepted, given that it is nonconforming? |
| Conditional CR (conditioned on the test outcome ) | CCRy | How likely is it that a lot is nonconforming, given that it is accepted? |
| Global CR | GCR | How likely is it that a lot is both nonconforming and accepted? |
| Global probability of acceptance | GPacc | How likely is it that a lot is accepted – no matter whether it is conforming or not? |
Only the specific consumer’s risk SCR is considered in the present paper.
It should be noted that the global probability of acceptance may not have any practical relevance.
The following table provides a convenient classification of these 5 consumer’s risks.
Table 8.
Classification of Bayesian consumer’s risks. The random variable X (with realization x) denotes the true proportion nonconforming of the lot, while the random variable Y (with realization y) denotes the test outcome (number of nonconforming items in the sample taken from the lot).
Table 8.
Classification of Bayesian consumer’s risks. The random variable X (with realization x) denotes the true proportion nonconforming of the lot, while the random variable Y (with realization y) denotes the test outcome (number of nonconforming items in the sample taken from the lot).
| Conditional on | Unconditional | ||
| Conditional on one point | SCR() |
||
| Conditional on a region | CCRx |
CCRy |
|
| Global | GCR |
||
| Global probability of acceptance | GPacc |
||
The following table provides a numerical example in order to illustrate how the calculation of these risks depends on the prior. The priors are two-point distributions.
Table 9.
Bayesian risks for two different priors. In all cases, the upper limit of the conformance region is = 10%. The producer prior is a two-point distribution with = 96% and = 4%. The consumer prior is a two-point distribution with = 80% and = 20%. In all cases, the acceptance sampling plan is = 10 and = 0.
| Risks [%] calculated with | ||||
|---|---|---|---|---|
| producer prior | consumer prior | |||
|
Producer risks |
Specific PR (evaluated for test outcome ) | SPR() | 96.57 | 82.44 |
| Conditional PR (conditioned on the lot quality ) | CPRx | 40.13 | 40.13 | |
| Conditional PR (conditioned on the test outcome ) | CPRy | 91.52 | 64.26 | |
| Global PR | GPR | 38.52 | 32.10 | |
| Global probability of rejection | GPrej | 42.09 | 49.95 | |
|
Consumer risks |
Specific CR (evaluated for test outcome ) | SCR() | 0.74 | 4.29 |
| Conditional CR (conditioned on the lot quality ) | CCRx | 10.74 | 10.74 | |
| Conditional CR (conditioned on the test outcome ) | CCRy | 0.74 | 4.29 | |
| Global CR | GCR | 0.43 | 2.15 | |
| Global probability of acceptance | GPacc | 57.91 | 50.05 | |
It should be noted that the conditional risks CPRx and CCRx do not depend on the probabilites and .
In Brush (1986) [18], a different example with a two-point distribution as prior is discussed. The risks for this example are provided in the following table.
Table 10.
Bayesian risks for the two-point prior distribution discussed in Brush (1986) [18]. The upper limit of the conformance region is = 0.1%. The prior is a two-point distribution with = 75% and = 4%. The acceptance sampling plan is = 125 and = 0.
Table 10.
Bayesian risks for the two-point prior distribution discussed in Brush (1986) [18]. The upper limit of the conformance region is = 0.1%. The prior is a two-point distribution with = 75% and = 4%. The acceptance sampling plan is = 125 and = 0.
| Risk [%] | |||
|---|---|---|---|
|
Producer risks |
Specific PR (evaluated for test outcome ) | SPR() | 56.22 |
| Conditional PR (conditioned on the lot quality ) | CPRx | 11.75 | |
| Conditional PR (conditioned on the test outcome ) | CPRy | 52.99 | |
| Global PR | GPR | 8.81 | |
| Global probability of rejection | GPrej | 16.63 | |
|
Consumer risks |
Specific CR (evaluated for test outcome ) | SCR() | 20.61 |
| Conditional CR (conditioned on the lot quality ) | CCRx | 68.73 | |
| Conditional CR (conditioned on the test outcome ) | CCRy | 20.61 | |
| Global CR | GCR | 17.18 | |
| Global probability of acceptance | GPacc | 83.37 |
Looking at the CPRy value of circa 53% (which Brush calls Bayes Producer’s Risk, abbreviated to BPR), Brush comments that the results “should be shocking.” Indeed, the CPRy value means that 53% of the rejected lots are actually conforming. However, it should be borne in mind that—due to the prior—the probability of rejection is low (16.63%). For this reason, dividing by this probability (recall that the CPRy is a conditional probability) yields a relatively high risk. In many, cases the GPR is a more useful measure of producer risk. Such questions will be discussed in the following section.
5. Taking producer’s risks into account
In the procedure for designing acceptance sampling plans described above (Section 3), the focus lies on the consumer’s perspective and information as codified in the consumer prior. In the present section, the focus shifts to the producer’s perspective and how to include it in the design of the sampling plans. As already mentioned in Section 4, any Bayesian risk – such as the global PR (GPR) – can be calculated both with the consumer’s prior and the producer’s prior, or indeed with a “mixed” prior reflecting both perspectives. The present section will also provide an opportunity to discuss the interpretation and practical relevance of some of the risks listed in Section 4, such as the specific PR and the global PR.
In general, the producer and consumer priors will differ. This reflects the fact that the producer has access to more (better) information regarding the quality of the manufacturing process. For example, if is chosen as Beta(1,26), the expected value for the proportion nonconforming is 3.7% and the probability that is greater than lies around 6.5%, indicating that the quality of the process is compatible with the specification of the conformance region, while allowing for some level of variation from lot to lot. The following figure shows the density function for this prior.
Figure 6.
Probability density distribution for Beta(1,26).
Consider the scenario that the lot conformance region has been defined via an upper limit proportion nonconforming and that the consumer has proposed the plan (=20, =0) based on the consumer prior Beta(1,9), as discussed in Section 3. Furthermore, consider the case that the producer prior is Beta(1,26). The producer’s conformance probability curve will differ from the consumer’s. The following figure shows the two conformance probability curves.
Figure 7.
Conformance probability curves for n = 20, x_C = 10%. The dashed line shows the curve for the consumer prior Beta(1,9) and the solid line shows the curve for the producer prior Beta(1,26).
Figure 7.
Conformance probability curves for n = 20, x_C = 10%. The dashed line shows the curve for the consumer prior Beta(1,9) and the solid line shows the curve for the producer prior Beta(1,26).
Comparing the consumer and producer conformance probability curves, the first thing to note is that the latter allows the acceptance number for CRBayes = 5% (in other words, in Step 2 in the procedure described in Section 3, we obtain ). This shows how the acceptance sampling plan depends on the prior. Indeed, with Beta(1,26) and = 10%, an admissible conformance probability curve (with respect to the threshold CRBayes = 5%) is obtained with sample size = 3.
Based on the producer’s conformance probability curve, the specific producer’s risk at test outcome is defined as follows (see Section 4):
for a given value of (i.e. ), SPR() = .
For , we have , and SPR() is 95.2% for the producer prior Beta(1,26) and = 10%.
Given lot rejection for a given value , SPR() provides useful information as to whether corrective measures are necessary. In general, the SPR provides useful information in connection with questions such as whether a rejected lot is indeed nonconforming and whether it makes sense to inspect the underlying production process. A high SPR means that it is likely that the lot quality was perfectly acceptable even though the lot was rejected, and that corrective action is thus not required.
The global producer’s risk (GPR) as defined in JCGM 106 is the probability that the lot is rejected despite being conforming, i.e. the probability that we have both and . The GPR is calculated as follows:
GPR =
=
It should be noted that the GPR can also be calculated with consumer prior .
For the acceptance plan (=20, =0), the producer prior Beta(1,26) and = 10%, the GPR is 37.5%.
It should be noted that for a point distribution at AQL as producer prior, the GPR is equal to the ISO producer’s risk.
Closely related to global PR (GPR) is the conditional PR (conditioned on the test outcome )
This conditional producer’s risk is always greater than or equal to GPR, since we are dividing by . Indeed, in his 1986 article [18], Brush notes that the CPRy (which he calls BPR) can he very high. However, this is often an artifact of an optimistic prior, and does not necessarily mean the acceptance sampling plan is not appropriate.
Now, while determining an acceptance sampling plan, the consumer will not typically have access to the producer’s prior. Nonetheless, the consumer can calculate GPR and CPRy on the basis of the consumer prior. The following table provides producer’s risk values for different plans for the consumer prior Beta(1,9).
Table 11.
For = 10% and for CRBayes = 5%, SPR (at ), GPR and CPRy for the consumer prior Beta(1,9).
| Sample size | SPR |
GPR | CPRy | ||
| 20 | 0 | 95.3% | 80.1% | 31.7% | 45.9% |
| 21 | 0 | 95.8% | 81.6% | 32.5% | 46.5% |
| 22 | 0 | 96.2% | 83.0% | 33.3% | 47.0% |
| 23 | 0 | 96.6% | 84.4% | 34.1% | 47.6% |
| 24 | 0 | 96.9% | 85.6% | 34.8% | 48.0% |
| 25 | 0 | 97.2% | 86.7% | 35.5% | 48.3% |
| 26 | 0 | 97.5% | 87.8% | 36.2% | 48.7% |
| 27 | 0 | 97.7% | 88.7% | 36.8% | 49.3% |
| 28 | 0 | 98.0% | 89.6% | 37.4% | 49.6% |
| 29 | 0 | 98.2% | 90.5% | 38.0% | 49.9% |
| 30 | 0 | 98.4% | 91.2% | 38.5% | 50.1% |
| 31 | 0 | 98.5% | 92.0% | 39.1% | 50.3% |
| 32 | 0 | 98.7% | 92.6% | 39.6% | 50.7% |
| 33 | 0 | 98.8% | 93.2% | 40.1% | 51.1% |
| 34 | 0 | 98.9% | 93.8% | 40.5% | 51.3% |
| 35 | 0 | 99.0% | 94.3% | 41.0% | 51.6% |
| 36 | 0 | 99.1% | 94.8% | 41.4% | 51.8% |
| 37 | 1 | 95.2% | 85.2% | 26.5% | 41.2% |
| 38 | 1 | 95.6% | 86.2% | 27.1% | 41.8% |
| 39 | 1 | 96.0% | 87.1% | 27.7% | 42.1% |
| 40 | 1 | 96.3% | 88.0% | 28.3% | 42.5% |
As can be seen, for a constant acceptance number , the producer’s risks increase with sample size. Accordingly, for a given acceptance number, it makes sense to select the plan with the smallest sample size for a given acceptance number. This means that for a given , CRBayes and prior, it makes to choose the most suitable plan among those with the lowest for a given . For = 10%, CRBayes = 5% and the Beta(1,9) prior, these plans are as follows:
Table 12.
Selected plans (for which c increases) for x_C = 10%, CRBayes = 5% and the Beta(1,9) prior.
Table 12.
Selected plans (for which c increases) for x_C = 10%, CRBayes = 5% and the Beta(1,9) prior.
| Sample size | SPR |
GPR | CPRy | ||
| 20 | 0 | 95.3% | 80.1% | 31.7% | 45.8% |
| 37 | 1 | 95.2% | 85.2% | 26.5% | 41.1% |
| 52 | 2 | 95.1% | 87.1% | 23.4% | 38.2% |
| 67 | 3 | 95.3% | 88.8% | 21.6% | 36.0% |
| 80 | 4 | 95.0% | 89.1% | 19.7% | 34.0% |
| 94 | 5 | 95.2% | 90.0% | 18.7% | 32.8% |
| 107 | 6 | 95.2% | 90.4% | 17.6% | 31.5% |
In order to obtain a GPR below 20%, a sample size of is required. With a more optimistic prior, however, the sample size can be considerably reduced. For example, with Beta(1,26), the lowest sample size yielding an admissible conformance probability curve for CRBayes = 5% is , and the corresponding GPR is 8% (the CPRy is 79%). The following table provides the first four plans for the Beta(1,26) prior, selected as in the previous table.
Table 13.
Selected plans (for which c increases) for x_C = 10%, CRBayes = 5% and the Beta(1,9) prior.
Table 13.
Selected plans (for which c increases) for x_C = 10%, CRBayes = 5% and the Beta(1,9) prior.
| Sample size | SPR |
GPR | CPRy | ||
| 3 | 0 | 95.3% | 80.1% | 8.1% | 78.6% |
| 20 | 1 | 95.2% | 85.2% | 13.5% | 73.4% |
| 35 | 2 | 95.1% | 87.1% | 12.8% | 70.5% |
| 50 | 3 | 95.3% | 88.8% | 12.3% | 68.3% |
It should be noted that, for this choice of prior and conformance region, as the sample size increases from to , the GPR increases from 8.1% to 13.5%. This is due to the fact that while, with this prior, around 95% of lots can be expected to be conforming (i.e. ), the probability of rejection increases with increasing sample size and acceptance number. For instance, for a lot with ‘true’ proportion nonconforming = 3.7% – the expected value for Beta(1,26) – the probability of acceptance for the plan (=3, =0) is 89.3% but the probability of acceptance for the plan (=20, =1) is 83.2%.
In practice, the producer and consumer will have to agree on an appropriate plan via a negotiation process. For instance, keeping to our running example of Beta(1,9) for the consumer prior and Beta(1,26) for the producer prior, the negotiation could take on a form such as the following
Step 1: the consumer proposes (on the basis of the consumer prior) the plan (=20, =0). The SPR evaluated at is less than 5%. The consumer is aware that the producer’s risk (calculated on the basis of the consumer prior) is around 32%.
Step 2: the producer, on the basis of the producer prior, calculates the GPR as around 13.5%. Moreover, the producer, on the basis of the producer prior, finds an =3 plan which allows SPR to be less than 5% and GPR to be less than 10%. The producer communicates this information to the consumer.
Step 3: the consumer makes the decision whether or not to lower the sample size on the basis of the information from step 2. It is perfectly legitimate for the consumer to take a cautious approach and to rely solely on the consumer prior, especially if the producer is unknown and cannot substantiate the optimistic quality level encapsulated in the producer prior with evidence such as QC monitoring data, QC certificates or historic data from previous inspections.
6. A common framework for both parametric and Bayesian risks
In the ISO 2859 [4] and ISO 3951 [7] standards, the PR and CR are defined in terms of the probability of lot acceptance/rejection. PR is calculated as the probability of lot rejection at an acceptable quality level, and CR is calculated as the probability of lot acceptance at an unacceptable quality level. These calculations are based on assumptions regarding the distribution of test results (e.g. binomial distribution for the number of nonconforming items ) at a given value for the true proportion nonconforming . The value thus takes on the role of a statistical parameter, e.g. the probability parameter for a binomial distribution, where . Accordingly, the ISO PR and CR will be referred to as parametric risks.
While the parametric risks are calculated without a prior distribution, the specific consumer’s risk (SCR) and the five Bayesian producer’s risks discussed in Section 4 (SPR, GPR, CPRx, CPRy and GPrej) require a prior distribution.
The proposal is not to replace or discard the parametric risks. Rather, it is proposed to consider the two types of risk (parametric versus Bayesian) as integral components of a larger risk assessment framework. In this broader framework, the difference between the parametric and the Bayesian risks would be similar to the difference between precision and measurement uncertainty. In the case of the parametric risks (precision), the focus is the characterization of the performance of an acceptance sampling plan (method). In the case of the Bayesian risks (measurement uncertainty), the focus is the characterization of a given lot (test item/measurand) on the basis of a test result (test outcome such as the number of nonconforming items in the sample taken from the lot).
This complementary nature of the parametric versus Bayesian perspectives is best illustrated by comparing the parametric and specific risks (SPR and SCR). Indeed, as illustrated in Section 2 via contingency tables, the specific risks as defined in JCGM 106 [1] and the parametric risks can be described as “going in opposite directions.” The following table provides an overview of the specific and parametric risks. As can be seen, in the parametric risks, the starting point is the ground truth, i.e. the “actual fact” quality of the lot expressed in terms of the proportion nonconforming parameter ( or ); and the risk is simply the probability of lot acceptance or rejection at . By contrast, in the specific risks, the starting point is lot acceptance or rejection ( or ), and the probability whether the “actual fact” quality lies within the conformance region is the conditional probability given . It should also be noted that in the parametric risks, lot quality is expressed as a (constant) parameter whereas, in the specific risks, lot quality is the realization of a random variable .
Table 14.
Parametric versus the specific risks from JCGM 106. In the parametric risks, the “true” proportion nonconforming x is considered to be a parameter (there is no random variable X regarding whose distribution assumptions are made). In the specific risks, a prior distribution for X is required. As can be seen, the parametric and specific risks can be considered to “go in opposite directions.”.
| Parametric (no prior required) |
Specific is required) |
|
|---|---|---|
| PR | Probability of rejection given quality level , where is considered acceptable (=PRQ, =AQL) |
Probability of conformity given test outcome , where |
| CR | Probability of acceptance given quality level , where is considered unacceptable (=CRQ, =LQ) |
Probability of nonconformity given test outcome , where |
7. Casting a new light on ISO acceptance sampling plans
In the ISO acceptance sampling standards [4,7], there is no conformance region or . Rather, two quality levels ( values) are considered: a quality level at which the probability of acceptance should be high – denoted AQL or PRQ – and a quality level at which the probability of acceptance should be low – denoted LQ or CRQ.
Nonetheless, a connection between the acceptance sampling plans described in the ISO standards and the conformance probability approach can be established by asking the following question:
Given a prior distribution, a threshold CRBayes for the specific CR and an ISO acceptance sampling plan: what is the corresponding value?
The following table provides values for the =0 diagonal in the ISO 2859-1 table for normal inspection (Table 2-A), for the non-informative prior Beta(1,1) and CRBayes = 10%. Recall that the (parametric) CR in the ISO standards is 10%.
Table 15.
Values for for the = 0 acceptance sampling plans from ISO 2859-1 (Table 2-A: normal inspection) for a noninformative Beta(1,1) prior and for CRBayes = 10% The following notation is used: = sample size, PR = (parametric) producer’s risk, PRQ = PR quality level, AQL = acceptance quality level = PRQ, CRQ = CR quality level, LQ = limiting quality level = CRQ.
| n | ISO AQL (=PRQ) |
PR | ISO LQ (=CRQ) |
|
|---|---|---|---|---|
| 2 | 6.500% | 12.58% | 68.38% | 53.59% |
| 3 | 4.000% | 11.53% | 53.59% | 43.77% |
| 5 | 2.500% | 11.89% | 36.91% | 31.88% |
| 8 | 1.500% | 11.39% | 25.02% | 22.58% |
| 13 | 1.000% | 12.25% | 16.24% | 15.17% |
| 20 | 0.650% | 12.23% | 10.88% | 10.39% |
| 32 | 0.400% | 12.04% | 6.95% | 6.74% |
| 50 | 0.250% | 11.76% | 4.51% | 4.42% |
| 80 | 0.150% | 11.32% | 2.84% | 2.81% |
| 125 | 0.100% | 11.76% | 1.83% | 1.82% |
| 200 | 0.065% | 12.19% | 1.15% | 1.14% |
| 315 | 0.040% | 11.84% | 0.73% | 0.73% |
| 500 | 0.025% | 11.75% | 0.46% | 0.46% |
| 800 | 0.015% | 11.31% | 0.29% | 0.29% |
| 1250 | 0.010% | 11.75% | 0.19% | 0.19% |
The following should be noted:
- In these c=0 plans, the producer’s risk (PR) is consistently around 11-12%, and thus considerably greater than 5% – the intended value for PR.
- While consistently lies between AQL (PRQ) and LQ (CRQ), as the sample size increases, tends to move further away from AQL and closer to LQ.
- From sample size =13 onwards, lies very close to LQ. From size =80 onwards, the two are indistinguishable. This is undoubtedly an interesting connection between the two concepts and LQ.
This reinterpretation of the ISO plans interms of values depends on the choice of prior. For example, if the prior is a Beta(,) distribution such that and AQL, the values are lower. The following table provides values for .
Table 16.
Values for for six = 0 acceptance sampling plans from ISO 2859-1 (Table 2-A: normal inspection) for a Beta(,) prior with and AQL and for CRBayes = 10%. The following notation is used: = sample size, PR = (parametric) producer’s risk, PRQ = PR quality level, AQL = acceptance quality level = PRQ, CRQ = CR quality level, LQ = limiting quality level = CRQ.
| n | ISO AQL (=PRQ) |
PR | ISO LQ (=CRQ) |
|
|---|---|---|---|---|
| 2 | 6.500% | 12.58% | 68.38% | 11.76% |
| 3 | 4.000% | 11.53% | 53.59% | 7.95% |
| 5 | 2.500% | 11.89% | 36.91% | 5.29% |
| 8 | 1.500% | 11.39% | 25.02% | 3.29% |
| 13 | 1.000% | 12.25% | 16.24% | 2.07% |
| 20 | 0.650% | 12.23% | 10.88% | 1.19% |
As can be seen, for this choice of prior, is consistently around twice the value of AQL.
In summary: in any given case where an ISO acceptance sampling plan is implemented, and the producer or consumer have prior information which can be encapsulated in a prior distribution for the proportion nonconforming , it is possible to determine a corresponding conformity region – as specified by means of .
Another relation between the approach presented here and the ISO plans is the question of the probability of acceptance for a certain proportion nonconforming . In particular, one question of interest is the probability of acceptance for and for . These probabilities can be calculated via the conditional producer’s risk CPRxand the conditional consumer’s risk CCRx (see Section 4).
This will be illustrated with the plan =20, =0 corresponding to an AQL (PRQ) of 1% and Code letter F (lot size from 91 to 150 items) in Table 2-A in ISO 2859-1. For this plan, the parametric PR is 12.2% and LQ (CRQ) is 10.9% (for a parametric CR of 10%).
The following table provides the conditional risks for two priors and for (roughly LQ).
Table 17.
Conditional risks for the plan =20 and =0.
| Prior | CPRx | CCRx | |||
| 20 | 0 | Beta(1,9) | 10% | 51.7% | 3.8% |
| Beta(1,26) | 40.1% | 6.8% |
This example shows how much the assessment of risks depends on the type of risk.
8. Conclusions
In general, producers and consumers assess their risks independently of each other on the basis of their own prior information. While the consumer is mainly interested in the specific consumer’s risk – i.e. the probability that the proportion nonconforming of an accepted lot is greater than the lot quality criterion , the producer is mainly interested in the global producer’s risk – i.e. the probability of lot rejection even though the proportion nonconforming is less than . In the approach presented here, it is the consumer who determines the sampling plan, consisting of sample size and acceptance number . Taking the producer’s risk into account, the consumer will often find that sample size is reduced. A possible challenge is that the producer may not be willing or able to fully disclose his actual prior information to the consumer. Ideally, it would be possible to construct a “mixed” prior which represents a compromise between the two perspectives. It is important to note that the approach described in the present paper does not require such a “mixed” prior.
Comparison to the ISO standards for acceptance sampling allows different concept to mutually elucidate one another. For example, with a point distribution at AQL as producer prior, the GPR is equal to the ISO producer’s risk. Similarly, with a noninformative Beta(1,1) prior, the LQ (or CRQ) is often very close (or identical) to the limit of the conformance region . Indeed, the approach presented here allows a reinterpretation of the ISO plans. Strictly speaking, it is a misnomer to talk about ISO plans or Bayesian plans. The plan itself – consisting of sample size and acceptance number (in the case of inspection by attributes – can be arrived at either by consulting an ISO standard or applying a procedure such as the conformance probability approach described here. What differs is the perspective (in particular, the decision whether or not to incorporate prior information) and the manner in which the risks are defined and calculated. For this reason, it is essential not only to propose alternative approaches for designing acceptance sampling plans, but also to propose an overall framework within which both the parametric risks and the Bayesian risks can be subsumed and related to one another.
Annex A: Prior distributions
The beta distribution
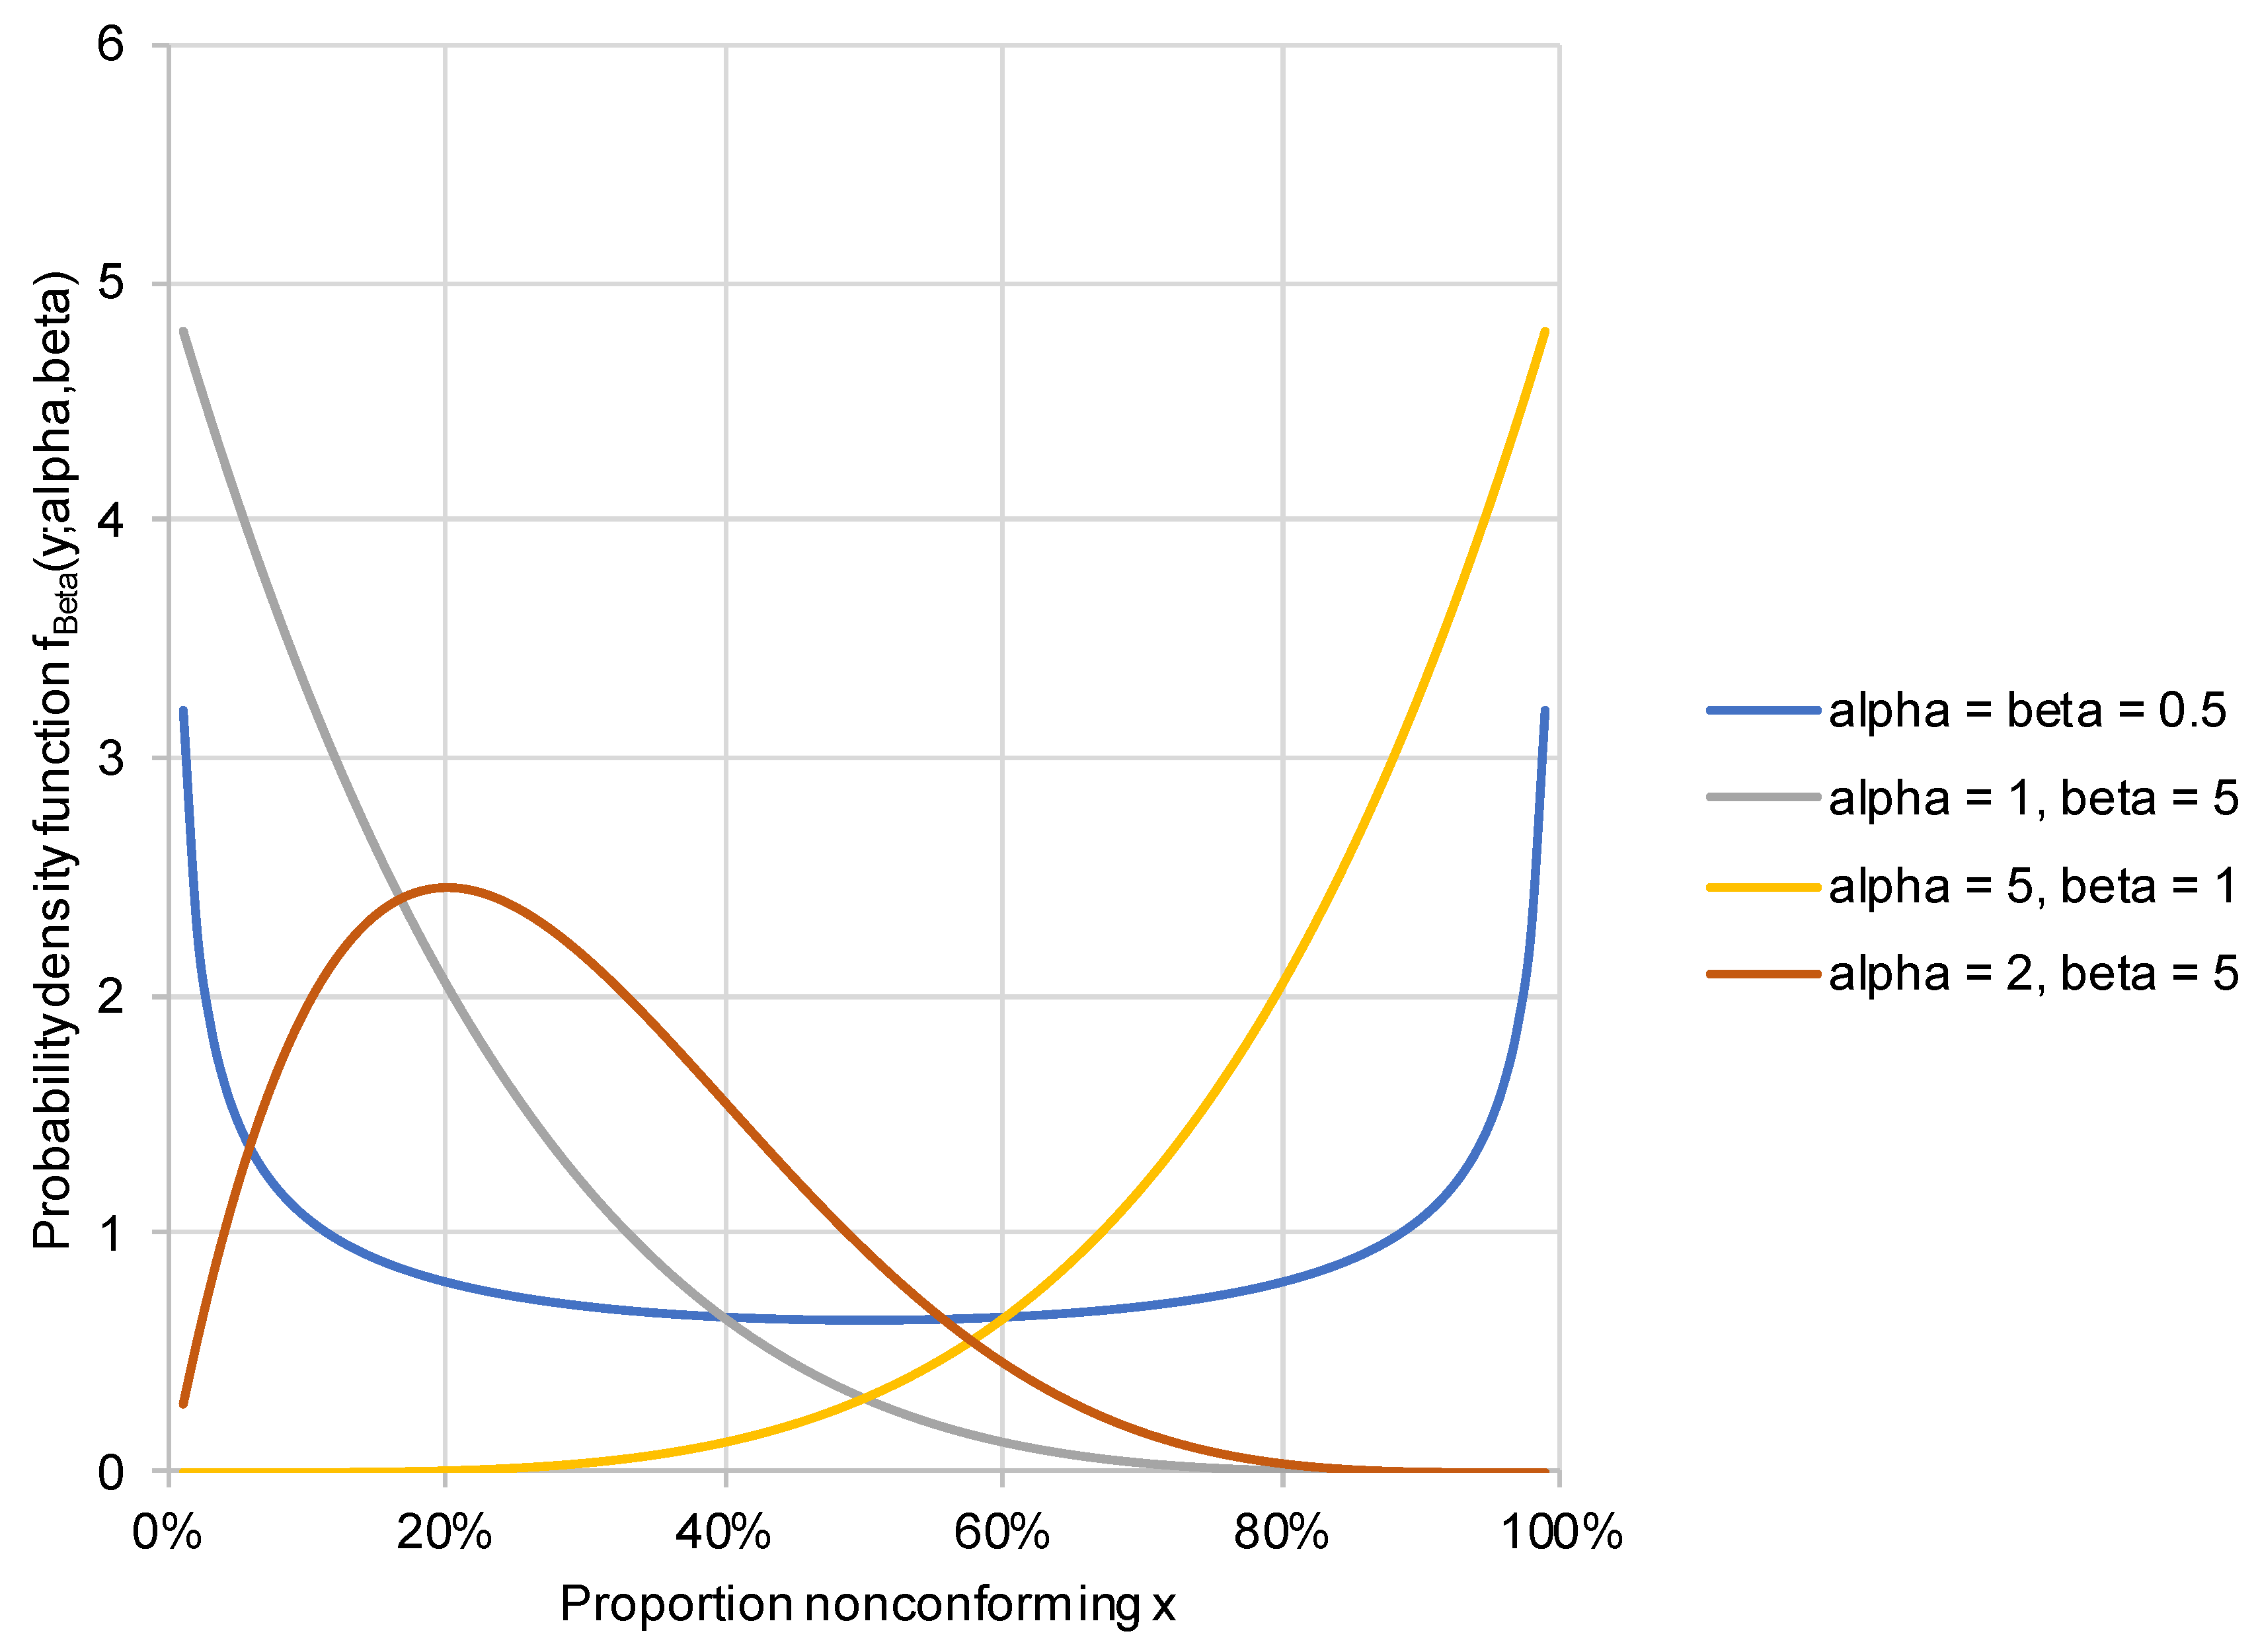
The consumer’s or producer’s prior information regarding the “true” proportion nonconforming is encapsulated in the prior distribution or . In this paper, prior information regarding will mostly be modelled via the beta distribution. The beta family of distributions is generated via two hyperparameters and . For a given choice of and , the corresponding beta distribution is denoted Beta() and the probability density function is denoted . The following diagram shows different beta distributions. As can be seen, this family of distributions is quite versatile, allowing very different curves to be mapped via the choice of and .
Figure 8.
Different beta distributions.
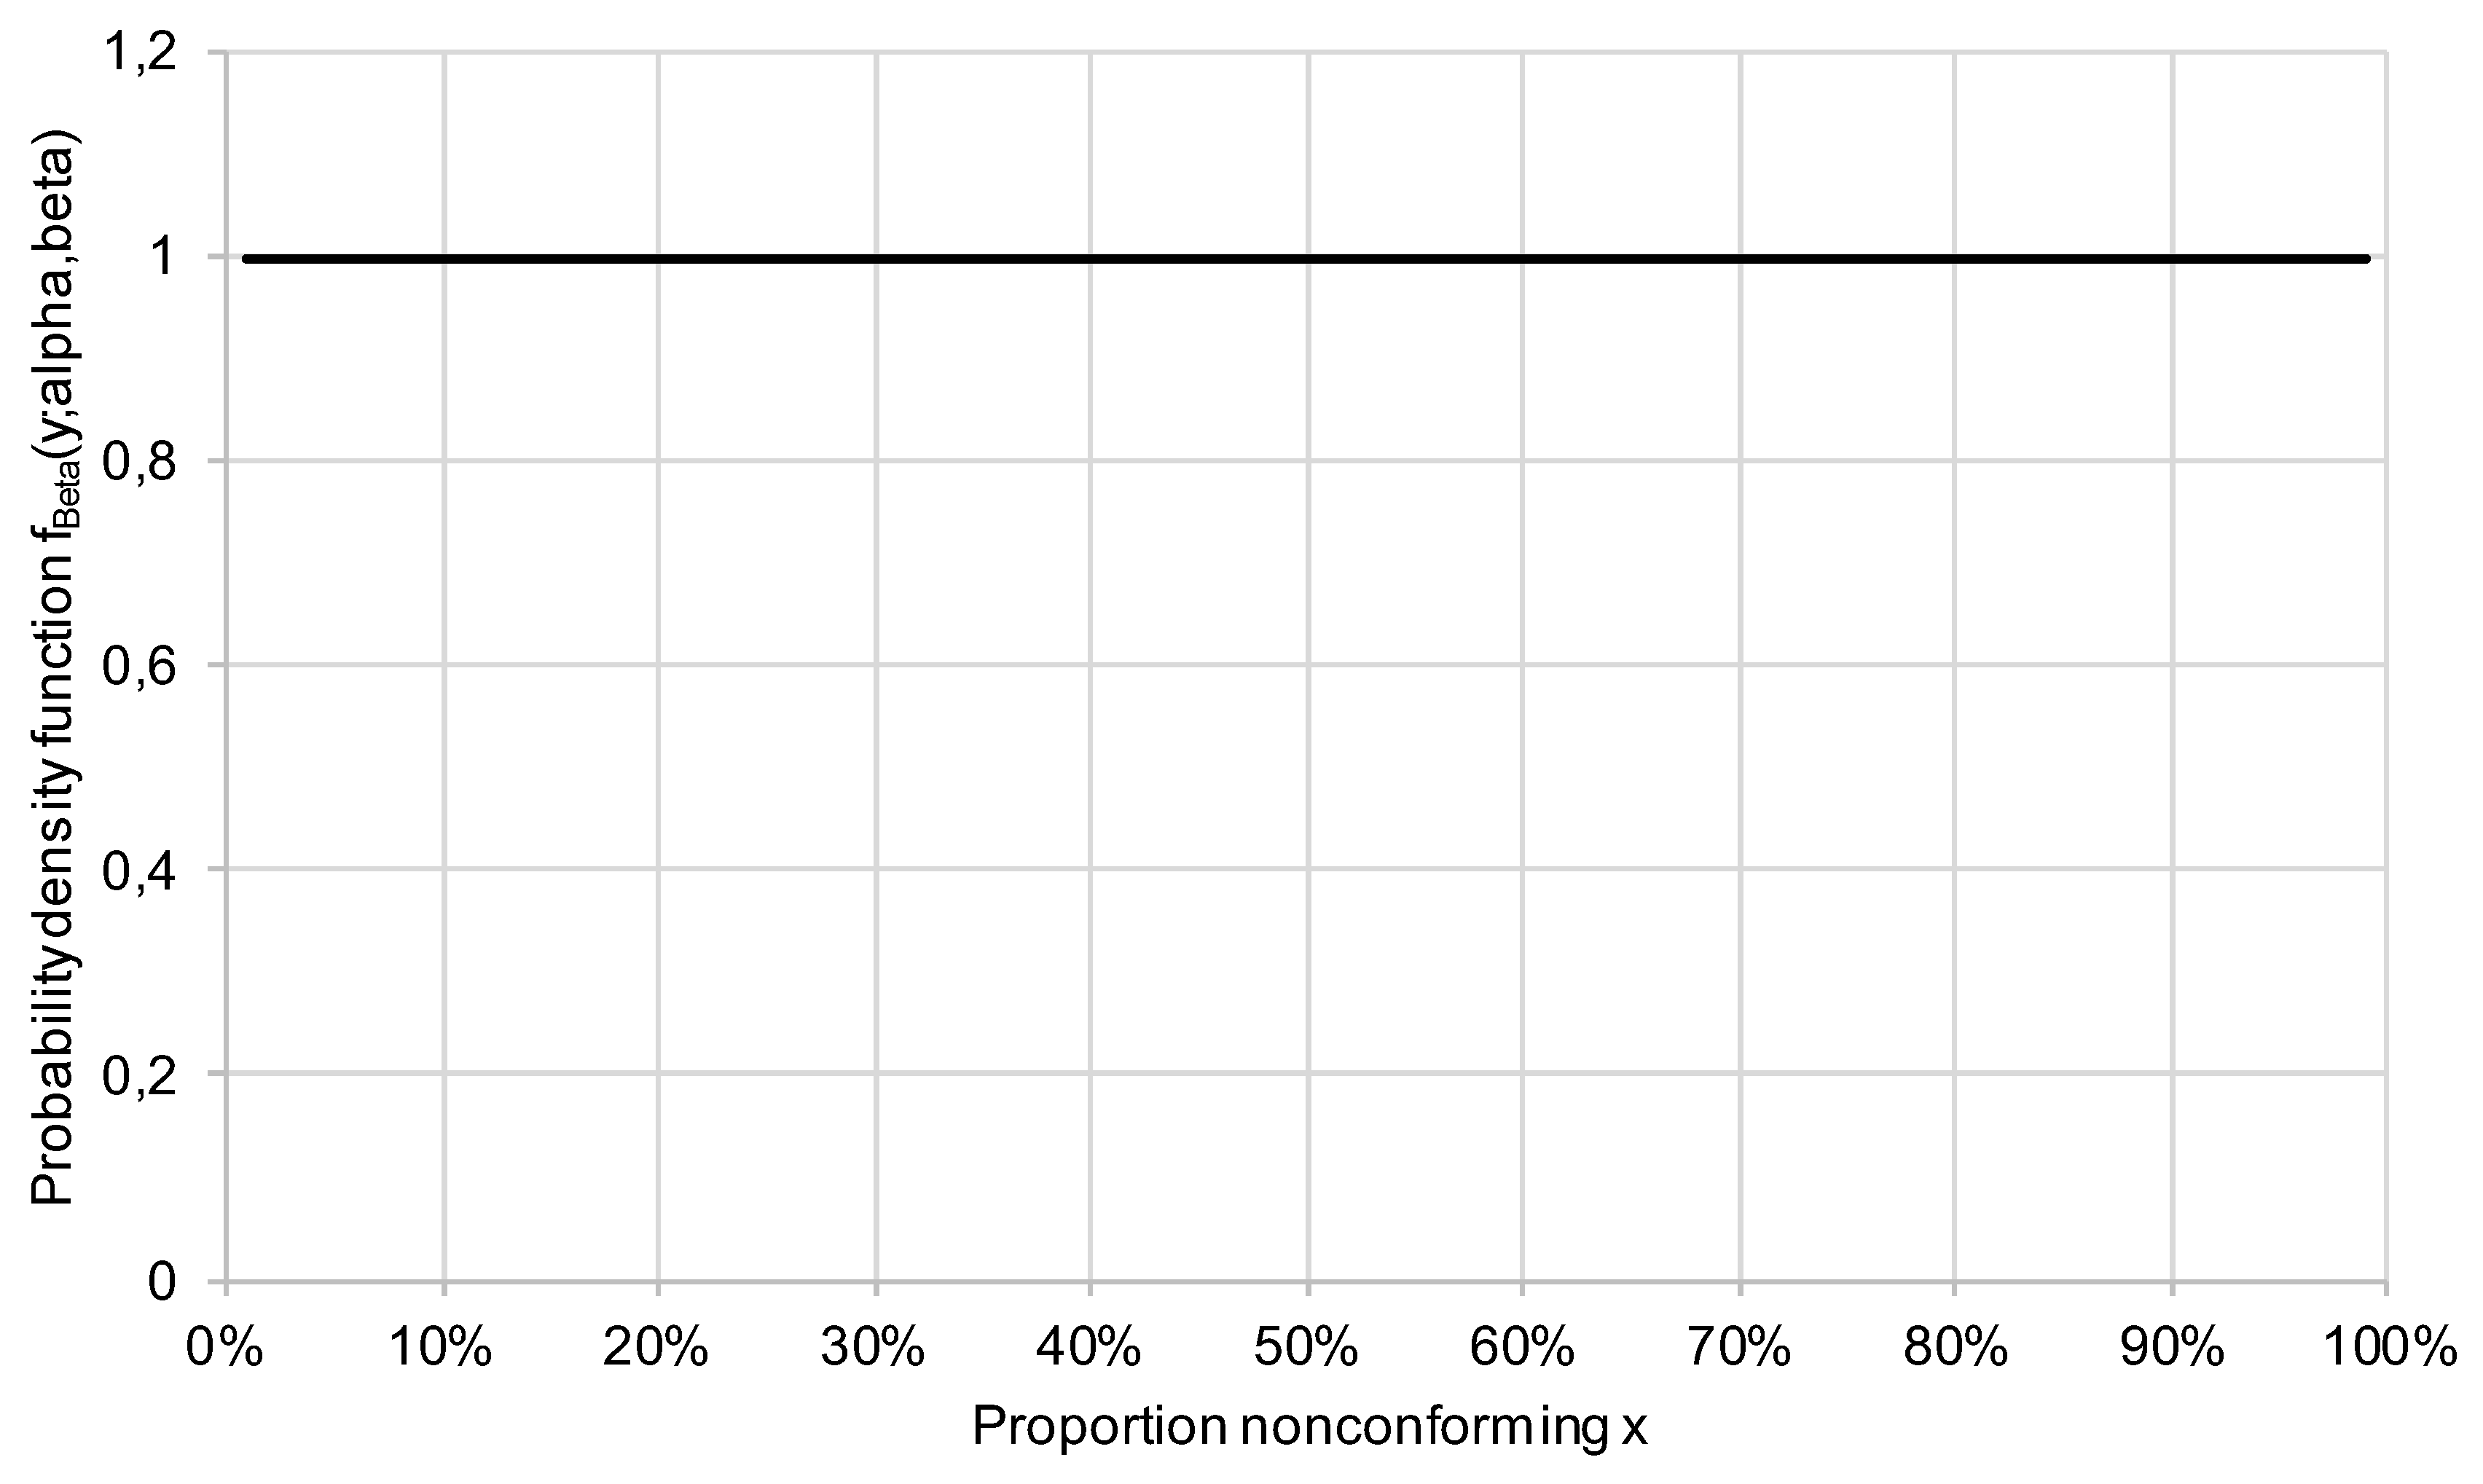
The case that the consumer has no prior information can be represented by the choice , yielding a uniform probability of occurrence for all proportion nonconforming values:
Figure 9.
Beta distribution for.
Once items from a lot have been tested, the prior distribution can be updated to obtain a posterior distribution. The posterior distribution is denoted or . If the prior is a beta distribution, the posterior is also a beta distribution and the posterior hyperparameters and are obtained from the prior hyperparameters and and from the number of nonconforming items as follows:
For example, if 8 items from a given lot have been inspected and all 8 have been found to be conforming (i.e. ), the prior is updated as follows:
The following diagrams shows the beta distribution corresponding to and .
Figure 10.
Beta distribution for and .
As can be seen, the Beta(1,9) density function falls steeply in the range to and is near 0 for all proportion nonconforming values above . This means that – on the basis of the prior Beta(1,1) and the test outcome – it is now expected that the proportion nonconforming will be no greater than 50%.
References
- Schilling E G and Neubauer D V (2008) Acceptance sampling in quality control, Second edition, CRC Press, Taylor & Francis Group, Chapman & Hall.
- MIL-STD-105E (1989) Military standard. Sampling procedure and tables for inspection by variables.
- ASTM E2234-08. Standard practice for sampling a stream of product by attributes indexed by AQL.
- ISO 2859-1:1999 Sampling procedures for inspection by attributes. Part 1: Sampling schemes indexed by acceptance quality limit (AQL) for lot-by-lot inspection.
- ANSI/ASQ Z1.4 (2003) Sampling procedures and tables for inspection by attributes (revised in 2018).
- MIL-STD-414 (1957), Military standard. Sampling procedure and tables for inspection by variables for percent defective.
- ISO 3951-1:2022 Sampling procedures for inspection by variables. Part 1: Specification for single sampling plans indexed by acceptance quality limit (AQL) for lot-by-lot inspection for a single quality characteristic and a single AQL.
- ANSI/ASQ Z1.9 (2003) Sampling procedures and tables for inspection by variables for percent nonconforming (revised in 2018).
- Dodge H F (1969a) Notes on the evolution of acceptance sampling plans, Part I. Journal of Quality Technology 1(2): 77-88. [CrossRef]
- Dodge H F (1969b) Notes on the evolution of acceptance sampling plans, Part II. Journal of Quality Technology 1(3): 155-162. [CrossRef]
- Hald A (1960) The compound hypergeometric distribution and a system of single sampling inspection plans based on prior distributions and costs. Technometrics 2, 275-339.
- Hald A (1968) Bayesian single sampling attributed plans for continuous prior distributions. Technometrics 10:4, 667-683.
- Hald A (1981) Statistical theory of sampling inspection by attributes. Academic press, Harcourt Brace Jovanovich.
- Pfanzagl (1963) Sampling procedures based on prior distributions and costs, Technometrics 5:1, 47-61. [CrossRef]
- Lindley D V, Singpurwalla N D (1991) Evidence needed to reach agreed action between adversaries. Journal of the American Statistical Association. Vol. 86, No. 416, pp. 933-937. [CrossRef]
- Lindley D V, Singpurwalla N D (1993) Adversarial life testing. J. R. Statist. Soc. Series B. Vol. 55, No. 4, pp. 837-847. [CrossRef]
- Facchinetti S, Osmetti S A, Magagnoli U (2022) Designing acceptance single sampling plans: An optimization-based approach under generalized beta distribution. wileyonlinelibrary.com/journal/asmb. Appl Stochastic Models Bus Ind. 2022;38:830–846. [CrossRef]
- Brush G (1986) A comparison of classical and Bayes producer’s risk. Technometrics, Vol. 28, No. 1.
- Chun Y H & Rinks D B (1998) Three types of producer's and consumer's risks in the single sampling plan, Journal of quality technology, 30:3, 254-268. [CrossRef]
- Göb R (1992) a-Optimal sampling plans for lot-by-lot defects inspection. Metrika, Vol. 39, No. 5, pp. 269-317.
- JCGM 106:2012 Evaluation of measurement data – The role of measurement uncertainty in conformity assessment.
- Pennecchi F and Kuselman I (2024) Probabilities of true and false decisions in conformity assessment of a finite sample of items Meas. Sci. Technol. 35 056003. [CrossRef]
| 1 | In ISO standards, the term specification limit is reserved for criteria regarding individual items. |
| 2 | The definition of a “decision rule” (for use in conformity assessment) in ISO 17025 is as follows: Rule that describes how measurement uncertainty is accounted for when stating conformity with a specified requirement. |
| 3 | Note that may be considered a more appropriate test outcome so that the “measurand” and the “measurement” represent the same type of quantity (e.g. a proportion). Mathematically, however, the use of is more convenient (via the binomial distribution). |
| 4 | This terminology is motivated in Section 6. |
Figure 4.
Conformance probability curve for n = 20, x_C = 10%, and for the consumer prior Beta(1,9).
Figure 4.
Conformance probability curve for n = 20, x_C = 10%, and for the consumer prior Beta(1,9).
Disclaimer/Publisher’s Note: The statements, opinions and data contained in all publications are solely those of the individual author(s) and contributor(s) and not of MDPI and/or the editor(s). MDPI and/or the editor(s) disclaim responsibility for any injury to people or property resulting from any ideas, methods, instructions or products referred to in the content. |
© 2024 by the authors. Licensee MDPI, Basel, Switzerland. This article is an open access article distributed under the terms and conditions of the Creative Commons Attribution (CC BY) license (http://creativecommons.org/licenses/by/4.0/).
Copyright: This open access article is published under a Creative Commons CC BY 4.0 license, which permit the free download, distribution, and reuse, provided that the author and preprint are cited in any reuse.


