
Submitted:
25 September 2024
Posted:
29 September 2024
You are already at the latest version
Abstract
After prolonged development, most domestic and international oilfields have entered a late stage of high water cut and high recovery, with a comprehensive water cut reaching up to 90%. Carbon-oxygen ratio logging can directly distinguish oil layers from water layers with low salinity, unknown salinity, or significantly varying salinity in cased wells. This makes it highly valuable for detecting oil and gas layers and locating and monitoring oil-water interfaces. It is currently one of the most effective methods for determining residual oil saturation in cased wells. This paper is based on two carbon-oxygen ratio spectrum interpretation models (the fan and ratio chart methods). It compares and analyzes these two methods and optimizes the interpretation parameters in the ratio chart model using an improved genetic algorithm. The results are effectively integrated with reservoir and conventional logging interpretation results, reducing the impact of lithology and physical properties on measurement values. This provides a theoretical foundation for improving the interpretation capability and accuracy of carbon-oxygen ratio logging, allowing for quicker and more accurate identification of water-flooded layers. This technical support aids in monitoring oil-water dynamics, determining water-flooded layers, and enhancing production potential during oilfield development.
Keywords:
carbon-oxygen ratio logging
; fan chart method
; ratio chart method
; improved genetic algorithm
1. Principle of Carbon-Oxygen Ratio Logging
The principle of carbon-oxygen ratio spectrum logging is to use 14MeV high-energy fast neutrons to irradiate the formation. When fast neutrons enter the formation, they undergo inelastic scattering reactions with the atomic nuclei of elements in the formation [1,2]. This process involves the fast neutrons losing significant energy and releasing inelastic scattering gamma rays with characteristic nuclear radiation energy. These gamma rays are generated exclusively in the presence of high-energy neutron sources and endure only briefly after the neutron source ceases emission. Therefore, measurement techniques synchronized with neutron pulses can effectively distinguish inelastic scattering gamma rays from those produced by other reactions. When neutrons bombard the formation, they induce gamma rays, the time series shown in Figure 1.
The primary objective of carbon-oxygen ratio logging is to ascertain the oil saturation within formations outside the casing in freshwater oil fields. To accurately distinguish between oil and water layers and quantitatively assess the oil saturation in the formation, carbon and oxygen are chosen as indicative elements for oil and water in the formation during carbon-oxygen ratio logging [3,4,5]. Alternatively, the formation evaluation can be conducted using inelastic scattering and capture ratios of Si/Ca (or inelastic scattering Ca/Si).
The principal nuclides in the formation that undergo inelastic scattering with fast neutrons, thereby producing gamma rays, include 12C, 16O, 28Si, and 40Ca. These nuclides release gamma rays with energies of 4.43 MeV, 6.13 MeV, 1.78 MeV, and 3.73 MeV, respectively, during the inelastic scattering process. According to the temporal distribution of these reactions, the logging instrument is equipped with pulse gates and capture gates to receive inelastic scattering gamma rays and capture gamma rays sequentially.
Using a multi-channel pulse amplitude analyzer for gamma-ray spectrum analysis [6], the intensities of both inelastic scattering gamma rays and capture gamma rays are measured. This analysis facilitates the determination of the various nuclides and their concentrations within the formation, enabling the calculation of parameters such as oil saturation [7,8]. This method provides precise data supporting oil field development, optimizing development plans, and enhancing recovery strategies.
2. Carbon-Oxygen Ratio Logging Interpretation Models
2.1. Fan Chart Interpretation Model for Carbon-Oxygen Ratio Logging
The primary goal of interpreting carbon-oxygen ratio spectrum logging data is to determine the formation’s oil saturation (or residual oil saturation). The interpretation model is based on the ratio of carbon atoms in the oil and rock matrix to the number of oxygen atoms in the water and rock matrix per unit volume of the formation, which is the carbon-to-oxygen atomic density ratio. This ratio is related to oil saturation and porosity.
In practical interpretation, empirical formulas derived from model wells are used. As shown in Figure 2, which is a crossplot of the carbon-oxygen ratio versus porosity, the blue curve represents (the water line), and the red curve represents (the oil line). Suppose all points falling between the water line and the oil line exhibit oil saturation values proportional to their distances from the water line [9,10]. In that case, the residual oil saturation can be expressed using the following equation:
where:
- is the carbon-oxygen ratio in the water layer,
- is the carbon-oxygen ratio in the oil layer, and
- is the actual measured carbon-oxygen ratio.
This equation allows for the quantification of residual oil saturation, providing essential data for the development and optimization of oil field production strategies.
Based on the crossplot, the water line and oil line can be expressed by the following relationships:
The carbon-oxygen ratio for a 100
The carbon-oxygen ratio for a 100
where COMA represents the baseline C/O value under different well conditions, and , , , are coefficients. The difference in the carbon-oxygen ratio between pure oil and pure water formations, , is expressed as:
Using a simple linear interpretation method for water saturation normalization, the water saturation calculation formula (as equation 1) is obtained and an improvement is proposed for the above interpretation model:
Please bear in mind the following information:
MDCO denotes the instrument sensitivity under various well conditions, and its value differs depending on the geological conditions.
The fan chart method is not influenced by salinity. Nonetheless, it is restricted to application only in sandstone and mudstone reservoirs with low carbon content in the rock matrix.
2.2. Ratio Chart Method for Carbon-Oxygen Ratio Logging
When evaluating residual oil saturation using carbon-oxygen ratio logging data within the framework of varying reservoir porosity and lithology, it is crucial to consider the measured values. This consideration leads to introducing the ratio chart method for carbon-oxygen ratio logging [11,12,13]. As shown in Figure 3, which represents a crossplot of and based on experimental data, all water points align along a straight line. This line intersects with the average water layer values for limestone, dolomite, and sandstone formations. Connecting point L (limestone’s average water layer value) and point S (sandstone’s average water layer value) forms line A. The average saturated water layer value for dolomite also lies close to this line, indicating that the water layer values for any mixed formation of sandstone, limestone, and dolomite fall near this line.
The data points for oil layers form multiple lines parallel to the water line. The distance of these lines from the water line increases with increasing porosity. Mathematically, the water line in equation 1 can be represented by the following linear equation:
where is the slope of the water line, and is the intercept on the C/O axis when the theoretical value of Si/Ca is zero.
The points on the oil line can be expressed as:
where is the increment in the C/O value from the water line to the oil line for a given Si/Ca value and determined porosity.
Based on relevant experimental charts (as shown in Figure 4), the relationship between and porosity can be derived. The increment in the distance from all oil points to the water line can be approximately expressed as:
The increment in the C/O value from points with varying oil saturations to the water line can be approximately expressed as:
Since the factor represents the oil volume per unit bulk volume, the distance from the water line is essentially proportional to the oil volume and largely independent of lithology. This confirms the lithological correction effect of Si/Ca, thus Equation (1) can be reformulated as:
where represents .
The aforementioned empirical formulas generally yield satisfactory application results in typical lithological formations. This approach is commonly referred to as the ratio chart interpretation technique. However, for certain unique formations, such as those with a rock matrix containing carbon but no calcium, or those with high porosity and low permeability, the application of these empirical formulas may result in overestimated oil saturation. To avoid misinterpretation, we can modify the formula as follows:
where the parameters a and b are coefficients to be determined.
The selection criterion for is as follows: within the measured interval, a pure water layer is identified, and a line with a slope of -0.8 is drawn through the midpoint of the crossplot of C/O and Si/Ca for the water layer. The intercept on the C/O axis when Si/Ca is zero is defined as .
It is crucial to account for variations in lithology and porosity when selecting these water layers, utilizing comprehensive analysis of GR, CNL, and DEN data [14,15,16,17]. In the absence of a pure water layer, data points from minimally exploited or unexploited reservoirs should be used. The intercept can be determined by drawing a line with a slope of -0.8 from the bottom of the crossplot. The value of k is defined as -0.8.
Given that the selection of these parameters directly influences the accuracy of interpretation results, this study proposes the use of a genetic algorithm to determine the parameters for the ratio chart method of carbon-oxygen ratio logging. Genetic algorithms, being adaptive global optimization techniques, exhibit flexibility in solving a variety of specific problems [18].
As the interpretation model in the ratio chart method is constructed based on theoretical charts, the coefficients 0.8, 0.6, and 1.11 are derived under ideal conditions and cannot be directly utilized in calculations. Therefore, in practical data interpretation, these parameters should be considered as unknowns. By selecting standard layers and setting the evolutionary range for each unknown parameter, an improved genetic algorithm can be applied to process the standard layers of a single well, ultimately determining the oil saturation interpretation model parameters for that well. Application results demonstrate that this method closely aligns with the heterogeneity of the measurement environment, effectively compensating for interpretation errors caused by inter-well and inter-layer differences, thus making the interpretation results more consistent with actual production dynamics. This method is suitable for carbon-oxygen ratio logging of residual oil saturation in different blocks, showcasing strong applicability.
2.3. Application of Improved Genetic Algorithm in Carbon-Oxygen Ratio Logging Interpretation
Traditional genetic algorithms are prone to local optima, leading to premature convergence. Building on previous research, this study enhances the genetic algorithm to effectively overcome the issue of premature convergence and local optima. The inherent parallelism of genetic algorithms is significant for finding the optimal solution of parameters within the model, making it highly relevant for this application.
The design of the improved genetic algorithm in this study follows these principles:
- Diversity Maintenance in Early Stages: During the initial stages, when population diversity is high, reduce the selection probability gap between high and low-fitness individuals and moderately increase the crossover probability. As the algorithm converges, the selection probability gap between high and low fitness individuals increases and the crossover probability decreases moderately. This approach enhances the search capability of the algorithm in the early stages, preventing premature convergence, and preserves superior genes as the algorithm converges.
- Adaptive Crossover and Mutation Probabilities: Individuals with lower fitness are assigned higher probabilities for crossover and mutation, and vice versa. This adaptive approach balances exploration and exploitation, maintaining genetic diversity and preventing premature convergence.
2.3.1. Selection Probability Setting
The probability P of an individual being selected is related to its fitness function F as follows:
where F represents the fitness of the individual.
If the normalized selection probability is denoted as and the normalized fitness as , with F ranging from 1 to ∞, then . At the beginning of the algorithm, using as the selection probability increases the likelihood of selecting individuals with lower fitness, preventing the algorithm from converging too quickly to local optima. Let represent the average fitness of the population in a given generation. When , the selection probability is ; when , the selection probability is f. Here, A is a variable parameter determined based on the expected fitness value.
2.3.2. Crossover Probability Setting
When :
When :
Here, is the crossover probability for individuals with fitness equal to , ranging from to 0.5. is the crossover probability for the fittest individuals, ranging from 0 to . and represent the maximum and minimum fitness values in the population, respectively. When , and are larger; when , and are smaller.
2.3.3. Mutation Probability Setting
When :
When :
Here, is the mutation probability for individuals with fitness equal to , ranging from to 0.1. is the mutation probability for the fittest individuals, ranging from 0.0001 to .
2.3.4. Algorithm Application Process
The following omits the basic steps of selection, crossover, and mutation operations of the genetic algorithm.
Step 1: Set Population Size. If the logging interpretation model has unknown parameters, perform binary encoding according to the evolution range and required precision of each parameter.
Step 2: Decoding. If the number of sample points involved in the computation is n, substitute individual j into the model of the parameters to be determined, and calculate the error between the true value and the computed value:
where is the value calculated by the genetic algorithm and is the true value. Let .
To convert the objective function of minimizing the error into maximizing the fitness function, set a large number, such as 10, as the fitness:
Step 3: Select the Individual with the Maximum Fitness. Compare the individual with the maximum fitness in this generation with the current stored optimal individual, and store the individual with the higher fitness as the new optimal individual.
Step 4: Determine Whether the Algorithm Meets the Stopping Criteria. If the criteria are met, stop the iteration; otherwise, generate the next generation and return to Step 2.
2.3.5. Setting the Algorithm Stopping Criteria
Considering the needs of logging interpretation and ensuring the smooth convergence of the algorithm, the stopping criteria are set as follows: if the individual with the maximum fitness shows no evolution for 10 consecutive generations and satisfies and , stop the iteration.
2.4. Improved Genetic Algorithm Performance
In selecting standard layers, sample points such as A, B, C, and D can be chosen, where the logging curves exhibit no anomalies and the completion interpretation accuracy is high. These sample points correspond to porosity, carbon-oxygen ratio, silicon-calcium ratio, and oil saturation in open-hole well interpretations. The interpretation process is conducted based on the aforementioned workflow, with the objective function given by Equation 11. The unknown parameters a, b, k, and are determined through iterative optimization to fit the interpretation model for the specific well and oil group.
Using the logging data from standard wells in the oilfield, parameter ranges for the carbon-oxygen ratio logging ratio chart interpretation model are analyzed. The parameter ranges are set as follows: a ranges from 0.6 to 0.85, b ranges from 0.7 to 1.11, k ranges from 0.6 to 0.88, and ranges from 2.36 to 2.78. The population size is set to 30, and binary encoding is applied based on the given parameter ranges. To verify the superiority of the improved genetic algorithm, both the standard genetic algorithm and the improved genetic algorithm are applied to the selected standard layer data.
As shown in Figure 5, the standard genetic algorithm is used to determine the oil group saturation model parameters for the standard layer, while Figure 6 illustrates the process using the improved genetic algorithm. The results clearly demonstrate that the traditional genetic algorithm tends to converge to local optima, whereas the improved genetic algorithm converges more quickly and stably.

Table 1.
Comparison of Improved and Standard Genetic Algorithms.
| Method | a | b | k | Optimal Generation | Computation Time (s) | |
|---|---|---|---|---|---|---|
| Improved | 0.6446 | 1.0712 | 0.6823 | 2.5061 | 32 | 17.053 |
| Standard | 0.6434 | 1.0512 | 0.6093 | 2.5925 | 67 | 32.672 |
* This table compares the parameters and performance of improved and standard genetic algorithms.
2.5. Validation of Improved Genetic Algorithm Results
To verify the accuracy of the parameter estimation for the carbon-oxygen ratio logging saturation interpretation model, the acquired parameters were meticulously utilized to conduct a back-evaluation on the initial samples. Figure 7 presents a comparison between the back-evaluation results and the original analysis findings. The correlation coefficient between the two datasets is 0.9024, with a standard deviation of 0.35.
The genetic algorithm was used to calculate parameters and predict the same interval in adjacent wells of the standard well that were not perforated and had core analysis data. Figure 8 illustrates the comparison between the calculated results and the core analysis water saturation. The figure demonstrates that the oil saturation predicted by the enhanced genetic algorithm closely aligns with the water saturation obtained from core analysis. This study highlights the effectiveness of applying the improved genetic algorithm to solve the constant parameters in the carbon-oxygen ratio logging residual oil saturation response equation, resulting in satisfactory outcomes.
3. Practical OilField Study
A comprehensive statistical analysis was conducted on the carbon-oxygen ratio logging data collected from the M-1 and M-2 oilfields: 17 wells and 50 well-logging operations were performed. The primary production layers in the M-1 oil field are A1-3, A1-4U, A1-4M, A2-1U, and A2-2U. Among these, A1-3 has the most minor oil production, with only one well in operation. From a development perspective, the A2-1U oil formation possesses the largest geological reserves and the highest cumulative oil production. The A1-4M, A2-1U, and A2-2U formations exhibit high recovery rates and significant water cuts. This study primarily analyzes the production dynamics of the A1-4U, A1-4M, A2-1U, and A2-2U formations in the M-1 oil field. Table 2 presents the parameter ranges set for evaluating the carbon-oxygen ratio logging interpretation model using the improved genetic algorithm in the M-1 oil field.
The M-2 oilfield comprises multiple production intervals, including sub-layers A1-1L, A1-2, A1-3U, A1-6, A1-7, A2-1U, and A2-1L. Among these, the A2-1U sub-layer boasts the largest geological reserves and the highest cumulative oil production, making it the primary production interval in the Wenchang 13-2 oil field. This sub-layer also exhibits the highest recovery factor and water cut. Conversely, the A1-2 sub-layer has the smallest geological reserves and the lowest recovery factor. This study focuses on analyzing the production dynamics of five sub-layers in the M-2 oil field: A1-1L, A1-6, A1-7, A2-1U, and A2-1L. Table 3 presents the parameter ranges for evaluating the carbon-oxygen ratio logging interpretation model using the improved genetic algorithm for the M-2 oil field.
To determine the operating parameters such as population size, termination generation, crossover probability, and mutation probability, standard layer data from the M-1 and M-2 oil fields were utilized. Multiple trials were conducted by varying the crossover and mutation probabilities, revealing that these parameters significantly impact the convergence speed and optimal values. The final operating parameters for the M oil fields were determined as follows: a population size of 30, termination generation of 100, crossover probability of 0.9, and mutation probability of 0.005.
With these parameters set, an analysis was conducted on the selected samples. The average generation to obtain the best chromosome and the computation time for each oil group in the M-1 and M-2 oil fields were statistically analyzed using standard and improved genetic algorithms. Comparatively, the improved genetic algorithm demonstrated faster and more stable convergence.
An in-depth analysis was conducted on Well 2 in the M-1 oil field, utilizing methods for interpreting carbon-oxygen ratio logging. Well 2 was spudded on January 12, 2001, and reached a total depth of 1768 meters (MD) on January 30, 2011, with a final vertical depth of 1585.7 meters and a measured depth of 1738 meters. Production in the Tertiary formation commenced on July 7, 2012, with the well completed using a central tubing and a "Y" type production tubing string.
Production profile logging conducted in September 2017 and August 2018 revealed that the A2-1U oil group was the primary producing and water-producing layer. Since September 2018, liquid production rates have been steadily declining. RPM logging in May 2019 and November 2022 measured the A1-4 oil group.
The carbon-oxygen ratio logging interpretation results for the 1290-1320 meter interval in Well 2 of the M-1 oil field in 2019 are presented in Figure 9. The three carbon-oxygen ratio logging curves within this interval demonstrated good repeatability, indicating acceptable curve quality. This interval has been perforated for production.
Variations in carbon-oxygen ratio values, caused by changes in fluid properties within the oil casing annulus, necessitate corrections to the original logging curves to account for influencing factors. The corrected curve is denoted as "CO corrected" in the figure. "SWCO untreated" indicates the water saturation calculated using the original carbon-oxygen ratio curve, while "SWCO treated" represents the water saturation calculated using the corrected carbon-oxygen ratio logging curve.
Between 1290 and 1309 meters, the oil saturation derived from the uncorrected carbon-oxygen ratio is significantly overestimated, showing a considerable discrepancy with the water saturation (Sw) obtained from the completion interpretation. Since this interval has not been perforated for production, the initial interpretation does not reflect the actual conditions. After applying the correction, the calculated water saturation aligns well with the completion interpretation results.
It is important to note that water saturation near the bottom of the figure increases close to the perforated interval at 1320.5-1324.2 meters. Therefore, applying environmental corrections to the carbon-oxygen ratio logging data prior to interpretation is essential for obtaining accurate results.
Between 1340 meters and 1370 meters, the perforated interval is from 1348.5 meters to 1359.3 meters. The interpretation results and comparison charts are shown in Figure 10 and Table 5, respectively. In the figure, SAVGCO_2019 and SAVGSC_2019 represent the preprocessed carbon-oxygen ratio logging curves for 2019, while SAVGCO_2022 and SAVGSC_2022 represent the preprocessed carbon-oxygen ratio logging curves for 2022. The analyzed results include CCO_2019 and CCO_2022, which are the environmentally corrected carbon-oxygen ratio curves. COW_2019, COW_2022, COO_2019, and COO_2022 are the waterline and oil line curves obtained by applying the crossplot method to the 2019 and 2022 carbon-oxygen ratio logging data. SWCO_S2019 and SWCO_S2022 denote the water saturation calculated using the crossplot method, while SWCO_B2019 and SWCO_B2022 denote the water saturation calculated using the ratio chart method.
3.1. A1-4U Oil Group
For the A1-4U oil group, calculations were performed using the 1330.0-1332.0m mudstone section as the standard layer. As shown in Figure 6-1, the C/O values are relatively higher at the top of the measurement section and lower at the bottom, indicating a higher water saturation at the bottom of the perforated section. The calculated water saturation for the A1-4U oil group in the 1331.5-1334.5m interval in 2022 is approximately 58%. Importantly, this figure remains consistent with the results from 2019, demonstrating the stability of the water saturation in this oil group over time.
3.2. A1-4M Oil Group
In the A1-4M oil group, a significant increase in water saturation for the 1355.1-1362.0m interval in 2022 compared to the open-hole water saturation indicates it is a water-bearing layer. The C/O values, as shown in Figure 6-1, are higher at the top of the measurement section, indicating some residual oil in the reservoir section, and lower at the bottom, reflecting a higher water saturation at the bottom of the perforated section. The calculated water saturation for the A1-4M oil group in the 1350.2-1352.6m interval in 2022 is approximately 67.5%. The current water saturations for the 1352.6-1354.4m and 1355.1-1359.0m intervals are 65.8% and 77.5%, respectively, showing an increase compared to 2019.
Three production profile logging runs have been conducted for this well. Figure 11 shows the interpretation results of the 2019 production profile logging. The turbine speed curves are highly repeatable, and the point measurement data are consistent with the continuous turbine speed trends. The fluid temperature, fluid density, and fluid capacitance curves clearly reflect changes in fluid production and properties. By cross-plotting the turbine speed and cable speed, the fluid flow rate in the wellbore was determined. The production rates and phase fractions for each oil group were calculated by analyzing changes in fluid density, fluid capacitance, and reservoir PVT parameters. The fluid pressure in the measured interval (7.31 MPa - 7.84 MPa) is higher than the oil saturation pressure (1.5 MPa - 5.5 MPa), indicating an oil-water two-phase flow downhole. The turbine speed curve morphology indicates that the 1332.1-1334.6m interval is the main production layer, providing crucial information for further analysis. Table 6 compares the interpretation results of production profile logging over the years. The layer-wise production data from surface measurements reveal a water cut of 58.1% for this layer.
By analyzing the relative permeability data, the relationship between the relative permeability and water saturation for the M-1 oil field was determined, as shown in Figure 12. The relationships are described by the following equations:
The relative permeability of oil :
The relative permeability of water :
By incorporating the oil-water viscosity ratio from the relative permeability data, the water cut of the production layer can be calculated as follows:
where is the viscosity of water and is the viscosity of oil.
Calculations indicate that the main production layer of this well had a water cut of 60.72% in 2019. This finding demonstrates a high correlation between the carbon-oxygen ratio logging interpretation and actual production conditions. Additionally, the water saturation of the unperforated layers aligns with the open-hole water saturation trends.
Furthermore, for the interval between 1341.2 meters and 1344.9 meters, perforation testing was conducted in December 2013. The oil pressure was 0.42 MPa, casing pressure was 1.21 MPa, and oil production was 43.05 m3. The oil density was 0.8458 at 20°C and 0.8278 at 50°C, with an oil content of 41.1%. The test results confirmed that this interval is an oil layer, which is consistent with the carbon-oxygen ratio logging interpretation.
4. Conclusion
1. The study demonstrates that, in solving the residual oil saturation parameters using the carbon-oxygen ratio logging ratio chart method, the improved genetic algorithm is more efficient and user-friendly compared to the basic genetic algorithm. It enhances algorithm efficiency and exhibits strong applicability, allowing for the simultaneous optimization of multiple parameters. This method provides an effective solution for parameter matching problems, resulting in more targeted interpretation parameters and better application outcomes.
2. Due to the inherent randomness in the improved genetic algorithm, such as the selection of parent individuals and the processes of gene crossover and mutation, the evolutionary paths can vary even though the overall fitness is improved. This can lead to different results in repeated trials, but the differences are generally minor, so multiple trials are often unnecessary in practical applications. The selection of crossover and mutation rates is crucial. A higher crossover rate can explore a larger solution space, reducing the likelihood of getting stuck in suboptimal solutions. However, if the crossover rate is too high, it may waste computational time on unnecessary solution spaces. The mutation rate controls the introduction of new genes into the population. A low mutation rate may prevent useful genes from being selected, while a high mutation rate may cause excessive random changes, leading to the loss of beneficial traits inherited from parents. Therefore, determining the optimal values for these rates requires multiple trials.
3. The accurate selection of parameters for the carbon-oxygen ratio logging residual oil saturation interpretation model is highly regional and experience-based, necessitating the integration of other data for combined analysis to achieve optimal results. Both interpretation methods have shown good application effects for the geological characteristics of the study area. Comparative analysis using core data, well testing data, and production profile data indicates that the interpretation results for unexploited layers are consistent with core data analysis and well testing results. The dynamic monitoring of the reservoir aligns with the production profile logging interpretation conclusions. However, comparing the advantages and disadvantages of the two methods reveals that the ratio chart method is more universal and suitable for wider application than the fan chart method.
Author Contributions
Conceptualization, Wei Zhou and Yaoting Lin; methodology, Wei Zhou; software, Yaoting Lin and Peng Wang; validation, Yaoting Lin, Wei Zhou and Gang Gao; formal analysis, Wei Zhou; investigation, Wei Zhou and Yaoting Lin; resources, Wei Zhou and Yaoting Lin; data curation, Wei Zhou and Yaoting Lin; writing—original draft preparation, Wei Zhou and Yaoting Lin; writing—review and editing, Wei Zhou and Yaoting Lin; visualization, Wei Zhou and Yaoting Lin. All authors have read and agreed to the published version of the manuscript.
Acknowledgments
This work was supported by program for scientific research star-up funds of Guangdong Ocean University (360302042301 & 360302042302).
Conflicts of Interest
The authors declare no conflict of interest.
Data Availability Statement
Data will be made available on request.
References
- Xing, G.; Zhang, Q.; Tian, L.; Liu, G.; Wu, N.; Xie, T. A carbon/oxygen calculation method to improve the response sensitivity of Carbon/Oxygen logging. Applied Radiation and Isotopes 2024, p. 111499.
- Elias, M.; Al-Quoud, K.; Sergeev, E.; Raffi, M.; Ikande, P.; Tagarieva, L. The First Horizontal Carbon Oxygen Logging with an Advanced Processing Approach to Precisely Estimate Up-Dip Oil Saturation Across a Mixed Water Salinity Reservoir, Case Study, Kuwait. In Proceedings of the International Petroleum Technology Conference. IPTC, 2024, p. D021S055R003.
- Yusuf, N.; Cavalleri, C.; Tolioe, W.; How, L.; Daud, S.; Johare, D.; Hendrawati, M.; Halim, A. Optimization of Pulsed Neutron Logging for Real-Time Water Management Through Oxygen Activation and Water Flow Logs. In Proceedings of the International Petroleum Technology Conference. IPTC, 2024, p. D031S118R003.
- Gan, L.; Dang, L.; Wang, D.; Wang, Y.; Chen, G.; Liu, Q.; Deng, R. Research on the processing and interpretation methods of distributed fiber optic vibration signal logging injection profiles. Geoenergy Science and Engineering 2024, 239, 212980. [CrossRef]
- Zhao, R.; Chen, S.; He, Z. Logging evaluation of total organic carbon and analysis of influencing factors in source rock of Zhu III sub-basin, Pearl river mouth basin, China. Petroleum Science and Technology 2024, 42, 122–145. [CrossRef]
- Herlinger Jr, R.; Bonzanini, L.A.F.; Vidal, A.C. Residual oil saturation in Pre-salt Brazilian carbonates: A multi-approach core-to-log case study. Journal of South American Earth Sciences 2024, 140, 104905. [CrossRef]
- Ma, S.M.; Guergueb, N.; Guo, W.; Eid, M. Intrinsic Carbon-Oxygen Logging for Enhanced Consistency of Reservoir Saturation Monitoring. In Proceedings of the SPWLA Annual Logging Symposium. SPWLA, 2021, p. D011S007R003.
- Zhang, F.; Fan, J.; Qiu, F.; Xie, B.; Li, X.; Zhang, H. An enhanced accuracy method to determine oil saturation by carbon/oxygen logging in tight reservoirs. Geophysics 2022, 87, D21–D31. [CrossRef]
- Liu, J.; Zhang, F.; Zhang, Q.; Hou, G.; Zhang, H.; Ding, F. A method of improving sensitivity of carbon/oxygen well logging for low porosity formation. Journal of China University of Petroleum 2016, 40.
- Zhang, F.; Zhang, Q.; Liu, J.; Han, Z.; Chen, Q. Monitoring Remaining Oil Saturation Using Carbon/Oxygen Logging Technique in CO2 Injection Reservoirs. In Proceedings of the 78th EAGE Conference and Exhibition 2016. European Association of Geoscientists & Engineers, 2016, Vol. 2016, pp. 1–5.
- Eltaher, Y.; Ma, S. In-Situ Oil Carbon Density Characterization for Enhanced Reservoir Saturation Monitoring Using Carbon-Oxygen Logs. In Proceedings of the International Petroleum Technology Conference. IPTC, 2022, p. D031S086R002.
- Akagbosu, P.; Kim, Y.; Nardiello, N.; Chace, D.; McGlynn, I.; Lawal, O.; Akomeno, K.; Toumelin, E.; Atuanya, C. Carbon/Oxygen Logging Speed Optimization in the Niger Delta Fields With Improved Pulsed Neutron Technology. In Proceedings of the SPE Nigeria Annual International Conference and Exhibition. SPE, 2023, p. D021S003R004.
- Gilchrist Jr, W.; Rogers, L.; Watson, J. Carbon/Oxygen Interpretation-A Theoretical Model. In Proceedings of the SPWLA Annual Logging Symposium. SPWLA, 1983, pp. SPWLA–1983.
- Sinha, R.K.; Kumar, R.; Pandey, A. Integration of Mineral Model with Carbon-Oxygen Log Interpretation to Reduce Uncertainty in Hydrocarbon Saturation. In Proceedings of the SPE Nigeria Annual International Conference and Exhibition. SPE, 2011, pp. SPE–150778.
- Wang, H.; Sullivan, M.; Se, Y.; Barnes, D.; Wilson, M.; Lazorek, M. Impact of cement quality on carbon/oxygen and elemental analysis from cased-hole pulsed-neutron logging and potential improvement using azimuthal cement bond logs. In Proceedings of the SPWLA Annual Logging Symposium. SPWLA, 2019, p. D033S002R002.
- Yang, G.; Dai, J.; Liu, X.; Wu, X.; Chen, M.; Qin, H. Denoising of gamma-ray spectrum by optimized wavelet thresholding based on modified genetic algorithm in carbon/oxygen logging. Journal of Radioanalytical and Nuclear Chemistry 2019, 320, 351–359. [CrossRef]
- Eltaher, Y.; Ma, S. Carbon/Oxygen Spectral Data Processing, its Affiliation to Scintillation Detector Selectivity & their Impact on Reservoir Saturation Monitoring, Lessons Learnt and Recommended Workflow. In Proceedings of the SPE Reservoir Characterisation and Simulation Conference and Exhibition? SPE, 2023, p. D021S009R001.
- Bassiouni, Z. Well logging; Cambridge University Press, 2019.
- Zhang, F.; Zhang, Q.; Tian, L.; Zhang, X.; Chen, Q.; Fan, J. Monitoring CO2 Saturation Using Three-Detector PNC Logging Technique for CO2 EOR in Heavy Oil Reservoir. In Proceedings of the SPWLA Annual Logging Symposium. SPWLA, 2019, p. D053S016R009.
- Sudac, D.; Valkovic, V.; Batur, J.; Meric, I.; Pettersen, H.; Nad, K.; Obhodas, J. C/O Logging by Using the Associated Alpha Particle Method: Proof of Principle. IEEE transactions on nuclear science 2021, 69, 738–744. [CrossRef]
- Abdel Aziz, A.S.; El Wazeer, F.; Odom, R.; Malalur, S. Novel Approach to Estimate Water Saturation Behind Casing Using Carbon Oxygen Data: Challenges and a Case Study in Abu-Dhabi Onshore Reservoirs. In Proceedings of the Abu Dhabi International Petroleum Exhibition and Conference. SPE, 2020, p. D012S116R057.
- Jiang, Q.; Li, P. Numerical Simulation of Carbon Oxygen Ratio Logging Response in Natural Gas Hydrate Reservoirs. International Journal of Energy 2023, 2, 13–16. [CrossRef]
- Kim, Y.; Akang, N. Crucial Factors for in-Situ CO2 Monitoring in CO2-EOR Projects Using Pulsed Neutron Well Logging. In Proceedings of the SPE Gas & Oil Technology Showcase and Conference. SPE, 2024, p. D031S044R003.
- How, L.; Cavalleri, C.; Yusuf, N.; Tolioe, W.; Daud, S.; Johare, D.; Hendrawati, M. Hydrocarbon Saturation Evaluation Behind Gravel Packing and Complex Completion Through Advanced Pulsed Neutron Logging. In Proceedings of the International Petroleum Technology Conference. IPTC, 2024, p. D021S078R001.
- Loo, S.; Willick, J.; Pemper, R.; Mekic, N.; Khalid, K.B.; Johare, D.; Goh, A.; Huong, C. How the Memory Multidetector Pulse Neutron Logging Helped to Achieve a High-Quality Results While Reducing the Costs–Case Studies in Malaysia. In Proceedings of the International Petroleum Technology Conference. IPTC, 2024, p. D021S063R005.
- Smith, R.L.; Repert, D.A.; Underwood, J.C.; Böhlke, J.; LeBlanc, D.R.; Hull, R.B.; Kent, D.B.; Reed, A.P.; Mroczkowski, S.J. Spatial, seasonal, and diel controls of nitrogen-carbon-oxygen cycling during lake-water infiltration to an aquifer. Journal of Geophysical Research: Biogeosciences 2024, 129, e2023JG007659. [CrossRef]
Figure 1.
The time mechanism of gamma-rays induced by Neutron bombardment
Figure 2.
Fan version method of Carbonate/Oxygen ratio logging interpretation
Figure 3.
The relationship of and . (a) The test well data with a -inch casing filled with freshwater. (b) The relationship between the oil-water envelope size and porosity.
Figure 3.
The relationship of and . (a) The test well data with a -inch casing filled with freshwater. (b) The relationship between the oil-water envelope size and porosity.
Figure 4.
The changes of C/O value from the waterline to the oil line at different porosities. (a) The test well data with inch casing (the casing is filled with fresh water).
Figure 4.
The changes of C/O value from the waterline to the oil line at different porosities. (a) The test well data with inch casing (the casing is filled with fresh water).
Figure 5.
The iterative process with standard Genetic Algorithm method
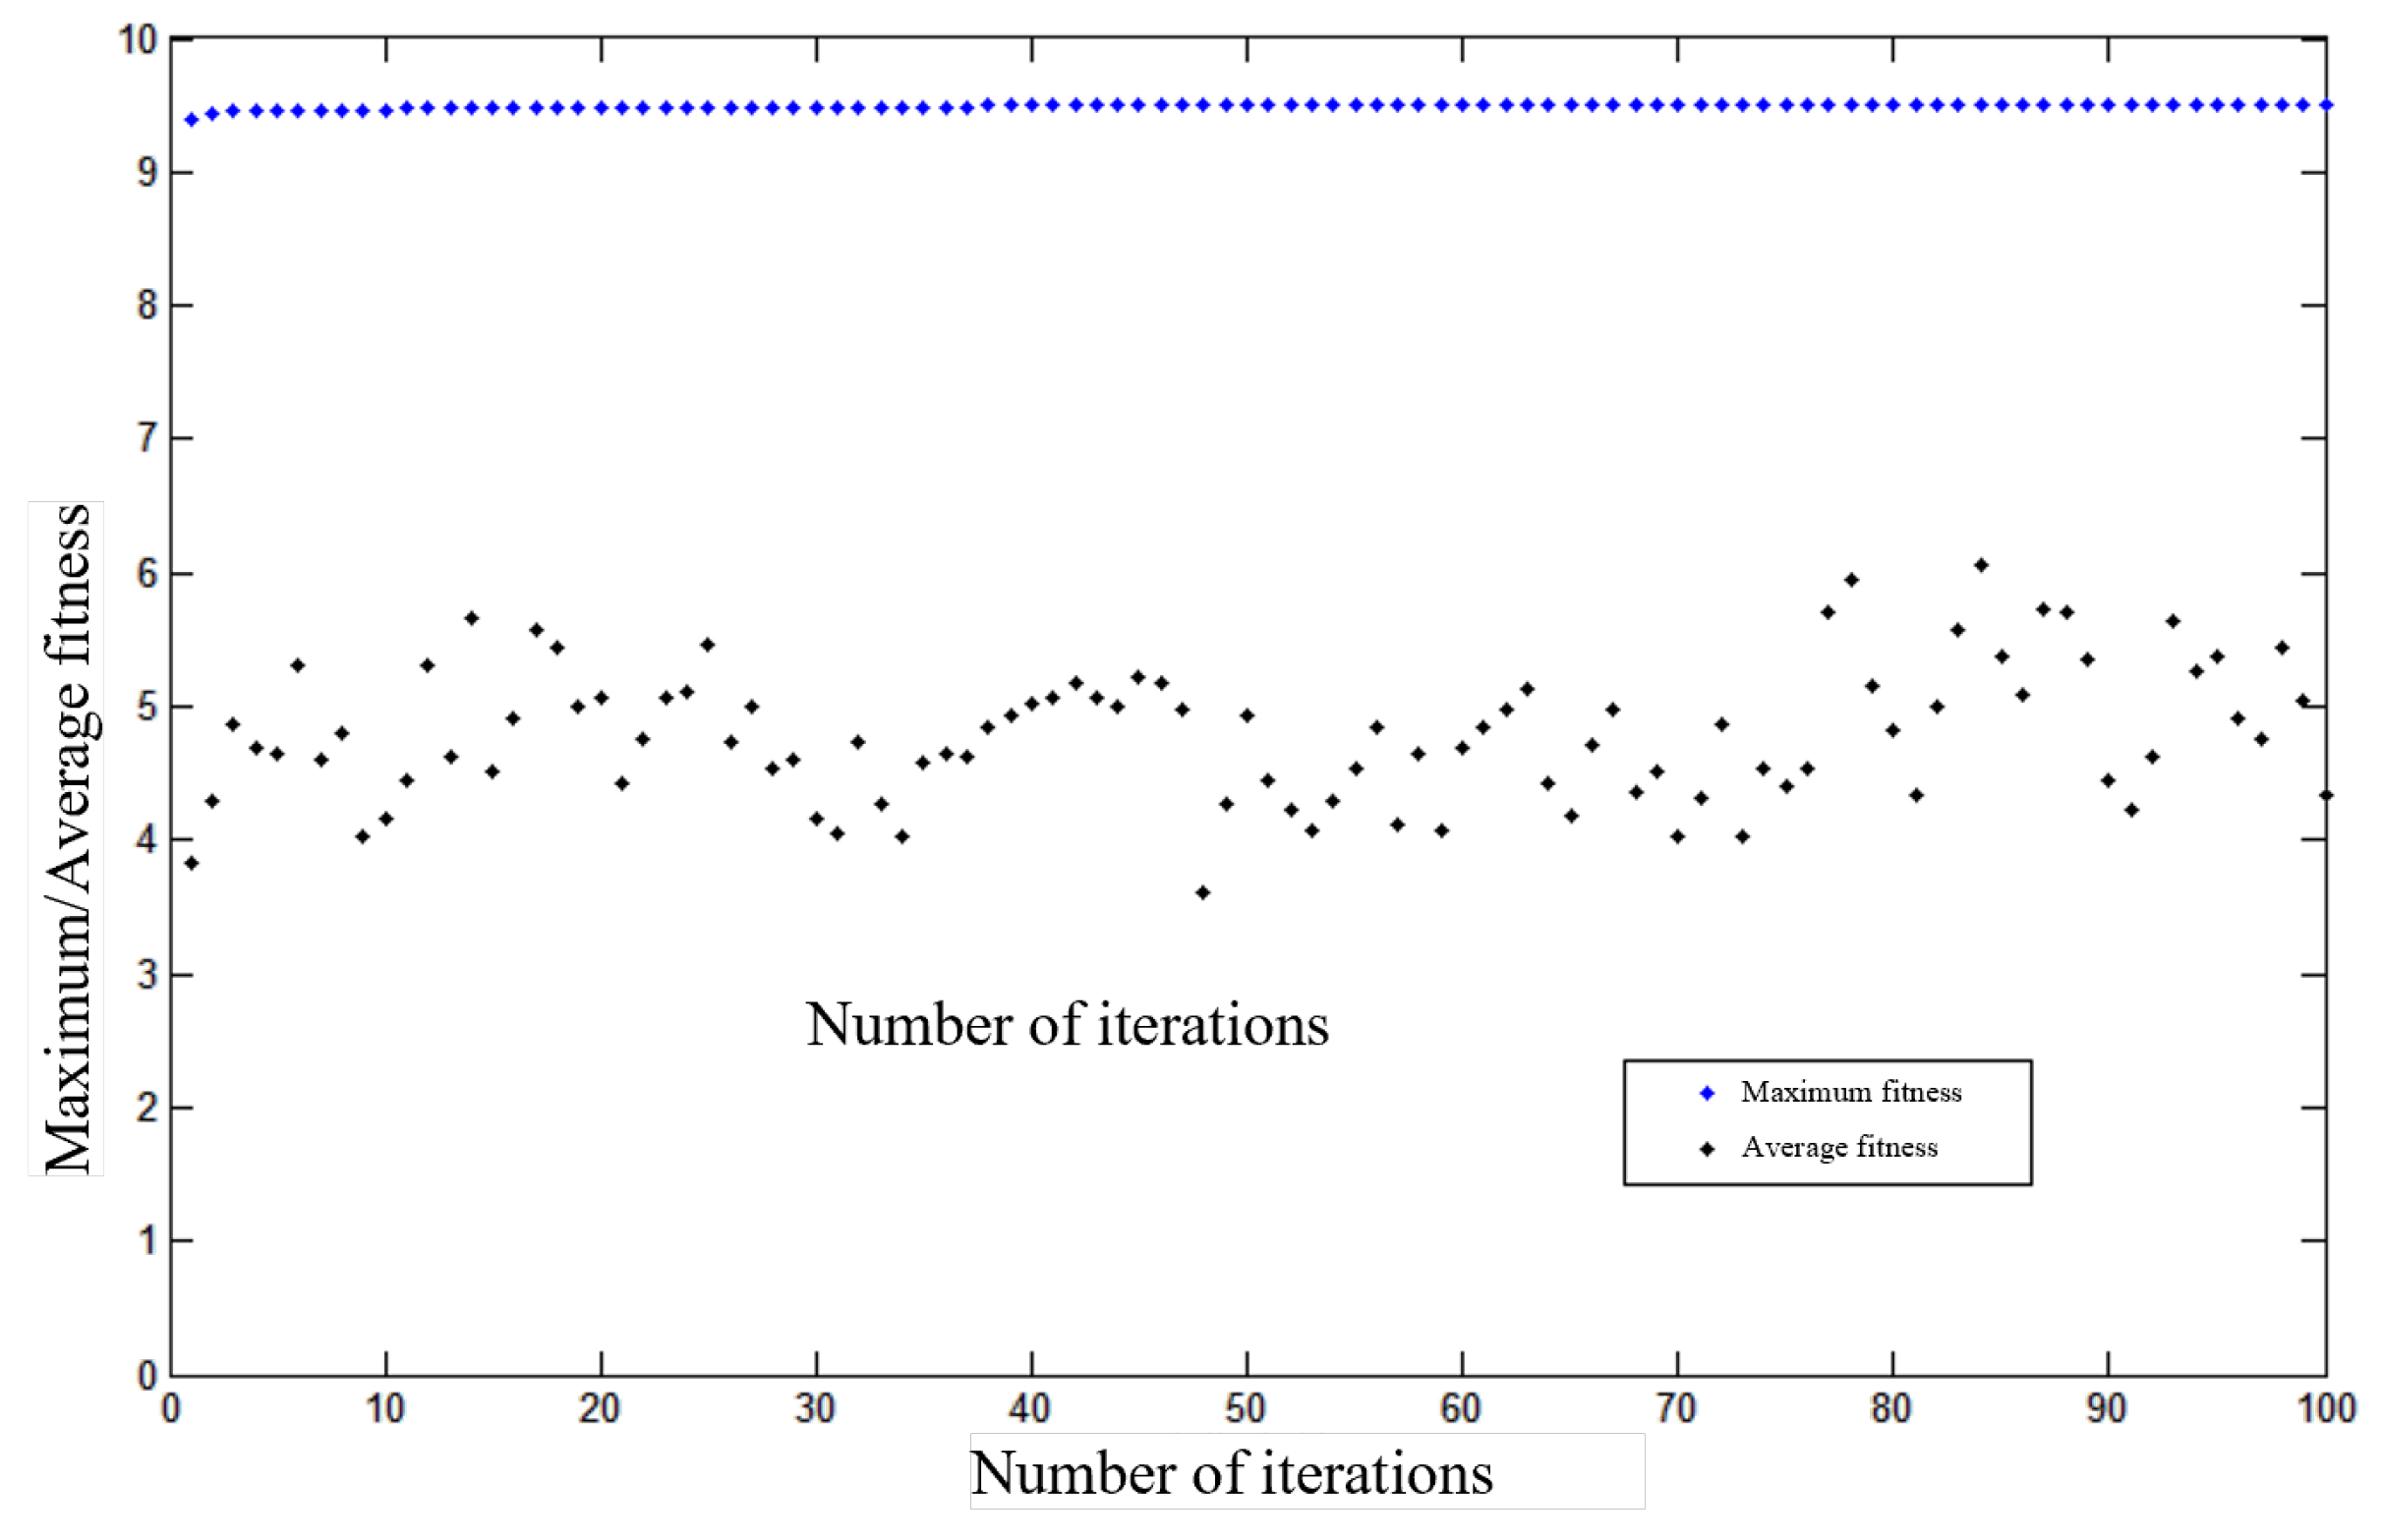
Figure 6.
The iteration process of improved Genetic Algorithm method
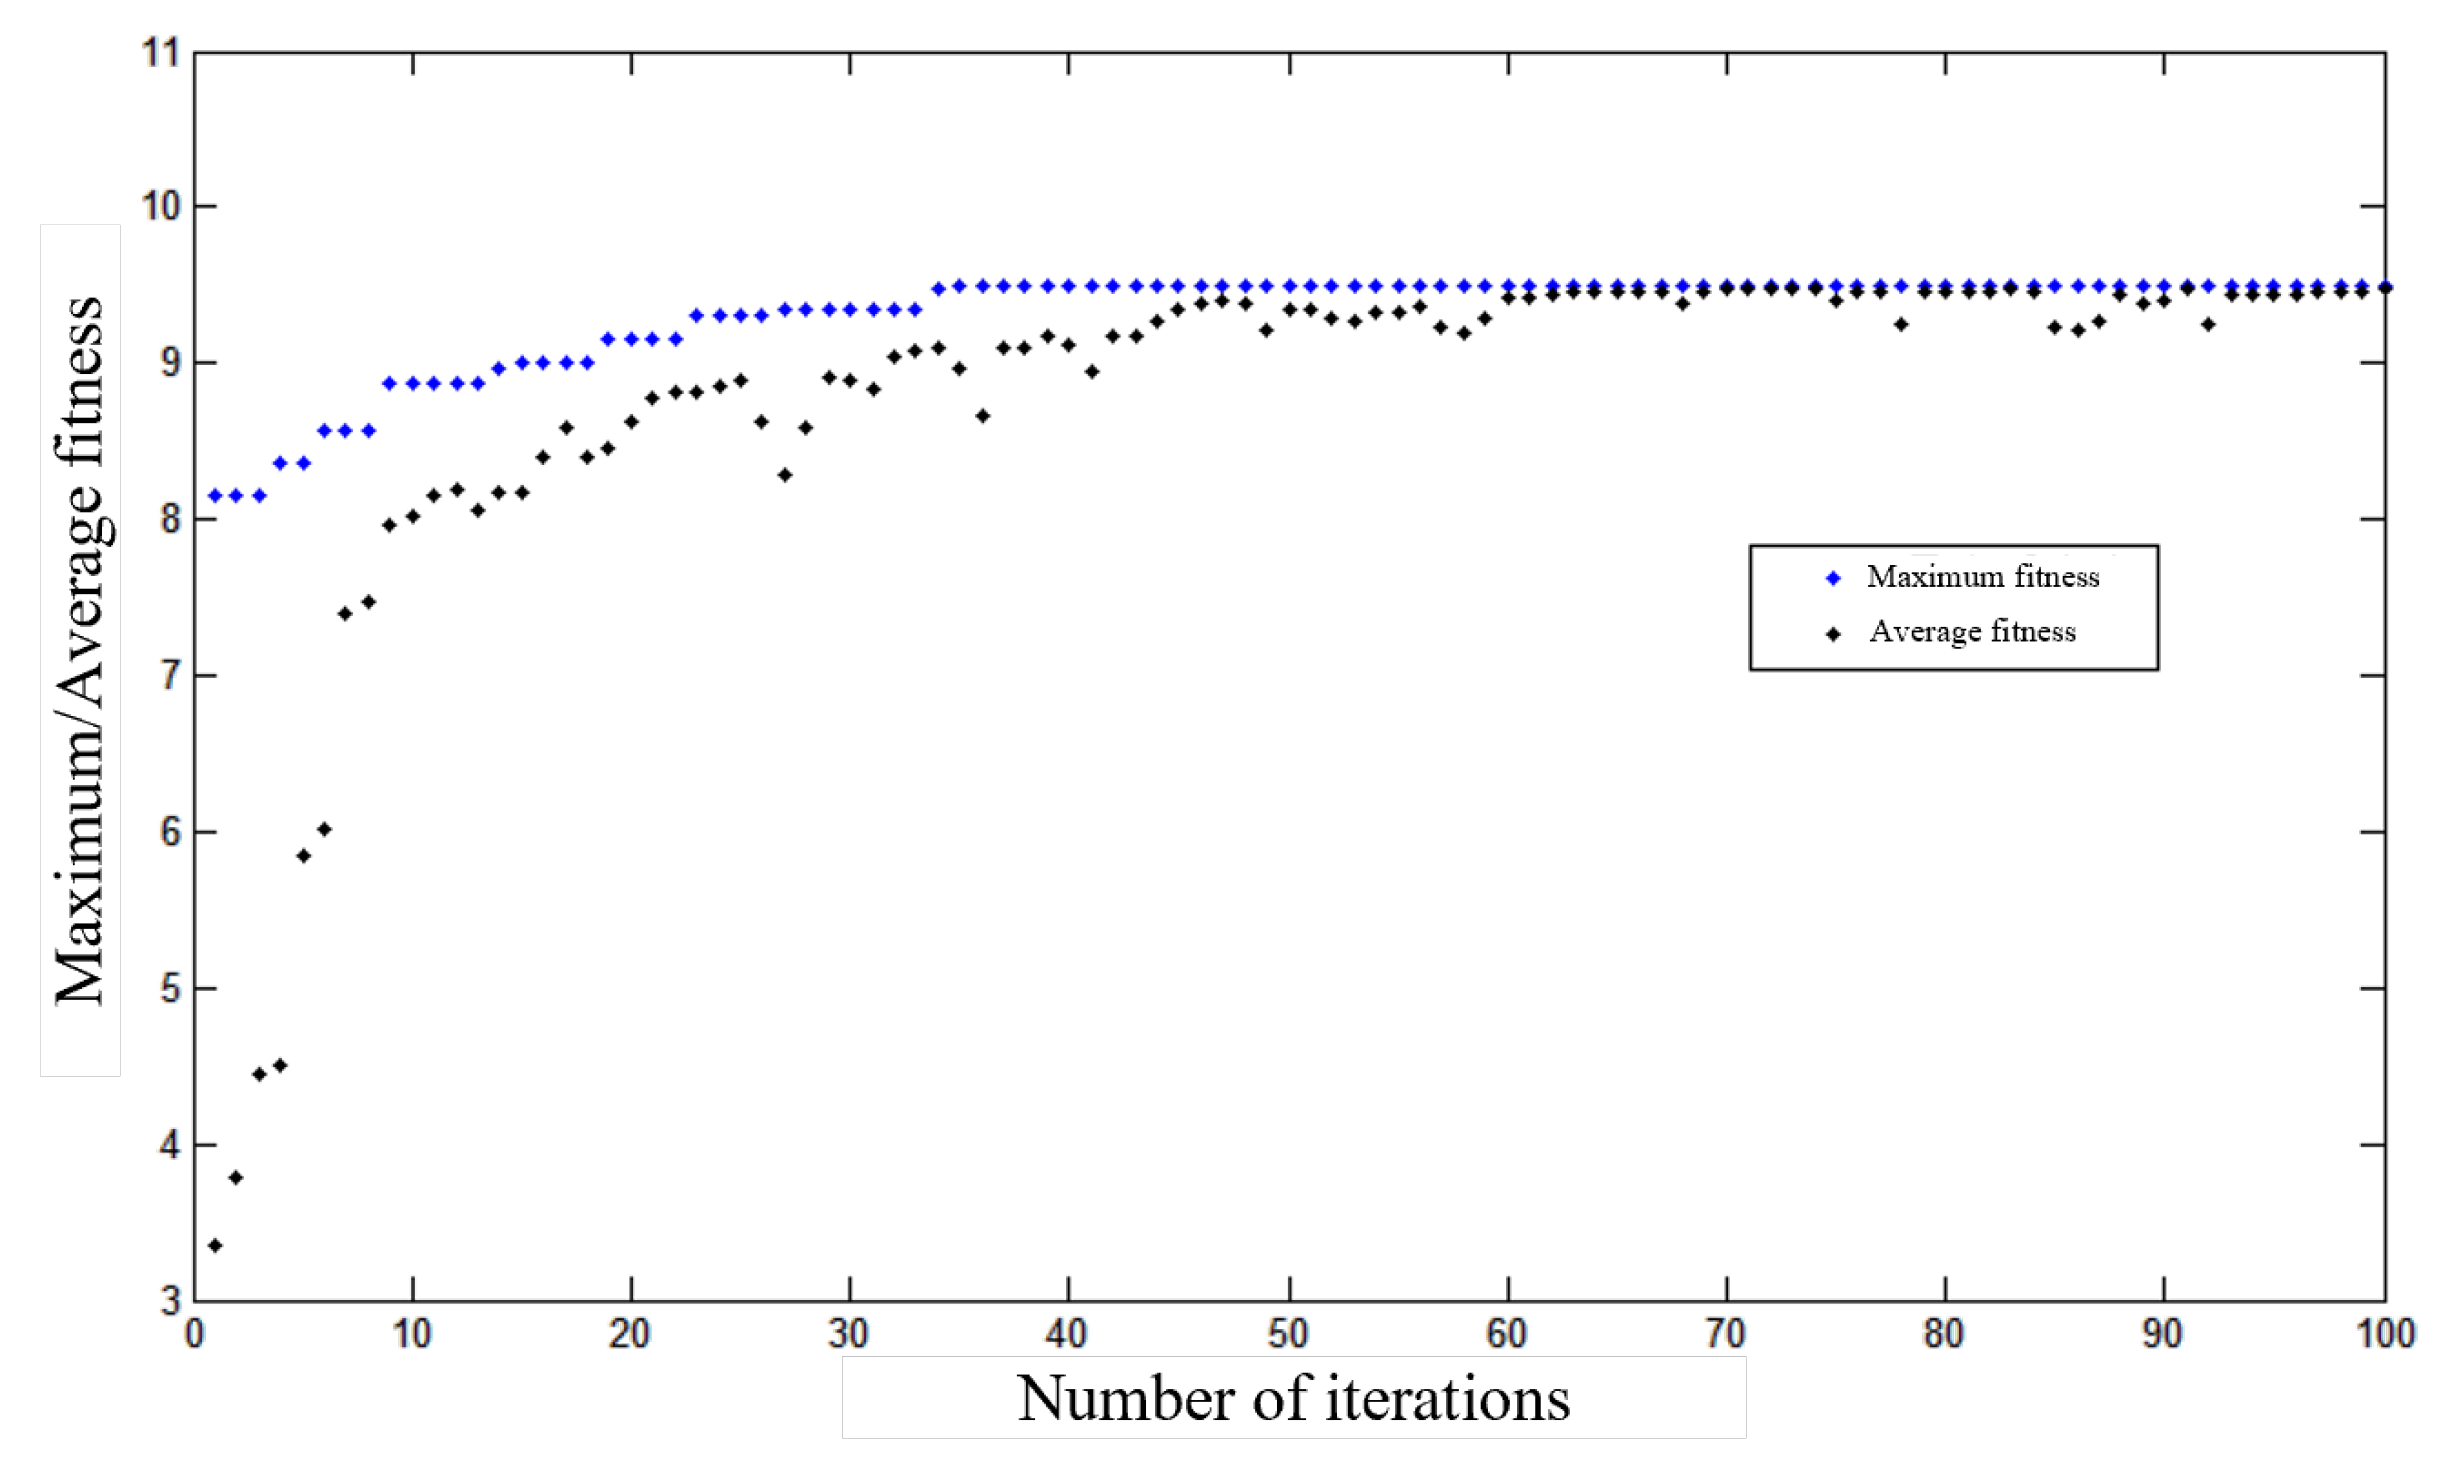
Figure 7.
The iteration process of improved Genetic Algorithm method
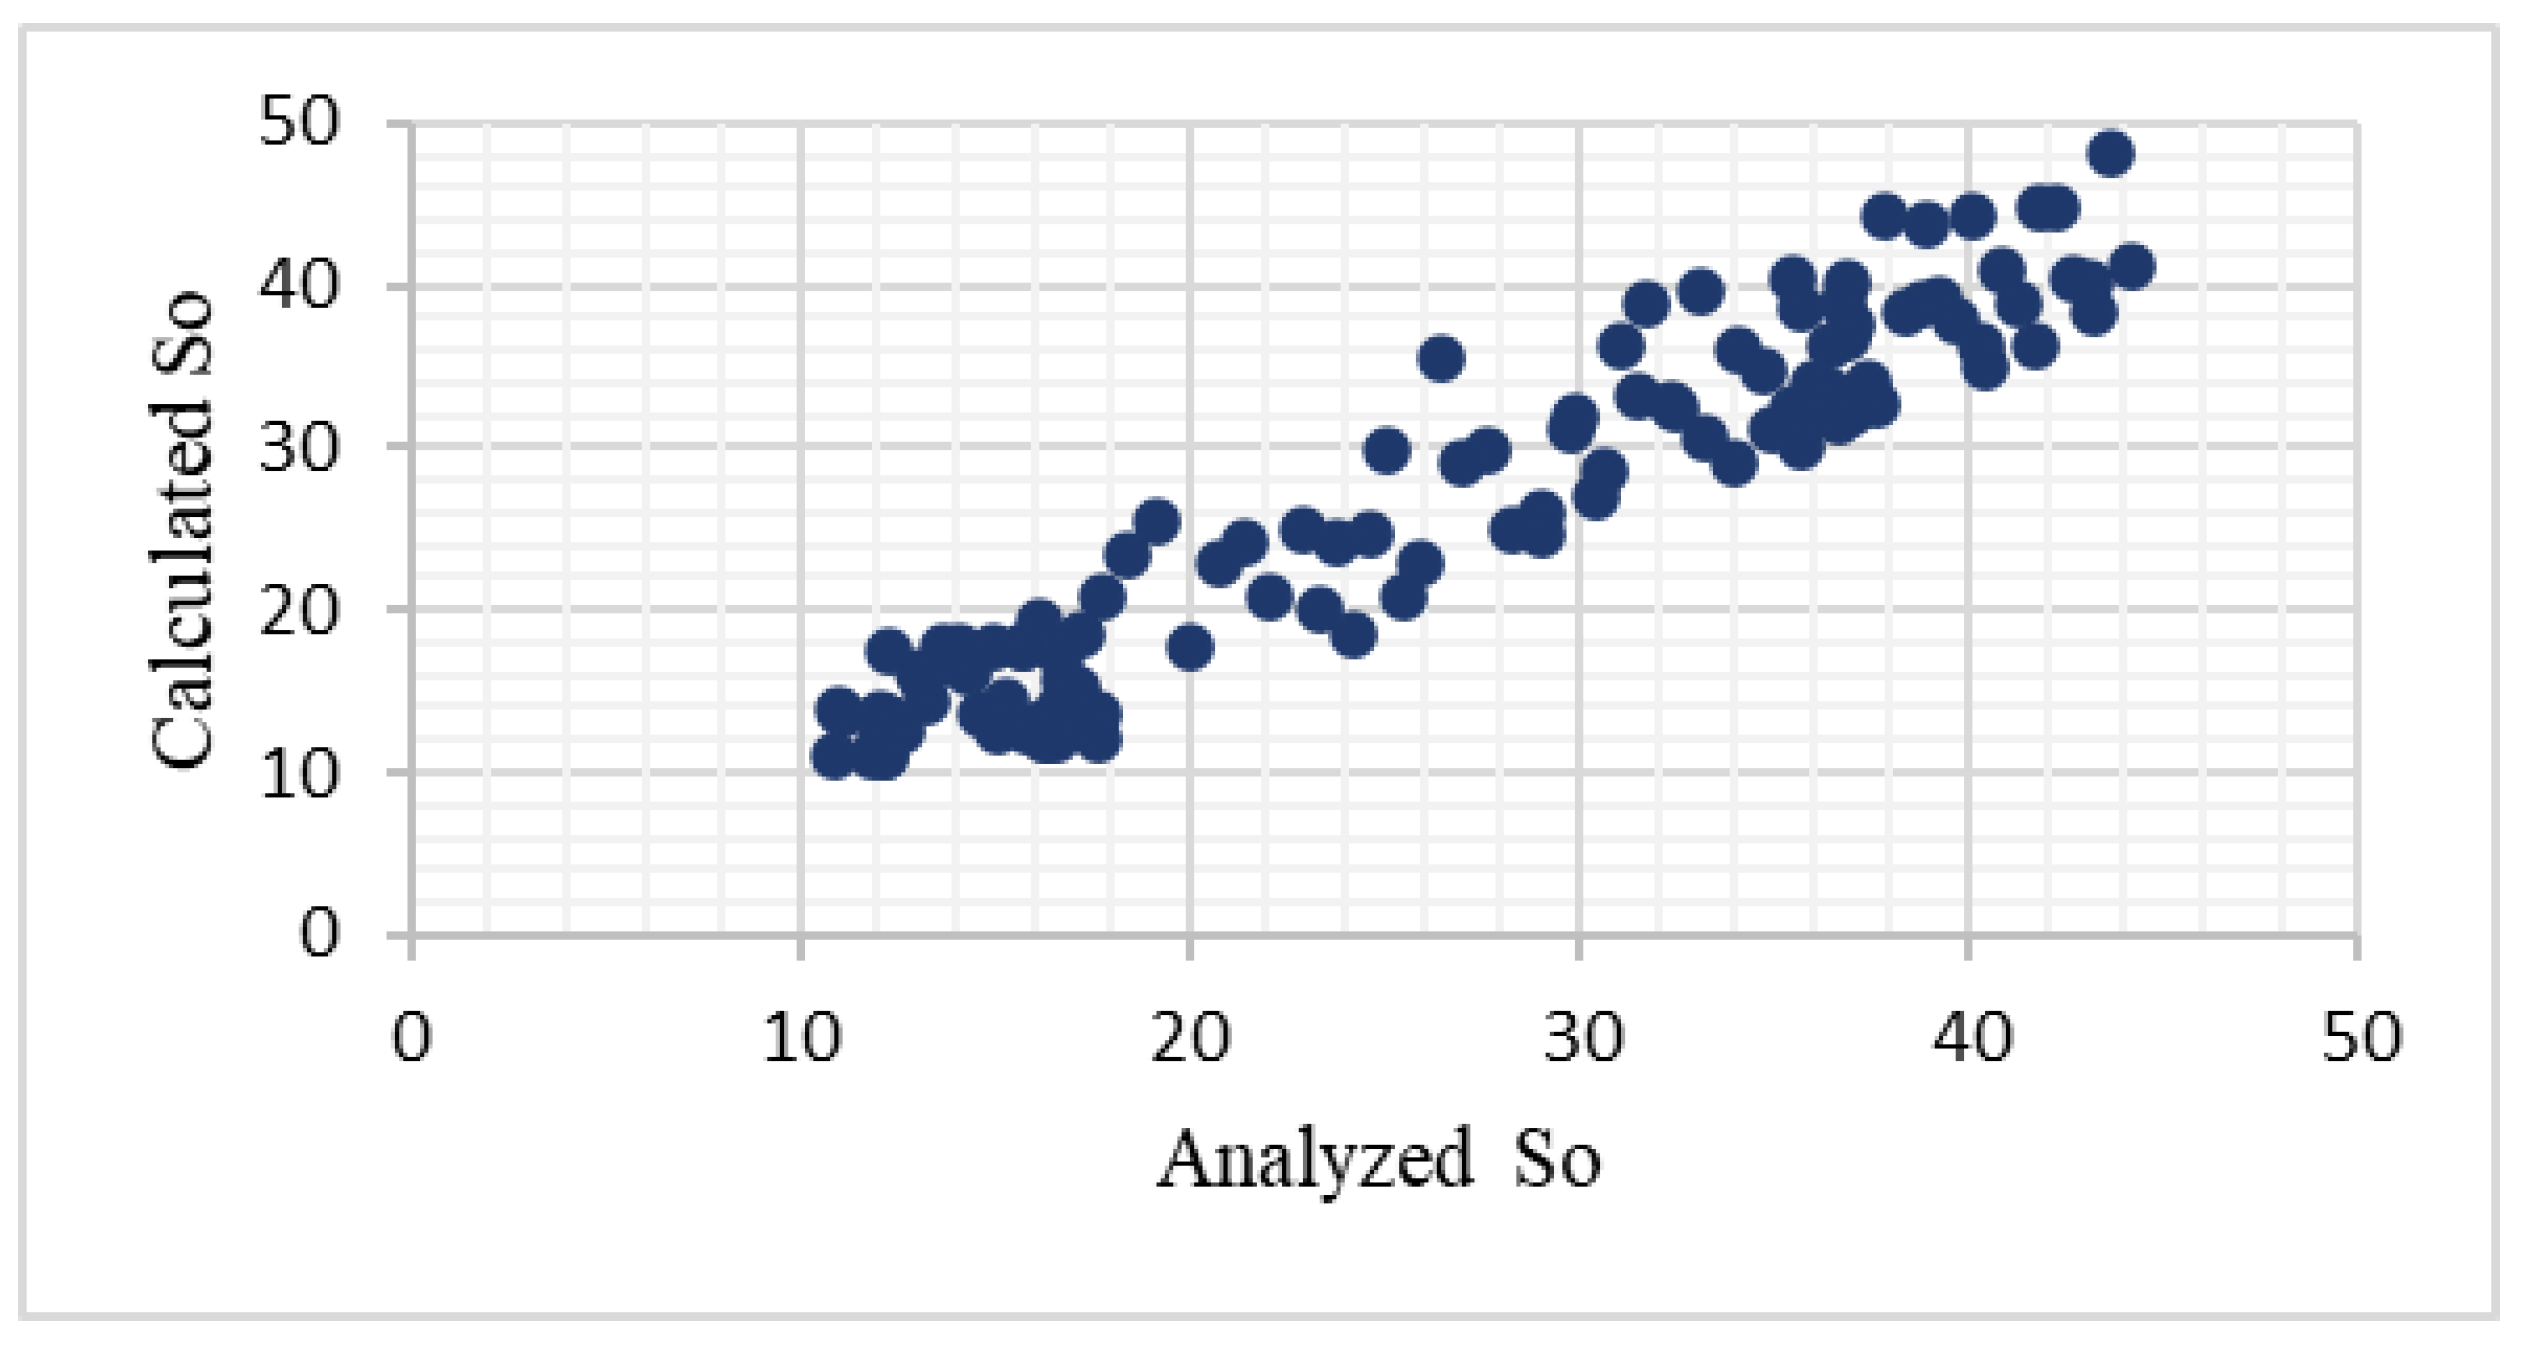
Figure 8.
The iteration process of improved Genetic Algorithm method
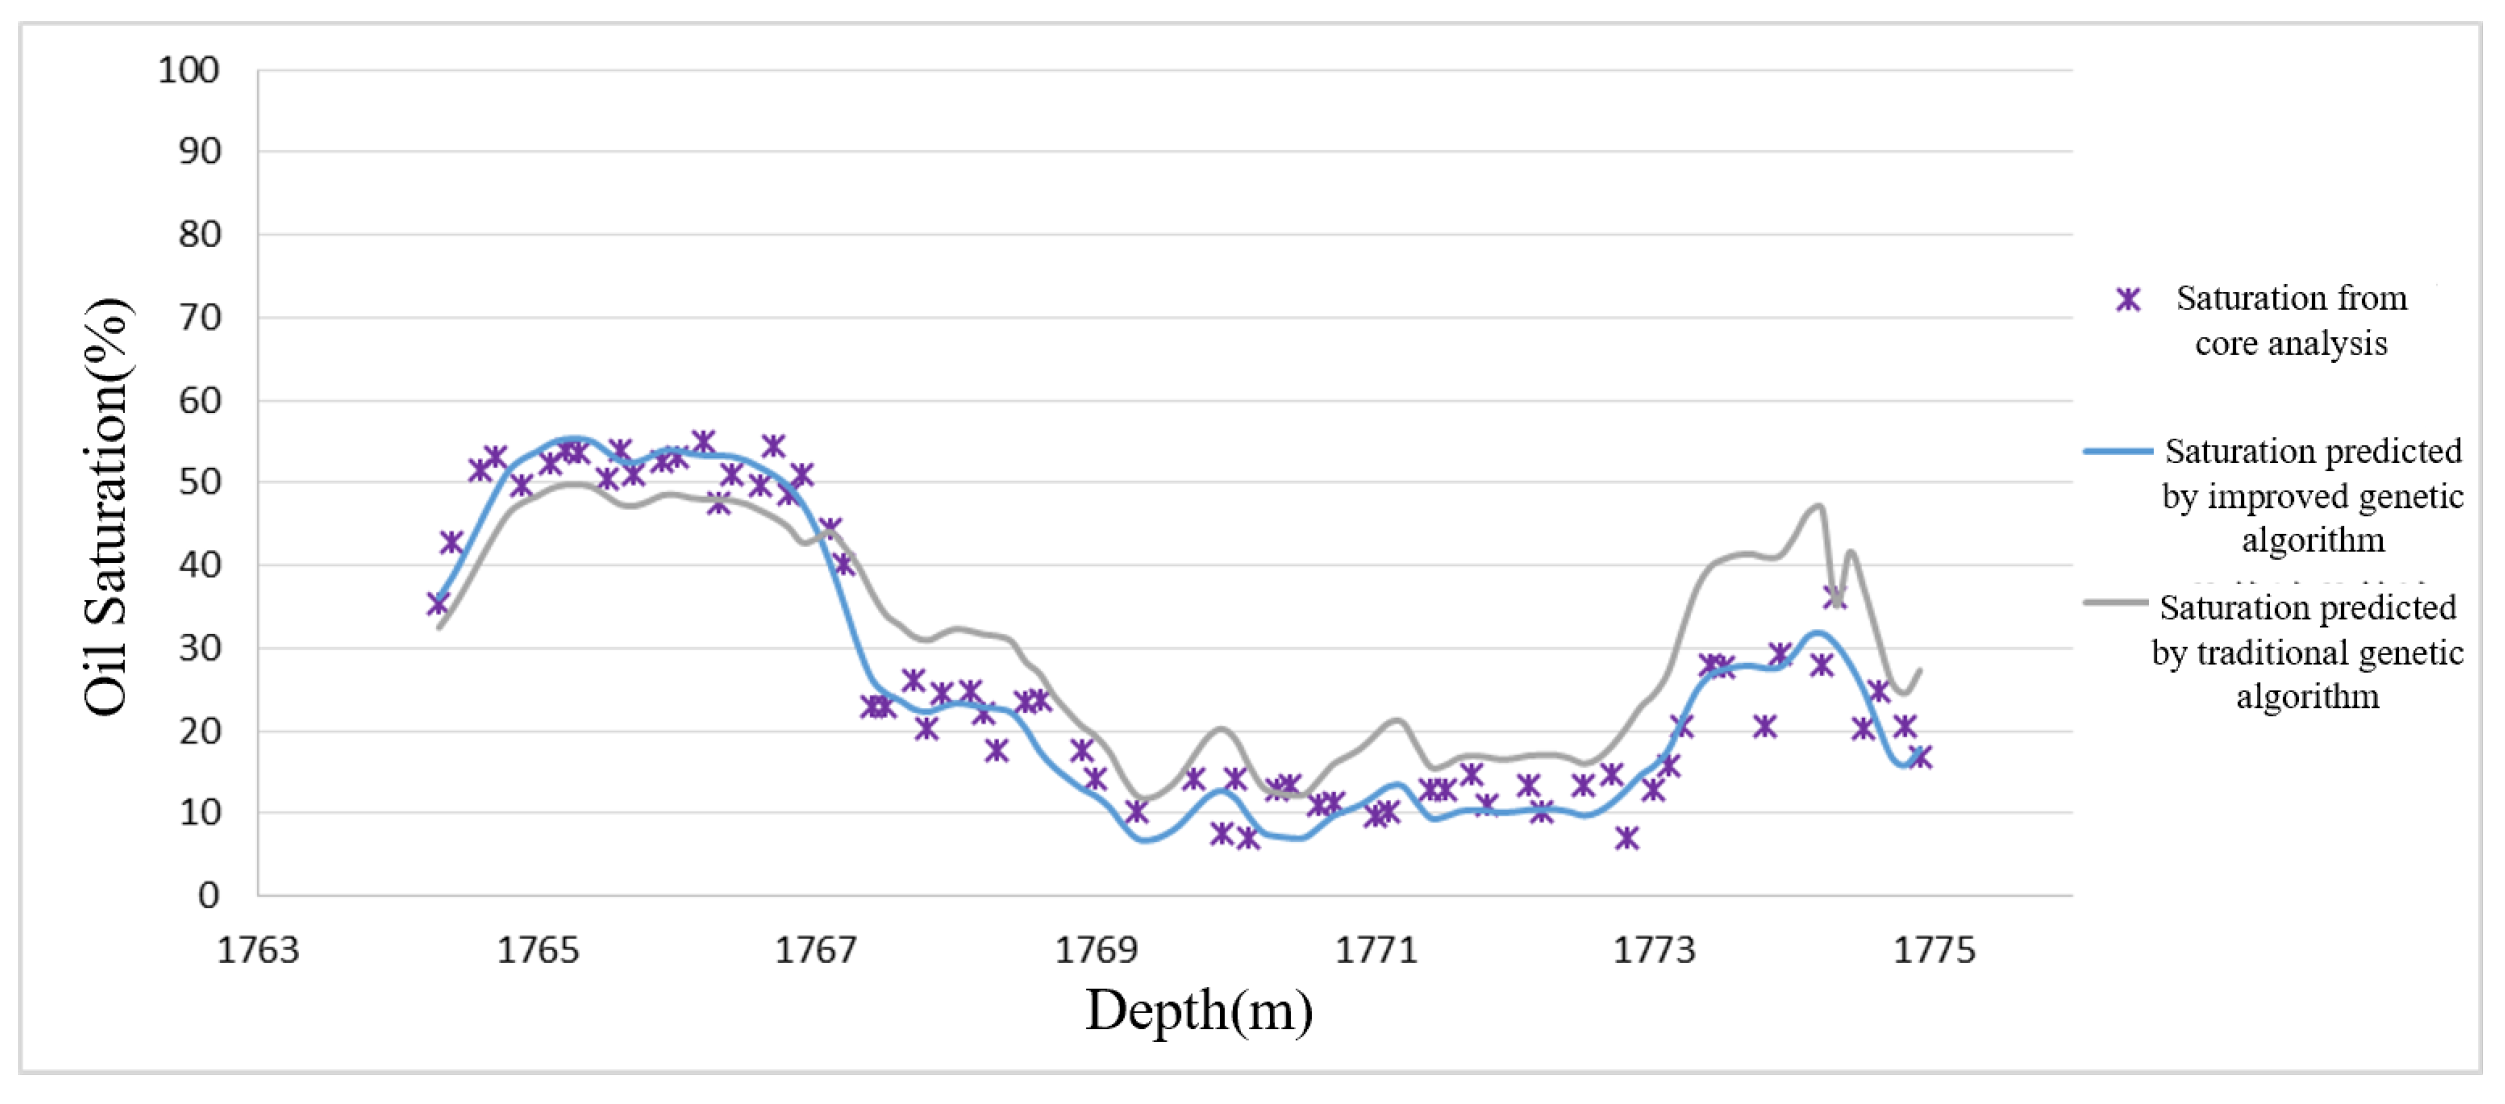
Figure 9.
Carbon-oxygen ratio logging interpretation results for the 1290-1320 meter interval in Well 2 of the M-1 oil field
Figure 9.
Carbon-oxygen ratio logging interpretation results for the 1290-1320 meter interval in Well 2 of the M-1 oil field
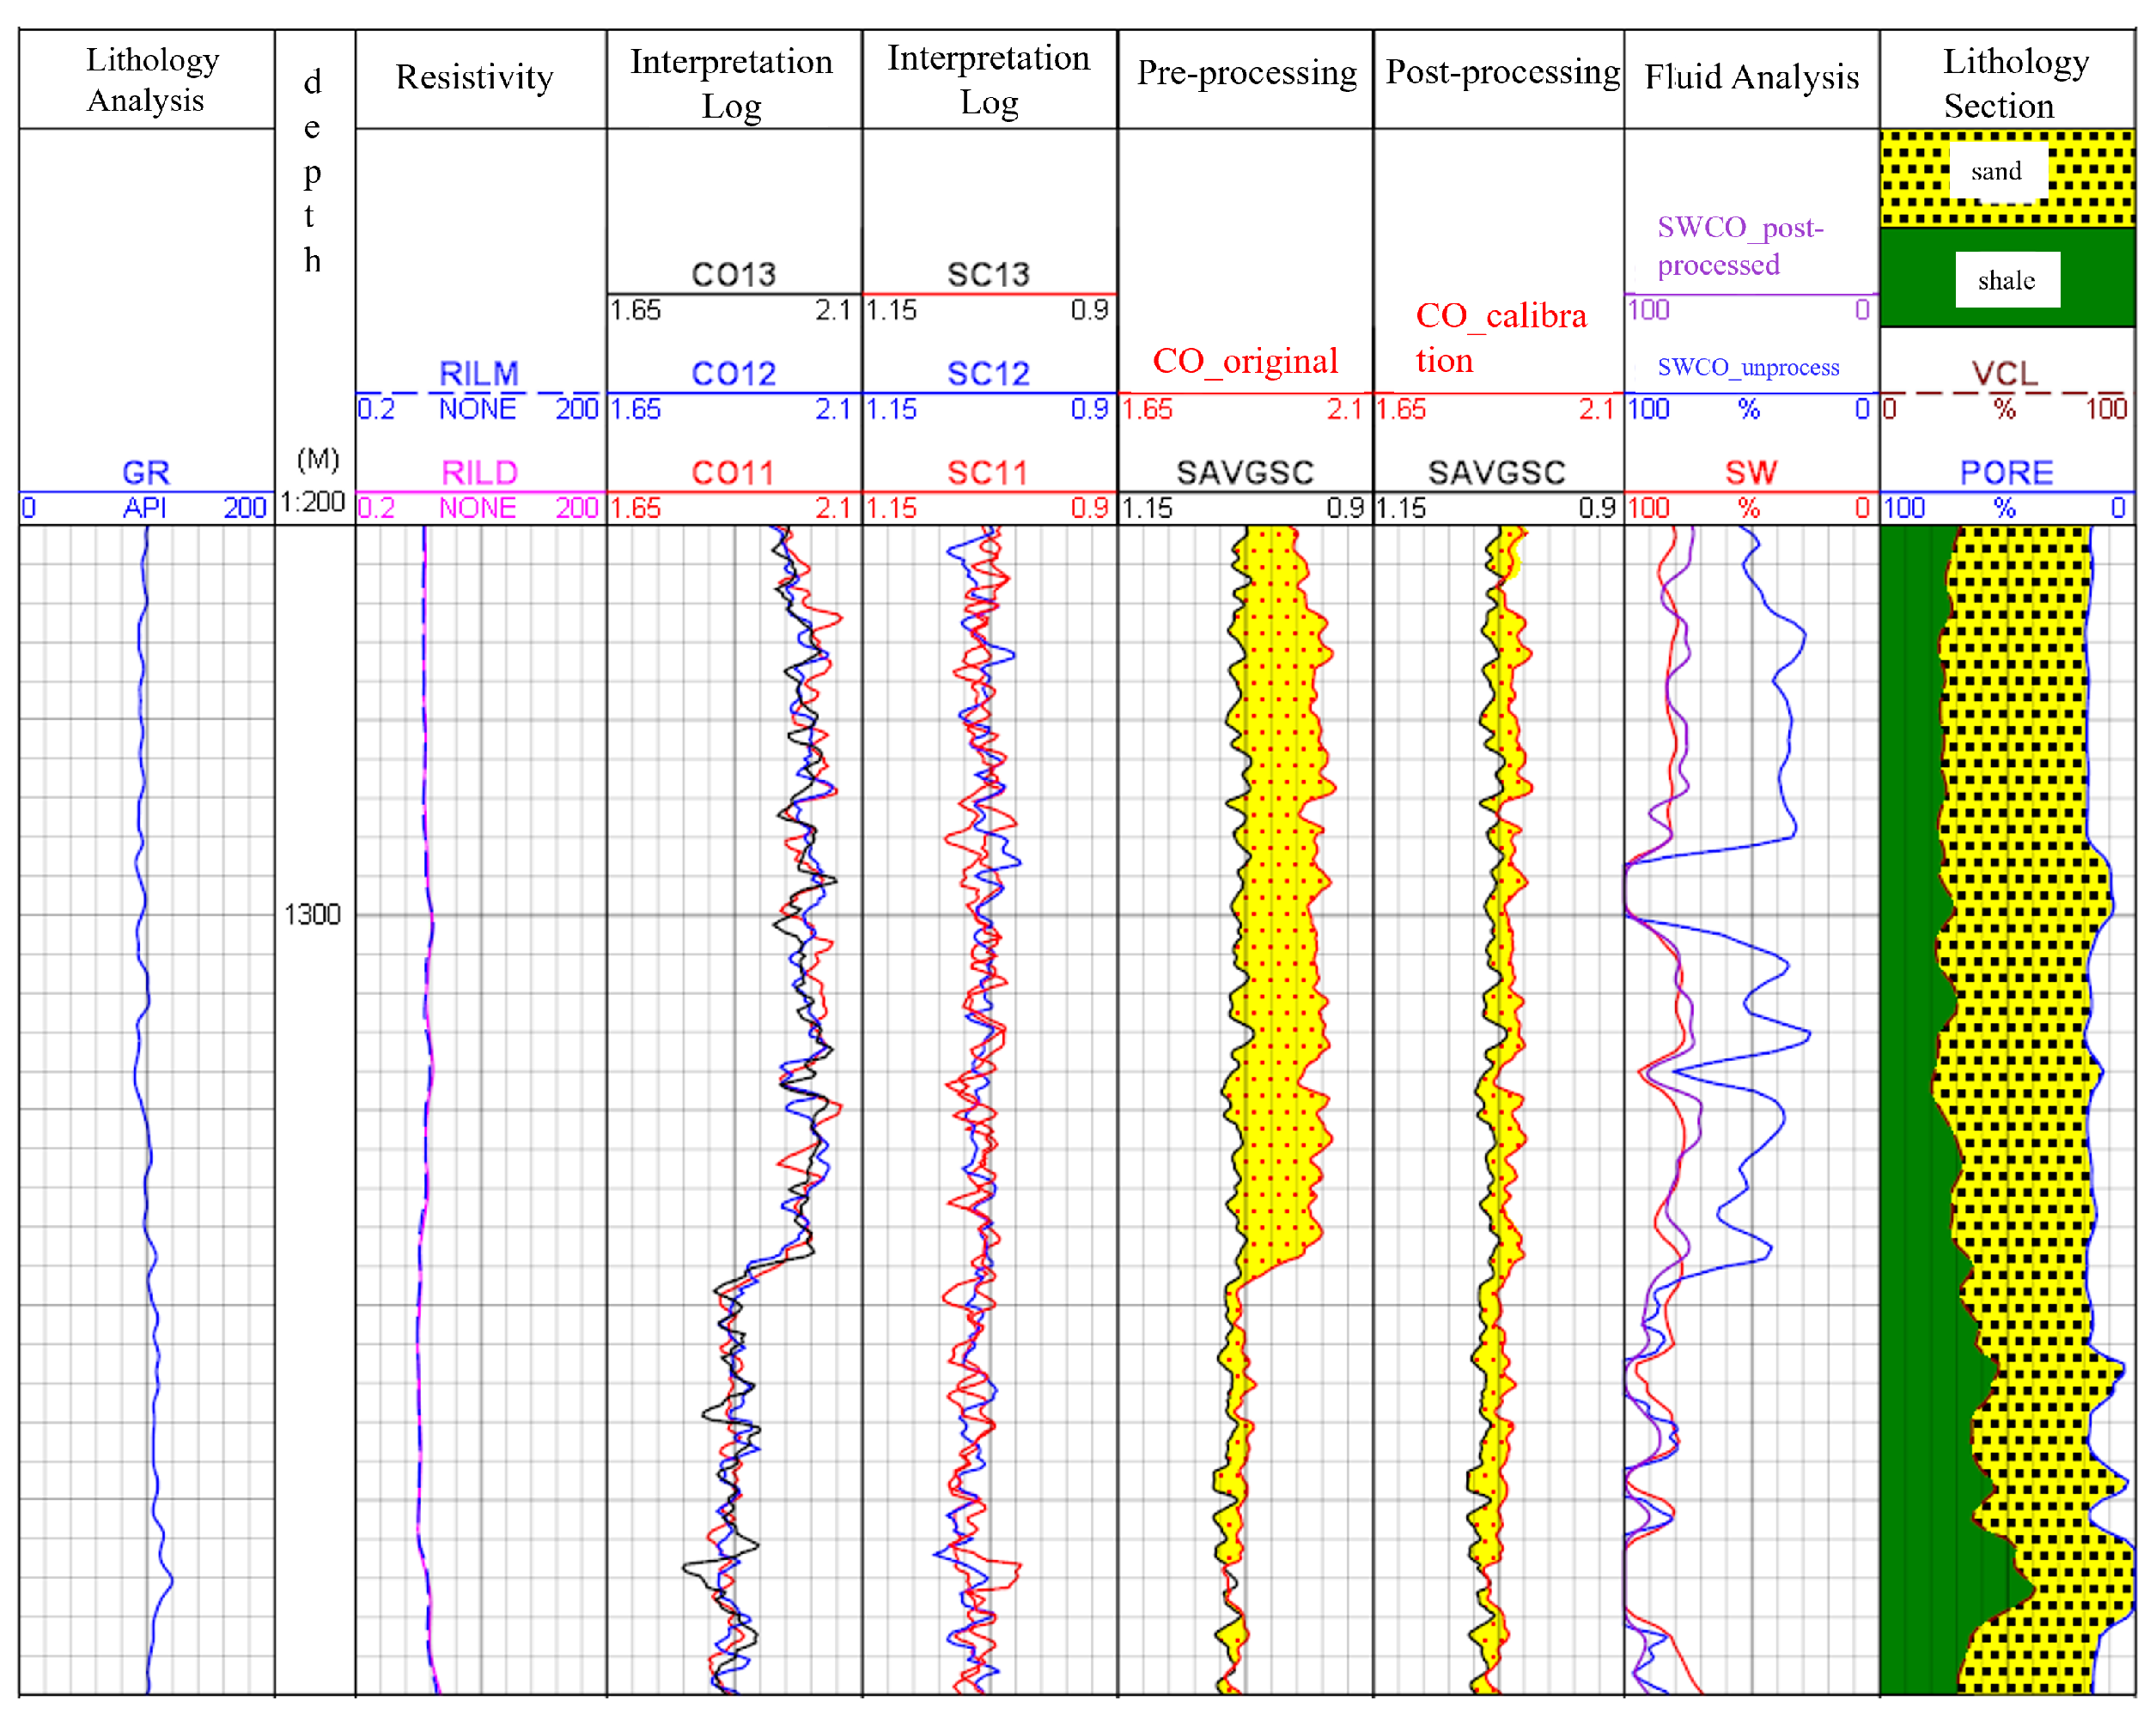
Figure 10.
The interpretation results of well2 in M-1 oilfield
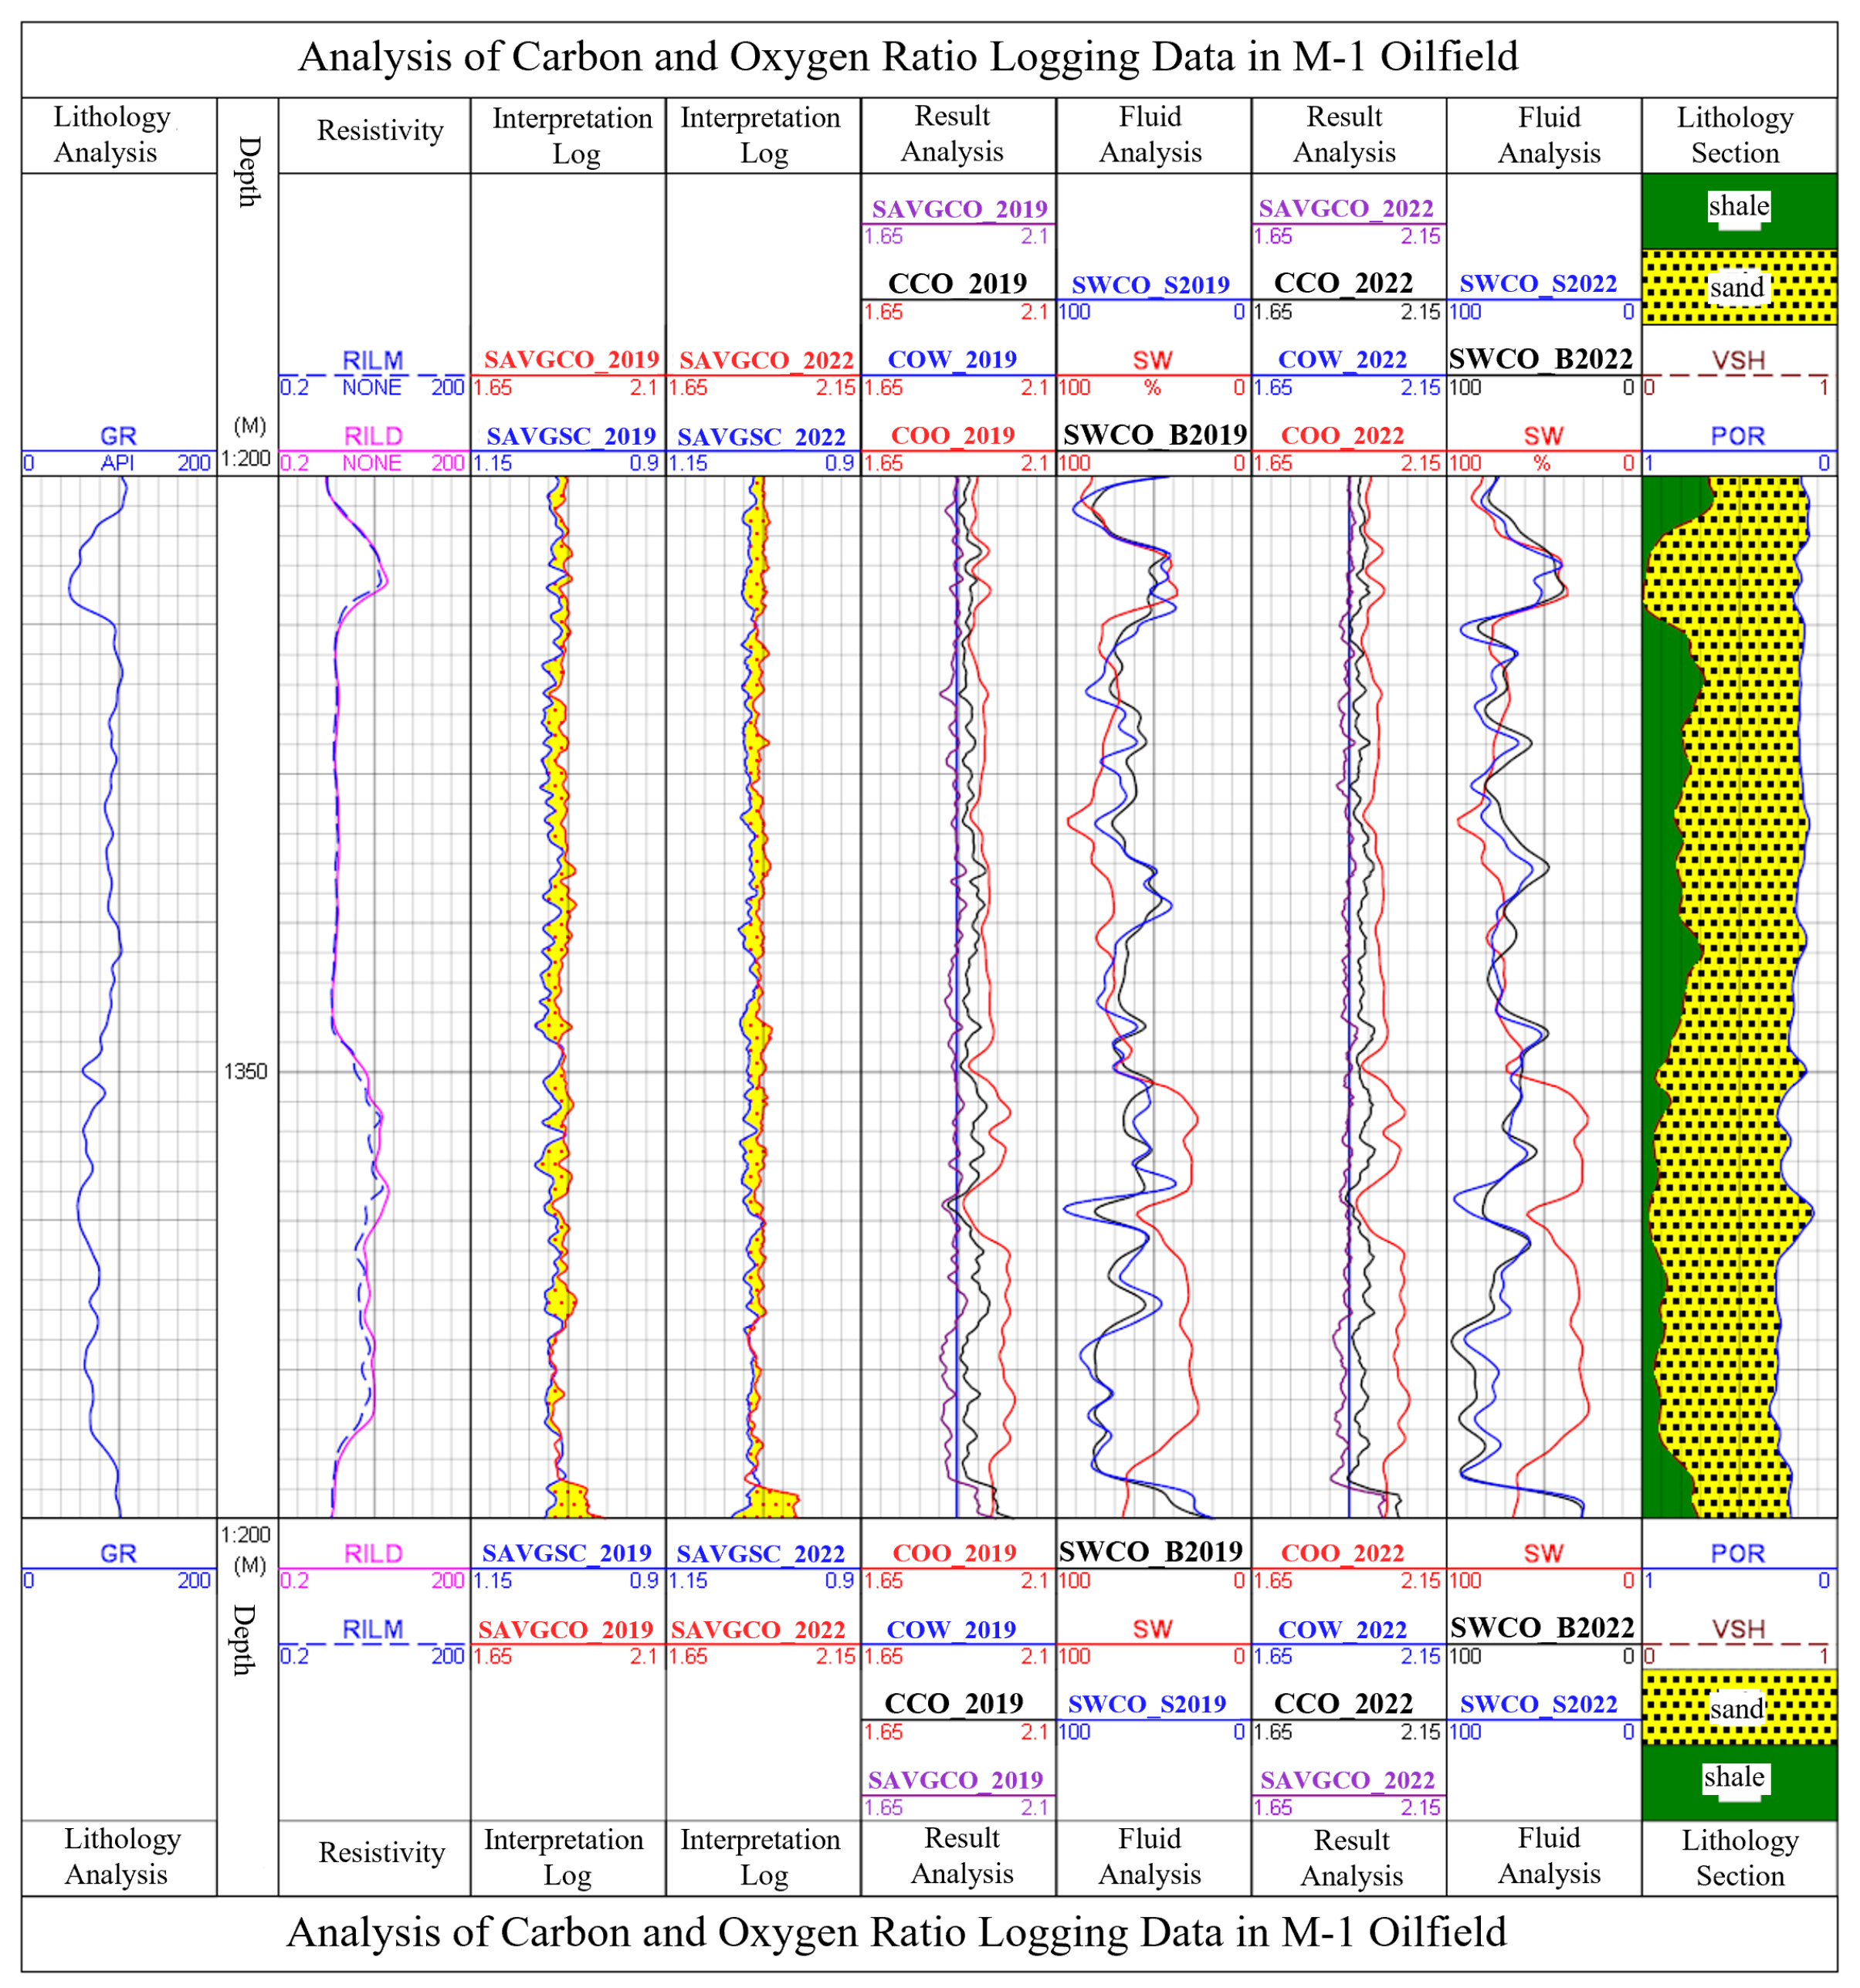
Figure 11.
Interpretation results of Output profile Logging of well 2 in M-1 oilfield
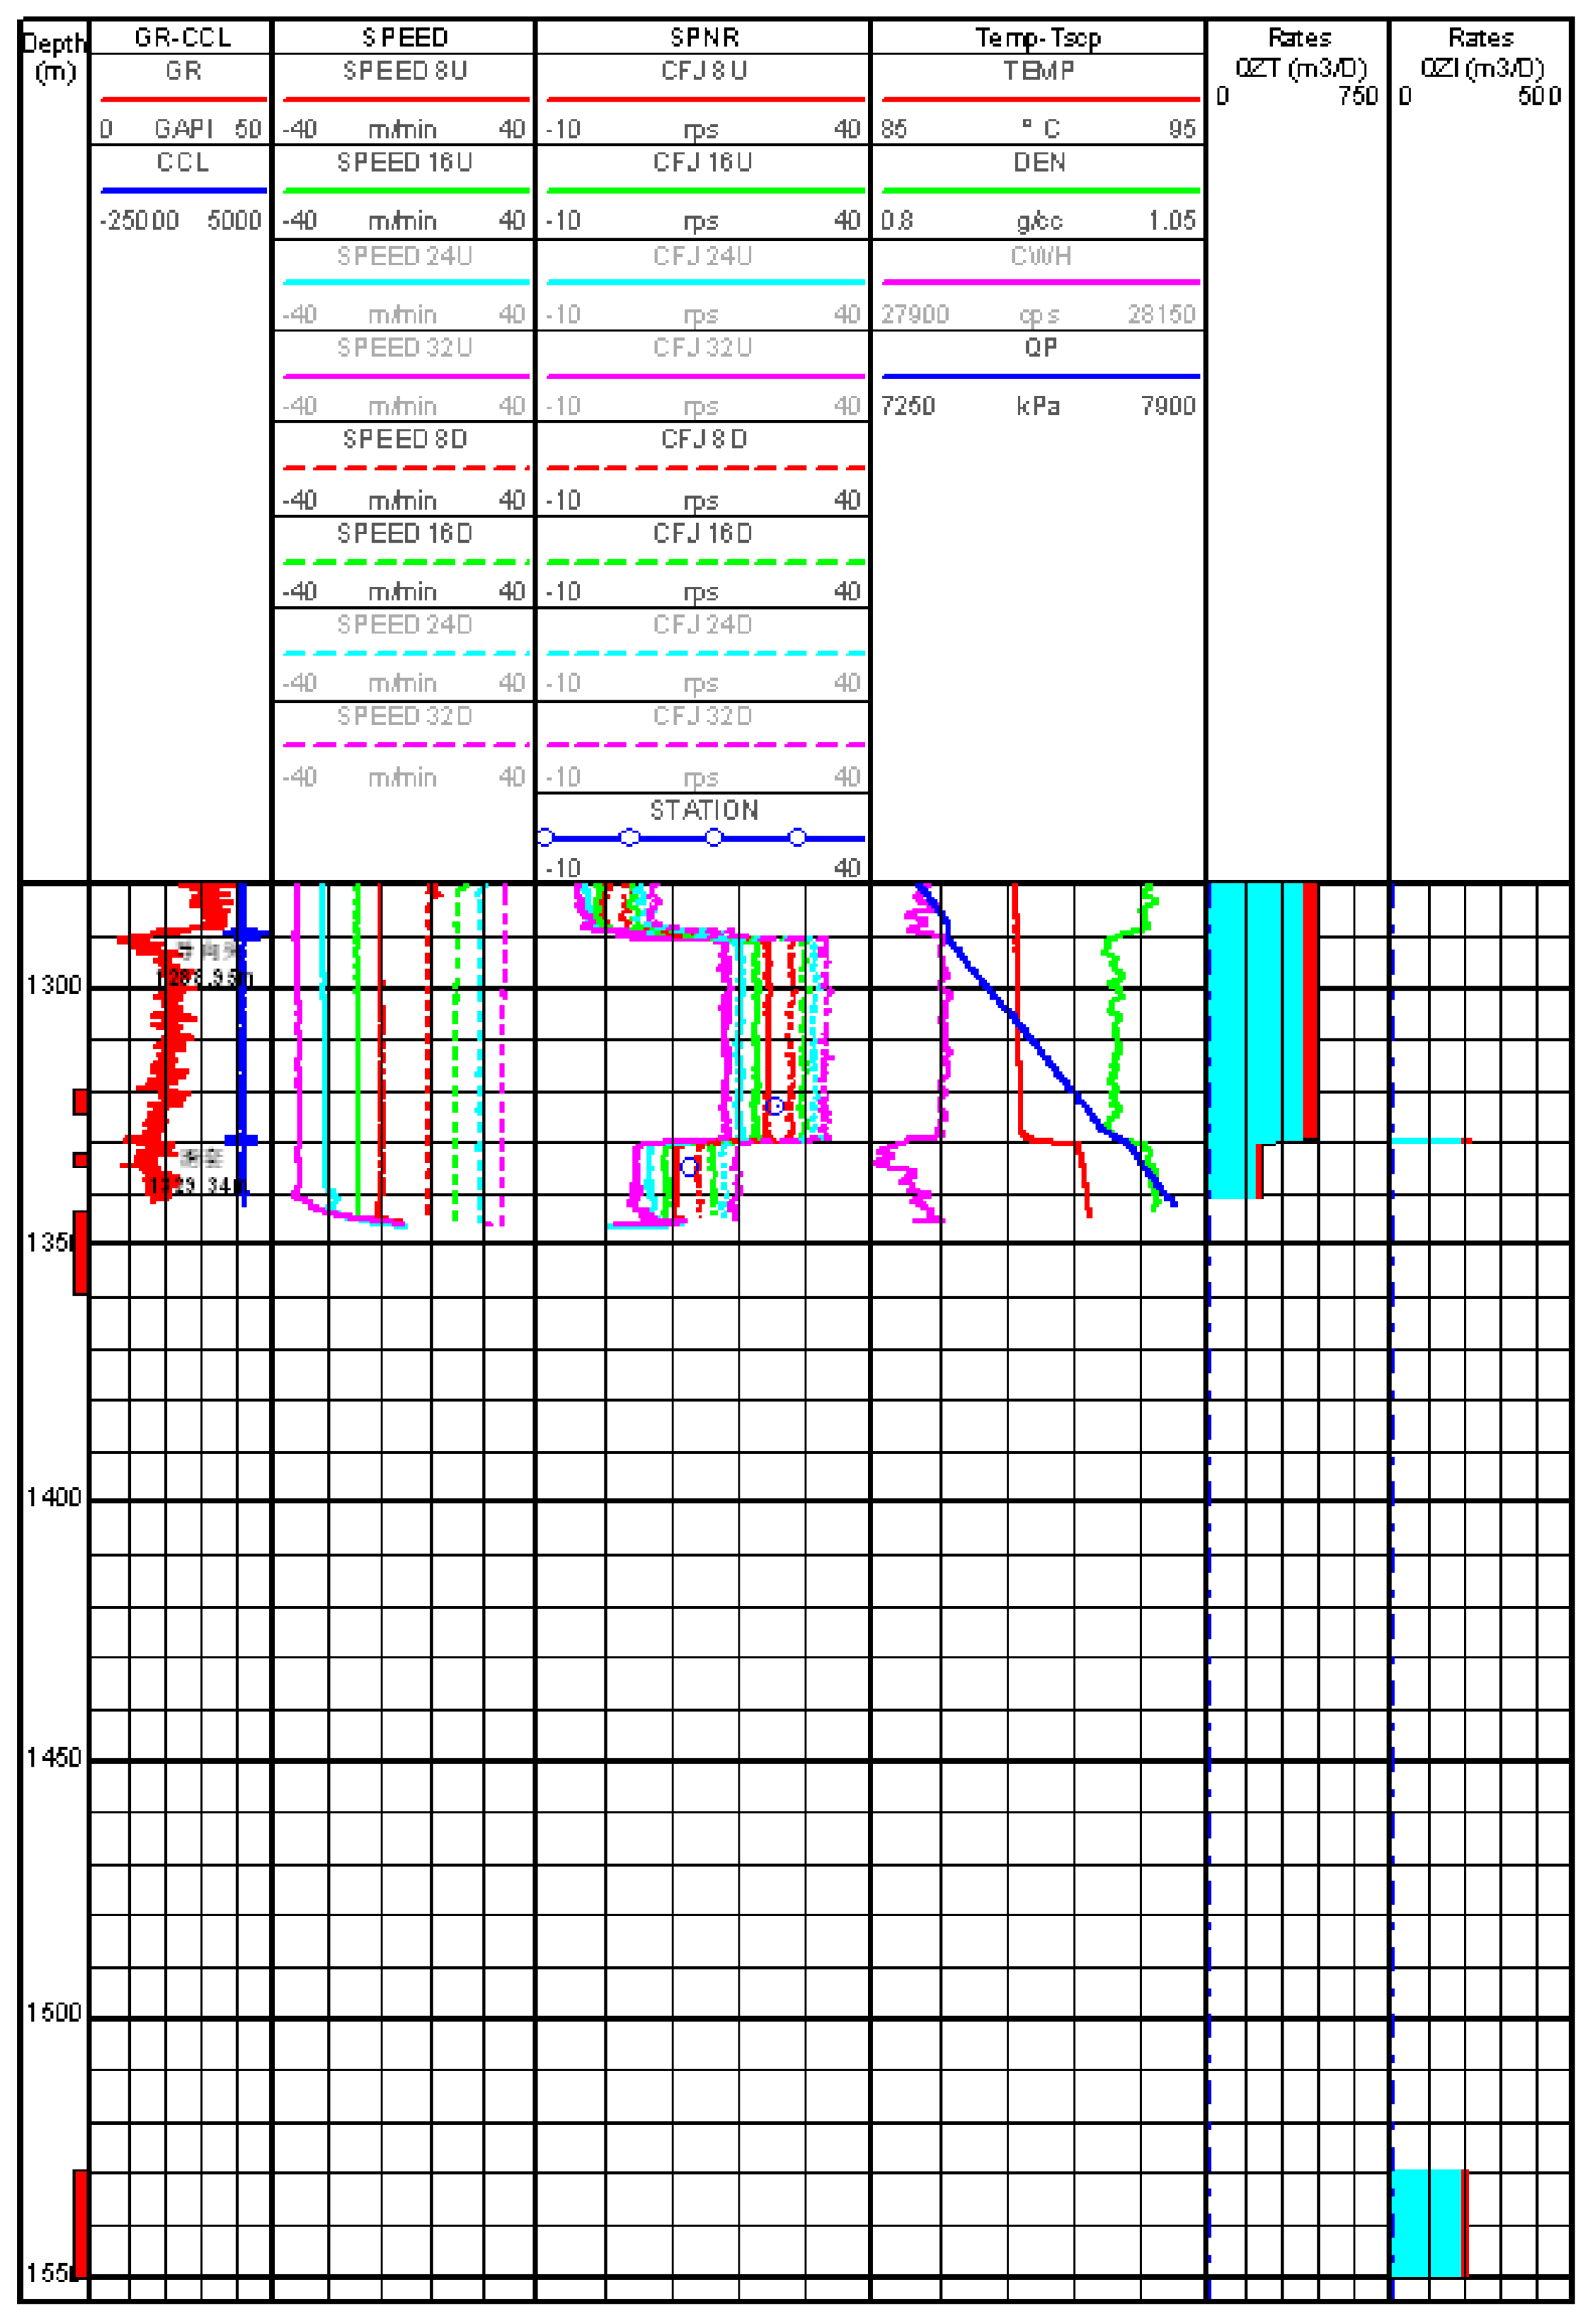
Figure 12.
Relationship between permeability and water saturation in M-1 oilfield
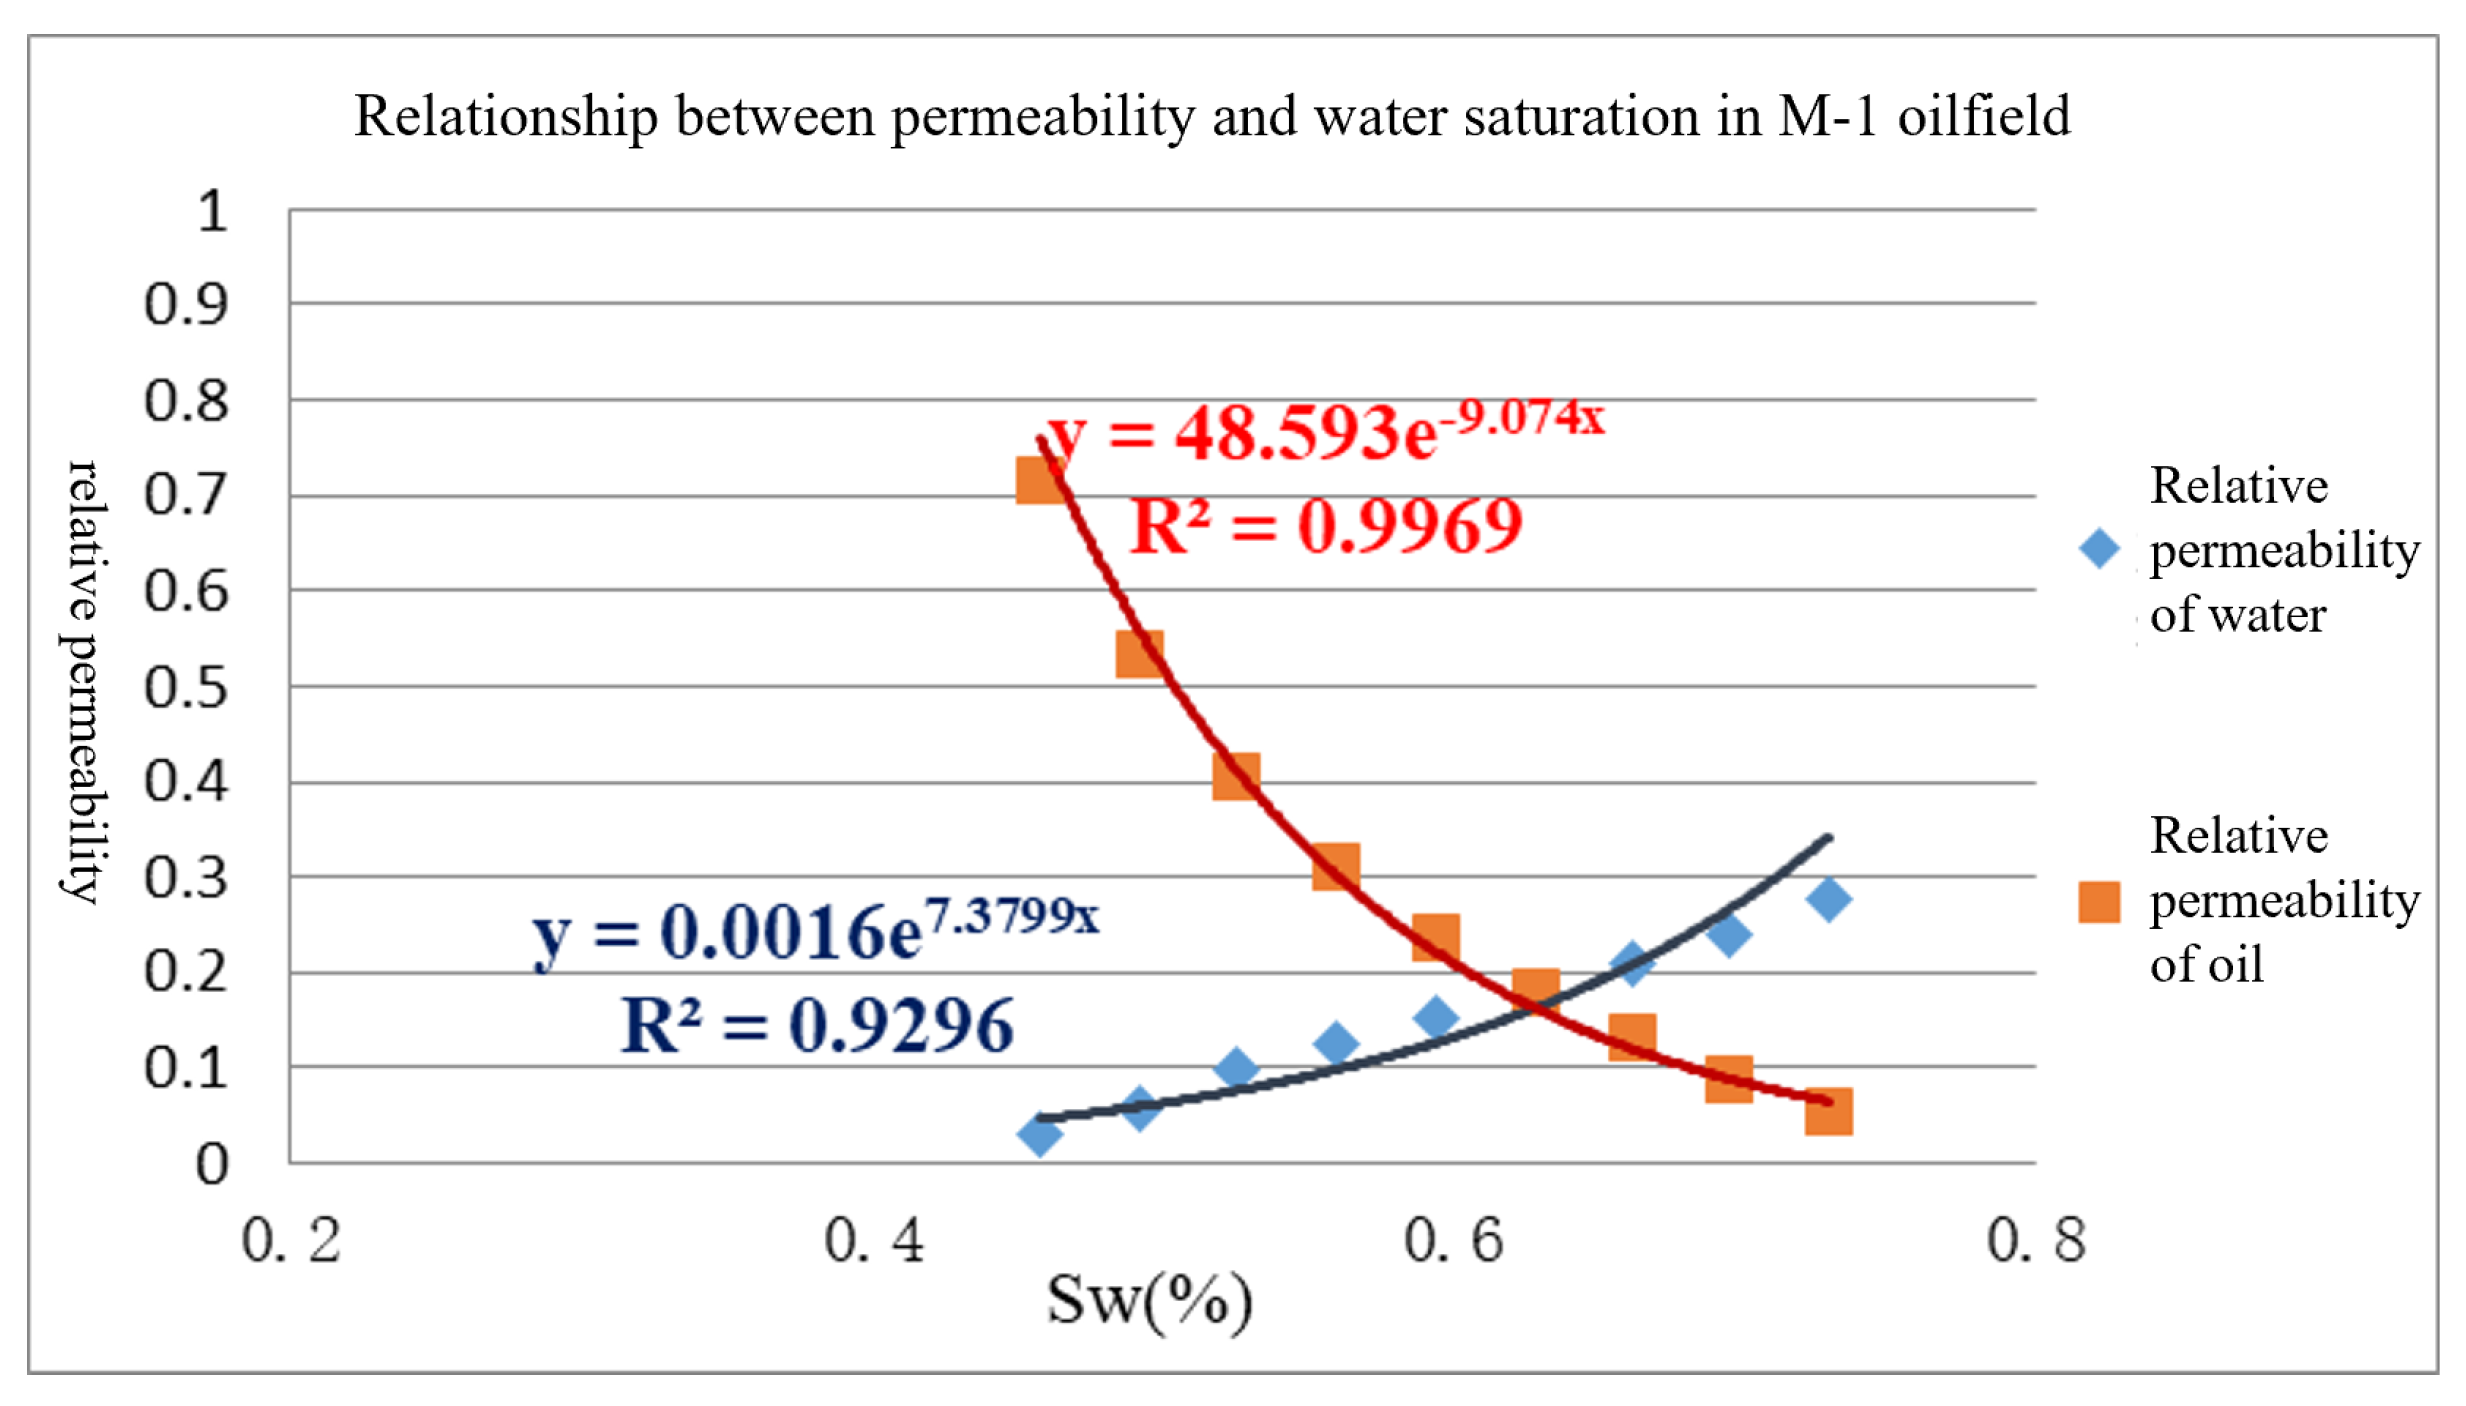
Table 2.
The range of parameters of Carbon/Oxygen logging.
| Oil Group | a | b | k | |
|---|---|---|---|---|
| A1-4U | 0.6-0.90 | 0.6-1.16 | 0.8-1.1159 | 2.50-3.06 |
| A1-4M | 0.6-0.90 | 0.6-1.11 | 0.8-1.2986 | 2.52-2.95 |
| A2-1 | 0.6-0.85 | 0.6-1.11 | 0.8-1.3197 | 2.46-2.78 |
| A2-2 | 0.6-0.85 | 0.6-1.10 | 0.8-1.3206 | 2.36-2.81 |
* This table presents the parameter ranges for interpretation model in M-1 oilfield.
Table 3.
The range of various parameters of Carbon/Oxygen logging.
| Oil Group | a | b | k | |
|---|---|---|---|---|
| A1-1L | 0.6-0.85 | 0.6-1.15 | 0.6-1.1023 | 2.60-3.15 |
| A1-6 | 0.6-0.75 | 0.6-1.19 | 0.6-0.864 | 2.54-3.05 |
| A1-7 | 0.6-0.78 | 0.6-1.09 | 0.6-0.876 | 2.52-3.05 |
| A2-1U | 0.6-0.85 | 0.6-1.10 | 0.6-0.8735 | 2.36-2.71 |
| A2-1L | 0.6-0.85 | 0.6-1.11 | 0.6-0.8823 | 2.36-2.78 |
* This table presents the parameter ranges for interpretation model in M-2 oilfield.
Table 4.
Performance comparison between standard Genetic Algorithm and improved Genetic Algorithm.
| Oil Field | Oil Group | Well Seq. | Standard Genetic Algorithm | Improved Genetic Algorithm | ||||
|---|---|---|---|---|---|---|---|---|
| Avg. Gen. | Time (s) | Error | Avg. Gen. | Time (s) | Error | |||
| M-1 | A1-4U | 10 | 68 | 30.2185 | 0.6473 | 24 | 17.3597 | 0.4872 |
| A1-4M | 11 | 72 | 32.8723 | 0.5978 | 17 | 15.4876 | 0.5032 | |
| A2-1 | 10 | 57 | 28.5495 | 0.5841 | 20 | 15.9987 | 0.4658 | |
| A2-2 | 4 | 62 | 25.3593 | 0.6015 | 28 | 16.9581 | 0.4213 | |
| M-2 | A1-1L | 9 | 55 | 29.6584 | 0.5911 | 24 | 14.1156 | 0.4522 |
| A1-6 | 9 | 65 | 31.6987 | 0.6218 | 31 | 15.4456 | 0.4111 | |
| A1-7 | 12 | 58 | 28.3549 | 0.5989 | 25 | 13.8542 | 0.4287 | |
| A2-1U | 7 | 59 | 26.9874 | 0.6017 | 20 | 14.3541 | 0.4054 | |
* This table presents a comparison of the parameter ranges for different oil groups using standard and improved genetic algorithms.
Table 5.
Comparison of Water Saturation Calculations Using Different Methods for M-1 Oil Field Well 2.
Table 5.
Comparison of Water Saturation Calculations Using Different Methods for M-1 Oil Field Well 2.
| Oil Group | Interpreted Well Interval (MD) | SW-OH (%) | SWCO_S2019 (%) (Fan chart method) | SWCO_B2019 (%) (Ratio chart method) | SWCO_S2022 (%) (Fan chart method) | SWCO_B2022 (%) (Ratio chart method) |
| A1-4U | 1331.5-1334.5 | 51.8 | 56.1 | 57.4 | 58.8 | 57.1 |
| 1334.5-1341.1 | 73.4 | 75.9 | 71.8 | 76.6 | 71.8 | |
| A1-4M | 1341.1-1346.2 | 80.1 | 61.1 | 60.9 | 63.4 | 62.9 |
| 1346.2-1350.2 | 70.2 | 74.5 | 68.8 | 74.5 | 77.2 | |
| 1350.2-1352.6 | 31.7 | 60.2 | 61.3 | 68.8 | 66.3 | |
| 1352.6-1354.4 | 30.8 | 61.9 | 59.6 | 66.8 | 64.8 | |
| 1355.1-1359.0 | 39.6 | 73.9 | 77.1 | 77.2 | 77.9 | |
| 1359.0-1362.0 | 37.2 | 82.9 | 80.7 | 84.8 | 87.5 |
Table 6.
Comparison of the logging of Well 2 of the M-1 Oilfield (Ground Stratification - Liquid).
| Year | 2017 | 2018 | 2019 | ||||
|---|---|---|---|---|---|---|---|
| Oil Group | Perforated Well Interval (m) | Layered (%) | Water (%) | Layered (%) | Water (%) | Layered (%) | Water (%) |
| A1-4U | 1320.5-1324.2 | 35.1 | 69.4 | 25.8 | 69.8 | 51.2 | 58.1 |
| A1-4M | 1332.1-1334.6 | ||||||
| 1343.5-1359.3 | |||||||
| A2-1U | 1529.5-1550.4 | 64.9 | 84.6 | 74.2 | 87.6 | 48.8 | 90.0 |
| Total | 100.0 | 79.3 | 100.0 | 83.2 | 100.0 | 87.5 | |
Disclaimer/Publisher’s Note: The statements, opinions and data contained in all publications are solely those of the individual author(s) and contributor(s) and not of MDPI and/or the editor(s). MDPI and/or the editor(s) disclaim responsibility for any injury to people or property resulting from any ideas, methods, instructions or products referred to in the content. |
© 2024 by the authors. Licensee MDPI, Basel, Switzerland. This article is an open access article distributed under the terms and conditions of the Creative Commons Attribution (CC BY) license (http://creativecommons.org/licenses/by/4.0/).
Copyright: This open access article is published under a Creative Commons CC BY 4.0 license, which permit the free download, distribution, and reuse, provided that the author and preprint are cited in any reuse.


