
Submitted:
27 September 2024
Posted:
27 September 2024
You are already at the latest version
Abstract
With the improvement of computer, artificial intelligence, information technology and other technical levels, the relationship between man-machine environment systems is more complicated and diversified. The optimization, iteration and development of the new generation of intelligent equipment system and human-computer interaction interface put forward higher requirements for ensuring the safety of personnel, improving the efficiency of human-computer interaction and improving the efficiency of the system. Such as intelligent cabin adaptive cognitive decision aid system, how to adopt intelligent information display and human-computer interaction, optimize information processing, strengthen situational awareness; How to effectively present information and improve the efficiency of human-computer interaction, so that the system has good security, applicability and maximize its effectiveness; How to deal with man-machine matching and man-machine collaboration problems, so as to improve the efficiency of man-machine/unmanned collaborative work. Human factors throughout the life cycle of equipment systems must be fully considered. The human factor is considered in the system design, so that people, machines and the environment can work together and adapt to each other, so as to achieve benign interaction and feedback between people and equipment and interface and complete the full transmission and communication of human-machine intelligent interaction information. The development of new aircraft human-computer interaction systems combined with new technological methods has also gradually changed the role of pilots and staff. From the system operator gradually into the monitor and decision maker, especially with the improvement of the degree of intelligent flight, information technology, advanced complex airborne equipment is increasing, the amount of information that operators need to deal with is also increasing, and the allowed time for judgment and decision is very short, and the mental resources that pilots bear are gradually rising. As the mental load is a key factor affecting the allocation of cognitive tasks, when encountering emergency situations, the mental load overload caused by the increase of information processing tasks often occurs, which seriously affects the task performance of operators, physical and psychological comfort and flight safety, and thus affects the efficiency and safety of the entire aircraft man-machine system. This requires us to conduct real-time analysis of human-computer interaction situational awareness, especially the individual cognitive state as an uncontrollable factor.
Keywords:
Artificial intelligence
; physiological fatigue
; pilots
; flight safety
1. Introduction
In recent years, Artificial Intelligence (AI) technology has achieved rapid development. As an important branch of computer science, artificial intelligence has been widely used in various fields through advanced methods such as deep learning and big data analysis and has solved many complex problems. In the modern war, the battlefield situation shows a three-dimensional and multi-dimensional development direction, the main task of the pilot gradually shifts from flight control to situation awareness, and the pressure of situation awareness increases sharply. The multi-dimensional situation information and the accelerating rhythm of the battlefield make the mental load of the pilot constantly increase and challenge the cognitive limit of the pilot. In this environment, pilots are prone to cognitive overload, which leads to perception and decision-making errors, affecting the pilot's mission performance. The global promotion and application of this technology marks its important position in modern science and technology.
In order to ensure the safe application of AI technology in aviation, the Federal Aviation Administration (FAA) issued the Roadmap for Artificial Intelligence Safety Assurance in July 2024. It's a 31-page document outlining the U.S. aviation safety regulator's approach to safely integrating new artificial intelligence technologies (AI) in aviation. In addition to ensuring that AI is safe, the FAA also seeks to identify ways that AI can make the industry safer, according to the policy document. This article will provide an in-depth interpretation of the roadmap, exploring the principles, objectives, action plans, and future prospects behind it. As a highly technology-concentrated industry, aviation involves a large amount of data analysis and calculation, so it has become an important field for the application of artificial intelligence technology. The improvement of aviation safety and the optimization of flight efficiency need to be realized by the advanced technology of artificial intelligence. This paper will introduce the basic concepts, technical advantages and specific applications of artificial intelligence in the field of aviation and provide references for researchers in related fields. The effective integration of human-machine intelligence depends on the real-time monitoring and adjustment of the pilot's status, so a comprehensive understanding and monitoring of the pilot's ability status is the basis for the realization of intelligent cockpit.
In this paper, the pilot fatigue state as the starting point, combined with theoretical analysis and empirical research, flight fatigue monitoring technology and its relationship with situational awareness. A multimode flight fatigue measurement method combining ECG and eye indexes is proposed. Based on the analysis of the characteristics of cabin environment and physiological measurement technology, the study of physiological index extraction and analysis methods, combined with the simulation flight empirical experiment, the method improves the reliability of the measurement process through multi-mode fusion, and can be used to achieve lightweight and non-invasive flight fatigue detection. Through the analysis and testing of these technologies, the aim is to provide scientific risk mitigation strategies for aviation safety and promote the technological progress and application development in related fields.
2. Related Work
2.1. Artificial Intelligence AIDS the Aviation Industry
In recent years, the rapid development of AI technology has brought unprecedented innovation potential to the aviation sector. From offline applications to process control to aircraft autonomous flight, AI technology has shown strong application prospects. However, since AI systems often achieve their performance through learning rather than traditional design methods, this makes them a huge challenge in terms of security assurance. Traditional aviation safety assurance techniques are based on the designer being able to fully explain every aspect of the system design, but this approach does not apply to AI systems. Therefore, how to ensure the safety application of AI in aviation has become an urgent problem to be solved. In developing the AI roadmap, the FAA consulted with industry officials and other regulators, including the European Aviation Safety Agency (EASA), which published its first AI roadmap in 2020. In May 2023, EASA published a revised and expanded AI Roadmap 2.0, and this year the agency published a concept paper that provides new guidelines for companies looking to certify AI systems. The FAA, in its version of the AI roadmap, lays out a set of core principles that will guide its approach to developing AI safeguards.
Figure 1.
EASA published a revised and expanded AI Roadmap 2.0.
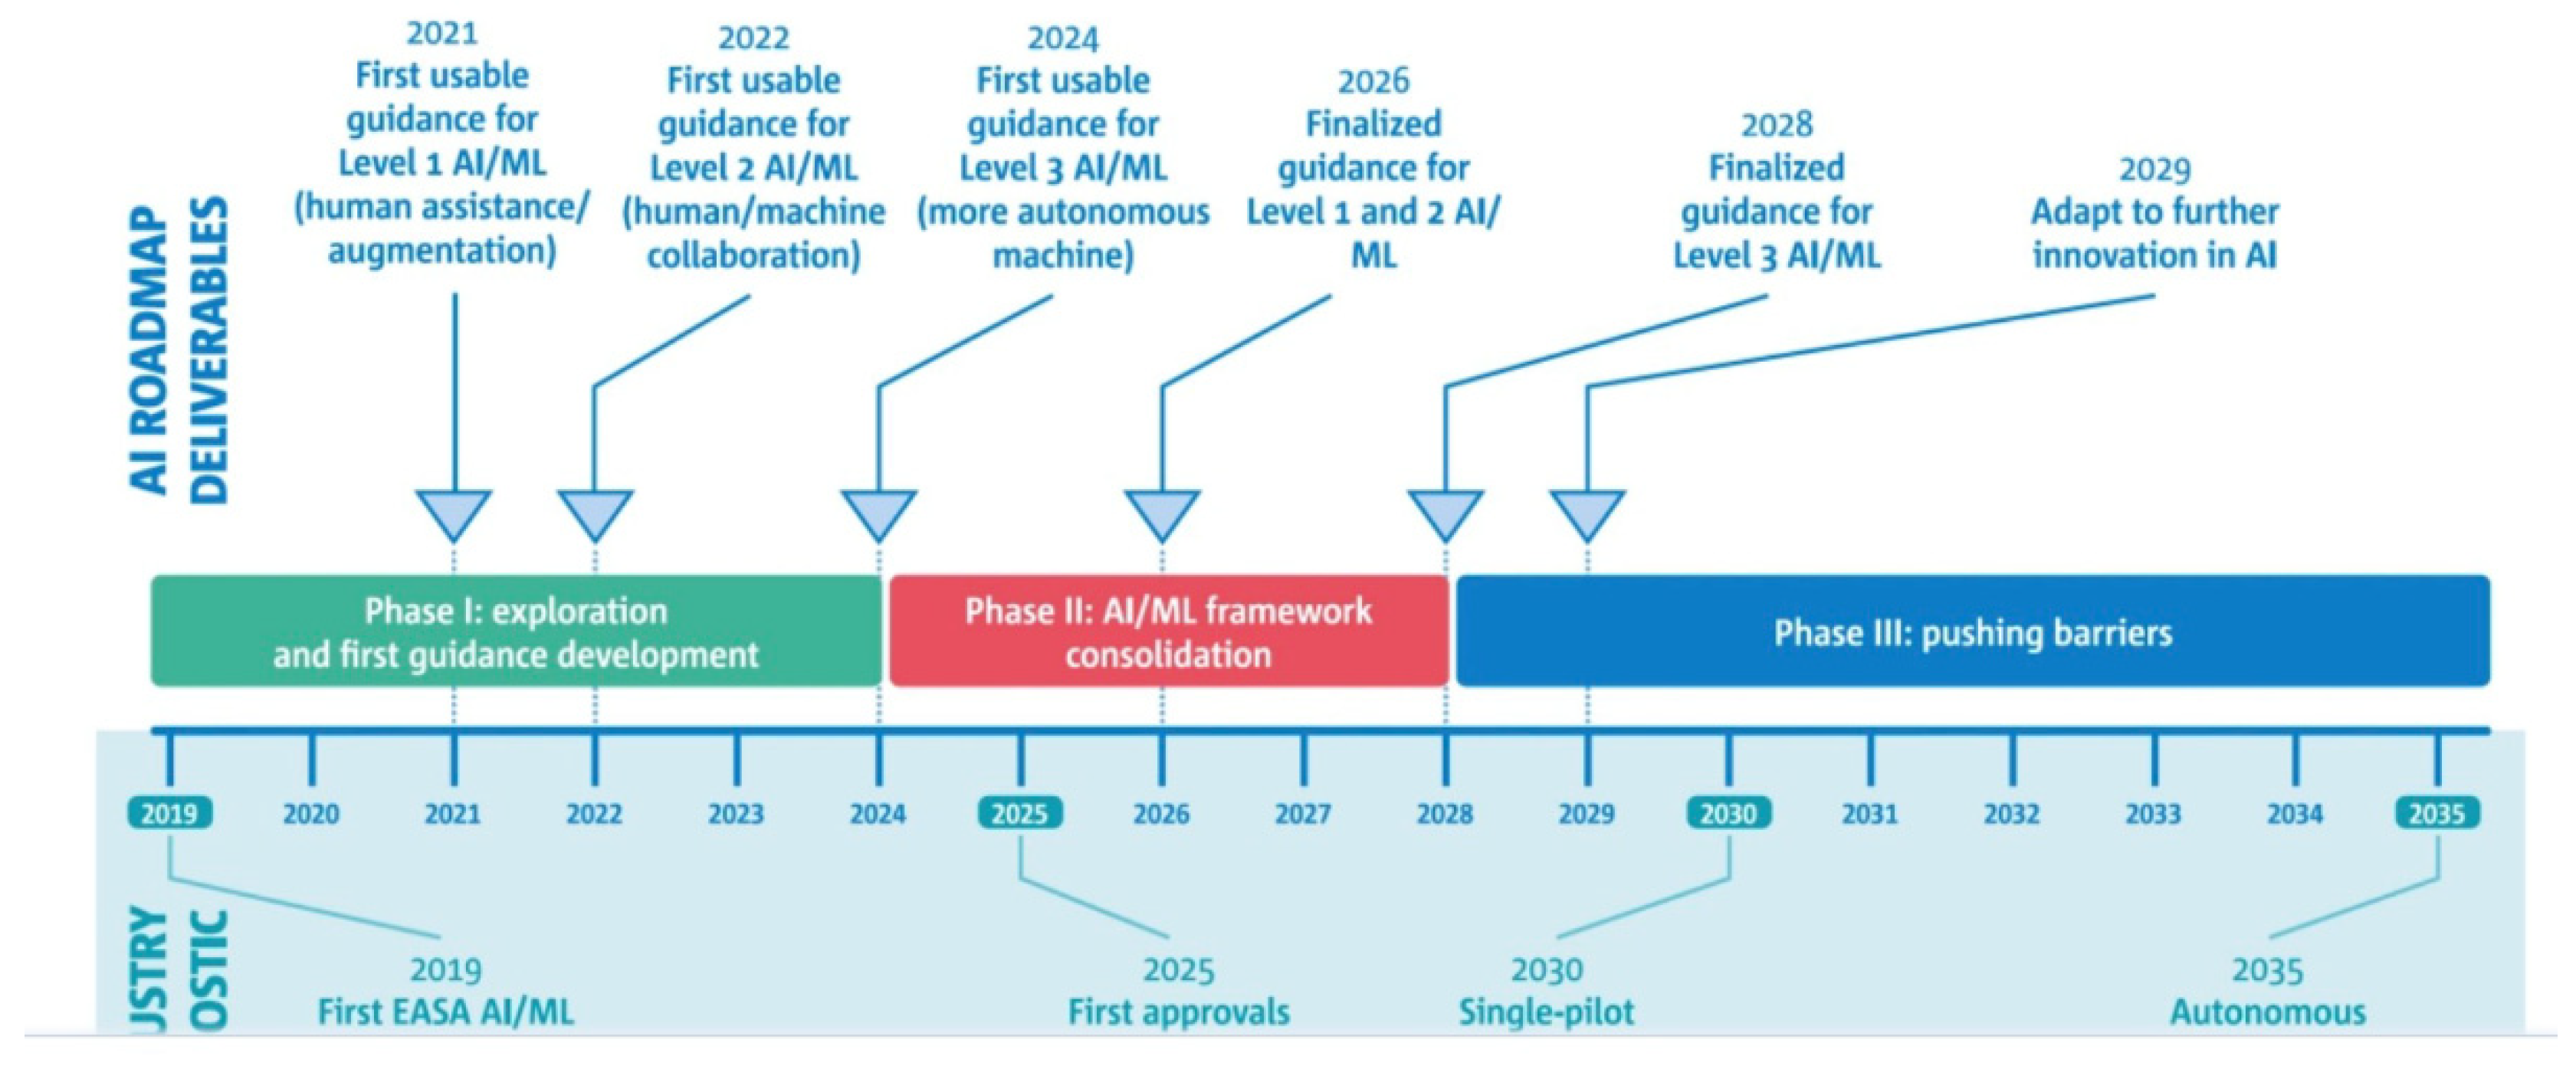
For example, it recommends that regulators leverage existing aviation safety requirements and take a step-by-step, safety-focused approach to implementing AI, starting with risk-reduction applications such as pilot assistance systems to reduce workload and crew numbers. The document also identifies some of the key actions that must be taken to enable the safe use of AI and the use of AI to enhance security. These actions include working with industry and government agencies to educate and train FAA employees on AI technologies, as well as conducting ongoing research to evaluate the effectiveness of its approach to safety assurance. The difference between EASA and FAA in the roadmap is the ethical considerations. The FAA document states that "the ethical use of AI is outside the scope of this roadmap," while EASA writes in its version that "the responsible, ethical, social, and social dimensions of AI should also be considered."
Figure 2.
Safety Agency (EASA) is pleased to announce the release of a 260-page report as part of his research project MLEAP.
Figure 2.
Safety Agency (EASA) is pleased to announce the release of a 260-page report as part of his research project MLEAP.
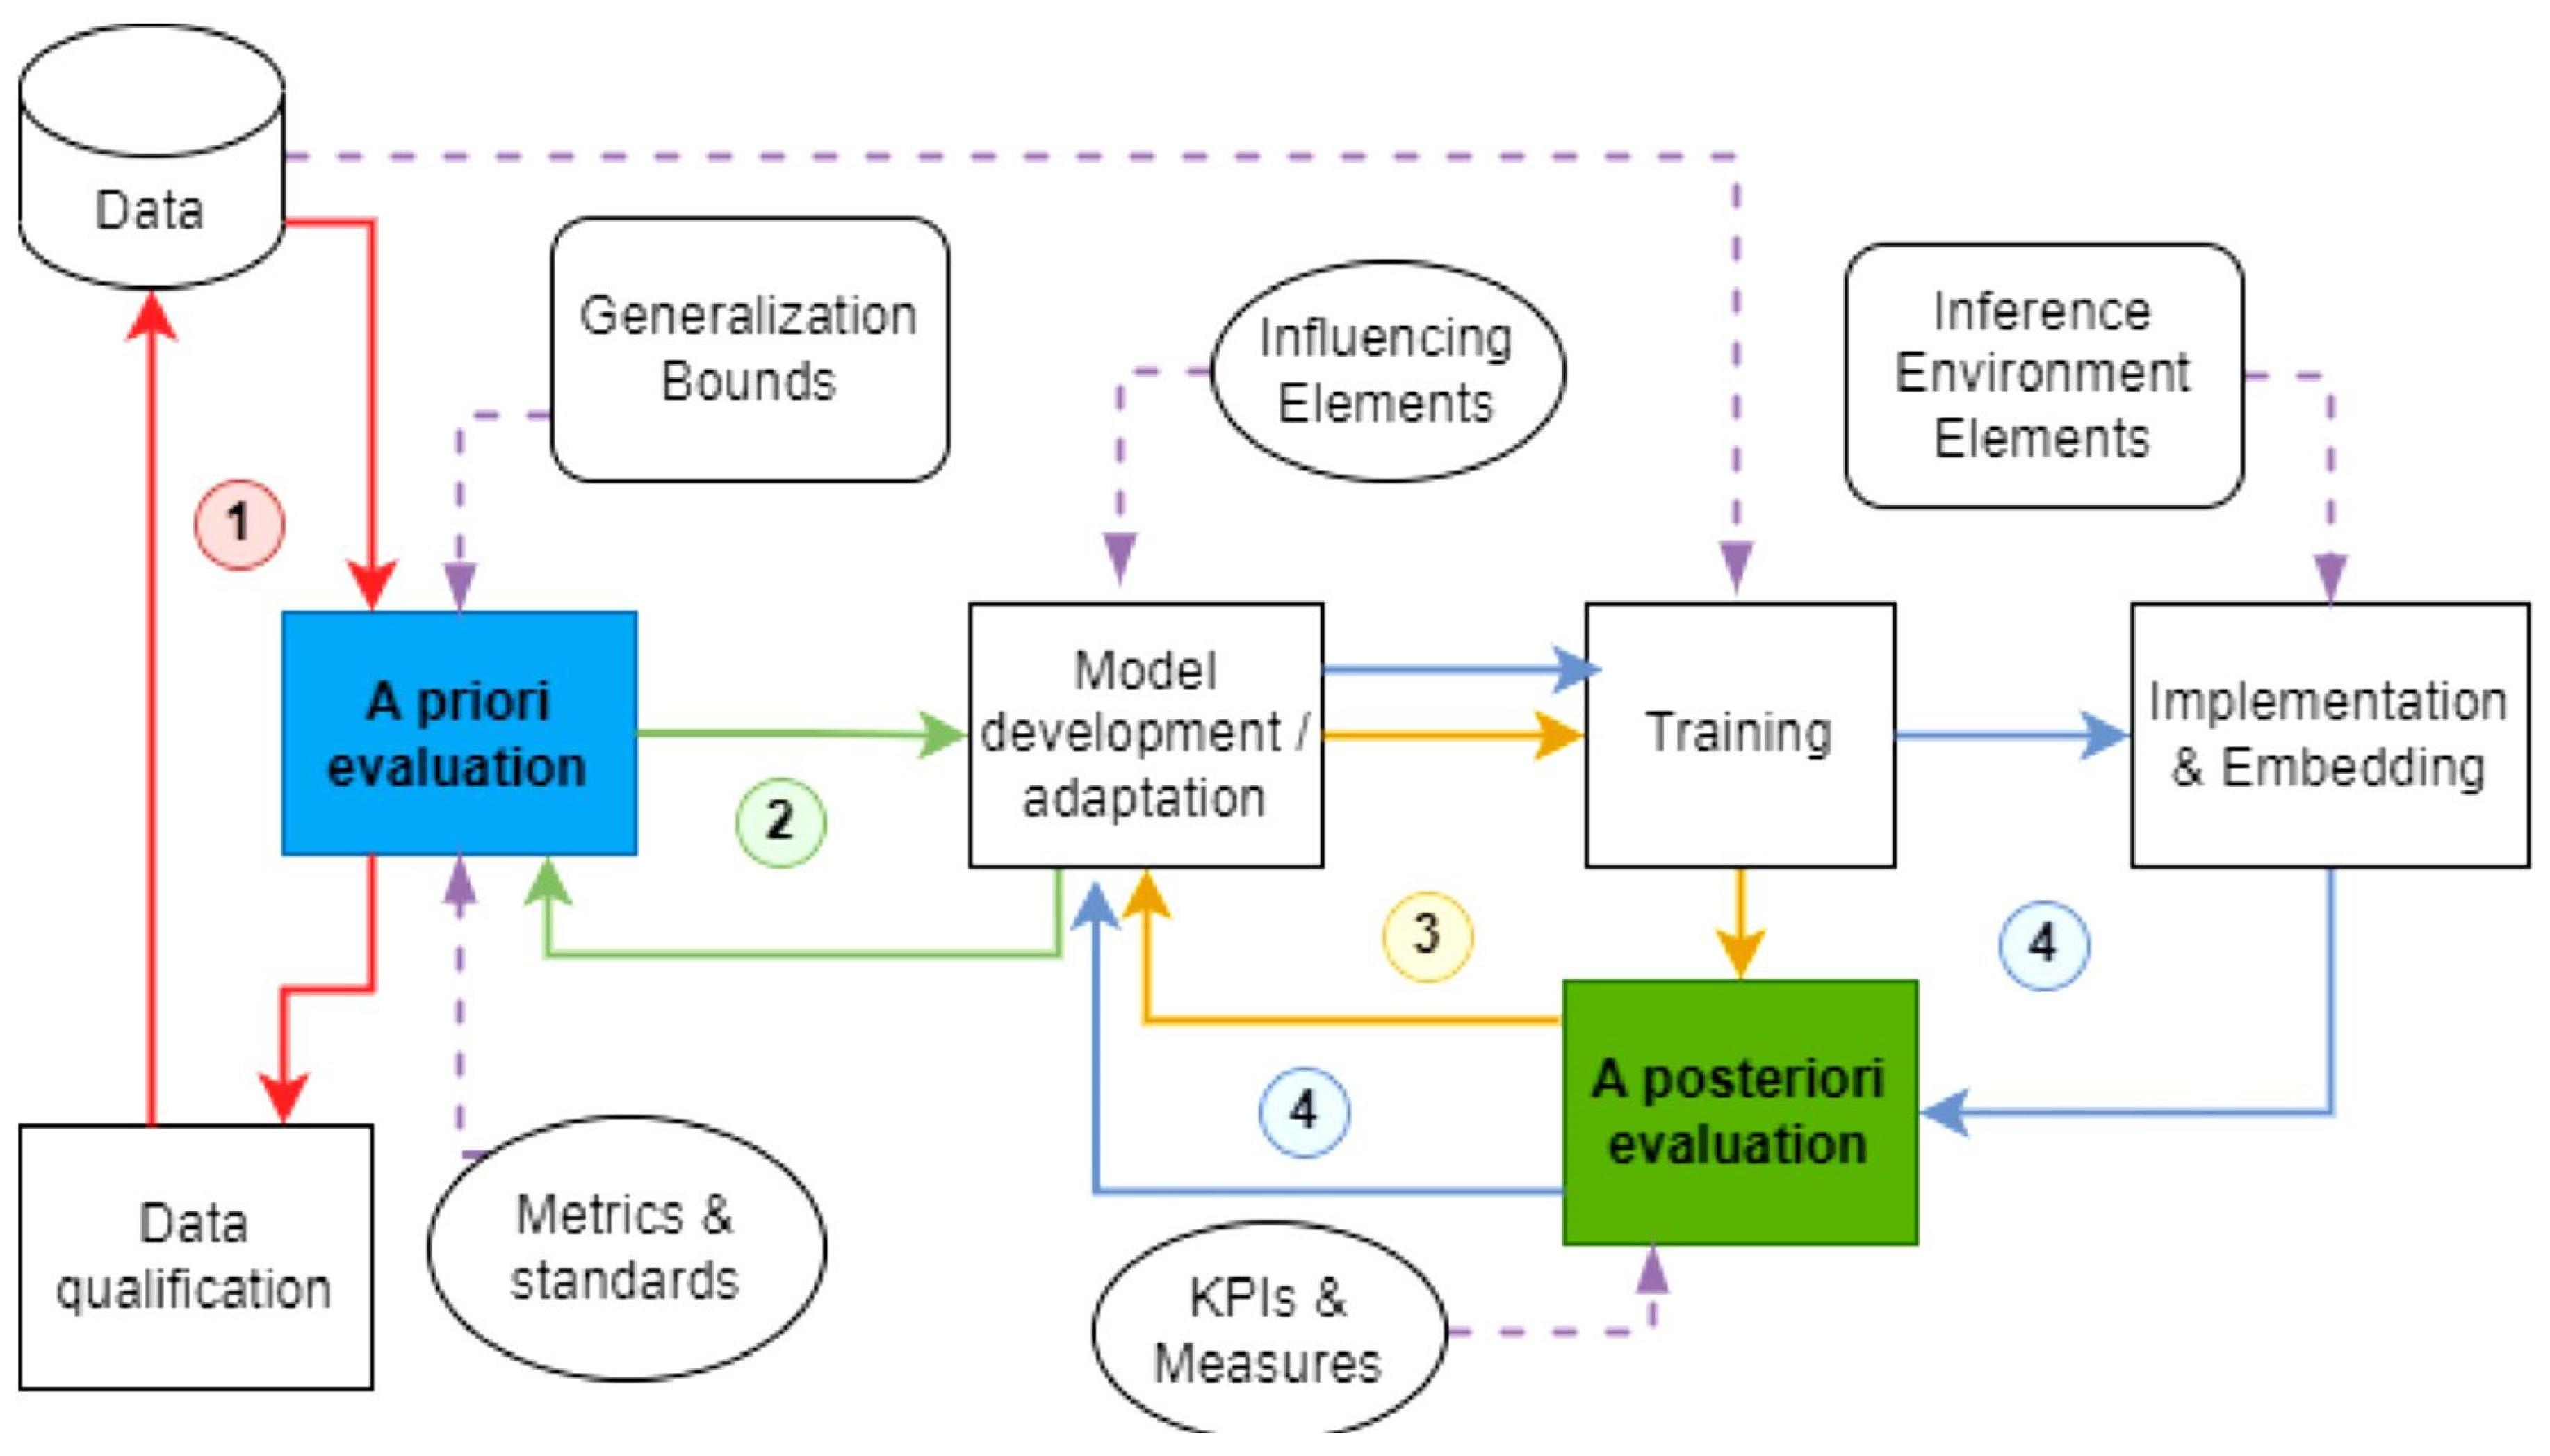
According to EASA (Figure 2), ethical guidelines are essential to ensure the credibility of AI and to gain social acceptance for the aviation sector and AI in general. While the FAA's roadmap does not directly provide any ethical guidance, the document refers to recent legislation addressing this issue, including President Joe Biden's October 2023 Executive Order 14110 (" The Safe, Secure, and Trusted Development and Use of Artificial Intelligence "). "This roadmap has been developed within a broader, evolving national framework to establish norms for the safe, secure, and trusted development and use of AI, including, where appropriate, the adoption and regulation of AI across the federal government," the FAA document states. EASA's roadmap anticipates a timeline for the various phases of AI adoption, starting with pilot assistance and human-machine collaboration this decade and reaching the market for fully autonomous commercial airliners around 2050. However, the FAA's roadmap does not speculate on the pace of AI adoption or the timing of any AI-related milestones. Both the FAA and EASA consider their respective roadmaps to be "living documents" that are regularly updated by the agencies as AI technology advances.
2.2. Traditional Pilot Fatigue Monitoring Technology
Flight fatigue is a physiological state that affects the cognitive function and operational performance of pilots. Monitoring flight fatigue can detect the deterioration of pilots' abilities in time, and take appropriate countermeasures to maintain pilots' mission performance and reduce the risk of flight accidents. Domestic and foreign studies have proposed many effective flight fatigue monitoring technologies, mainly based on EEG, electrocardiogram or eye tracking technology for real-time evaluation of pilot fatigue state.
A large number of studies have found that EEG can achieve accurate flight fatigue monitoring. Eeg signals are highly sensitive to people's alertness and cognitive state and are known as the "golden indicator" of fatigue and alertness. Wu et al. combined four types of fatigue indicators extracted based on EEG power spectrum features and a deep sparse shrinkage self-coding network capable of learning more local fatigue features to realize automatic classification of flight fatigue states in simulated flight environments. Through comparison, it was found that the classification performance of its model was superior to some other common classification models. Sauvet et al. realized fatigue automatic classification based on single EEG channel by combining the automatic classification algorithm and the mean value characteristics of EEG alpha wave, beta wave and theta wave components, aiming at the low alertness fatigue state generated during long-term flight. Liu et al. (2024) investigate the use of machine learning techniques to predict dangerous flight weather conditions. Their study emphasizes the integration of diverse machine learning models to enhance the accuracy and reliability of weather forecasts essential for flight safety. The researchers utilize historical weather data alongside real-time atmospheric measurements to train predictive models capable of identifying hazardous weather patterns. By employing advanced algorithms, their approach offers improved predictive capabilities compared to traditional meteorological methods. This research highlights the potential of machine learning to provide more accurate and timely weather predictions, thereby aiding pilots in making better-informed decisions and mitigating the risks associated with adverse weather conditions during flights.
Qiu Xuyi et al. proposed a convolutional neural network model based on Gauss Newton online variational method, which can achieve flight fatigue classification ability superior to other deep learning models based on pilot brain power spectrum features. Luo Yingxue et al. built fatigue state index and Gamma deep belief network based on EEG instantaneous frequency domain information to achieve accurate identification of flight fatigue state.
Several studies have confirmed the feasibility of ECG based flight fatigue monitoring. Cheng et al. conducted a sleep deprivation experiment on 137 trainee pilots for up to 40 hours, combined with a number of physiological measurements including electrocardiogram, and found that the time domain and frequency domain indexes of heart rate variability were significantly correlated with pilots' subjective mental fatigue scores, providing direct evidence for the correlation between electrocardiogram indexes and pilot fatigue. In addition, several other studies have found that ECG indicators can reflect the workload and stress levels of pilots, providing indirect evidence for the correlation between ECG and flight fatigue.
For example, Alaimo et al. studied the operational error index subjective workload index and heart rate variability index of 23 professional pilots during takeoff and landing stages of simulated flight, and found the complex nonlinear relationship between heart rate variability index and pilots' subjective workload, and proposed that heart rate variability is an ideal index for real-time monitoring of pilots' workload. In their study, Liu et al. (2024) explore the application of Back Propagation Neural Networks (BPNN) for predicting flight accidents. The authors develop a predictive model that leverages historical accident data to identify patterns and factors contributing to flight accidents. By analyzing various flight parameters and operational conditions, their BPNN-based approach aims to enhance the predictive accuracy of potential accident scenarios. The study demonstrates the effectiveness of neural networks in processing complex datasets to forecast risks and improve safety measures. This research underscores the value of integrating neural network techniques into aviation safety protocols, offering a data-driven approach to accident prediction and risk management.
Mansikka et al. analyzed the ECG indicators and task performance of fighter pilots when they performed simulation flight experiment tasks with different task requirements and found that heart rate variability and heart rate indicators were sensitive to task demands and workload and could detect changes in pilot workload before performance deteriorated significantly. By analyzing the changes of heart rate variability when pilots perform different task difficulty simulated flight tasks in flight simulators, it is found that both time domain and frequency domain indexes of heart rate variability can reflect the task pressure of pilots, and pilots perform better when the pressure is light.
2.3. Fatigue Evaluation Method Based on Subjective Scale
Subjective fatigue or sleepiness is the main form of mental fatigue, so analyzing the operator's subjective fatigue is an effective fatigue evaluation method. The quantification of subjective fatigue feelings usually relies on the fatigue scale, which requires the operator to score the overall fatigue level or the further subdivided fatigue related function level according to the evaluation mechanism corresponding to the scale. The score can be further used in the analysis and evaluation of the fatigue state of the operator. Because of the variety of fatigue scales
In this paper, the following four most representative scales are sorted out and selected for further analysis. (1) The Stanford SleepinessScale (SSS) is a simple and easy to use subjective fatigue evaluation scale, which focuses on evaluating the operator's mental state from two perspectives of sleepiness and alertness. The scale includes 7 grades ranging from 1 to 7. The higher the score, the stronger the subjective fatigue feeling. Each score corresponds to a paragraph describing the corresponding fatigue representation. For example, the corresponding of a score of 1 is described as "energetic and alert", and the corresponding of a score of 7 is described as "about to fall asleep and have a feeling of dreaming".
(2) the karolinska sleepiness scale (KarolinskaSleepinessScale, KSS) dimension and Stanford sleep scale are similar, are focused mainly on alertness and drowsiness feel [8]. The difference with the Stanford sleepiness Scale is that the scale is more finely graded, divided into 9 scales ranging from 1 to 9. For example, a score of 1 corresponds to "extremely alert" and a score of 10 corresponds to "extremely sleepy and unable to stay awake."
Figure 3.
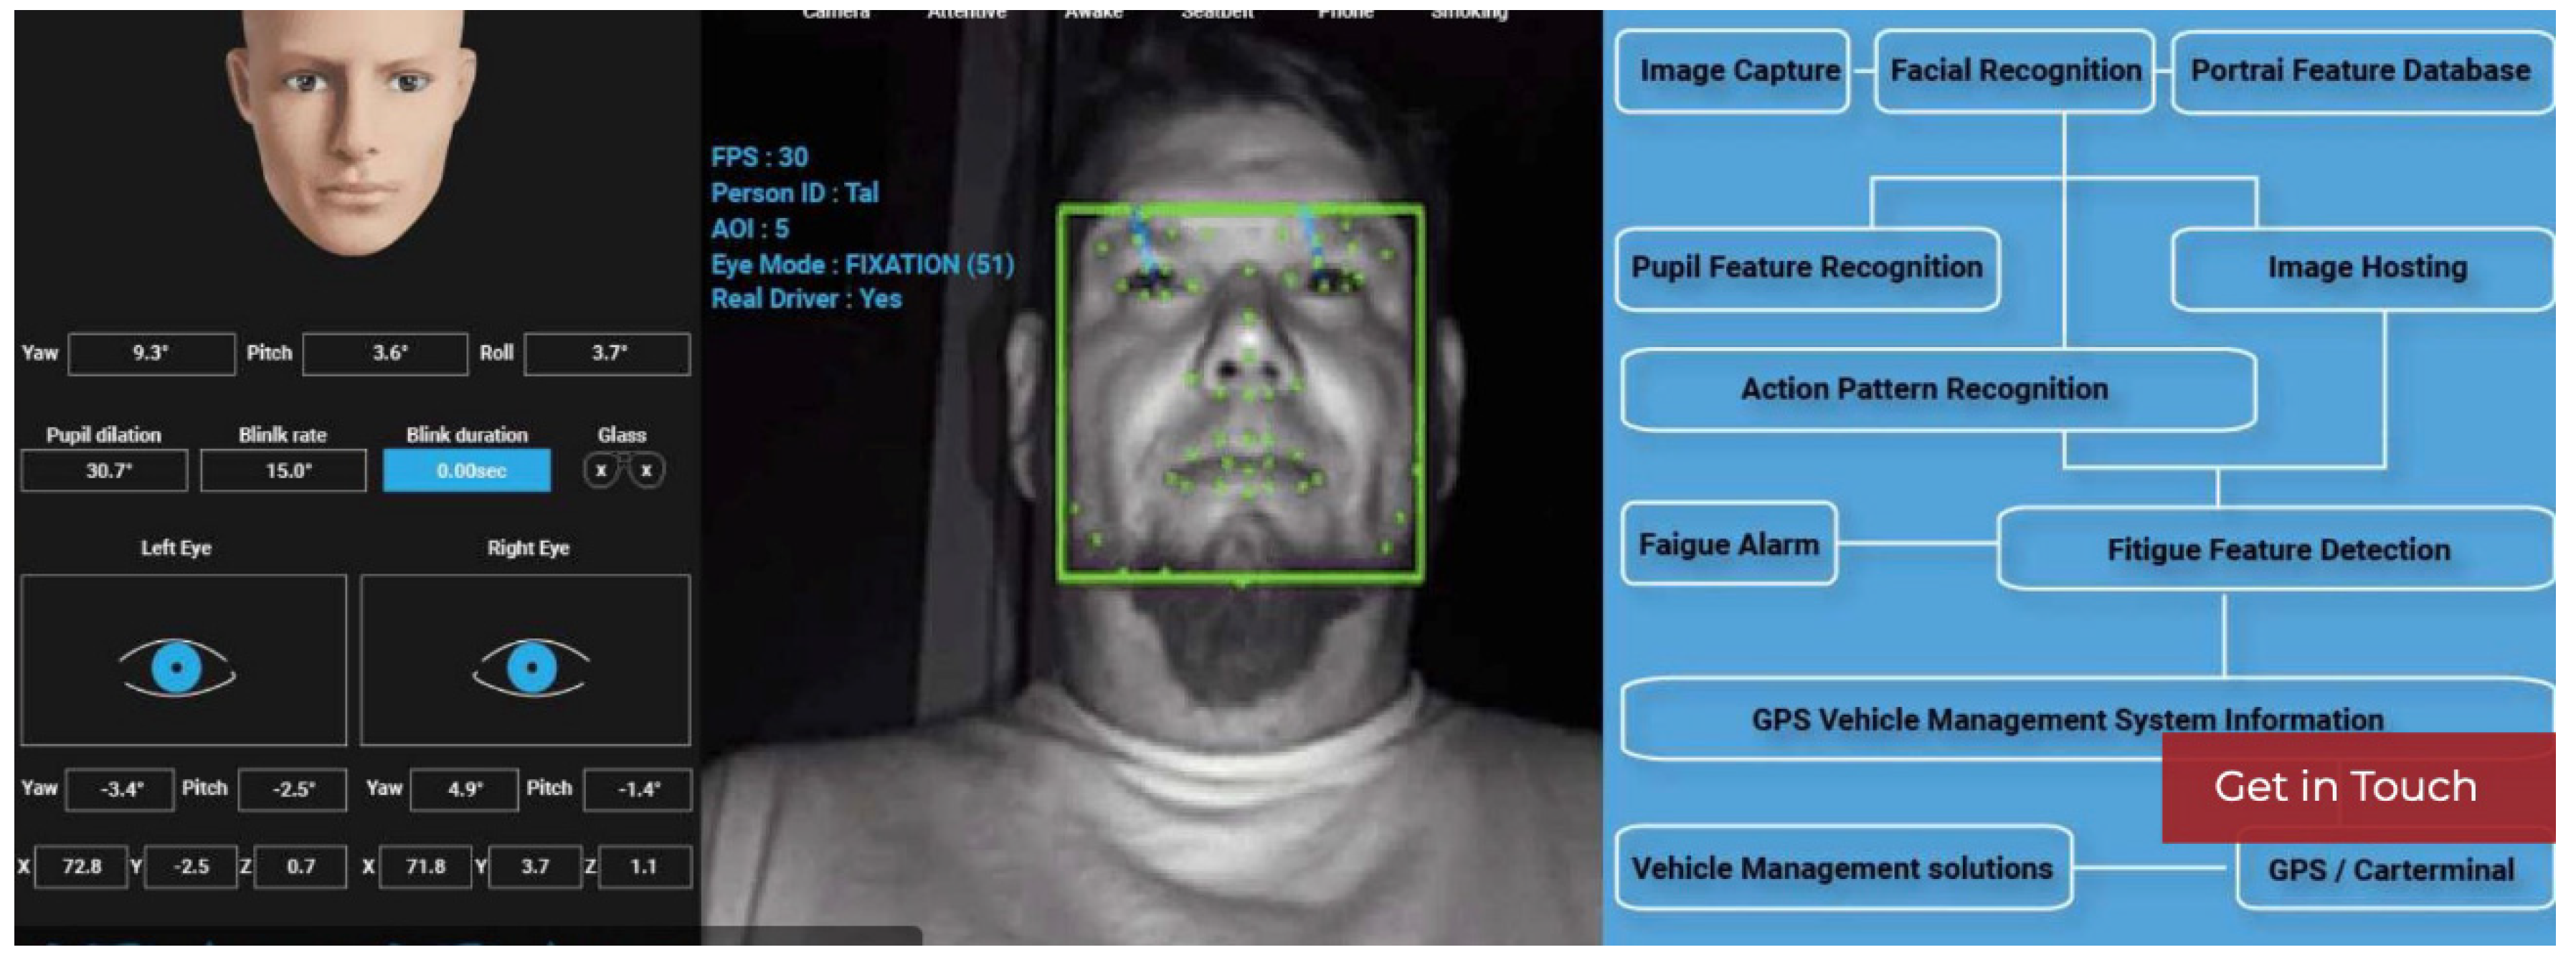
Driver sleepiness monitoring framework.
(3) Sam-Perellifatiguescale (SPF) is a subjective scale consisting of 7 evaluation scales ranging from 1 to 7 points. It was created by two researchers, Sam and Perrelli. At the beginning of its creation, it was designed to evaluate the fatigue feelings of aircraft crew members under different work and rest conditions. The main difference between this scale and the above two sleepiness scales is that the text description of different fatigue score levels in this scale is more oriented to the overall fatigue feeling of the operator, rather than only for alertness and sleepiness.
(4) The visual analog scale (VAS) is usually presented in the form of a long line, only the first and last ends are marked with the corresponding fatigue state of the text description, respectively, representing the weakest and strongest fatigue feeling, operators need to mark their current fatigue degree based on their own feelings in the appropriate position on the line 40]. For example, one end of the line is marked 0, indicating no fatigue at all, the other end is 10, indicating extreme fatigue, and the middle part indicates different degrees of fatigue. The advantage of visual analog scale is that its implementation process is very convenient and it has high internal validity.
The evaluation mechanism and applicable scope of different scales are different. The Karolinska sleepiness Scale and the Stanford Sleep Scale are suitable for evaluating the sleepiness oriented fatigue state, while the Sam Perrelli fatigue scale and the Visual Analog Scale are more suitable for evaluating the tiredness oriented fatigue induced by work tasks, which is more consistent with the fatigue state concerned in this study. However, it is not feasible to rely on subjective scales for real-time monitoring of flight fatigue, because all subjective scales can only be implemented with the participation of subjects themselves, which will cause certain interference to the task at hand. Moreover, the subjective measurement can not be carried out in real time, which may cause the fatigue monitoring is not timely. Therefore, this study will use the subjective measurement results as the evaluation basis to test other fatigue monitoring techniques that are more available.
2.4. Fatigue Evaluation Method Based on Physiological Measurement
Physiological measurement refers to the evaluation of the fatigue state of the operator based on the physiological data of the human body and its mapping relationship with the fatigue level. The advantage of physiological measurement over subjective or performance evaluation is that it is not only sensitive to fatigue, but also that its implementation can be performed automatically by the system without operator involvement. For example, the DDREM safety system that has been put into use by Hyundai Motor Company monitors the fatigue state of drivers based on eye data. At present, the commonly used fatigue physiological measurement techniques mainly include electroencephalogram, electrocardiogram and eye tracking.
(1) Electroencephalography (EEG) is widely regarded as the "gold standard" for evaluating driver and pilot fatigue. The application of EEG technology in the field of human factors originated from a 1930 study by Berger et al. [44], who reported significant differences in EEG signals during mental activities and resting states. Subsequent studies further confirmed the high correlation between EEG and mental states such as mental activity, alertness and emotion, and frequently appeared in fatigue monitoring studies in flight, driving and other operational fields. Eeg technology mainly records the voltage changes generated by the ionic current of neurons during brain activity through a physiological electrode attached to the surface of the scalp, via Delta waves
Sita wave, alpha wave and beta wave are the characteristics of the brain wave segment to analyze the state of human mental activity. (2) Electrocardiography (ECG) is a very important fatigue evaluation technology, which generally detects physiological voltage changes caused by heartbeat activity through physiological electrodes placed on the skin surface. Ecg technology originated in the 19th century as a standard measurement tool for assessing a patient's condition. As time goes by, more and more studies begin to pay attention to the correlation between ECG and mental states such as workload and mental fatigue [45], and a large number of mathematical methods have been introduced to analyze the dynamic rule of heartbeat activity. At present, a large number of research reports in the field of neurophysiology have demonstrated the sensitivity of ECG indicators, including heart rate and heart rate variability, to mental fatigue of workers! . In addition, ECG measurement has attracted more and more attention because of its advantages of convenience and high efficiency.
(3) EyeTracking (ET) studies changes in central nervous system function by measuring changes in eye and visual system function, and then reflects changes in individual alertness and cognitive status. There are a variety of measurement methods, mainly based on the method of machine vision through the camera to collect eye images, and the application of image recognition algorithm to extract eye dynamic indicators. Eye tracking indexes commonly used in fatigue evaluation include blinking, eyelid closure, pupil diameter, saccade and fixation. Due to the excellent detection validity and non-invasive features of eye tracking technology, a number of eye tracking systems have been developed to monitor the operator's functional status, such as the Co-Pilot system for eyelid closure monitoring and the Optalert system based on blink characteristics monitoring.
3. AI Based Fatigue Monitoring Systems for Fighter Pilots
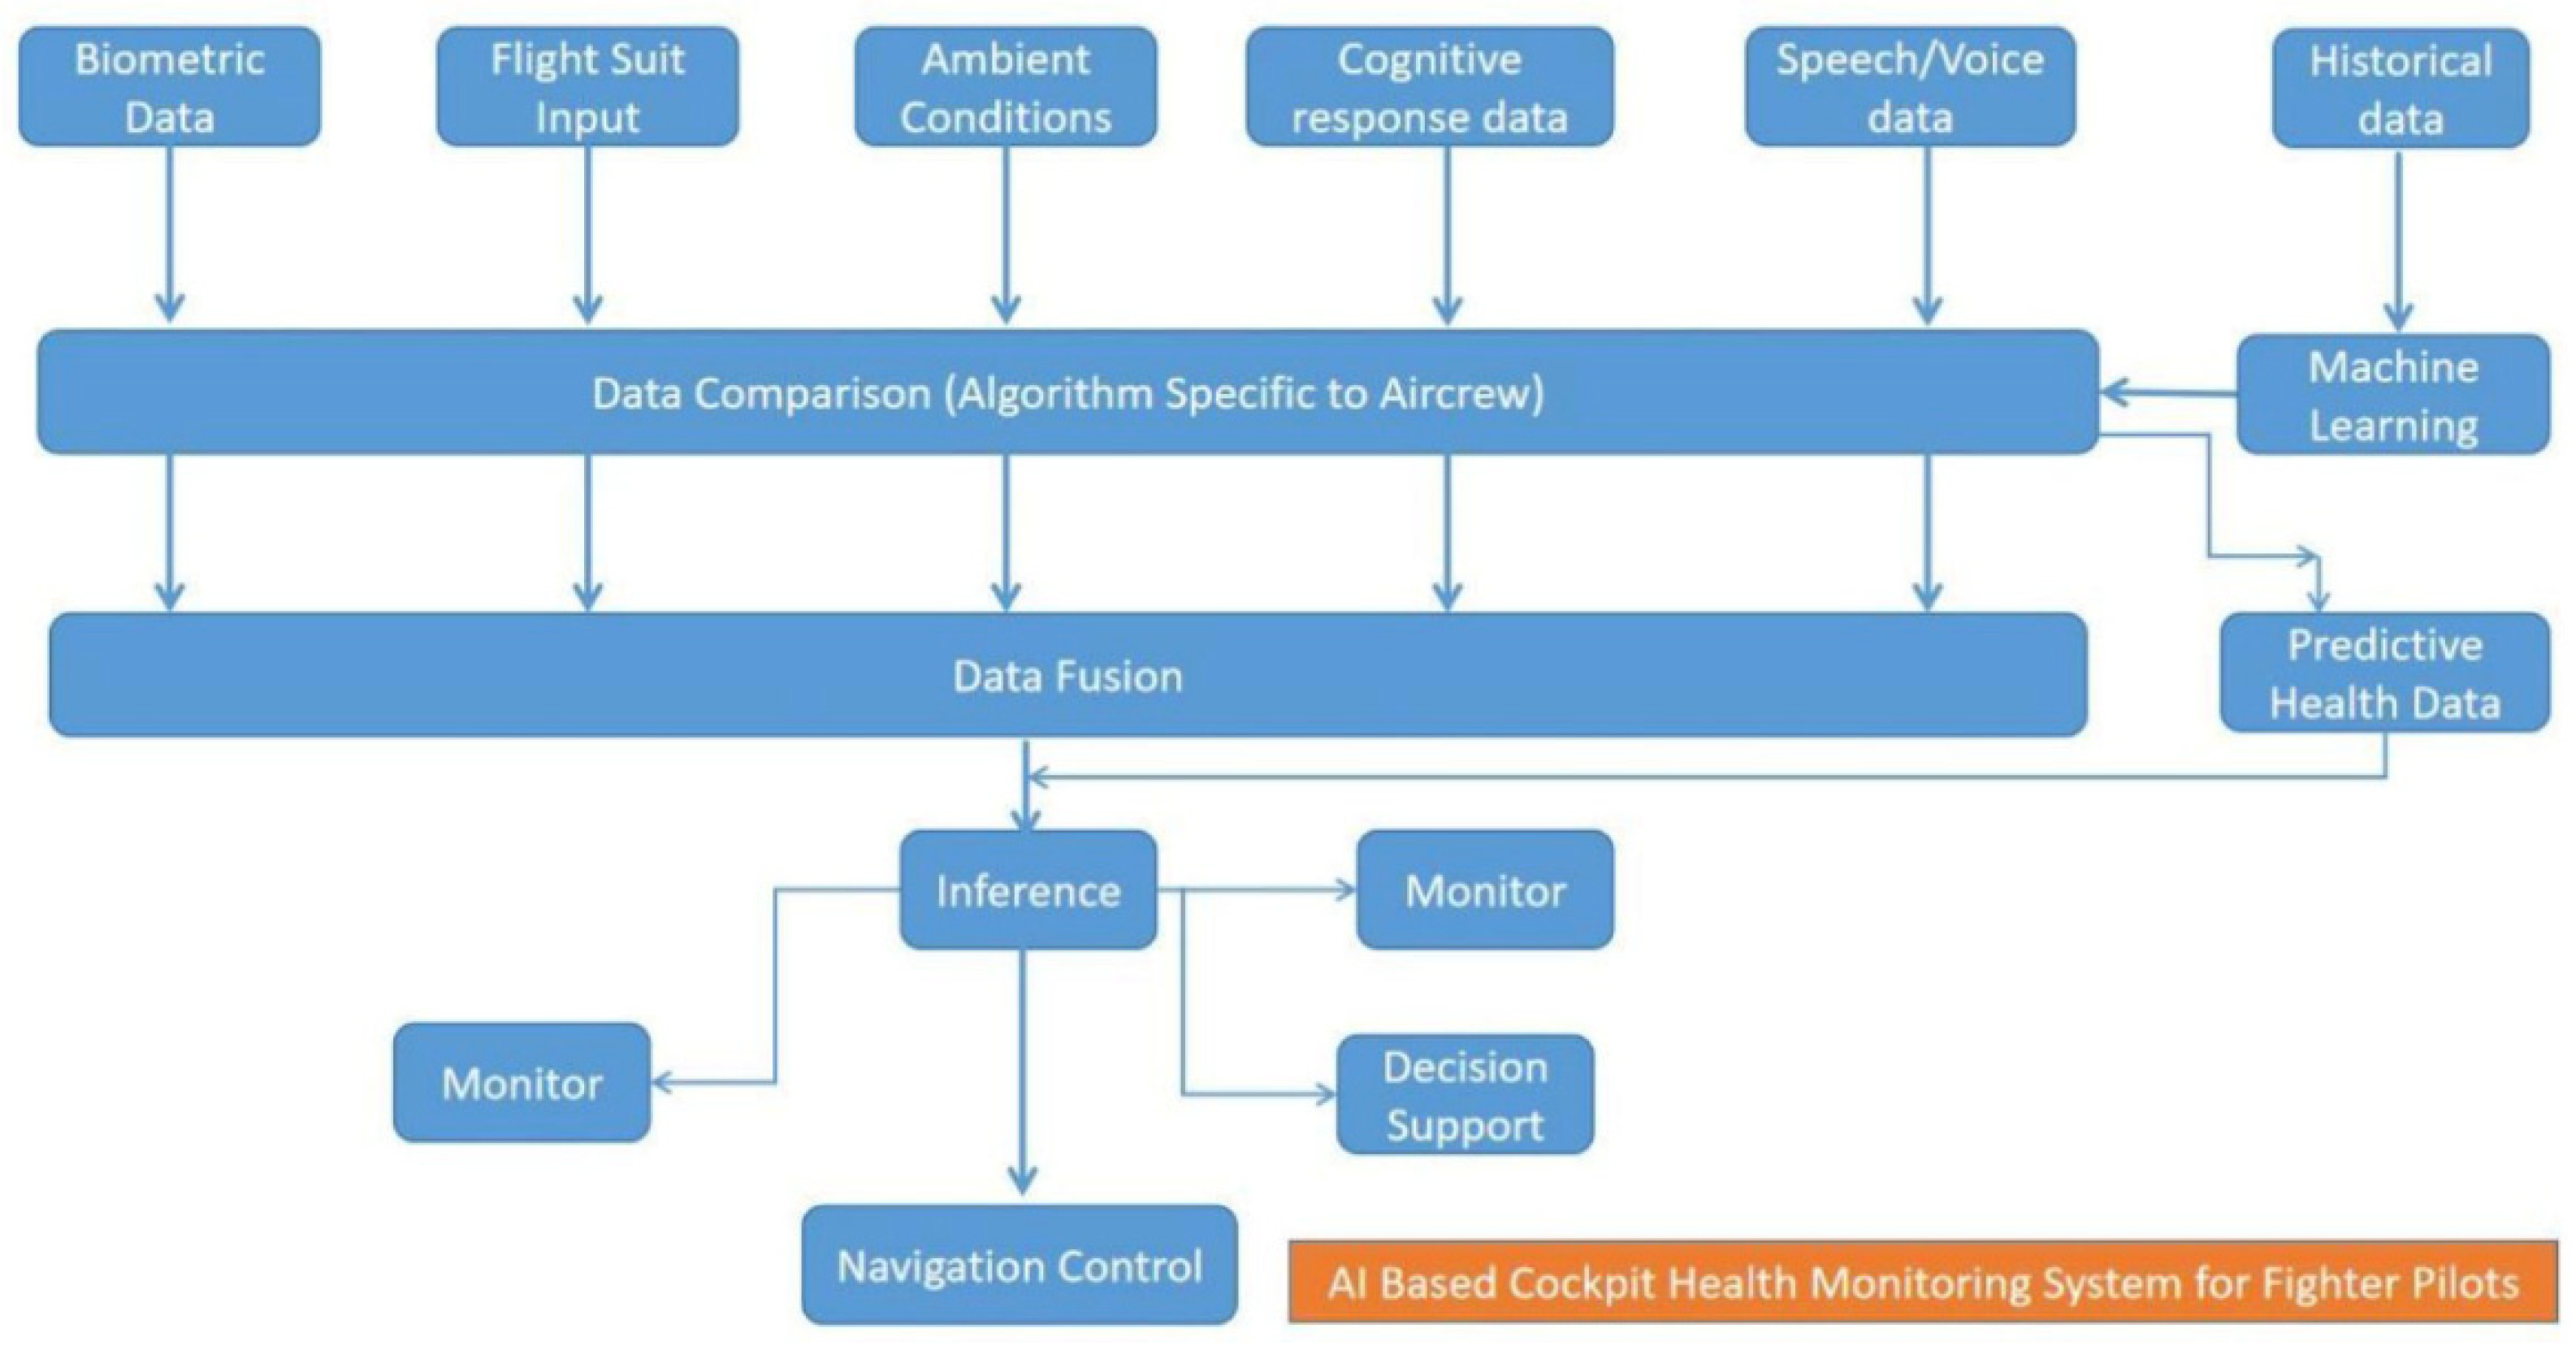
The fatigue level of fighter pilots seated in aircraft cockpits is a very critical factor for combat missions. Timely response can negate unpleasant G-LOC incidents. The AI based aircrew fatigue monitoring could help aircrew to circumvent the situation towards achieving flight safety. This cognitive system can be designed as a cockpit-centric one or a ground based autonomous system supported by distributed databases and edge computing. Even medical specialists and airworthiness certification engineers can be kept in the loop along with the operational commander in controlling the aircraft mission. Safe recovery of the aircraft can be done in an autonomous mode if the pilot experience a G-LOC. Such overrides could keep the aircrew safe and help the safe recovery of aircraft.
3.1. Wearable Biometric Sensors and Smart Flight Gear
Today, wearable mission suits with integrated sensors are very common. By wearing biosensor devices, the crew's heart rate, blood pressure, oxygen levels and body temperature will be monitored in real time. By using algorithms, we can analyze biometric data patterns and detect anomalies or signs of stress, fatigue or dehydration during flight. This will help aircrews and ground controllers aid decision-making during combat missions and under extreme stress conditions. We can implement AI-driven analytics to assess the physical condition of fighter pilots during flight, considering gravity and other factors that trigger stress. Every crew member's health is different, so the (machine learning) ML and algorithms relevant to each crew member may be unique.
3.2. Cockpit Environmental Condition Sensor
In addition to biometric sensors, the environmental conditions in the cockpit are equally important, as they can affect the health of the crew. Environmental sensors installed in the cockpit measure cabin pressure, temperature and humidity for comprehensive analysis. Ai can correlate environmental data with pilot health metrics to give a comprehensive read on a pilot's health in real time.
3.3. Cognitive Performance Monitoring
The alertness and response of the crew to various situations needs to be measured and monitored simultaneously. Ai can assess real-time cognitive performance by analyzing neural signals or monitoring eye movements and reaction times. We can implement machine learning models to detect changes in the crew's cognitive response that could indicate fatigue or stress. A similar analysis can also be performed before a crew member enters the cockpit for medical treatment. A computer vision system that tracks eye movements and blinking patterns would certainly be helpful in understanding the alertness level of the flight crew.
3.4. Flight Crew Voice/Sound Analysis
The language of the crew can also be analyzed to find out the level of fatigue. By applying natural language processing (NLP), a pilot's speech patterns and voice can be analyzed to identify signs of stress or fatigue, and the system can give early warnings of health conditions. Artificial intelligence systems that can provide real-time feedback or alerts based on changes in voice features and patterns.
Figure 4.
Fatigue state based on voice/voice analysis of flight crew.
3.5. Predictive Health Analysis
Every possible disaster can be predicted by teaching the AI system the history of past events/events. We can easily implement predictive modeling using AI to predict potential health issues or fatigue-related issues before upgrading. Taking into account factors such as sleep patterns, previous flight data, pre-flight food or drink, family/personal issues, and the overall health history of the crew, an accurate prediction can certainly be made. Integrating the AI system with the crew scheduling system and taking into account factors such as circadian rhythms, sleep patterns and workload distribution will make the system more robust.
3.6. Emergency Response System
If the AI-based crew health monitoring system is integrated into the onboard external communication system, the system can automatically trigger an emergency response to crew health and initiate communication with ground control. We can also implement features such as ground reporting of abnormal health parameters and other health emergencies. And through HMI, well-designed HMI will promote intuitive and user-friendly interfaces that enable pilots to easily access and interpret their health data. Use AI to provide personalized advice to maintain optimal health and supplement data as needed to the various command formations and aircrews stationed at the base. A well-designed user interface will help the crew make logical decisions at critical moments. A similar user interface can be replicated to a ground control center to act in an emergency.
3.7. Integration with Flight Navigation Systems
Integrating the health/fatigue monitoring system with the avionics of the fighter aircraft in real time will be a challenging task. Upgrading the fatigue monitoring system to a decision support system and then to a control system to navigate the aircraft safely to recovery/landing in autonomous mode in the event of a medical emergency is one of the most popular features. The use case is currently available for many autonomous military UAVs. During flight, maintaining the stability of the aircraft and fail-safe within the flight envelope becomes the responsibility of the system. Combined with pilot privacy concerns, there is a need to establish the security of AI systems by providing the necessary encryption for data exchanged between ground stations and aircraft in the electromagnetic spectrum. Sensitive health data collected from pilots is sometimes kept secret. We can implement robust encryption standards and data protection regulations at the development stage to ensure flight safety.
3.8. Artificial Intelligence Unit Feedback Integration
Reinforcement learning (ML) is recommended for many military applications to continuously improve established AI systems. We need to collect feedback from the crew on a regular basis to improve and refine the existing AI algorithms. User experience and input are valuable for improving the effectiveness of the system. Due to existing flight safety regulations, obtaining permission to operate an AI-integrated system will be challenging. The extent to which the DGCA/CEMILAC (supervisory body) can approve the transfer of decision-making power from humans to machines is yet to be ascertained. Ai-based fatigue monitoring systems need to ensure compliance with all aviation regulations and standards.
4. Conclusions
In combination with technologies such as artificial intelligence and machine learning, implementing a crew fatigue monitoring system will not only improve the accuracy and efficiency of monitoring, but also bring a range of far-reaching benefits. Artificial intelligence and machine learning techniques were able to process and analyze large amounts of physiological and behavioral data from the flight crew in real time. These data include heart rate, brain waves, behavior patterns, and more, and through sophisticated algorithmic models, the system can recognize small signs of fatigue and give an early warning before the problem becomes serious. For example, machine learning models can learn early signals of fatigue from historical data and use real-time data to make dynamic predictions, effectively reducing safety hazards caused by fatigue. In addition, AI technology enables personalized fatigue management based on individual differences of the flight crew. By analyzing the physiological characteristics and work habits of different crew members, the system can develop targeted fatigue prevention measures and work arrangements. This personalized management strategy can significantly improve the practical application effect of fatigue monitoring system, and better meet the needs of different personnel.
Machine learning technology enables the fatigue monitoring system to have the ability of adaptive optimization. As the amount of data increases and technology advances, the system is able to continuously learn and update its algorithms, gradually improving the accuracy of predictions and the reliability of monitoring. This self-optimizing capability not only improves the long-term performance of the system, but also ensures its adaptability in a constantly changing work environment. Making this happen requires close collaboration between aviation experts, data scientists, and technology developers. Aviation experts provide domain expertise to ensure systems are designed to meet flight safety requirements; Data scientists are responsible for the collection and analysis of data and the development of effective algorithmic models; The technical developer implements the technical development and deployment of the system. Only through this multidisciplinary cooperation can we ensure the comprehensiveness and efficiency of the system.
In the long term, the integration of AI and ML technologies will not only improve flight safety, but also drive technological advances across the aviation industry. The successful application of these systems will provide valuable experience for security management in other fields, while promoting the further development and application of related technologies.
In summary, the application of artificial intelligence and machine learning technology to crew fatigue monitoring not only provides an unprecedented guarantee for flight safety, but also promotes the progress of technology and the expansion of application fields. Through continuous optimization and upgrading, these technologies will become an important pillar to improve aviation safety.
References
- Wang, C., Chen, J., Xie, Z., & Zou, J. (2024). Research on Personalized Teaching Strategies Selection based on Deep Learning.
- Wang, D. (Ed.). (2016). Information Science and Electronic Engineering: Proceedings of the 3rd International Conference of Electronic Engineering and Information Science (ICEEIS 2016), January 4-5, 2016, Harbin, China. CRC Press.
- Wang, H., Li, J., & Li, Z. (2024). AI-Generated Text Detection and Classification Based on BERT Deep Learning Algorithm. arXiv preprint arXiv:2405.16422. [CrossRef]
- Wang, J., An, G., Peng, X., Zhong, F., Zhao, K., Qi, L., & Ma, Y. (2024). Effects of three Huanglian-derived polysaccharides on the gut microbiome and fecal metabolome of high-fat diet/streptozocin-induced type 2 diabetes mice. International Journal of Biological Macromolecules, 133060. [CrossRef] [PubMed]
- Wang, Y., He, Z., Zou, J., Xie, H., & Bao, J. (2024). Energy Transition for Sustainable Economy: What is the Role of Government Governance and Public Concern?. Finance Research Letters, 106087.
- Xie, D., Kuang, Y., Yuan, B., Zhang, Y., Ye, C., Guo, Y., ... & Yang, S. (2025). Convenient and highly efficient adsorption of diosmetin from lemon peel by magnetic surface molecularly imprinted polymers. Journal of Materials Science & Technology, 211, 159-170. [CrossRef]
- Yang, J., Qin, H., Por, L. Y., Shaikh, Z. A., Alfarraj, O., Tolba, A., ... & Thwin, M. (2024). Optimizing diabetic retinopathy detection with inception-V4 and dynamic version of snow leopard optimization algorithm. Biomedical Signal Processing and Control, 96, 106501. [CrossRef]
- Yu, C., Jin, Y., Xing, Q., Zhang, Y., Guo, S., & Meng, S. (2024). Advanced User Credit Risk Prediction Model using LightGBM, XGBoost and Tabnet with SMOTEENN. arXiv:2408.03497.
- Yu, C., Xu, Y., Cao, J., Zhang, Y., Jin, Y., & Zhu, M. (2024). Credit card fraud detection using advanced transformer model. arXiv:2406.03733.
- Zeng, X., Wang, S., Peng, Z., Wang, M., Zhao, K., Xu, B. B., ... & Wang, J. (2024). Rapid screening and sensing of stearoyl-CoA desaturase 1 (SCD1) inhibitors from ginger and their efficacy in ameliorating non-alcoholic fatty liver disease. Journal of Food Measurement and Characterization, 1-15.
- Zhang, X., Xu, L., Li, N., & Zou, J. (2024). Research on Credit Risk Assessment Optimization based on Machine Learning. [CrossRef]
- Zhang, Y., Qu, T., Yao, T., Gong, Y., & Bian, X. (2024). Research on the application of BIM technology in intelligent building technology. Applied and Computational Engineering, 61, 29-34. [CrossRef]
- Zhao, K., Qian, C., Qi, L., Li, Q., Zhao, C., Zhang, J., ... & Shi, Z. (2024). Modified acid polysaccharide derived from Salvia przewalskii with excellent wound healing and enhanced bioactivity. International Journal of Biological Macromolecules, 263, 129803. [CrossRef] [PubMed]
- Zhao, K., Wu, X., Han, G., Sun, L., Zheng, C., Hou, H., ... & Shi, Z. (2024). Phyllostachys nigra (Lodd. ex Lindl.) derived polysaccharide with enhanced glycolipid metabolism regulation and mice gut microbiome. International Journal of Biological Macromolecules, 257, 128588. [CrossRef] [PubMed]
- Zhao, S., Zhang, T., & Li, N. (2024). Machine Learning Analysis of Key Features in Household Financial Decision-Making. Academic Journal of Science and Technology, 12(2), 1-6. [CrossRef]
- Zheng, Q., Yu, C., Cao, J., Xu, Y., Xing, Q., & Jin, Y. (2024). Advanced Payment Security System: XGBoost, CatBoost and SMOTE Integrated. arXiv:2406.04658.
- Chen, Y., Yan, S., Liu, S., Li, Y., & Xiao, Y. (2024, August). EmotionQueen: A Benchmark for Evaluating Empathy of Large Language Models. In Findings of the Association for Computational Linguistics ACL 2024 (pp. 2149-2176).
- Chen, Z., Ge, J., Zhan, H., Huang, S., & Wang, D. (2021). Pareto self-supervised training for few-shot learning. In Proceedings of the IEEE/CVF conference on computer vision and pattern recognition (pp. 13663-13672).
- Feng, Z., Ge, M., & Meng, Q. (2024). Enhancing Energy Efficiency in Green Buildings Through Artificial Intelligence. [CrossRef]
- Feng, Z., Ge, M., Meng, Q., & Chen, Y. (2024). Research on Old Building Renovation Strategies by using Green Building Technologies.
- Ge, M., Feng, Z., & Meng, Q. (2024). Urban Planning and Green Building Technologies Based on Artificial Intelligence: Principles, Applications, and Global Case Study Analysis. [CrossRef]
- Huang, D., Liu, Z., & Li, Y. (2024). Research on Tumors Segmentation based on Image Enhancement Method. arXiv:2406.05170. [CrossRef]
- Huang, D., Xu, L., Tao, W., & Li, Y. (2024). Research on Genome Data Recognition and Analysis based on Louvain Algorithm.
- Jiang, G., Zhao, S., Yang, H., & Zhang, K. (2024). Research on Finance Risk Management based on Combination Optimization and Reinforcement Learning.
- Jin, Y., Shimizu, S., Li, Y., Yao, Y., Liu, X., Si, H., ... & Xiao, W. (2023). Proton therapy (PT) combined with concurrent chemotherapy for locally advanced non-small cell lung cancer with negative driver genes. Radiation Oncology, 18(1), 189. [CrossRef] [PubMed]
- Kumada, H., Li, Y., Yasuoka, K., Naito, F., Kurihara, T., Sugimura, T., ... & Sakae, T. (2022). Current development status of iBNCT001, demonstrator of a LINAC-based neutron source for BNCT. Journal of Neutron Research, 24(3-4), 347-358. [CrossRef]
- Lai, S., Feng, N., Sui, H., Ma, Z., Wang, H., Song, Z., ... & Yue, Y. (2024). FTS: A Framework to Find a Faithful TimeSieve. arXiv:2405.19647.
- Li, B., Jiang, G., Li, N., & Song, C. (2024). Research on Large-scale Structured and Unstructured Data Processing based on Large Language Model.
- Li, B., Zhang, K., Sun, Y., & Zou, J. (2024). Research on Travel Route Planning Optimization based on Large Language Model.
- Li, B., Zhang, X., Wang, X. A., Yong, S., Zhang, J., & Huang, J. (2019, April). A Feature Extraction Method for Daily-periodic Time Series Based on AETA Electromagnetic Disturbance Data. In Proceedings of the 2019 4th International Conference on Mathematics and Artificial Intelligence (pp. 215-219).
- Li, S., & Tajbakhsh, N. (2023). Scigraphqa: A large-scale synthetic multi-turn question-answering dataset for scientific graphs. arXiv:2308.03349.
Disclaimer/Publisher’s Note: The statements, opinions and data contained in all publications are solely those of the individual author(s) and contributor(s) and not of MDPI and/or the editor(s). MDPI and/or the editor(s) disclaim responsibility for any injury to people or property resulting from any ideas, methods, instructions or products referred to in the content. |
© 2024 by the authors. Licensee MDPI, Basel, Switzerland. This article is an open access article distributed under the terms and conditions of the Creative Commons Attribution (CC BY) license (http://creativecommons.org/licenses/by/4.0/).
Copyright: This open access article is published under a Creative Commons CC BY 4.0 license, which permit the free download, distribution, and reuse, provided that the author and preprint are cited in any reuse.