Submitted:
20 September 2024
Posted:
24 September 2024
Read the latest preprint version here
Abstract
"Politography" refers to the study or portrayal of political events, figures, and systems. It is used to analyze political trends, to visualize data, and create a data driven narrative. Decision support tools (DST) for policy makers tend to be narrowly defined in terms of specific domain applications. In this work, we describe the design and construction of a DST related to intergroup conflict management and resolution, focused on the Israeli-Palestinian conflict. It provides a case study that can be generalized to other applications. The DST, labeled T-Politography, integrates over 9000 indicators pertaining to the Israeli-Palestinian conflict, in a hierarchical structure that begins with the specific geographical areas influenced by the Israeli-Palestinian conflict. These include geographical areas: A, B, and C in the West Bank and East Jerusalem. The designated areas have distinct legal status specified in the 1993 Oslo Accords between Israel and the Palestinians Authority (PA). The second level of the DST hierarchy consists of three domains that characterize Israeli and Palestinian levels of control, in each one of the geographic areas: security, geo-spatial, and economic. In addition, the T-Politography DST contains contextual data relevant to the Israeli and Palestinian control such as political, diplomatic, social, and legal domains. Each domain is designated as influencing either Israeli or Palestinian Authority (PA) control and is further subdivided into categories. For example, the geo-spatial domain is one of the categories covering Israeli demographics in Area C. Each category is represented by a set of specific indicators, e.g., Israeli birth rates in Area C.
Keywords:
decision support tool
; indicators
; multivariate analysis
; composite indicators
; random forrests
; Bayesian networks
1. Background
The origins of the Israeli-Palestinian conflict can be traced back to the Balfour Declaration of 1917, which pledged to establish a national home for the Jewish people in a land with an Arab majority. The national aspirations of both sides, coupled with demographic shifts, the Holocaust, and the aftermath of World War II, culminated in the UN Partition Plan of 1947, proposing the creation of two states - one Jewish and one Arab. Several military conflicts followed the UN declaration with an apparent impasse to a peaceful resolution. The situation in 2024 is characterized by a lack of tools for the Israeli political system to be capable of effectively describing, analyzing, and evaluating Israel’s trajectory towards various political, foreign and domestic scenarios. A data driven approach is needed in the context of the Israeli-Palestinian conflict for identifying and formulating appropriate responses.
“Politography” refers to the study or portrayal of political events, figures, and systems. It is used to analyze political trends, to visualize data, and create a data driven narrative. Decision support tools (DST) for policy makers tend to be narrowly defined in terms of specific domain applications. In this work, we describe the design and construction of a DST related to intergroup conflict management and resolution, focused on the Israeli-Palestinian conflict. It provides a case study that can be generalized to other applications. The DST, labeled T-Politography, integrates over 9000 indicators pertaining to the Israeli-Palestinian conflict, in a hierarchical structure that begins with the specific geographical areas influenced by the Israeli-Palestinian conflict. These include geographical areas: A, B, and C in the West Bank and East Jerusalem. The designated areas have distinct legal status specified in the 1993 Oslo Accords between Israel and the Palestinians Authority (PA). The second level of the DST hierarchy consists of three domains that characterize Israeli and Palestinian levels of control, in each one of the geographic areas: security, geo-spatial, and economic. In addition, the T-Politography DST contains contextual data relevant to the Israeli and Palestinian control such as political, diplomatic, social, and legal domains. Each domain is designated as influencing either Israeli or Palestinian Authority (PA) control and is further subdivided into categories. For example, the geo-spatial domain is one of the categories covering Israeli demographics in Area C. Each category is represented by a set of specific indicators, e.g., Israeli birth rates in Area C.
To provide decision makers and researchers with an effective DST we apply various data analytic methods including data standardization methods, construction of composite indicators, dimension reduction with principal components, random forest models and measures of variable importance.
DSTs are used in a wide range of application domains such as web traffic analysis, mobility across different transportation options, public movement in shopping centers and agricultural domains. They provide the equivalent of a digital twin of social and political systems (Kenett and Bortman, 2022). A general structure for designing a DST was proposed in Harel et al. (2018). Here we consider a DST based on data that consists of official statistics and survey-based indicators. For methodologies analyzing and displaying indicators in social and economic applications see Kenett and Maggino (2021) and Kenett (2024).
To track trends of conditions in various geographical areas, we compile a range of indicators covering security, demographic, economic data, employment, population size, security events, and media enticements to violence. In the T-Politography DST there are over 9000 indicators curated by specialized teams. The data is derived either from official sources (e.g., Bank of Israel, Central Bureau of Statistics), dedicated surveys, GIS analyses of aerial photographs, and media based textual analyses of statements and declarations made by officials or leading figures in the region and in major countries and international institutions or NGOs. In general, the data covers ten years of historical data and is updated on a yearly or quarterly basis, depending on how frequently changes occur.
In designing and implementing the DST, we considered two main target groups of users and stakeholders defined in the next section. The DST is designed to be updated on a regular basis and provide capabilities for generic and special purpose analyses.
2. The DST Users Target Groups
The general challenge in DST Politography is to provide a data driven analysis of conflicts characterized by geo-spatial boundaries and conflict domains. The analytic tool needs to provide both high level perspectives and drill down capabilities, with an ability to examine alternative scenarios.
The T-Politography DST, presented here, was designed with two main target user groups, The first group consists of decision makers that need an up-to-date assessment of the situation and an ability to evaluate hypothetical change scenarios. The second target group consists of conflict analysis scholars who use the DST to access and analyze data that is relevant to testing theoretical models of conflict and conflict resolution.
The first target group is provided, by the T-Politography DST, easy access to several analysis panels that are pre-designed. The second target group can access a versatile platform for investigating a range of possibilities with miscellaneous tools both internal and external to the platform. An example of the application of such tools in the COVID pandemic, is provided in Kenett et al. (2022). In the COVID DST, hospital data from ministries of health and individual mobility data from Google mobility, were integrated using Bayesian networks and structural equation models. For an example of dynamic Bayesian networks see Halabi et al. (2017), for an introduction to Bayesian networks see Kenett (2016) and Kenett et al. (2022). For a general approach to data integration see Dalla Valle et al. (2015). The next section provides a description of the methodology we developed and applied in designing and implementing the T-Politography DST.
3. The Methodology
In developing a Politography DST the main methodological challenges include:
- i)
- Integrating data from different sources and in different update timings and units
- ii)
- Defining composite indicators that provide unified views
- iii)
- Tracking and modeling trends at various levels of the system hierarchy
- iv)
- Analyzing alternative scenarios for supporting decision makers
The methodology applied in designing and implementing the T-Politography DST involved four parts: i) Map, ii) Construct, iii) Identify and iv) Analyze (MCIA).
I. Map control factors into economic, security and geo-spatial (demographic) domains. In this phase experts determine indicators reflecting domains of control by geographical area: economic, security and geo-spatial. A methodology for supporting this part is the Goals-Question-Metrics (GQM) approach presented in Van Solingen et al. (2002). The GQM steps are: 1) Generate a set of goals, 2) Derive a set of questions relating to the goals and 3) Develop a set of metrics needed to answer the questions. Data can be viewed using dynamic graphs with an ability that allows zooming on any individual indicator by navigating its relevant data hierarchy.
II. Construct an integrated database combining indicators from different domains, by year or by quarters. In this phase research teams load data into a database and compute indices relative to a common annual baseline. The T-Politography DST updates a configuration file with indicator names and identifies missing values and outliers. We determine data subsets for use in integration (by year or quarter), conduct linkage analysis to get integrated data.
III. Identify trends in individual indicators and composite indicators and compute relative control level by year by entity (Israel, PA) over one of the predetermined territories listed above. For trend analysis, we compute composite indicators by domain using the median. We present bar charts and trend charts and conduct variable cluster analysis to identify the most representative cluster indicator. In addition, we combine all domains to compute an overall trend with a composite indicator. The method applied to define composite indicators is by computing individual indicators relative to a base year and then use the yearly median across indicators. In the 2024 T-Politography DST we apply this approach with 2022 as baseline and label the yearly composite indicator, MEDIAN.
To compute the overall level of Israeli and Palestinian control, we derive and present combined composite indicators. A feature selection preprocessing step in the T-Politography DST applies random forest to selects subset indicators based on 80% of their cumulated variable importance to the respected trend (Kenett et al.l, 2022). To derive the combined composite indicators for each indicator, Yi(x), we define a desirability function di(Yi) which assigns numbers between 0 and 1 to the possible values of Yi. The values di(Yi)=0 represents an undesirable value of Yi and di(Yi)=1 represents a desirable or ideal value. The individual desirabilities are then combined to an overall desirability index using the geometric mean of the individual desirabilities:
Overall Desirability Function = [(d1(Y1) x d2(Y2))x … dk(Yk))]1/k
where k denotes the number of indicators. Notice that if any response Yi is completely undesirable (di(Yi) = 0), then the overall desirability is zero. To account for this “zero control” we apply an additional step that mitigates such cases and the Desirability Function is used as a composite Indicator based on individual indicators. The final composite indicators, representing Israeli and PA control, are graphed on a 0 to 1, Y by X graph, within one of four triangular quadrants. Each triangle represents a different combination of Israeli and PA control level. For more on desirability functions see Derringer and Suich (1980).
IV. Analyze scenarios by determining list and contribution of indicators affecting target indicators. Map target indicators and affecting indicators followed by a PCA analysis of target indicators. Use principal components that determine most of the variability. On the dimension Prin1 apply a random forest to determine indicators representing 80% of the cumulated variable importance. Determine rules in decision tree of Prin1 based on the subset of top 80% affecting indicators.
The validation of the T-Politography DST was based on feedback sessions with domain experts and triangulation of information from different sources. The descriptive components provide visual rendering that can be checked by comparisons to other reports. The analytic components were internally validated.
4. The Decision Support Tool Elements
The T-Politography DST elements consist of various data sources, a configuration file and organized files used in the data analysis. The front end of the Politography DST is shown in Figure 1. It provides bilingual options (Hebrew, English) and access to several analytic tools.
The first level of data presentation is descriptive. The data is organized by geographical area (e.g., Area C), by domain (e.g., geo-spatial), by group (e.g., Palestinian demographics), and then a specific indicator is chosen (e.g., density of Palestinian residents in built-up areas). As an example Figure 2 shows the density of Palestinian residents in area C built-up area.
At the next level, we apply a control composite indicator that aggregates data from the three domains of control: geo-spatial, economic, and security. This composite index enables decision-makers to trace change in both Palestinian and Israeli control, in the four regions of interest. Note that “control” is calculated in reference to the base year, 2022.
A trend of Israeli composite indicator affecting Area C, relative to base year 2022, is shown in Figure 3. The filtering option of the dashboard permits to consider different areas by highlighting interactively an area on the top left.
To better understand a change in control, users can examine change in each specific domain of control. For instance, on can ask: “what accounts for the increase in Israeli control over Area C in the past two decades as seen in Figure 3? “. Figure 4 shows change in each domain separately. As can be seen, changes in security do not seem to account for the increase in Israeli control. It is primarily the geo-spatial and economic domains that are driving the observed change. A map of composite indicators over time, by domain, is shown in Figure 4.
The map of indicator trends shown in Figure 4 provides a general picture of the sources of control. To get more accurate information on the specific indicators that contribute to levels of control, and the relative contribution of each indicator, we created a Scenario Maintenance screen (Figure 5 and Figure 6). This screen enables users to run a random forest analysis predictive model and determine from it the specific indicators that contribute to overall control in a designated area. It also permits to analyze sources of control in specific domains (geo-spatial, economic, security).
The scenario function also enables users to examine contextual influences on control. Figure 5 presents an example of which indicators in the Palestinian social domain (i.e., Palestinian influencers on social media) exert the most influence on Palestinian control in Area C. The analysis presents indicators explaining up to 85% of the variance in descending order. In this example, we see that influencers discussing political, popular, and media activism contribute more to PA control than discussions of military activism. The Scenario Maintenance screen is shown in Figure 5 and Figure 6.
The Scenario Maintenance screen has an additional use: answering user-specific questions and queries. Users may want to know who is gaining more control in a specific area of the West Bank, Israelis or Palestinians (as displayed in Figure 6)? They might have other questions pertaining to the issue of control such as predicting Palestinian and/or Jewish settlers’ violence in the West Bank. This enables us to generate user-tailored responses to specific queries.
Ultimately, users may want to not only understand which factors contribute to control, but to determine the current state of the balance of control between the conflicting parties and how that balance changes over time. Using a desirability function, we compute the ratio of Israeli and Palestinian control and map it on a two-dimensional space with the X-axis representing Israeli control and the Y-axis representing Palestinian control. The two diagonals traversing this space create four quadrants of control that indicate who is the dominant party and whether they have high or low levels of control: 1. Palestinian control – high; 2. Israeli control – high; 3. Israeli control – low; and 4. Palestinian control -low.
Figure 7 provides an overall perspective combining Israeli and Palestinians indicators using the desirability function introduced above. The top triangle (1) represents full control by PA, the right triangle (2) corresponds to full control by Israel, the lower triangle represents partial control by Israel, the left triangle (4) consists of partial control by the PA.
5. The Decision Support Dynamic Scenario Analysis Tool
As a next step conducted off line, we apply Bayesian network analysis in order to understand links between indicators from the same or different domains, and how changes in the level of one indicator influences the other indicators. Bayesian networks consist of a graph structure called directed acyclic graph (DAG) and an estimation step (see Kenett 2016, 2024). This provides the ability to run what-if scenarios to assist policymakers in making informed decisions that account for consequences of policy decisions.
To present an application of a Bayesian network, and preserve confidentiality, we demonstrate below an application to a subset of 18 indicators labeled I1-I16 over 12 years (2010-2021). The data analyzed is calibrated to the year 2022 as base line (see Table 1). The last column, labeled MEDIAN, is the median of the row used as a composite indicator representing the specific year.
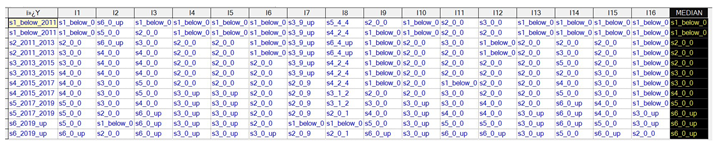
To analyze this data with a discrete Bayesian network, one needs to first discretize the data as shown in Table 2. In this example the indicator data was classified into 3 groups of equal width.
From this data we can derive a directed acyclic graph as shown in Figure 8.
In Figure 9 we show the DAG, conditioned on the year 2010 and, in Figure 10, the data is conditioned on years above 2019. In Figure 9 we see that indicator I10 is, with a probability of 60% , in the lowest category and in Figure 10, 10 years later, this probability drops to 20%.
These model driven estimates provide probabilistic statements to changes over time or on conditioning the Bayesian network on any of its variables. This Bayesian network analysis provides the DST with an ability to consider future looking alternative scenarios.
A DST is designed to provide a data driven wide angle view. Decision makers can use it to manage planned and unplanned events, such as the Taleb black swans (Kenett and Taleb, 2009)…..
6. Discussion
The T-Politography DST described in this paper is a decision support tool instrumental in analyzing and understanding complex conflicts such as the Israeli-Palestinian conflict. This general DST structure may prove valuable for scholars of conflicts, that have access to a comprehensive database, and for decision makers that want to make data driven decisions. The Bayesian network analysis in section 5 highlights consequences of decisions by enabling conditioning of indicator values. This type of DST is organized in a hierarchical manner such that users can examine the data at a descriptive level systematically. Then, they can examine more complex questions such as impact of changes in the level of control, questions about the sources of control, specific scenarios pertaining to control, the ratio of control between conflicting parties and how all this changes over time. Finally, they may examine what-if scenarios in a network of control indicators. The general methodology for designing and implementing the DST presented here consists of Map, Construct, Identify and Analyze (MCIA).
A Politography DST contributes to the field of conflict resolution studies in several important ways. Most of the literature on intergroup conflict resolution is domain-specific. Some studies focus on geographical or demographic aspects of the conflict (Leuenberger and Schnell, 2020; Wallach, 2011), whereas others focus on public opinion (Hirschberger and Hirsch-Hoefler, 2024), or on elite or leader opinion (Lazin, 2023). The T-Politography DST integrates the data of different domains and presents an integrative approach to intergroup conflict resolution. Conflict resolution is also often conceptualized in unidimensional terms (e.g., one-state solution – two-state solution). The T-Politography DST conceptualizes intergroup conflict as an array of control ratios between parties, in different geographical regions and in different domains. This multidimensional understanding of intergroup conflict provides a unique perspective on the nuances and specific features of conflict that are often overlooked (Kenett, 2024). It offers new policy opportunities that may ultimately advance conflict resolution. For example, increasing Palestinian economic control in the West Bank and Gaza would facilitate independence in the long run. Most importantly, the T-Politography DST identifies the indicators influencing control and predicts the consequences of change in such indicators. These advanced capabilities reduce the reliance on beliefs, biases, and feelings, and increase the possibility for stakeholders to make informed decisions that are based on state-of-the-art analytic tools. Using this type of DST does not imply a guarantee of success in conflict resolution. The T- Politography DST assistance in decision making processes significantly supports informed decisions and increases the chances of finding the right path to peace. In general, the structure of a DST described in the paper can be used in general conflict resolution initiatives. It can be considered a social digital twin mirroring a conflict with data driven indicators covering an array of conflict specific domains.
References
- Dalla Valle, L., & Kenett, R. S. (2015). Official statistics data integration for enhanced information quality. Quality and Reliability Engineering International, 31(7), 1281-1300. [CrossRef]
- Derringer, G., & Suich, R. (1980). Simultaneous optimization of several response variables. Journal of quality technology, 12(4), 214-219. [CrossRef]
- Halabi, A., Kenett, R. S., & Sacerdote, L. (2017). Using dynamic Bayesian networks to model technical risk management efficiency. Quality and Reliability Engineering International, 33(6), 1179-1196. [CrossRef]
- Harel, A., Kenett, R. S., & Ruggeri, F. (2008). Decision support for user interface design: usability diagnosis by time analysis of the user activity. In 2008 32nd Annual IEEE International Computer Software and Applications Conference (pp. 836-840). IEEE.
- Hirschberger, G., & Hirsch-Hoefler, S. (2024). Temporal trends in Israeli political ideology: A longitudinal analysis of rightward shifts and reluctance to compromise in relation to perceived threats. Manuscript under review.
- Kenett, R. S. (2016). On generating high InfoQ with Bayesian networks. Quality Technology & Quantitative Management, 13(3), 309-332. [CrossRef]
- Kenett, R. S., & Maggino, F. (2021). Techniques for analyzing and presenting official statistics indicators. Statistical Journal of the IAOS, 37(2), 541-552. [CrossRef]
- Kenett, R. S., Manzi, G., Rapaport, C., & Salini, S. (2022). Integrated analysis of behavioural and health COVID-19 data combining Bayesian networks and structural equation models. International Journal of Environmental Research and Public Health, 19(8), 4859. [CrossRef]
- Kenett, R. S., Zacks, S., & Gedeck, P. (2022). Modern Statistics: A Computer-Based Approach with Python. Cham: Springer International Publishing.
- Kenett, R. S., & Bortman, J. (2022). The digital twin in Industry 4.0: A wide-angle perspective. Quality and Reliability Engineering International, 38(3), 1357-1366.
- Kenett, R. S. (2024) Multivariate techniques for analyzing and presenting official statistics indicators, Statistica Applicata - Italian Journal of Applied Statistics, Vol. 36, Number 1. https://www.sa-ijas.org/ojs_files_online_first/36_002_270.pdf.
- Lazin, F. A. (2023). President Donald Trump’s Abraham Accords initiative: Prospects for Israel, the Arab states, and Palestinians. Politics & Policy, 51(3), 476-487.
- Leuenberger, C., & Schnell, I. (2020). The Politics of Maps: Cartographic Constructions of Israel/Palestine. Oxford University Press.
- Van Solingen, R., Basili, V., Caldiera, G., & Rombach, H. D. (2002). Goal question metric (GQM) approach. Encyclopedia of software engineering, Wiley.
- Wallach, Y. (2011). Trapped in mirror-images: The rhetoric of maps in Israel/Palestine. Political Geography, 30(7), 358-369. [CrossRef]
Figure 1.
The T-Politography DST front end screen.
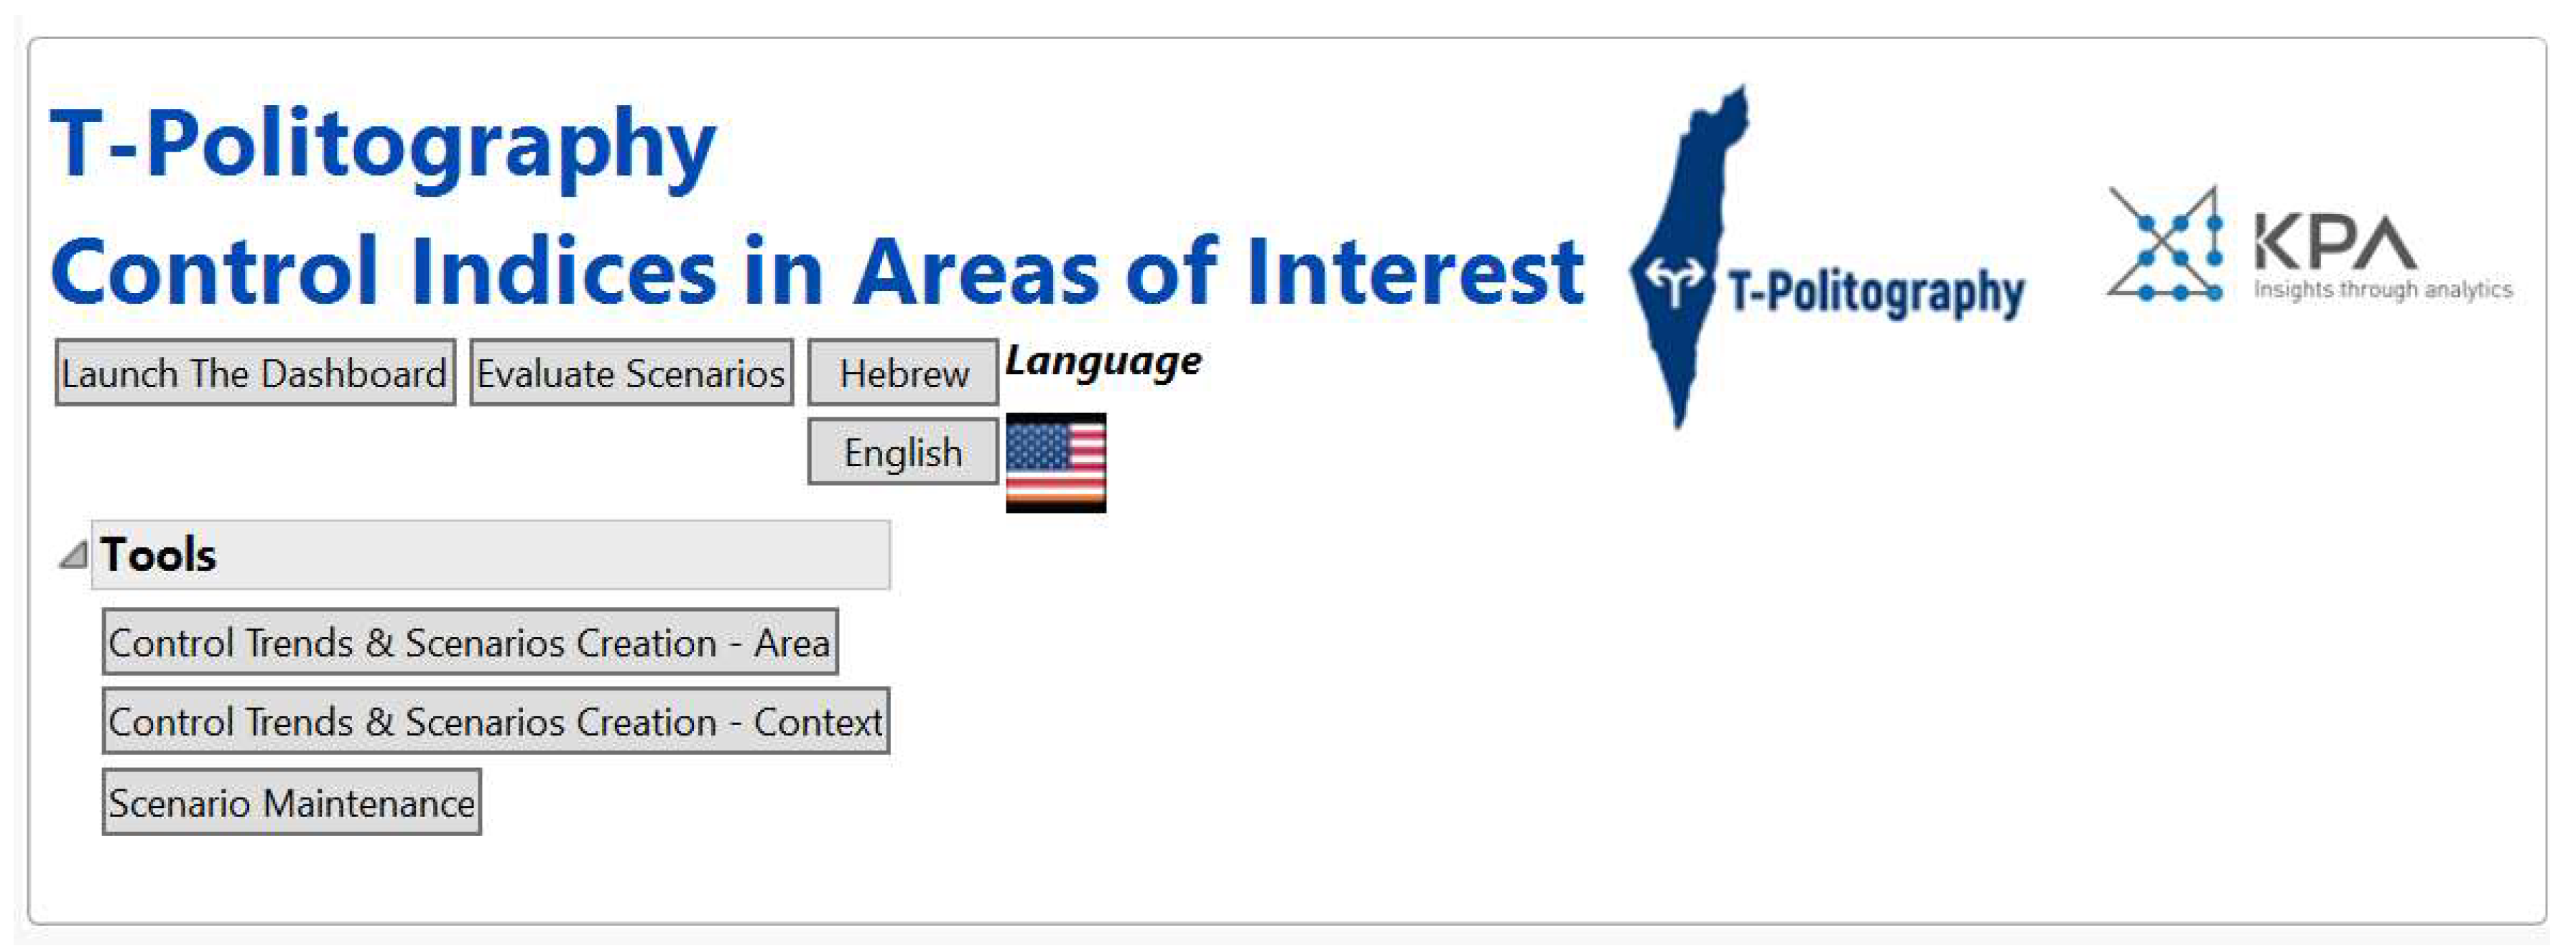
Figure 2.
Density of Palestinian residents in area C built-up area vs. Year.
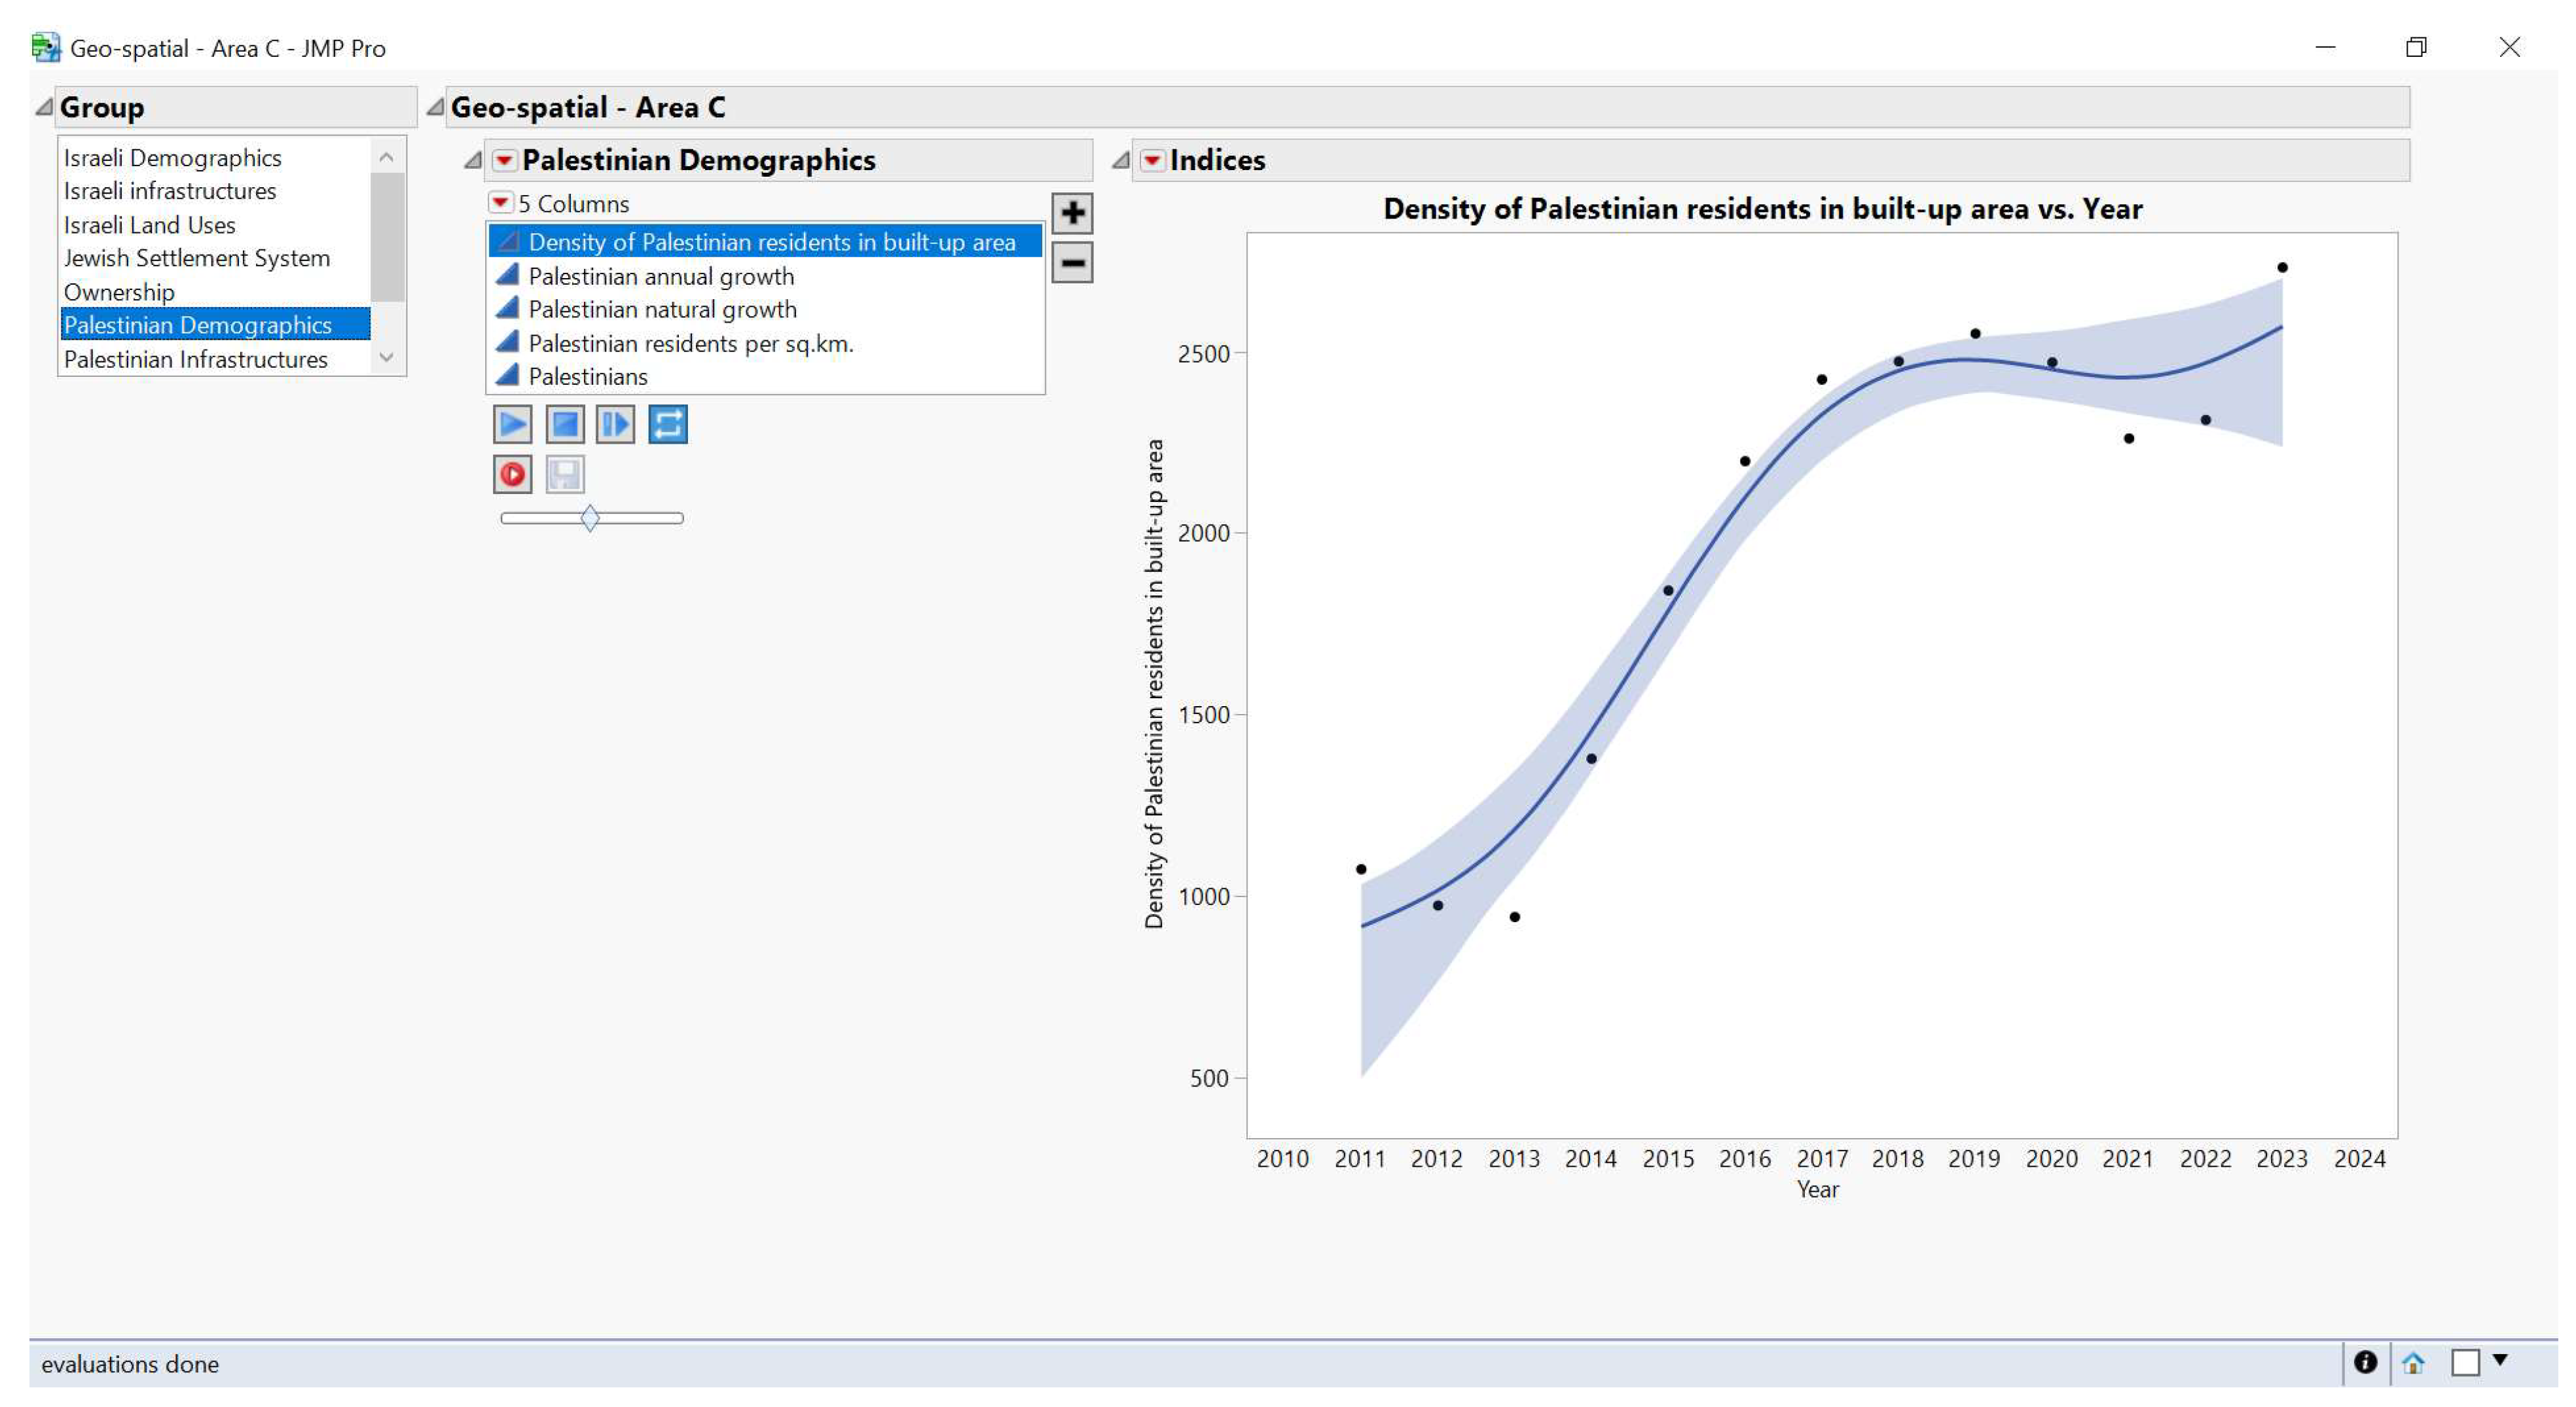
Figure 3.
Trend of Israeli related indicators affecting Area C, relative to base year 2022.
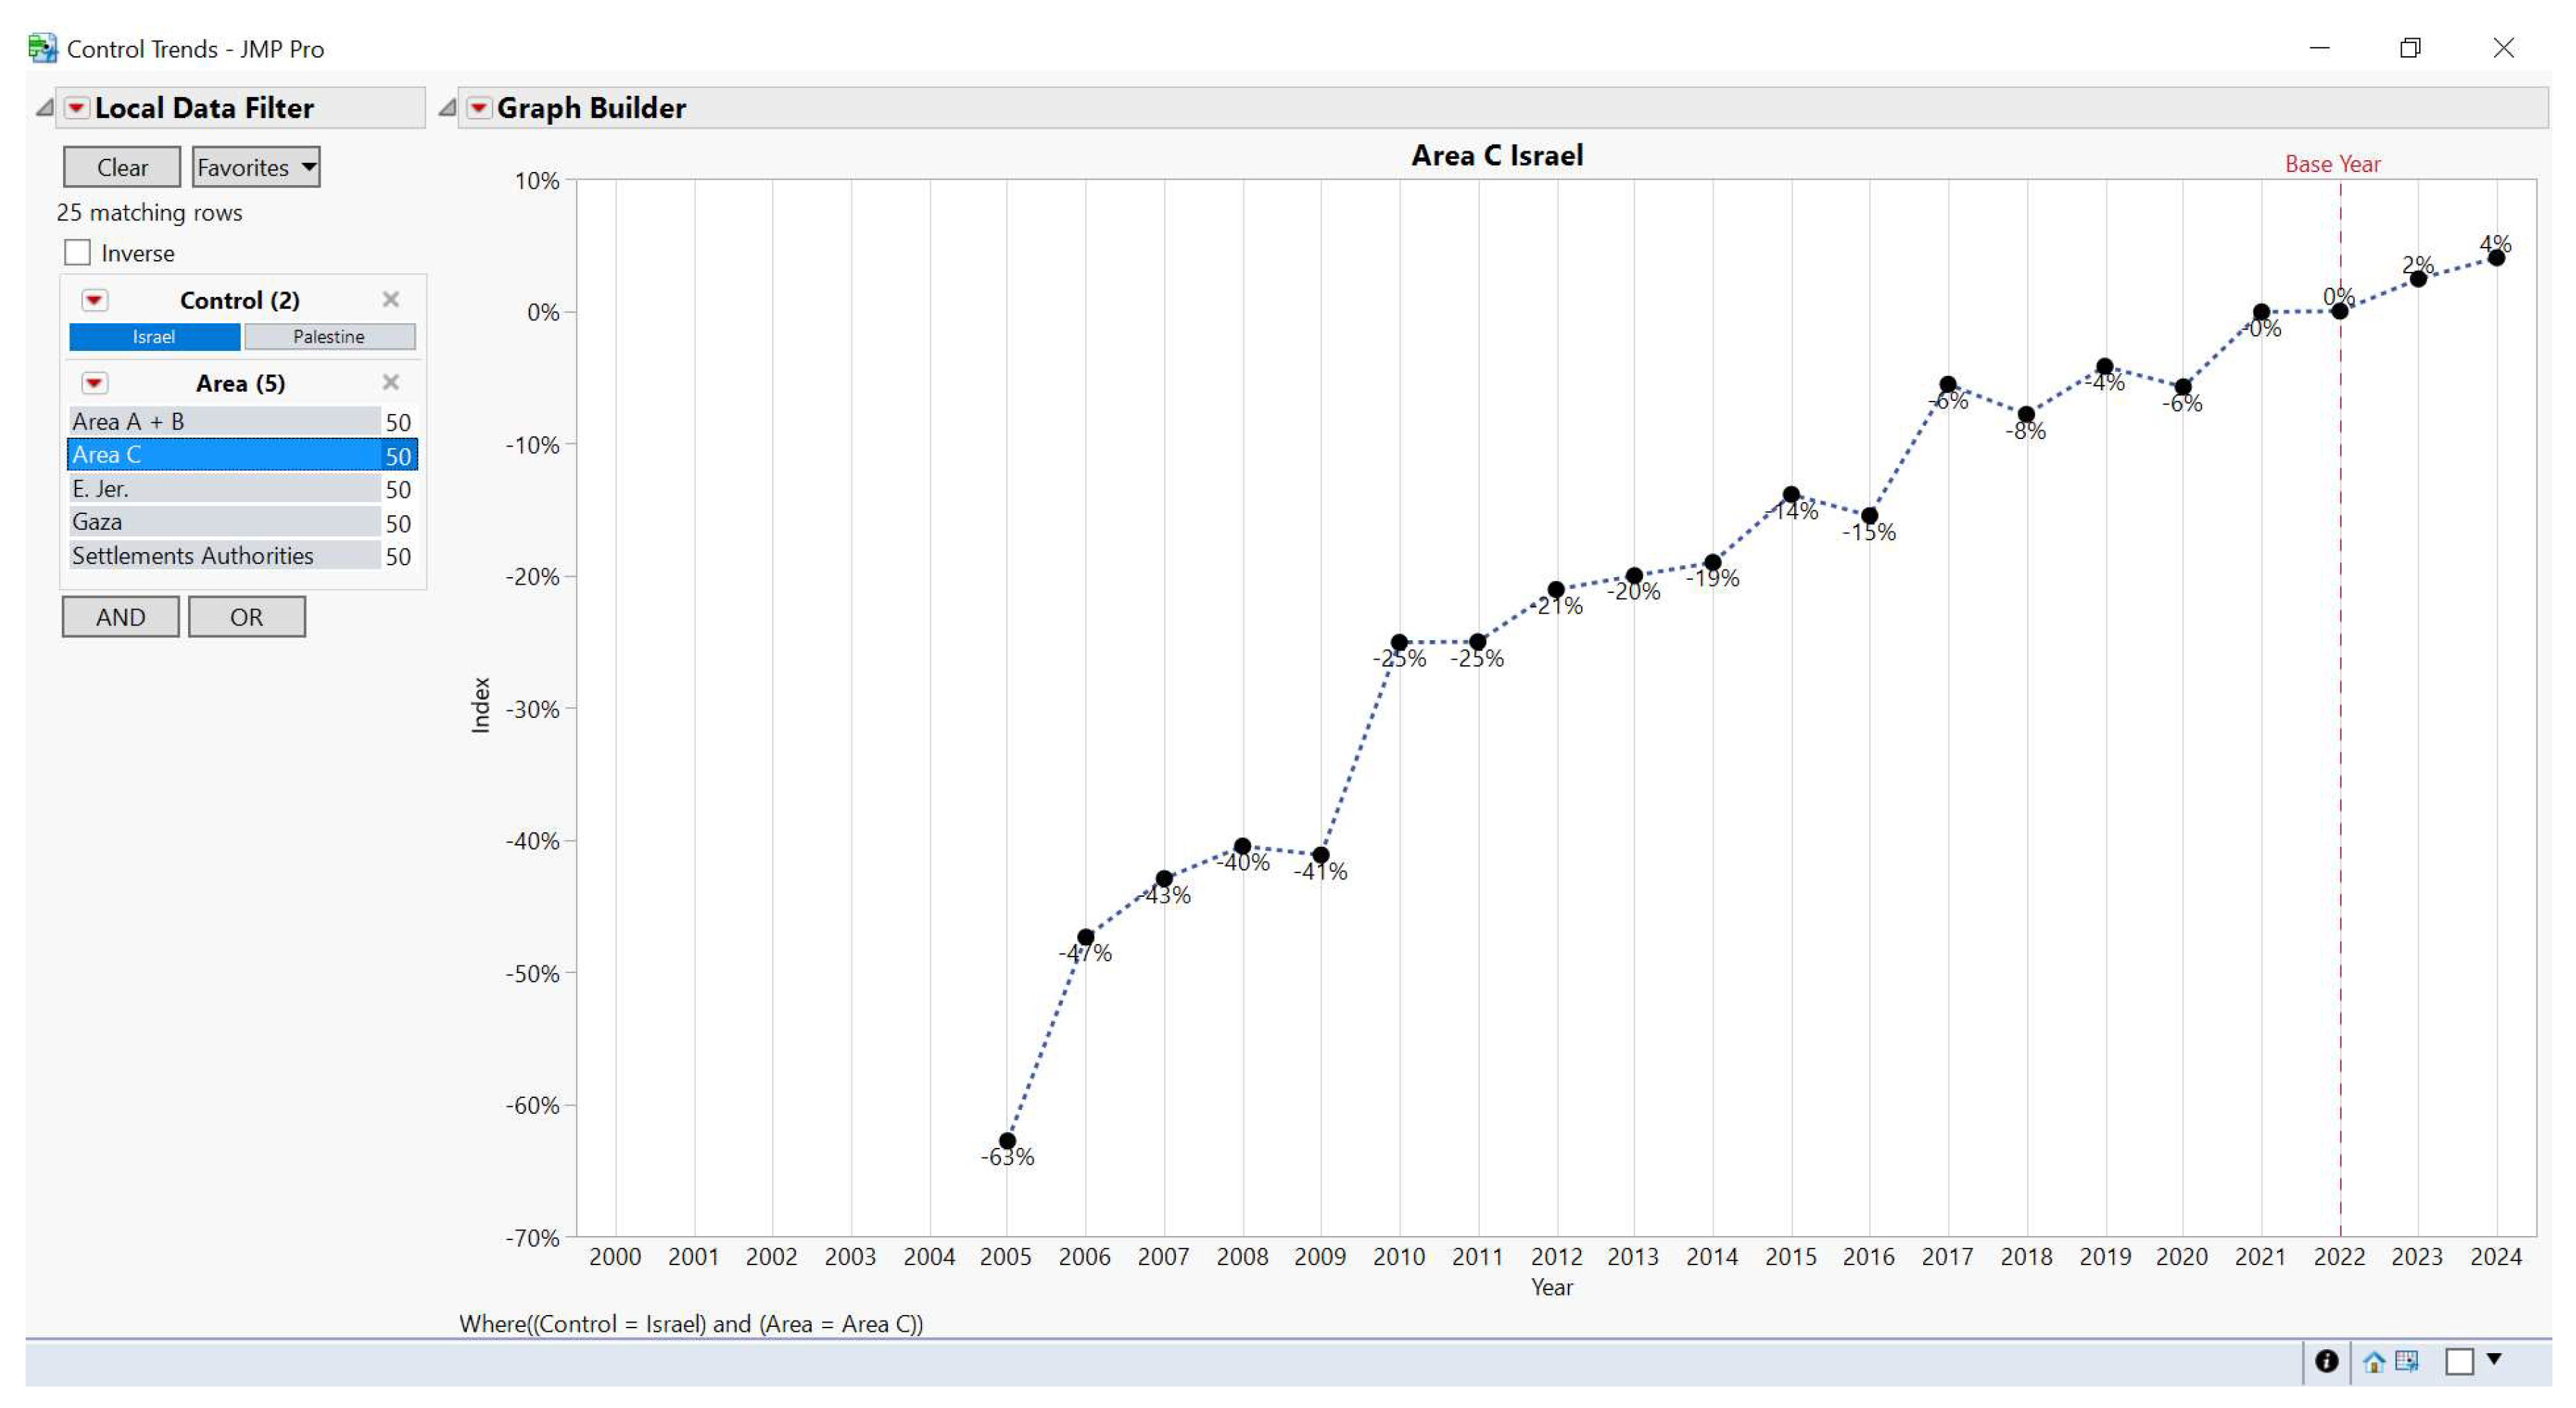
Figure 4.
Map of composite indicators over time, by domain.
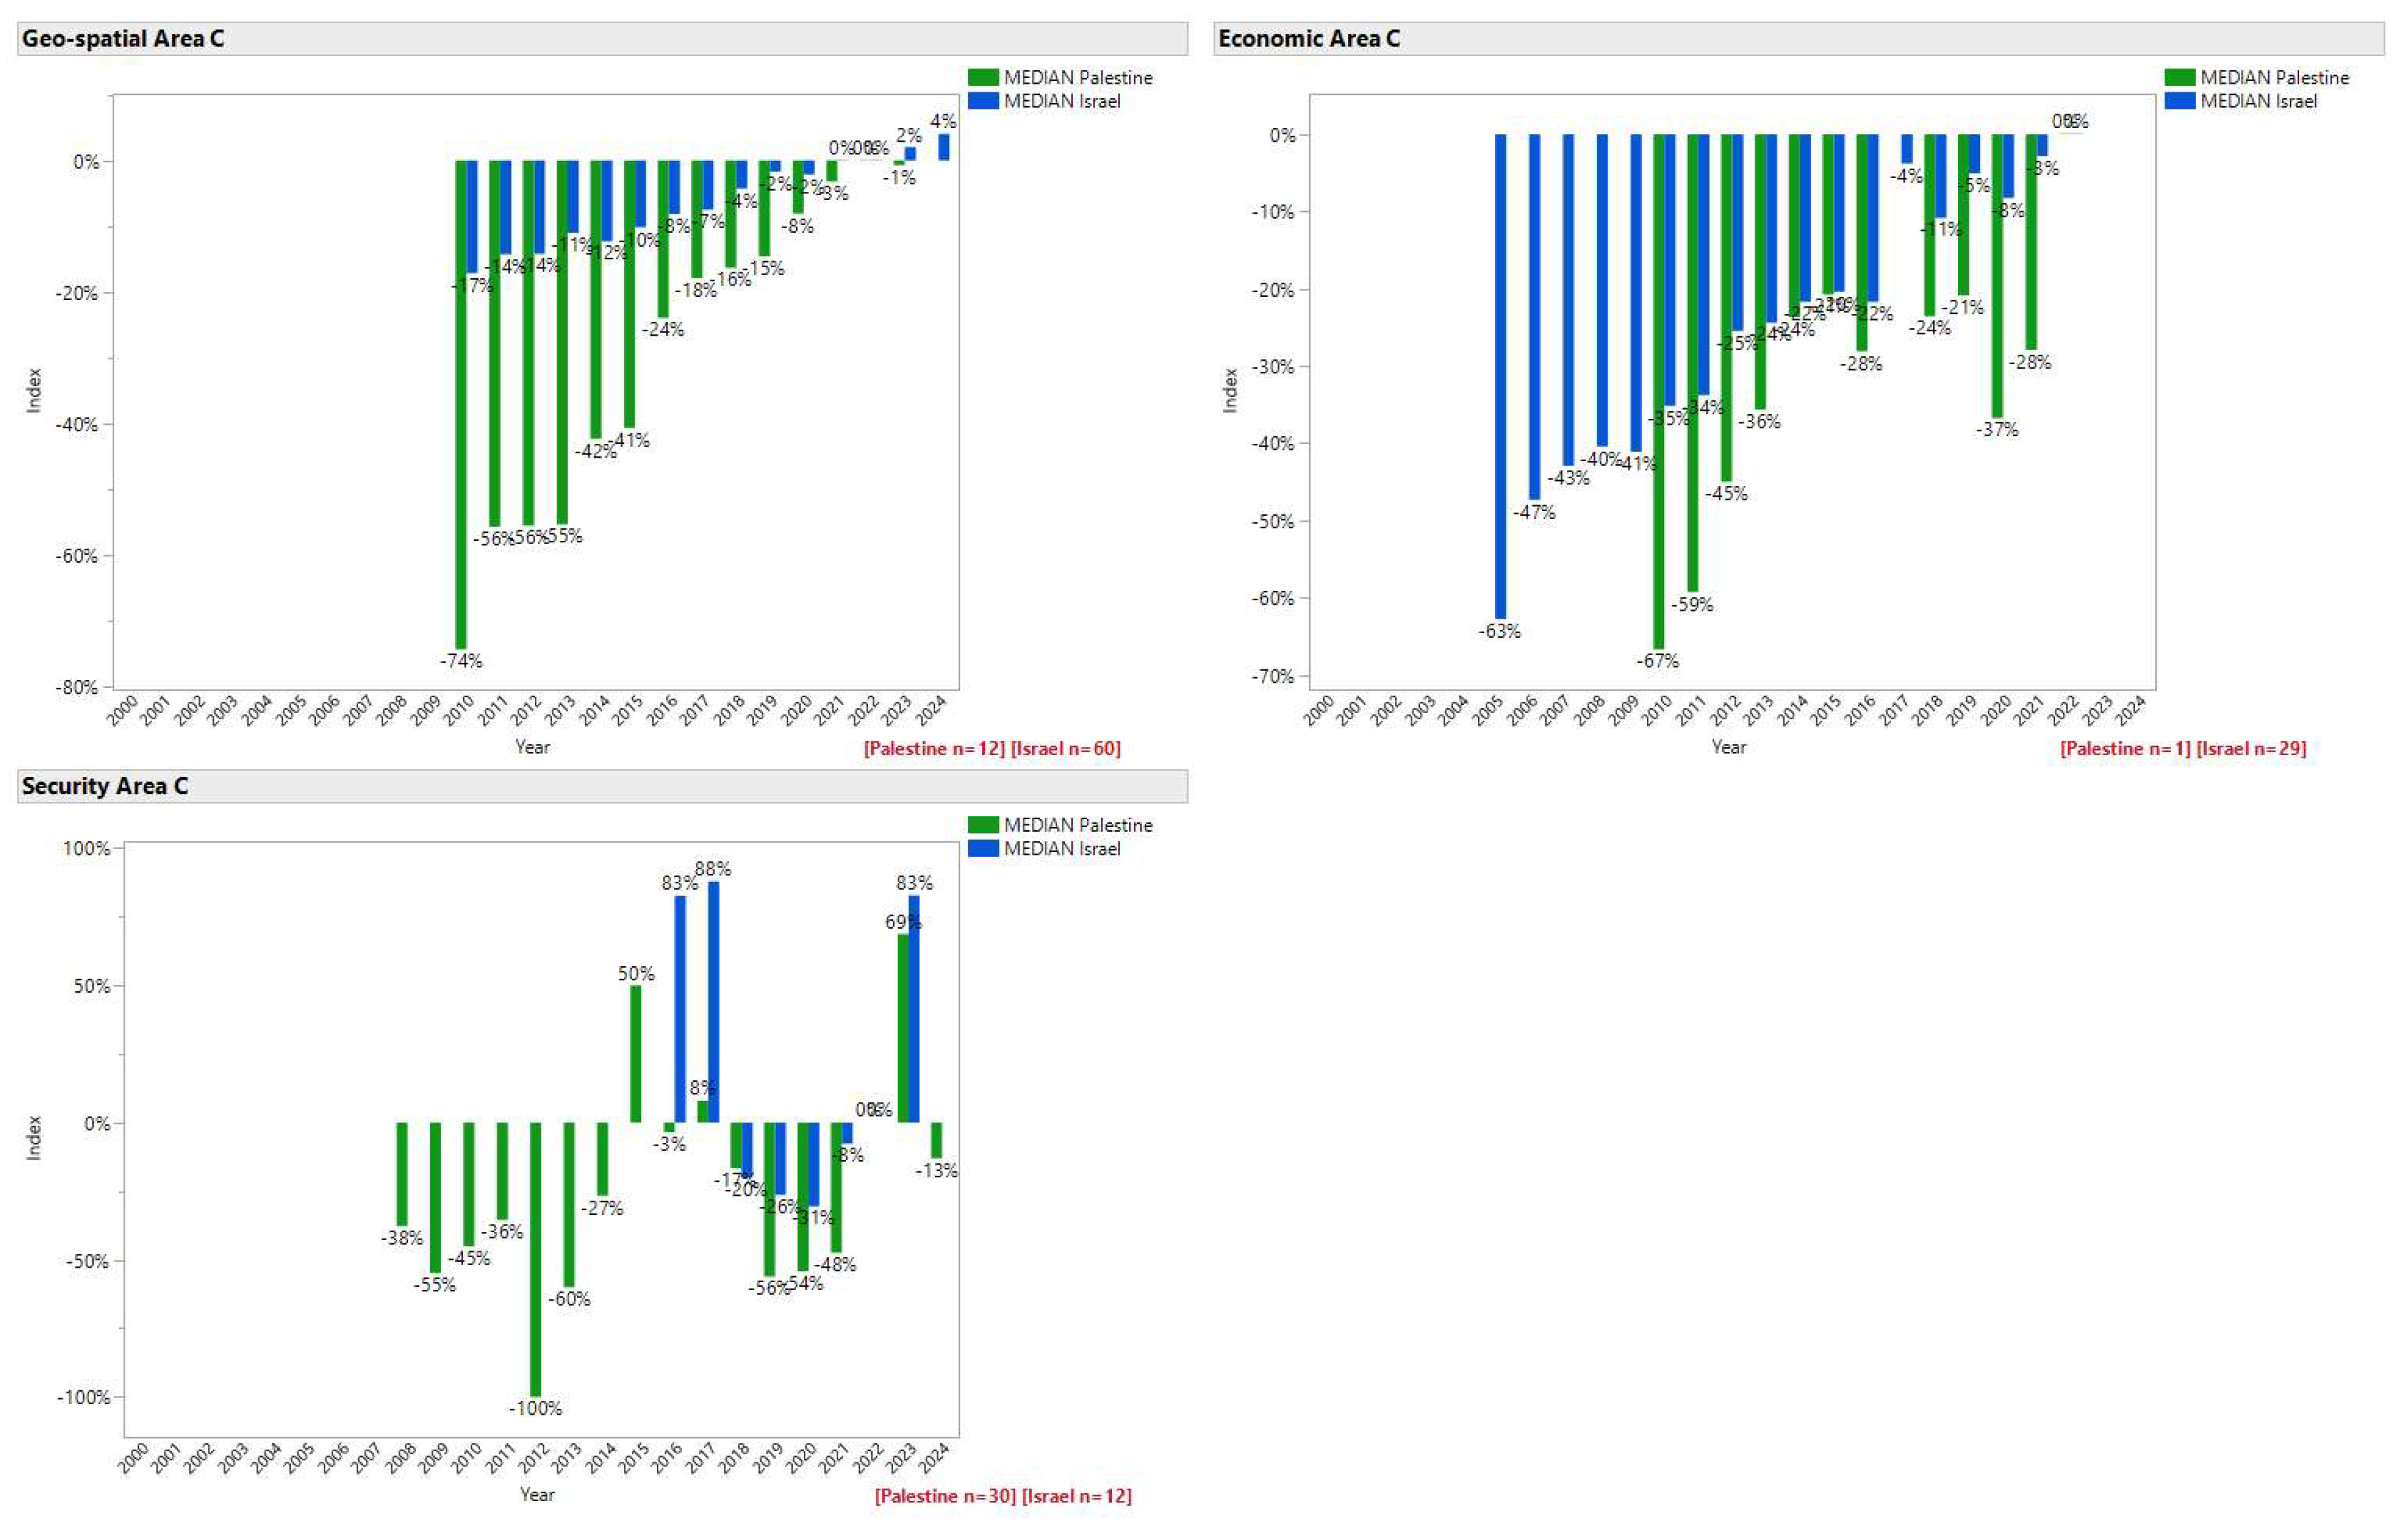
Figure 5.
T-Politography DST generic scenario based on indicators with ~80% of the contribution to Palestinian social impact.
Figure 5.
T-Politography DST generic scenario based on indicators with ~80% of the contribution to Palestinian social impact.
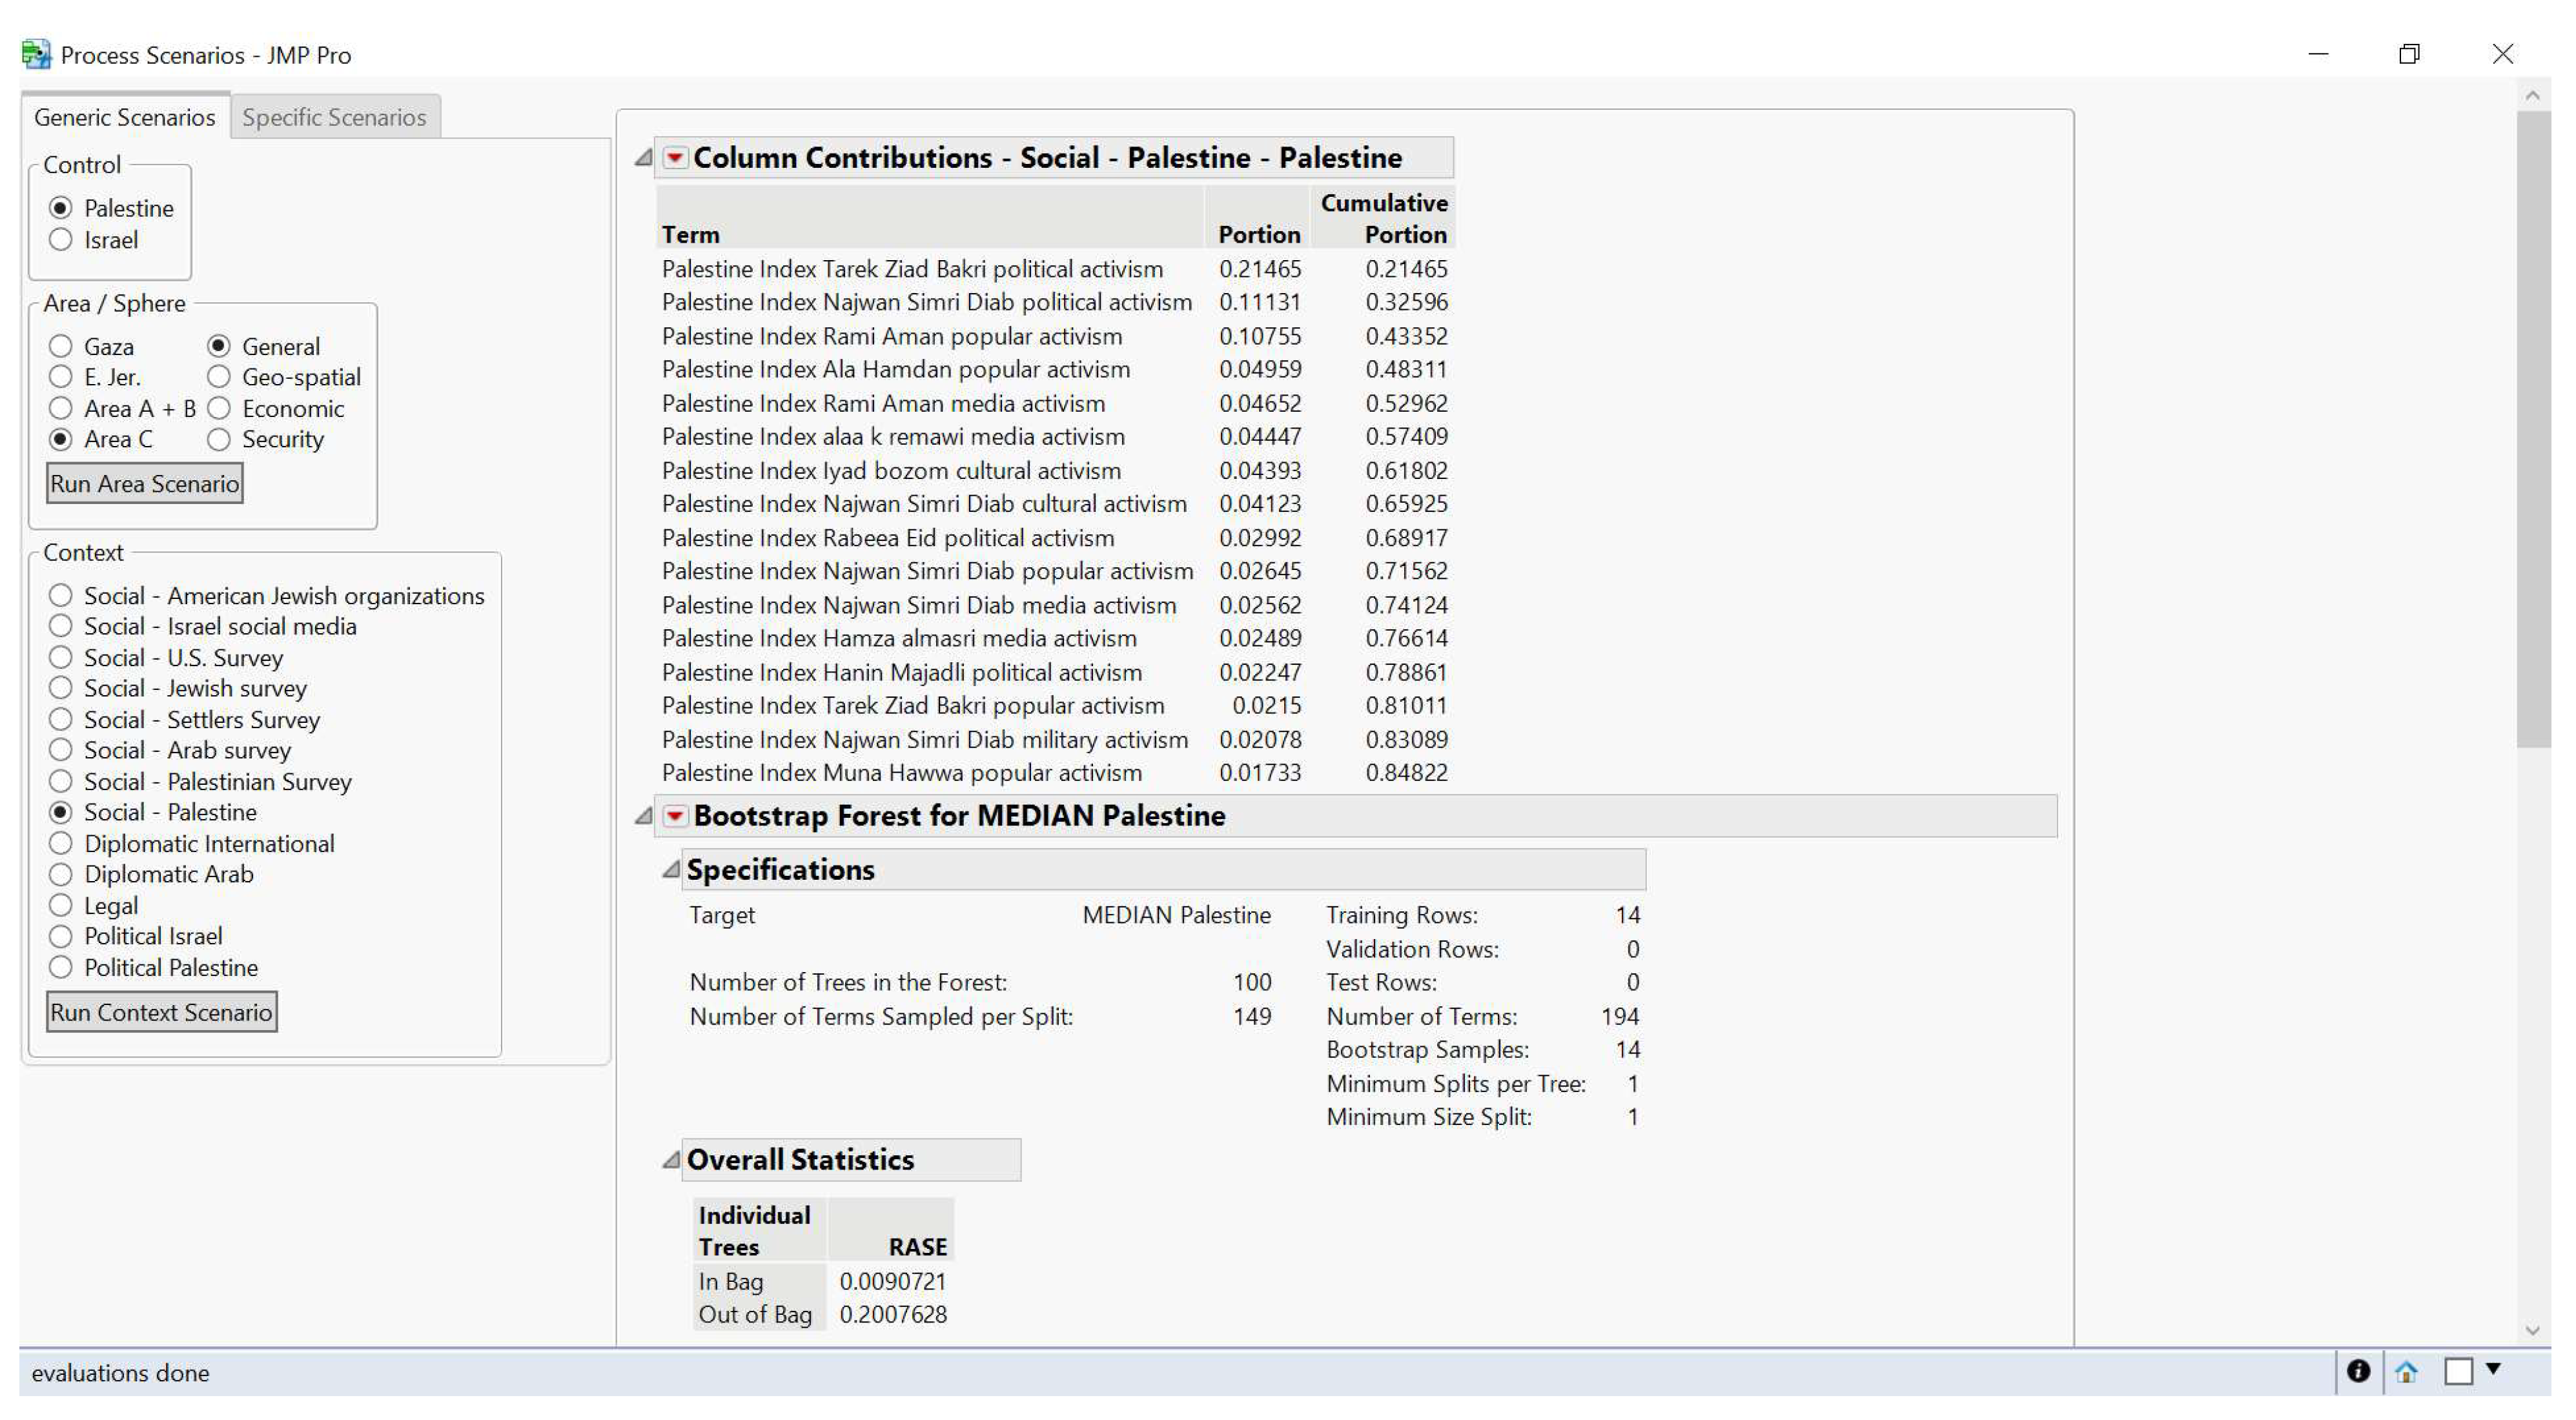
Figure 6.
T-Politography DST scenario answering the question: What are the factors influencing Israeli or Palestinian control over area C?
Figure 6.
T-Politography DST scenario answering the question: What are the factors influencing Israeli or Palestinian control over area C?
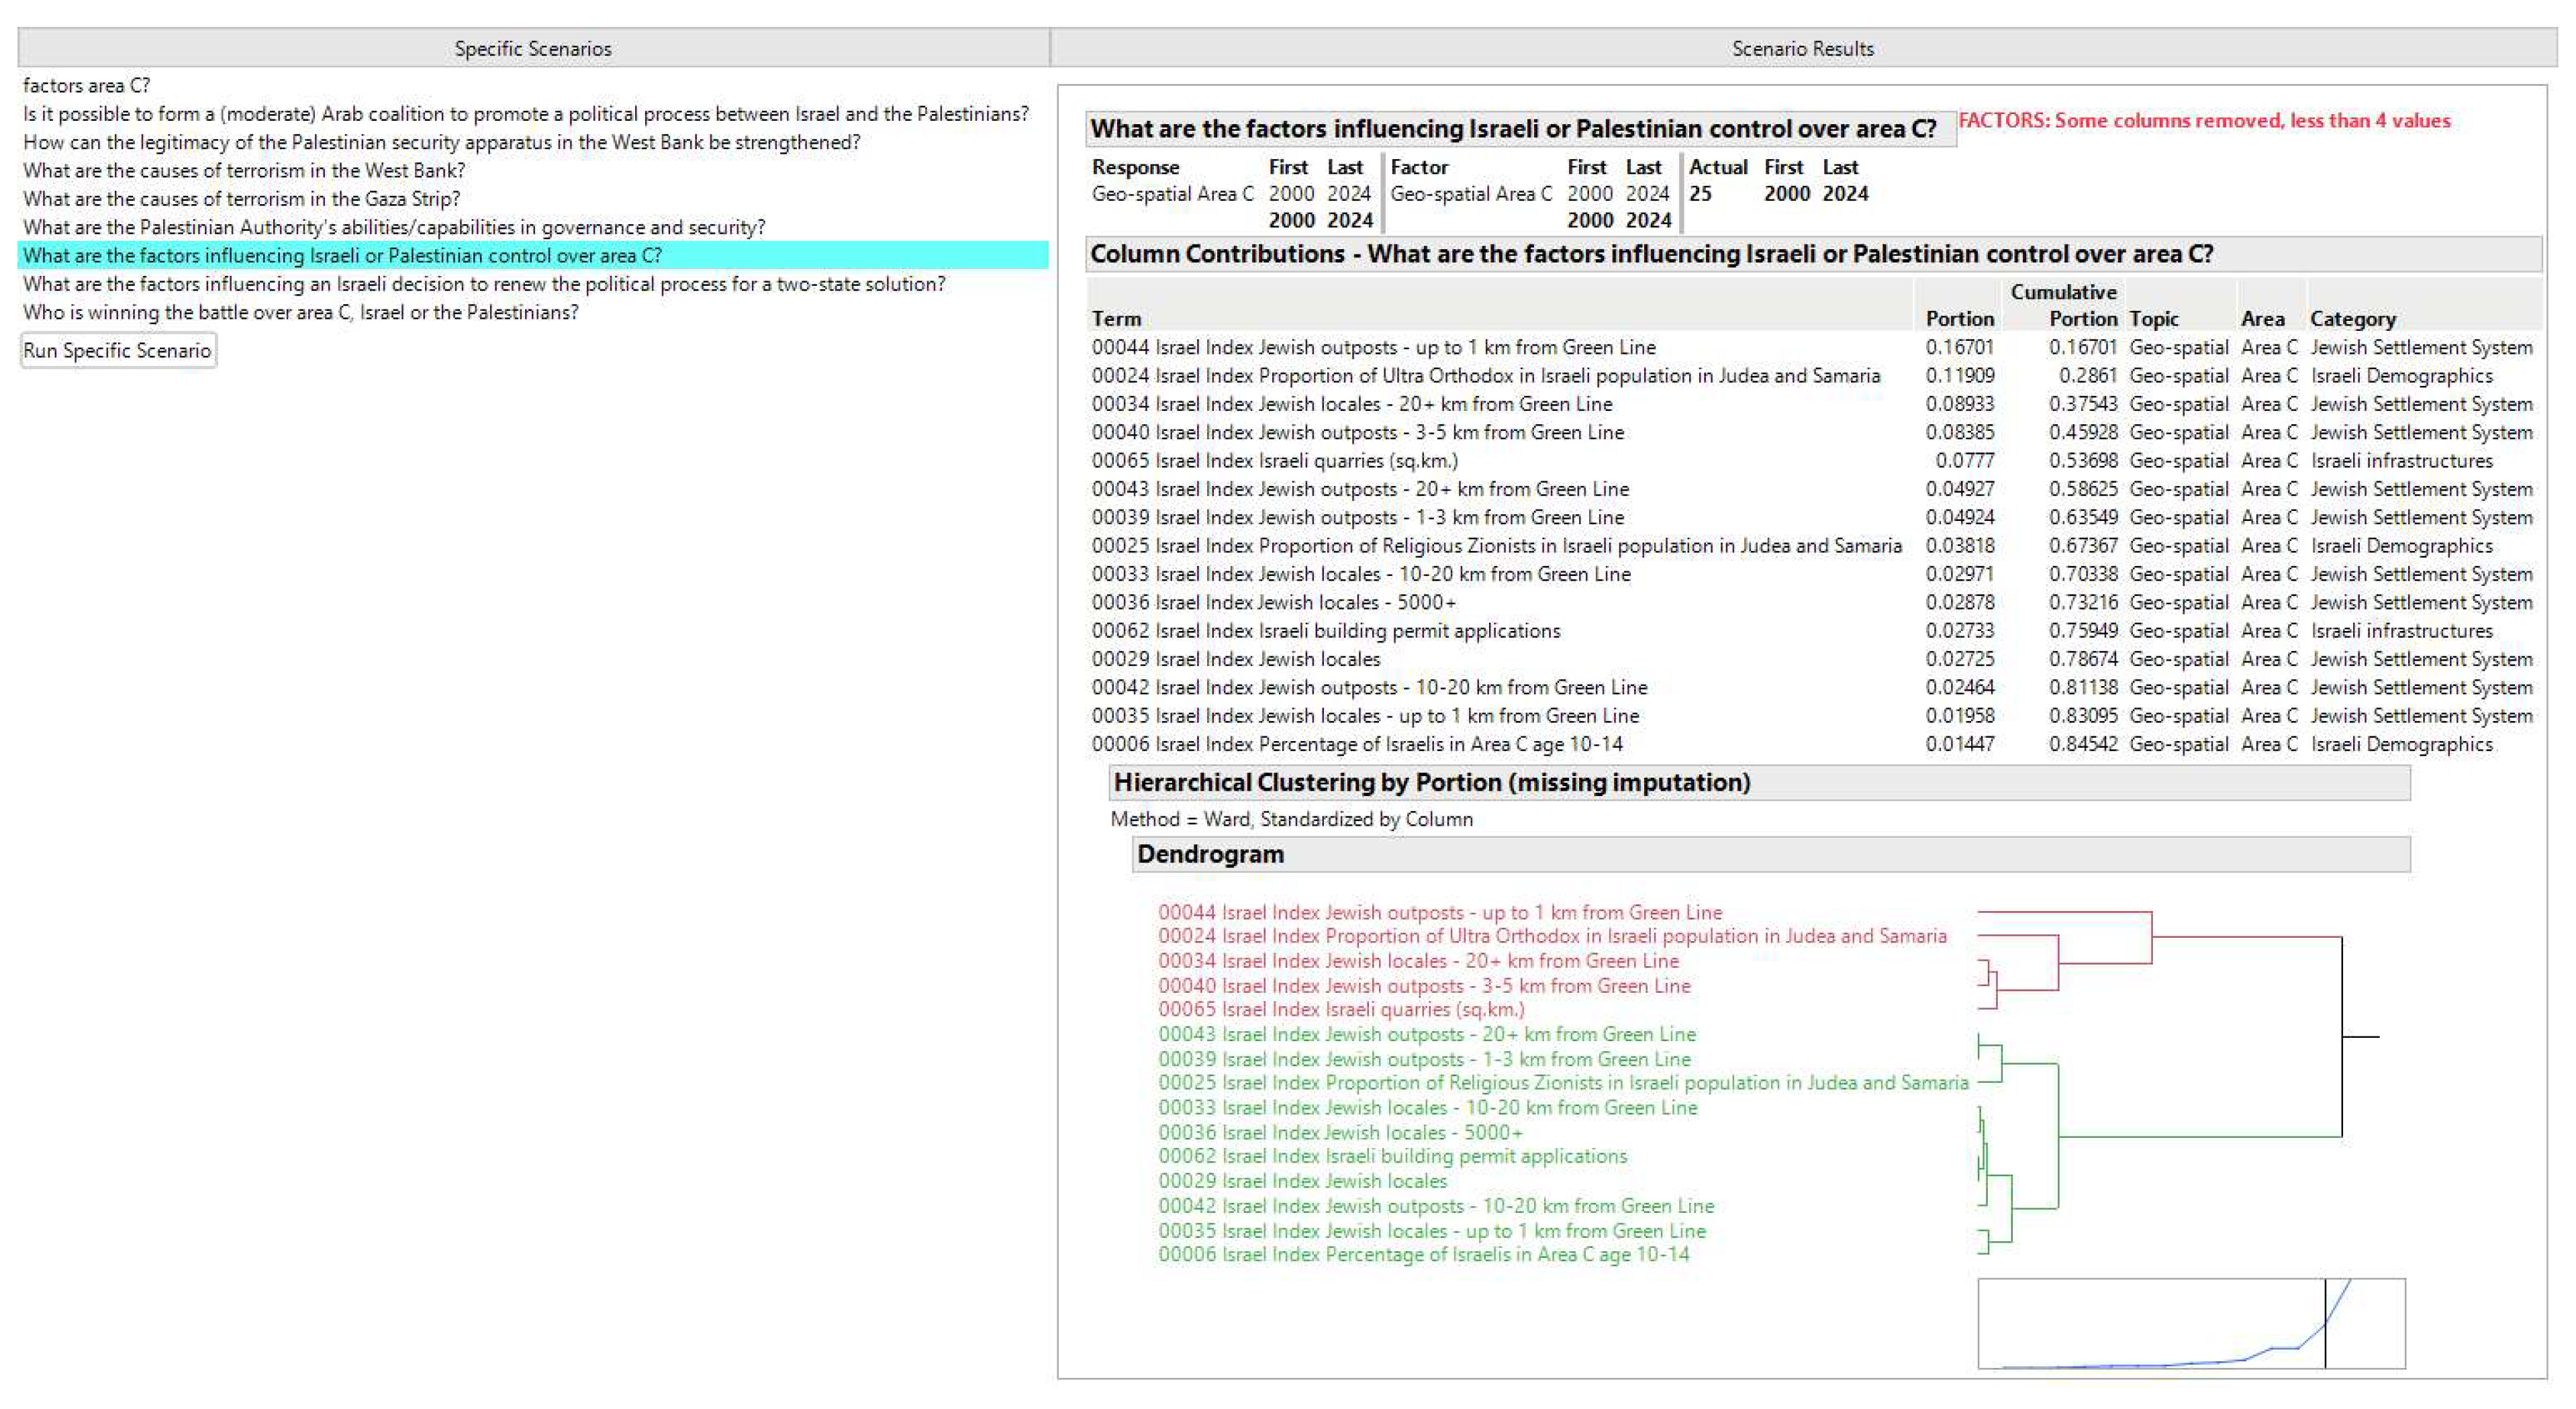
Figure 7.
For illustration only – Relative control levels determined by composite indices calculated by desirability functions.
Figure 7.
For illustration only – Relative control levels determined by composite indices calculated by desirability functions.
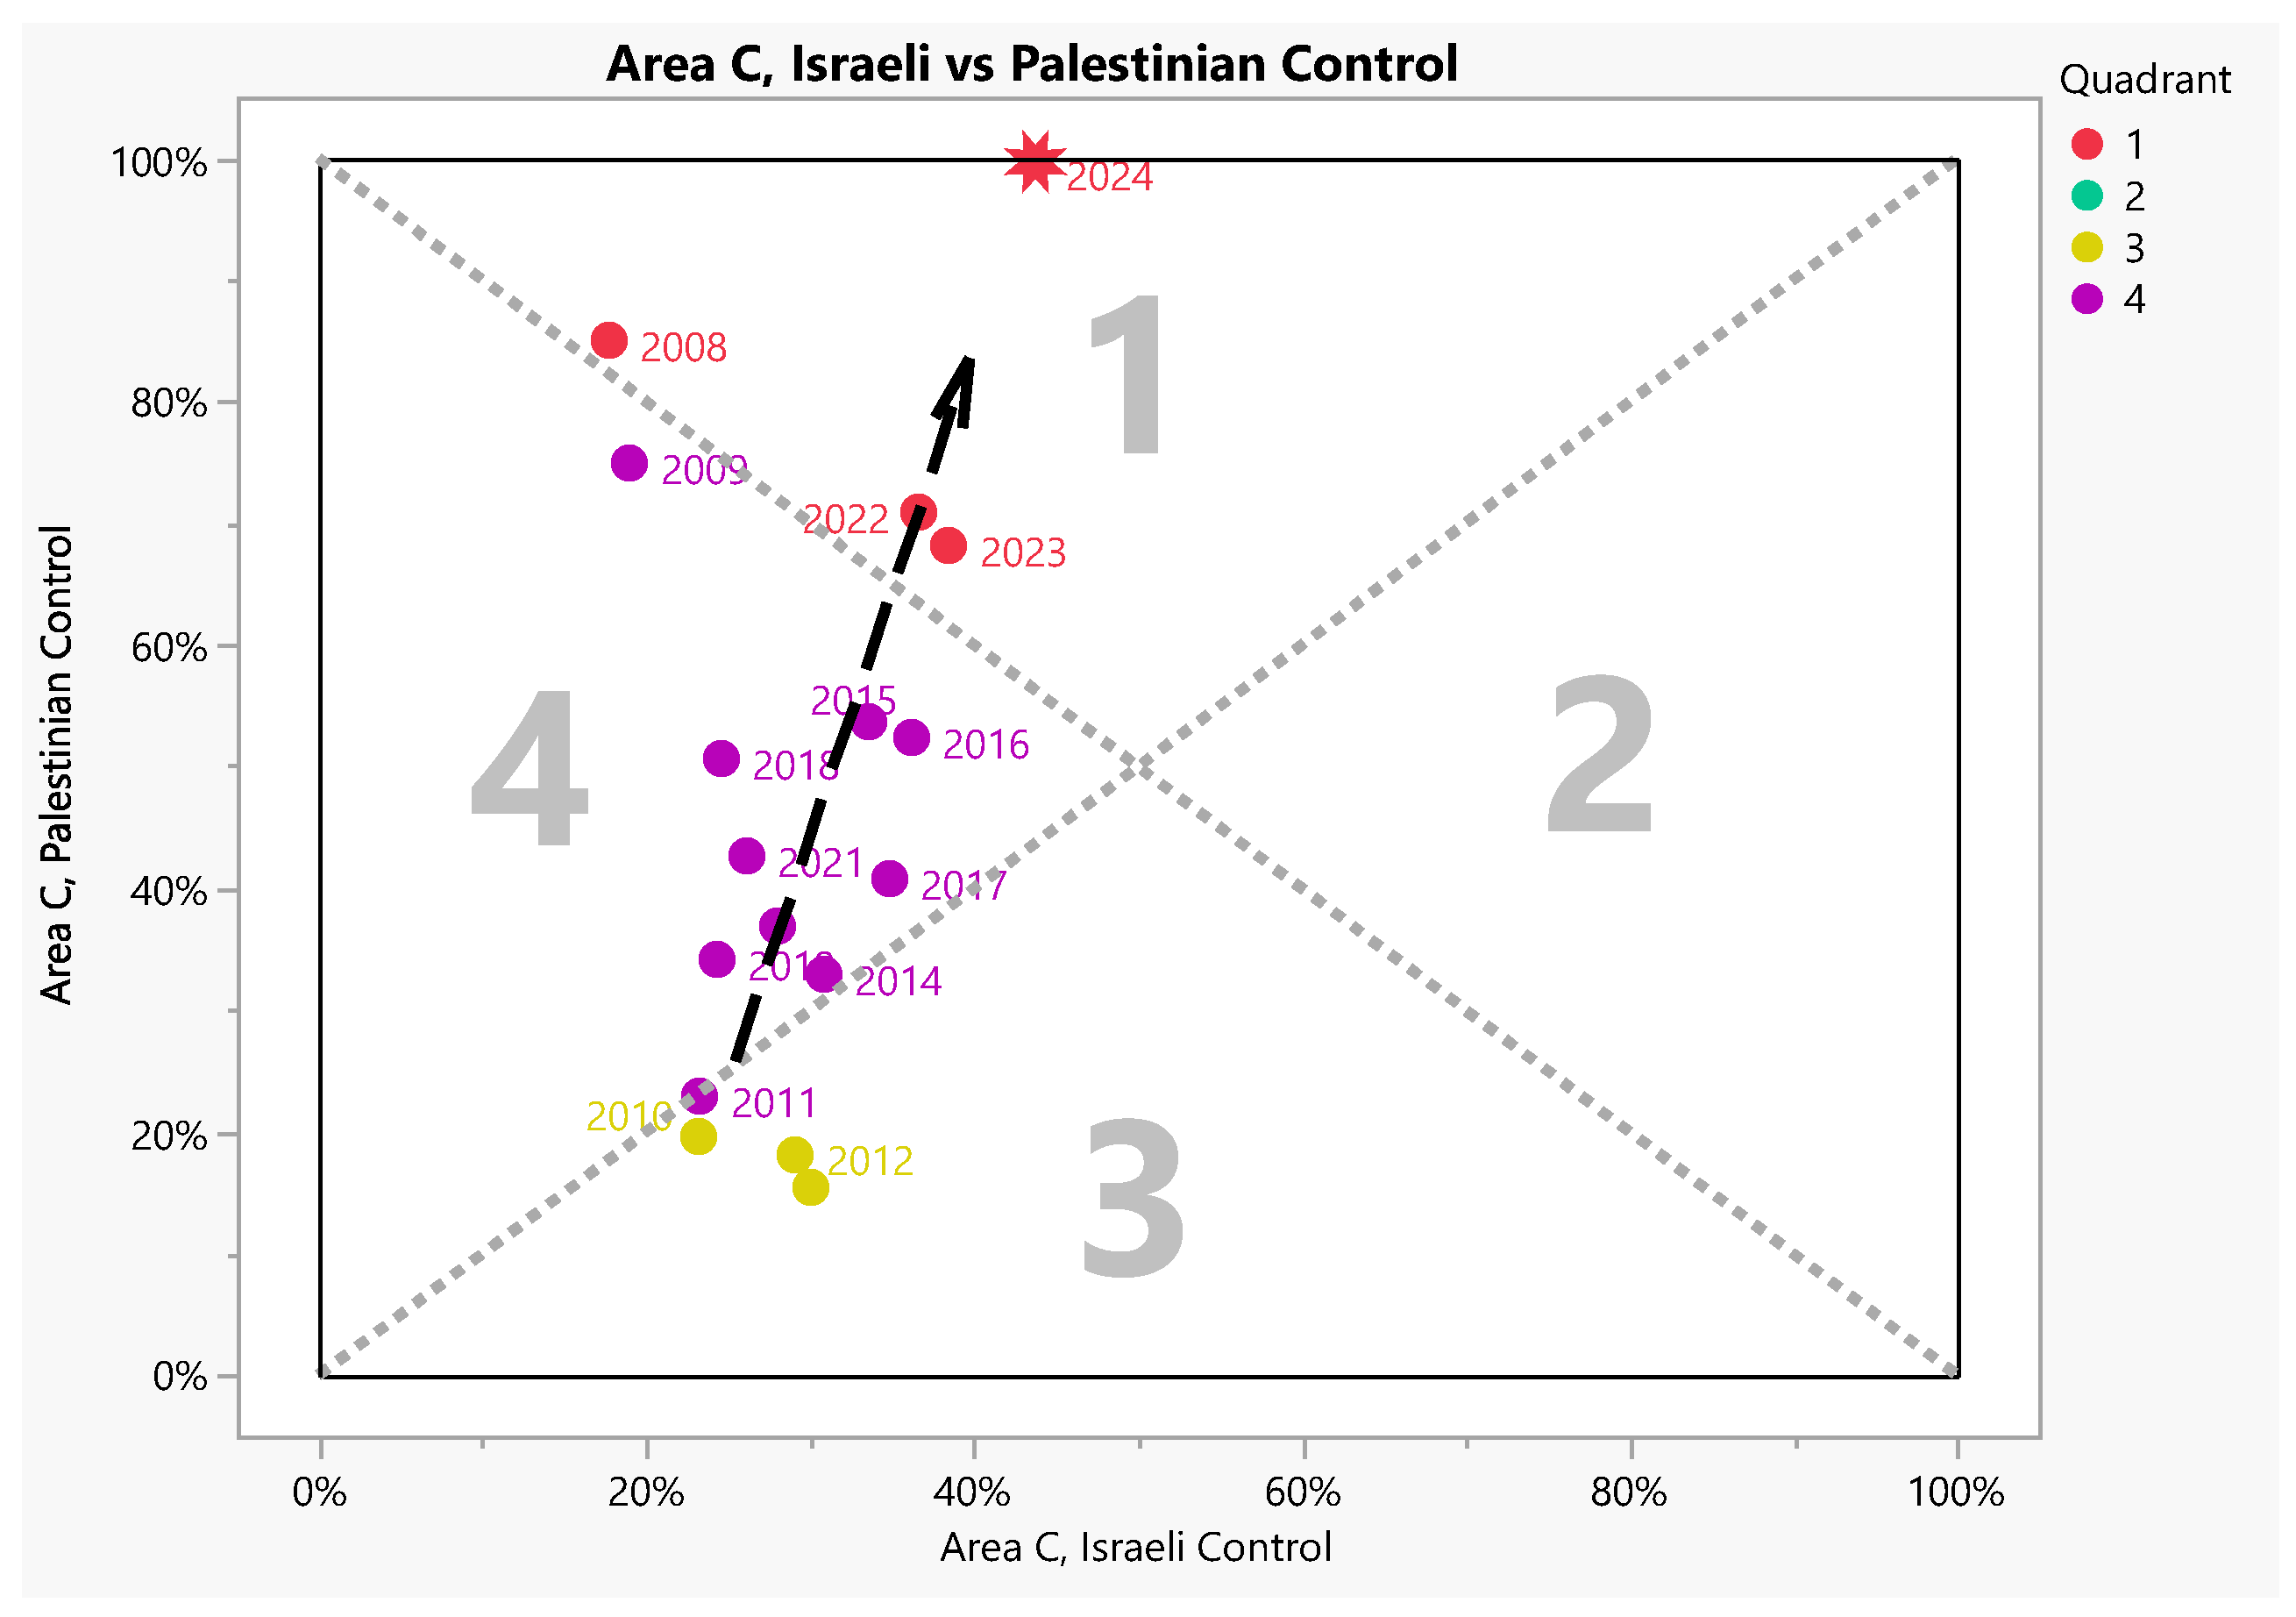
Figure 8.
Bayesian network of data in Table 1.
Figure 8.
Bayesian network of data in Table 1.
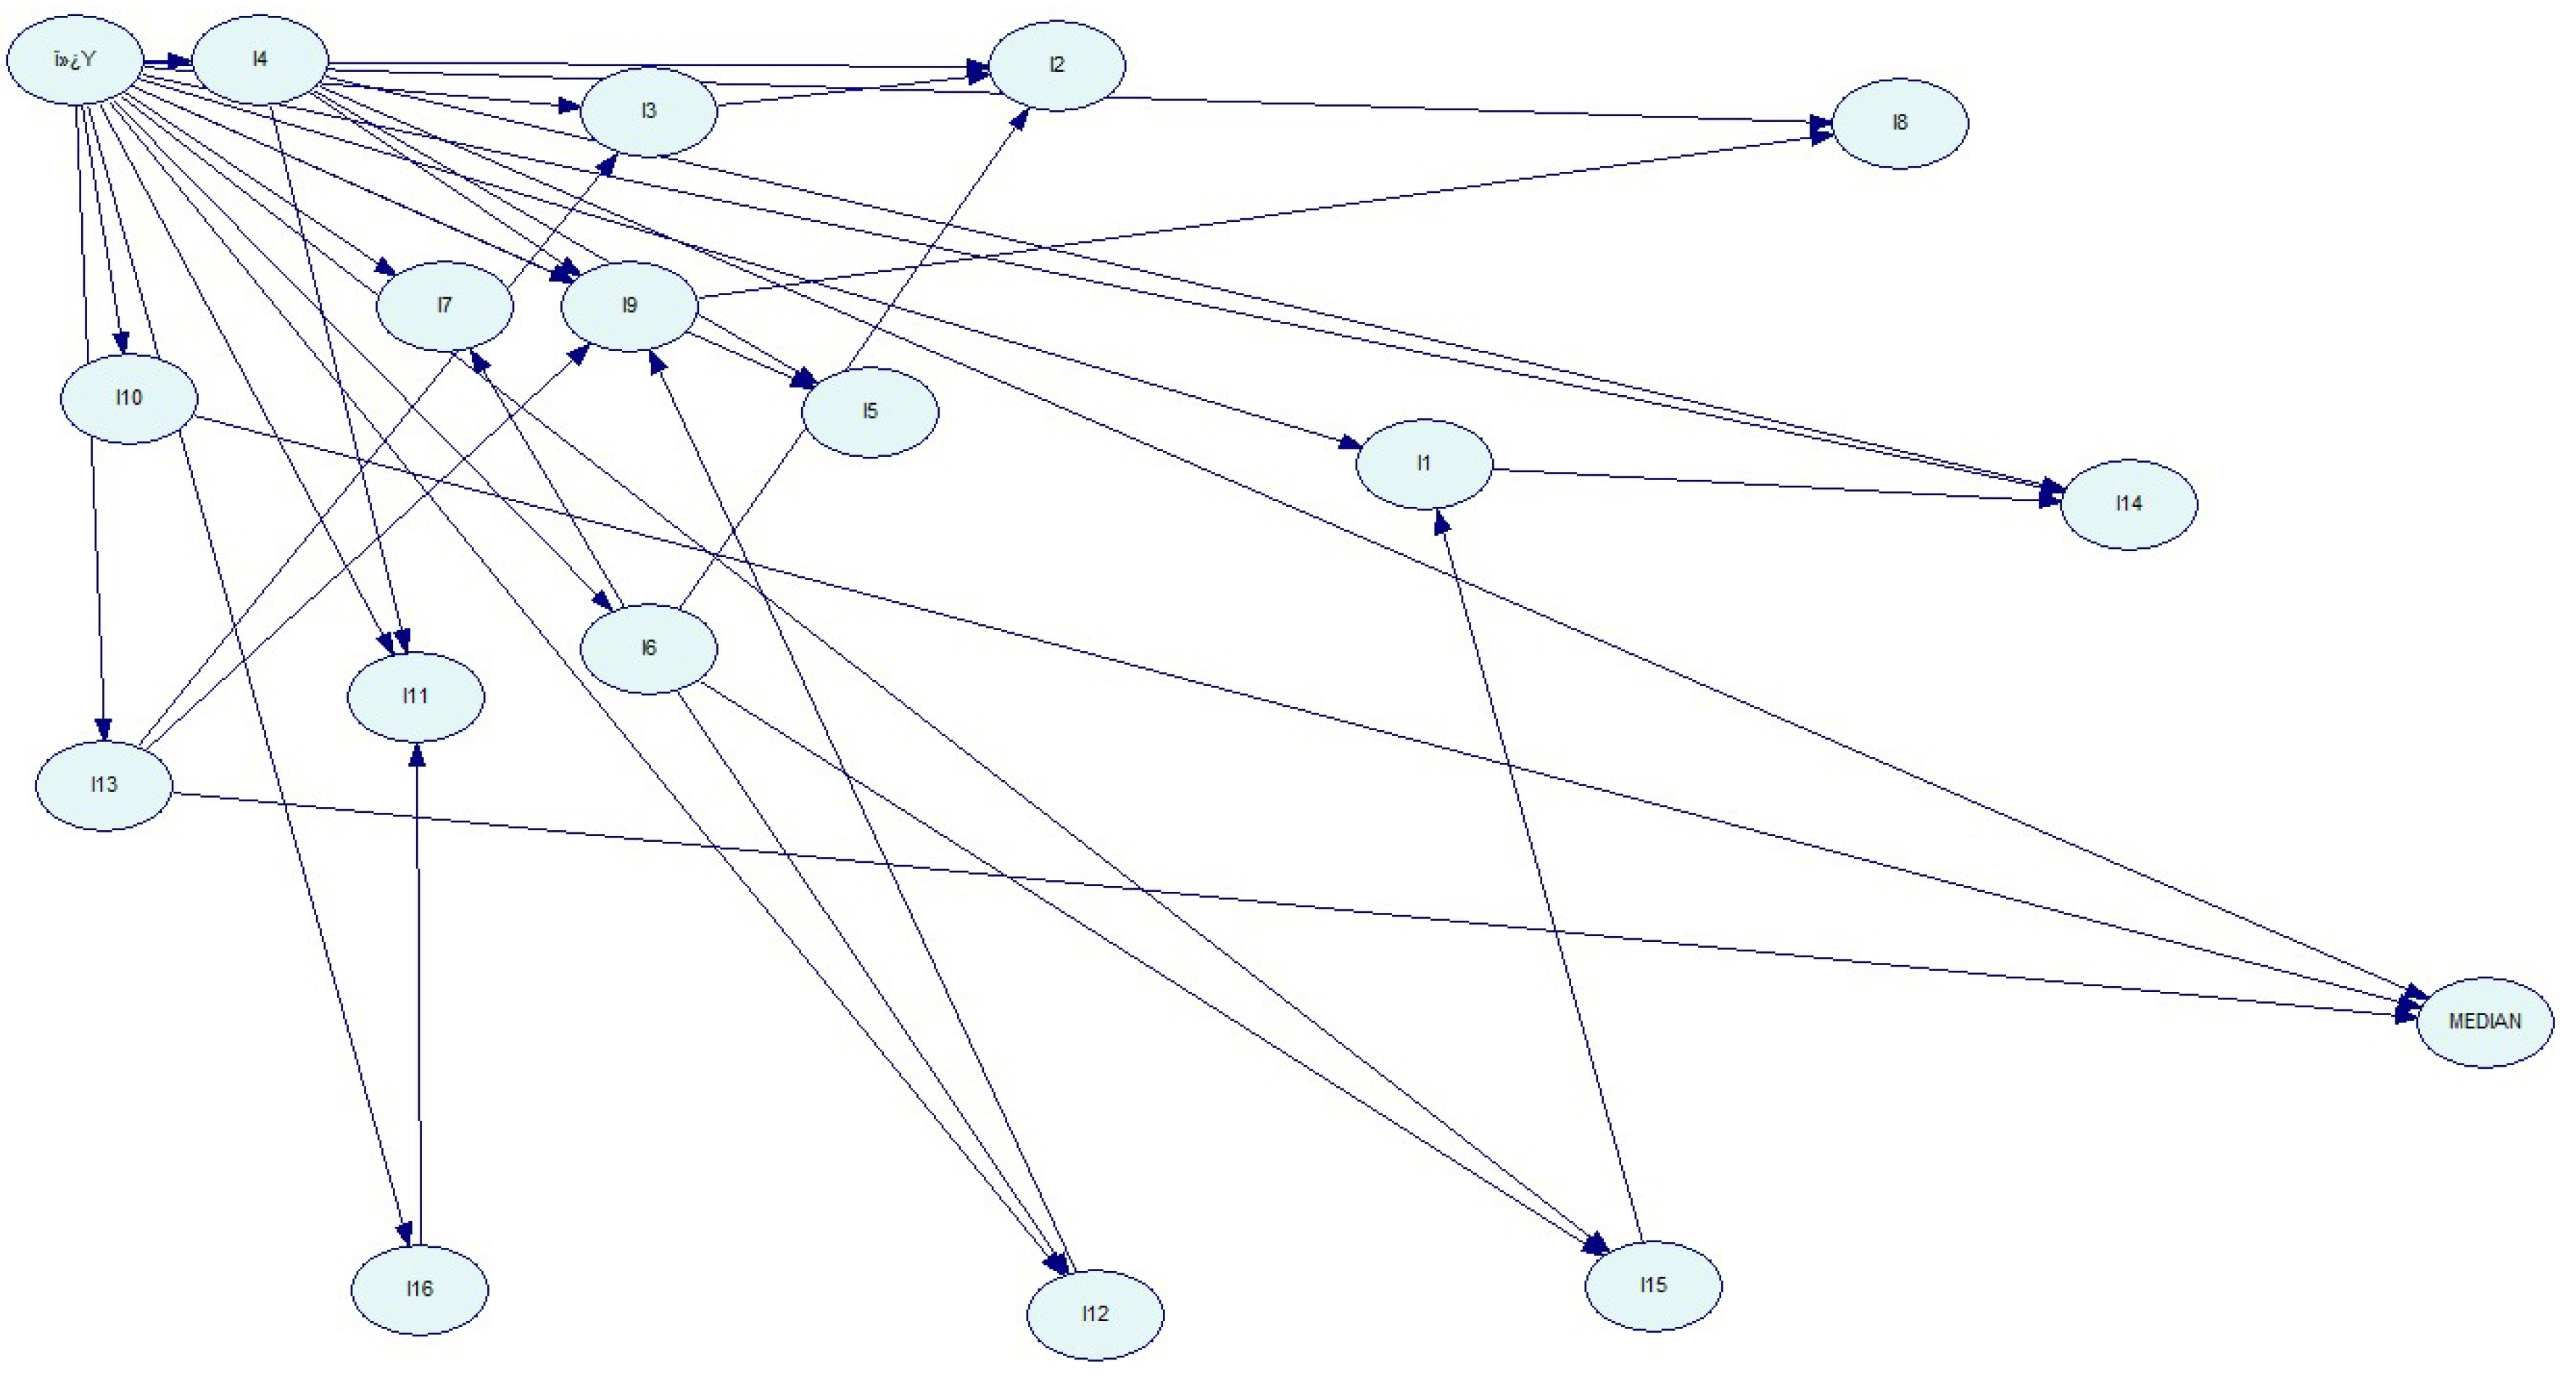
Figure 9.
Bayesian network of data in Table 1, conditioned on year 2010.
Figure 9.
Bayesian network of data in Table 1, conditioned on year 2010.
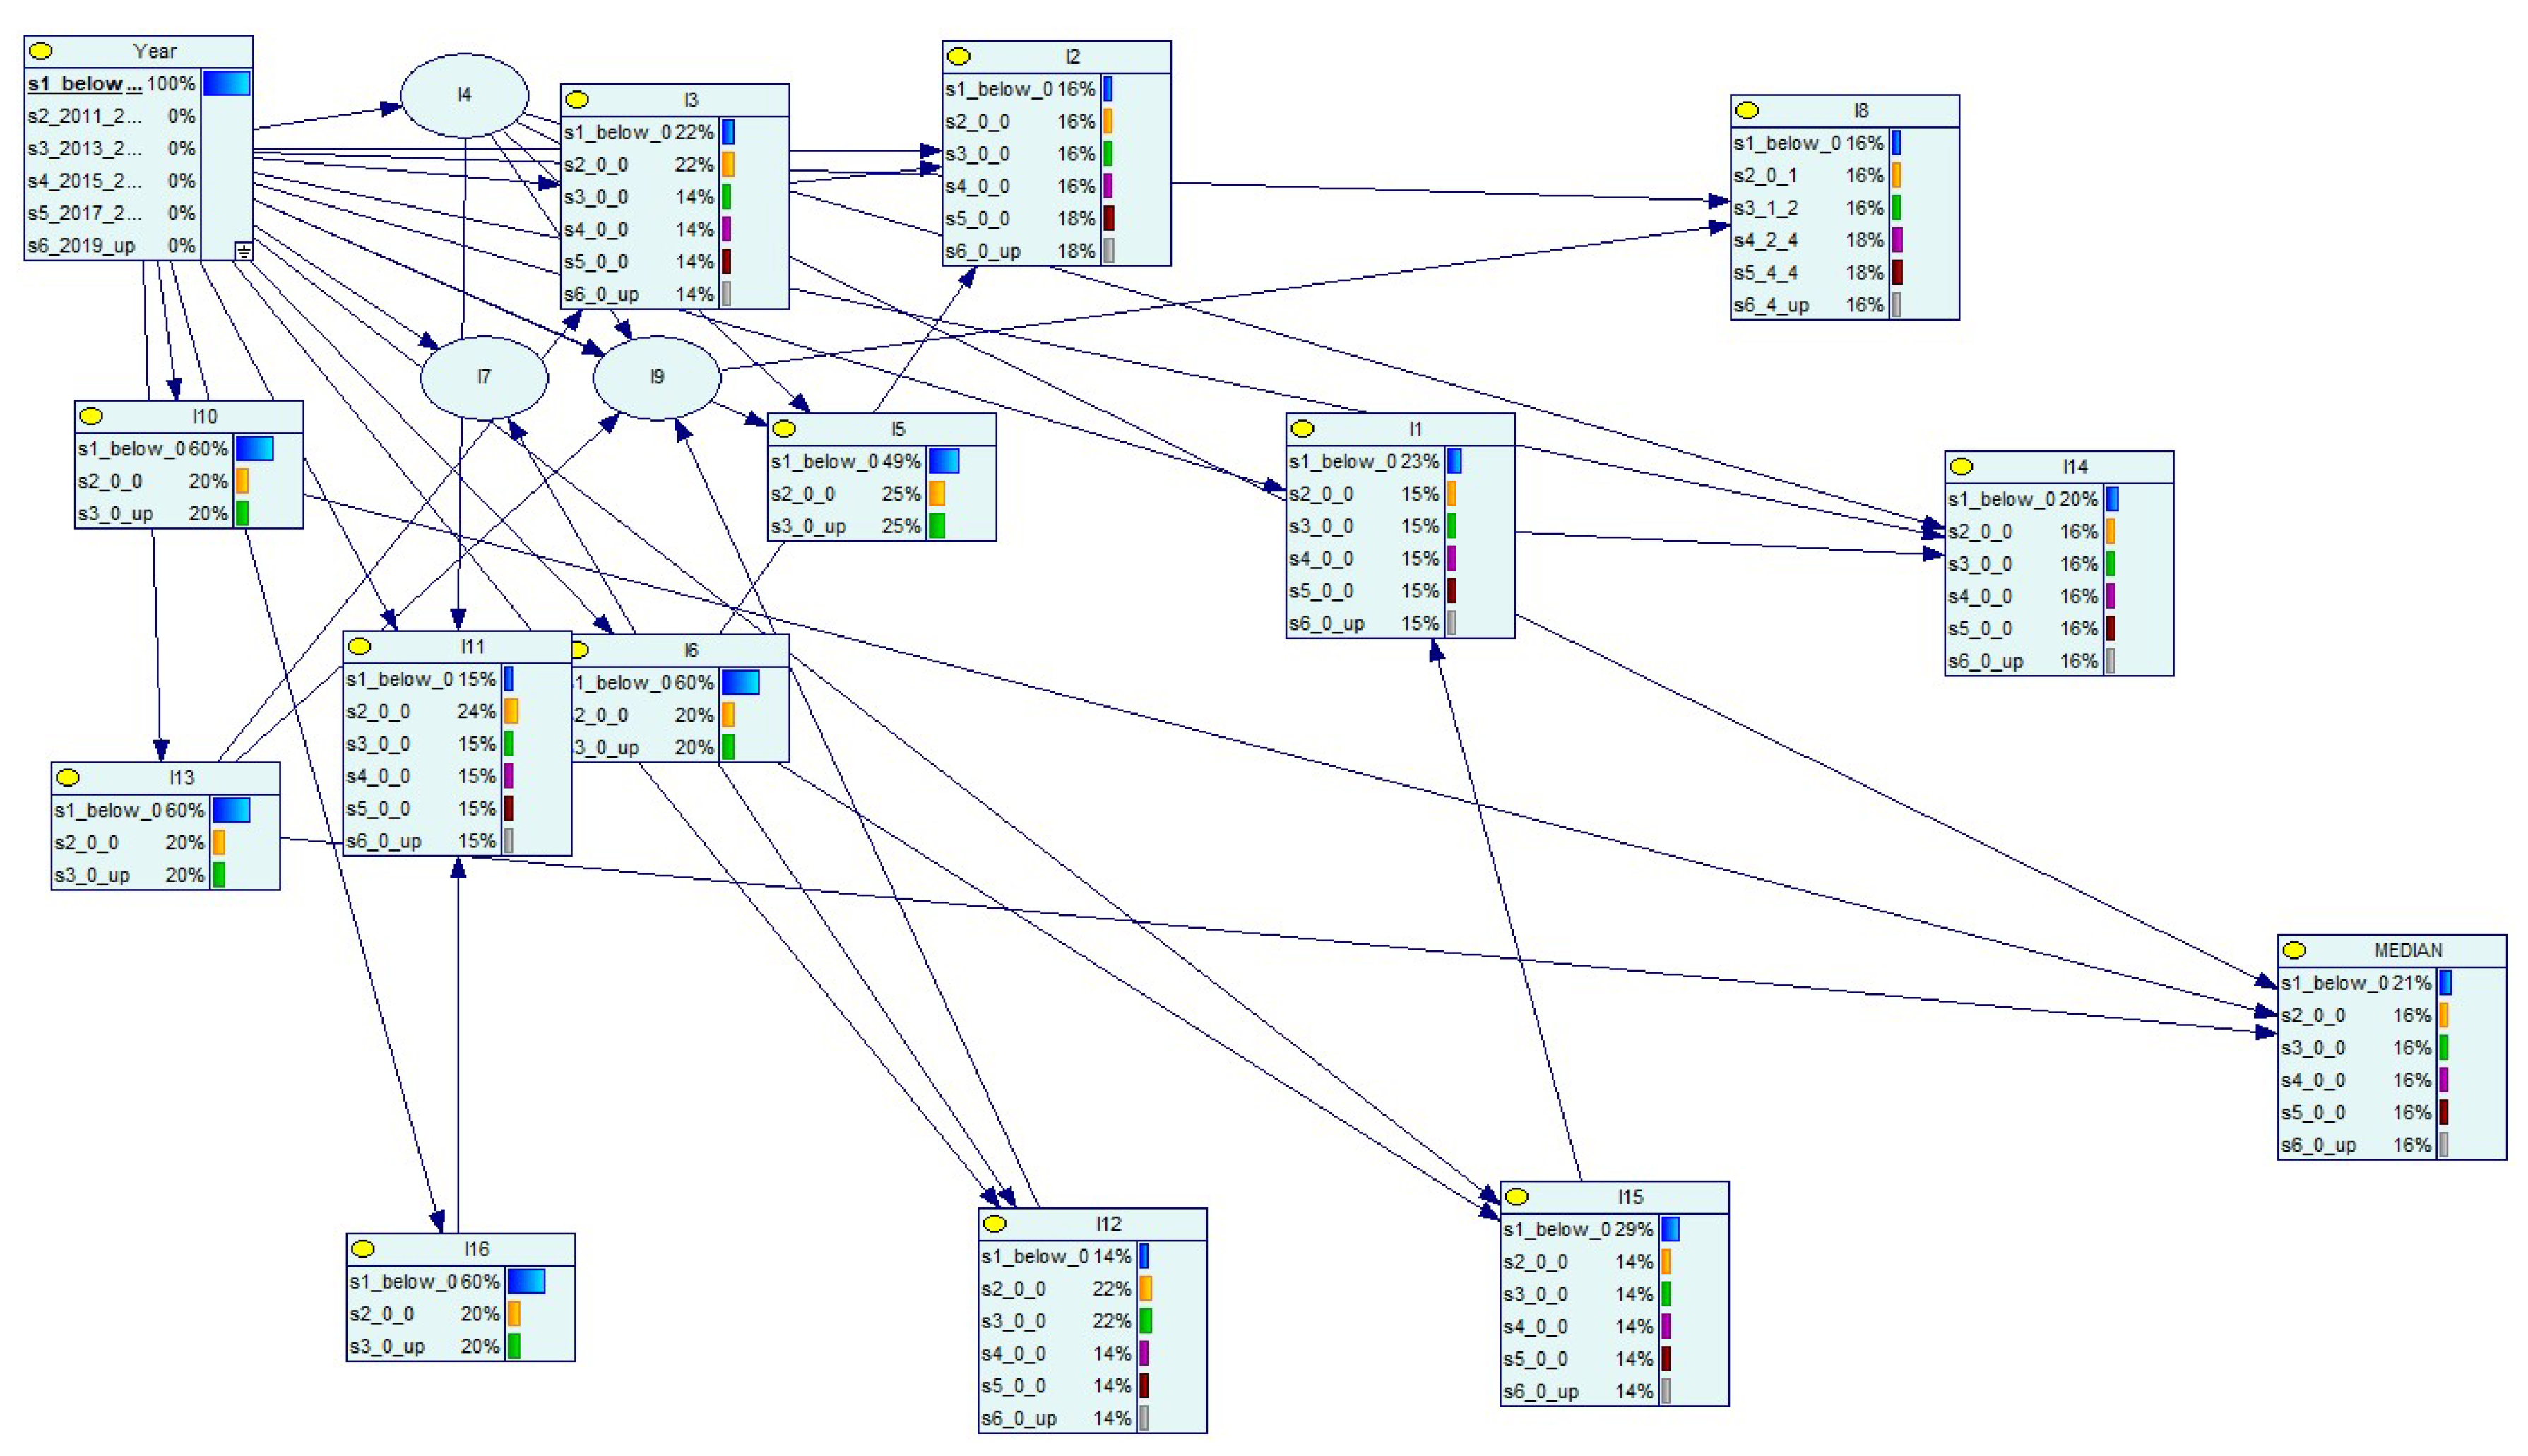
Figure 10.
Bayesian network of data in Table 1, conditioned on years above 2019.
Figure 10.
Bayesian network of data in Table 1, conditioned on years above 2019.


Table 1.
Data analyzed with Bayesian network.
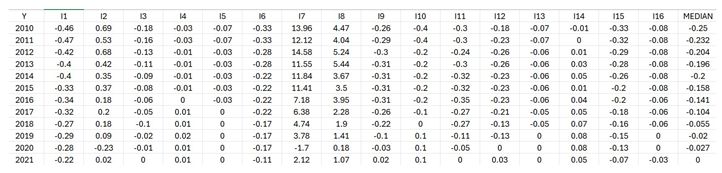 |
Table 2.
Discretized data analyzed with Bayesian network.
 |
Disclaimer/Publisher’s Note: The statements, opinions and data contained in all publications are solely those of the individual author(s) and contributor(s) and not of MDPI and/or the editor(s). MDPI and/or the editor(s) disclaim responsibility for any injury to people or property resulting from any ideas, methods, instructions or products referred to in the content. |
© 2024 by the authors. Licensee MDPI, Basel, Switzerland. This article is an open access article distributed under the terms and conditions of the Creative Commons Attribution (CC BY) license (http://creativecommons.org/licenses/by/4.0/).
Copyright: This open access article is published under a Creative Commons CC BY 4.0 license, which permit the free download, distribution, and reuse, provided that the author and preprint are cited in any reuse.


