Submitted:
20 September 2024
Posted:
23 September 2024
You are already at the latest version
Abstract
The Cyber Security Incident Response Team executes its critical duties in the Centralized Security Operation Centers. Its primary target is to protect organizational resources from all types of Advanced Persistent Threats (APT) and attacks while making the correct judgments at the right time. Despite the great efforts and the efficient tools, the incident response mechanism faces two significant challenges. The generation of large amounts of alerts with huge rates of false positives per unit of time and the time-consuming manual expert engagement in the post-alert decision phase. The main aim of this research study is to investigate the potential of Machine Learning techniques in solving the above challenges. This study proposes six event detection modules to identify 14 different types of malicious behavior using Splunk. The available APT dataset is extended by adding more alert types. Then, the machine learning techniques i.e., Random Forest, and XGBoost, are applied to improve the decision process and reduce the false positive alerts of the Security Information and Event Management system. The proposed model outperforms the state-of-the-art techniques by predicting an accuracy of 99.6%.
Keywords:
Cybersecurity Incident Response
; Machine Learning
; Security Information and Event Management
1. Introduction
The cyber incident is analogous to a catastrophe as it is unexpected, sudden, and crucial. If the cyber incident is not quickly alleviated, it causes severe damage. These damages often worsen when a cyber incident is unmanageable for a longer time. For example, the adversary can destroy or withdraw confidential data. Moreover, in a recently published report [1], 20 percent of the companies report a loss in revenue, business opportunities, and a decrease in the number of their customers due to security incidents.
The companies implement incident response procedures to identify, hold, and abolish cybersecurity incidents. The incident response consists of a plan of action preparation, incident detection, limiting the adversary, removal of the adversary, healing from the incident, and post-accident tasks [2]. The incident Response Frameworks i.e., SysAdmin, Audit, Network, and Security (SANS) [3], and National Institute of Standards and Technology (NIST) [4] help companies in the formation of systematic incident response procedures.
The Cyber Security Incident Response Team (CSIRT) [5] is trained to hold and respond to cybersecurity incidents. The CSIRT discovers threats, prepares methods, and trains end users to mitigate cybersecurity incidents [6]. The CIRT uses Security Information and Event Management (SIEM) [7] tools like Splunk [8], QRadar [9], to analyze the log in real-time. The SIEM tools collect security logs from different devices like servers, firewalls, etc. These tools generate alerts for CSIRT if a cybersecurity incident is found.
Due to the huge streams of alerts received per unit of time in Security Operation Centers (SOC), CSIRT teams find it difficult or impossible to handle threats and attacks on time. Unfortunately, many incidents and attacks are missed. Another problem is the large amounts of false positives that overload the system and negatively impact its efficacy. Moreover, manual intervention of experts is required in many stages in the last post-alert phase, which slows the decision process [10].
We proposed a novel framework to enhance security event identification and reduce false positive alerts. The proposed framework includes many core elements to solve the above-mentioned problems. Firstly, we proposed six event detection modules to identify more malicious behaviors using a specific set of Indicators of Compromises (IOCs). These modules can detect 14 different types of malicious behavior using different Splunk queries. Secondly, the Advance Persistent Threat (APT) alert dataset [11] is extended by adding additional alert types, giving the system a large number of APT indicators. Thirdly, Machine Learning (ML) techniques i.e., Random Forest and Extreme Gradient Boosting (XGBoost) are trained and tested using the extended APT dataset. The proposed model improved the APT detection accuracy up to 99.6% and reduced false positive alerts generated by Splunk. The main contributions of the research study are as follows.
- To detect critical malicious behavior, we extended the APT alert dataset with more alert types using Splunk.
- To reduce false positive APT alarms, we re-engineered existing processes and developed an advanced learning framework with an accuracy of 99.6%.
- To automate the incident response process by reducing manual intervention in the post-alert decision using ML techniques.
The rest of the paper is structured as follows. In Section II, we summarize preliminaries and related literature. In section III, we detailed the proposed framework. In Section IV, we present the implementation and evaluation of the result in detail. Similarly, the conclusion of this work is drawn in section V.
2. Preliminaries and Related Literature
The following subsections discuss SIEM, ML, and literature related to CyberSecurity Incident Response optimization Using ML techniques.
2.1. Overview of Security Information and Event Management
SIEM was introduced by Mark Nicolett and Amrit Williams in the technical report of Gardner in 2005 [12]. SIEM combines Security Information Management (SIM) and Security Event Management (SEM) citesecurity. The SIM is used to store, analyze, and report log events. Similarly, SEM is used to monitor and correlate real-time events. Therefore, SIEM can be defined as it is a tool that gathers, analyzes, and validates log data [13]. Moreover, SIEM uses either rule-based or statistical events correlation and provides the log data in human-readable format i.e., reports and alerts. The core functionalities of SIEM are discussed in the following subsection.
- Log Collection: Network Devices like switches, hosts, firewalls, etc, generate log data. There are two methods defined for log data collection i.e., agent-based and agent-less [14]. In the agent-based method, an intermediary agent collects log data and then forwards it to the next module. Similarly, in the Agent-less method, there is no intermediate agent and the server gets data directly from the servers.
- Log Aggregation: It is a procedure for gathering, analyzing, and capturing structured data from the log data generated by network devices. In the literature [14], two methods are used for log data collection i.e., push and pull. i) Push: The network devices like switches, firewalls, etc, send logs to the servers. ii) Pull: The servers drag the log data from the network devices.
- Parsing: It is a procedure for transforming the log data into structured data. In a network environment, multiple parsers are used to transform log data received from multiple devices like firewalls, server switches, etc.
- Normalization: It receives log data from multiple sources and converts it into one standard reduced format. It removes the redundant logs from the log data.
- Threat analysis: SIEM identifies adversaries by comparing log data with the records in a known threat database. During threat analysis, SIEM uses statistical methods to identify different threat patterns.
- Response: SIEM is a very efficient tool because it can detect malicious activity quickly before it can cause serious damage. It has built-in pre-defined real-time alerts and a notification system.
- Reporting: SIEM tools contain different custom reporting templates for data visualization. Moreover, the data collected by SIEM is available to data analysts and experts for investigation.
2.1.1. SIEM’s Architecture and Components
The layered architecture of SIEM is depicted in Figure 1. It comprises a SIEM Engine, log collection, log sources, and presentation layer [14]. The SIEM architecture collects logs generated by different sources like servers, firewalls, applications, etc. Then, the SIEM engine filters the duplicate events and correlates the filtered events to find malicious activities. Moreover, the analysis result is displayed in the form of a report or alert at the presentation layer. The SIEM architecture also stores the log data for future analysis. The SIEM provides functionalities like threat detection, log storage, incident response, and threat reporting.
Gartner’s SIEM Magic Quadrant annual report [15] has categorized SIEM solutions into niche, challengers, leaders, or visionary. Splunk is a well-known SIEM tool recognized as a leader by the Gartner report.
2.1.2. Splunk: Implementations of SIEM
It is used to process log data and present it in a human-readable format. It consists of two modules i.e., the processing module and management module [16]. A high-level Splunk architecture is present in Figure 2. Furthermore, the processing module consists of forwarders, Indexers, and search heads [17]. The forwarders gathered log data from the network devices and forwarded it to other Splunk processing components. Similarly, an indexer is used to index and store log data. Furthermore, the search head analyzes the log data and generates visual graphs and reports. Similarly, the deployment server, license master, Indexer cluster master node, search head cluster deployer, and monitoring console are the sub-components of the management module.
Splunk can be deployed in two ways i.e., single server deployment and distributed deployment [18]. The single server deployment is used either to test Splunk components or for learning purposes. Similarly, in a multi-server deployment, the Splunk components are installed on several servers in a distributed manner.
2.2. Introduction to Machine Learning
ML is an Artificial Intelligence (AI) application that enables a system to learn from its experiences. ML identifies patterns in a given data and generates predictions. ML has gained much attention due to its applications in diversified domains like Image processing, digital forensics, incident response, etc [19]. ML is also known as learning from data. Conventional softwares are based on deduction methods whereas ML is based on induction methods. Therefore, an ML algorithm automatically discovers rules by looking at many examples, and these practices can then be applied to other similar data. The following are the well-known ML models in the existing literature.
2.3. Random Forest
Random Forest [20] is a powerful ML classifier that combines the predictions of multiple decision trees. The working of random forest can be divided into the following three steps. 1) Random Forest begins by extracting random samples from the original data by using either sample with replacement or random feature selection method. This randomness in the training phase protects the model from overfitting. 2) Then, a decision tree is generated for each sample. 3) Finally, the Random Forest combines the predictions of each decision tree using either classification or regression. The Random Forest is well known because of its simplicity, usability, and potential to deal with large-size datasets.
2.4. XGBoost
XGBoost [21] is an improved version of the gradient boosting technique to reduce the loss function. It is an ensemble ML model that combines numerous decision trees to generate a strong prediction model. Unlike random forests, which build trees separately, boosting builds trees consecutively, with each new tree attempting to remedy the flaws committed by the preceding ones. Moreover, it uses L1 and L2 regularization techniques to avoid overfitting. XGBoost classifier is famous for its speed due to parallel processing, accuracy, and ability to work with large-size datasets.
2.5. Related Works
Cybersecurity has strongly accepted ML in various fields i.e., botnet identification [22], malware, and intrusion detection [23,24,25]. This research focuses on the application of ML to enhance and automate decision-making in the post-alert stage of SIEM systems. The related works are discussed in the following paragraphs.
In [11], the authors have developed an efficient ML-based model to detect APT attacks quickly and accurately. The model consists of three core phases i.e., APT attacks detection, correlation, and prediction. The model detected the APT attacks with a true positive rate of 81.8% and a false positive rate of 4.5%. However, the accuracy is still low and needs to be improved. Similarly, the authors, in [26], have proposed a framework to protect organization workstations and servers from APTs. Agents are used to monitor these computers. The agents perform two functions i.e., security violation identification and alert generation. The proposed TerminAPTor module correlates the alerts generated by agents using Information Flow Tracking (IFT). This IFT is used to detect APTs. However, the authors simulated only two APT scenarios which resulted in high false positive alerts. Similarly, the proposed context-based framework introduces a conceptual attack model called the attack pyramid [27]. It has defined sensitive data at the top level and the lower levels consist of a platform for recording events related to the APTs. However, sufficient knowledge is required to set up the framework.
The authors, in [28], discussed the deployment of ML to categorize and predict SOC alerts. The proposed solution aims to reduce human analyst intervention by automating the process of threat detection using an ML model. The proposed ML model depends on the response from five senior SOC experts. Each expert shares his experience in handling the alerts. They used a Random Forest Classifier while the dataset was generated using SIEM. Although the aim was to automate the decision-making concerning false positive alerts, the final decision was still taken by the experts. Similarly, the authors, in [29], have proposed an efficient ML-based threat detection model with minimized false positive alerts. To select standardized threat use cases, several MITRE’s taxonomies (ATT&CK, CAPEC, and MAEC) were examined. KMeans is used to analyze uploaddownload data traffic, because of its simplicity and fast grouping ability. Linear regression and Random Forest were used to identify malicious activities while SVM was used to identify malicious child and parent activities. Moreover, the authors have claimed that existing intrusion detection mechanisms are inefficient and proposed context-aware IDS by integrating ML and DRL models [30]. The robustness of the proposed model is enhanced by integrating the denoising autoencoder. The proposed model is trained and tested using NSL-KDD, UNSW-NB15, and AWID datasets. The authors claimed that the proposed model showed better accuracy and less FPR as compared to their counterparts. However, the proposed model is not tested in real-world scenarios. Moreover, a quick ML-based incident response approach is proposed in [31]. The authors generated their APT dataset by analyzing 2.5 million log events. The dataset consists of a thousand vectors, where each vector contains nine features labeled as either positive or negative. ZeroR, OneR, SVM, NaiveBayes, J48, and Random Forest classifiers were trained and tested. The Random Forest attained a high accuracy of 95.54% using the extracted APT dataset.
Moreover, in [32], the authors have proposed a spam and junk mail detection mechanism based on Bayesian spam filtering. They identified APT’s behavioral patterns and proposed a novel self-destructive method to protect individual or organizational data from APTs. Furthermore, several classification models i.e., random forest, KNN, XGBoost, etc., are used on four different datasets i.e.,e CSE-CIC-IDS2018, CIC-IDS2017, NSL-KDD, and UNSW-NB15, to detect APT at the early stage [33]. However, Random Forest and XGBoost were selected as the base classifiers. Then, the simple classifier aggregator is used to merge the predictions of the two classifiers. The proposed hybrid model was then trained and tested on the four different datasets. The summary of the existing related works is presented in Table 1.
Finally, the state-of-the-art APT detection mechanisms face several challenges i.e., high false positive rate, detection of APT in early stages, new APT scenarios, and behavior. To address those challenges, we proposed a novel mechanism for APT detection.
3. Overview of the Proposed Framework
The proposed architecture uses an advanced ML Technique for Cybersecurity Incident Response (CIR) optimization. The proposed architecture consists of an Event Logging, Event Detection Module, Alert Correlation Module, and Reporting as shown in Figure 3.
3.1. Notations
The notations used in this section are given in Table 2.
3.2. Event Logging
The following logs were collected from the hosts. Splunk collects log files from different sources i.e., Syslog, MySQL Logs, Apache Access Logs, DNS logs, FTP server Logs, and Authentication Logs. The components of an event are given in Eq. 1.
Formally, we defined a log file as a set of events i.e., set records all the events generated in a system as shown in Eq. 2.
3.3. Event Detection Module
The event detection module is proposed to detect malicious behavior in a log of events. We use Splunk to collect log files from different sources like firewalls, routers, hosts, and servers. Splunk examines these logs against malicious behavior indicators to detect malicious behavior. If a malicious behavior is detected then Splunk generates an alert. We proposed six sub-modules for malicious behavior detection i.e., unusual network traffic, unusual system behavior, user behavior, file behavior, malicious IP, and malicious domain as shown in Figure 3. Each module generates an alert when a specific behavior is detected.
3.3.1. Unusual Network Traffic (UNT) Behavior Detection:
The Splunk query is used to detect Unusual Network Traffic as shown in Table 3. Unusual Network Traffic detection can be an indicator of several stages in the APT life cycle i.e., Command and Control, Exfiltration, and Maintenance. 1) Command and Control (C2): An unusual network traffic pattern can be produced when the adversary uses non-standard communication methods to reach the compromised host. 2) Exfiltration: Extracting sensitive data from the compromised host can increase network traffic. 3) Maintenance: The attacker performs additional activities to maintain communication with the compromised host, which can produce unusual network traffic.
We defined a Unusual Network Traffic Set () that contains all those events that cause unusual network traffic as shown in Eq. 3.
3.3.2. Unusual System Behavior Detection:
Unusual system behavior like unexpected system crashes, error messages, and modifications to system configuration are the indicators of many stages in the APT life cycle. We used the following indicators to detect unusual system behavior of APT attacks. 1) Indicators at Exploitation phase: Malicious activities can result in unusual system behavior like unexpected system crashes and error messages. 2) Indicators at Installation phase: Adversaries may install malicious software like backdoors, rootkits, etc, which can result in a modification to system configurations or new process creation. 3) Indicators at the Data Exfiltration phase: At this phase, we use increased network traffic as indicators of compromise. We defined as a superset of all the events of unusual system behavior as shown in Eq. 4.
3.3.3. Unusual User Behavior Detection:
It recognized unusual user behavior from the logs collected by Splunk using the following indicators. 1) Indicators at Reconnaissance Phase: Unusual network scans. 2) Indicators at Initial Compromise Phase: At this phase, the following indicators are used i.e., Unusual pattern of failed login attempts, Failed login attempts from the same IP address into many accounts, and successfully logging into an account followed by numerous failed login attempts. 3) Indicators at Lateral Movement Phase: Unusual activity from privileged accounts, change in user privileges, and access to sensitive data. A sample Splunk query is given in Table 4 for detecting failed attempts before successful login. We defined as a superset of all the events of unusual user behavior as shown in Eq. 5.
3.3.4. File Behavior Detection:
We used the following indicators of file behavior to identify an APT. 1) File execution: APTs often use malicious files that execute upon being opened. 2) File creation and deletion: APTs may create or delete new unexpected files. 3) File encryption: APTs may use encryption to keep their task undetected. We monitored system logs for unexpected file encryption to detect APT. 4) File transfer: We monitored system logs for unexpected file transfers between network hosts. A sample Splunk query is given in Table 5 for the detection of malicious file creation and deletion by a particular host. We defined Unusual File Behavior Set as a superset of all the events generated in response to unusual File behavior i.e., malicious domain, unusual file transfer, malicious hash as given in Eq. 6.
3.3.5. Malicious IP Detection:
This module uses the following indicators for malicious IP addresses. 1) Known malicious IP address. 2) Unusual increase in network traffic from an IP. 3) Communication with C2 server. We defined Malicious IP Set that contains blacklisted IP addresses as shown in Eq. 7.
3.3.6. Malicious Domain Detection:
The proposed framework used the following indicators to detect malicious Domains. 1) Similar domains that were used in previous APT attacks. 2) Only TOR-accessible domains. 3) malicious DNS.4) Newly registered domains. 5) Domains having malicious SSL certificates. We defined Malicious Domain Set() as a superset of all the events generated in response to malicious domain behavior i.e., malicious domain, malicious DNS, malicious SSL Certificate as shown in Eq. 8.
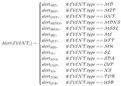
3.3.7. Alert ()
In the proposed architecture consists of the following attributes as shown in Eq. 9. However, Eq. 10 shows the different types of alerts generated by the proposed system.
3.3.8. Alert Set ()
contains all the alerts generated by the system in response to unusual behaviors.
3.3.9. APT Life Cycle Graph ()
is a superset of all the APT attacks sequences. It is a directed graph where nodes represent alerts and the edges between nodes represent the sequence of alerts i,e., , Sequence of .
3.3.10. APT Attack Sequence ()
It contains all sequences of APT attack alerts.
3.3.11. APT Incomplete Attack Sequence ()
It contains an incomplete sequence of APT attacks on host i.
3.3.12. APT Incomplete Attack Sequence
It contains a complete sequence of APT attacks on host i.
3.3.13. Event Detection Function
The Event_Detection () takes logs of events as input and detects malicious events based on the type of event stored in the log file as shown in Eq. 16. The different types of events are discussed in Table 6.
3.3.14. Implementation of Malicious Behavior Detection Algorithm
The proposed architecture is designed to detect malicious behavior in a system using input logs as shown in Algorithm 1. The Algorithm 1 takes a set of logs as input which consists of one or more events. As an output, the Algorithm 1 generates an alert or error message. We used an Event_Detection() function to extract the type of each event from the input logs. The Algorithm 1 examines the type of each event and divides it based on specific types of malicious behavior. The Algorithm 1 generates an alert if the event type matches the malicious behavior. The details of the malicious behaviors and alerts are given in Table 6. Then, it adds the generated alert to the Graph. However, if the event type does not match any of the malicious behaviors then an error message is generated which shows that malicious behavior is not found.
| Algorithm 1 Malicious Behavior Detection |
|
3.4. Alert Correlation Module
The alert correlation module is proposed to correlate the alerts generated by different modules and predict the exact attack type. This module accepts the APT Life Cycle Graph as input. Then this module uses supervised ML techniques like Random Forest and XGBoost, to correlate and predict the exact attack type alert. It reduces the false positive alerts and filters the repeated alerts generated by the proposed six modules. The main functionalities of the alert correlation module are depicted in Figure 4.
The IOCs for different kinds of attacks can often overlap because adversaries frequently use identical tactics and techniques. For example, several attacks may use IOCs like malicious URLs, IP addresses, file signatures, and malicious behavior patterns. To effectively identify and respond to attacks, the proposed framework using AI techniques detects the exact attack IOCs associated with each attack. The APT attack detectable stages and alerts are given in Table 6.
3.4.1. Alert Function
The Alert () takes events as input and generates the corresponding alert based on the event type as shown in Eq. 17. The Alert () compares the event.type with pre-defined malicious behavior. If a match is found then it generates the corresponding alert. The different types of alerts are discussed in Table 6.
3.4.2. Alert Correlation Function
The Alert_correlation() takes alerts store as input and add its to or set. In other words, it correlates the alerts and classifies them into complete APT Attacks and incomplete APT Attacks. The alert correlation function is shown in Eq. 18.
3.4.3. Implementation of Alerts Correlation Algorithm
The proposed architecture correlates alerts and classifies them into complete APT Attacks and incomplete APT Attacks as shown in Algorithm 2. The Algorithm 2 takes as input and adds it to either the complete APT alert set or the incomplete APT alert set i.e., , . In step 3, the Algorithm 2 checks if the APT attack sequence i.e., , for host i is empty. In step 4, if empty, it adds the alert from to of host i. In step 6, if is not empty, the Algorithm 2 calls a loop that iterates through the remaining alerts in . In step 7, the Algorithm 2 executes a correlation check between the current alert () and all alerts already in . The correlation check examines three parameters i.e., stage, source IP address, and timestamp. Firstly, it inspects whether the current alert’s stage is greater than or equal to the stage of any existing alert in . It shows a potential development in the attack. Secondly, it inspects whether the current alert’s source IP address matches any existing alert in . It indicates a potential connection between the events. Lastly, it inspects whether the current alert’s timestamp is greater than or equal to any existing alert in . It aids in maintaining chronological order within the APT sequence. In step 8, If the correlation check passes, the current alert is added to . Moreover, it invokes the , which returns either an incomplete APT attack sequence i.e., or a complete APT attack sequence i.e., . In step 9, if the correlation check fails, the Algorithm 2 returns "similar alert already exists" and starts the execution of a new alert in the loop.
| Algorithm 2 Alerts correlation Algorithm |
|
3.4.4. APT Reporting
APT offers substantial issues due to its stealth and long-lasting nature. Early diagnosis and rapid intervention are critical for minimizing damage. This module reports two types of APT alerts i.e., complete APT attack alert and incomplete APT attack alert. This reporting allows the incident and response team to make swift and appropriate decisions based on the information provided by the proposed system.
4. Experimental Setup and Results Evaluation
The experimental setup and obtained results are discussed in the following sections.
4.1. System Setup
We used the VMWare ESXi physical server to install the virtual machines with different operating systems and services. We installed vulnerable web applications i.e., Damn Vulnerable Web Application (DVWA), X-operating system, Apache, Mysql, Php, Perl (XAMPP) Server on the first VM. Similarly, the Domain Name System (DNS) Server and File server are installed on the other two VMs. The adversary attacks the servers from the Public Network. Each server has a log-capturing capacity. The log server is used for filtering and storing logs. Moreover, the networks and server logs are periodically transferred to the Splunk server as shown in Figure 5.
4.2. Dataset Collection
We extended the dataset used in [11] by adding more alert types as shown in Table 6. Our dataset contains the source IP address, destination IP address, source port number, destination port number, timestamps, alert types, infected hosts, and attack steps. This dataset is used as the basis for ML models to detect and investigate complete and incomplete APT attacks.
4.3. Data Pre-Processing and Encoding
Initially, our dataset had 3886 records with 9 attributes as discussed in section B. After careful analysis of the attributes, we discarded the alter_id attribute because it carries no information for the ML algorithm. Furthermore, we deleted the source IP attribute as it duplicates the IPs of the infected host attribute.
In the next step, we annotated the dataset into two classes i.e., ’complete APT attack’ and ’incomplete APT attack’. We identified 1031 incomplete APT attacks and 337 complete APT attacks as shown in Figure 6.
In the next step, we performed data encoding. Initially, we converted infected host IPs and destination IPs into their respective IP classes i.e., A, B, and C. In our dataset, alert type, step, destination IP and infected host IP are categorical attributes. We used a one-hot encoding technique to transform these attributes. There are 13 distinct values for alert type, therefore, after one hot encoding there are 13 columns each representing a different alert type. Similarly, there are 3 columns for each class of IP address. The aggregation criteria for the alert type, destination IP address, and infected host IP address attributes are set to sum. Moreover, the time stamp in our data is a continuous attribute. Therefore, we used ’mean’ as the aggregation criteria for the time stamp. The destination port and source port are nominal attributes, therefore we set ’median’ as the aggregation criteria. After data pre-processing and encoding we get 1368 records (rows) and 24 columns (attributes).
We selected the Random Forest and XGBoost classifiers because the majority of the attributes in our dataset are categorical and also, we used one-hot-encoding. Random Forest is a powerful machine-learning homogeneous ensemble classifier that is composed of multiple decision trees. Each tree is built using random sub-samples of the training data. The final decision is made using a majority vote criteria. Random Forest is useful because it reduces overfitting, and increases the robustness of the model. An overfitted model poorly performs on unseen data or cannot generalize. unlike random forest, XGBoost implements gradient boosting where each new tree is trained to work on the errors produced by preceding trees. Moreover, XGBoost uses a regularization mechanism in tree formation, that prevents the model from overfitting.
4.4. Results and Discussion
The training dataset is split into training and testing datasets with a famous 20:80 ratio. We performed out-of-sample experiments also called hold-out testing or external validation. The testing data is unseen for the model to provide a realistic assessment of the model. As mentioned earlier we have used Random Forest and XGBoost for the prediction task. The Random Forest and XGBoost classifier’s prediction accuracy, True Positive Rate (TPR), True Negative Rate (TNR), False Negative Rate (FNR), and False Positive Rate (FPR) are given in Table 7.
The confusion matrix and Receiver Operating Characteristic curve (ROC curve) for the Random Forest classifier are shown in Figure 7 and Figure 8 respectively.
Similarly, the confusion matrix and Receiver Operating Characteristic curve (ROC curve) for the XGBoost classifier are shown in Figure 9 and Figure 10 respectively.
We computed the importance of each feature/attribute in the prediction task as shown in Figure 11. We used all the features in our prediction step, however, less number of features can give nearly the same results. Thus, making the predictor suitable for embedded systems or the Internet of Things.
We can conclude that if the data is properly pre-processed and encoded, ML techniques can greatly enhance the performance of any SEIM tool.
4.5. Comparisons among Proposed and State-of-the-Art Framework
Our model has outperformed the state-of-the-art techniques in terms of multiple performance metrics as shown in Table 8.
5. Conclusion
This research paper covers the issues that the CSIRT faces while dealing with enormous amounts of alerts and time-consuming manual operations in the SOC. This study proposes a novel architecture to improve malicious behavior detection and reduce false positive alarms. We implemented six different malicious behavior detection modules. These modules can detect 14 malicious behaviors. These malicious behaviors are reflected in the APT dataset by adding the new alert types. Then, ML approaches, such as Random Forest and XGBoost, are trained and tested on the extended APT dataset. The proposed Random Forest-based model detects malicious behaviors with an accuracy of 98.54% and FPR of 1.46%. However, the XGBoost-based model generation detection accuracy of 99.6% and FPR of 0.0%.
The dataset was generated in a controlled environment, therefore only four stages of the APT life cycle are considered. In the future, we will work to detect APT at a more fine-grained level by incorporating more APT steps in real-world scenarios. Moreover, we will work to identify more malicious behaviors by adding more detection modules.
Author Contributions
Conceptualization, G.A.; methodology, G.A.; software, G.A., S.S.; validation, G.A., S.S.; formal analysis, G.A.; data curation, G.A., S.S.; writing—original draft preparation, G.A.; writing—review and editing, G.A., S.S.; visualization, G.A., S.S.; supervision, M.E.A. All authors have read and agreed to the published version of the manuscript.
Acknowledgments
The authors would like to acknowledge the support of Prince Sultan University for paying the Article Processing Charges (APC) of this publication.
Conflicts of Interest
The authors declare no conflicts of interest.
References
- Annual Cyber security Report. https://www.cisco.com/c/m/en_au/products/security/offers/annual-cybersecurity-report-2017.htm. [Accessed 10-03-2024].
- Schlette, D.; Caselli, M.; Pernul, G. A comparative study on cyber threat intelligence: The security incident response perspective. IEEE Communications Surveys & Tutorials 2021, 23, 2525–2556. [Google Scholar]
- Bromiley, M. SANS 2019 incident response (IR) survey: It’s time for a change. Technical report, Technical Report. SANS Institute, 2019.
- Cichonski, P.; Millar, T.; Grance, T.; Scarfone, K.; others. Computer security incident handling guide. NIST Special Publication 2012, 800, 1–147. [Google Scholar]
- Morgus, R.; Skierka, I.; Hohmann, M.; Maurer, T. National CSIRTs and their role in computer security incident response; New America., 2022.
- Ahmad, A.; Hadgkiss, J.; Ruighaver, A.B. Incident response teams–Challenges in supporting the organisational security function. Computers & Security 2012, 31, 643–652. [Google Scholar]
- González-Granadillo, G.; González-Zarzosa, S.; Diaz, R. Security information and event management (SIEM): analysis, trends, and usage in critical infrastructures. Sensors 2021, 21, 4759. [Google Scholar] [CrossRef] [PubMed]
- Splunk. https://www.splunk.com. [Accessed 10-03-2024].
- QRadar. https://www.ibm.com/qradar. [Accessed 10-03-2024].
- Islam, C.; Babar, M.A.; Croft, R.; Janicke, H. SmartValidator: A framework for automatic identification and classification of cyber threat data. Journal of Network and Computer Applications 2022, 202, 103370. [Google Scholar] [CrossRef]
- Ghafir, I.; Hammoudeh, M.; Prenosil, V.; Han, L.; Hegarty, R.; Rabie, K.; Aparicio-Navarro, F.J. Detection of advanced persistent threat using machine-learning correlation analysis. Future Generation Computer Systems 2018, 89, 349–359. [Google Scholar] [CrossRef]
- Williams, A.; Nicolett, M. Improve it security with vulnerability management. Gartner ID 2005. [Google Scholar]
- Miller, D.R.; Harris, S.; Harper, A.; VanDyke, S.; Blask, C. Security information and event management (SIEM) implementation; McGraw Hill Professional, 2010.
- Sheeraz, M.; Paracha, M.A.; Haque, M.U.; Durad, M.H.; Mohsin, S.M.; Band, S.S.; Mosavi, A. Effective security monitoring using efficient SIEM architecture. Hum.-Centric Comput. Inf. Sci 2023, 13, 1–18. [Google Scholar]
- Gartner Magic Quadrant for Security Information and Event Management. https://www.gartner.com/en/documents/4019750?ref=null. [Accessed 25-02-2024].
- Hwoij, A.; Khamaiseh, A.h.; Ababneh, M. SIEM architecture for the Internet of Things and smart city. International Conference on Data Science, E-learning and Information Systems 2021, 2021, pp. 147–152. [Google Scholar]
- Hristov, M.; Nenova, M.; Iliev, G.; Avresky, D. Integration of Splunk Enterprise SIEM for DDoS Attack Detection in IoT. 2021 IEEE 20th International Symposium on Network Computing and Applications (NCA). IEEE, 2021, pp. 1–5.
- Balaji, N.; Pai, B.K.; Bhat, B.; Praveen, B. Data visualization in splunk and Tableau: a case study demonstration. Journal of Physics: Conference Series. IOP Publishing, 2021, Vol. 1767, p. 012008.
- Dunsin, D.; Ghanem, M.C.; Ouazzane, K.; Vassilev, V. A comprehensive analysis of the role of artificial intelligence and machine learning in modern digital forensics and incident response. Forensic Science International: Digital Investigation 2024, 48, 301675. [Google Scholar] [CrossRef]
- ElSahly, O.; Abdelfatah, A. An incident detection model using random forest classifier. Smart Cities 2023, 6, 1786–1813. [Google Scholar] [CrossRef]
- Pothumani, P.; Reddy, E.S. Original Research Article Network intrusion detection using ensemble weighted voting classifier based honeypot framework. Journal of Autonomous Intelligence 2024, 7. [Google Scholar] [CrossRef]
- Ibrahim, W.N.H.; Anuar, S.; Selamat, A.; Krejcar, O.; Crespo, R.G.; Herrera-Viedma, E.; Fujita, H. Multilayer framework for botnet detection using machine learning algorithms. IEEE Access 2021, 9, 48753–48768. [Google Scholar] [CrossRef]
- Nguyen, T.T.; Reddi, V.J. Deep reinforcement learning for cyber security. IEEE Transactions on Neural Networks and Learning Systems 2021, 34, 3779–3795. [Google Scholar] [CrossRef] [PubMed]
- Almasoud, A.S. Enhanced Metaheuristics with Machine Learning Enabled Cyberattack Detection Model. Intelligent Automation & Soft Computing 2023, 37. [Google Scholar]
- Sadia, H.; Farhan, S.; Haq, Y.U.; Sana, R.; Mahmood, T.; Bahaj, S.A.O.; Rehman, A. Intrusion Detection System for Wireless Sensor Networks: A Machine Learning based Approach. IEEE Access 2024. [Google Scholar] [CrossRef]
- Brogi, G.; Tong, V.V.T. Terminaptor: Highlighting advanced persistent threats through information flow tracking. 2016 8th IFIP International Conference on New Technologies, Mobility and Security (NTMS). IEEE, 2016, pp. 1–5.
- Giura, P.; Wang, W. A context-based detection framework for advanced persistent threats. 2012 International Conference on Cyber Security. IEEE, 2012, pp. 69–74.
- Sopan, A.; Berninger, M.; Mulakaluri, M.; Katakam, R. Building a Machine Learning Model for the SOC, by the Input from the SOC, and Analyzing it for the SOC. 2018 IEEE Symposium on Visualization for Cyber Security (VizSec). IEEE, 2018, pp. 1–8.
- Farooq, H.M.; Otaibi, N.M. Optimal machine learning algorithms for cyber threat detection. 2018 UKSim-AMSS 20th International Conference on Computer Modelling and Simulation (UKSim). IEEE, 2018, pp. 32–37.
- Sethi, K.; Sai Rupesh, E.; Kumar, R.; Bera, P.; Venu Madhav, Y. A context-aware robust intrusion detection system: a reinforcement learning-based approach. International Journal of Information Security 2020, 19, 657–678. [Google Scholar] [CrossRef]
- Nilă, C.; Apostol, I.; Patriciu, V. Machine learning approach to quick incident response. 2020 13th International Conference on Communications (COMM). IEEE, 2020, pp. 291–296.
- Chandra, J.V.; Challa, N.; Pasupuleti, S.K. A practical approach to E-mail spam filters to protect data from advanced persistent threat. 2016 international conference on circuit, power and computing technologies (ICCPCT). IEEE, 2016, pp. 1–5.
- Saini, N.; Bhat Kasaragod, V.; Prakasha, K.; Das, A.K. A hybrid ensemble machine learning model for detecting APT attacks based on network behavior anomaly detection. Concurrency and Computation: Practice and Experience 2023, 35, e7865. [Google Scholar] [CrossRef]
Figure 1.
High-level SIEM Architecture
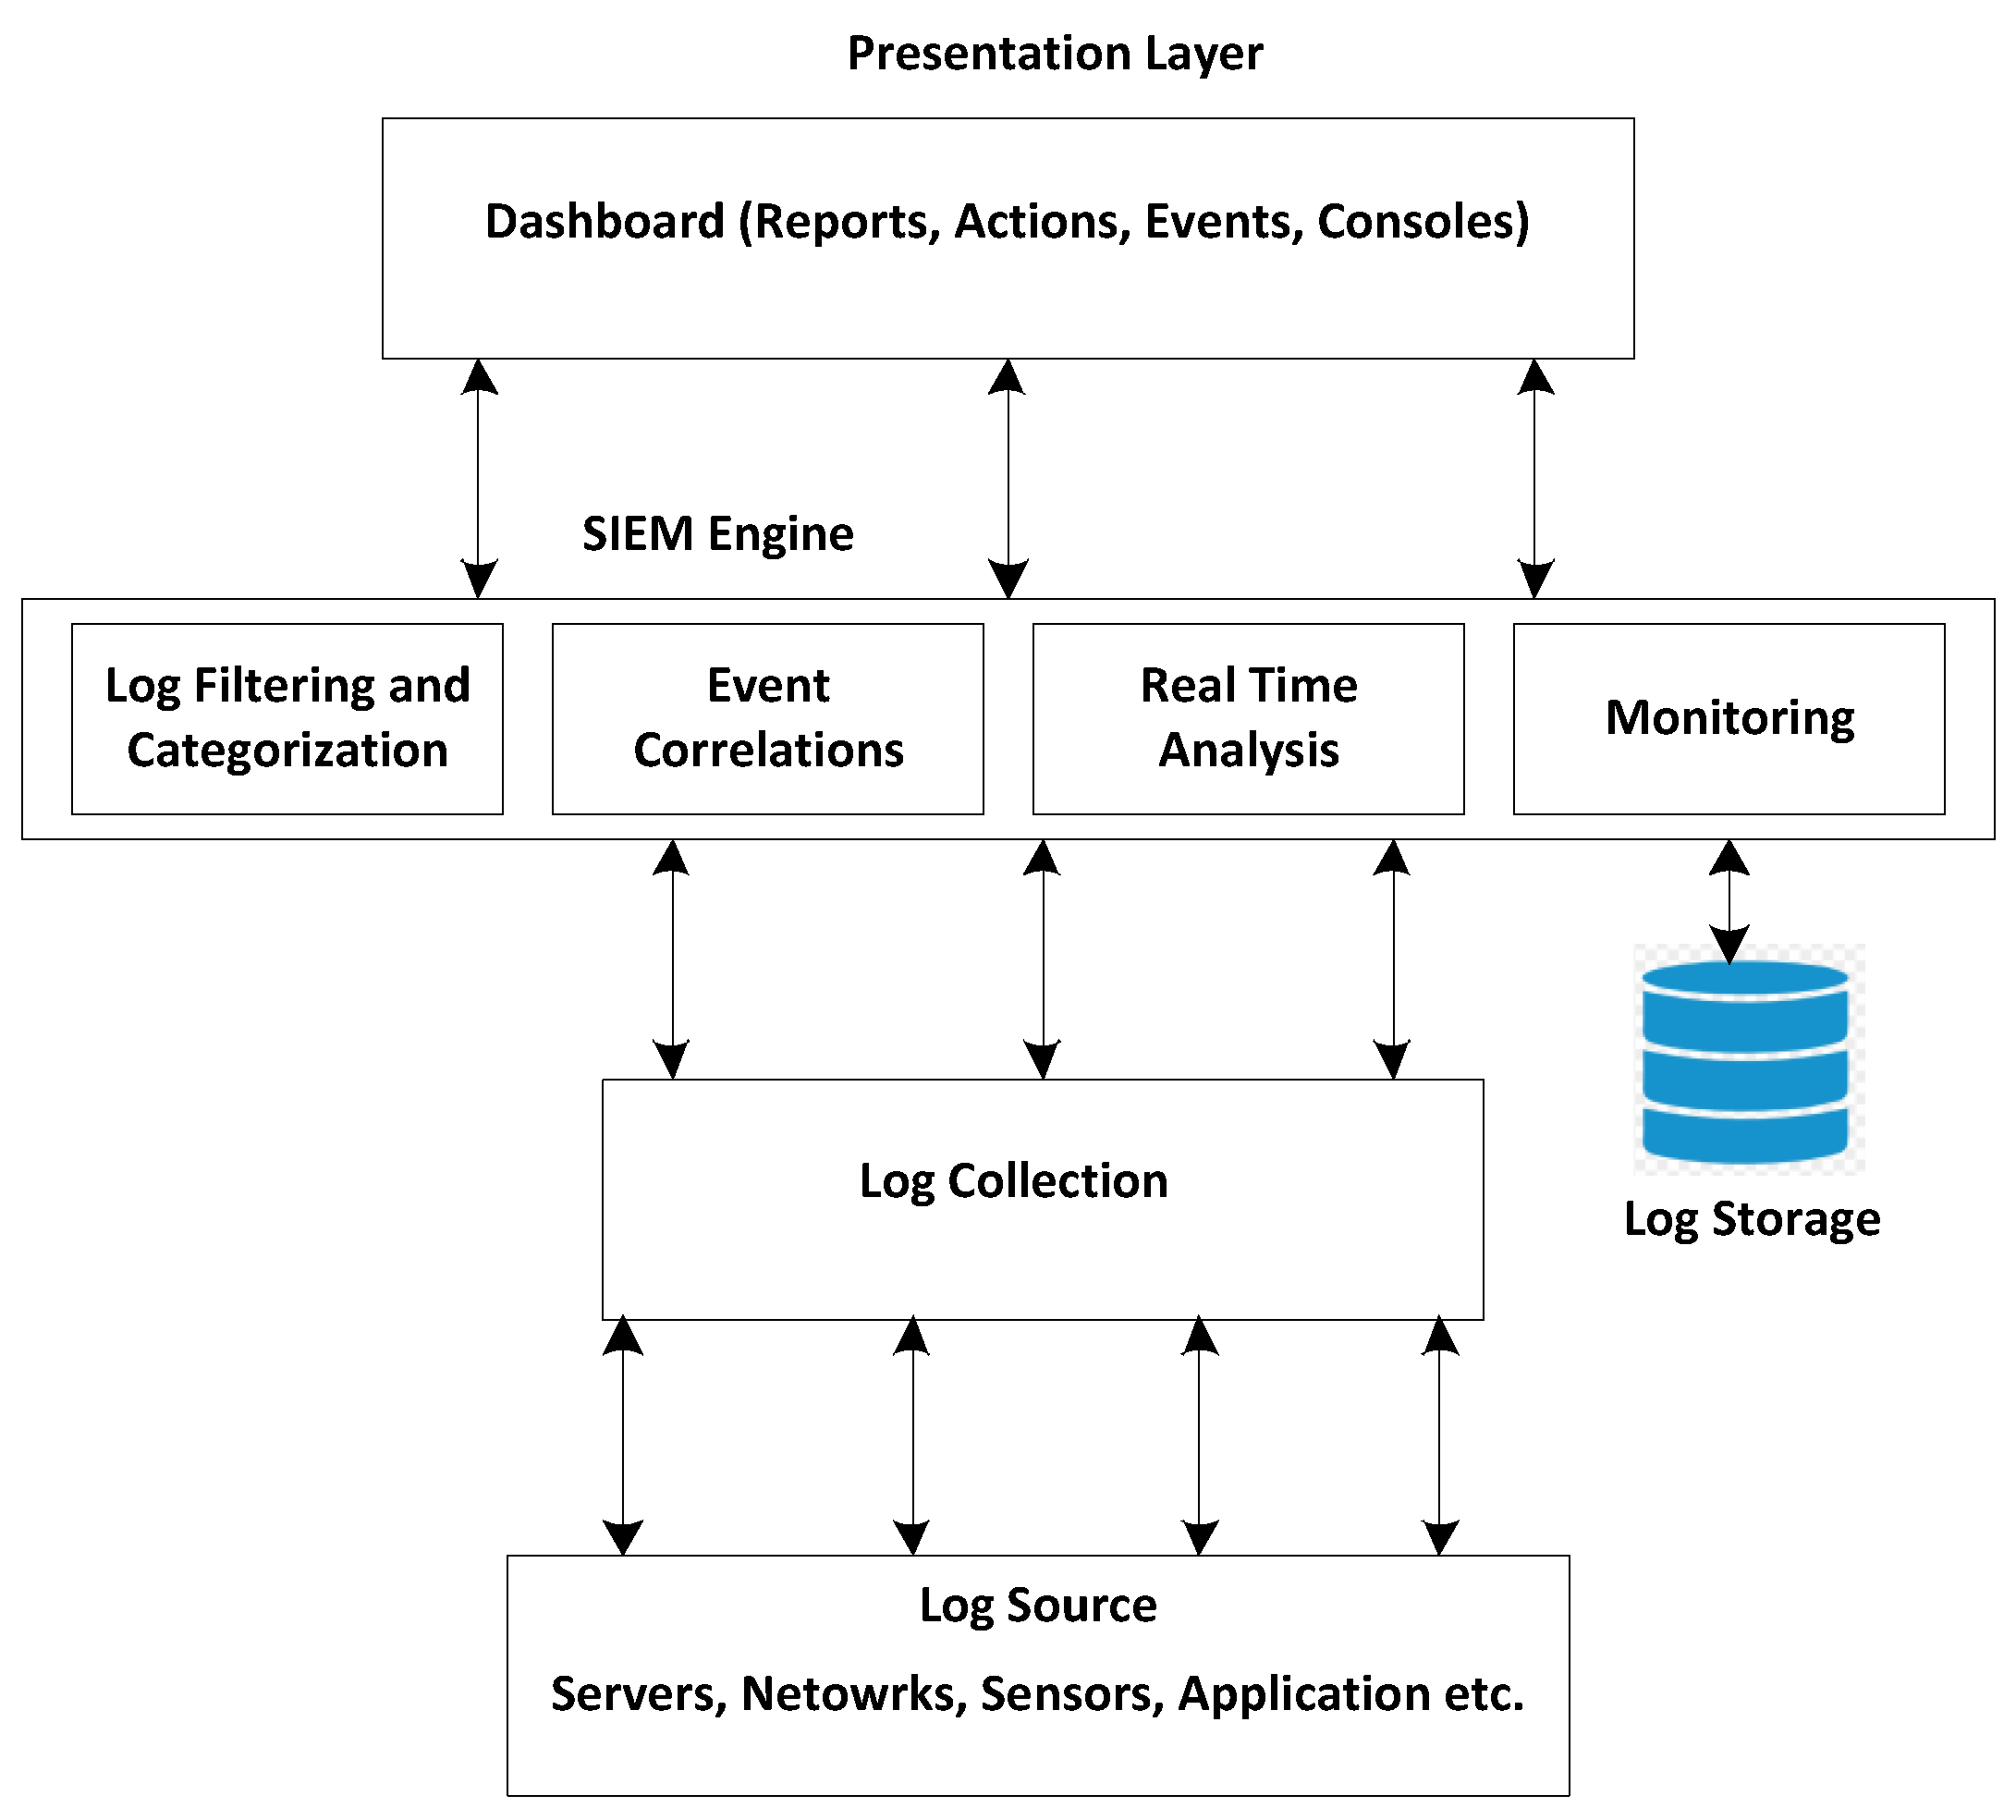
Figure 2.
Splunk Architecture
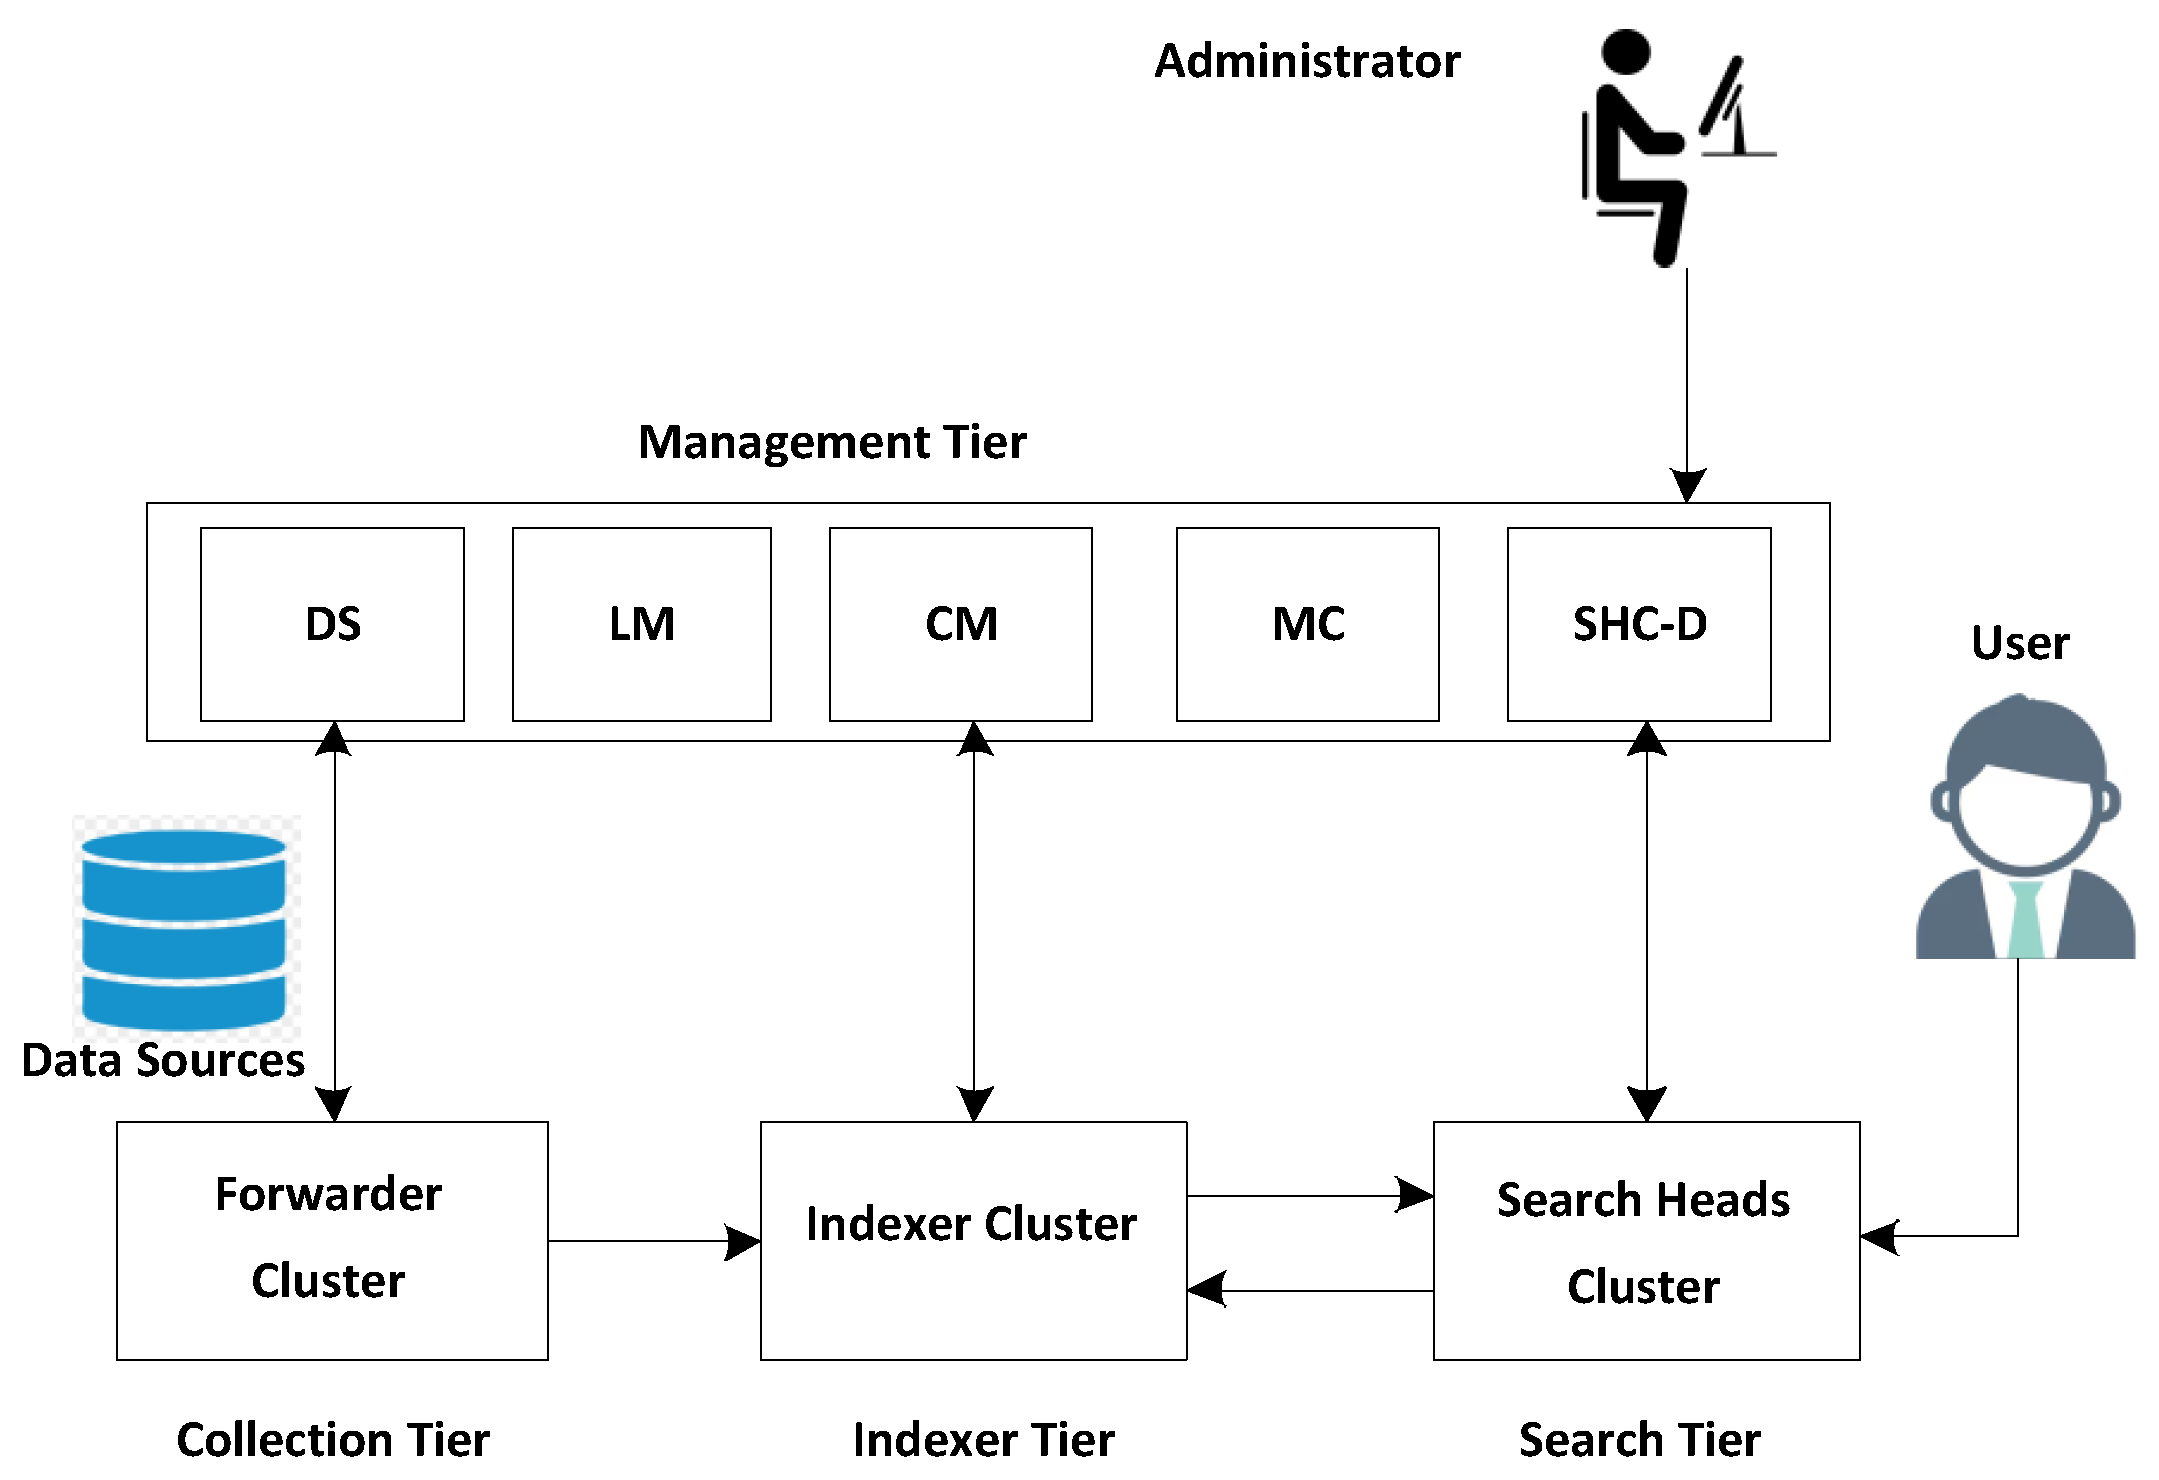
Figure 3.
Proposed High-level Architecture

Figure 4.
Alerts Correlation and Generation
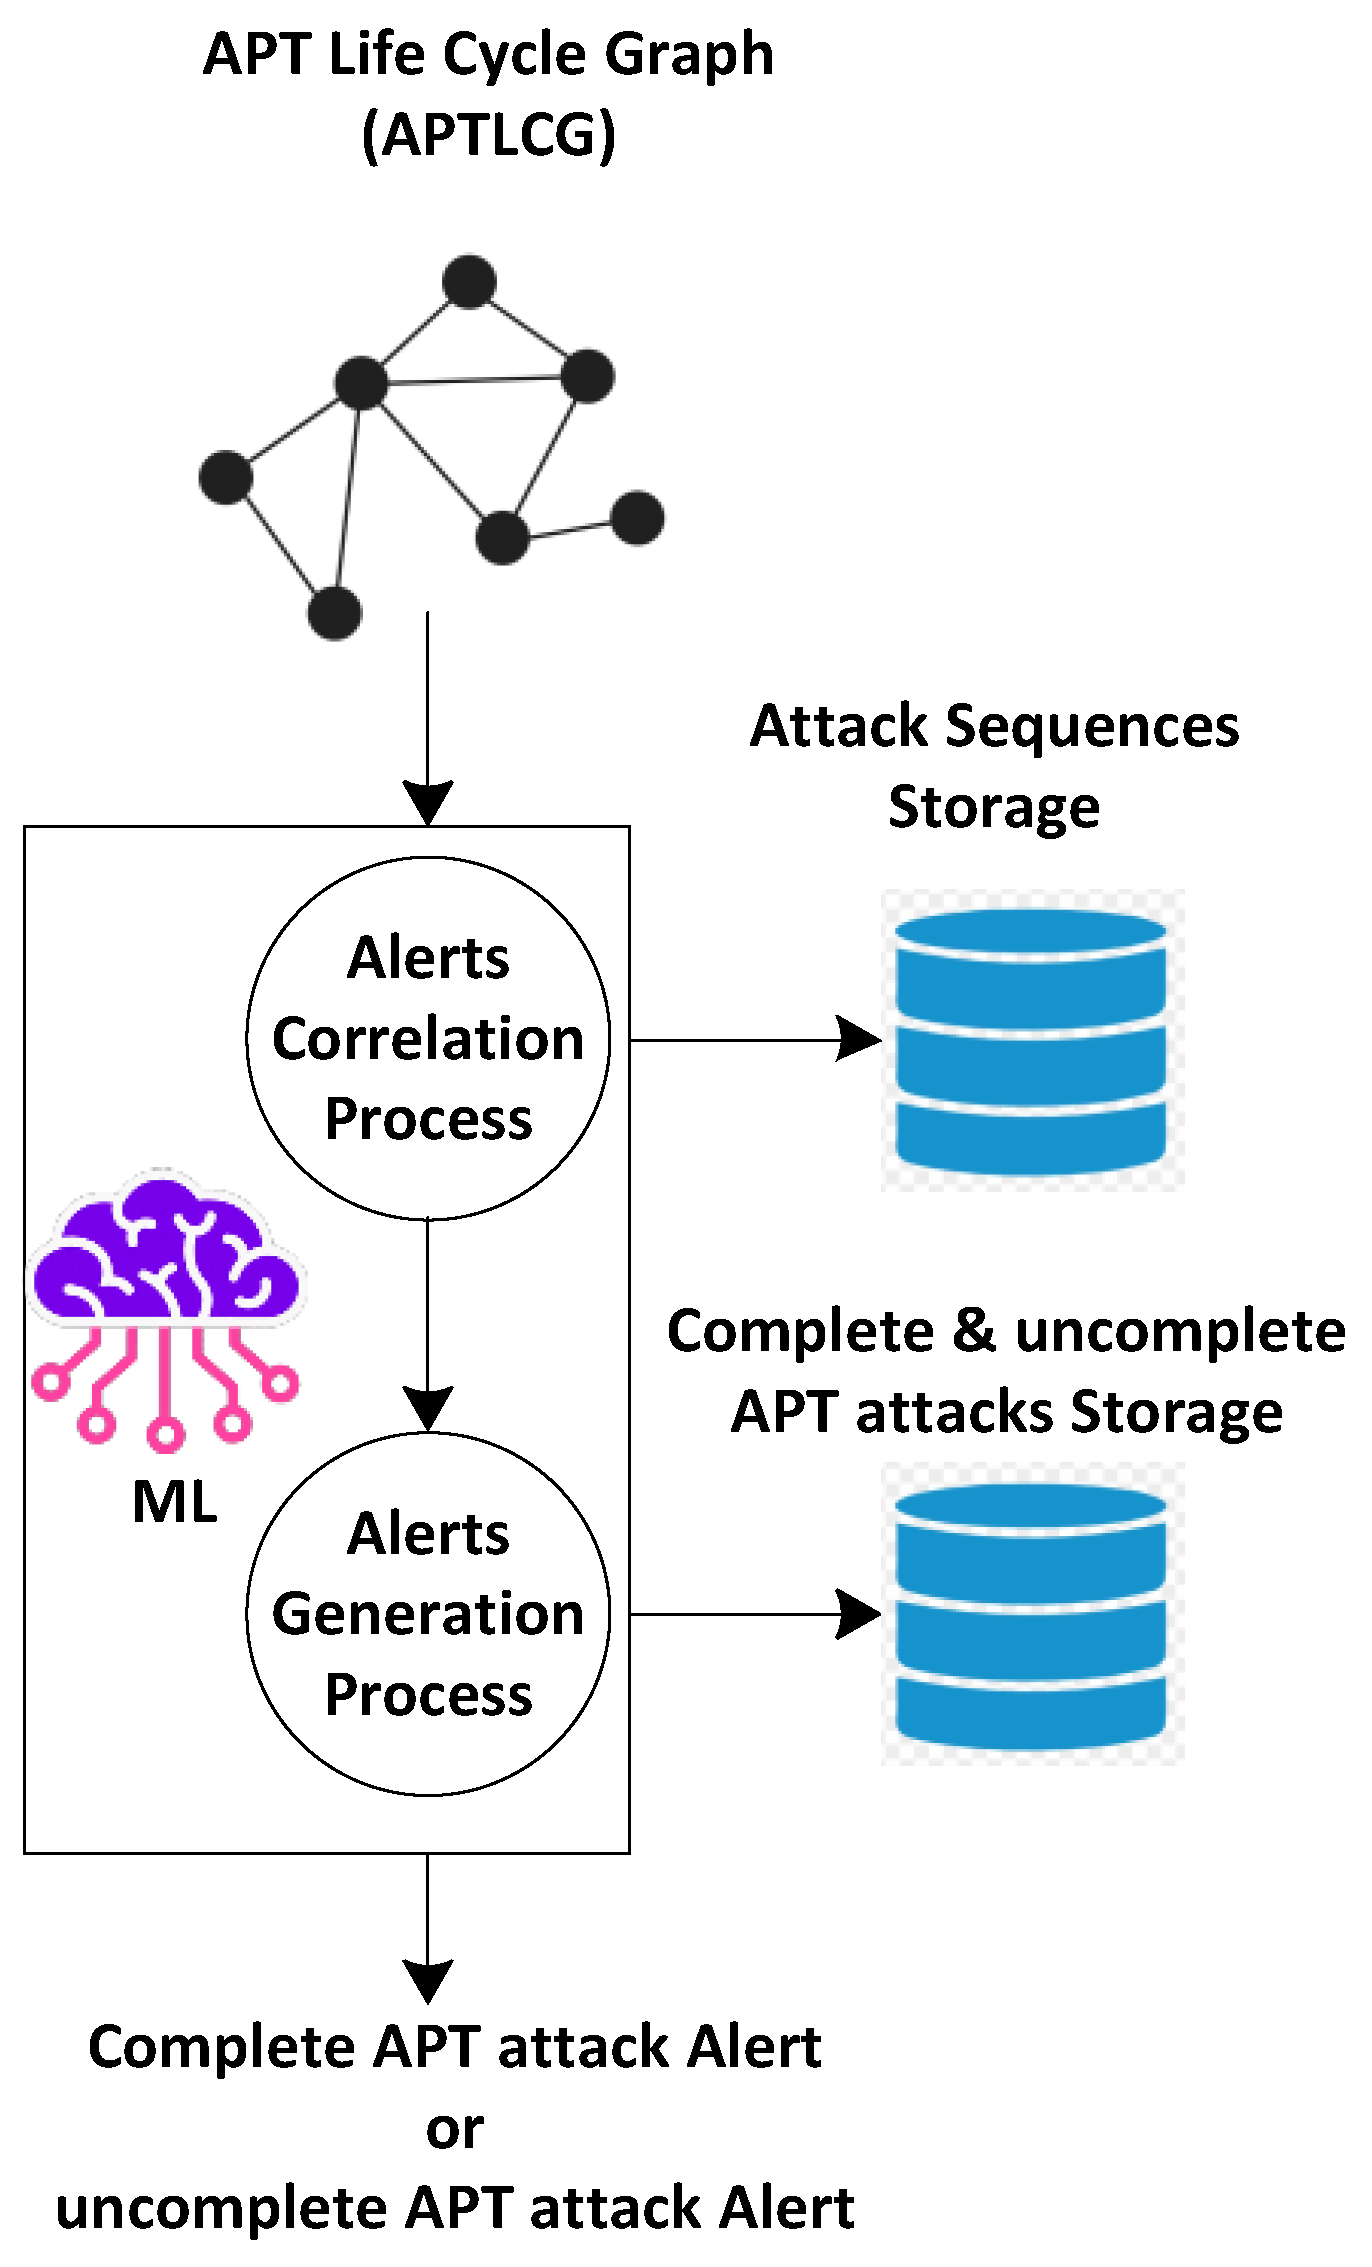
Figure 5.
System Setup
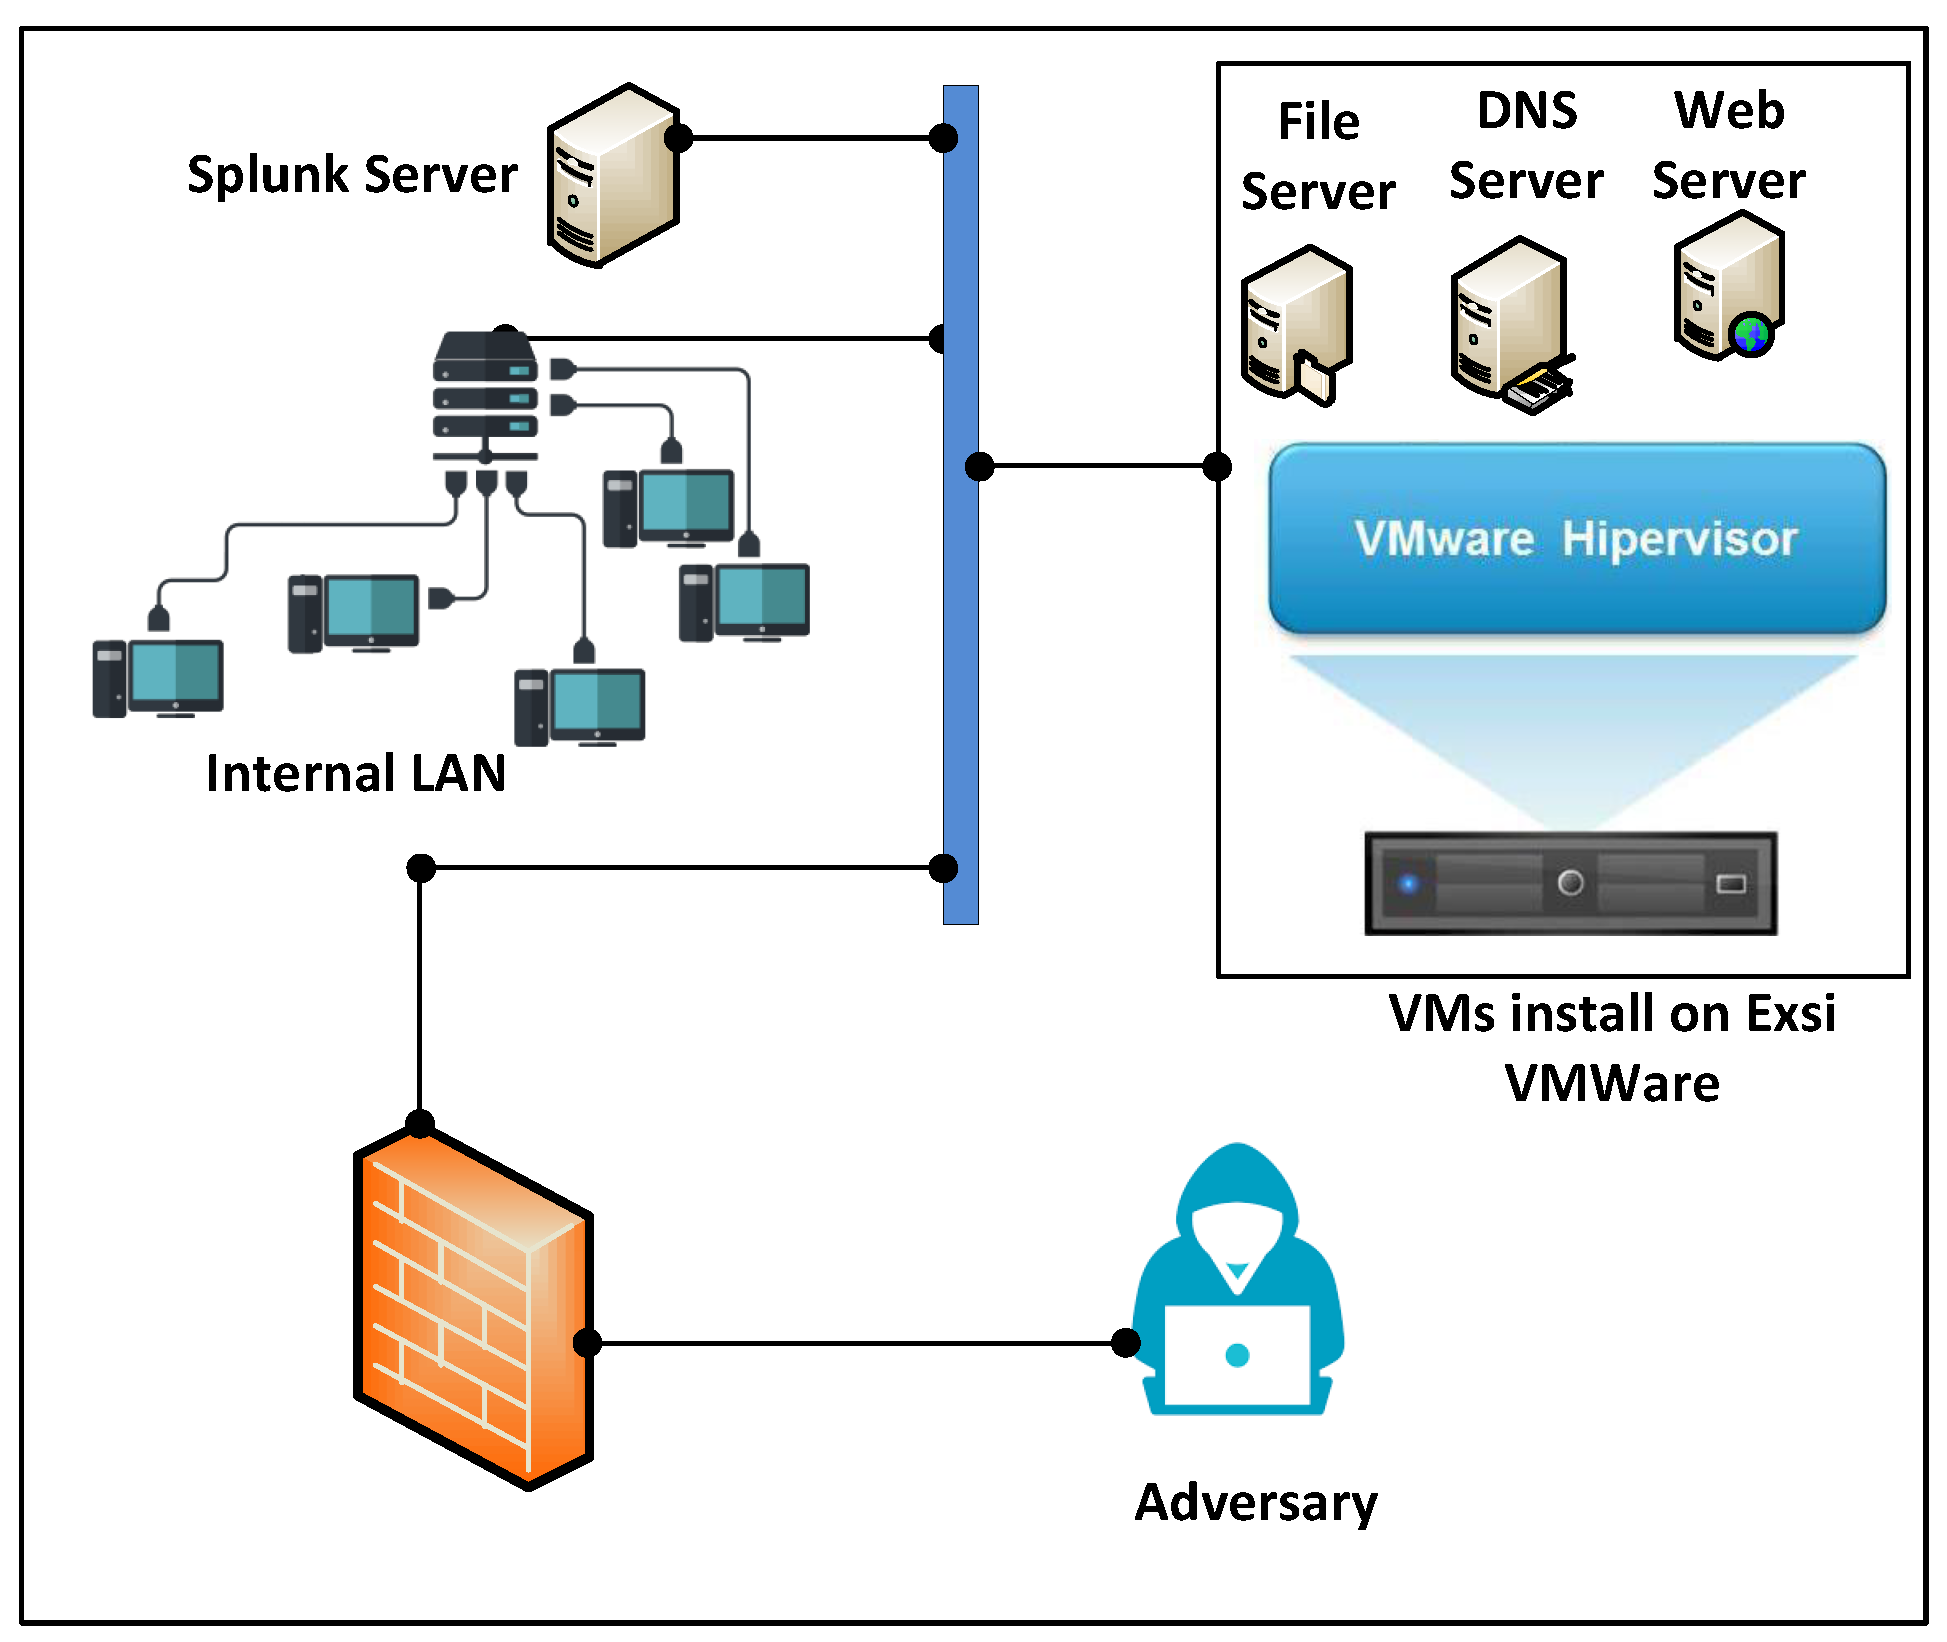
Figure 6.
Class Distribution
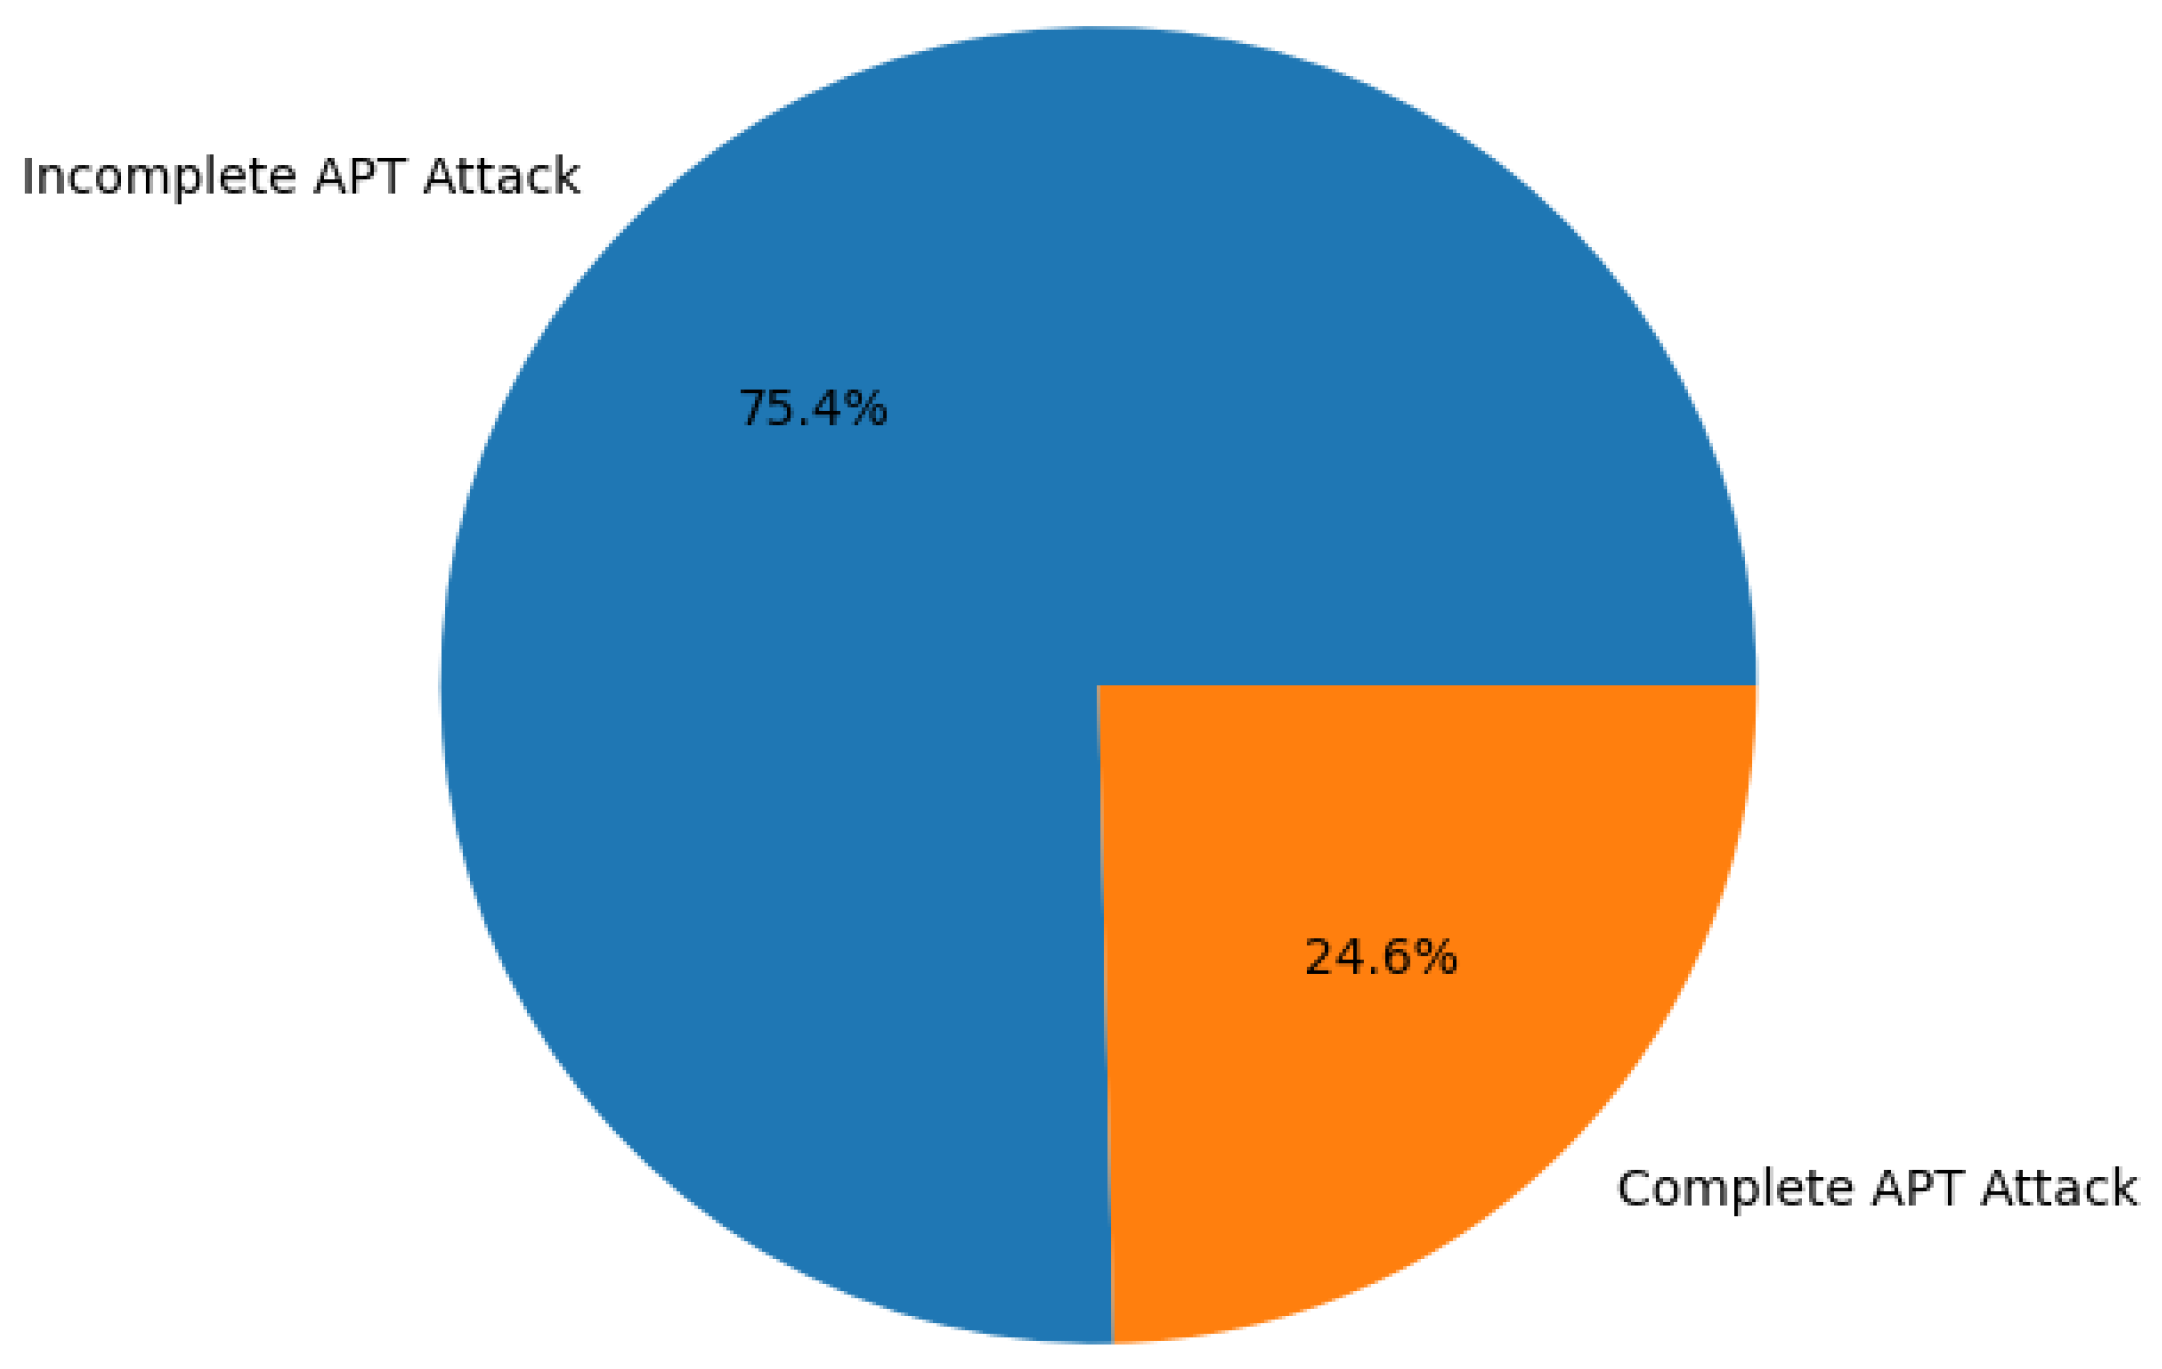
Figure 7.
Confusion Matrix
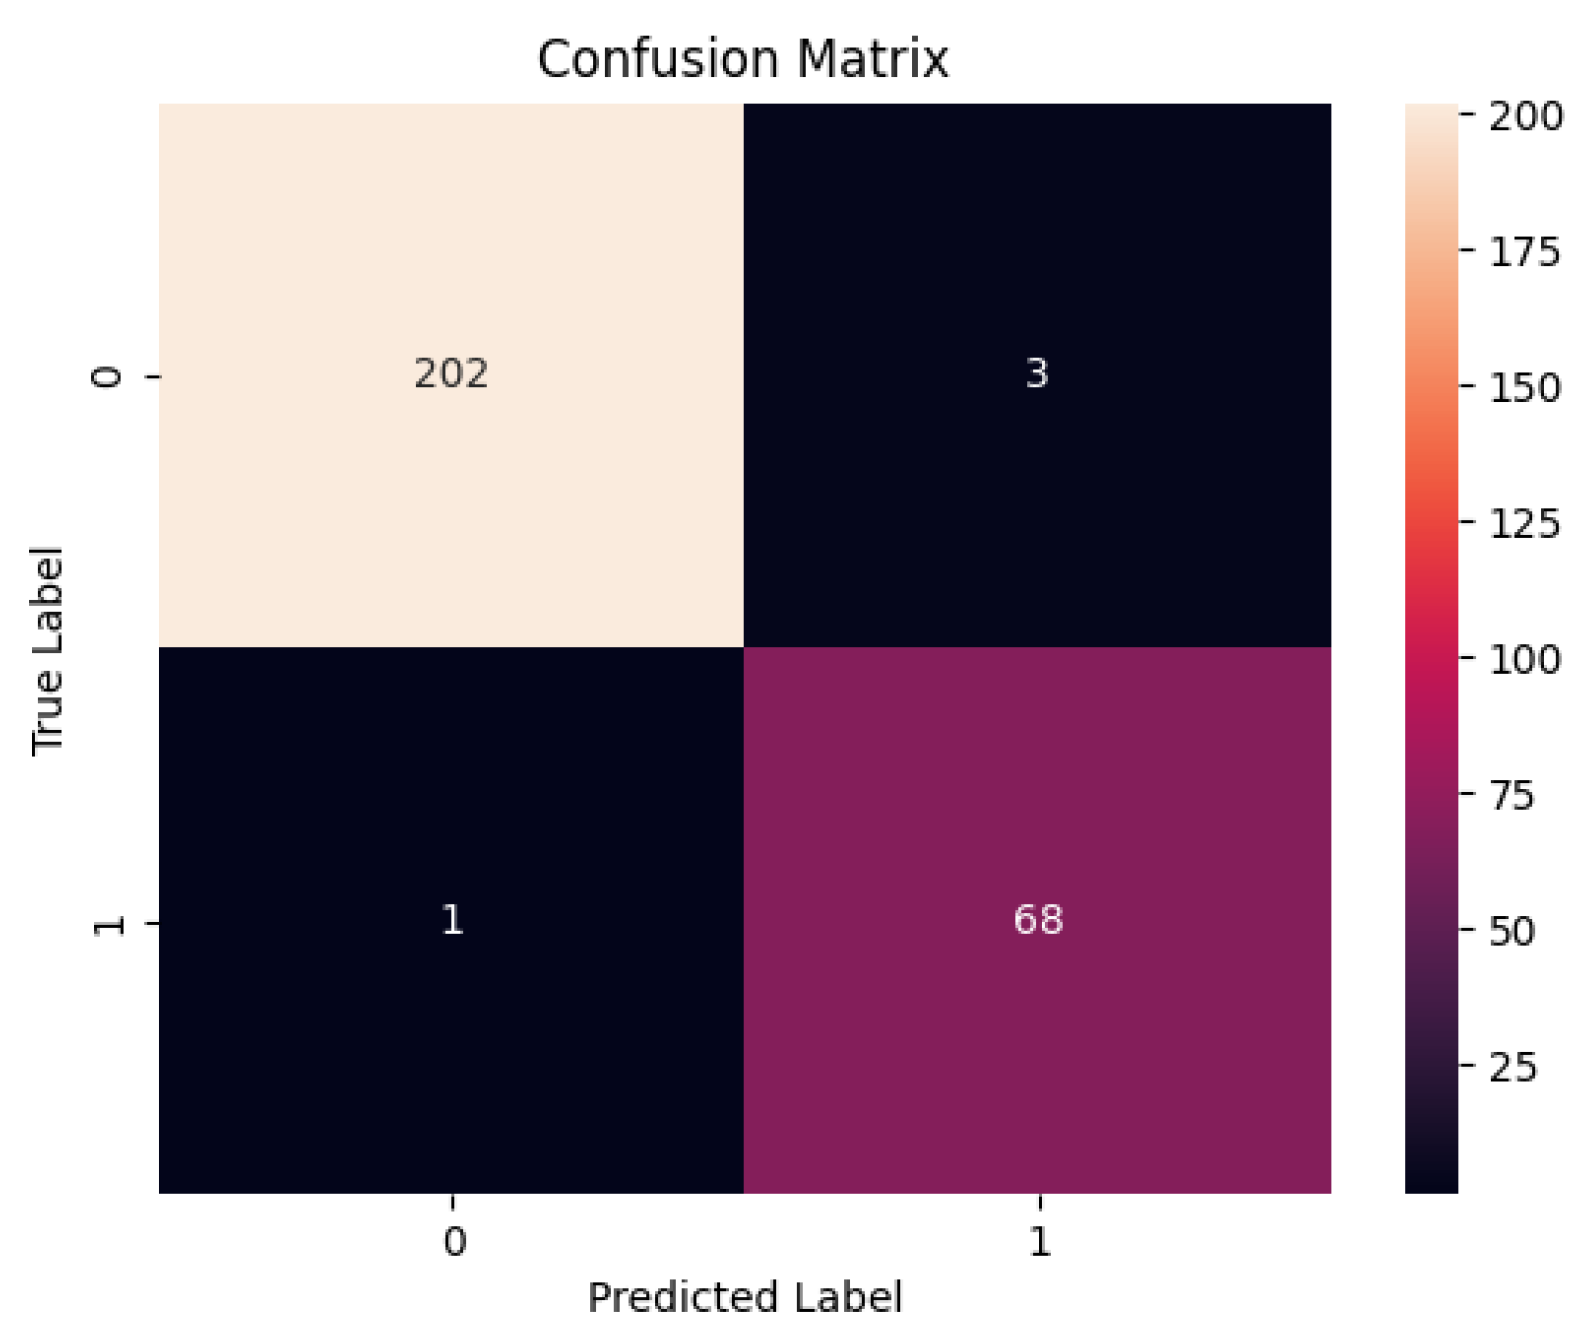
Figure 8.
ROC Curve
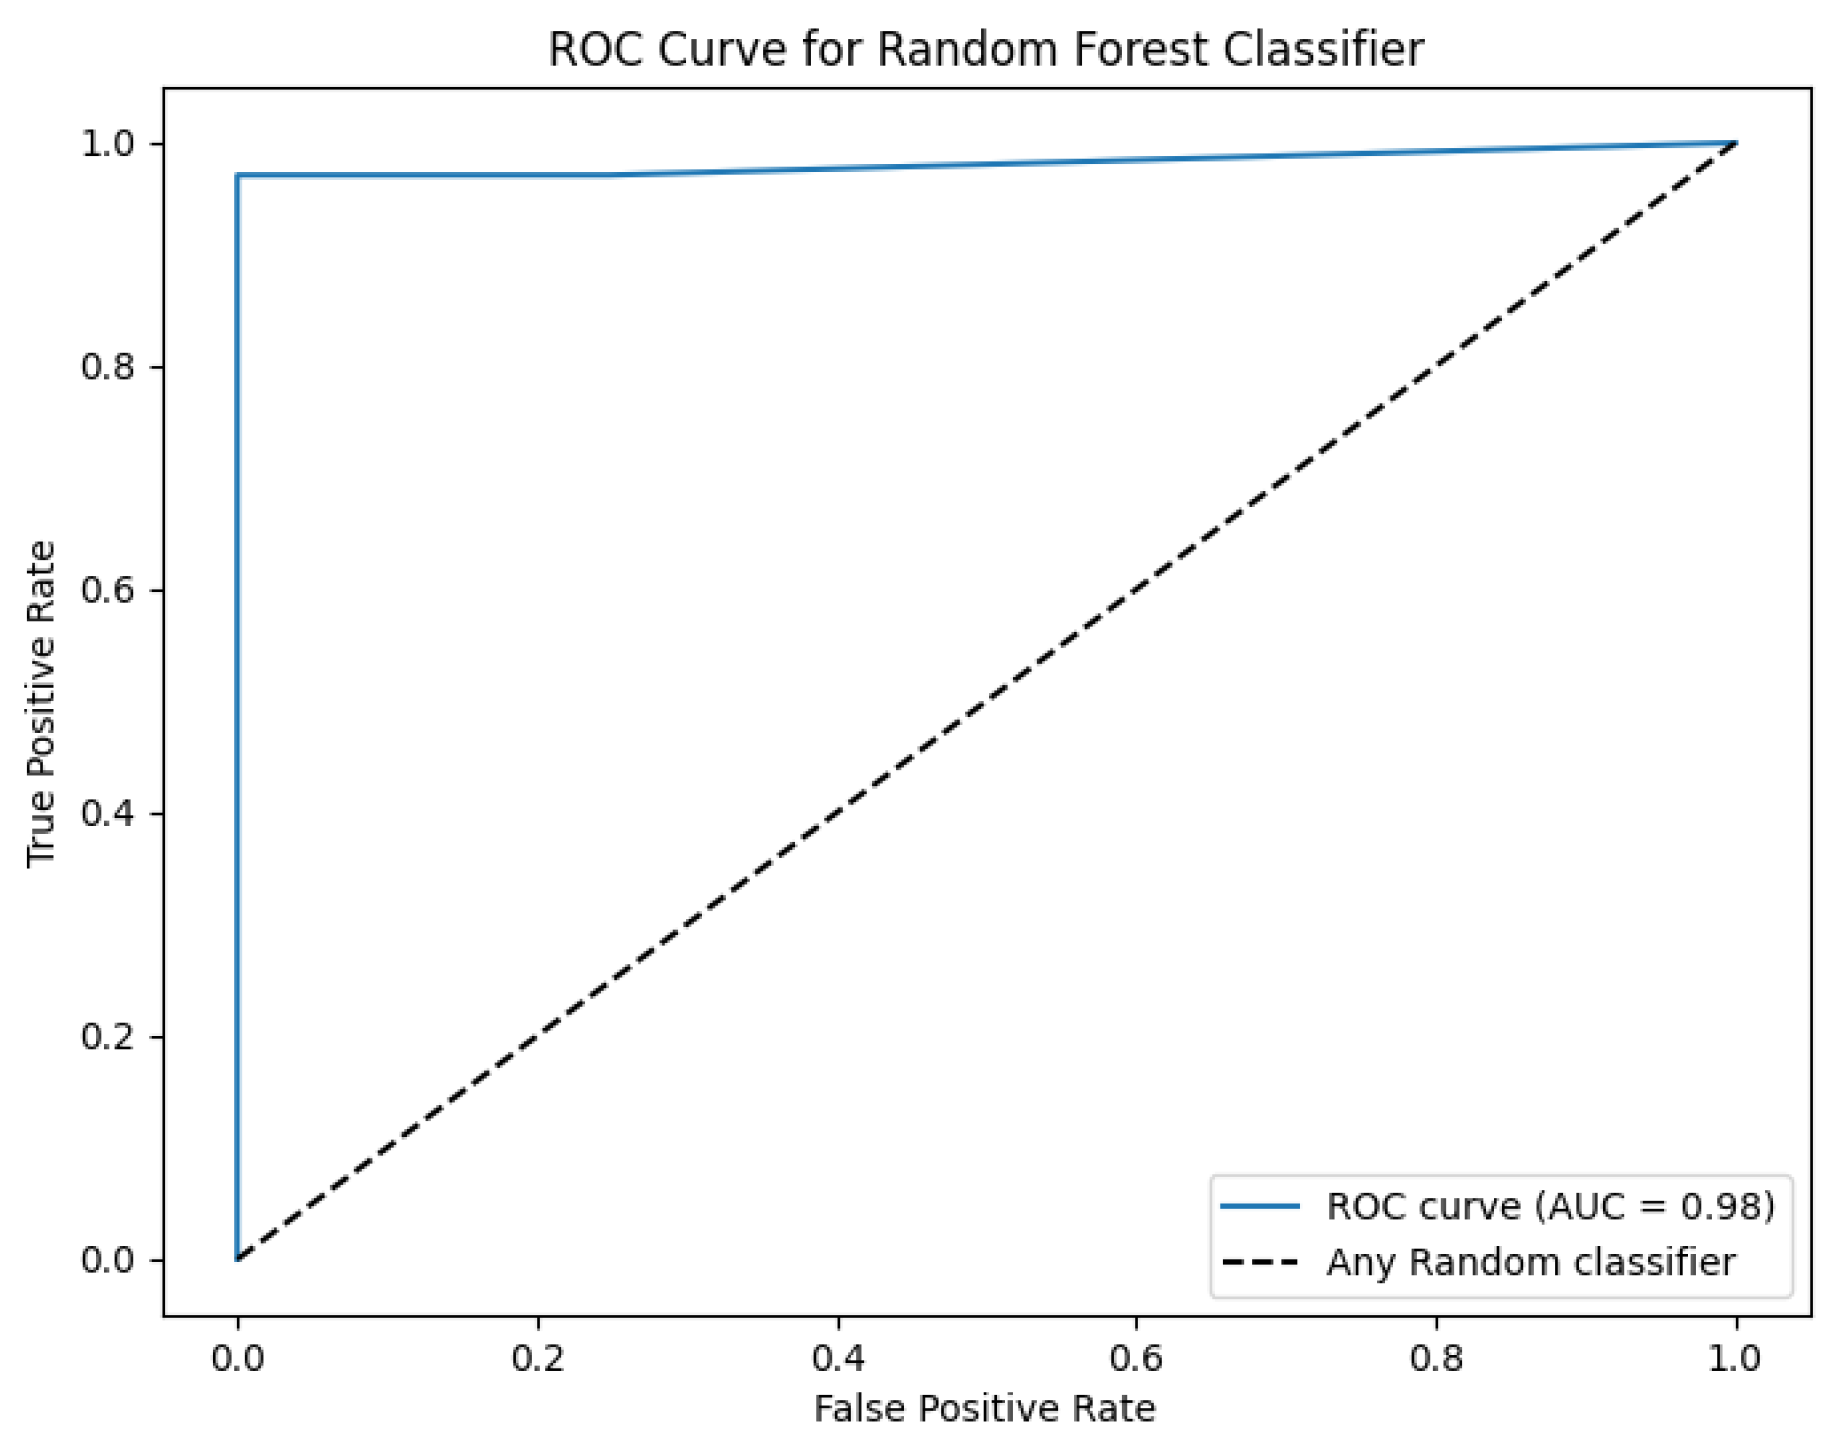
Figure 9.
Confusion Matrix
Figure 10.
ROC Curve
Figure 11.
Features Importance

Table 1.
The summary of the Existing Related Works.
| References | APT Life Cycle Detection | AI Models | Lowest FPR | Highest Accuracy | Limitations |
|---|---|---|---|---|---|
| [11] | Complete | Decision Tree, SVM, KNN,Ensemble Classifier | 4.5% | 84.8% | The blacklist based detection modules require continuous update. Moreover, the accuracy is lower. |
| [26] | Complete | No ML model used | High | Not calculated | Information Flow Tracking is used to detect APTs, however, the FPR is high. |
| [27] | Complete | No ML model used | 27.88% | Not calculated | sufficient knowledge is required to setup the mechanism. |
| [28] | No | Random Forest | Not calculated | 98.5% | The post-alert decision is not automated, it involves the intervention of security experts. |
| [29] | Partial | SVM, Random Forest | Not calculated | Not calculated | The process anomaly detection is presented formally using One-Class SVM, However, the paper lacks ML based experimental results. |
| [30] | No | Deep Q-network | 0.35% | 96.12 | The proposed model enable to detect APTs. |
| [31] | No | ZeroR, OneR, NaiveBayes, SVM, J48, RandomForest | Not calculated | 95.5% | The authors did not discuss the FPR of the proposed model. |
| [32] | Partial | NaiveBayes | Not calculated | 87% | The authors did not discuss the FPR of the proposed model. |
| [33] | Partial | Random Forest, XGBoost | 0.12% | 99.91% | This study used the existing datasets poses a challenge, because these datasets might not contain the latest attack scenarios. |
Table 2.
Notations
| Notation | Description |
|---|---|
| jth host IP address. | |
| ith user account. | |
| kth event, recorded in the log file. | |
| alert generated by ith infected host. | |
| Malicious Domain. | |
| Malicious IP address. | |
| Malicious DNS. | |
| Malicious SSL Certificate. | |
| Malicious Execution File. | |
| Unusual File Transfer. | |
| Malicious Hash. | |
| Various failed attempt before successful login. | |
| Sensitive Data Access. | |
| Change User Privileges | |
| Network Scan | |
| Unusual Network Traffic | |
| Tor connection with the remote server | |
| Unusual User Behavior | |
| Set of Malicious Domain. | |
| Set of Malicious IP address. | |
| Set of Unusual User Behavior | |
| Set of Unusual File Behavior | |
| Set of Unusual Network Traffic | |
| Set of Unusual System Behavior | |
| Source IP address | |
| Destination IP address | |
| Source Port Number | |
| Destination Port Number |
Table 3.
Splunk query to Detect Unusual Traffic
| index=* source="C:\\firewall.log" |
| ((S_Port NOT IN ("21", "22", "80", "443", "445", "135")) OR |
| (proto NOT IN ("TCP", "UDP")) AND |
| D_IP IN (compromised_IPs.txt)) |
| | stats count by S_IP, D_IP, D_Port, proto |
| | where count > 5 |
| | sort - count |
| | head 10 |
Table 4.
Splunk query to Detect Five Failed Attempts before Successful Login
| index=* source="C:\\xampp\\FileZillaFTP\\Logs\\FileZilla |
| Server.log" |
| | stats count(eval(login=530)) as failures count(eval(login=230)) |
| as successes by host |
| | where (successes=<1 AND failures >=5) |
Table 5.
Splunk Query to Detect File Creation and Deletion
| index=* source="Microsoft-windows-sysmon/operational" |
| (Eventcode IN ("11", "23", "29") AND host="fileserver") |
| | table host file_creation_time location |
| | sort _time |
Table 6.
APT Attack Detectable Stages and Alerts
| APT Stages | Unusual Behavior Events | Alerts | Alert Description |
|---|---|---|---|
| S1: Initial Compromise | Malicious Domain | Malicious Domain Alert | |
| Malicious File Execution | Malicious File Execution alert | ||
| Malicious Hashes | Malicious Hash Alert | ||
| Malicious DNS | Alert generated in response of a malicious DNS detection | ||
| Successful login after several failed attempts | Alert generated in response of illegal login attempts | ||
| S2: C and C Communication | Malicious IP addresses | Alert generated when malicious IP is detected | |
| Malicious SSL certificate | Alert generated when malicious SSL certificate is detected | ||
| S3: Asset Discovery | Network scanning | Network ports scanning | |
| Assessing sensitive data | Illegal access to sensitive data | ||
| Change to user privileges | Alert generated when there is a change in user privileges | ||
| S4: Data Ex-filtration | Unusual Network Traffic | Alert generated due to huge increase in network traffic | |
| Unexpected System Errors | Alert generated due to system errors | ||
| Tor connection with C and C server | Alert generated when tor connection is detected | ||
| File transfer, creation, or deletion | Alert generated due to file transfer, deletion, or creation |
Table 7.
A comparison between Random Forest and XGBoost Classifiers
| Notation | Description | ||||
|---|---|---|---|---|---|
| Classifiers | Acc | TPR | TNR | FNR | FPR |
| Random Forest | 98.54 | 98.55 | 98.53 | 1.44 | 1.46 |
| XGBoost | 99.6 | 98.55 | 1.0 | 1.44 | 0.0 |
Disclaimer/Publisher’s Note: The statements, opinions and data contained in all publications are solely those of the individual author(s) and contributor(s) and not of MDPI and/or the editor(s). MDPI and/or the editor(s) disclaim responsibility for any injury to people or property resulting from any ideas, methods, instructions or products referred to in the content. |
© 2024 by the authors. Licensee MDPI, Basel, Switzerland. This article is an open access article distributed under the terms and conditions of the Creative Commons Attribution (CC BY) license (http://creativecommons.org/licenses/by/4.0/).
Copyright: This open access article is published under a Creative Commons CC BY 4.0 license, which permit the free download, distribution, and reuse, provided that the author and preprint are cited in any reuse.


