Submitted:
19 September 2024
Posted:
20 September 2024
You are already at the latest version
Abstract
The construction of an anaerobic digester coupled with post-digestion low level aeration for agricultural wastewater treatment is described. The digester employs underwater speakers to accelerate the anaerobic digestion process while retaining solids to reduce the strength of the effluent. The digester effluent is sent to a holding tank and fed at a low flow rate to an aeration tank to effect partial nitrification of the wastewater. The outlet of this tank is sent to a settling tank to retain biomass that developed in the aeration tank and the effluent is sent to a small, constructed wetland to further reduce wastewater nitrogen and phosphorus. The wetland was planted with the broadleaf cattail, Typha latifolia, and hence to a retention basin. The system has reduced energy consumption due to both the use of underwater sonic treatment and low-level aeration that is not designed to achieve full nitrification/denitrification but rather to achieve a mixture of ammonium, nitrite, and nitrate that might foster the development of a consortium of organisms (i.e. nitrifiers, Anammox bacteria) that can remediate wastewater ammonium at low cost. Biogas is sent to an inground condenser where different treatments may be tested to remove carbon dioxide and hydrogen sulfide. The system is meant to serve as a complex where various technologies and practices can be evaluated to improve the treatment of agricultural wastewater.
Keywords:
anaerobic digestion
; animal waste
; bioenergy
; biogas
; carbon dioxide
; greenhouse gases
; methane
; sonication
; wastewater
1. Introduction
Inadequate treatment of animal wastes is a global problem, leading to air pollution, eutrophication of natural water bodies, spread of antibiotic-resistant bacteria and significant releases of the greenhouse gases (GHG) carbon dioxide, methane, and nitrous oxide [1]. Although much large-scale animal production occurs in developed countries, there is little legislation that addresses pollution from animal rearing facilities [2].
In the United States, the most common waste management practice is to store wastewater in facultative aerobic lagoons and then apply the treated wastewater to land during seasons where the nutrients, particularly phosphorus and nitrogen, can be utilized by crops [3]. Lagoons emit considerable amounts of greenhouse gases, ammonia, and malodors. Sulfur in the form of hydrogen sulfide and organic sulfides contribute to malodor but can also react in the atmosphere to produce sulfate particulate species [4,5]. Other compounds from lagoon emissions that are reactive includes nitrogen species such as ammonia, amines [6], and heterocyclic compounds [7]. Furthermore, the effluent usually contains pathogens, excess plant nutrients, and untreated biological waste which leads to contamination of ground and surface waters. While facultative lagoons have the advantage of being relatively inexpensive, more effective means of treating animal waste are needed.
Of all the technologies available to treat animal wastes, anaerobic digestion has the greatest provenance, with its earliest known use occurring at least 30 centuries ago [8]. Despite this, the use of anaerobic digesters has not achieved widespread adoption. Reasons for this include the relatively low quality of biogas which contains considerable moisture, carbon dioxide and hydrogen sulfide. Their removal requires the use of technologies such as sorbents and chemicals such as iron and alkalis [9] which may entail considerable capital and operational costs [10].
In addition to this, anaerobic digesters normally require mixing systems which can be costly to install and maintain. Adequate mixing is often hard to achieve which may lead to accumulation of solids and/or crusting and potentially lead to digester failure [11,12].
Other possible problems associated with anaerobic digesters are plant nutrients in the discharged wastewater [13]. This would ideally be supplemented with a nitrogen source and applied to cropland to meet phosphorus requirements.
Another concern is the emission of greenhouse gases (GHG) from anaerobic digesters, although it seems intuitive that anaerobic digesters would have less GHG emissions than more conventional means of manure handling. Indeed, Miranda et al., in a meta-analysis of anaerobic digestion, found lower emissions of GHG in manure storage and field applications as well as GHG reductions due to offsets for fertilizer application and energy production [14].
In addition to utilizing methane for energy production, anaerobic digestion offers the opportunity of capturing carbon dioxide in a concentrated form and at low temperatures. Whereas atmospheric CO2 occurs at about 412 ppm at the present day [15], its concentration in biogas typically ranges from 30-60% [16].
Hydrogen sulfide in biogas occurs at concentrations normally ranging from 50 to 5,000 ppm but has been measured as high as 20,000 ppm [17]. As a corrosive, as well as due to its toxicity, it should be removed from biogas prior to its combustion [18]. Furthermore, if it is not, it is rapidly converted to sulfur dioxide in the atmosphere and hence to sulfate whether or not it is combusted and can participate in the formation of harmful particulate matter and acid rain [19].
This paper describes an anaerobic digestion system coupled with post digestion wastewater treatment. It employs sound to accelerate the speed of anaerobic digestion and as a substitute for mechanical mixing, reduce the concentration of solids in the digester effluent. The effluent then undergoes low level aeration to achieve partial nitrification to aid in ammonia removal and is discharged to a small, constructed wetland. The discharge from the wetland is to a lagoon which serves as a reservoir for process water for the digester.
The biogas from the digesters is passed through an inground condenser to attempt removal of CO2 and H2S without the use of more sophisticated scrubbing systems. Although we use a small chamber here, it affords significant time for interaction with sorbents or other chemical reagents to improve biogas quality. For instance, gas linear velocity in a 1.27-cm diameter gas line at a gas production rate of 5 m3 day-1 is approximately 45.8 cm s-1 while in the 10.2-cm diameter condenser this decreases to 0.18 cm s-1.
The coupled digester and wastewater treatment system is used as a means of evaluating practices and technologies that can produce biogas in a cost-effective manner and produce water that is of sufficient quality to recycle back to the anaerobic digesters. This study describes the system and presents preliminary data that will used in designing systems to improve nutrient recovery from the effluent, improve biogas quality and identify points in the system where the escape of GHG occur.
2. Materials and Methods
2.1. Waste Treatment System Description
The anaerobic digester and nitrogen removal module was built on a concrete pad measuring 21 by 6 m. A building with a floor measuring 9.1 by 5.2 m with walls 4.9 m tall and a peak building height of 5.9 m was erected on the concrete pad and housed the wastewater feeding tank, anaerobic digester, aeration tank and settling tank as described below. The concrete pad also accommodated a constructed wetland measuring 3.6 by 3.6 m and filled with a Crider soil with an average depth of 0.3 m and a water depth of 0.3 m (Figure 1). Bulrushes or broadleaf cattails (Typha latifolia) were planted in the wetland to aid in remediation of the wastewater. The outlet of the wetland led to a polypropylene-lined lagoon with dimensions of approximately 10 by 5 m and an average depth of 4.75 m with a 30° slope, providing a capacity of approximately 75 m3. A photograph of the wastewater treatment system is presented as Figure 1.
Anaerobic digestion and wastewater holding tanks were purchased from Tank Depot (Edgecliff Village, TX, USA). The digester was constructed from a high-density polyethylene (HDPE) water tank with a diameter of 2.44 m and height of 2.77 m, a volume of 11,360-L and a digestate volume of 9,085-L. The system was fed by an AMT model 316B-95 self-priming 120-V single-phase centrifugal pump (Gorman-Rupp, Mansfield, OH, USA). Wastewater was fed to the pump from an elevated cone-bottom HDPE feed tank with a capacity of 946 L (National Tank Outlet, Memphis, TN, USA). Feed was routed to the digester my means of a 5.08-cm polyvinyl chloride (PVC) pipe. During a typical feeding each digester received 22.7 kg of chicken litter suspended in 757-L with a 189-L rinse. Digestate levels were gauged by the means of a clear 5.08-cm diameter PVC pipe with a length of 30 cm (McMaster-Carr, Aurora, OH, USA) connected to the side of the digester near its surface.
The approximate volume to be fed to each tank was drained prior to feeding by opening a ball valve and emptied into a 3,028-L HDPE effluent holding tank located outside of the building. The digester had an outlet at the top of the tank which accommodated a 1.27 cm diameter PVC pipe connected to an EKM model EKM-PGM-075 pulse output diaphragm gas meter, which recorded 1.0-ft3 (28.3 L) per pulse (EKM Metering, Santa Cruz, CA, USA). From the meter the line led to an in-ground condensate trap constructed from a 10.2 cm diameter pipe with a length of 0.3 m. The top of the condensate trap was fitted with a 1.27-cm diameter pipe and ball valve from which condensate from the bottom of the condenser could be collected. From the condensate trap the line then led to another EKM gas meter prior to venting to the atmosphere. Prior to feeding the digester it was vented to the atmosphere by opening a three-way valve on the gas line to avoid developing excess pressure or vacuum in the system.
From the outdoor holding tank, water flowed was gravity fed to an indoor effluent holding tank. From this tank, water at a rate of 94 mL-1 min-1 was fed to a 208-L cone bottom HDPE tank filled with 38-L of polypropylene bioballs (Aquatic Experts, Greensboro NC, USA). Aeration at a rate of 6-L min-1 was provided by a Aquaneat SCP-107 diaphragm pump (Amazon.com). The volume of this tank was maintained at 204-L by an outlet leading to another HDPE cone-bottom tank maintained at a volume of 193-L. This tank was intended for use as a settling tank to reduce loss of ammonia oxidizing bacteria and or archaea that might develop in the aeration tank. A schematic representation of the waste treatment system is presented as Figure 2.
The overflow from the settling tank led back outside the building and to a 3.4-m long sand-filled aluminum gutter lined with geotextile fabric and with downspouts at each end. The flow from the sand filter trickled into the constructed wetland.
The overflow of the wetland, consisting of wastewater and rainwater, flowed into a lagoon with a polypropylene liner for further remediation and use as a reservoir for water to feed waste back to the digesters. The lagoon had approximate dimensions of 14 by 7 m and an approximate capacity of 125 m3.
2.2. Sound Systems
All sound systems were housed in a shed measuring 2 by 4 m. Sound was supplied to the digesters by Skar Audio FSX10-4 ten in (25.4 cm) 4 Ω speakers rated at 200 W RMS (root mean square) power and a frequency response of 50-5,000 Hz (Skar Audio, Tampa, FL, USA). The speakers were waterproofed by coating them with GE Silicone I caulk (General Electric Co., Boston, MA, USA) diluted with petroleum-based lighter fluid. Two sets of speakers were mounted 0.5 m above and facing the bottom of each digester to have a backup system in case of failure of one of the stereo systems. During operation, the amplifiers were operated at one-quarter volume for 15 min per hour. Sound was played to the digester consisted of a recording of Neptune, The Mystic from Gustav Holst’s orchestral suite The Planets, and five simultaneous sine waves with frequencies of 1, 2, 3, 4, and 5 kHz played simultaneously as well as a overdubbed recording of two electric guitars undergoing feedback while being played through a Fender® Mustang II amplifier (Fender, Fullerton, CA, USA) recorded with a Yeti USB microphone (Logitech, Newark, CA, USA). The guitars were recorded at a sample rate of 320 kHz with an audio depth of 32 bits.
For audio recordings of the digesters, two Aquarian Model H1A hydrophones (Aquarian Audio & Scientific, Anacortes,WA, USA) were placed in each digester and placed in the center of the tank 1.0 m above the bottom of the tank. For each digester, one hydrophone was equipped with a 1/4“ (6.35 mm) tip-sleeve jack while the other was equipped with a XLR connector. Speaker and hydrophone lines were routed via a 2-in polyvinylchloride (PVC) conduit to a shack (4 m by 3m) housing the stereo amplifiers (Pyle Audio PTAU 55) rated at 120-W RMS per channel (Pyle Audio, Brooklyn, NY, USA) and the recording equipment.
Recording was performed using a Focusrite Scarlett 18i8 3rd generation USB audio interface (Focusrite Audio Engineering Ltd., High Wycombe, UK) and Ableton Live 11 software (Ableton, Berlin, DE). Input gain was set to 0 dB. Recordings was performed at a sampling rate of 96 kHz and audio depth of 24 bits affording a frequency range while recording from 1 Hz to 48 kHz. Live audio monitoring of the digesters was provided by 150-W Behringer Studio50usb-powered studio monitors (Behringer, Willich, DE).
2.3. Wastewater Treatment System Operation
The digesters were seeded with 13.6 kg dairy manure and 95 L of digestate from a commercial anaerobic digester maintained at approximately 48 °C. The next week, the digesters were fed 13.6 kg of spent top-dressing poultry litter in 750 L of water followed by 190 L of addition water to rinse and flush the feed tank and lines. In subsequent weeks the digesters were fed 22.7 kg of poultry litter in the same fashion. From week six onwards, 100 g Ca(OH)2 was added to the feed to boost alkalinity in the digester. From week 11 onwards, the digesters were fed 11.3 kg cracked corn and 13.6 kg of poultry litter.
2.4. Sampling
Samples were collected weekly for analysis prior to feeding the digesters. Water temperature, conductivity, pH, and oxidation-reduction potential (ORP) were measured using a YSI ProDSS water quality meter (YSI Inc., Yellow Springs, OH, USA), and analyses of GHG in the biogas and water were performed as previously described [20,21]. Soil temperature and moisture were recorded once hourly (Meter Group Inc. Pullman, WA, USA). All other water quality parameters were conducted on samples which had been stored at -4 °C prior to analysis using APHA standard methods [22].
Wastewater samples were filtered through nylon syringe filters with a 0.25 um pore size and then analyzed on a SEAL AQ400 discrete spectrophotometric analyzer (SEAL Analytical, Inc., Mequon, MN, USA) using methods AGR-232-C Rev.1 and EPA-153-A Rev. 2 for nitrate/nitrite and ammonia, respectively.
Anions were determined by ion chromatography. Two mL samples were filtered through a 0.2 µm pore size filters. Twenty-five µL was injected via IC via a Model AS-AP autosampler. AS22 Eluent Reagent was used as mobile phase for an isocratic run. The mobile phase was pumped at 1.0 mL min-1 through a 50 mm x 4.00 mm IonPac AG22 Guard and 250 mm by 4.00 mm IonPacAS22 Analytical columns held at 25 °C to a model 061830 conductivity detector and an ADRS 600 Anion Dynamically Regenerating Suppressor. Cations were determined using methanesulfonic acid as the mobile phase at 1.2 mL min-1 through a 50 mm x 4.00 mm IonPac CG12A Guard and 250 mm X 4.00 mm IonPac CS12A Analytical columns held at 25 °C to a Model 061830 conductivity detector and a Cation Dynamically Regenerating Suppressor (ICS 6000 , Thermo Sci/Dionex Corp., San Francisco, CA, USA). Wastewater and ion data was analyzed in SAS 9.4 (SAS Institute, Cary, NC, USA) using PROC GLM and means were compared by a Duncan multiple range test.
Atmospheric greenhouse gases were determined by a photoacoustic multigas monitor INNOVA 1512-5, LumaSense (California Analytical Instruments Inc., Orange, CA), USA). The photoacoustic gas analyzer had four optical filters: NH3 with a detection limit (DL) of 0.2 ppm(UA0976), N2O with a DL of 0.03 ppm (UA0985), CO2 with a DL of 5.0 ppm (UA0983), and CH4 with a DL of 0.4 ppm (UA0969). Samples were collected every 5 min. via the onboard vacuum system on the system through PTFE tubing with a 4.6 mm diameter and an average length of 18 m. Gas was sampled at the outlet of the anaerobic digester, 3-cm above the surface of the aeration tank, and at a 5.1-cm vent on the effluent holding tank. In the case of the wetland, the air was sampled from a floating chamber with an approximate volume of 28-L. The chamber was made by cutting a 57-L closed-end barrel in half longitudinally.
Biogas and dissolved gas analyses were performed as described previously [21,23]. Ammonium and nitrate concentrations were analyzed on a SEAL AQ400 discrete spectrophotometric analyzer (SEAL Analytical, Inc., Mequon, MN) using methods AGR-232-C Rev.1 and EPA-153-A Rev. 2 for nitrate/nitrite and ammonia, respectively.
3. Results and Discussion
3.1. Sound Treatment of Digesters
Figure 3 shows a spectrogram of digester A recorded during week 11 after digester startup. During this time the digester had been treated intermittently at one-quarter volume by a recording of Neptune, The Mystic. The background sound amplitude was very low as we have seen in previous research, and it was only after a long exposure to sound on a 2 h on, 1 h off cycle of sound that the background audio amplitude became much greater than that of an untreated digester [21]. During the previous experiment, the amplifiers were set to one-half volume whereas in the present experiment, the amplifier was set to one-quarter volume. The faint vertical lines extending from about 0-5,000 Hz that can be best seen during the background recording and while sine waves are being played are due to cavitational events, i.e., bubbles either forming or collapsing.
In the previous experiment, we speculated that bubbles undergoing inertial cavitation in a sound field would emit harmonics of the excitation frequency extending into the ultrasonic range but lacked equipment capable of recording beyond 22 kHz. With the new recording equipment, faint bubble harmonics were seen extending to near 40 kHz when exposed to a mix of 1, 2, 3, 4, and 5 kHz sine waves. After approximately five minutes of exposure to the sine waves the volume of the stereo was increased to one-half to accentuate the bubble harmonics and then turned back to one-quarter volume. Intense bubble harmonics extending to at least 48 kHz were noted when comparatively loud guitar feedback was played to the digesters. It should be noted, however, that recording of the guitar feedback samples were done deliberately with audio clipping, i.e., exceeding the maximum input level of the recording device. The observed ultrasonic harmonics were nevertheless impressive considering the rated frequency of the loudspeakers did not exceed 5 kHz. The rationale for using recordings of guitar feedback was that audio feedback is a classic example of a chaotic system [24], and bubbles exposed to a chaotic sound field might undergo more chaotic oscillations and perhaps collapse more frequently and perhaps with even more violence [25].
3.2. Wastewater Quality
During the period discussed here, limited precipitation coupled with evaporation from the wetland resulted in very little flow into the lagoon so only wastewater quality from the digester through the wetland is discussed. Wastewater quality data presented in Table 1 covers the periods encompassing weeks 6-13 of the wastewater treatment system operation (7/2/2024-8/20/2024). The pH of the digester was low during this period, averaging 6.7 reflecting the relatively fast growth of fermenters as compared to methanogens [26]. Dissolved oxygen was low in all tanks but higher in the aeration tank where low level aeration was performed. All tanks had low ORP values, but this value was highest in the aeration tank.
Except in the aeration tank, NO2- occurred at much higher concentrations than did NO3-, likely due to the anoxic conditions. Poultry litter may contain high concentrations of NO3- [27] which could explain the high concentration of NO2- in the digesters due to incomplete denitrification [28]. In the aeration tank NO2- and NO3- concentrations were more nearly equal. Ammonium levels were lower in the aeration tank which could be due to nitrification/denitrification processes or stripping of ammonia due to the aeration. Regardless of which mechanism accounted for the lower concentration of NH4+, combined NH4+, NO3-, and NO2- concentration was relatively low in the wetland compared to that of the aeration tank. The intent for the aeration tank and wetland is to see how NH4+, NO2- and NO3- concentrations vary in the future and whether their microbiome adapts to catabolize these nutrients either through denitrification or anaerobic ammonia oxidation.
The wetland started out prior to feeding the digesters relatively oxic with dissolved O2 concentrations varying from 10.3 to 7.3 mg per L-1 and ORP ranging from +124 to +90 mV. Two weeks prior to the commencement of system operation, however, ORP declined to -205 mV due to die-off of accumulated algae. Despite rapid growth of T. latifolia during this period the wetland remained anoxic with ORP averaging -172 mV and dissolved oxygen averaging 1.0 mg L-1. Likely due to these anoxic conditions in the wetland, NO2- concentrations were much higher than were NO3-. Ammonium concentrations remained relatively low in the wetland likely due to its utilization by micro- and macro-flora.
Although these results are preliminary, relatively lower inorganic phosphate- concentrations in the aeration tank and wetland may indicate points where it is crystallizes out from the wastewater due to their higher pH. Inorganic phosphate is less soluble at higher pH [29]. In the wetland, much lower inorganic phosphate concentrations are likely also due to its take up by algae and cattails and perhaps deposition in the sediment. Without more comprehensive sampling and speciation of phosphate into organic and inorganic forms, this is speculative, however.
3.3. Biogas Production
Table 2 presents the characteristics of the digester biogas from three weeks before sound treatment began and three weeks with sound treatment. These periods span only weeks eight to 13 of digester operation and sound treatment was only started on a consistent basis to check operation and gain insight into bubble harmonics as discussed in section 3.1. Although gas production and biogas quality were slightly higher before sound treatment as compared to sound treatment, the digesters had not reached a period of stable gas production so it would be expected that both gas production and gas quality would be increasing during this time. Since the sound treatment was of low intensity compared to previous experiments [21,23], as well as only used 15 minutes per hour, it is unknown whether higher intensity sound treatment and/or treatment for longer time will yield results comparable to those seen previously.
Carbon dioxide composed approximately 39% of the biogas. Carbon dioxide typically ranges from 30-60% per volume in biogas (Abdel-Hadi 2008). The contaminant of most concern in biogas is usually H2S, which typically ranges from 50 to 10,000 parts per million (Little et al. 2000). We did not measure H2S in this study but plan on investigating whether condensation traps, as discussed below, can be used to remove CO2 and H2S in the future both to reduce the toxicity and corrosiveness of the biogas but to improve its caloric value.
3.4. Gas Emissions
Greenhouse gas and ammonia/ammonium concentrations were measured in the atmosphere and in the aqueous phase in the digester, effluent holding tank, aeration tank, and wetland (Table 3). Aqueous phase (solvated and in the form of bubbles) CO2 and CH4 occurred in the highest concentration in the digester and effluent holding tank as expected, and atmospheric CO2 concentrations were much higher from the outlet of the digester as expected. Atmospheric CH4 concentrations above the surface of the effluent holding tank were not markedly higher than that above the surface of the wetland, however, even though aqueous CH4 was more than 25-fold higher than that in the wetland.
Seeming incongruities in the concentration of gases in the wastewater and headspace at various stages of the treatment process are probably due to dynamics of ebullition, pH, and configuration of the wastewater holding tanks. For instance, the digester would have high rates of gas evolution due to bubbles collapsing at the surface of the tank as would the aeration tank. On the other hand, the digester and effluent holding tanks had limited venting compared to the aeration tank and wetland which might allow for the accumulation of aqueous gases. Ammonia, especially in more alkaline treatment stages after the digester would mostly be in the form of ammonium, limiting its emission.
In any case, no actual fluxes of gases were calculated from any of the sites within the wastewater treatment system which would be necessary to determine the magnitude of fugitive emissions. Still, given its relatively large area and the high concentrations of CH4 measured at its surface, the wetland is likely to be an area of concern. This is likely due to eutrophication of the wetland. As measures are taken to reduce nutrient loading of the wetland algal growth and GHG emissions may be reduced.
Although combined NH3/NH4+ in the digestate (quantified as NH4+) was quite high, low concentrations of NH3 was detected in the biogas. This would be due to the pH of the digester averaging 6.7 during the sampling period when most of the ammonia would exist as ammonium [23].
3.5. Condensate Traps
During the study period, the average daily temperature was 25.4 °C while the soil temperature averaged 26.6 °C. Therefore, little condensation was expected to occur. In fact, the condenser only yielded a mean of 25.9 ± 8.0 mL of water per week. This corresponded to a yield of only 4.75 ± 1.47 µL of water per L of biogas. It could be that most of this water was condensed in the gas lines above ground during the early morning when there would be the greatest temperature differential between the digester and air temperature. Analysis of the collected liquid showed high concentrations of ions including ammonium and sulfate indicating some removal of impurities from the gas stream. The presence of high concentrations of ions such as chloride, sodium and potassium, however, indicated that much of the liquid was deposited as aerosols from the digester rather than condensing from the vapor phase (data not shown).
Prior to addition of 2 mL of NaOH to the condensers, the condensate contained a mean of 1.30 ± 0.05 mM HCO3-, but after addition of NaOH, 13.8 ± 2.9 mM HCO3- (Table 4). This resulted in the relative percentage of CO2 in the biogas decreasing by 1.5% after passage through the inground trap. Although the amount of bicarbonate collected was small, this result indicates that due to the low linear velocity of the biogas in the condensers that means may be devised to significantly improve biogas quality at low cost. Although little liquid was collected, we feel that the efficiency of the condensers will likely increase in the future as ground cover develops and as temperatures decline in the fall. Using small amounts of liquid reagents such as bases and sorbents will be a convenient way of estimating their efficiency prior to modifying the condenser design.
A curious finding was the variable, yet higher, concentration of N2O collected in the condenser after addition of NaOH. Although we have no explanation for this finding if it should be borne out, it is possible that the most stable resonance structure of N2O, having a formal negative charge on the oxygen atom, is more soluble in alkaline solutions.
4. Conclusions
This system is intended for use in developing and testing anaerobic digestion and wastewater remediation technologies that are low cost and efficient. Wastewater and biogas characteristics of the system operated without the candidate technologies will serve as useful baselines for comparison later. The wide variation of pH, dissolved oxygen and redox potentials within the treatment system can foster the development of microbial processes such as nitrification, denitrification and anaerobic ammonia oxidation to remediate wastewater. Pilot scale wastewater treatment systems such as described here can be useful in developing new technologies due to their ability to be readily modified.
Author Contributions
J.H.L, S.W.A. M.B.V; methodology, J.H.L., M.B.V., P.J.S., S.W.A.; validation, S.W.A.; J.H.L; formal analysis, J.H.L., S.W.A.; investigation, J.H.L., N.L. resources, J.H.L., S.W.A. K.R.S., P.J.S., M.B.V.; data curation, J.H.L.; writing—J.H.L.; review and editing, J.H.L., P.J.S., P.J.S., M.B.V. visualization, J.H.L., M.B.V.; supervision, J.H.L.; project administration, J.H.L.; funding acquisition, J.H.L., K.R.S., P.J.S., M.B.V. All authors have read and agreed to the published version of the manuscript.
Funding
Funding was provided by the Agricultural Research Service (Grant No. 5040-12630-006-00D).
Data Availability Statement
The original contributions presented in the study are included in the article, further inquiries can be directed to the corresponding author.
Acknowledgments
The authors thank Zachary Berry, Jason Simmons, and Michael Bryant (USDAARS) for their technical assistance. The use of trade, firm, or corporation names in this article is for the information and convenience of the reader. Such use does not constitute an official endorsement or approval by the United States Department of Agriculture or the Agricultural Research Service of any product or service to the exclusion of others that may be suitable.
Conflicts of Interest
The authors declare no conflicts of interest. The funders had no role in the design of the study; in the collection, analyses, or interpretation of data; in the writing of the manuscript; or in the decision to publish the results.
References
- Gilbert, P.M. From hogs to HABs: impacts of industrial farming in the US on nitrogen and phosphorus and greenhouse gas pollution. Biogeochemistry 2020, 150, 139–180. [Google Scholar] [CrossRef]
- Center, T.J. Governmental oversight of discharges from concentrated animal feeding operations. Environ. Manag. 2006, 37, 745–752. [Google Scholar] [CrossRef] [PubMed]
- Burkholder, J.; Libra, B.; Weyer, P.; Heathcote, S.; Kolpin, D.; Thorne, P.S.; Wichman, M. Impacts of waste from concentrated animal feeding operations on water quality. Environ. Health Perspect. 2007, 115, 308–312. [Google Scholar] [CrossRef] [PubMed]
- Van Rooy, P.; Purvis-Roberts, K.L.; Silva, P.J.; Nee, M.J.; Cocker, D. Characterization of secondary products formed through oxidation of reduced sulfur compounds. Atmos. Environ. 2021, 256, 118148. [Google Scholar] [CrossRef]
- Van Rooy, P.; Drover, R.; Cress, T.; Michael, C.; Purvis-Roberts, K.L.; Silva, P.J.; Nee, M.J.; Cocker, D. Methanesulfonic acid and sulfuric acid Aerosol Formed through oxidation of reduced sulfur compounds in a humid environment. Atmos. Environ. 2021, 261, 118504. [Google Scholar] [CrossRef]
- Price, D.J.; Kacarab, M.E.; Cocker, D.R.; Purvis-Roberts, K.L.; Silva, P.J. Effects of temperature on the formation of secondary organic aerosol from amine precursors. Atmos. Environ. 2016, 50, 1216–1226. [Google Scholar] [CrossRef]
- Baboomian, V.J.; He, Q.; Montoya-Aguilera, J.; Ali, N.; Fleming, L.T.; Lin, P.; Laskin, A.; Laskin, J.; Rudich, Y.; Nizkorodov, S.A. Light absorption and scattering properties of indole secondary organic aerosol prepared under various oxidant and relative humidity conditions. Aerosol Sci. Technol. 2023, 57, 532–545. [Google Scholar] [CrossRef]
- Auer, A.; Vande Burgt, N.H.; Abram, F.; Barry, G.; Fenton, O.; Markey, B.K.; Nolan, S.; Richards, K.; Bolton, D.; De Waal, T.; et al. Agricultural anaerobic digestion power plants in Ireland and Germany: Policy and practice. J. Sci. Food. Agric. 2017, 97, 719–723. [Google Scholar] [CrossRef]
- Altege, M.R.; Senol, H.; Djaafri, M.; Hansu, T.A.; Krisa, D.; Atabani, A.; Eskicioglu, C.; Muratçobaboğlu, H.; Unalan, S.; Kalloum, S.; et al. A critical overview of the state-of-the-art methods for biogas purification and utilization processes. Sustainability 2021, 13, 11515. [Google Scholar] [CrossRef]
- Bauer, F.; Persson, T.; Hulteberg, C.; Tamm, D. Biogas upgrading - technology overview, comparison and perspectives for the future. Biofpr 2013, 7, 499–511. [Google Scholar] [CrossRef]
- Kariyama, I.D.; Zhai, X.; Wu, B. Influence of mixing on anaerobic digestion efficiency in stirred tank digesters: A review. Water Res. 2018, 142, 503–517. [Google Scholar] [CrossRef]
- Singh, B.; Szamosi, Z.; Siménfalvi, Z. State of the art on mixing in an anaerobic digester: A review. Renew. Energy 2019, 141, 922–936. [Google Scholar] [CrossRef]
- Çelen, I.; Türker, M. Recovery of ammonia as struvite from anaerobic digester effluents. Environ. Technol. 2001, 22, 1263–1272. [Google Scholar] [CrossRef]
- Miranda, N.D.; Tuomisto, H.L.; McCulloch, M.D. Meta-Analysis of greenhouse gas emissions from anaerobic digestion processes in dairy farms. Environ. Sci. Technol. 2015, 39, 5211–5219. [Google Scholar] [CrossRef]
- Cui, Y.; Schubert, B.A.; Jahren, A.H. A 23 m.y. record of low atmospheric CO2. Geology 2020, 48, 888–892. [Google Scholar] [CrossRef]
- Abdel-Hadi, M.A. A simple apparatus for biogas quality determination. Misr. J. Ag. Eng. 2008, 25, 1055–1066. [Google Scholar]
- Dumont, E. H2S removal from biogas using bioreactors: a review. Int. J. Energy Environ. Eng. 2015, 6, 479–498. [Google Scholar]
- Little, B.J.; Ray, R.I.; Pope, R.K. Relationship between corrosion and the biological sulfur cycle: a review. Corrosion 2000, 56, 433–443. [Google Scholar] [CrossRef]
- Likens, G.E.; Wright, R.F.; Galloway, J.N.; Butler, T.J. Acid Rain. SciAm. 1979, 241, 43–51. [Google Scholar] [CrossRef]
- Loughrin, J.H.; Antle, S.W.; Polk, J. A Gas Chromatographic Method for the Determination of Bicarbonate and Dissolved Gases. Front. Environ. Sci. 2017, 5, 65. [Google Scholar] [CrossRef]
- Loughrin, J.; Antle, S.W.; Sistani, K.; Lovanh, N. In situ acoustic treatment of anaerobic digesters to improve biogas yields. Environments 2020, 7, 11. [Google Scholar] [CrossRef]
- Eaton, A.; Clesceri, L.; Greenberg, A.; Franson, M. Standard Methods for the Examination of Water and Wastewater, 20th ed.; American Public Health Association: Washington, DC, USA, 1998. [Google Scholar]
- Loughrin, J.; Silva, P.; Lovanh, N.; Sistani, K. Acoustic stimulation of anaerobic digestion: Effects on biogas production and wastewater malodors. Environments 2022, 9, 102. [Google Scholar] [CrossRef]
- Slater, D. Chaotic sound synthesis. Comput. Music J. 1998, 22, 12–19. [Google Scholar] [CrossRef]
- Zhang, Y.; Zhang, Y. Chaotic oscillations of gas bubbles under dual-frequency acoustic excitation. Ultasonics Sonochem. 2018, 40, 151–157. [Google Scholar] [CrossRef]
- Meegoda, J.N.; Li, B.; Patel, K.; Wang, L.B. A review of the processes, parameters, and optimization of anaerobic digestion. Int. J. Res. Public Health 2018, 15, 2224. [Google Scholar] [CrossRef]
- Katuwal, S.; Rafsan, N.A.S.; Ashworth, A.J.; Kolar, P. Poultry litter physiochemical characterization based on production conditions for circular systems. BioResouces 2023, 18, 3961–2977. [Google Scholar] [CrossRef]
- Wilderer, P.A.; Jones, W.L.; Dau, U. Competition in denitrification systems affecting reduction rate and accumulation of nitrite. Water Res. 1987, 21, 239–245. [Google Scholar] [CrossRef]
- Zheng, Y.; Wan, Y.; Zhang, Y.; Huang, J.; Yang, Y.; Tsang, D.C.W.; Wang, H.; Chen, H.; Gao, B. Recovery of phosphorus from wastewater: A review based on current phosphorous removal technologies. Crit. Rev. Environ. Sci. Technol. 2022, 53, 1148–1172. [Google Scholar] [CrossRef]
Figure 1.
Anaerobic Digester/Wastewater treatment complex. A. Shed containing audio amplifiers and recording equipment. B. Building housing feeding tank, anaerobic digester, aeration tank, C. Holding tanks for digester effluent. D. Constructed wetland. E. Water retention lagoon for recycling back to the waste digester. Note that building houses two anaerobic digesters but that only one is fully functional at the time of this writing.
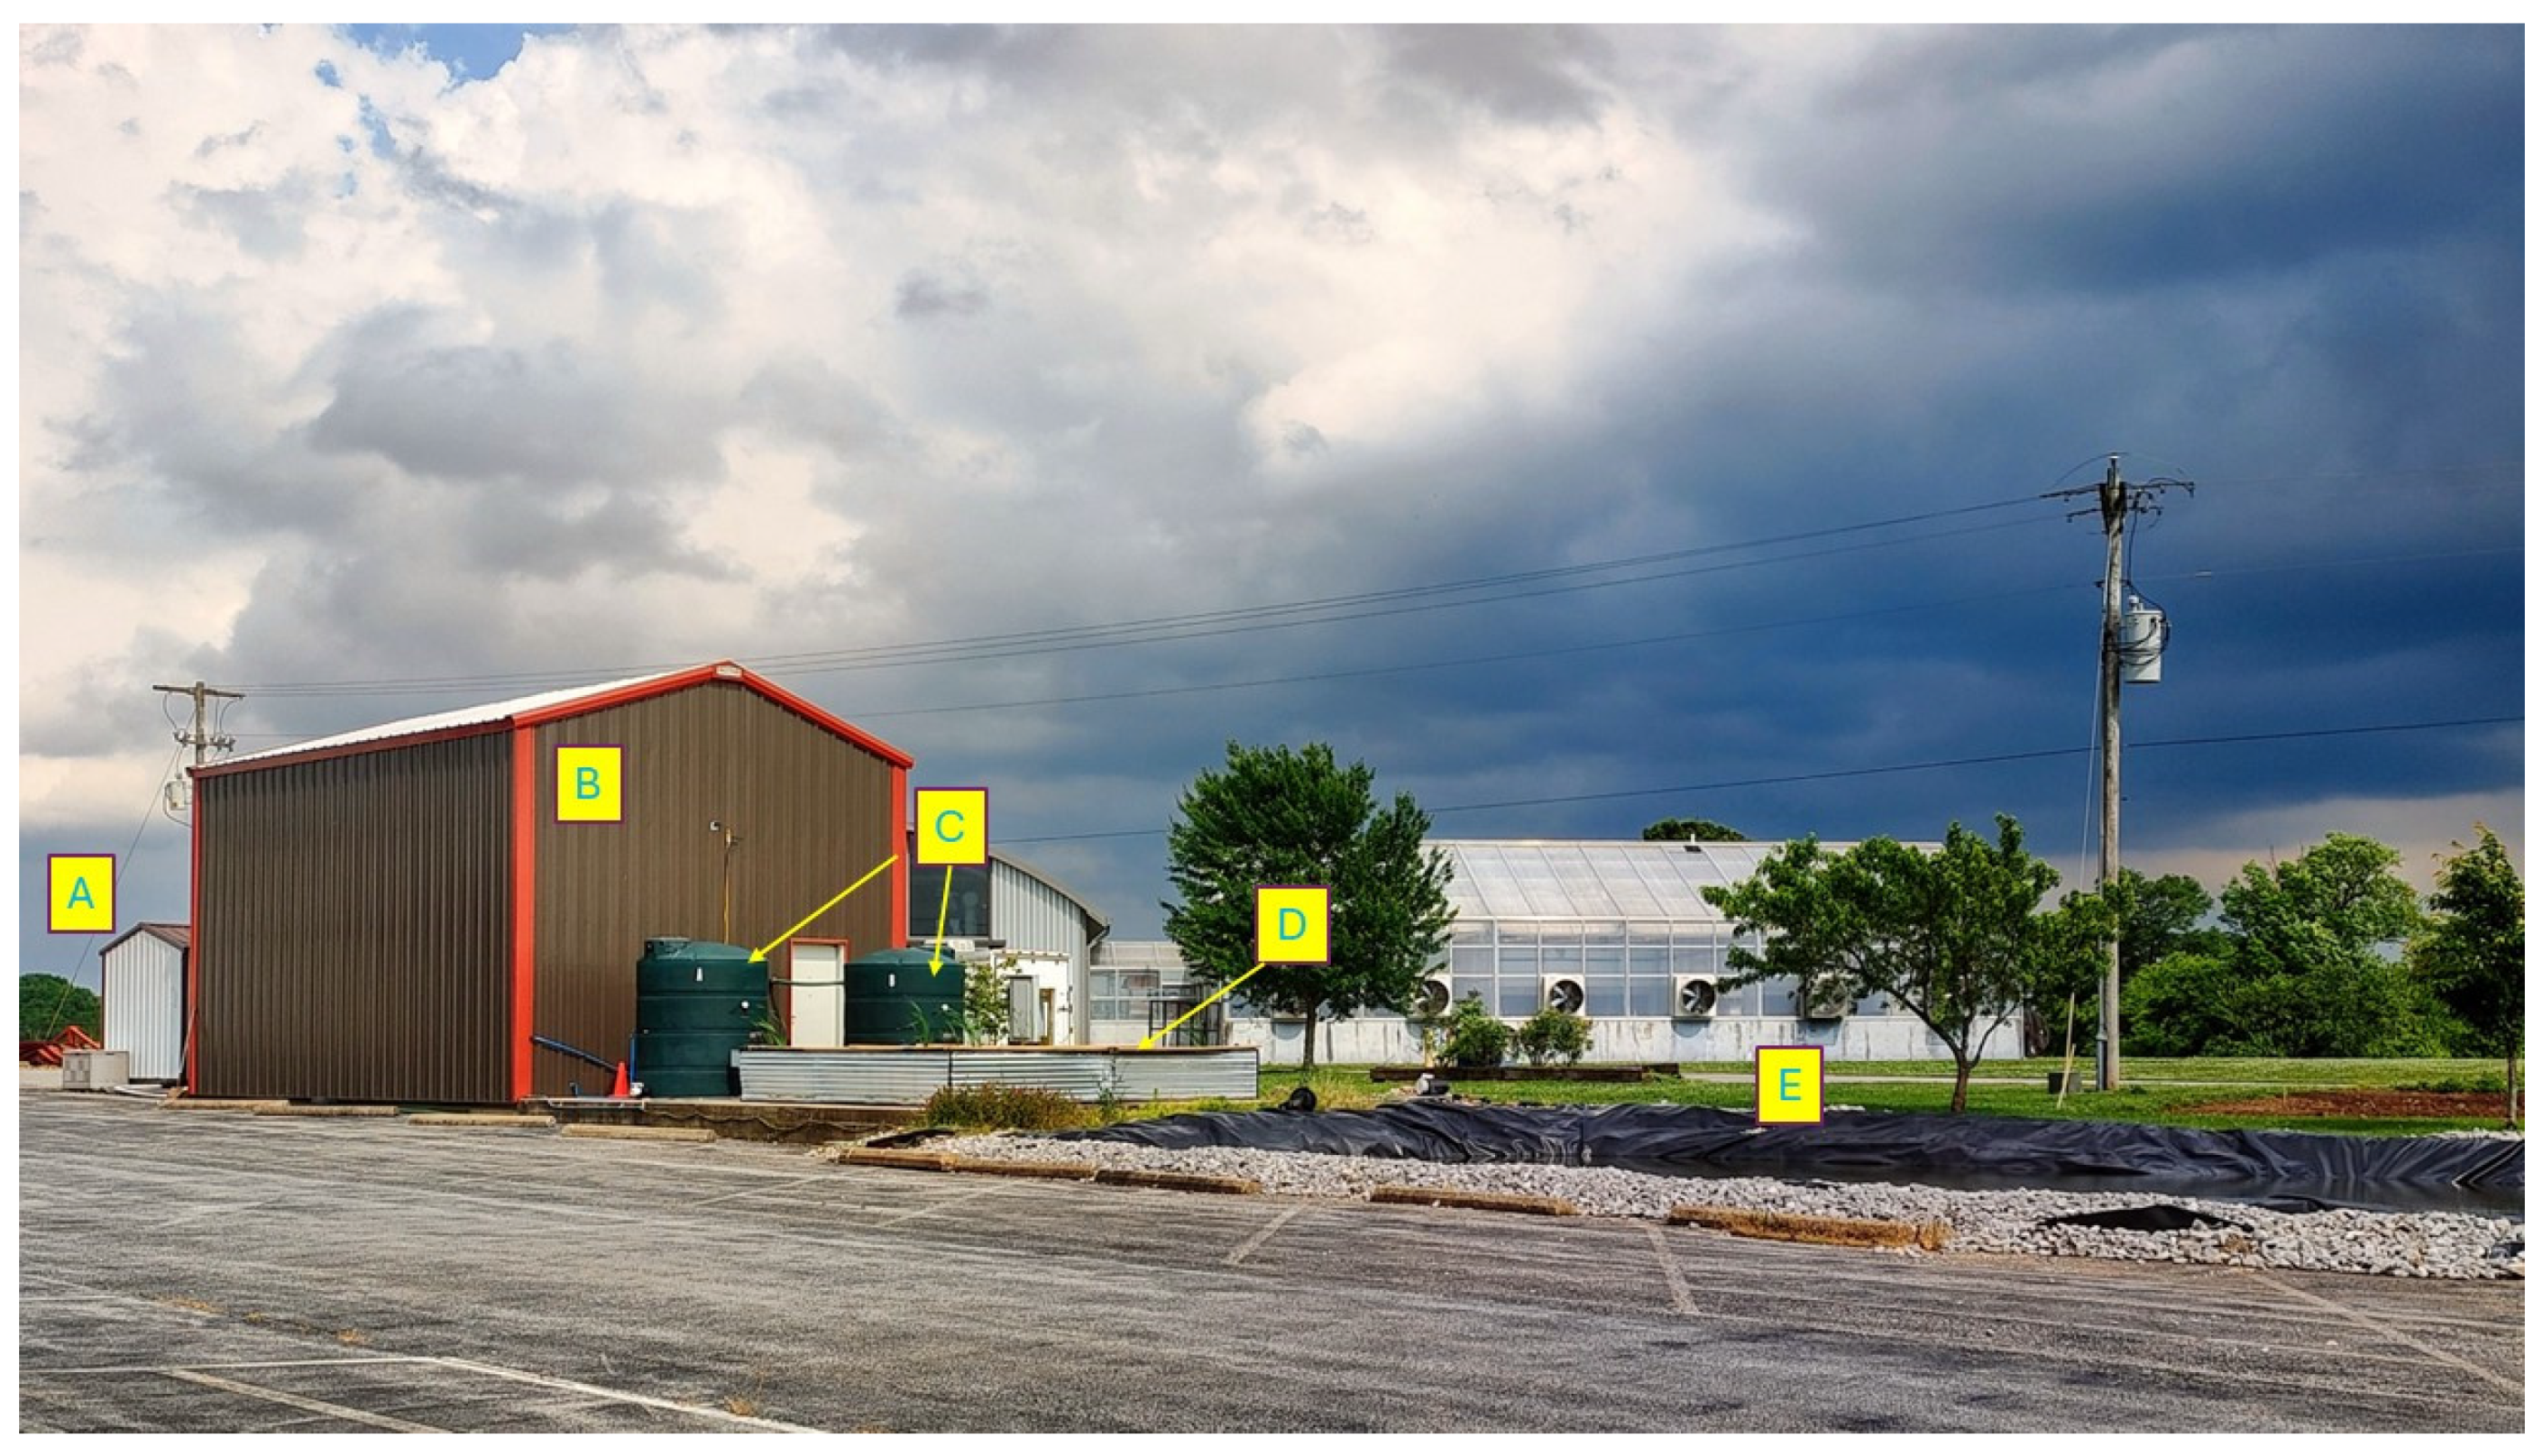
Figure 2.
Schematic representation of the anaerobic digestion system and wastewater treatment system. A. Feed tank; B. Anaerobic digester; C. Outdoor effluent holding tank; D. Indoor effluent holding tank; E. Aeration tank; F. Biomass retention tank.
Figure 2.
Schematic representation of the anaerobic digestion system and wastewater treatment system. A. Feed tank; B. Anaerobic digester; C. Outdoor effluent holding tank; D. Indoor effluent holding tank; E. Aeration tank; F. Biomass retention tank.
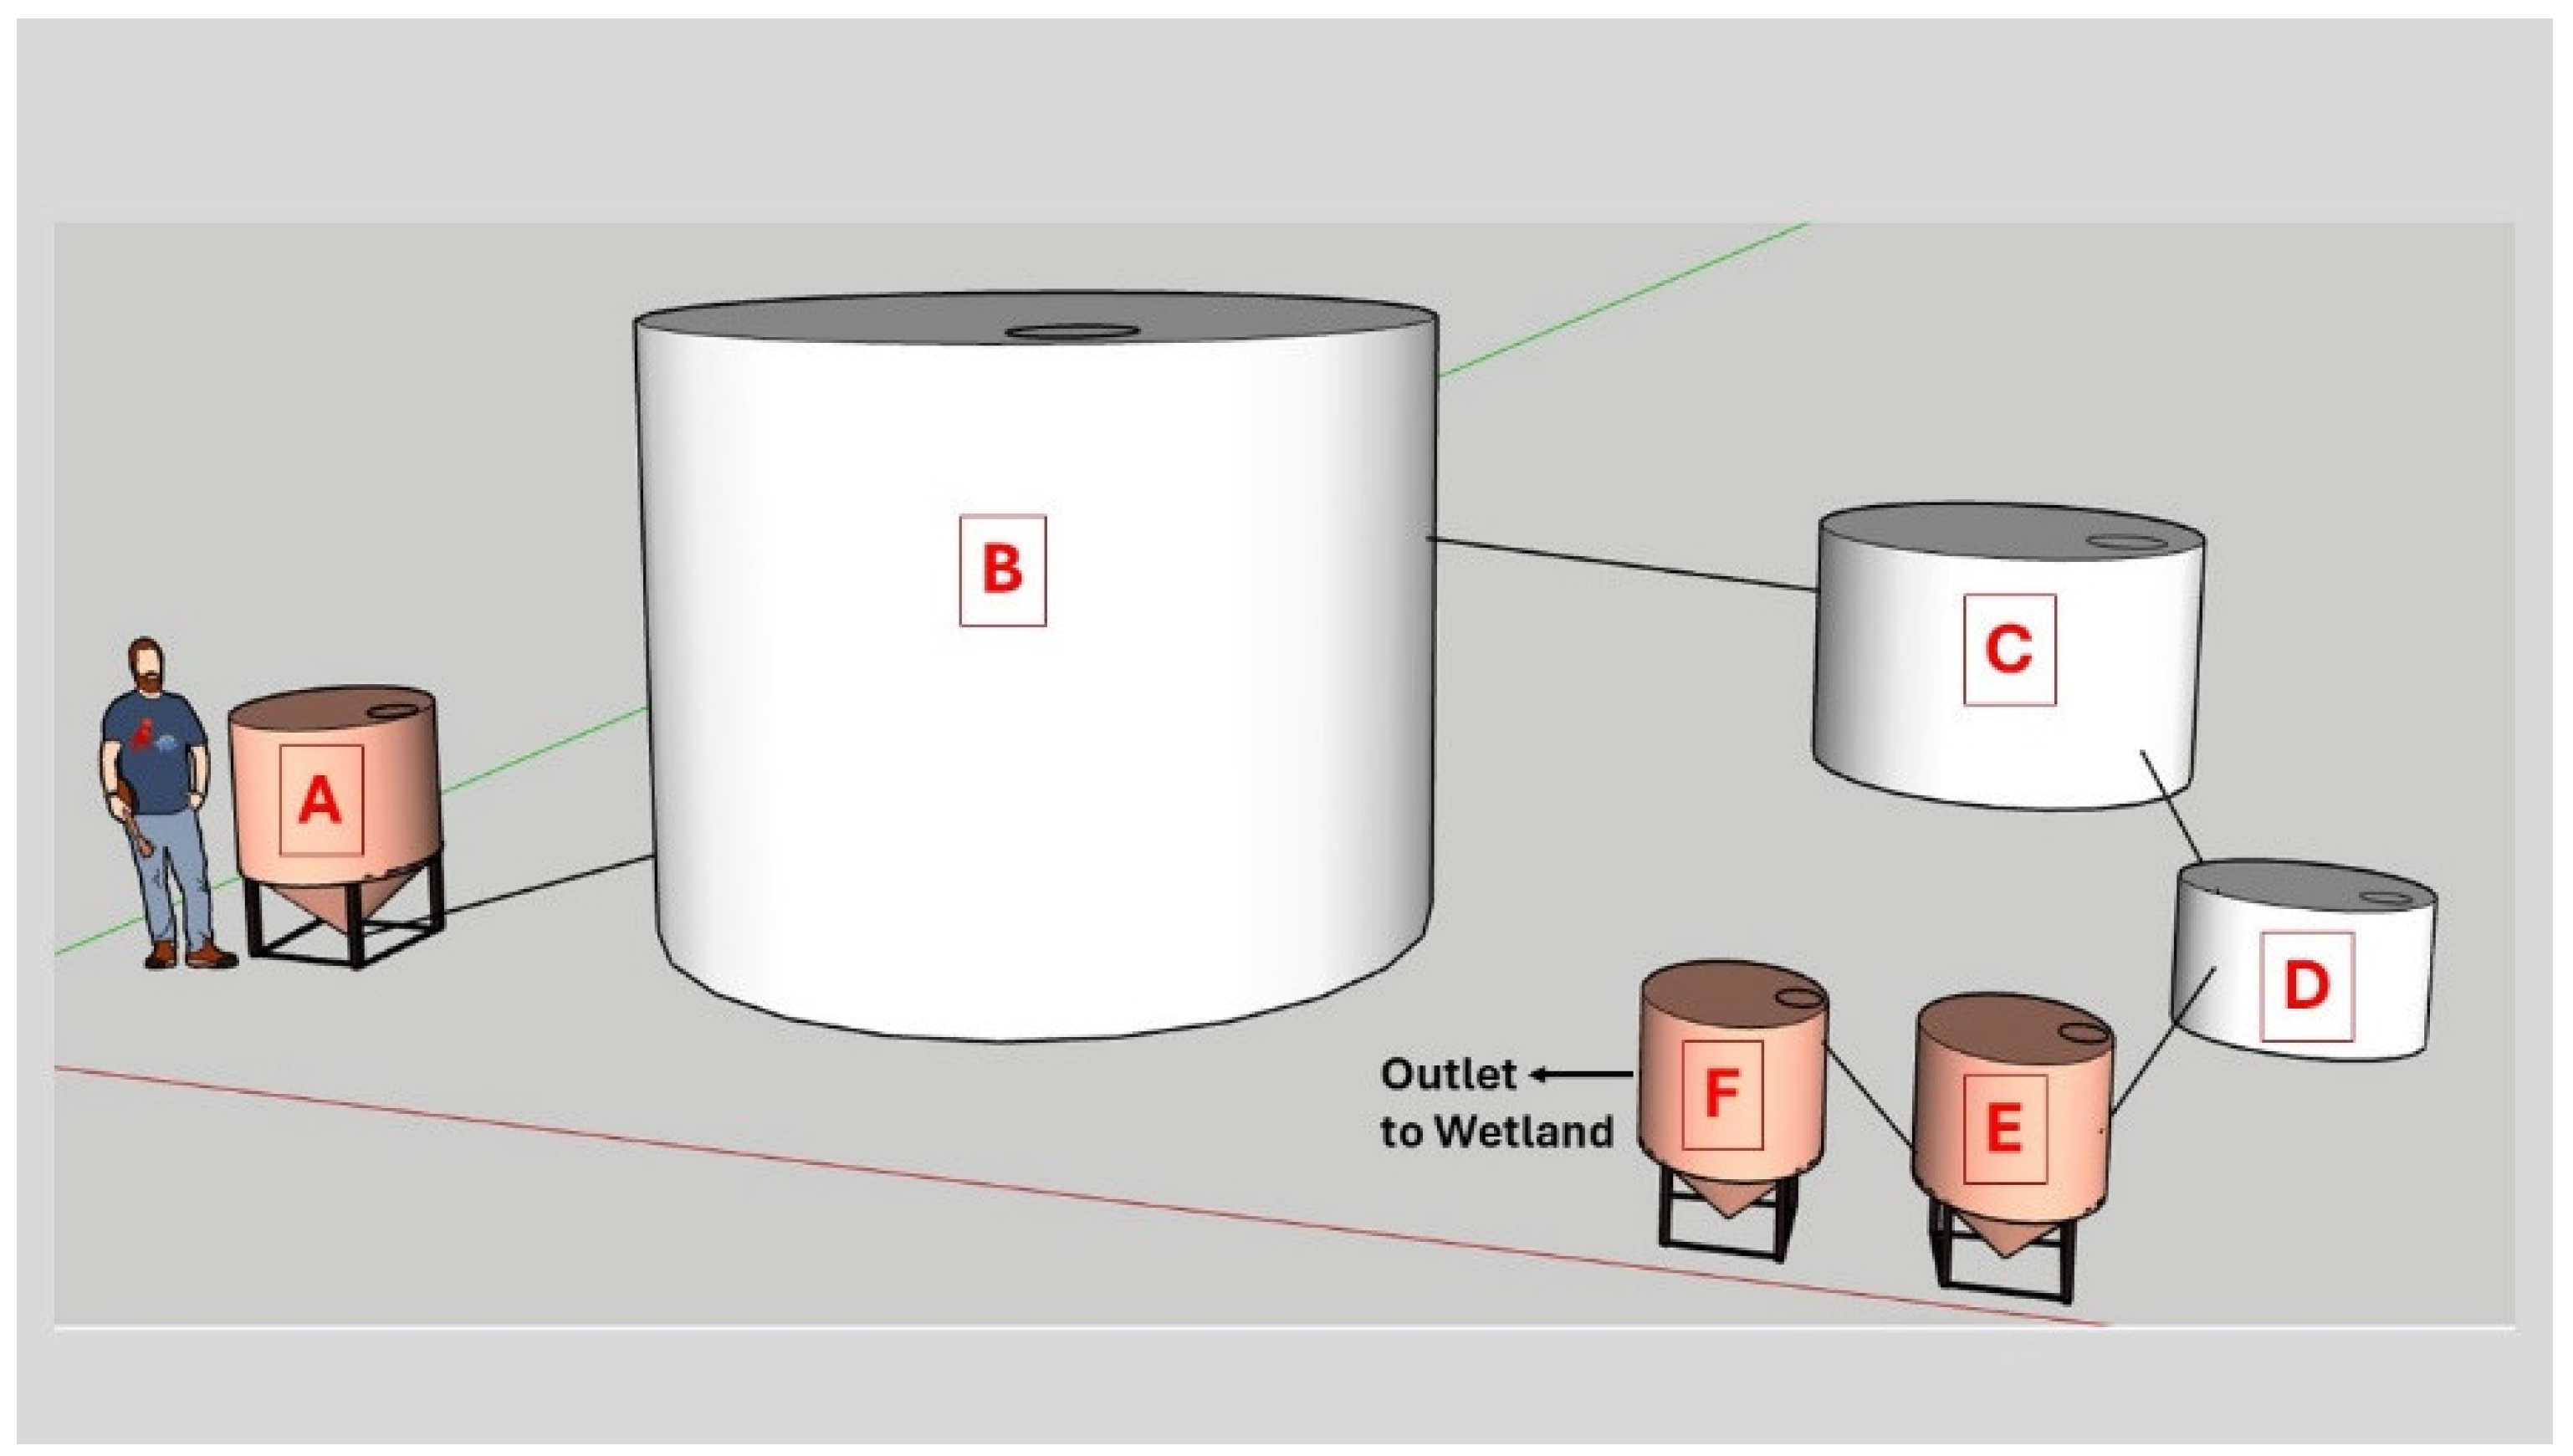
Figure 3.
Spectrogram of anaerobic digester treated with sound. A: Background sound levels; B: Digester exposed to a mix of one through five kHz sine waves at one kHz intervals. C: Volume of sine waves increased to one-half to accentuate harmonics; D: Digester exposed to a recording of Neptune, the Mystic from Gustav Holst’s orchestral suite The Planets; E. Digester exposed to a recording of guitar feedback.
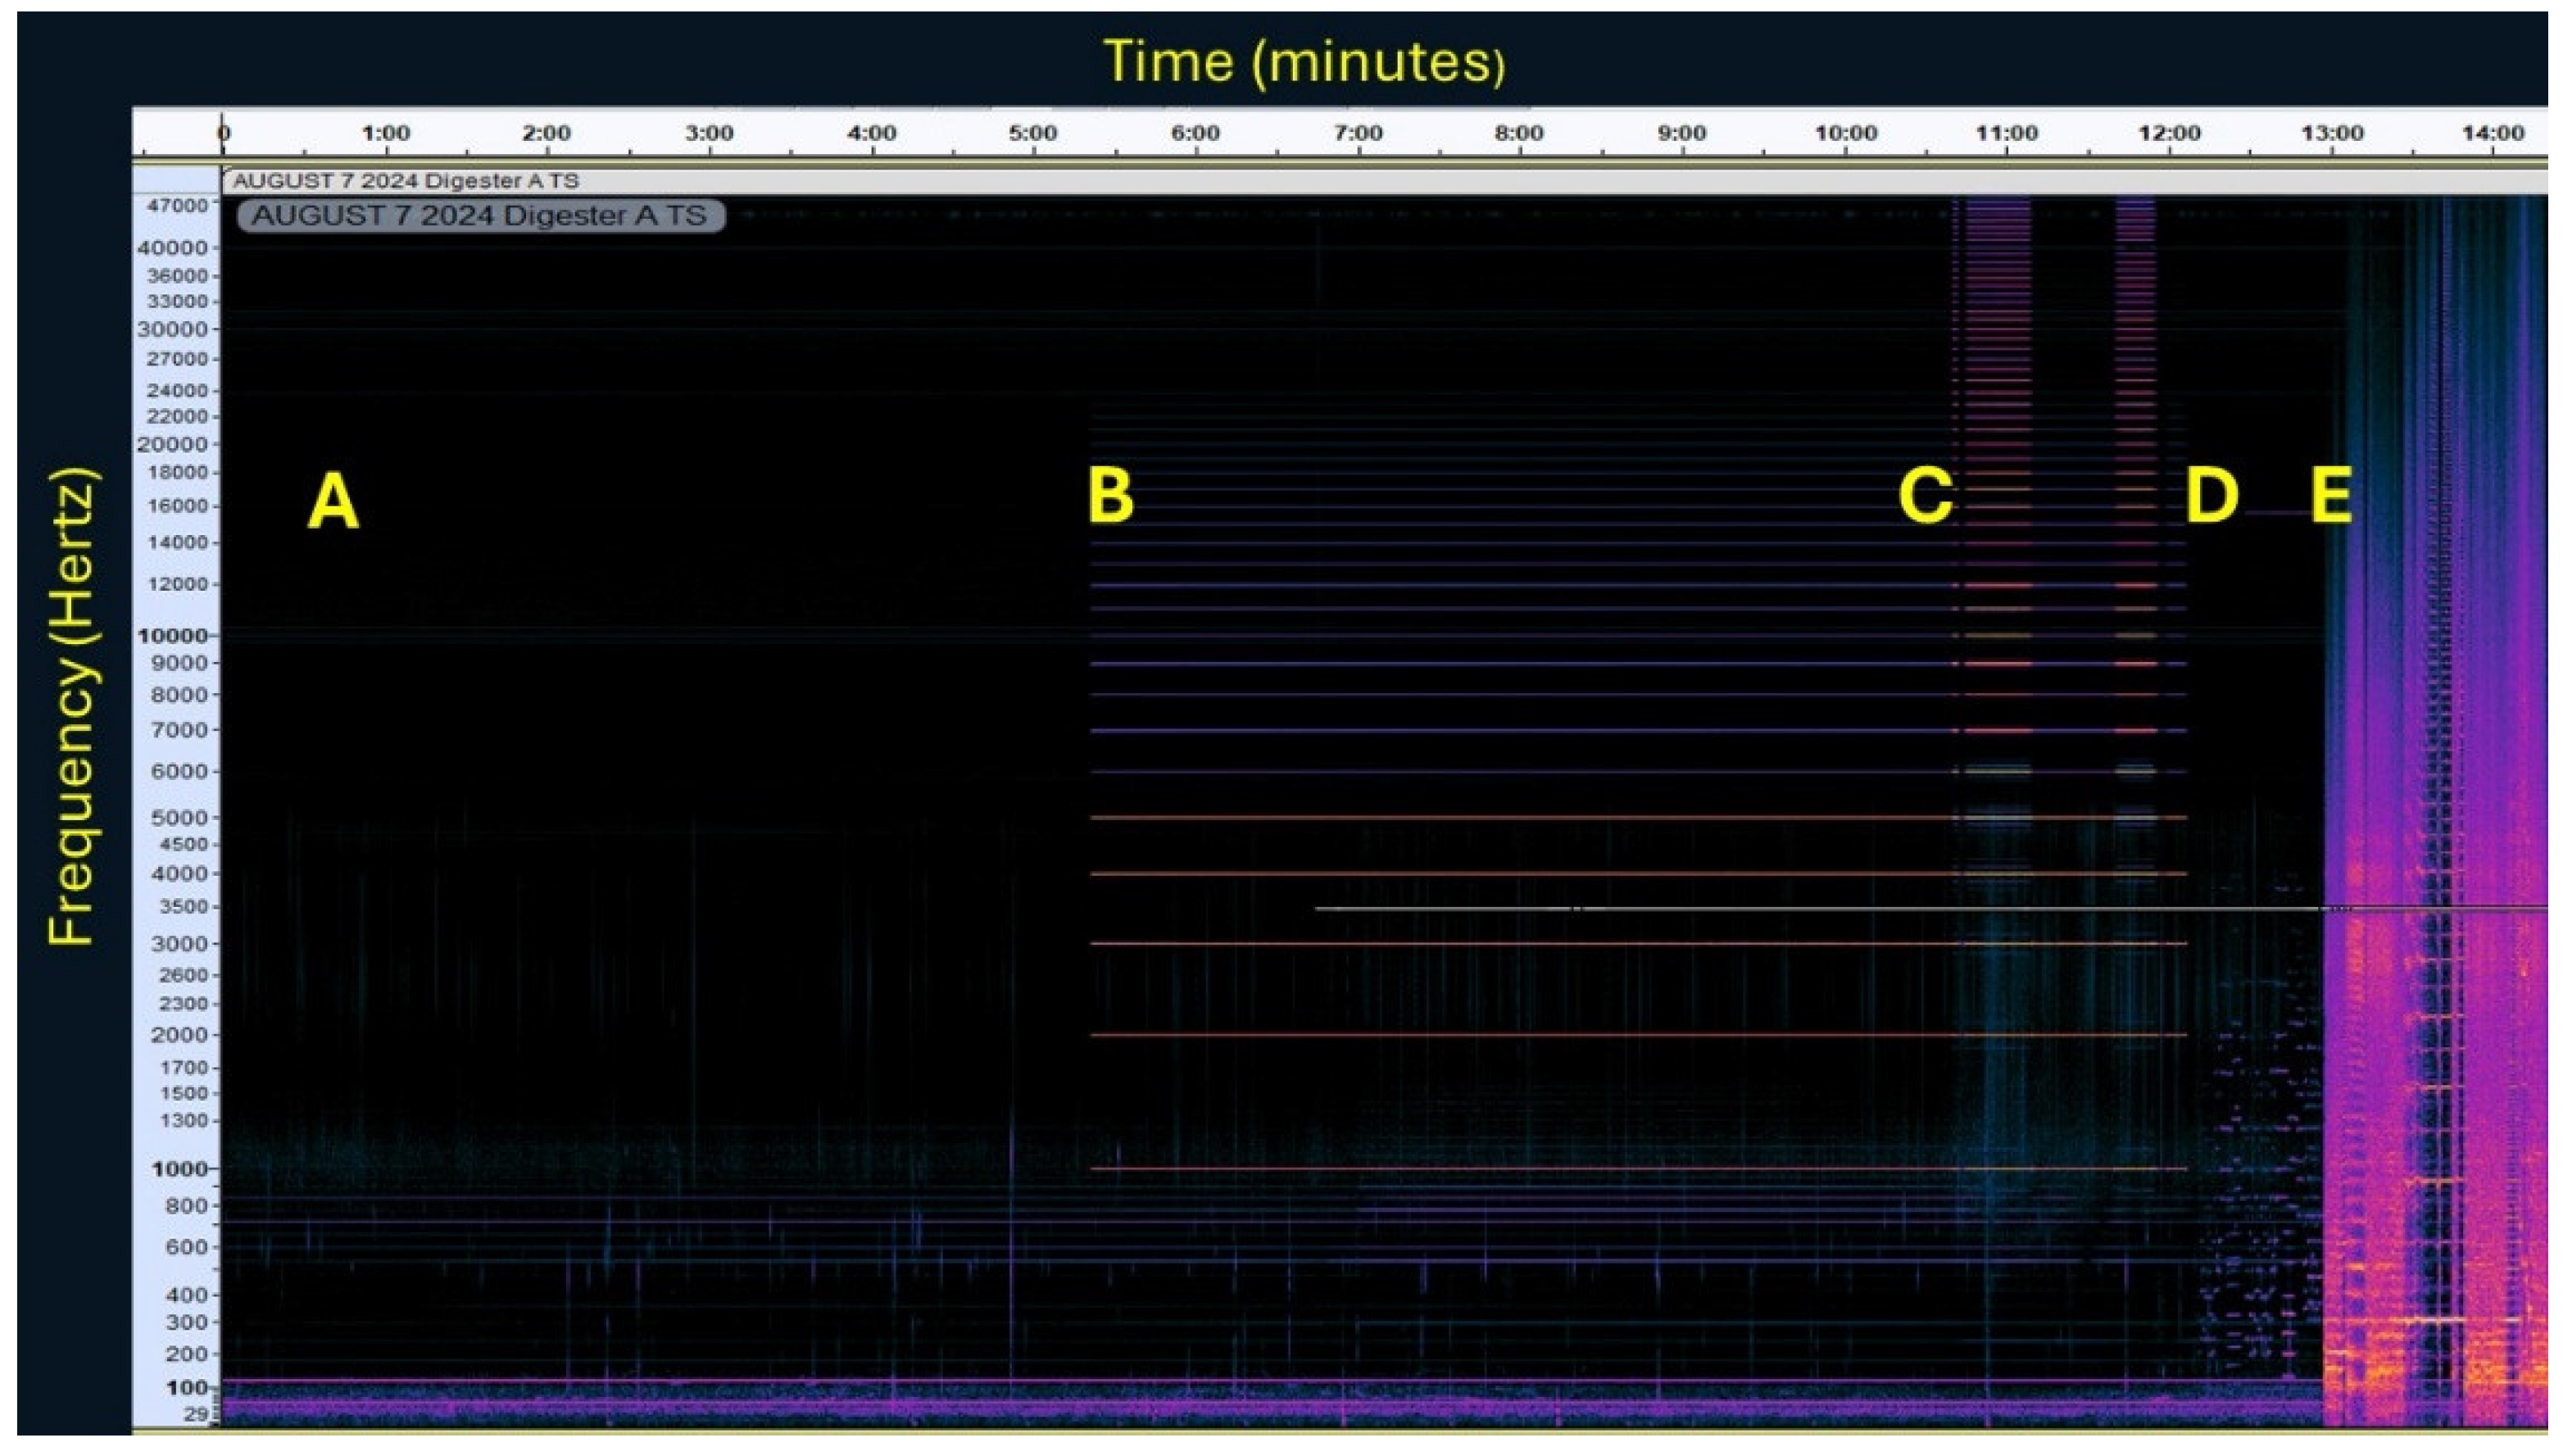

Table 1.
Water characteristics of the four treatment stages of the waste treatment system. a.
| Treatment Stage | ||||
|---|---|---|---|---|
|
Parameter |
Digester |
Effluent Storage Tank |
Aeration Tank |
Wetland |
| Temperature (°C) | 27.1 ± 1.0 b | 29.2 ± 1.9 b | 27.3 ± 1.4 a | 24.6 ± 1.9 c |
| pH | 6.7 ± 0.3 d | 7.2± 0.2 c | 7.9 ± 0.4 a | 7.6 ± 0.2 b |
| Dissolved oxygen (mg L-1) | 1.3 ± 0.5 b | 1.4 ± 0.9 b | 2.5 ± 1.3 a | 1.0 ± 0.7 b |
|
Oxidation-Reduction Potential (mV) |
-271 ± 23.2 b |
-263 ± 20.8 b |
-151 ± 83.1 a |
-158 ± 59.9 a |
| Conductivity (µS cm-1) | 3,390 ± 1,120 a | 2,910 ± 801 ab | 2,520 ± 723 b | 982 ± 384 c |
| Concentration (mg L-1) | ||||
| Ammonium | 148 ± 93.1 a | 161 ± 4.5 a | 103 ± 80.7 b | 16.7 ± 20.7 c |
| Nitrite | 67.8 ± 190 a | 11.3 ± 27.2 a | 10.0 ± 14.4 a | 16.9 ± 19.3 a |
| Nitrate | 2.04 ± 3.08 a | 1.16 ± 1.79 a | 9.33 ± 12.1 a | 0.82 ± 0.48 a |
| Phosphate | 254 ± 228 a | 177 ± 134 ab | 95.7 ± 81.3 bc | 20.2 ± 24.8 c |
| Sulfate | 22.1 ± 23.5 ab | 16.8 ± 12.9 bc | 38.1 ± 17.6 a | 3.60 ± 2.94 c |
| Sodium | 99.0 ± 47.3 ab | 104 ± 39.2 a | 80.4 ± 41.4 b | 40.9 ± 25.4 c |
| Potassium | 316 ± 168 a | 301 ± 133 a | 221 ± 130 b | 89.0 ± 59.9 c |
| Calcium | 106 ± 36.7 a | 89.0 ± 30.0 a | 59.1 ± 27.2 b | 45.8 ± 9.36 b |
| Magnesium | 47.3 ± 18.3 a | 42.9 ± 15.3 ab | 33.9 ± 5.63 ab | 27.4 ± 8.20 b |
a Data represent the mean of eight determinations ± standard deviation of the mean. Within rows, means followed by the same letter are not significantly different by a Duncan’s multiple range test at P = 0.05 using PROC GLM.
Table 2.
Biogas quality produced by anaerobic digester.
| Sampling Period a | ||
|---|---|---|
| Parameter | Before Sound Treatment | During Sound Treatment |
| Carbon dioxide, µg L-1 | 326,000 ± 65,200 | 341,000 ± 74,400 |
| Methane, µg L-1 | 508,000 ± 99,300 | 485,000 ± 97,600 |
| Liters of biogas wk-1 | 5,760 ± 688 | 5,580 ± 1,580 |
a Data represent the mean of three determinations ± standard deviation of the mean.
Table 3.
Concentration of greenhouse gases and ammonium/ammonia in wastewater and atmosphere of four stages of the wastewater treatment system.
Table 3.
Concentration of greenhouse gases and ammonium/ammonia in wastewater and atmosphere of four stages of the wastewater treatment system.
| Wastewater Treatment Stage | ||||
|
Digester |
Effluent Holding Tank |
Aeration Tank |
Wetland |
|
| Aqueous Phase Concentration | ||||
| CO2 (mM) a | 3.16 ± 0.14 | 0.74 ± 0.049 | 0.15 ± 0.02 | 0.11 ± 0.011 |
| CH4 (mM) a | 25.0 ± 2.32 | 26.4 ± 3.69 | 0.81 ± 0.14 | 0.98 ± 0.13 |
| NH4+ (mM) a | 11.0 ± 10.2 | 7.91 ± 2.56 | 6.72 ± 4.86 | 0.58 ± 1.75 |
| N2O (pM) a | 225 ± 35.1 | 213 ± 39.7 | 184 ± 39.1 | 188 ± 33.1 |
| Atmospheric Concentration (ppm) | ||||
| CO2 | 64,400 ± 61,500 | 2,830 ± 1,200 | 911 ± 156 | 2,230 ± 3,890 |
| CH4 | 37,700 ± 34,700 | 716 ± 350 | 45.7 ± 11.0 | 708 ± 3.310 |
| NH3 | 12.8 ± 17.9 | 6.51 ± 4.22 | 9.87 ± 1.33 | 7.58 ± 5.41 |
| N2O | 26.9 ± 17.9 | 16.6 ± 8.22 | 1.26 ± 0.24 | 0.96 ± 0.88 |
aData represent the mean ± standard deviation of the mean of seven triplicate determinations. Number of atmospheric gas analyses = 285, 323, 285, and 567 for the digester, effluent holding tank, aeration tank and wetland respectively.
Table 4.
Dissolved gases and carbonate concentrations in liquid of the inground traps.
| Concentration in Condensate | ||
|---|---|---|
| Before Addition of NaOH a | After Addition of NaOH a | |
| Bicarbonate (mmol L-1) | 1.30 ± 0.56 | 13.8 ± 2.9 |
| Carbonate (mmol L-1) | 2.0 x 10⁻⁴ ± 1.1 x 10⁻⁴ | 1.6 x 10⁻² ± 4.0x 10⁻³ |
| Carbon dioxide (mmol L-1) | 2.37 ± 0.80 | 1.4 ± 0.27 |
| Methane (mmol L-1) | 8.1 ± 3.4 | 14.3 ±7.7 |
| Nitrous oxide (pmol L-1) | 19.1 ± 16.8 | 641 ± 711 |
a Data represent the mean of three determinations ± standard deviation of the mean.
Disclaimer/Publisher’s Note: The statements, opinions and data contained in all publications are solely those of the individual author(s) and contributor(s) and not of MDPI and/or the editor(s). MDPI and/or the editor(s) disclaim responsibility for any injury to people or property resulting from any ideas, methods, instructions or products referred to in the content. |
© 2024 by the authors. Licensee MDPI, Basel, Switzerland. This article is an open access article distributed under the terms and conditions of the Creative Commons Attribution (CC BY) license (http://creativecommons.org/licenses/by/4.0/).
Copyright: This open access article is published under a Creative Commons CC BY 4.0 license, which permit the free download, distribution, and reuse, provided that the author and preprint are cited in any reuse.


