

Submitted:
20 September 2024
Posted:
20 September 2024
You are already at the latest version
Abstract
Background: Gestational trophoblastic neoplasia (GTN) is a rare tumor with an excellent prognosis. This study aimed to refine the FIGO risk score by incorporating immune nutritional factors. Methods: A retrospective analysis was conducted on women diagnosed with GTN between 2005 and 2019 who received chemotherapy (CT). Statistical tests (Wilcoxon, univariate, multivariate analyses) were used to assess associations with response to CT, and Cox regression models were applied to identify factors influencing overall survival (OS). immune nutritional FIGO (in-FIGO) risk score was calculated using significant variables and compared to the original FIGO score using ROC curves. Results: A total of 160 GTN patients were included. There was a positive association between CR and prognostic nutritional index (PNI) (p <0.0001) and neutrophils lymphocyte ratio (NLR) (p <0.001). In multivariate analysis, only PNI had a significant association (p= 0.001). A significant association was found between higher PNI (HR 0.95-IC 0.91-0.99, p= 0.019) and OS. ROC curves of the in-FIGO risk and FIGO risk scores were compared. For CR to chemotherapy, the in-FIGO score had higher sensitivity (71.6 vs. 61.5%), specificity (74.3 vs. 62.9%), and AUC (0.719 vs. 0.633) than the original FIGO score. For OS, the in-FIGO score demonstrated higher sensitivity (92% vs. 72.4%) but lower specificity (45.0% vs. 61.8%) and AUC (0.691 vs. 0.710) compared to the original FIGO score. Conclusions: PNI is a significant predictor of both CR and OS in women with GTN receiving CT. The in-FIGO score demonstrated improved sensitivity and specificity in predicting complete response to CT compared to the original FIGO score.
Keywords:
Gestational trophoblastic neoplasia (GTN)
; Nutritional prognostic index (PNI)
; Neutrophil/lymphocyte ratio (NLR)
; Complete response to chemotherapy (CR)
; Overall survival (OS)
1. Introduction
Gestational trophoblastic neoplasia (GTN) is a rare tumor that includes four entities: invasive malignant mole, choriocarcinoma, placental-site trophoblastic tumor, and epithelioid trophoblastic tumor, the first being the most common (1-4). This disease mainly affects young women and those of reproductive age. It is a complex disease that, in many cases, begins with a high burden of disease and early mortality (5, 6).
In addition to anatomical staging, the International Federation of Gynecology and Obstetrics (FIGO) developed risk scores that determine the risk of disease progression and resistance to a single chemotherapeutic agent. The score is calculated based on clinical, laboratory, and imaging variables (7-10). Furthermore, the score obtained will have implications for the treatment to be followed; for example, a FIGO score <= 6 is considered low risk, and the patient could receive a single chemotherapy agent as treatment (11-13). In the case of high-risk GTN (FIGO score >= 7), treatment with polychemotherapy is necessary since this group of patients tends to develop resistance to a single agent (14, 15). A very high-risk group is also considered with a FIGO score >=13 (8, 16)
Fortunately, the prognosis of this disease is favorable, achieving high complete response rates ranging from 75-100% (17). However, about 25-40% of low-risk patients develop resistance to first-line chemotherapy or relapse, decreasing overall survival (18).This demonstrates the limitations of the FIGO score, highlighting the need for improvements. Despite various initiatives, efforts to enhance it have not yet been successful.
Various studies have described the interaction between the immune system and the systemic inflammatory response with cancer cells. Neutrophils release inflammatory cytokines, leukocyte chemotactic factors, and other phagocytic mediators that can damage cellular DNA, inhibit apoptosis, and promote angiogenesis (19, 20). Albumin levels decrease by increasing levels of proinflammatory cytokines, such as IL-1, IL-6, and tumor necrosis factor, which modulate albumin production. Lymphocytes, such as CD3+ T and NK cells, can also affect growth and metastasis.
This association between nutritional status, immune response, and their interaction in cancer patients has led to the development of indices that have demonstrated predictive value for prognosis, survival, and quality of life in patients undergoing cancer treatment (19). Prognostic Nutritional Index (PNI) represents the nutritional status and immune balance of an individual (19, 20). PNI was initially designed for patients with gastrointestinal cancer (21, 22). However, this index has been shown to predict different outcomes in several other types of cancer (23-25). The neutrophil-lymphocyte ratio (NLR) is another marker of systemic inflammatory responses. NLR has been shown to promote several features of cancer and affect survival (20, 26, 27)
The present study evaluates the association of immuno-nutritional factors such as body mass index (BMI), hemoglobin (Hb), prognostic nutritional index (PNI), and neutrophil/lymphocyte ratio (NLR) with response to chemotherapy and overall survival. Based on the results, an effort was made to generate a new risk score adjusted for the impact of some of these significantly associated factors, which was compared with the original FIGO score.
2. Matherials and Methods
2.1. Study Design and Population
This was observational of a correlational type. The study population comprised 160 patients diagnosed with GTN who received chemotherapy at the INEN from 2005 to 2019. Other inclusion criteria were patients over 18 years of age, initiation of chemotherapy between 2005 and 2019, control of the human chorionic gonadotropin (hCG) at the end of treatment, and at least one imaging study. Patients with non-malignant hydatidiform mole or incomplete treatment or follow-up were excluded.
2.2. Data Collection
The data was obtained from a manual review of patient records. A coded data collection form was used to gather information. Data entry was done transversally and then exported to the statistical program for analysis. The data was recorded in a database, along with demographic data, weight, height, histology, tumor stage, and FIGO risk score.
2.3. Immune Nutritional Factors and Response Assessment
Data were obtained from the clinical history record at the onset of the disease before starting treatment. Immune nutritional factors included body mass index (BMI), hemoglobin (Hb), nutritional prognostic index (PNI), and neutrophil-lymphocyte ratio (NLR).
BMI: It is calculated by dividing weight, always expressed in kg, by height, and always squared in meters.
PNI: was calculated using this formula [10x albumin (g/dl)] + [0.005x total lymphocyte count (μl)].
NLR: Widely used as a marker of inflammatory status, it was calculated at the beginning of the study for each subject. It was defined as the absolute neutrophil count (μl) divided by the absolute lymphocyte count (μl).
Response to chemotherapy (rCT): It was divided into complete response (CR) and poor response. CR was defined as three consecutive negative results for the tumor marker hCG and the disappearance of target lesions on tomography. Poor response was described as a patient continuing with elevated or plateauing hCG levels, persistent lesions on CT scans, or death during treatment.
Overall survival (OS): It was described as the time from the start of chemotherapy to death. Patients who did not complete treatment or did not have adequate follow-up were excluded.
2.4. Statistical Analysis
In the descriptive analysis, the variables were presented through absolute and relative frequencies (qualitative variables) or the main summary measures (quantitative variables), such as mean, standard deviation, median, minimum value, and maximum value.
Normality tests were performed using histograms, Shapiro-Wilk test, and Kolmogorov-Smirnov test for the variables of interest (age, BMI, Hb, PNI, NLR, and FIGO score). For statistical analysis, the Student's T-test was used to compare quantitative variables with a normal distribution, and the non-parametric Wilcoxon test was used for variables with a non-normal distribution. The qualitative variables were evaluated using Pearson's chi-square test with Yates' correction or Fisher's exact test when they were indicated. To evaluate the association between two continuous variables, the Pearson correlation coefficient (r) was used. Results with a probability of type I error less than or equal to 5% (p<0.05) were considered statistically significant.
To assess the association between nutritional factors and response to chemotherapy, univariate analyses, and multivariate logistic regression were performed on factors showing significant associations. Kaplan-Meier curves were used for survival analysis, and Cox regression models estimated the relative risk (HR—Hazard Ratio) of continuous variables with a 95% confidence interval (95% CI). A significance level of 5% was adopted.
For variables that demonstrated an association, receiver operating characteristic (ROC) curves were analyzed to determine the cutoff value for variables significantly predicted CR and OS. Analyzes were performed using R software, version 4.3.1. P<0.05 was considered significant.
2.5. Generation of New Score
Variables that impacted the response to CT and OS were selected to generate the new risk score. A new adjusted FIGO risk score was proposed, which was called immune nutritional FIGO (in-FIGO) and will be calculated using the following formula:

The median normalized the data, and the in-FIGO scores were obtained.
Two cutoff points were determined and compared to define the low and high-risk categories: one based on the median and the other using the ROC curve. Finally, ROC curves were generated for the FIGO score, the in-FIGO score with median cutoff point (in-FIGOm), and the in-FIGO with ROC cutoff point (in-FIGOr). In relation to rCT and overall survival (OS). Sensitivity, specificity, and area under the curve (AUC) were obtained for each test. The distribution for OS was carried out using the Kaplan-Meier curve with the modified FIGO score.
3. Results
3.1. Descriptive Analysis
170 women were evaluated, 4 patients did not receive chemotherapy, and 6 were previously treated and excluded. 160 patients were included in this cohort. The age, weight, height, histology, tumor stage, and FIGO risk score of the patients are listed in Table 1. The median age at presentation was 30 years (interquartile range, 23 to 40 years). The predominant histological diagnosis was choriocarcinoma, observed in 89.7% of patients (n= 87); however, it could not be determined in 63 patients. The majority of women had stage III tumor disease (48.8%). The median FIGO risk score was 10 points (interquartile range 7-14). Consequently, 17.5% and 82.5% of patients belong to the low- and high-risk groups, respectively. Furthermore, 33.8% of patients belong to the very high-risk subgroup, with a FIGO score greater than or equal to 13 points.
The mean weight and height were 55 (34-83 kilograms) and 1.52 (1.32-1.75 meters). For immune nutritional factors, the BMI median was 23.3, hemoglobin was 10.0, PNI was 36.0, and NLR was 2.7.
Regarding response to treatment, 16 patients were lost to follow-up. A CR was reported in 75.7% (109/160) of patients after first-line chemotherapy, while 24.3% (35/160) of patients had a poor response to treatment. 29 deaths were recorded in the follow-up period (Table 1).
3.2. Comparative Analysis
In the group that achieved a CR to chemotherapy, the median BMI was 23.5 (range 21.8-26.11), hemoglobin was 10.3 (range 8.6-11.6), PNI was 37.9 (range 31.0-42.0), and the NLR was 2.4 (range 1.6-4.2). On the other hand, in the poor response group, the median BMI was 22.9 (range 19.7-26.7), hemoglobin was 9.1 (range 8.2-11.0), and PNI was 30.0 (range 21.0-39.0) and the NLR 4.6 (range 2.6-7.9) (Table 2).
Comparative analysis was carried out between the group with CR to chemotherapy, and the group with the poor response; the Student's T-test was used for the BMI and Hb variables, which showed no significant difference between both groups (p=0.56 and p =0.9, respectively). For the PNI, NLR, and FIGO scores, the Wilcoxon test was used, showing a significant difference between both groups for the three variables (p 0.00029, p 0.00038, and p 0.018, respectively) (Figure 1).
In the group of living patients, the median BMI was 23.3 (range 21.4-26.2), hemoglobin was 10.2 (range 8.1-11.5), PNI was 37, 0 (range 31.0-42.0), and the NLR of 2.7 (range 1.7-4.7). In contrast, in the group of deceased patients, the median BMI was 23.2 (range 20.4-25.5), hemoglobin was 9.0 (range 7.5-10.9), and PNI was 28.0 (range 22.3-36.8). and NLR 3.3 (range 2.5-7.4). Furthermore, it should be noted that in the group of deceased patients, 83.3% of the patients were those who had a poor response to treatment (Table 3).
For the comparative analysis of OS, the Student's t test was used for the variables BMI and Hb, which showed no significant difference between both groups (p=0.81 and p=0.61, respectively). For the PNI, NLR and FIGO scores, the Wilcoxon test was used, showing a significant difference between both groups for the three variables (p 0.00012, p 0.039 and p 0.00039, respectively) (Figure 2).
3.3. Correlational Analysis: Logistic Regression, Univariate and Multivariate COX Analysis
To determine the association, univariate analysis was carried out for each of the variables, revealing statistically significant results for the PNI, NLR and FIGO score; However, in the multivariate analysis, only the PNI and FIGO scores showed a significant association with CR to chemotherapy (Table 4).
To determine the association with OS, univariate analysis was performed for each variable, with statistically significant results for PNI, NLR, and FIGO scores; however, in the multivariate analysis, only the PNI and FIGO scores demonstrated a significant association with OS (Table 5).
3.4. Calculation of the New Risk Score: In-FIGO
Based on the results obtained, we found that PNI has a significant association with both responses to chemotherapy and overall survival, such as the FIGO score, which is currently the only risk score and is considered the gold standard.
With these findings, the in-FIGO was calculated using the following formula:

The in-FIGO cutoff point for low and high risk was initially calculated by taking the median as the cutoff point, dividing it into low risk (<0.423) and high risk (>= 0.423)
Likewise, the cutoff point was also calculated according to the in-FIGO receiver operating characteristics (ROC) curve analysis, dividing it into low risk (<0.375) and high risk (>=0.375).
Kaplan-Meier curves were generated for the three risk distributions: FIGO, in-FIGOm, and in-FIGOr, showing a significant difference between the groups in all three classifications. The low- and high-risk groups had p-values of 0.043, 0.0053, and <0.0001, respectively (Figure 3).
Moreover, in the in-FIGOr distribution, the high-risk group had HR of 19.1 (95% CI = 2.60 - 141), which confers a significantly higher likelihood of death compared to the high-risk classifications in the other models (FIGO HR = 6.33, in-FIGOm HR = 2.97).
Therefore, it was decided that the division between low and high-risk groups for the new score, termed in-FIGO, would be based on the cutoff point determined by the ROC curve. The following table (Table 6) shows the distribution according to the in-FIGO score. Notably, 8 patients previously classified as low risk are now classified as high risk, while 40 patients initially classified as high risk are now reclassified as low risk according to the in-FIGO score.
3.5. Comparison of FIGO vs in-FIGO
A ROC curve analysis was conducted to compare the FIGO score and the in-FIGO score regarding the chemotherapy response. The FIGO score yielded a sensitivity of 61.5%, a specificity of 62.9%, and an AUC of 0.633. In contrast, the in-FIGO score demonstrated improved performance with a sensitivity of 71.6%, a specificity of 74.3%, and an AUC of 0.719 (Figure 4).
Finally, a ROC curve analysis was conducted to compare the FIGO score and the in-FIGO score in relation to survival. The FIGO score had a sensitivity of 72.4%, a specificity of 61.8%, and an AUC of 0.710. In comparison, the in-FIGO score achieved a higher sensitivity of 96.6% but a lower specificity of 45.0% and an AUC of 0.691 (Figure 5).
4. Discussion
GNT is a complex and potentially curable disease that occurs in young women of reproductive age, most frequently in Asian and American countries (28). Despite the good prognosis of this disease, about 25-40% of low-risk patients develop resistance to first-line chemotherapy or relapse, decreasing OS (28). This underscores the limitations of the FIGO score and the ongoing efforts to enhance it (29). Some initiatives have introduced new variables, including incorporating new variables like the uterine artery pulsatility index (30), serum peptide profile (31) adjusting cutoff points for hCG, and developing novel non-linear models (32). However, none of these modifications have achieved substantial success.
Additionally, the limited number of studies describing the clinical behavior of this disease means that other factors influencing survival remain largely unknown (19, 20). It has been described that the OS decreased to 27% in patients with liver metastases, 70% in those with brain metastases, and only 10% when metastases occurred in both locations (8). Among the studies reported, most of the population belongs to low-risk diseases (33). A Latin American series conducted in Brazil included 2,186 patients with GTN, 89.7% (n=1,875) low risk and 10.4% (n=217) high risk. In the low-risk group, the risk of death increased if they were of the choriocarcinoma type (RR 12.4), presence of metastases (RR 12.57), chemoresistance (RR 12.18) and care in a non-specialized center (RR 12,22). For the high-risk group, the factors were time between last pregnancy (RR 4.1), metastatic disease (14.66), in the brain (RR 8.63) and in the liver (RR 5.76) , chemoresistance (RR 3.2) and care in a non-specialized center (RR 28.3) (33, 34). Regarding chemoresistance, factors such as large tumor size, elevated hCG >100,000 IU/l, an interval of less than 4 months since a history of pregnancy, and metastatic disease are described (18, 35). However, all these factors evaluated are included in the FIGO score, so this scale has not changed since 2000.
On the other hand, modifications towards non-linear models have been applied to improve the predictive capacity of the FIGO score. A study carried out in 2022 aimed to generate models based on the different combinations of FIGO variables. Six models were generated with the eight FIGO variables and compared with the traditional FIGO score using true and false positive rates, positive and negative predictive values, diagnostic odds ratios, ROC curves, Bland-Altman calibration plots, curve analysis decision making and contingency tables. The results showed only minor improvements in performance. The M2 model, which combined all variables (both scored and raw data), achieved the most significant benefit, with a 0.04 increase in the area under the curve and the highest accuracy in identifying resistance to primary chemotherapy (36). In addition, simplifications of the FIGO score have been made, considering only the pretreatment hCG values, history of failed chemotherapy, site of metastases and number of metastases, demonstrating only the same effectiveness as the FIGO score(32).
In search of determining other prognostic and predictive factors that may influence the response to treatment and survival, this is the first study that evaluates the prognostic importance of immuno-nutritional factors in patients with GTN. We evaluated correlations between BMI, hemoglobin, PNI, and NLR with response to chemotherapy and OS. We found that high PNI was significantly associated with CR in first-line chemotherapy and better OS. We also determined the cutoff value for PNI using the ROC curve for complete response to chemotherapy and OS. The ROC curve indicated that the optimal cutoff point for response to chemotherapy was 35.005, with a sensitivity of 66.3% and a specificity of 72.7%, while OS showed a cutoff point of 30.005, with a sensitivity of 57.7% and a specificity of 78.8%. It reinforces the importance of nutritional status not only for the immediate response to treatment. When performing the multivariate analysis, it was confirmed that the PNI was an independent factor in predicting the response to chemotherapy and overall survival.
This finding suggests that good nutritional status is crucial for a CR to chemotherapy and long-term survival in GTN patients.
The PNI has demonstrated its predictive effect in other neoplasias, including gynecological ones. A meta-analysis evaluated the prognostic value of PNI in patients with gynecological cancer. PNI was closely correlated with OS and PFS for gynecologic cancer; the pooled HRs were respectively 2.66 (95% CI: 1.56-4.55) and 2.43 (95% CI: 2.07-2.86) in univariate analysis (UVA) and 1. 88 (95% CI: 1.10-3.20) and 1.92 (95% CI: 1.52-2.44) in multivariate analysis (MVA)(30.43). Other studies on cervical cancer have also demonstrated its value as a predictor of survival in patients with recurrent disease (26).
The results of the new in-FIGO score redistributed patients into low- and high-risk groups, taking the value found in the ROC curve as the cutoff point. This distribution finds significant differences in the anatomical clinical stage (p<0.001), Hb (p<0.001), NLR (p<0.001), PNI (p<0.001), response to chemotherapy (p=0.006), and survival (p<0.001). In addition, the CR rate in the low-risk group of patients, according to in-FIGO, was higher than the response rate of the low-risk group according to FIGO (89.5% vs 83.3%), while in the case of high-risk patients, this was lower for in-FIGO (66.6% vs 74%). When analyzing the Kaplan Meier curves, we observed that the high-risk group had worse survival than the original FIGO division, according to in-FIGO. This is also reflected in the percentage of survivors at 1 and 5 years according to FIGO (1y-OS: Low-risk 96.4% and high-risk 86.4%; 5y-OS: Low-risk 96.4% and high-risk 80.8%) and in-FIGO (1y-OS: Low-risk 96.3% and high-risk 80.0%; 5y-OS: Low-risk 90.8% and high-risk 76.3%). The reclassification of patients into low or high-risk categories has clinical and prognostic implications and potential therapeutic consequences.
As a final analysis, comparative ROC curves were performed between FIGO and in-FIGO, evaluating both rCT and OS. We found that, for the response to chemotherapy, the in-FIGO score presented a higher AUC, greater sensitivity, and specificity than the original FIGO score, which means that it has a greater discriminative capacity and would be a better predictor. However, when performing the comparative analysis of the ROC curve for OS, in-FIGO presented a lower AUC, higher sensitivity, and lower specificity. While incorporating nutritional factors into the FIGO score appears to improve its accuracy in predicting chemotherapy response, further research is needed to optimize its effectiveness in predicting overall survival.
Finally, this finding significantly contributes to the effort to enhance the FIGO score. Moreover, since this disease is more common in low-resource and developing countries, any new variables included in the score should ideally be easily accessible and low-cost to ensure broad applicability.
5. Conclusions
PNI is a useful, inexpensive, and accessible method to predict CR to chemotherapy and OS. The in-FIGO demonstrated to have a better discriminative value than the traditional FIGO in relation to the response to chemotherapy, which can help identify a population at particular risk who may need closer follow-up or early intervention, thus improving the quality of treatment, first-line remission rates and long-term outcomes.
in-FIGO gave us promising results in our series and has the potential to improve the clinical management of patients with GTN significantly; however, they should be applied to other case series or prospectively to validate them. We recognize that our study has some limitations due to the low incidence of this disease, the long study period, and the fact that the information in the medical records was sometimes incomplete. Ten percent of patients had adequate follow-up during treatment, so they had to be excluded from the analysis. Currently, we are in the process of collecting new prospective data that allows us to validate the score.
References
- Seckl, M.J.; Sebire, N.J.; Fisher, R.A.; Golfier, F.; Massuger, L.; Sessa, C. Gestational trophoblastic disease: ESMO Clinical Practice Guidelines for diagnosis, treatment and follow-up. Ann Oncol. 2013;24 Suppl 6:vi39-50.
- Lurain, J.R. Gestational trophoblastic disease II: classification and management of gestational trophoblastic neoplasia. Am. J. Obstet. Gynecol. 2011, 204, 11–18. [Google Scholar] [CrossRef] [PubMed]
- Lurain, J.R. Gestational trophoblastic disease I: epidemiology, pathology, clinical presentation and diagnosis of gestational trophoblastic disease, and management of hydatidiform mole. Am. J. Obstet. Gynecol. 2010, 203, 531–539. [Google Scholar] [CrossRef] [PubMed]
- Seckl, M.J.; Sebire, N.J.; Berkowitz, R.S. Gestational trophoblastic disease. Lancet. 2010, 376, 717–729. [Google Scholar] [CrossRef] [PubMed]
- Costanzo, V.; Bardelli, A.; Siena, S.; Abrignani, S. Exploring the links between cancer and placenta development. Open Biol. 2018, 8. [Google Scholar] [CrossRef] [PubMed]
- Brown J, Naumann RW, Seckl MJ, Schink, J. 15years of progress in gestational trophoblastic disease: Scoring, standardization, and salvage. Gynecol. Oncol. 2017, 144, 200–207. [Google Scholar] [CrossRef]
- Abu-Rustum NR, Yashar CM, Bean S, Bradley K, Campos SM, Chon HS, et al. Gestational Trophoblastic Neoplasia, Version 2.2019, NCCN Clinical Practice Guidelines in Oncology. J. Natl. Compr. Canc Netw. 2019, 17, 1374–1391. [Google Scholar] [CrossRef]
- Ngan, H.Y.S.; Seckl, M.J.; Berkowitz, R.S.; Xiang, Y.; Golfier, F.; Sekharan, P.K. , et al. Diagnosis and management of gestational trophoblastic disease: 2021 update. Int. J. Gynaecol. Obstet. 2021; 155, 86–93. [Google Scholar]
- FIGO staging for gestational trophoblastic neoplasia 2000. FIGO Oncology Committee. Int J Gynaecol Obstet. 2002, 77, 285–287. [Google Scholar] [CrossRef]
- Elias, K.M.; Berkowitz, R.S.; Horowitz, N.S. State-of-the-Art Workup and Initial Management of Newly Diagnosed Molar Pregnancy and Postmolar Gestational Trophoblastic Neoplasia. J. Natl. Compr. Canc Netw. 2019, 17, 1396–1401. [Google Scholar] [CrossRef]
- Lawrie, T.A.; Alazzam, M.; Tidy, J.; Hancock, B.W.; Osborne, R. First-line chemotherapy in low-risk gestational trophoblastic neoplasia. Cochrane Database Syst. Rev. 2016, 2016, CD007102. [Google Scholar] [CrossRef]
- Maesta I, Nitecki R, Horowitz NS, Goldstein DP, de Freitas Segalla Moreira M, Elias KM, et al. Effectiveness and toxicity of first-line methotrexate chemotherapy in low-risk postmolar gestational trophoblastic neoplasia: The New England Trophoblastic Disease Center experience. Gynecol. Oncol. 2018, 148, 161–167. [Google Scholar] [CrossRef]
- Petrilli, E.S.; Twiggs, L.B.; Blessing, J.A.; Teng, N.H.; Curry, S. Single-dose actinomycin-D treatment for nonmetastatic gestational trophoblastic disease. A prospective phase II trial of the Gynecologic Oncology Group. Cancer. 1987, 60, 2173–2176. [Google Scholar] [CrossRef] [PubMed]
- Lurain, J.R.; Singh, D.K.; Schink, J.C. Primary treatment of metastatic high-risk gestational trophoblastic neoplasia with EMA-CO chemotherapy. J. Reprod. Med. 2006, 51, 767–772. [Google Scholar]
- Deng, L.; Zhang, J.; Wu, T.; Lawrie, T.A. Combination chemotherapy for primary treatment of high-risk gestational trophoblastic tumour. Cochrane Database Syst. Rev. 2013, 2013, Cd005196. [Google Scholar] [CrossRef] [PubMed]
- Kong Y, Yang J, Jiang F, Zhao J, Ren T, Li J, et al. Clinical characteristics and prognosis of ultra high-risk gestational trophoblastic neoplasia patients: A retrospective cohort study. Gynecol. Oncol. 2017, 146, 81–86. [Google Scholar] [CrossRef] [PubMed]
- Matsui, H.; Iitsuka, Y.; Seki, K.; Sekiya, S. Comparison of chemotherapies with methotrexate, VP-16 and actinomycin-D in low-risk gestational trophoblastic disease. Remission rates and drug toxicities. Gynecol. Obstet. Invest. 1998, 46, 5–8. [Google Scholar] [CrossRef]
- Singhal, S.; Kumar, L.; Kumar, S.; Khurana, S.; Bhatla, N. Predictors of chemotherapy resistance & relapse in gestational trophoblastic neoplasia. Indian. J. Med. Res. 2020, 152, 595–606. [Google Scholar]
- Sun, K.; Chen, S.; Xu, J.; Li, G.; He, Y. The prognostic significance of the prognostic nutritional index in cancer: a systematic review and meta-analysis. J Cancer Res Clin Oncol. 2014, 140, 1537–1549. [Google Scholar] [CrossRef]
- Templeton AJ, McNamara MG, Šeruga B, Vera-Badillo FE, Aneja P, Ocaña A, et al. Prognostic role of neutrophil-to-lymphocyte ratio in solid tumors: a systematic review and meta-analysis. J. Natl. Cancer Inst. 2014, 106, dju124. [Google Scholar]
- Maejima, K.; Taniai, N.; Yoshida, H. The Prognostic Nutritional Index as a Predictor of Gastric Cancer Progression and Recurrence. J. Nippon. Med. Sch. 2022, 89, 487–493. [Google Scholar] [CrossRef]
- Okadome K, Baba Y, Yagi T, Kiyozumi Y, Ishimoto T, Iwatsuki M, et al. Prognostic Nutritional Index, Tumor-infiltrating Lymphocytes, and Prognosis in Patients with Esophageal Cancer. Ann. Surg. 2020, 271, 693–700. [Google Scholar] [CrossRef]
- Fujiwara, D.; Tsubaki, M.; Takeda, T.; Miura, M.; Nishida, S.; Sakaguchi, K. Objective evaluation of nutritional status using the prognostic nutritional index during and after chemoradiotherapy in Japanese patients with head and neck cancer: a retrospective study. Eur. J. Hosp. Pharm. 2021, 28, 266–270. [Google Scholar] [CrossRef] [PubMed]
- Tumas, J.; Tumiene, B.; Jurkeviciene, J.; Jasiunas, E.; Sileikis, A. Nutritional and immune impairments and their effects on outcomes in early pancreatic cancer patients undergoing pancreatoduodenectomy. Clin. Nutr. 2020, 39, 3385–3394. [Google Scholar] [CrossRef] [PubMed]
- Mirili, C.; Yılmaz, A.; Demirkan, S.; Bilici, M.; Basol Tekin, S. Clinical significance of prognostic nutritional index (PNI) in malignant melanoma. Int. J. Clin. Oncol. 2019, 24, 1301–1310. [Google Scholar] [CrossRef]
- Ida, N.; Nakamura, K.; Saijo, M.; Kusumoto, T.; Masuyama, H. Prognostic nutritional index as a predictor of survival in patients with recurrent cervical cancer. Mol. Clin. Oncol. 2018, 8, 257–263. [Google Scholar] [CrossRef] [PubMed]
- Cupp, M.A.; Cariolou, M.; Tzoulaki, I.; Aune, D.; Evangelou, E.; Berlanga-Taylor, A.J. Neutrophil to lymphocyte ratio and cancer prognosis: an umbrella review of systematic reviews and meta-analyses of observational studies. BMC Med. 2020, 18, 360. [Google Scholar] [CrossRef] [PubMed]
- Braga A, Uberti EM, Fajardo Mdo C, Viggiano M, Sun SY, Grillo BM, et al. Epidemiological report on the treatment of patients with gestational trophoblastic disease in 10 Brazilian referral centers: results after 12 years since International FIGO 2000 Consensus. J Reprod Med.
- Parker, V.L.; Pacey, A.A.; Palmer, J.E.; Tidy, J.A.; Winter, M.C.; Hancock, B.W. Classification systems in Gestational trophoblastic neoplasia - Sentiment or evidenced based? Cancer Treat Rev. 2017, 56, 47–57. [Google Scholar] [CrossRef]
- Agarwal R, Harding V, Short D, Fisher RA, Sebire NJ, Harvey R, et al. Uterine artery pulsatility index: a predictor of methotrexate resistance in gestational trophoblastic neoplasia. Br. J. Cancer. 2012, 106, 1089–1094. [Google Scholar] [CrossRef]
- Wang F, Wang ZR, Ding XS, Yang H, Guo Y, Su H, et al. Combining serum peptide signatures with International Federation of Gynecology and Obstetrics (FIGO) risk score to predict the outcomes of patients with gestational trophoblastic neoplasia (GTN) after first-line chemotherapy. Front. Oncol. 9828.
- Parker VL, Winter MC, Tidy JA, Palmer JE, Sarwar N, Singh K, et al. PREDICT-GTN 2: Two-factor streamlined models match FIGO performance in gestational trophoblastic neoplasia. Gynecol. Oncol. 2024, 180, 152–159. [Google Scholar] [CrossRef]
- Clark, R.M.; Nevadunsky, N.S.; Ghosh, S.; Goldstein, D.P.; Berkowitz, R.S. The evolving role of hysterectomy in gestational trophoblastic neoplasia at the New England Trophoblastic Disease Center. J. Reprod. Med. 2010, 55, 194–8. [Google Scholar]
- Freitas F, Braga A, Viggiano M, Velarde LGC, Maesta I, Uberti E, et al. Gestational trophoblastic neoplasia lethality among Brazilian women: A retrospective national cohort study. Gynecol. Oncol. 2020, 158, 452–459. [Google Scholar] [CrossRef]
- Ghorani E, Kaur B, Fisher RA, Short D, Joneborg U, Carlson JW, et al. Pembrolizumab is effective for drug-resistant gestational trophoblastic neoplasia. Lancet. 2017, 390, 2343–2345. [Google Scholar] [CrossRef] [PubMed]
- Parker VL, Winter MC, Tidy JA, Hancock BW, Palmer JE, Sarwar N, et al. PREDICT-GTN 1: Can we improve the FIGO scoring system in gestational trophoblastic neoplasia? Int J Cancer. 2023, 152, 986–997.
Figure 1.
Comparative analysis of immune nutritional factors according to rCT.(A) Age, (B) BMI, (C) Hb, (D) PNI, (E) NLR, (F) FIGO score.
Figure 1.
Comparative analysis of immune nutritional factors according to rCT.(A) Age, (B) BMI, (C) Hb, (D) PNI, (E) NLR, (F) FIGO score.
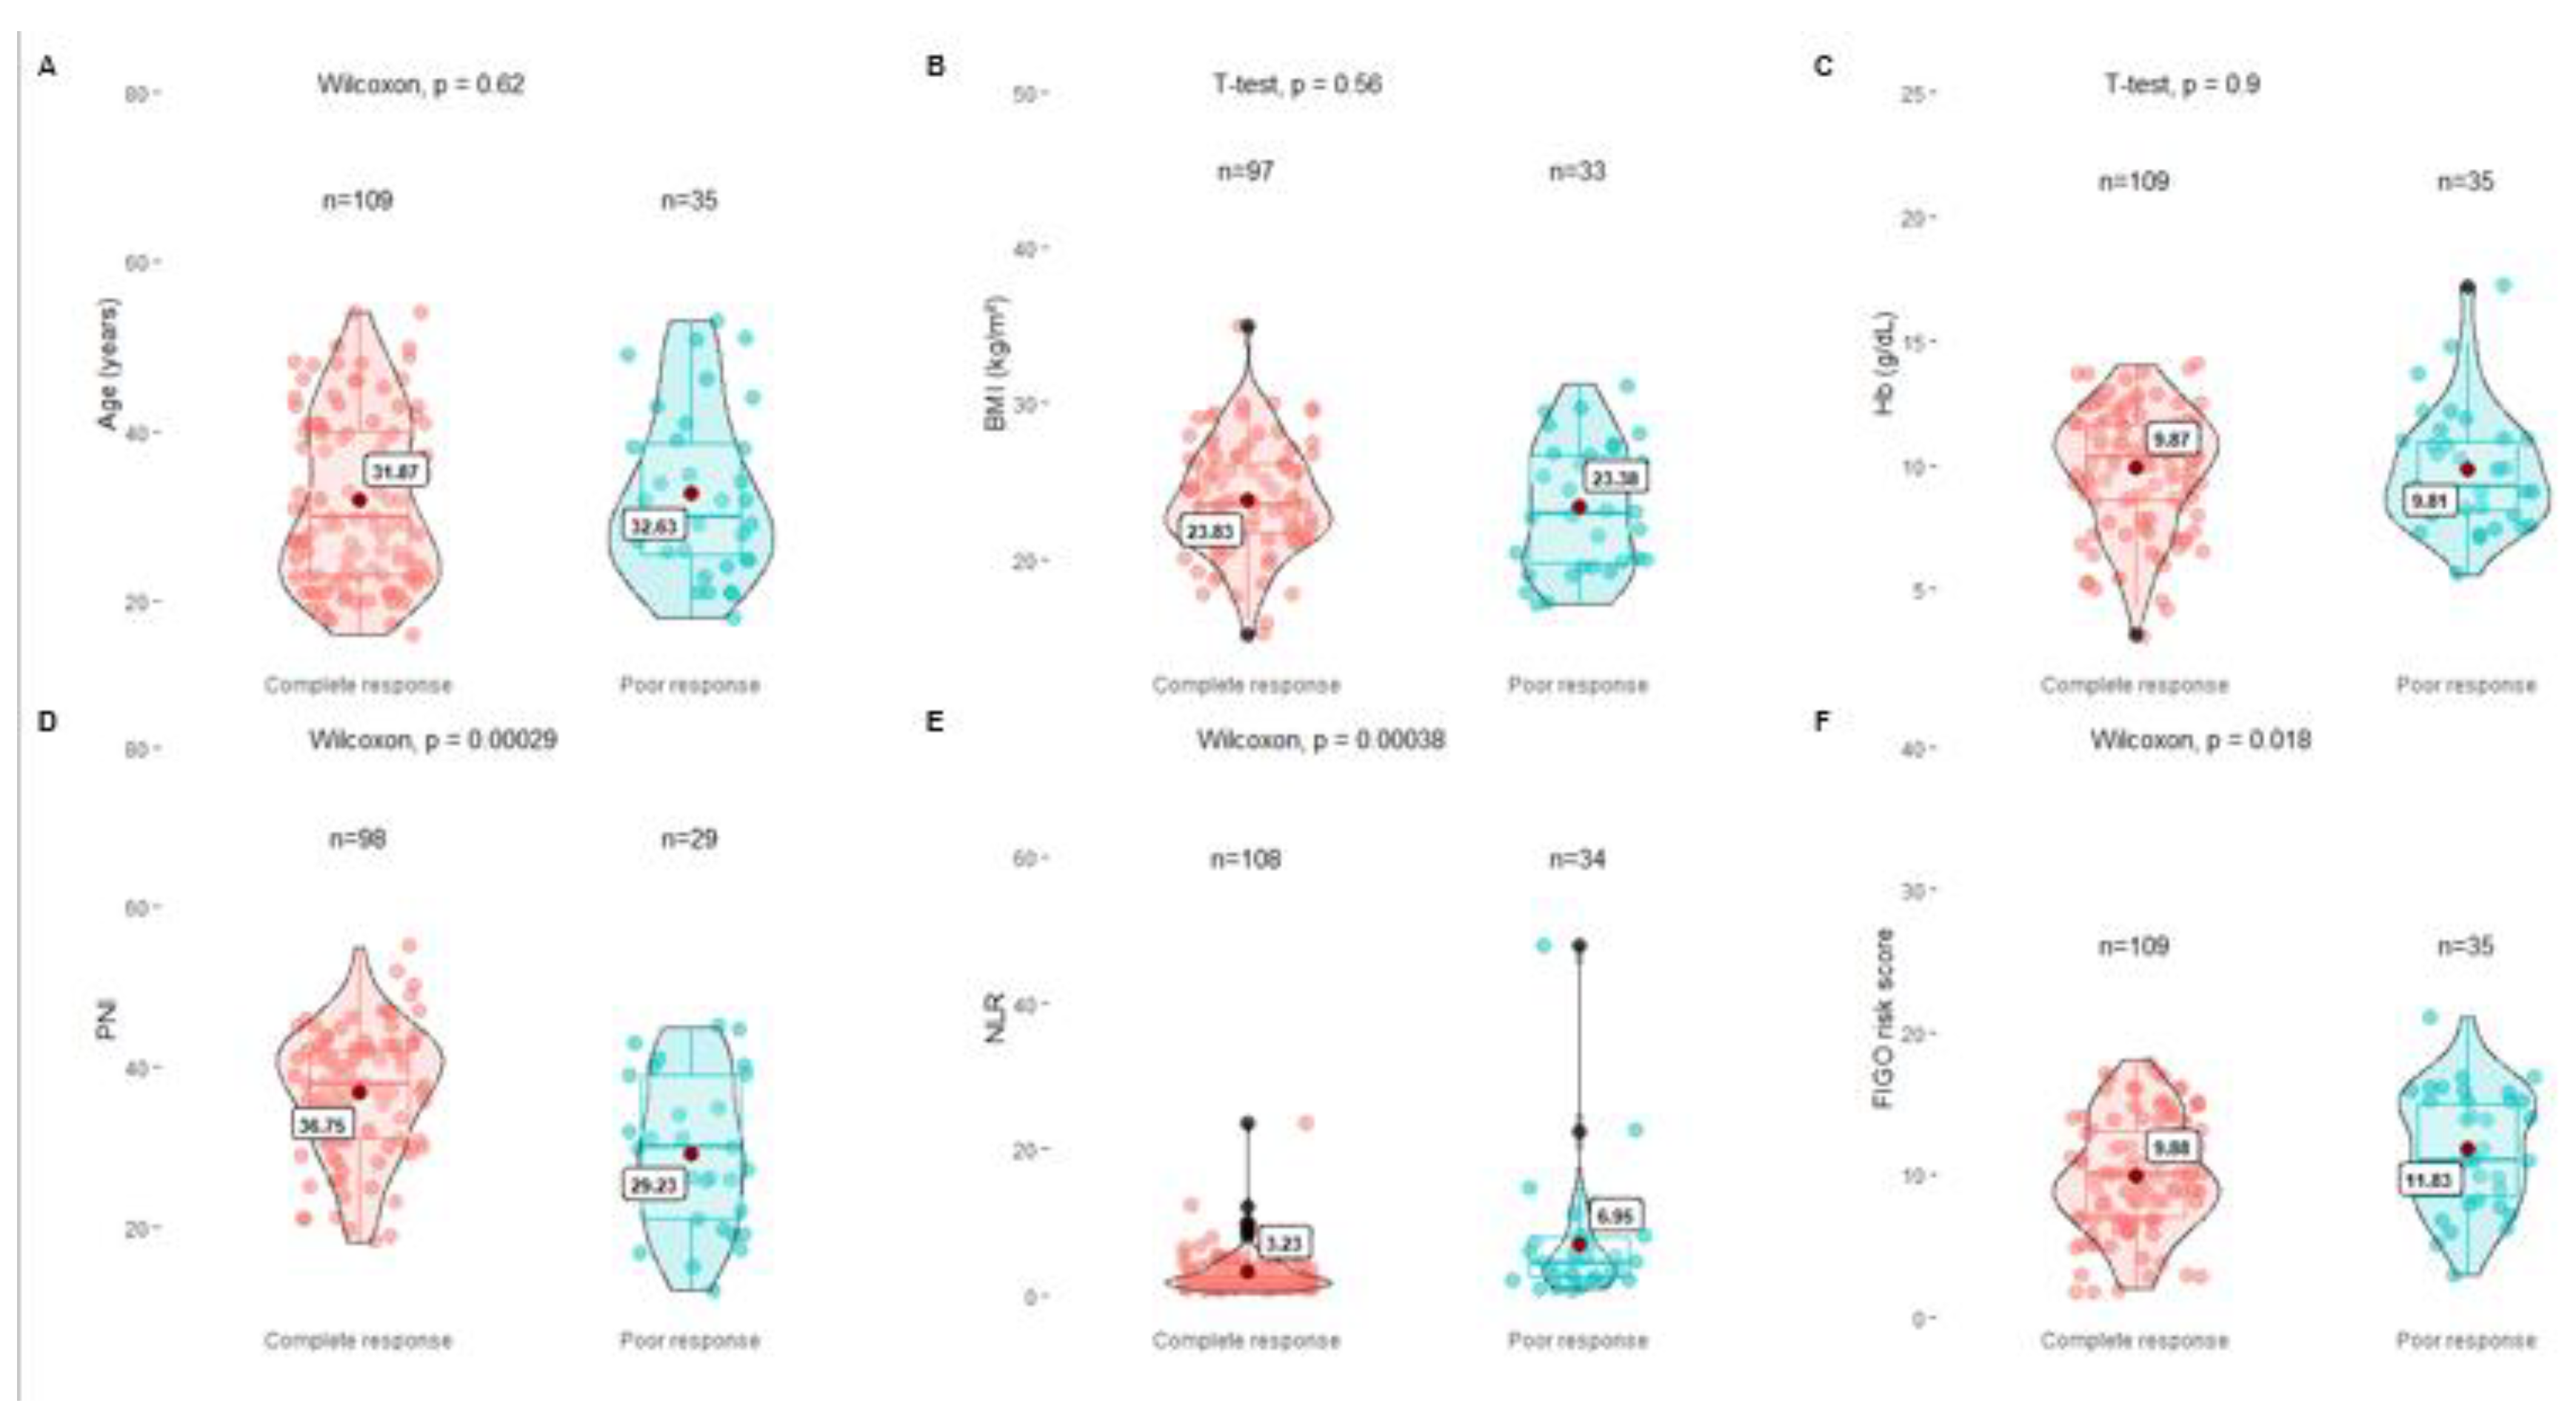
Figure 2.
Comparative analysis of immune nutritional factors and FIGO according to survival. (A) Age, (B) BMI, (C) Hb, (D) PNI, (E) NLR, (F) FIGO score.
Figure 2.
Comparative analysis of immune nutritional factors and FIGO according to survival. (A) Age, (B) BMI, (C) Hb, (D) PNI, (E) NLR, (F) FIGO score.
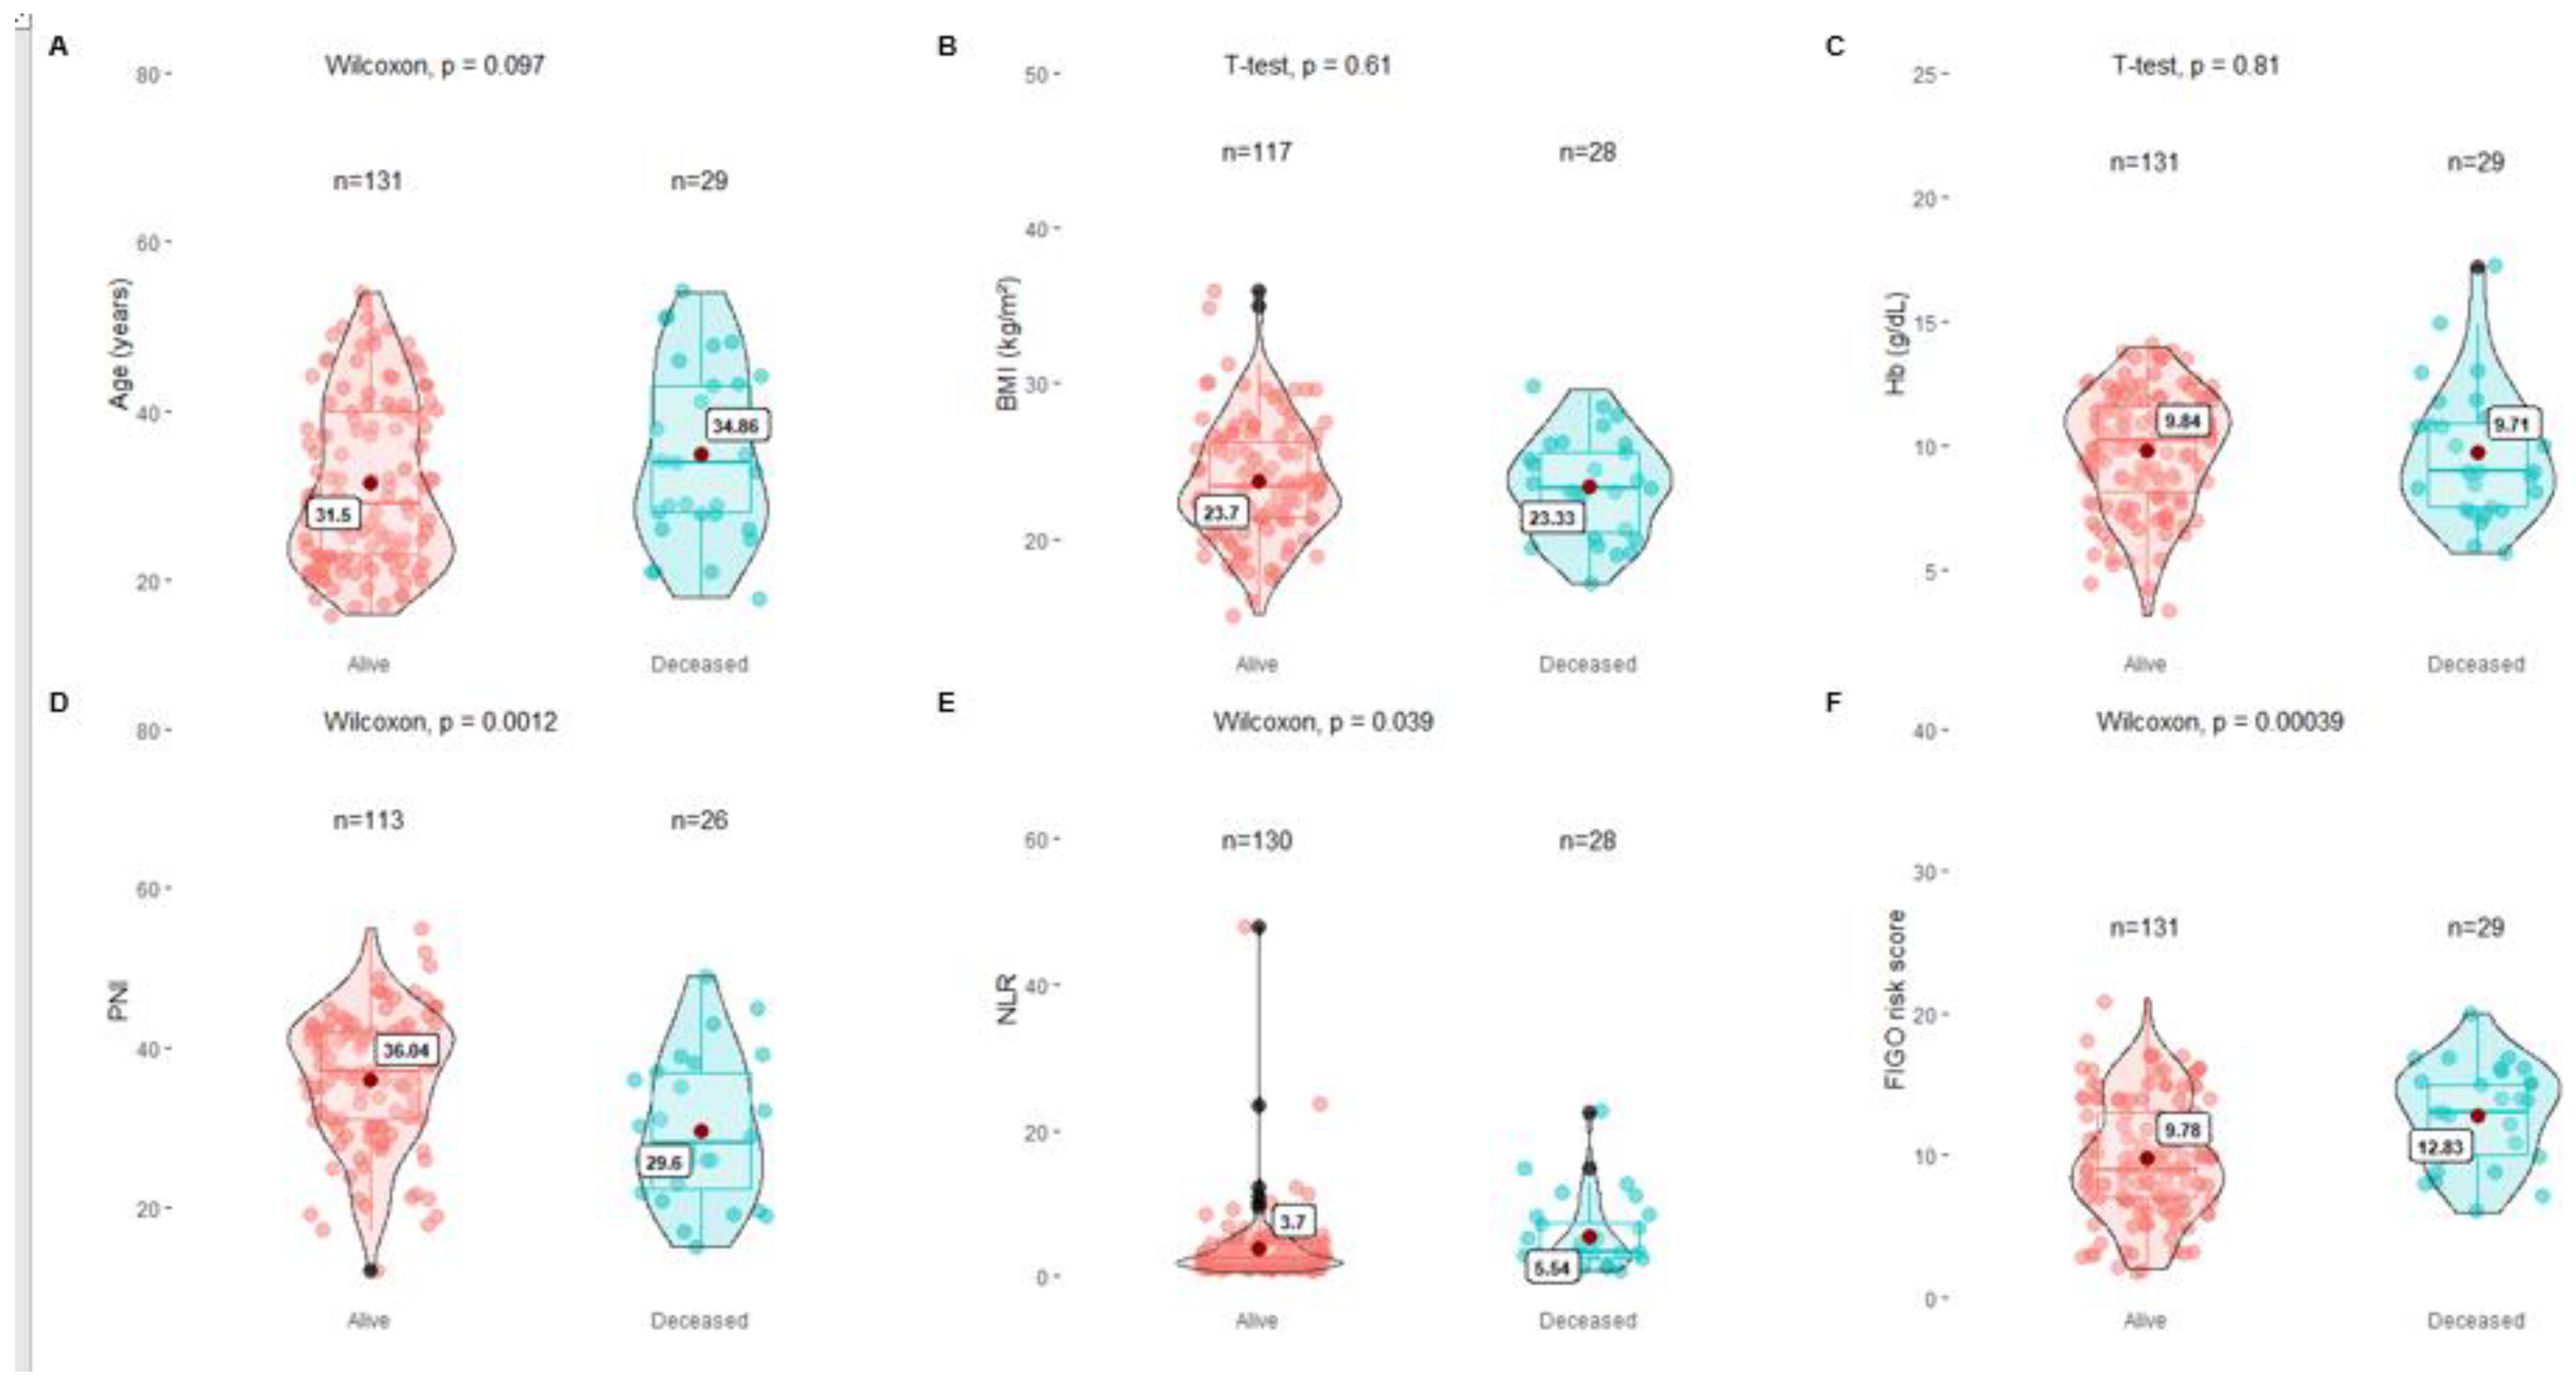
Figure 3.
Kaplan Meier curve according to FIGO, in-FIGOm and in-FIGOr.
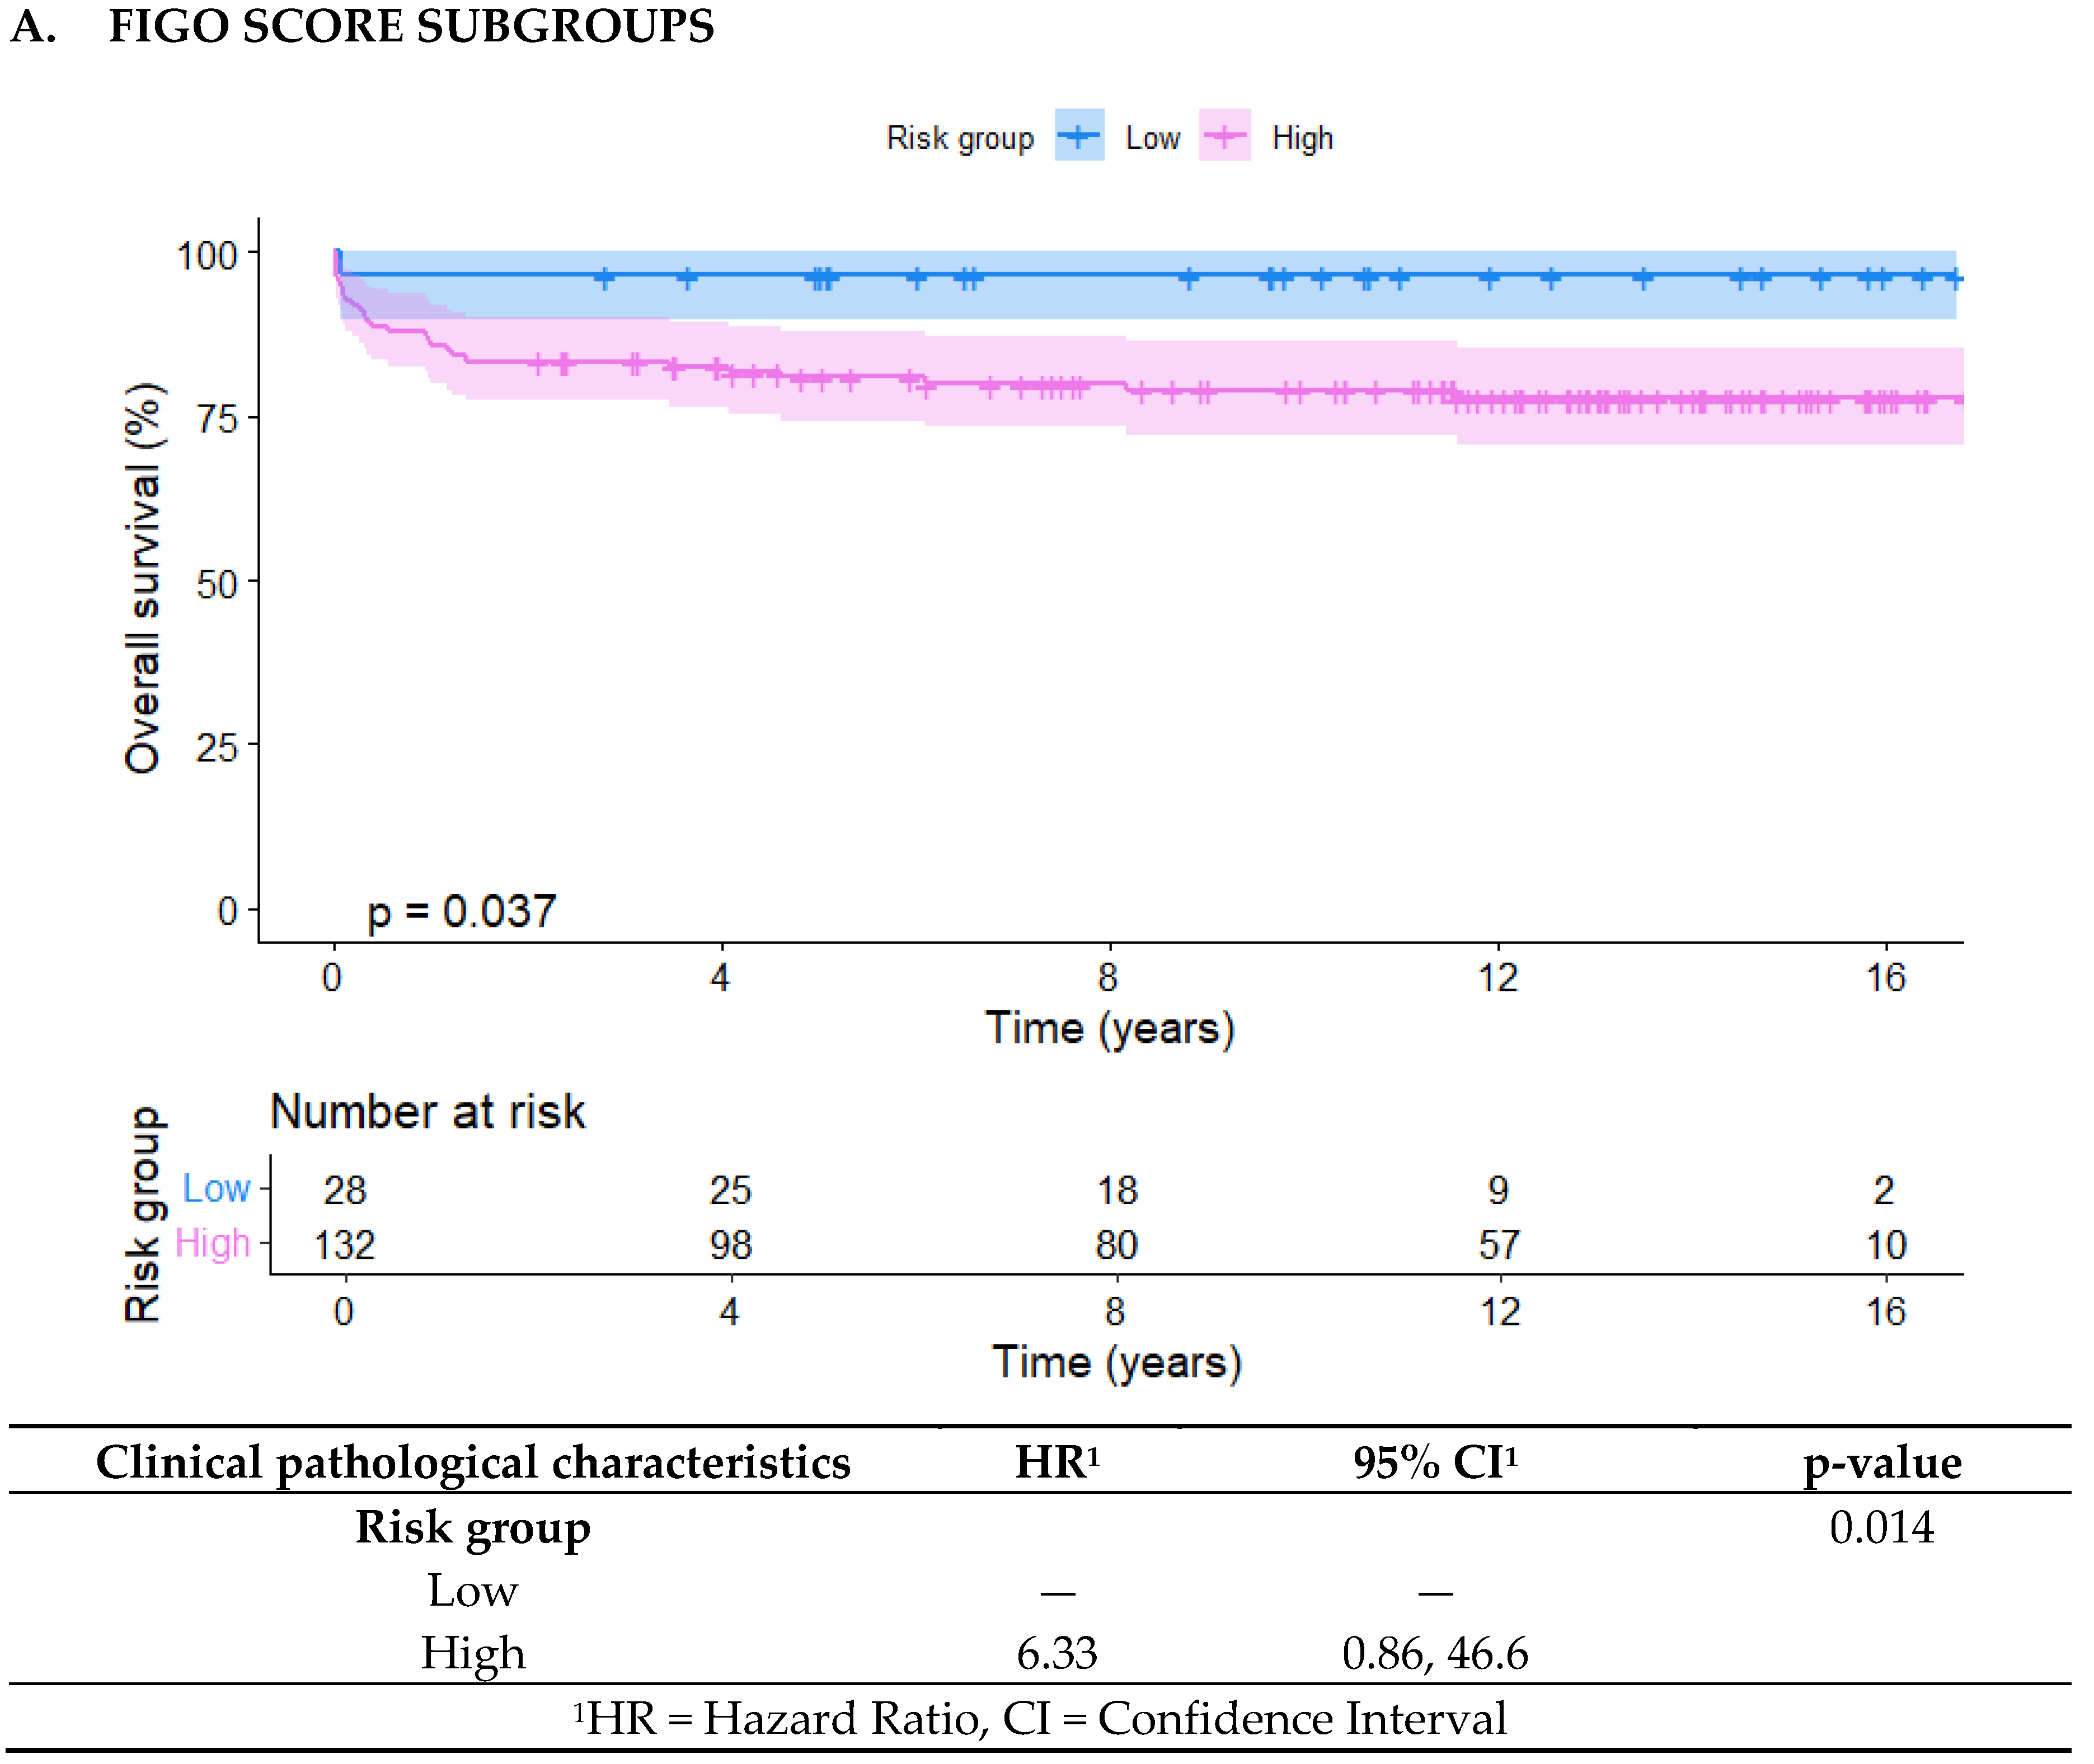
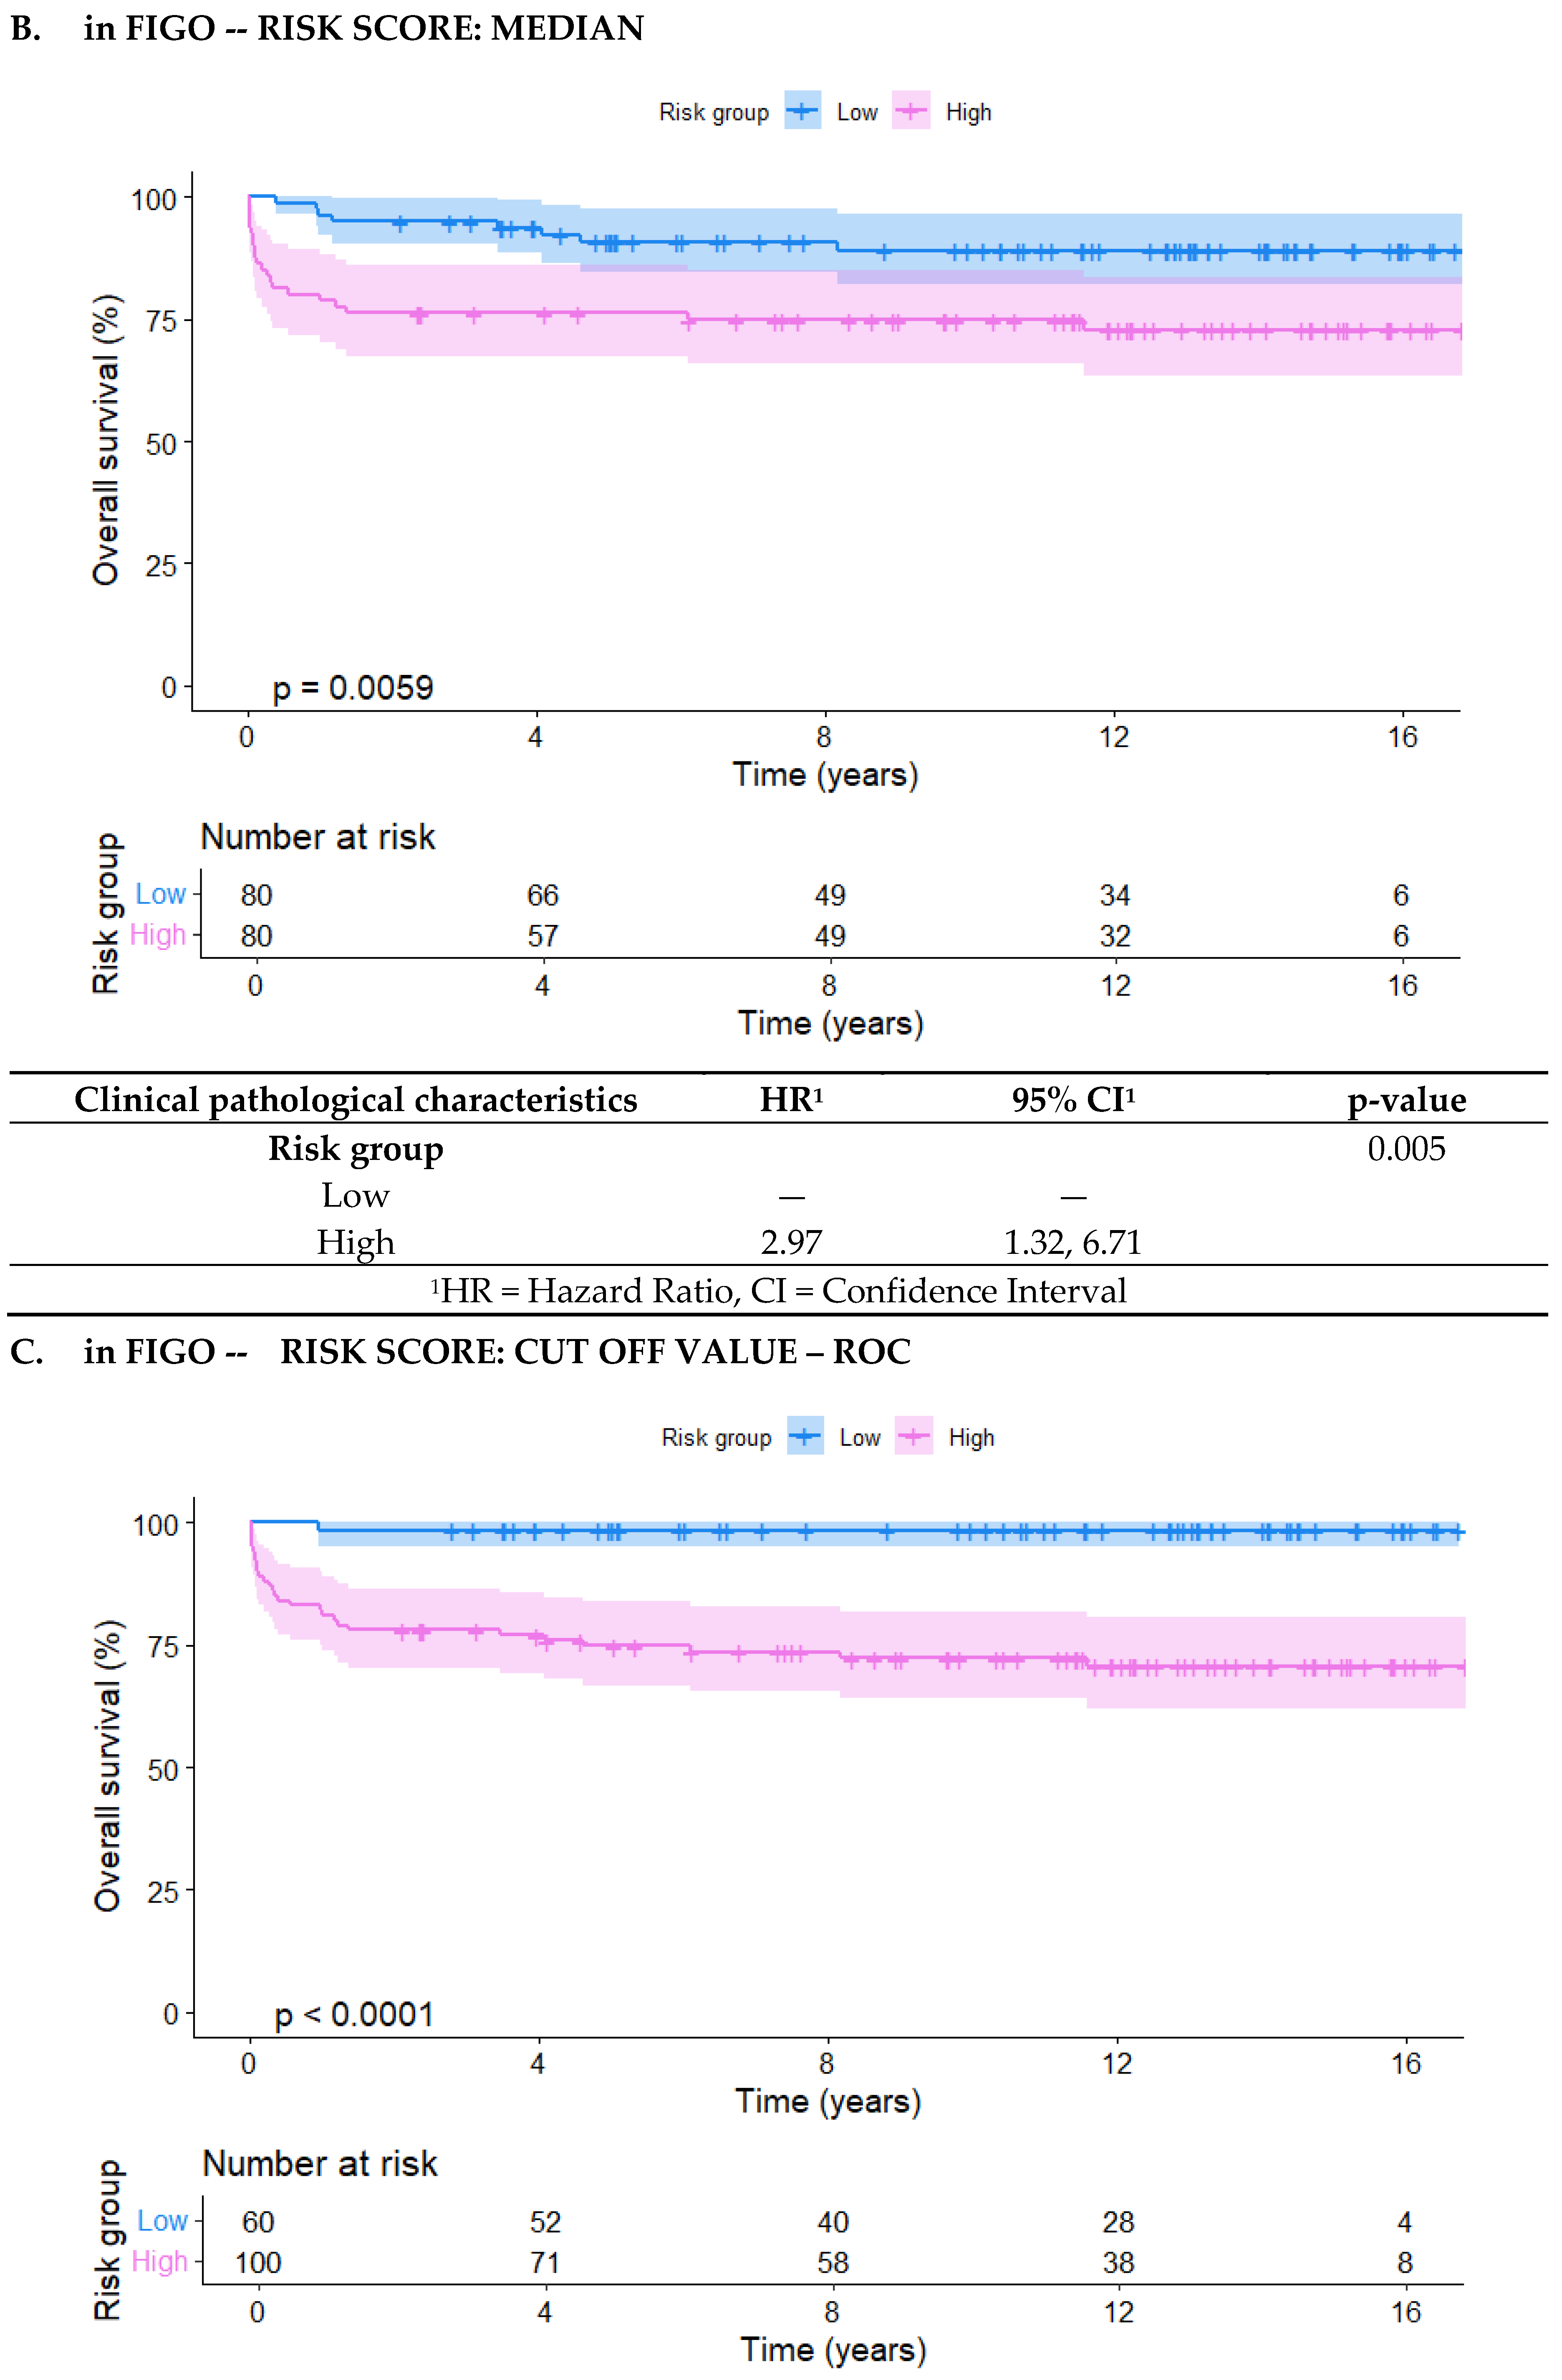

Figure 4.
ROC curve for FIGO score and in-FIGO score in relation to rCT.
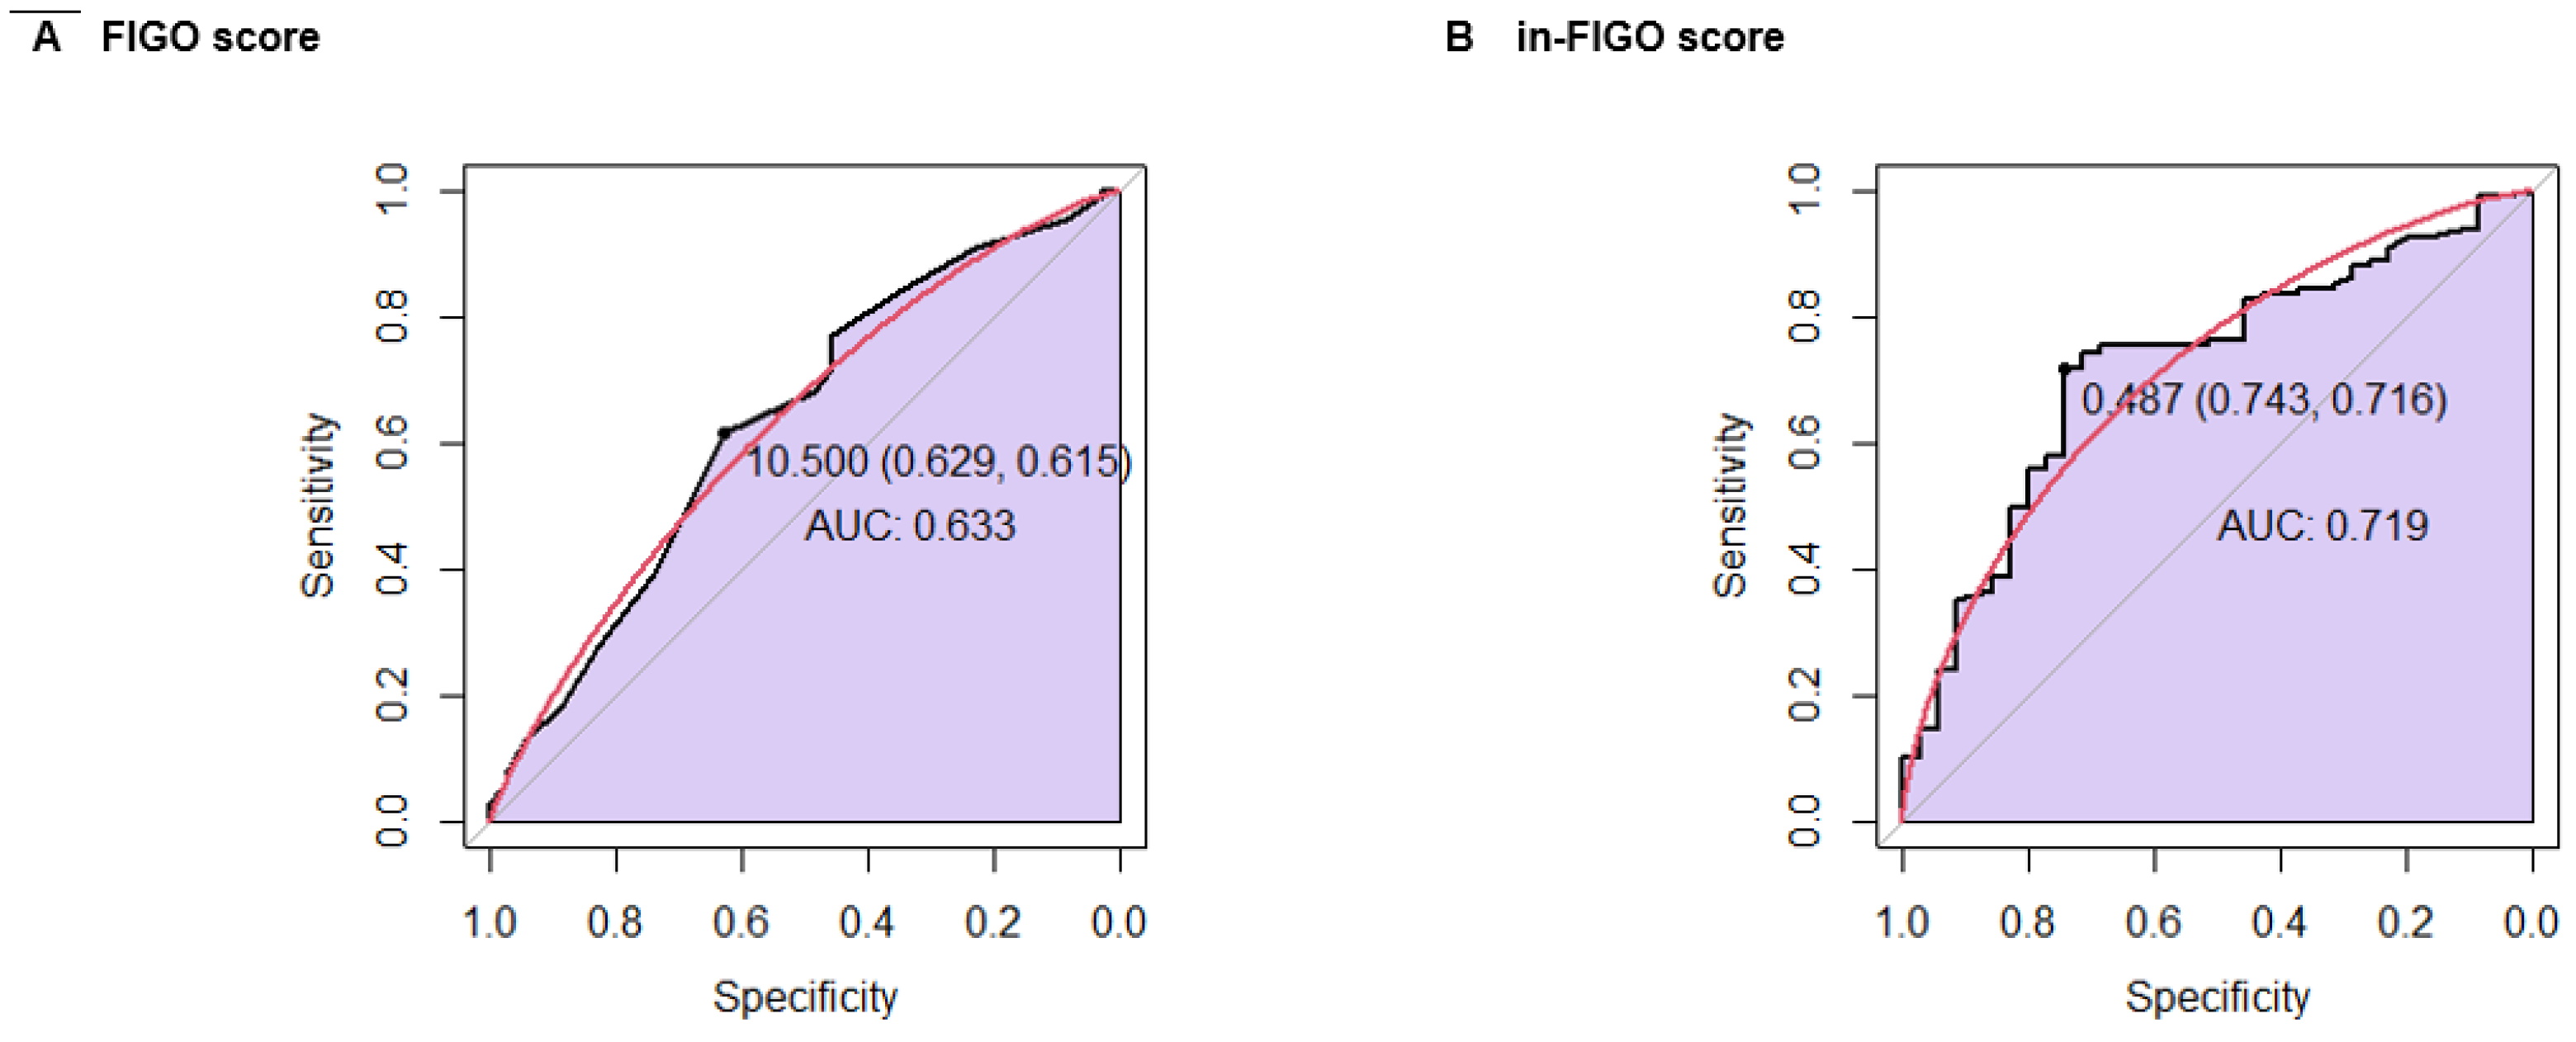
Figure 5.
ROC curve for FIGO score and in-FIGO score in relation to OS.
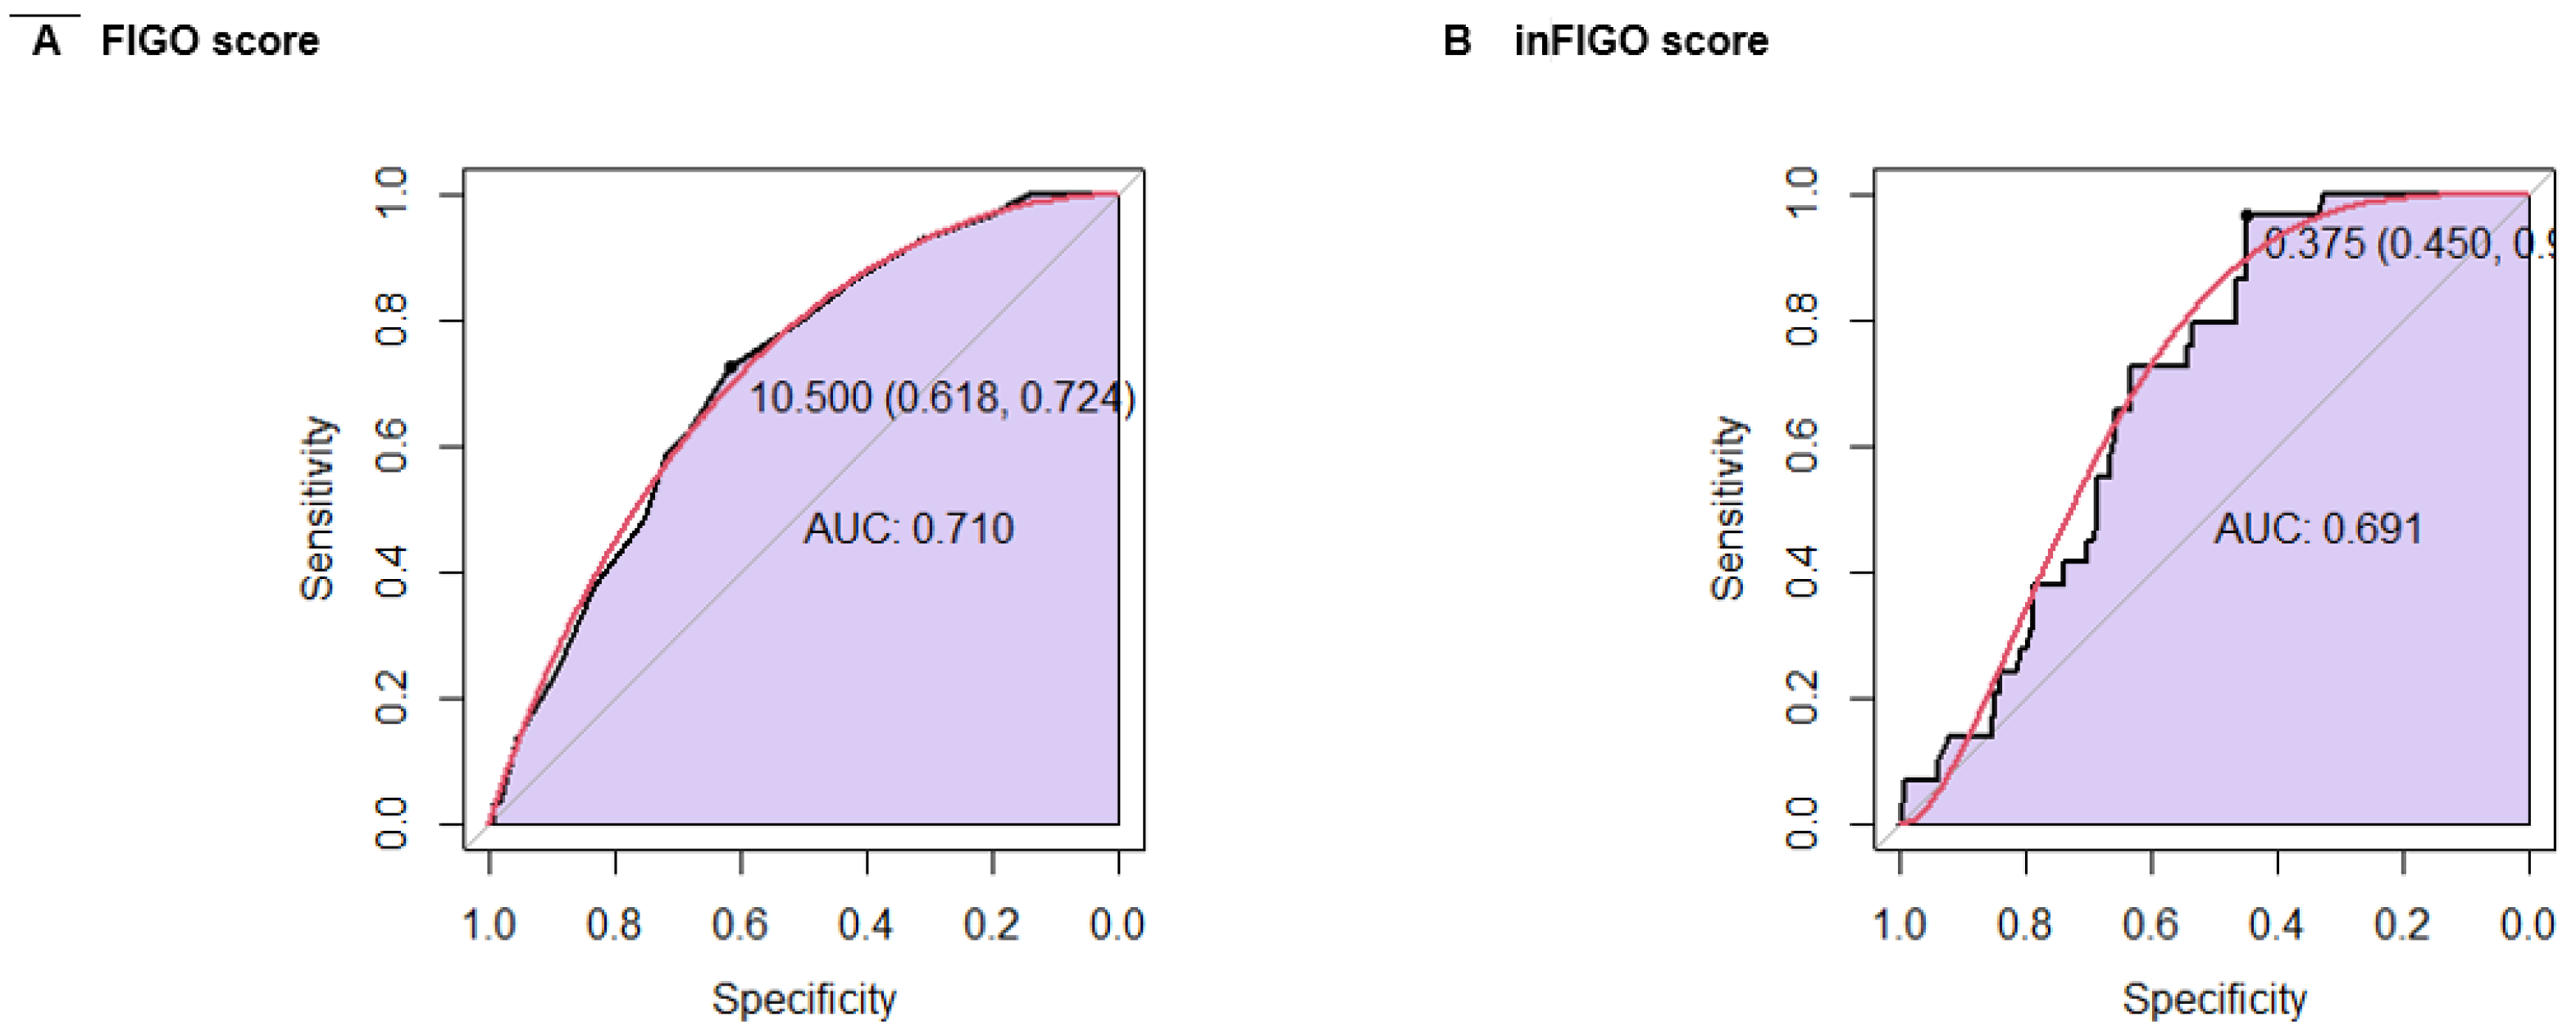

Table 1.
Clinical and pathological characteristics of patients with GTN.
| N = 1601 | |
|---|---|
| Age (years) | 30.0 (23.0, 40.0) |
| Age group (years) | |
| <40 | 116 (72.5%) |
| ≥40 | 44 (27.5%) |
| Histology | |
| Invasive mole | 8 (8.2%) |
| Choriocarcinoma | 87 (89.7%) |
| Placental site trophoblastic tumor | 1 (1.0%) |
| Epithelioid trophoblastic tumor | 1 (1.0%) |
| Not evaluated | 63 |
| Tumor stage | |
| Yo | 24 (15.0%) |
| II | 26 (16.3%) |
| III | 78 (48.8%) |
| IV | 32 (20.0%) |
| Chemotherapy treatment | |
| MTX | 27 (16.9%) |
| EMACO | 115 (71.9%) |
| EMA/EP | 15 (9.4%) |
| B.E.P. | 2 (1.3%) |
| Other | 1 (0.6%) |
| BMI (kg/m²) | 23.3 (21.2, 26.1) |
| Hb (g/dL) | 10.0 (8.1, 11.5) |
| PNI | 36.0 (29.0, 41.9) |
| NLR | 2.7 (1.7, 4.7) |
| FIGO risk score | 10.0 (7.0, 14.0) |
| FIGO risk group | |
| Low | 28 (17.5%) |
| High | 78 (48.8%) |
| Very high risk | 54 (33.8%) |
| Response to chemotherapy | |
| Complete response | 109 (75.7%) |
| Poor response | 35 (24.3%) |
| Not reported | 16 |
| Survival status | |
| Alive | 131 (81.9%) |
| Deceased | 29 (18.1%) |
| 1Median (IQR); n (%) | |
Table 2.
Distribution of Immune nutritional factors according rCT.
| Immune nutritional factors | Overall, N = 1441 | Complete response, N = 1091 | Poor response, N = 351 | p-value2 |
|---|---|---|---|---|
| BMI (kg/m²) | 23.4 (21.4, 26.2) | 23.5 (21.8, 26.1) | 22.9 (19.7, 26.7) | 0.5 |
| Hb (g/dL) | 10.1 (8.3, 11.4) | 10.3 (8.6, 11.6) | 9.1 (8.2, 11.0) | 0.4 |
| PNI | 36.2 (29.5, 41.9) | 37.9 (31.0, 42.0) | 30.0 (21.0, 39.0) | <0.001 |
| NLR | 2.7 (1.7, 4.6) | 2.4 (1.6, 4.2) | 4.6 (2.6, 7.9) | <0.001 |
| 1Median (IQR); n (%) | ||||
| 2Wilcoxon rank sum test; T-Test; Pearson's Chi-squared test; Fisher's exact test | ||||
Table 3.
Distribution of Immune nutritional factors according survival and rCT.
| Immune nutritional factors | Overall, N = 1601 | Alive, N = 1311 | Deceased, N = 291 | p-value2 |
|---|---|---|---|---|
| BMI (kg/m²) | 23.3 (21.2, 26.1) | 23.3 (21.4, 26.2) | 23.2 (20.4, 25.5) | 0.8 |
| Hb (g/dL) | 10.0 (8.1, 11.5) | 10.2 (8.2, 11.6) | 9.0 (7.5, 10.9) | 0.4 |
| PNI | 36.0 (29.0, 41.9) | 37.0 (31.0, 42.0) | 28.0 (22.3, 36.8) | 0.001 |
| NLR | 2.7 (1.7, 4.7) | 2.5 (1.6, 4.4) | 3.3 (2.5, 7.4) | 0.039 |
| Chemotherapy response | <0.001 | |||
| Complete response | 109 (75.7%) | 105 (87.5%) | 4 (16.7%) | |
| Poor response | 35 (24.3%) | 15 (12.5%) | 20 (83.3%) | |
| 1Median (IQR); n (%) | ||||
| 2Wilcoxon rank sum test; T-Test; Pearson's Chi-squared test; Fisher's exact test | ||||
Table 4.
Evaluation of the association of immune nutritional factors with rCT.
| Univariable | Multivariable | ||||||
|---|---|---|---|---|---|---|---|
| N | OR1 | 95% CI1 | p-value | OR1 | 95% CI1 | p-value | |
| BMI (kg/m²) | 145 | 0.97 | 0.86, 1.09 | 0.6 | |||
| Hb (g/dL) | 160 | 0.98 | 0.83, 1.16 | 0.8 | |||
| PNI | 139 | 0.92 | 0.87, 0.97 | 0.001 | 0.93 | 0.88, 0.99 | 0.012 |
| NLR | 158 | 1.06 | 0.99, 1.15 | 0.12 | |||
| FIGO risk score | 160 | 1.21 | 1.09, 1.36 | <0.001 | 1.15 | 1.02, 1.30 | 0.020 |
| 1OR = Odds Ratio, CI = Confidence Interval | |||||||
Table 5.
Evaluation of the association of immune nutritional factors with survival.
| Univariable | Multivariable | ||||||
|---|---|---|---|---|---|---|---|
| N | HR1 | 95% CI1 | p-value | HR1 | 95% CI1 | p-value | |
| BMI (kg/m²) | 145 | 0.98 | 0.98, 1.08 | 0.7 | |||
| Hb (g/dL) | 160 | 0.97 | 0.97, 1.14 | 0.7 | |||
| PNI | 139 | 0.93 | 0.89, 0.97 | <0.001 | 0.94 | 0.90, 0.99 | 0.013 |
| NLR | 158 | 1.04 | 1.00, 1.08 | 0.15 | |||
| FIGO risk score | 160 | 1.17 | 1.07, 1.28 | <0.001 | 1.10 | 1.00, 1.22 | 0.049 |
| 1HR = Hazard Ratio, CI = Confidence Interval | |||||||
Table 6.
New distribution of patients according in-FIGO.
| Characteristic | Overall, N = 1601 | LR, N = 601 | HR, N = 1001 | p-value2 |
|---|---|---|---|---|
| Age (years) | 30.0 (23.0, 40.0) | 28.5 (23.0, 38.3) | 31.5 (24.0, 41.0) | 0.2 |
| Age group (years) | 0.4 | |||
| <40 | 116 (72.5%) | 46 (76.7%) | 70 (70.0%) | |
| ≥40 | 44 (27.5%) | 14 (23.3%) | 30 (30.0%) | |
| Histology | 0.13 | |||
| Invasive mole | 8 (8.2%) | 4 (11.8%) | 4 (6.3%) | |
| Choriocarcinoma | 87 (89.7%) | 28 (82.4%) | 59 (93.7%) | |
| Placental site123456trophoblastic tumor | 1 (1.0%) | 1 (2.9%) | 0 (0.0%) | |
| Epithelioid trophoblastic tumor | 1 (1.0%) | 1 (2.9%) | 0 (0.0%) | |
| Tumor stage | <0.001 | |||
| I | 24 (15.0%) | 12 (20.0%) | 12 (12.0%) | |
| II | 26 (16.3%) | 18 (30.0%) | 8 (8.0%) | |
| III | 78 (48.8%) | 28 (46.7%) | 50 (50.0%) | |
| IV | 32 (20.0%) | 2 (3.3%) | 30 (30.0%) | |
| BMI (kg/m²) | 23.3 (21.2, 26.1) | 24.5 (22.4, 26.8) | 22.8 (21.0, 25.5) | 0.013 |
| Hb (g/dL) | 10.0 (8.1, 11.5) | 10.9 (9.7, 12.3) | 9.0 (7.4, 10.9) | <0.001 |
| PNI | 36.0 (29.0, 41.9) | 41.4 (38.8, 44.0) | 30.0 (25.0, 35.0) | <0.001 |
| NLR | 2.7 (1.7, 4.7) | 2.1 (1.6, 3.3) | 3.3 (2.0, 5.7) | <0.001 |
| Chemotherapy dosage | <0.001 | |||
| Monotherapy | 27 (16.9%) | 20 (33.3%) | 7 (7.0%) | |
| Polytherapy | 133 (83.1%) | 40 (66.7%) | 93 (93.0%) | |
| FIGO risk score | 10.0 (7.0, 14.0) | 8.0 (5.0, 9.0) | 13.0 (9.8, 15.0) | <0.001 |
| FIGO risk subgroups (original) | <0.001 | |||
| Low | 28 (17.5%) | 20 (33.3%) | 8 (8.0%) | |
| High | 132 (82.5%) | 40 (66.7%) | 92 (92.0%) | |
| Chemotherapy response | 0.002 | |||
| Complete response | 109 (75.7%) | 51 (89.5%) | 58 (66.7%) | |
| Poor response | 35 (24.3%) | 6 (10.5%) | 29 (33.3%) | |
| Survival status | <0.001 | |||
| Alive | 131 (81.9%) | 59 (98.3%) | 72 (72.0%) | |
| Deceased | 29 (18.1%) | 1 (1.7%) | 28 (28.0%) | |
| 1Median (IQR); n (%) | ||||
| 2Wilcoxon rank sum test; Pearson's Chi-squared test; Fisher's exact test | ||||
Disclaimer/Publisher’s Note: The statements, opinions and data contained in all publications are solely those of the individual author(s) and contributor(s) and not of MDPI and/or the editor(s). MDPI and/or the editor(s) disclaim responsibility for any injury to people or property resulting from any ideas, methods, instructions or products referred to in the content. |
© 2024 by the authors. Licensee MDPI, Basel, Switzerland. This article is an open access article distributed under the terms and conditions of the Creative Commons Attribution (CC BY) license (http://creativecommons.org/licenses/by/4.0/).
Copyright: This open access article is published under a Creative Commons CC BY 4.0 license, which permit the free download, distribution, and reuse, provided that the author and preprint are cited in any reuse.


