Submitted:
18 September 2024
Posted:
20 September 2024
You are already at the latest version
Abstract
Power consumption prediction is a crucial component in enhancing the efficiency and sustainability of building operations. This study investigates the impact of data collection frequency and model selection on the predictive accuracy of power consumption in two distinct building types: an Academic one with 15-minute interval data and an Industrial one with hourly data. Various machine learning models, including Support Vector Machine (SVM) with Radial and Sigmoid kernels, Random Forest (RF), and Deep Neural Networks (DNN), across different data splits and feature sets. Our analysis reveals that higher data collection frequency generally improves model performance, as indicated by lower RMSE, MAPE, and CV values, alongside higher R² scores. The inclusion of more historical power consumption features has also been found to have a more significant impact on the accuracy of predictions than including climate condition features. Moreover, the SVM-Radial model consistently outperformed others, particularly in capturing complex, non-linear patterns in the data. However, the DNN model, while competent in some metrics, showed elevated MAPE values, suggesting potential overfitting issues. These findings suggest that careful consideration of data frequency, features and model selection is essential for optimizing power prediction, contributing to more efficient power management strategies in building operations.
Keywords:
power consumption prediction
; machine learning models
; predictive analytics
; feature analysis
; random forest
; support vector machine (SVM)
; deep neuronal networks (DNN)
1. Introduction
The rising global energy demand and the urgent need to address environmental challenges such as global warming have placed energy efficiency and emission reduction at the forefront of sustainable development. In 2021, building operations accounted for 30% of global energy consumption and 27% of energy-related carbon emissions, making buildings a significant source of greenhouse gases [1]. Accurate power consumption prediction in buildings is crucial for managing and optimizing energy use, essential for reducing carbon emissions in rapidly urbanizing regions like China [2]. Over the past decade, extensive energy consumption monitoring platforms have been developed, collecting vast amounts of data that can be leveraged to enhance building operations and efficiency [3].
The transition to electrification, driven by the need to reduce greenhouse gas emissions, has further emphasized the importance of accurate energy consumption prediction in buildings [4]. The integration of distributed generation and storage solutions, along with the adoption of Zero-Emission Building (ZEB) concepts, underscores the need for robust predictive models that can adapt to dynamic and uncertain environments [5]. Artificial Intelligence (AI) techniques, particularly those leveraging large amounts of data generated by smart meters and Internet of Things (IoT) devices, offer significant potential for improving building energy efficiency [6].
Additionally, understanding the historical evolution of energy prediction models provides important context for the development and maturity of current hybrid models. From simple calculations in the 1970s to statistical models in the 1980s, and the rise of Machine Learning (ML) and AI from the mid-1990s onwards, each stage has contributed to the current advancements [5,7]. The infrastructure needed to implement AI models, including the collection and processing of large amounts of data, is fundamental to the practical application of these predictive models [8,9]. Furthermore, policies and regulations that promote energy efficiency play a crucial role in the adoption and effectiveness of energy prediction models [10].
The type and location of a building are critical factors in selecting an appropriate model for energy consumption prediction, as they influence the consumption patterns and dynamics [11,12]. Depending on the type of building (e.g., offices, industrial, academic, residential) and its environmental conditions (e.g., warm/cold, humid/dry), the consumption pattern can vary significantly. For instance, office buildings in colder climates may have distinct heating requirements and power usage patterns compared to residential buildings in warmer regions. Consequently, the effectiveness of a particular model can vary depending on these factors. Thus, tailoring predictive models to the specific characteristics of each building type and its environment is essential for accurate and effective energy management.
Among the various ML techniques, artificial neural networks (ANN), support vector regression (SVR), and deep neural networks (DNN) have been widely applied in energy prediction tasks [13]. However, these models often struggle to capture the temporal dependencies inherent in time series energy data. Deep learning models such as long short-term memory (LSTM) networks and convolutional neural networks (CNN) have shown superior performance in extracting features from large datasets and detecting hidden patterns [14]. While LSTM and CNN offer advantages in capturing temporal dependencies and detecting complex patterns, they often require extensive computational resources and training data, which may limit their practical applicability, especially in scenarios with limited data availability or computational constraints.
In contrast, using discrete data offers several advantages over time series data. Discrete data typically present a reduced risk of overfitting, as they involve fewer data points and less complex patterns, making models more robust and generalizable [15]. The preparation of discrete data is simpler compared to the intricate preprocessing required for time series data, facilitating quicker and more straightforward data handling [16]. Implementing models with discrete data is generally easier, allowing for faster deployment and testing without the need for extensive computational resources [17]. Additionally, the interpretability of models trained on discrete data is enhanced, providing clearer insights into the factors influencing energy consumption and leading to actionable insights for decision-makers. However, it’s essential to acknowledge that the choice between using discrete data and time series data depends on various factors, including the nature of the problem, the availability of data, and the specific objectives of the predictive modeling task.
Random Forest (RF), Support Vector Machine (SVM), and Deep Neural Network (DNN) models lend themselves well to handling discrete data, offering advantages over traditional methods in terms of their ability to capture complex relationships and patterns in the data [18,19].
In resume, this study focuses on evaluating the effectiveness of different ML models for predicting the electrical consumption of buildings 24 hours in advance. And for that purpose, a Persistent Model (PM), predicting future consumption based on consumption exactly 24 hours prior, serves as a baseline to assess the performance of the ML models.
1.1. Research Questions and Hypotheses
Building on the context of global energy challenges and the critical role of accurate power consumption predictions, this study seeks to address key Research Questions aimed at improving predictive accuracy across diverse building types and environmental conditions:
- RQ1 Which features (e.g., previously consumed power, temperature, irradiation) are most influential in predicting power consumption in academic vs. industrial buildings?
- RQ2 To what extent do climatic conditions (oceanic vs. continental Mediterranean) influence the predictive accuracy of power consumption models in different types of buildings?
- RQ3 What impact does the frequency of data collection (15-minute intervals for the Academic building vs. hourly for the Industrial building) and the split between train, validation, and test sets have on the performance of these machine learning models?
- RQ4 How does the choice of kernel in SVM (Radial vs. Sigmoid) affect the ability of the model to capture non-linear relationships in power consumption data from different building types?
- RQ5 How does the accuracy of power consumption predictions vary among different machine learning models (RF, SVM with Radial and Sigmoid kernels, DNN) when applied to buildings with distinct architectural functions (Academic vs. Industrial)?
Based on these questions, the following Hypotheses are proposed:
- H1 Humidity and occupancy rates will be the most influential features in predicting power consumption in the Academic building, while temperature and equipment usage will be more critical in the Industrial building.
- H2 The climatic conditions will have a more significant impact on the accuracy of predictions in the Industrial building than in the Academic building due to the extreme temperature fluctuations typical of continental Mediterranean climates.
- H3 The prediction accuracy of power consumption models will be higher for the Academic building, which has a higher frequency of data collection (15-minute intervals), compared to the Industrial building, where data is collected hourly.
- H4 The Radial kernel in SVM will provide better predictive accuracy for power consumption in both buildings compared to the Sigmoid kernel, due to its superior ability to model complex, non-linear relationships in the data.
- H5 The DNN model will outperform RF and SVM in predicting power consumption in both the Academic and Industrial buildings due to its ability to capture complex non-linear relationships.
These questions and hypotheses will guide the analysis and comparison of the selected ML models, providing insights into their applicability and effectiveness for building power consumption prediction under varying conditions.
2. Methodology
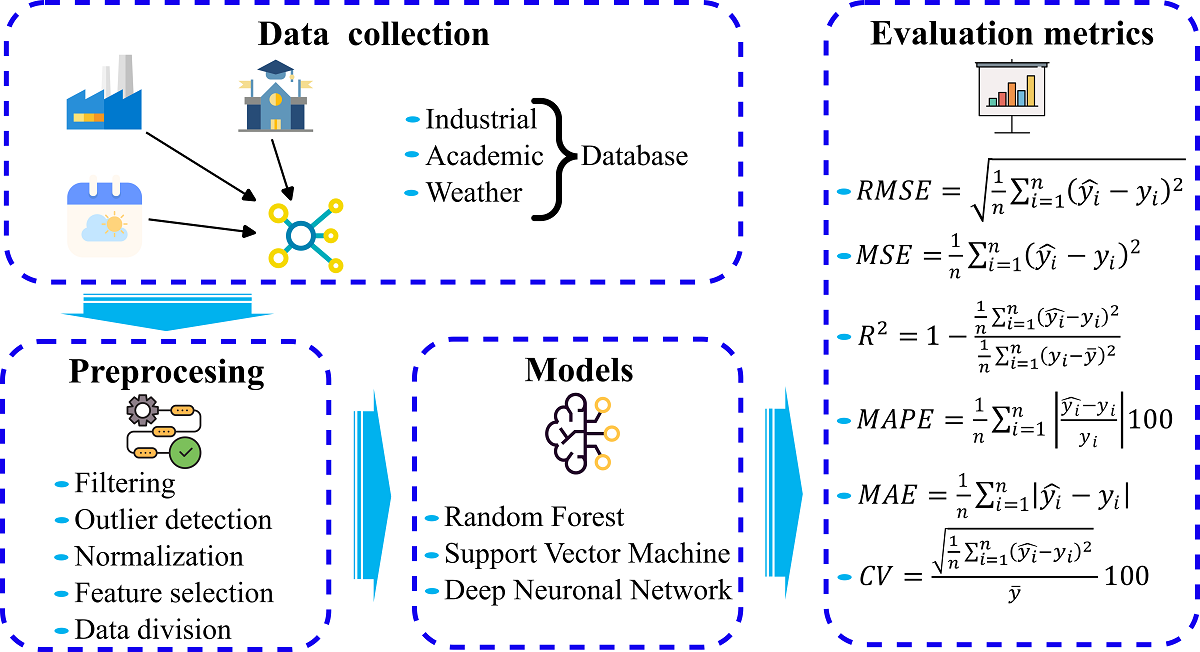
The foundation of predicting building power consumption lies in effective feature selection and comprehensive model training. This process begins with gathering and preprocessing relevant data, followed by identifying critical features that influence power consumption. Subsequently, models are trained and validated to ensure accuracy and reliability in their predictions. This structured approach (see Figure 1) is essential for developing precise models tailored to the specific characteristics of different buildings.
2.1. Data Collection
Gathering power consumption data for different building types is essential for accurate forecasting. The academic and industrial buildings each have their own monitoring platform, with different data collection frequencies tailored to their specific needs. For the academic building, data was collected at 15-minute intervals over a period of 3 academic years, from September 2016 to July 2019. This resulted in a total of 92,160 readings, or 960 full days (see Table 1). In contrast, for the industrial building, data were collected over a period of 1 year, from March 2022 to February 2023, at 1-hour intervals. This resulted in a total of 8,759 readings, or 365 full days.
Local meteorological data for each site were retrieved from the web application Solcast, ensuring the data frequency matched the consumption data for precise integration and analysis. This harmonized approach allows for effective feature selection and model training, crucial for predicting power consumption accurately.
2.2. Data Preprocessing
This step ensures data is suitable for predictive models, enhancing their accuracy and efficiency. The preprocessing involves data cleaning, outlier identification, normalization, feature selection and data division to create a robust dataset for building power consumption prediction. The data for the industrial building has already been preprocessed, eliminating the need for further data cleaning and outlier identification (see Table 2).
2.2.1. Data Cleaning
First, academic building data was filtered. Repeated samples were identified and removed. A total of 1,168 samples with NaN values were identified (1.27% of the data). In cases with a single or double NaN value, it was replaced with the previous or subsequent non-null value. In cases with three or more NaN values, the entire day was removed. In total, 28 days with three or more NaN values were removed.
2.2.2. Outlier Identification
Next, academic building outliers were identified. Values outside the range of 100 W and 100,000 W were removed. 15,745 measurements below 100 W were removed, corresponding to a period when the data storage system did not store the data correctly. Four other measurements exceeding 100 kW were identified and removed. Finally, five days without 15-minute measurements were identified and removed.
Outliers were identified using standard deviation method. To do this, the samples were separated into groups considering whether they are holidays or weekdays, work hours or non-work hours, and whether the chiller is on or off defined in Section 3. Outliers were replaced using the same criterion as the NaN values. 1,234 working hours samples out of 21,666 total samples are outliers (5.7%). 540 non working hours samples out of 51,582 total samples are outliers (1%).
2.2.3. Normalization
The consumed power was normalized using min-max normalization, Equation (1), to obtain values in a range from 0 to 1 in Academic and Industrial buildings.
2.2.4. Feature Selection
In order to optimize the effectiveness of the model, relevant input data for the implementation of the algorithm has been selected. This was achieved by graphing the consumption curves in 24-hour windows, which allowed for the visual selection of a subset of the characteristics available for use in the model. This step, is found in Section 3.2 after the in-depth analysis of the two case studies (Academic and Industrial buildings). Furthermore, the impact of climatic variables on the power consumption of buildings has been analyzed in Section 3.2.1.
2.2.5. Data Division
To evaluate the learning capacity of the models under different training, validation, and test set proportions, we conducted a detailed analysis studying two distinct cases for each dataset:
- Case 1 Split of around 72% of the data allocated to train, 18% to validation and 10% to test.
- Case 2 Split of around 80% of the data allocated to train, 10% to validation and 10% to test.
To ensure representativeness, data was segmented into 24-hour blocks in order to be able to visualize whole days during the tests of each model, and each dataset maintained a balanced representation of weekdays, weekends, and holidays. Consequently, the proportions varied between the Academic and Industrial datasets, but the trends remained consistent, ensuring systematic and comparable analysis (see Figure 2).
2.3. Prediction Models
- RF is particularly useful due to its ability to handle multiple features and capture complex patterns. RF constructs an ensemble of decision trees, each trained on random subsets of the dataset, which not only enhances accuracy but also helps mitigate overfitting. Additionally, the ease of interpretation of RF results is an advantage, as it allows for understanding which features are most influential in the predictions.
-
SVM is powerful for prediction tasks because it handles both linear and non-linear relationships in data. SVM seeks the optimal hyperplane that maximizes the separation between classes or patterns. It is effective with high-dimensional datasets, providing robust solutions.The choice of kernel function is crucial in SVM as it defines how data is transformed and separated, significantly enhancing SVM’s predictive power and generalization ability.
- –
- The Radial Basis Function (RBF) kernel, also known as the Gaussian kernel or just Radial kernel, is popular due to its efficiency in modeling non-linear relationships. However, it may overfit small or noisy datasets.
- –
- The Sigmoid kernel is another option that offers flexibility in modeling various relationships, but may underperform compared to the RBF kernel in highly non-linear environments.
-
DNN is a deep learning architecture consisting of multiple layers of interconnected neurons. DNNs are particularly effective for learning complex and non-linear representations of data, making them suitable for tasks involving intricate patterns and relationships. One of the primary advantages of DNNs is their ability to automatically learn relevant features from the data, which enhances their performance in modeling intricate patterns.Due to its effectiveness and efficiency, Rectified Linear Unit (ReLU) activation function is chosen. It facilitates a faster training of the model, reduces the likelihood of overfitting and helps in capturing complex patterns by not suffering from the vanishing gradient problem.
2.4. Evaluation Metrics of the Models
To evaluate the accuracy of the different models, six different metrics are used: Mean Squared Error (MSE), Root Mean Squared Error (RMSE), Mean Absolute Error (MAE), Mean Absolute Percentage Error (MAPE), coefficient of determination () and Coefficient of Variation (CV). These can be obtained though Equations (2)–(7).
where y, and are the real value, predicted value and mean of the prediction, respectively; and n is the total number of samples, in our case for Industrial and for Academic.
3. Case Study
3.1. Buildings Description
The two case studies are:
Academic building: located in Arrasate, Spain, which has an oceanic climate with mild to cool conditions, moderate temperatures with little annual variation, and abundant rainfall. It has five floors and covers a total area of 7,640 , comprising offices, classrooms, and laboratories. It is a smart building, equipped with automated management systems that optimize energy use and maintain efficient operation.
Industrial building: located in Burgos, Spain, where the climate is continental Mediterranean featuring harsh winters and hot summers, with irregular and scarce rainfall. The building includes a large production area and office spaces, spanning a total of 11,800 . It must support the extreme temperature fluctuations typical of the region, ensuring stable and efficient operational conditions year-round.
3.2. Data Analysis and Correlations
After the data preprocessing done in Section 2.2 (see Table 2), an in-depth analysis has been carried out in order to select the appropriate features.
The Academic building (see Figure 3-a) indicates an increase in consumption related to a chiller in the air conditioning system over several days. Furthermore, it is straightforward to differentiate between holiday and non-holiday periods (shown in purple and green, respectively) as well as the working hours are between 7 a.m. and 6 p.m.
A visual analysis of the Industrial building’s consumption patterns (see Figure 3-b) allows distinguishing between days when the workday ends at 7 p.m. (in orange) and at 11 p.m. (in green). The workday always begins at 7 a.m. Furthermore, days with elevated power consumption within a specified time frame are identified as base power (power consumption exceeds 78 kW between 7 a.m. and 7 p.m.). Non-working days, which are clearly distinguishable due to the absence of power consumption, are indicated in purple.
All these characteristics, because of their direct implication on consumption, will be used as inputs for the models.
3.2.1. Pearson Correlation
The effect of previous consumptions and environmental factors on consumption has been analyzed using the Pearson Correlation Coefficient. The environmental factors that have been under investigation are: outside air temperature, global horizontal irradiation, cloud opacity and outside relative humidity.
The parameter with the highest correlation in both Industrial and Academic is the consumption 24 hours before (see Table 3), and the second one, the consumption 48 hours before.
Environmental factors analyzed includes, among others: air temperature, irradiation, azimuth, cloud opacity, dew-point temperature and relative humidity. In general, there is a low correlation between these parameters with consumption, i.e., the results for air temperature and irradiation can be seen in Table 3. However, there is a high correlation between air temperature and power consumption depending on the month during the working hours in the Industrial building, so it will be taken into account as an additional input, i.e., in June the correlation has a value of 0.89 and in October of 0.93.
3.3. Input Data
Some labels are the same for both buildings, but are defined differently due to the characteristics of each one. The features under consideration are described next and a summarized in Table 4.
- Pprev 24h. The power consumption at this point in time 24 hours before, normalized between 0 and 1.
- Pprev 48h. The power consumption at this point in time 48 hours before, normalized between 0 and 1.
- Holiday. Boolean value indicating whether the time to be predicted belongs to a holiday ‘1’ or not ‘0’.
-
Base power. Boolean value indicating whether at the time to be predicted there is a base load ‘1’ or not ‘0’.
-
Working hours. Boolean value indicating whether the time to be predicted belongs to working time ‘1’ or not ‘0’.
- Air temperature. The air temperature at that time, normalized between 0 and 1.
4. Experimental Results and Discussion
4.1. Analysis of Results
Table 5 compiles all the numerical results of the metrics used across all combinations of cases, features, models, and buildings. Figure 4 presents these results in a more visual format, facilitating easier interpretation and analysis.
Figure 4-a and Table 5 present the evaluation metrics results for the Academic building. The Basics+48h configuration generally improves upon the Basics configuration in most cases. However, the differences in the best RMSE and R² results are minimal, with little variation between the different scenarios. Nevertheless, there is a noticeable difference in the performance of the different ML models.
For the Industrial building (see Figure 4-b), the Basics+48h configuration achieves better RMSE results across all models and scenarios, except for the SVM-Sigmoid in Case 1. A similar tendency is observed for R² and MAE. Another trend to note is that Basics+AirTemp consistently performs the worst, sometimes even underperforming the persistent model. Meanwhile, Complete and Basics configurations struggle for second place across the various combinations. In MAPE, the DNN model diverges significantly from the other models.
The relation between the true and predicted values has been calculated as a linear regression Equation (8), where the linear relationship between the true and predicted values is given by the regression slope and the offset is .
Estimated values are closer to true values when and . The smaller the deviation, the closer the R² value is to 1.
Figure 5 depicts the correlation between the forecasted and actual consumption values of the Academic building. The consumption patterns used as features can be identified in Figure 3-a: the first, between 0 and 15 kW, corresponds to the power consumed outside of working time with the chiller off; the second, with power between 15 and 30 kW, occurs outside working time with the chiller on; and the third zone, above 30 kW, occurs during working time.
In certain combinations of the highest-performing models (SVM-Radial, RF, and DNN), minimal differences are observed between Case 1 and Case 2, or between Basics with and without the 48h features, indicating that these models are highly stable. However, the model that delivers the best results is the SVM-Radial in Case 2 with the Basics+48h features.
In the graphs for the Industrial building (see Figure 6), three zones are also evident, although less distinct: the first, around 25 kW, represents the base consumption outside working time; the second, between 50 and 75 kW, corresponds to working time with low power consumption; and the third zone, above 75 kW, corresponds to periods of high power consumption.
In general, Case 1 exhibits values closer to 1 and lower offset values, which is consistent with the R² results. Therefore, it can be concluded that Case 1 performs better than Case 2. Furthermore, Basics+48h demonstrates the best performance, except in the SVM-Sigmoid scenario. Lastly, the model with the highest performance is RF, though it is only marginally better than the SVM-Radial.
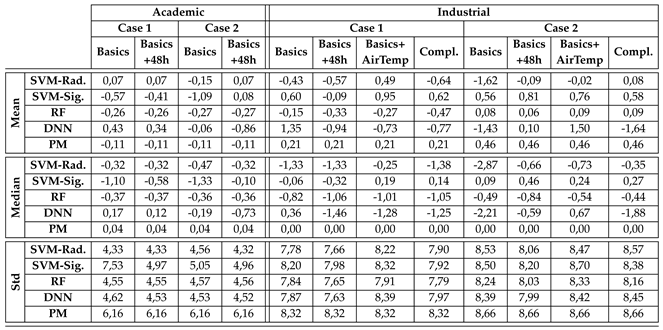
In Table 6 can be seen a summary of Academic and Industrial absolute error. In general, it is desirable for the mean, median, and standard deviation (std) of the absolute error to be as close to zero as possible. A small mean value would indicate that, on average, the error is very small, while a small median value indicates that half of the errors are negative and half are positive. A low standard deviation indicates that the errors are concentrated near the mean, meaning that the errors do not vary much and are consistently small.
The more concentrated the curves around 0, the higher the prediction accuracy of the model. In the case of the Academic building (see Figure 7-a), the RF and DNN models show the most concentrated curves, although the different combinations of cases and features diverge less in the RF model. For the Industrial building (see Figure 7-b), the RF, SVM-Radial, and DNN models all show highly concentrated curves. However, in this, the different combinations diverge more noticeably.
The graphs Figure 8 and Figure 9 present energy consumption for a couple of days (with and whout base load) in the Academic and Industrial buildings, respectively. In all cases Case 1 with Basics+48h has been used. While these visualizations do not yield significant insights on their own, they serve to illustrate how each model adapts to the specific consumption patterns of the buildings. By examining these predictions against actual consumption data, we can observe how the models align with or deviate from the real trends, offering a practical example of model performance under typical conditions for each building type.
4.2. Discussion
Building on the objective analysis of the results presented in the previous section, this discussion will delve into the interpretation and implications of the findings in relation to the five research questions and hypotheses one by one (see Section 1.1). Each hypothesis will be critically examined to assess its validity, drawing on the results to explore how well they align with the initial expectations. This examination will provide a nuanced understanding of the strengths and limitations of the predictive models used, as well as their relevance to the broader goals of improving power consumption forecasting.
- During the analysis of consumption data and correlation with environmental factors, it was observed that the features within the Basics package, directly related to occupancy rate and equipment usage, carry the most significant weight for both the Academic and Industrial buildings. In general, environmental factors showed low correlation with consumption. However, there is a high correlation between air temperature and power consumption depending on the month during working time in the Industrial building, justifying its use as a feature in this context.
- As previously noted, there is a high correlation between air temperature and power consumption during specific months and working hours in the Industrial building, a pattern not observed in the Academic building. However, when examining metrics in its Basics+AirTemp settings such as RMSE, MAE, and R², only in Case 2 with the SVM-Radial model does the performance surpass that of the Basics, with many instances showing even poorer results than the Persistent Model.
From these points, it can be concluded that both buildings are minimally influenced by the climatic conditions of their locations. The Industrial building is more affected by production scheduling, while the Academic building is influenced by its academic activity schedule. This reasoning is further supported by the fact that Basics+48h combinations significantly improve prediction accuracy compared with only Basics in most of the scenarios studied. In resume, H1 hypothesis is partially ratified and H2 refuted.
- Overall, better RMSE values were achieved in the Academic building compared to the Industrial one. Additionally, lower MAPE and CV values were observed, along with higher R² scores, indicating that the models performed more effectively in the environment with 15-minute data intervals than in the one with hourly intervals. Furthermore, the absolute error distributions in the Academic context were much more concentrated around zero.
Based on these findings, it can be concluded that a higher frequency of data collection increases the prediction accuracy of power consumption models, ratifying H3 hypothesis. Moreover, regarding the two data division cases studied, it was observed that Case 1 provides better generalization due to a more balanced validation set than Case 2.
- In all cases studied across both buildings, except for Case 2 in the Industrial building, the SVM-Radial model consistently outperformed the SVM-Sigmoid. The absolute error distribution clearly indicates better performance of the SVM-Radial in the Academic building, and although the difference is less pronounced in the Industrial building, a higher concentration of errors around zero is still observed.
These results ratify the H4 hypothesis that the Radial kernel of the SVM model would demonstrate better predictive accuracy for power consumption in both buildings due to its superior ability to model complex, non-linear relationships in the data.
- Firstly, in the case of the Academic building, the evaluation metrics show similar behavior between the DNN and RF models. However, the RF model generally exhibits better performance, with the lowest RMSE and a very narrow and high absolute error distribution. Secondly, in the Industrial building, the DNN model does not perform as well as the SVM-Radial or RF models, with RF being slightly superior.
In conclusion, it can be stated that the SVM-Radial model is better suited to the characteristics of the Academic building, showing the best performance, while the RF model performs better in the Industrial building. In resume, H5 hypothesis is refuted. The DNN model does not fit as well in either scenario; however, it is observed that this model shows a much higher MAPE than the other models. Excluding issues with scaling or preprocessing of input data, or model construction (as it demonstrates competent behavior in other metrics), it is concluded that the issue may be overfitting. This suggests that while the model may predict very well in many cases, it may fail significantly in others, leading to a spike in MAPE due to high relative errors in those specific cases.
5. Summary and Conclusions
Firstly, the findings indicate that both buildings are minimally affected by local climatic conditions. However, incorporating historical consumption data from 48 hours prior to the Basics features significantly enhances prediction accuracy across most scenarios. The results further confirm that a higher frequency of data collection improves the accuracy of power consumption models. In addition, it is found that a better and more balanced division of the data improves the performance of the models in a very relevant way.
Secondly, the SVM model with a Radial kernel demonstrated superior predictive accuracy in both buildings compared with the Sigmoid kernel one due to its ability to model complex, non-linear relationships in the data. Specifically, the SVM-Radial model exhibited the best performance in the Academic building, while the RF model was more effective in the Industrial building.
Thirdly, the DNN model displayed a notably higher MAPE compared to other models, despite competent performance in other metrics. This suggests that the DNN model may be prone to overfitting, excelling in many cases but significantly underperforming in others, which inflates the MAPE due to high relative errors in those specific instances.
These findings highlight the importance of selecting appropriate data collection frequencies, features and predictive models tailored to the operational characteristics of each building to enhance the accuracy and reliability of power consumption predictions.
Finally, the persistent model’s results were outperformed in the majority of the settings and models tested. This suggests that even with minimal optimization effort, these prediction techniques already prove to be a highly useful tool worth considering. This reinforces the potential of these models to significantly enhance power management practices in various building types, underscoring their practical applicability and effectiveness in real-world scenarios.
Author Contributions
Conceptualization, June Urkizu and Ander Goikoetxea; Data curation, Izar Lopez-Ramirez and June Urkizu; Formal analysis, David Cabezuelo Romero; Investigation, David Cabezuelo Romero, June Urkizu and Ander Goikoetxea; Methodology, David Cabezuelo Romero and Izar Lopez-Ramirez; Resources, June Urkizu; Supervision, June Urkizu and Ander Goikoetxea; Validation, Izar Lopez-Ramirez; Visualization, Izar Lopez-Ramirez; Writing – original draft, David Cabezuelo Romero and Izar Lopez-Ramirez; Writing – review & editing, June Urkizu.
Conflicts of Interest
The authors declare no conflicts of interest.
Abbreviations
The following abbreviations are used in this manuscript:
| AI | Artificial Intelligence |
| ANN | Artificial Neural Network |
| CNN | Convolutional Neuronal Network |
| DNN | Deep Neuronal Network |
| IoT | Internet of Things |
| LSTM | Long Short-Term Memory |
| ML | Machine Learning |
| PM | Persistent Model |
| RF | Random Forest |
| SVM | Support Vector Machine |
| ZEB | Zero-Emission Building |
References
- IEA. Energy Efficiency. Technical report, International Energy Agency, 2023.
- Zhao, T.; Xu, J.; Zhang, C.; Wang, P. A monitoring data based bottom-up modeling method and its application for energy consumption prediction of campus building. Journal of Building Engineering 2021, 35, 101962. [Google Scholar] [CrossRef]
- Liu, X.; Liu, X.; Luo, X.; Fu, H.; Wang, M.; Li, L. Impact of Different Policy Instruments on Diffusing Energy Consumption Monitoring Technology in Public Buildings: evidence from Xi’ an, China. Journal of Cleaner Production 2020, 251, 119693. [Google Scholar] [CrossRef]
- Wu, Y.; Wang, W.; Sun, Y.; Cui, Y.; Duan, D.; Deng, S. An equivalent temperature drop method for evaluating the operating performances of ASHP units jointly affected by ambient air temperature and relative humidity. Energy and Buildings 2020, 224, 110211. [Google Scholar] [CrossRef]
- Nematchoua, M.K.; Nishimwe, A.M.R.; Reiter, S. Towards nearly zero-energy residential neighbourhoods in the European Union: A case study. Renewable and Sustainable Energy Reviews 2021, 135, 110198. [Google Scholar] [CrossRef]
- Zhang, Q.; Yang, L.T.; Chen, Z.; Li, P. A survey on deep learning for big data. Information Fusion 2018, 42, 146–157. [Google Scholar] [CrossRef]
- Amasyali, K.; El-Gohary, N.M. A review of data-driven building energy consumption prediction studies. Renewable and Sustainable Energy Reviews 2018, 81, 1192–1205. [Google Scholar] [CrossRef]
- Somu, N.; R, G.R.M.; Ramamritham, K. A hybrid model for building energy consumption forecasting using long short term memory networks. Applied Energy 2020, 261, 114131. [Google Scholar] [CrossRef]
- Bakar, N.N.A.; Hassan, M.Y.; Abdullah, H.; Rahman, H.A.; Abdullah, M.P.; Hussin, F.; Bandi, M. Energy efficiency index as an indicator for measuring building energy performance: A review. Renewable and Sustainable Energy Reviews 2015, 44, 1–11. [Google Scholar] [CrossRef]
- Bourdeau, M.; qiang Zhai, X.; Nefzaoui, E.; Guo, X.; Chatellier, P. Modeling and forecasting building energy consumption: A review of data-driven techniques. Sustainable Cities and Society 2019, 48, 101533. [Google Scholar] [CrossRef]
- Wei, Y.; Zhang, X.; Shi, Y.; Xia, L.; Pan, S.; Wu, J.; Han, M.; Zhao, X. A review of data-driven approaches for prediction and classification of building energy consumption. Renewable and Sustainable Energy Reviews 2018, 82, 1027–1047. [Google Scholar] [CrossRef]
- Ramokone, A.; Popoola, O.; Awelewa, A.; Temitope, A. A review on behavioural propensity for building load and energy profile development – Model inadequacy and improved approach. Sustainable Energy Technologies and Assessments 2021, 45, 101235. [Google Scholar] [CrossRef]
- Ghoddusi, H.; Creamer, G.G.; Rafizadeh, N. Machine learning in energy economics and finance: A review. Energy Economics 2019, 81, 709–727. [Google Scholar] [CrossRef]
- Al-Saudi, K.; Degeler, V.; Medema, M. Energy Consumption Patterns and Load Forecasting with Profiled CNN-LSTM Networks. Processes 2021, 9, 1870. [Google Scholar] [CrossRef]
- Johnson, J.M.; Khoshgoftaar, T.M. Survey on deep learning with class imbalance. Journal of Big Data 2019, 6. [Google Scholar] [CrossRef]
- Türkmen, A.C.; Januschowski, T.; Wang, Y.; Cemgil, A.T. Forecasting intermittent and sparse time series: A unified probabilistic framework via deep renewal processes. PLoS ONE 2021, 16. [Google Scholar] [CrossRef] [PubMed]
- Adadi, A. A survey on data-efficient algorithms in big data era. Journal of Big Data 2021, 8. [Google Scholar] [CrossRef]
- Olu-Ajayi, R.; Alaka, H.; Sulaimon, I.; Sunmola, F.; Ajayi, S. Building energy consumption prediction for residential buildings using deep learning and other machine learning techniques. Journal of Building Engineering 2022, 45, 103406. [Google Scholar] [CrossRef]
- Zheng, G.; Feng, Z.; Jiang, M.; Tan, L.; Wang, Z. Predicting the Energy Consumption of Commercial Buildings Based on Deep Forest Model and Its Interpretability. Buildings 2023, 13. [Google Scholar] [CrossRef]
Figure 1.
Diagram of the methodology.
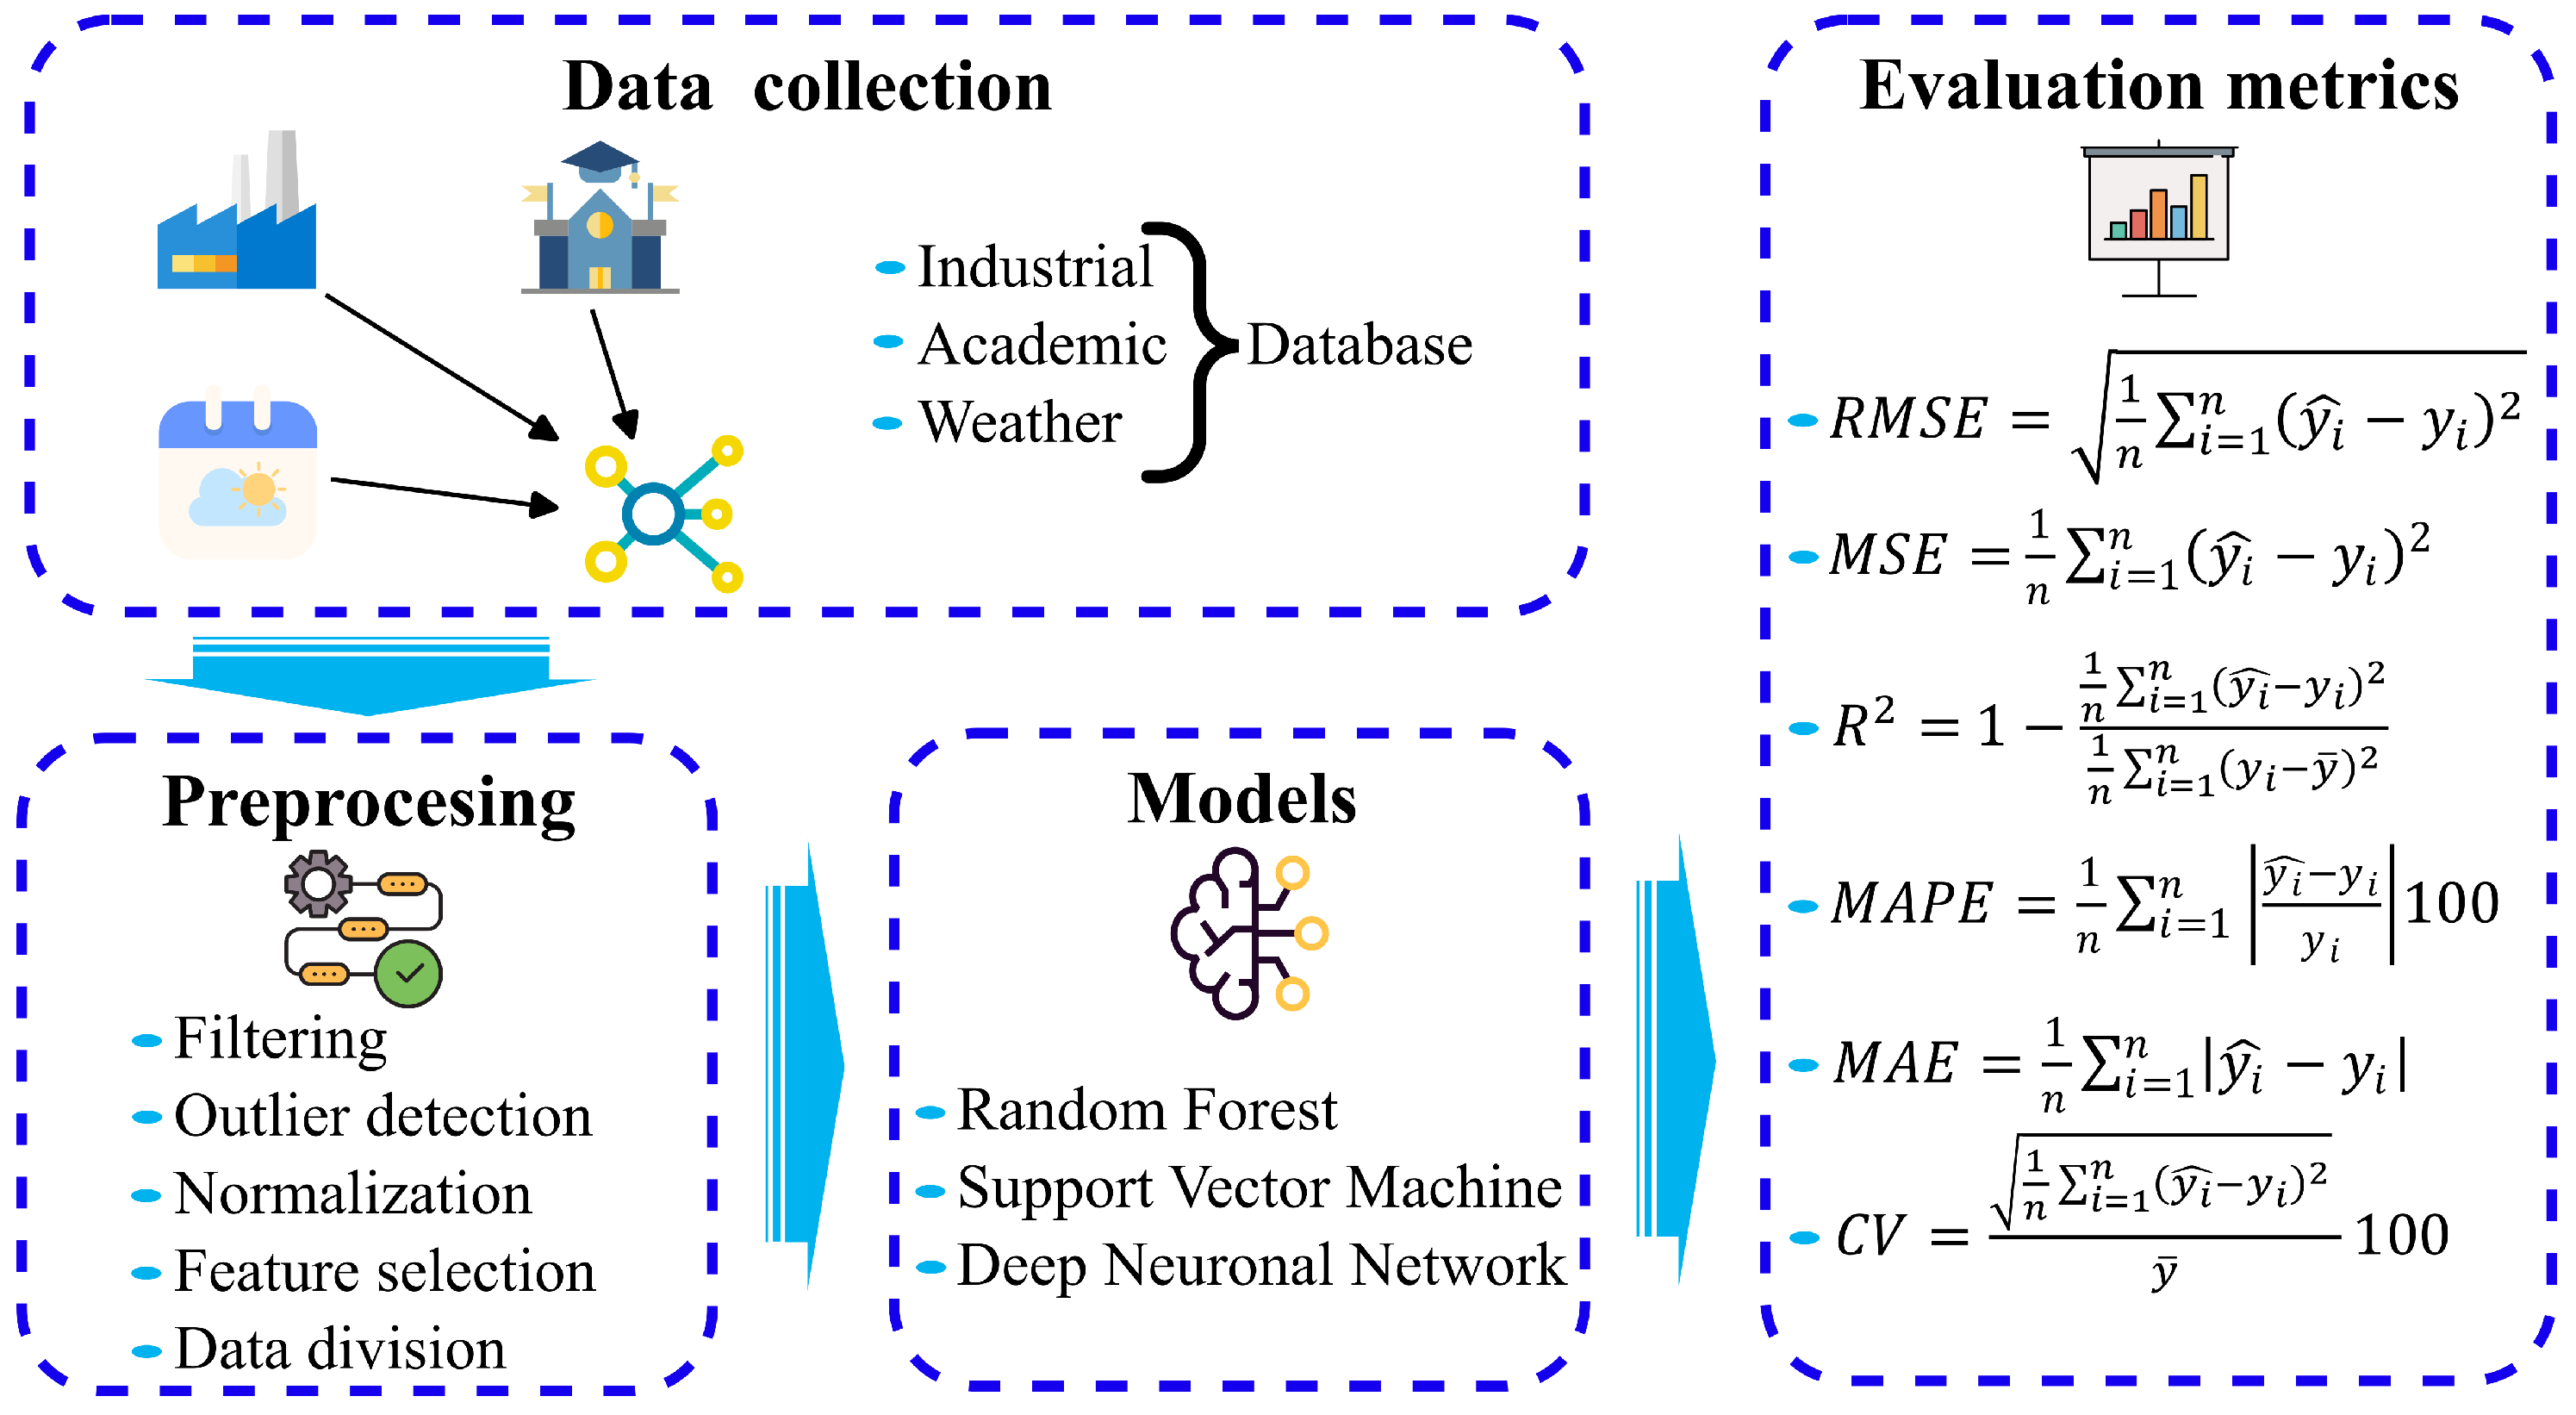
Figure 2.
Dataset split for training, validation and test.
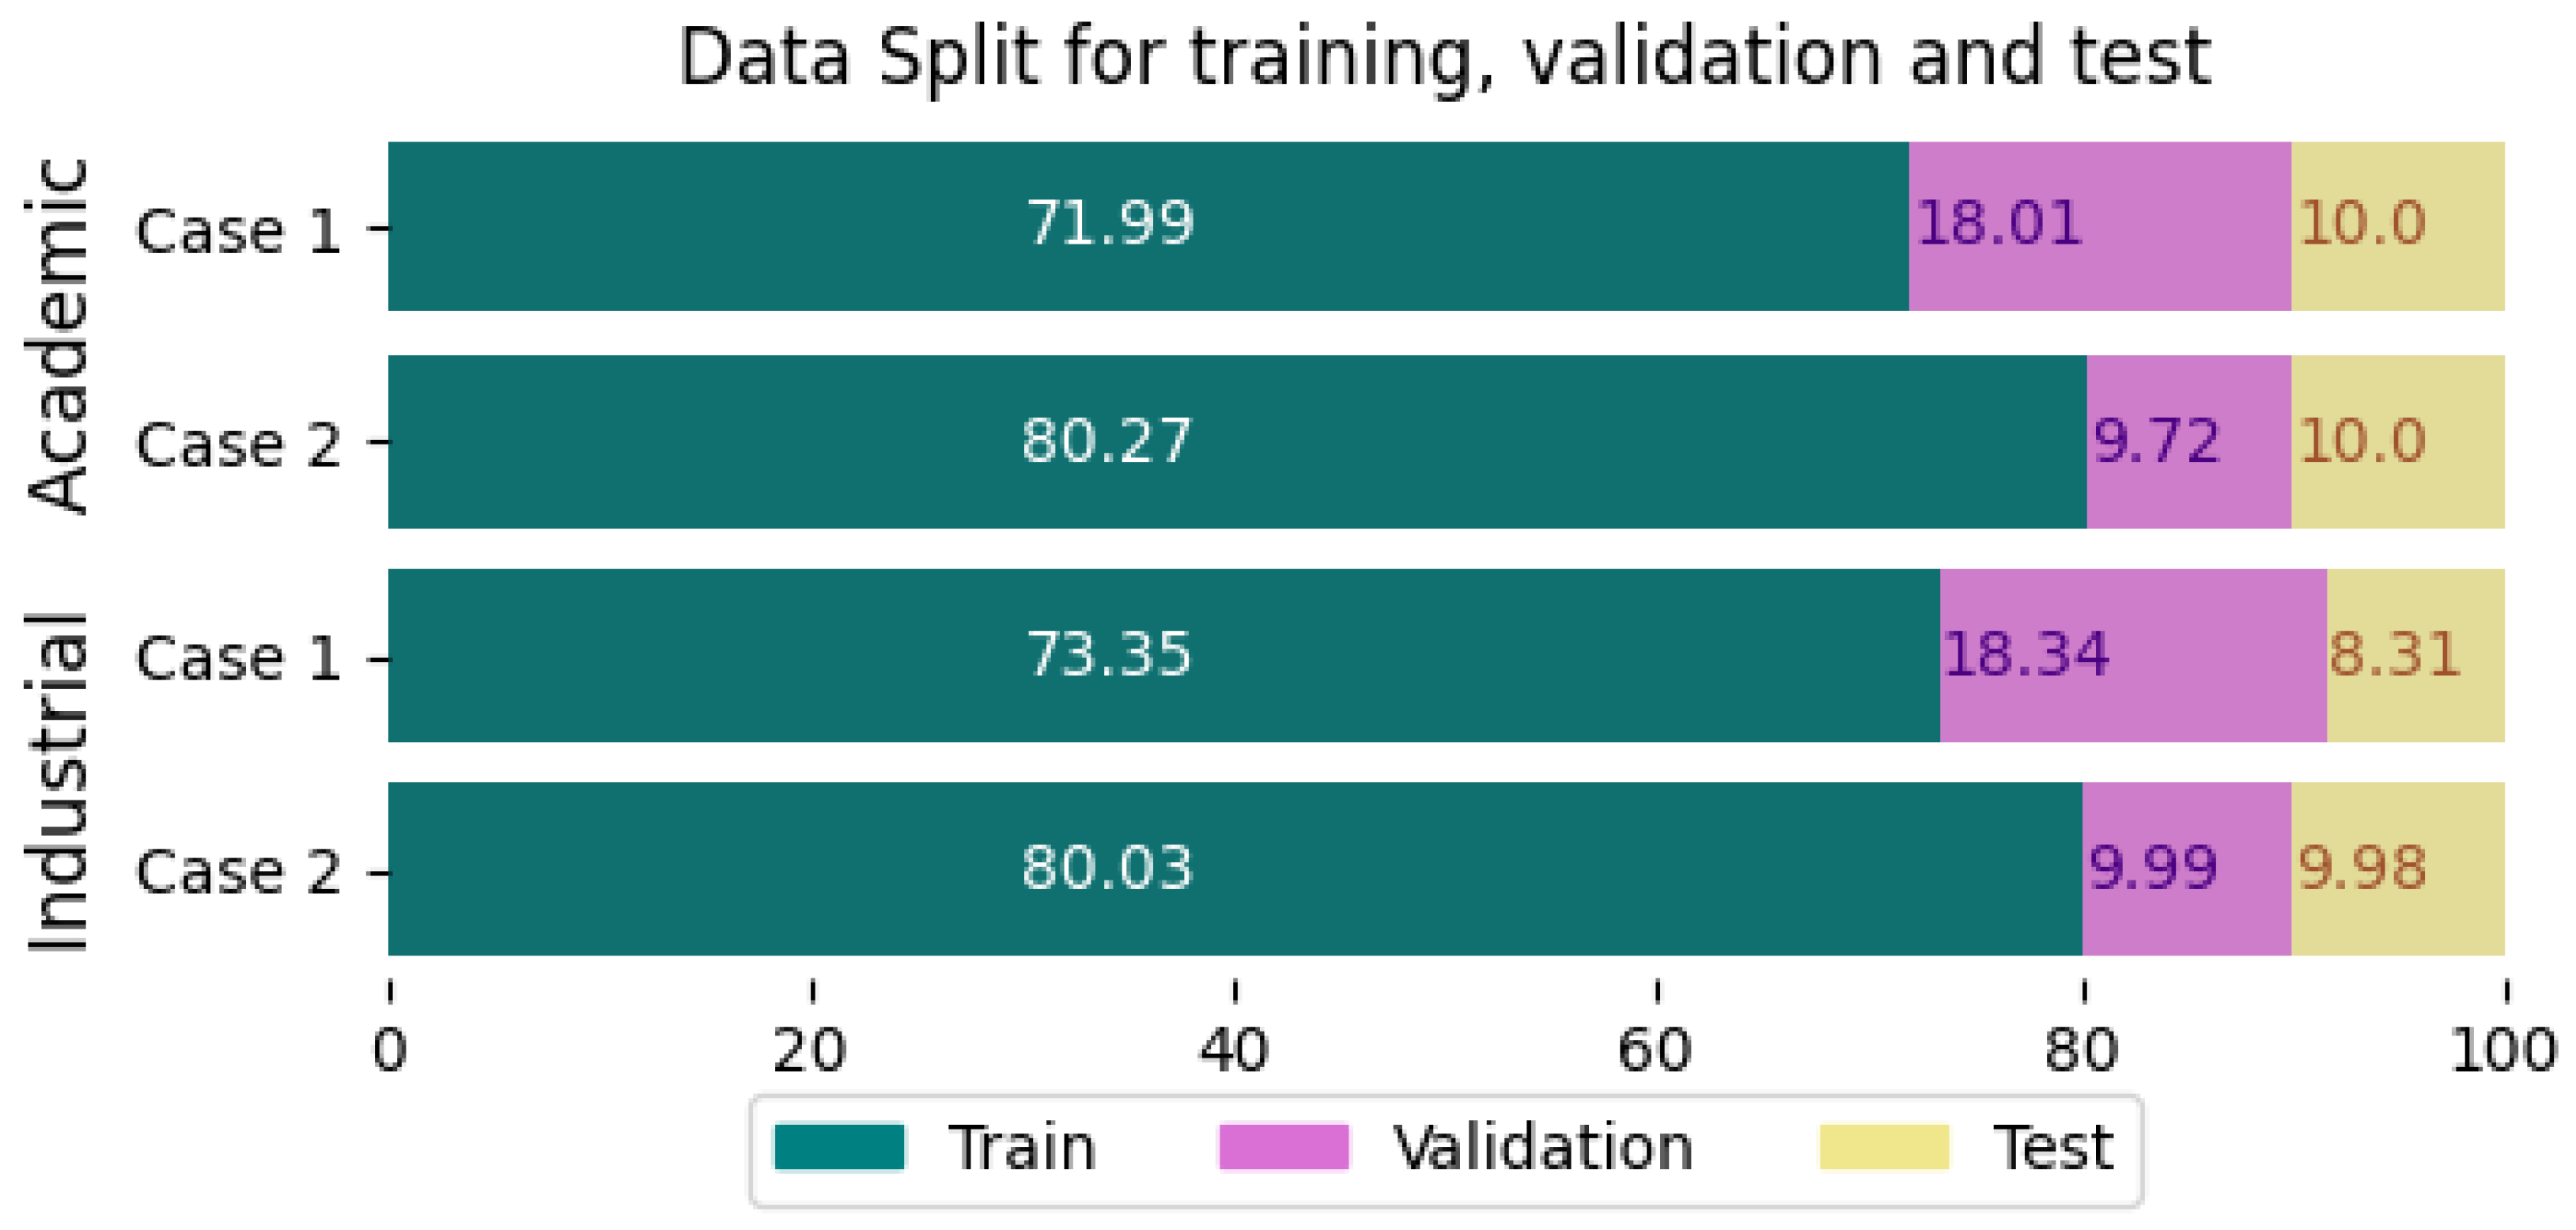
Figure 3.
Daily consumption patterns of both (a) Academic and (b) Industrial building.
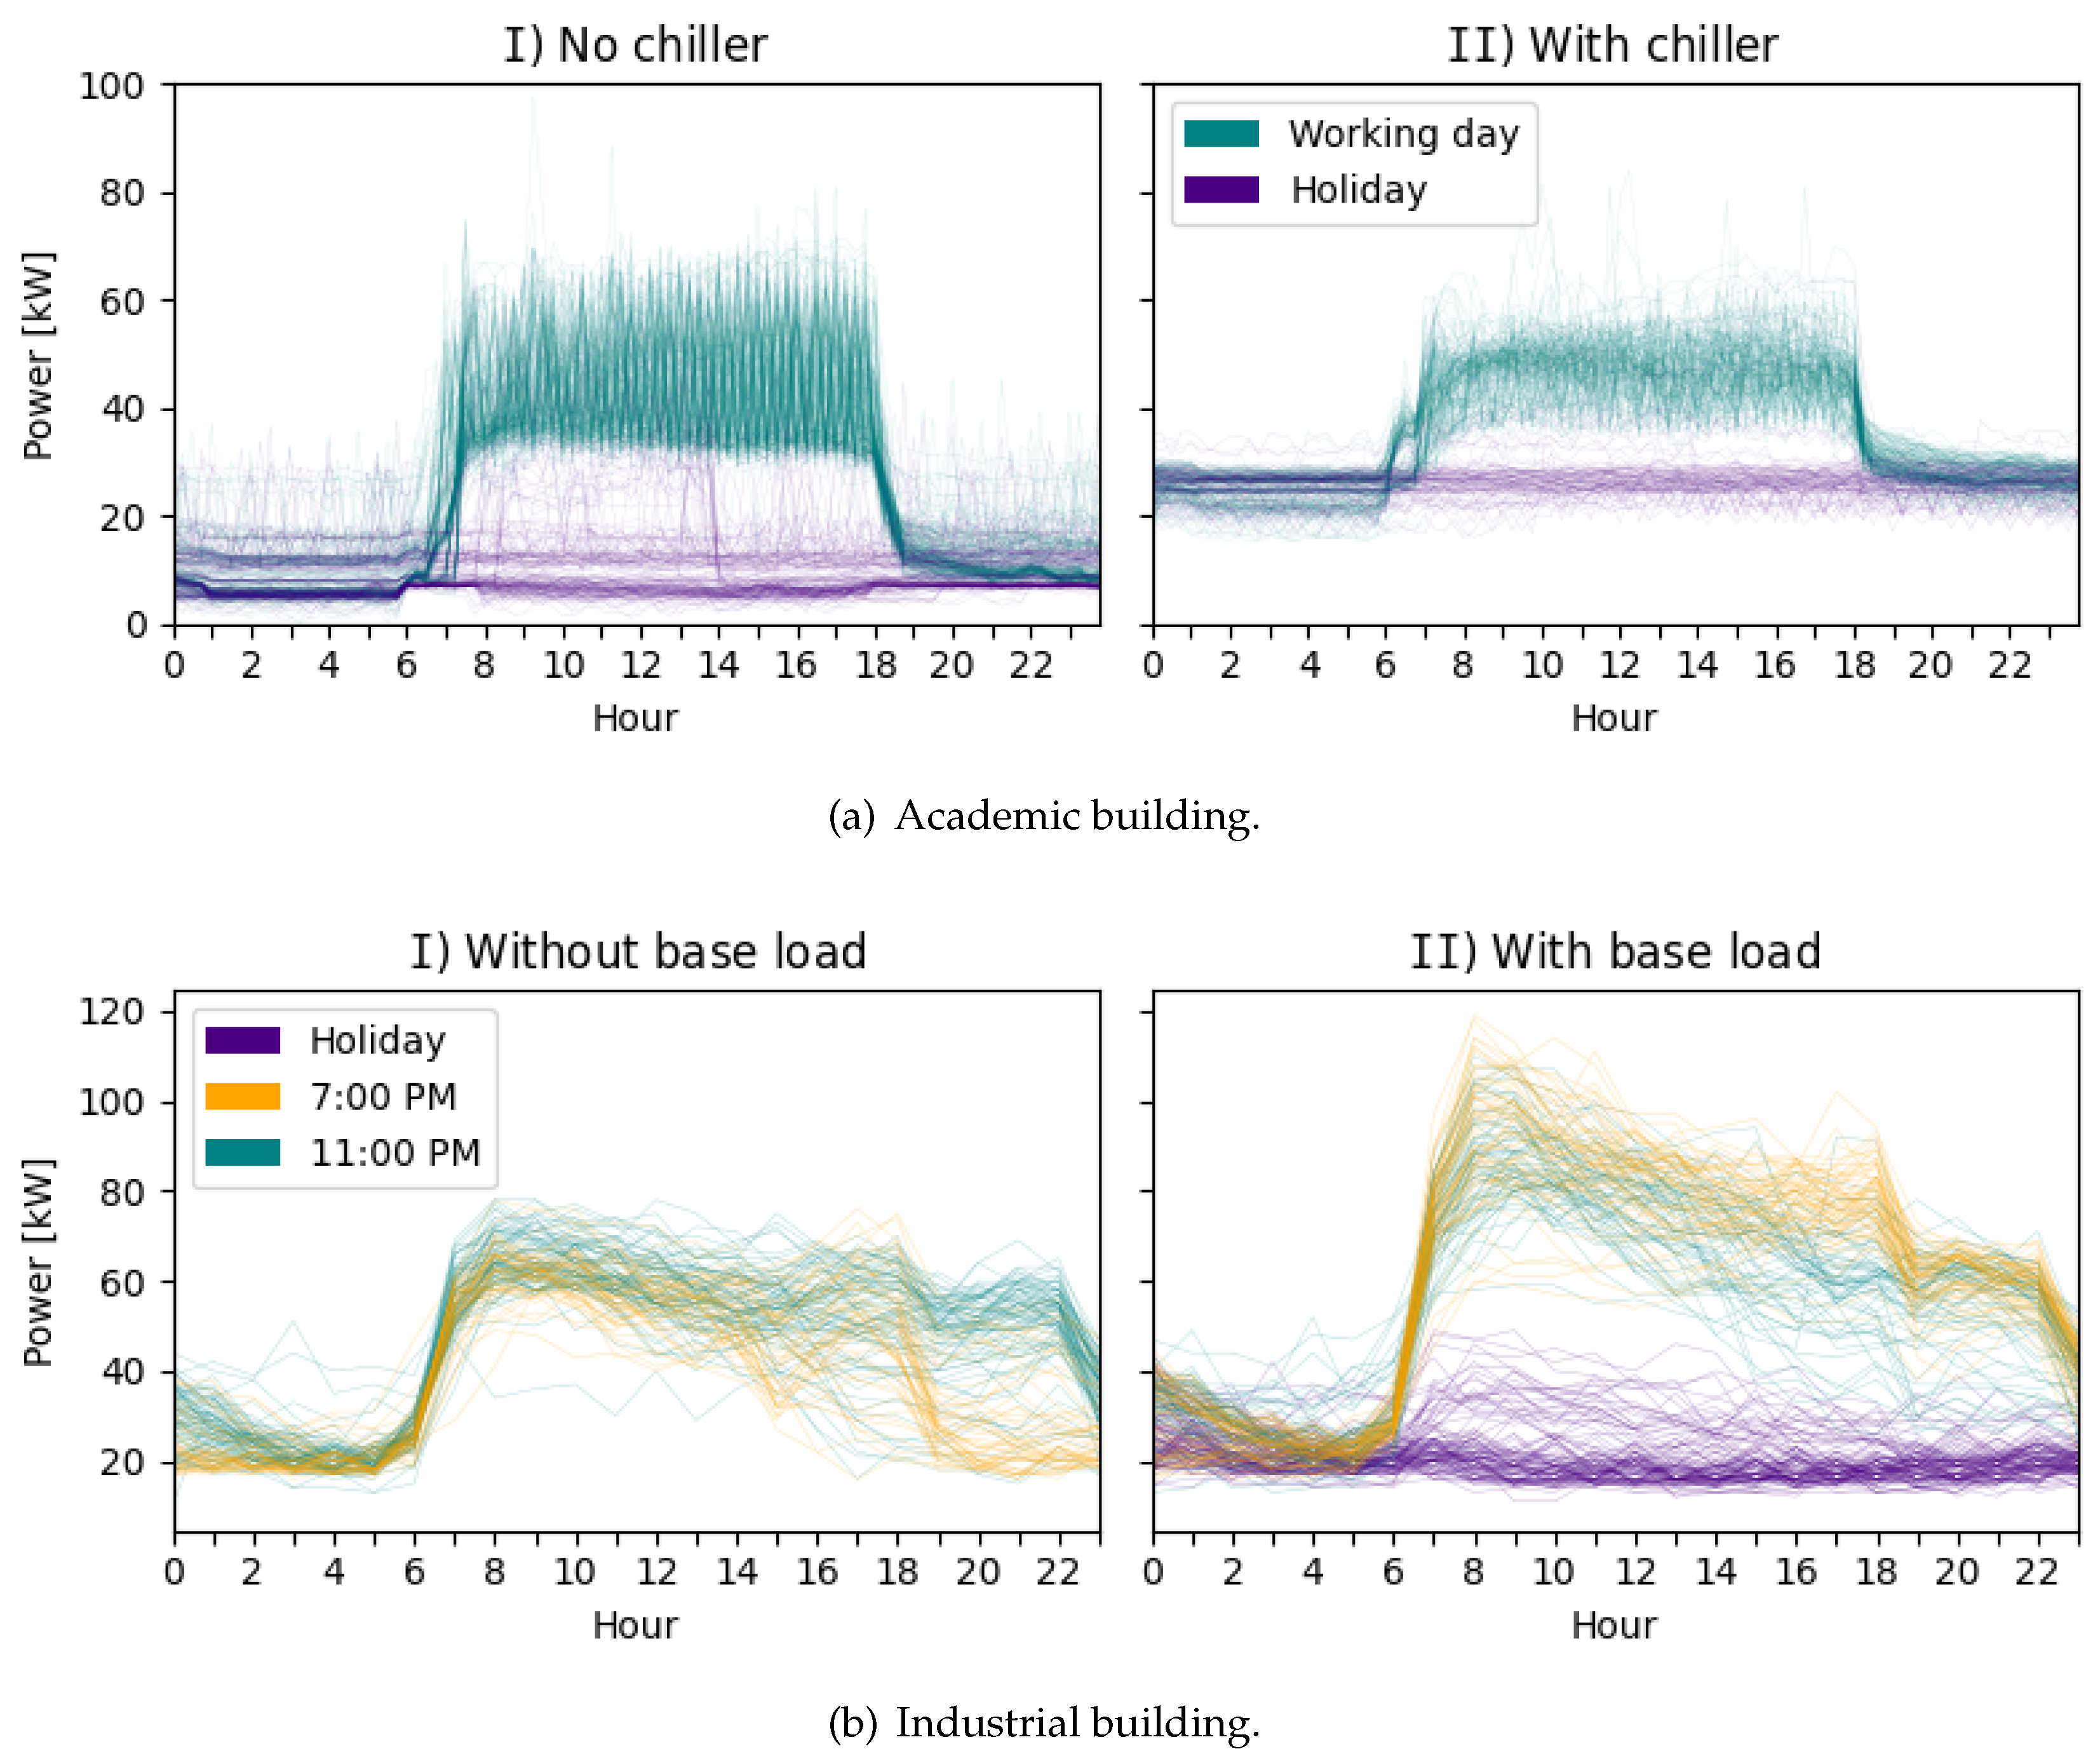
Figure 4.
Evaluation metrics results of both (a) Industrial and (b) Academic building.
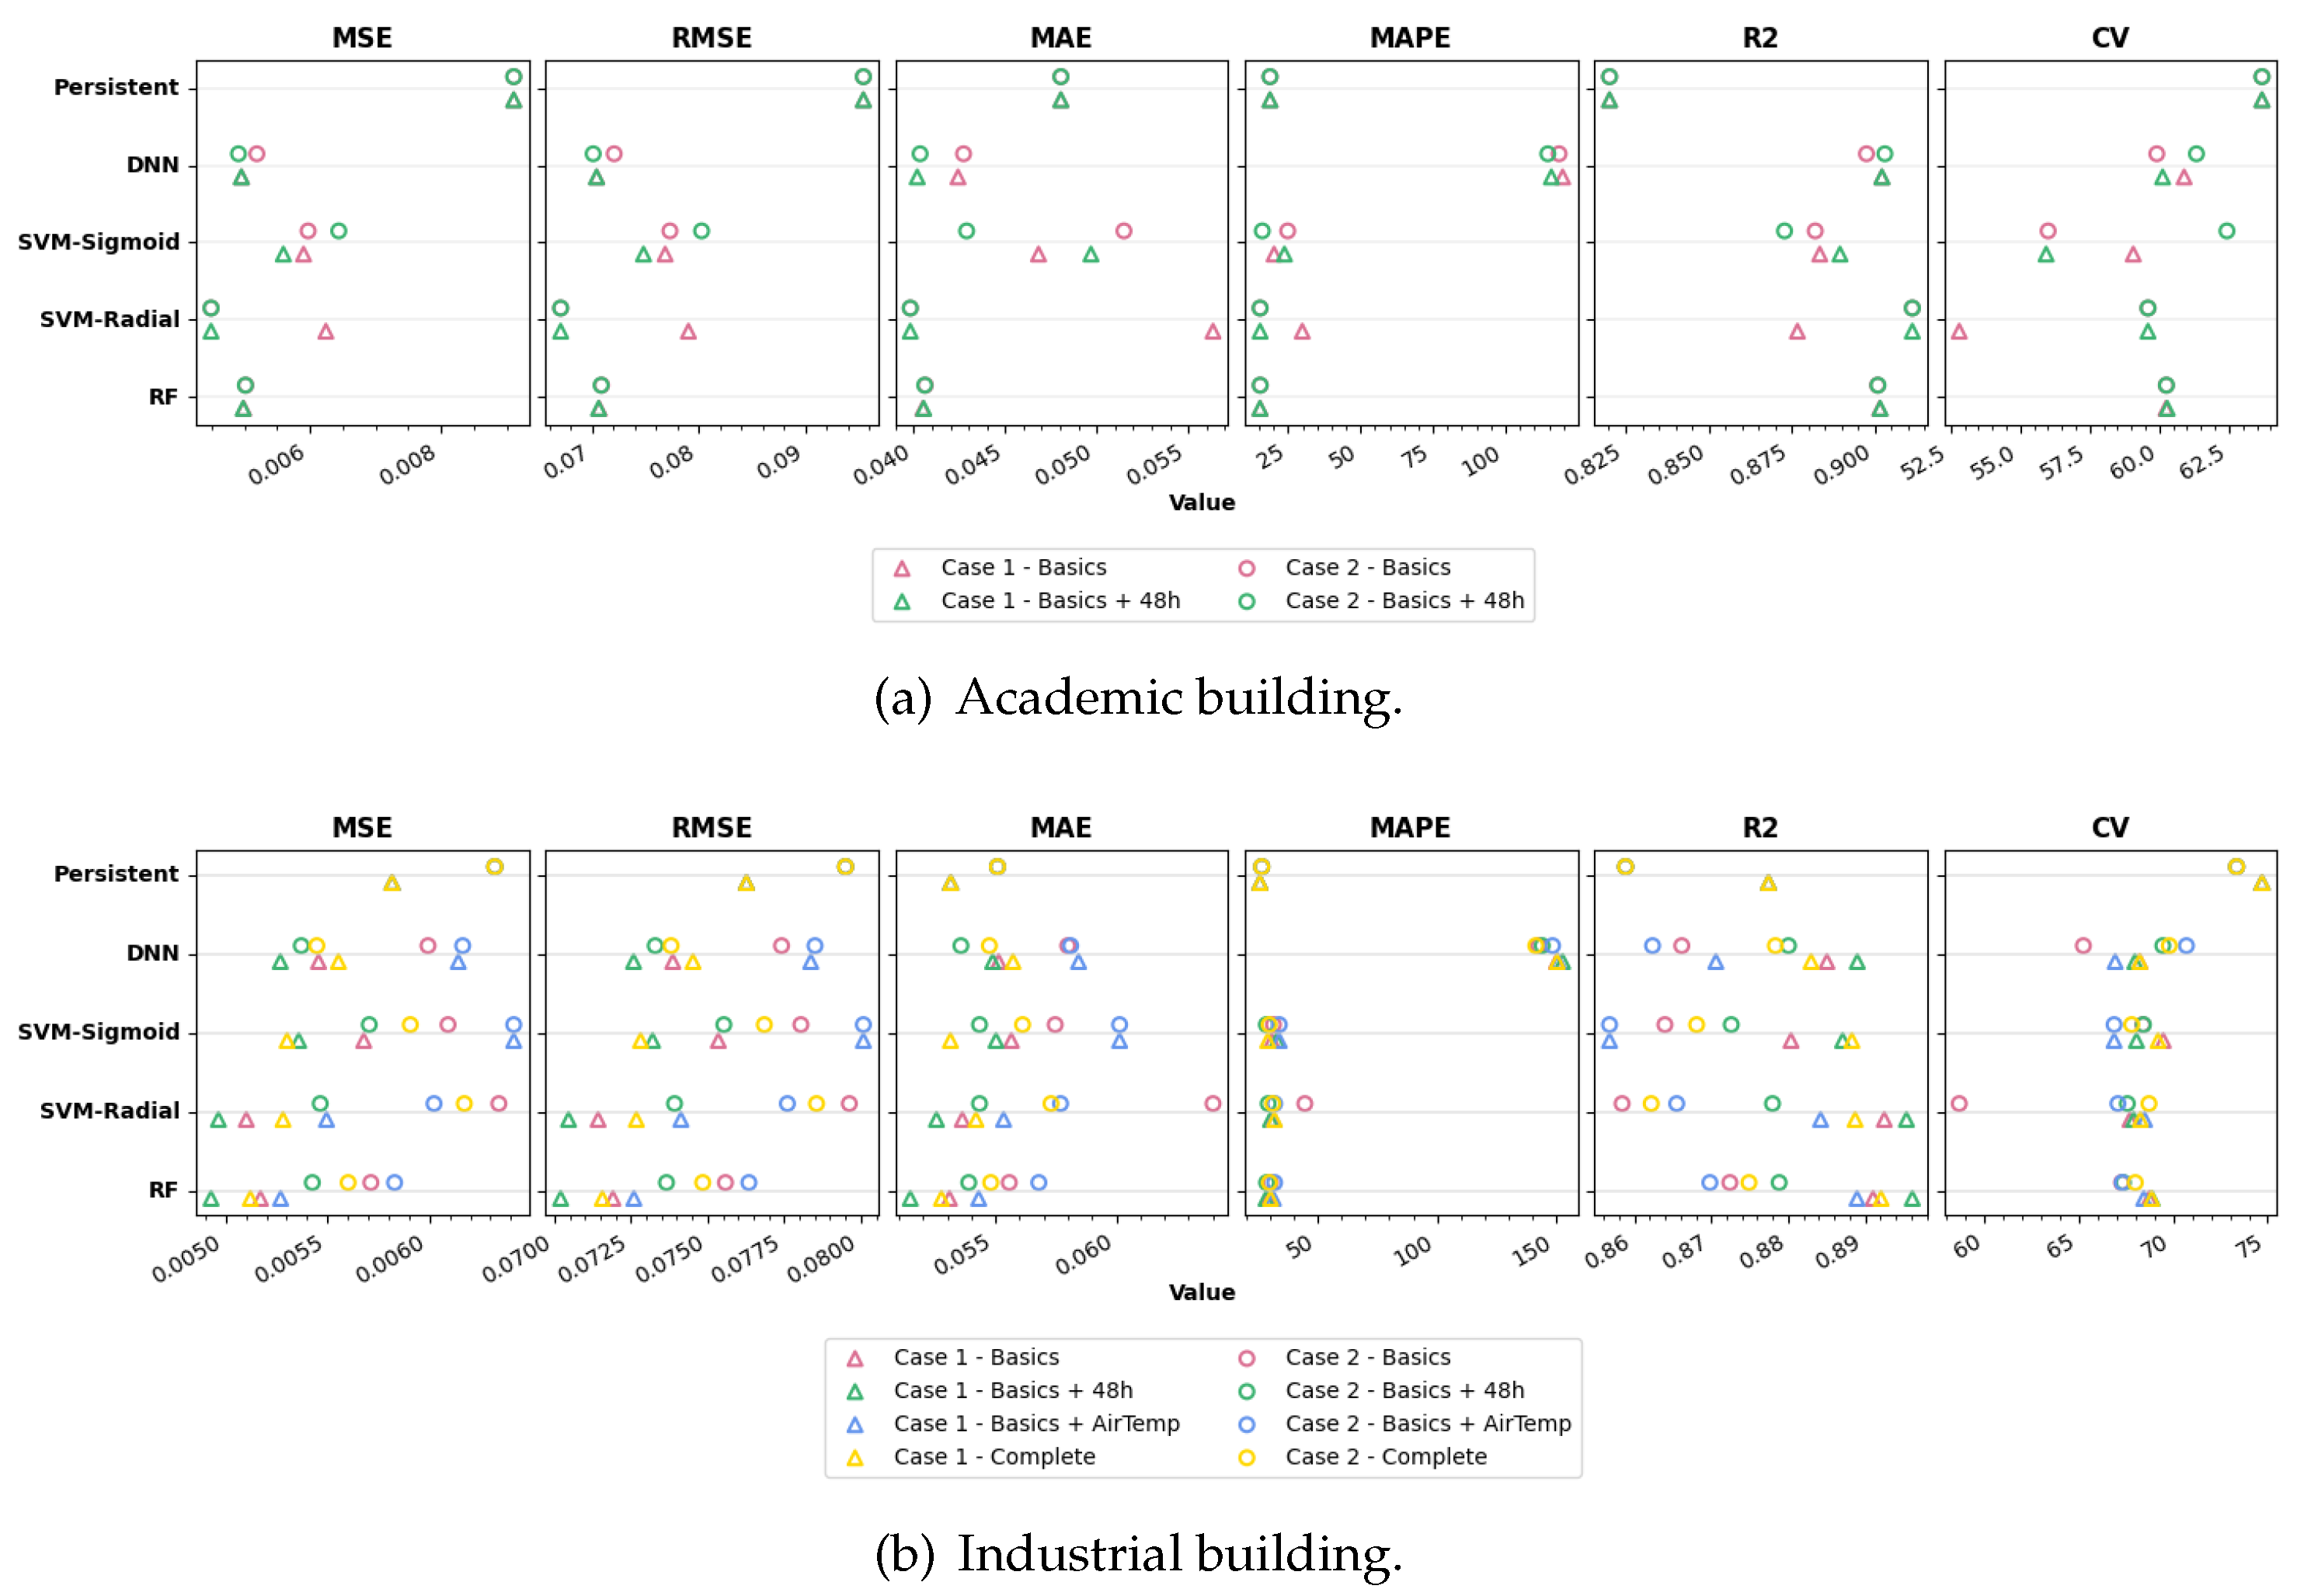
Figure 5.
Correlation between and consumption in Academic building of data division proportions (a) Case 1 and (b) Case 2.
Figure 5.
Correlation between and consumption in Academic building of data division proportions (a) Case 1 and (b) Case 2.
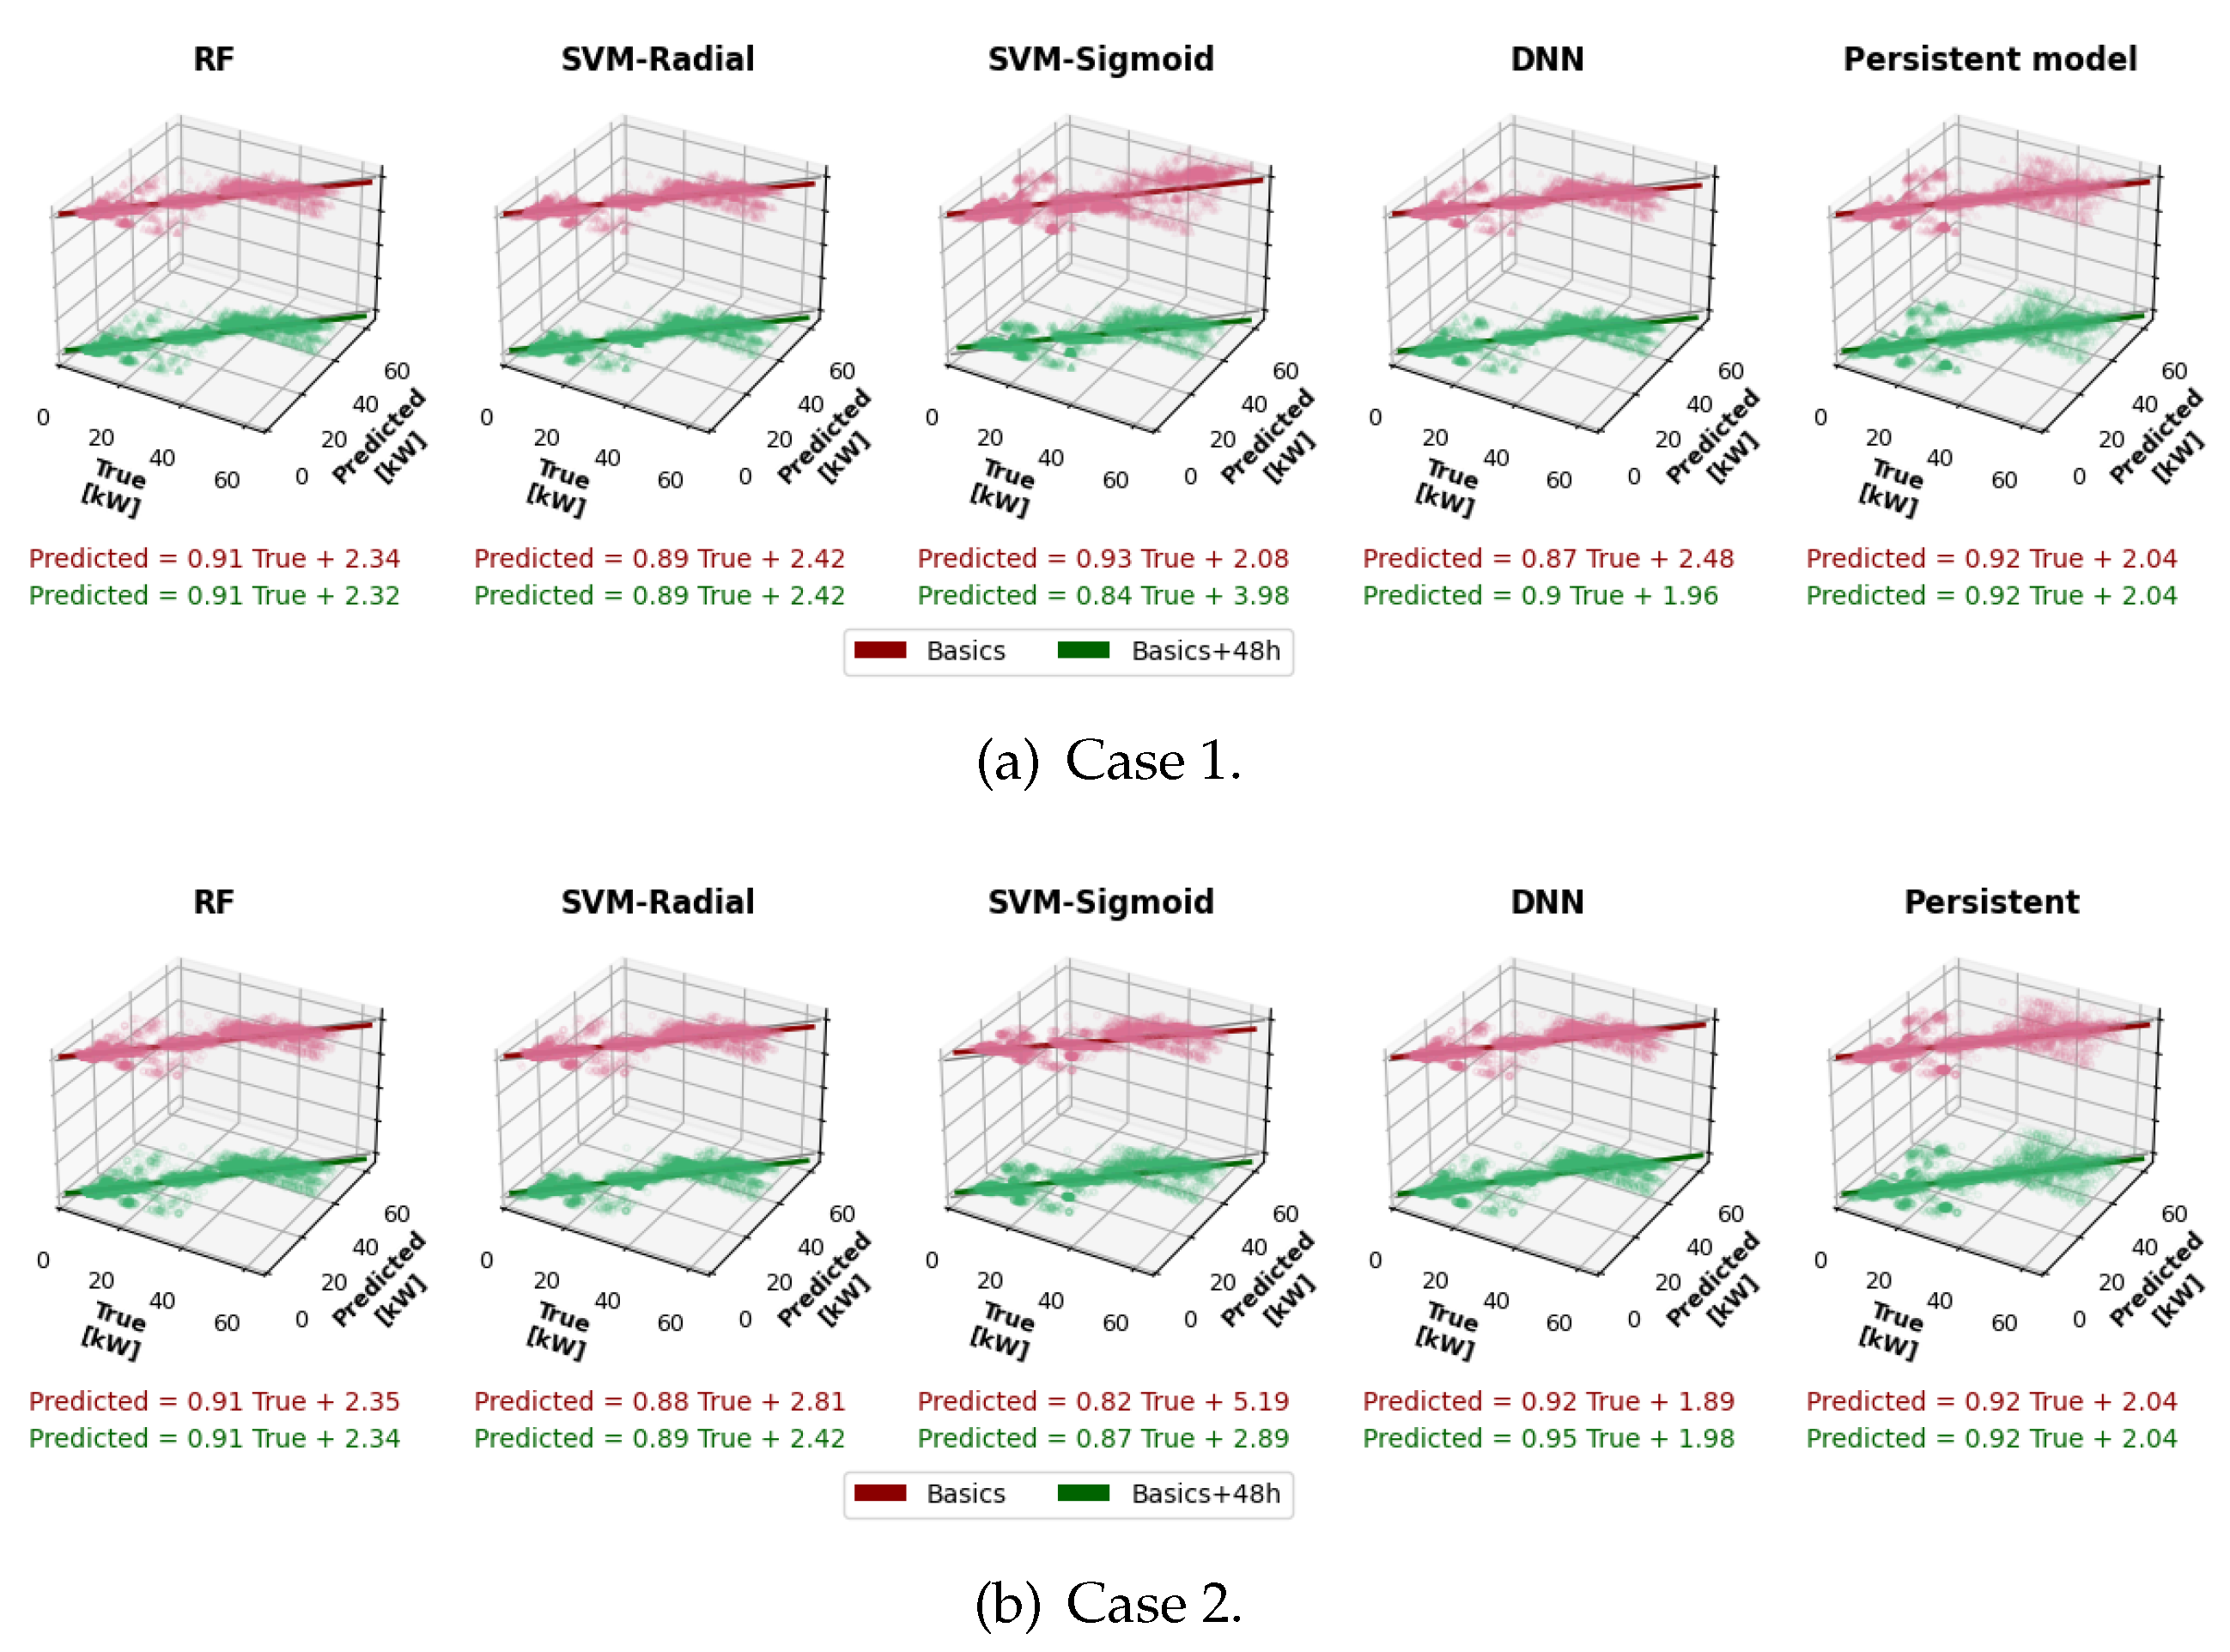
Figure 6.
Correlation between true and predicted power consumption in Industrial building of data division proportions (a) Case 1 and (b) Case 2.
Figure 6.
Correlation between true and predicted power consumption in Industrial building of data division proportions (a) Case 1 and (b) Case 2.
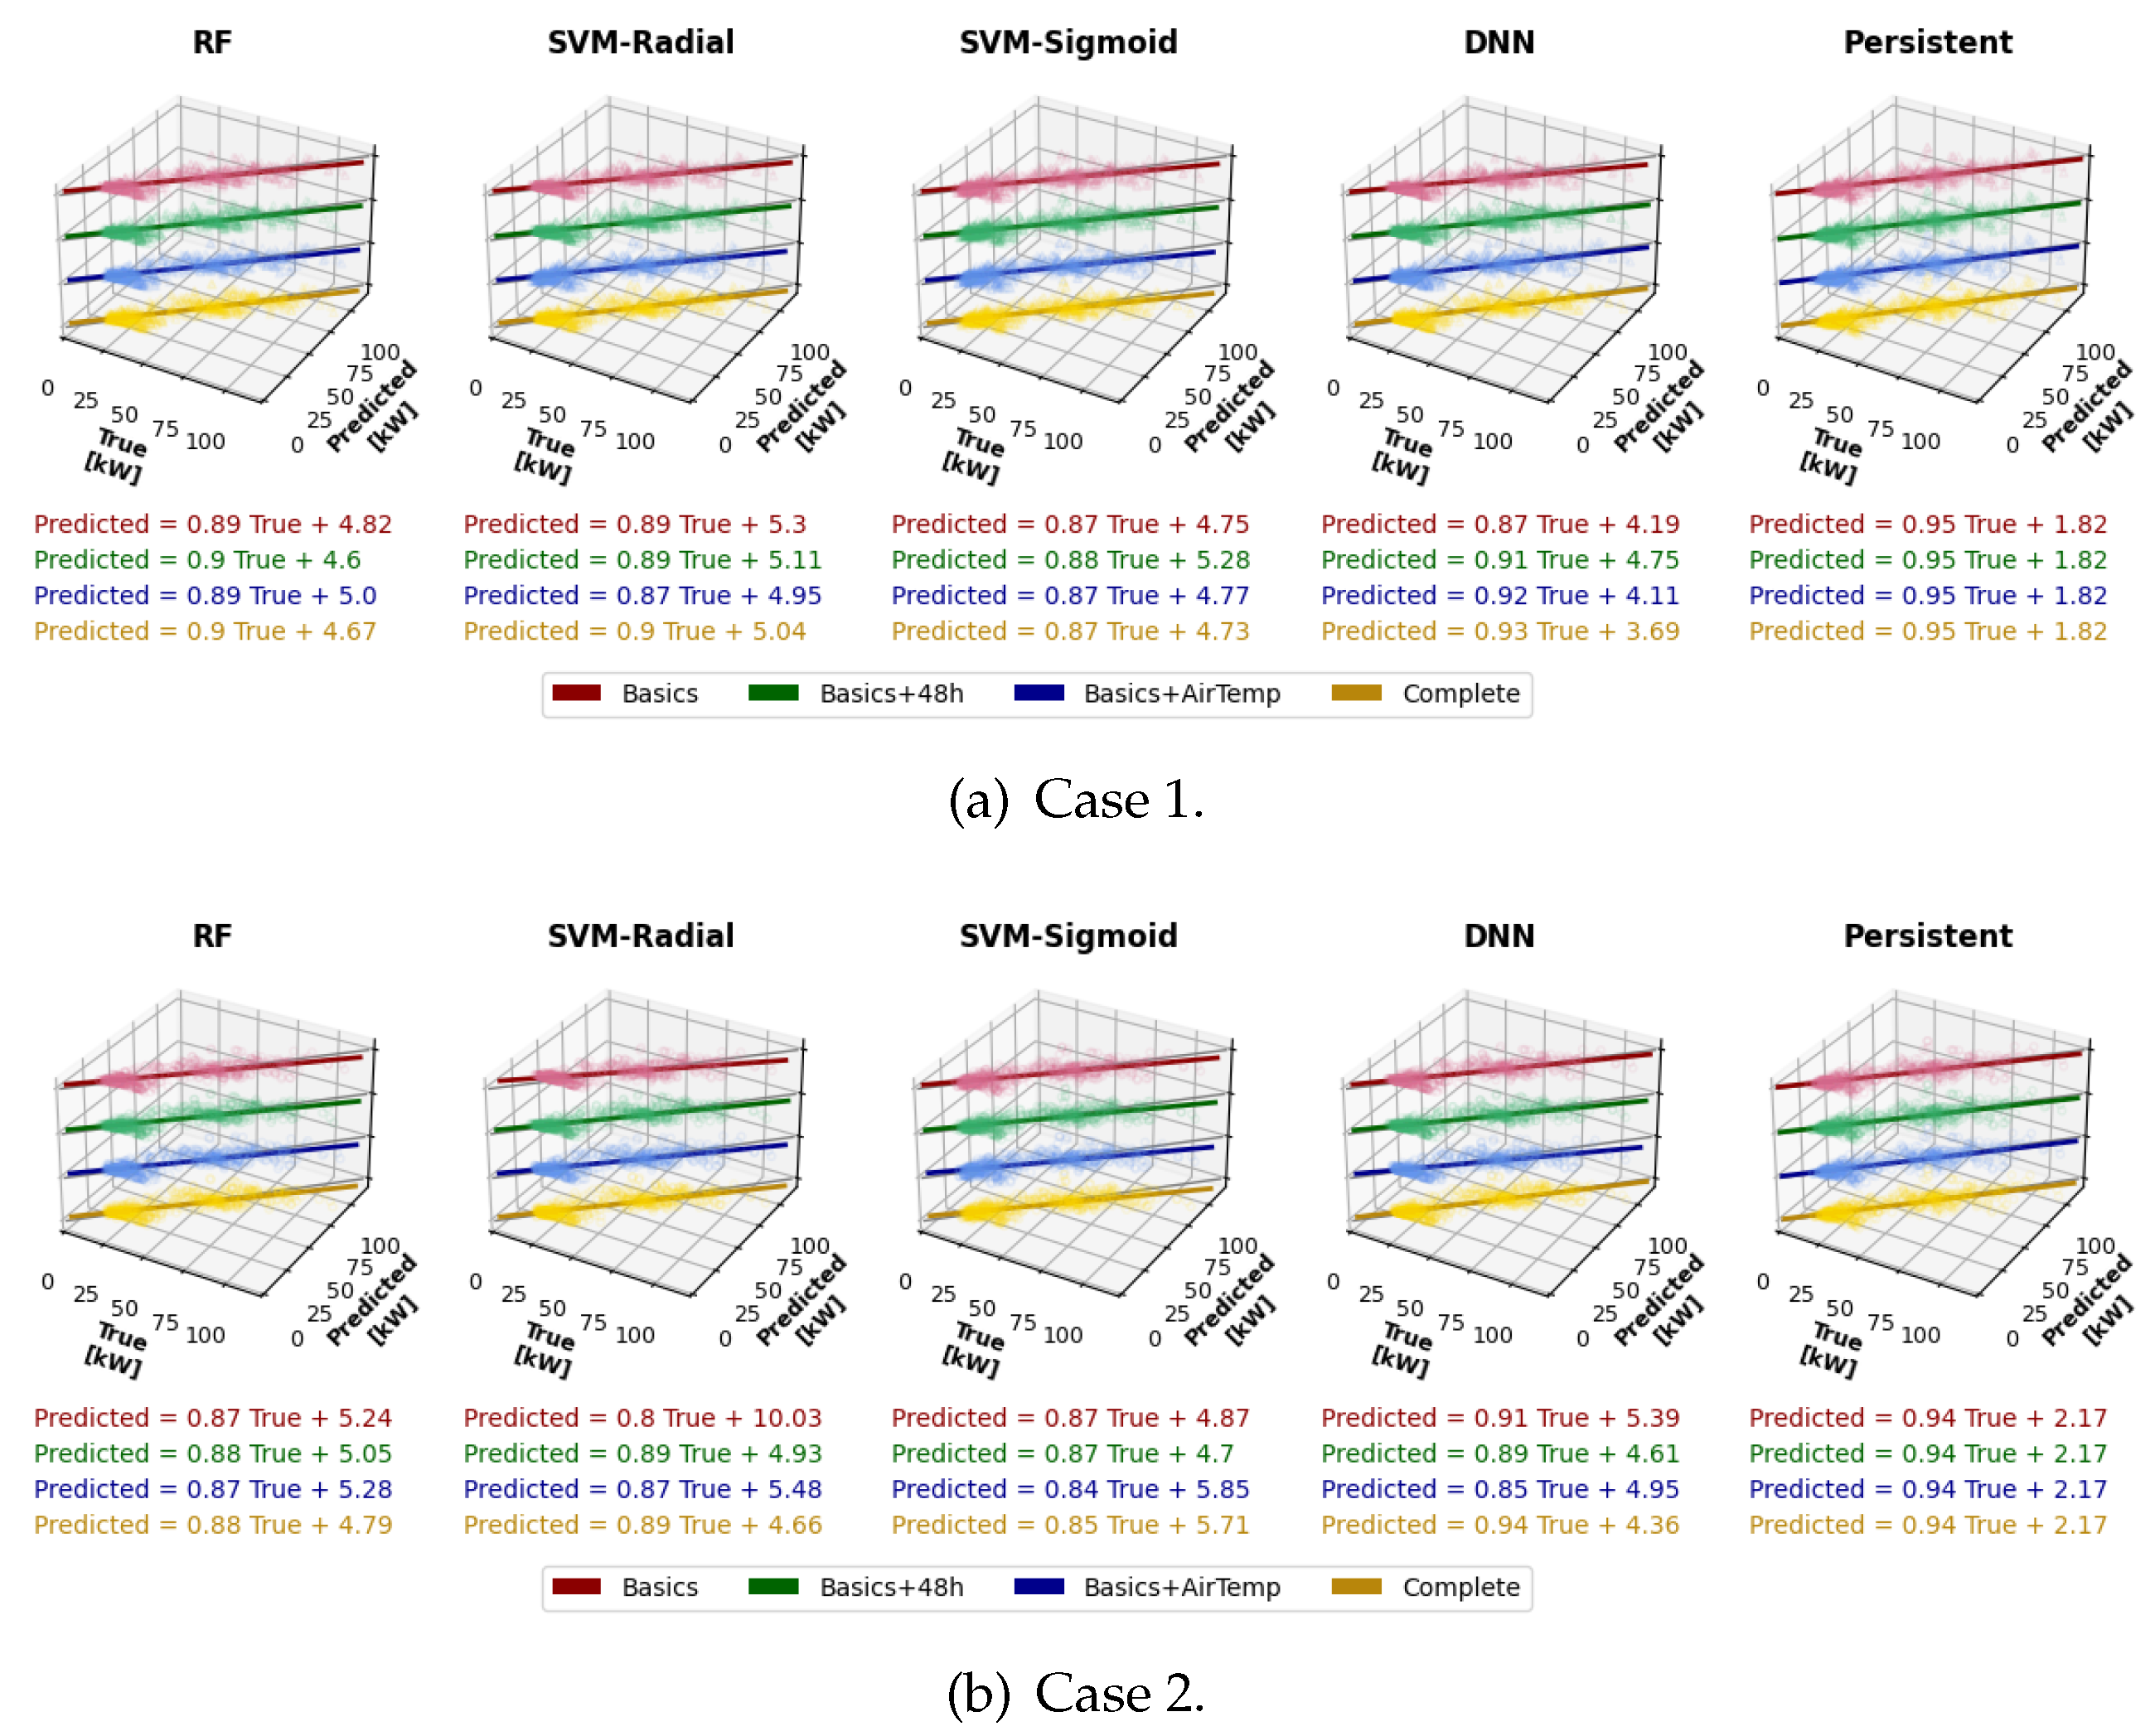
Figure 7.
Absolute error distribution of both (a) Academic and (b) Industrial building.
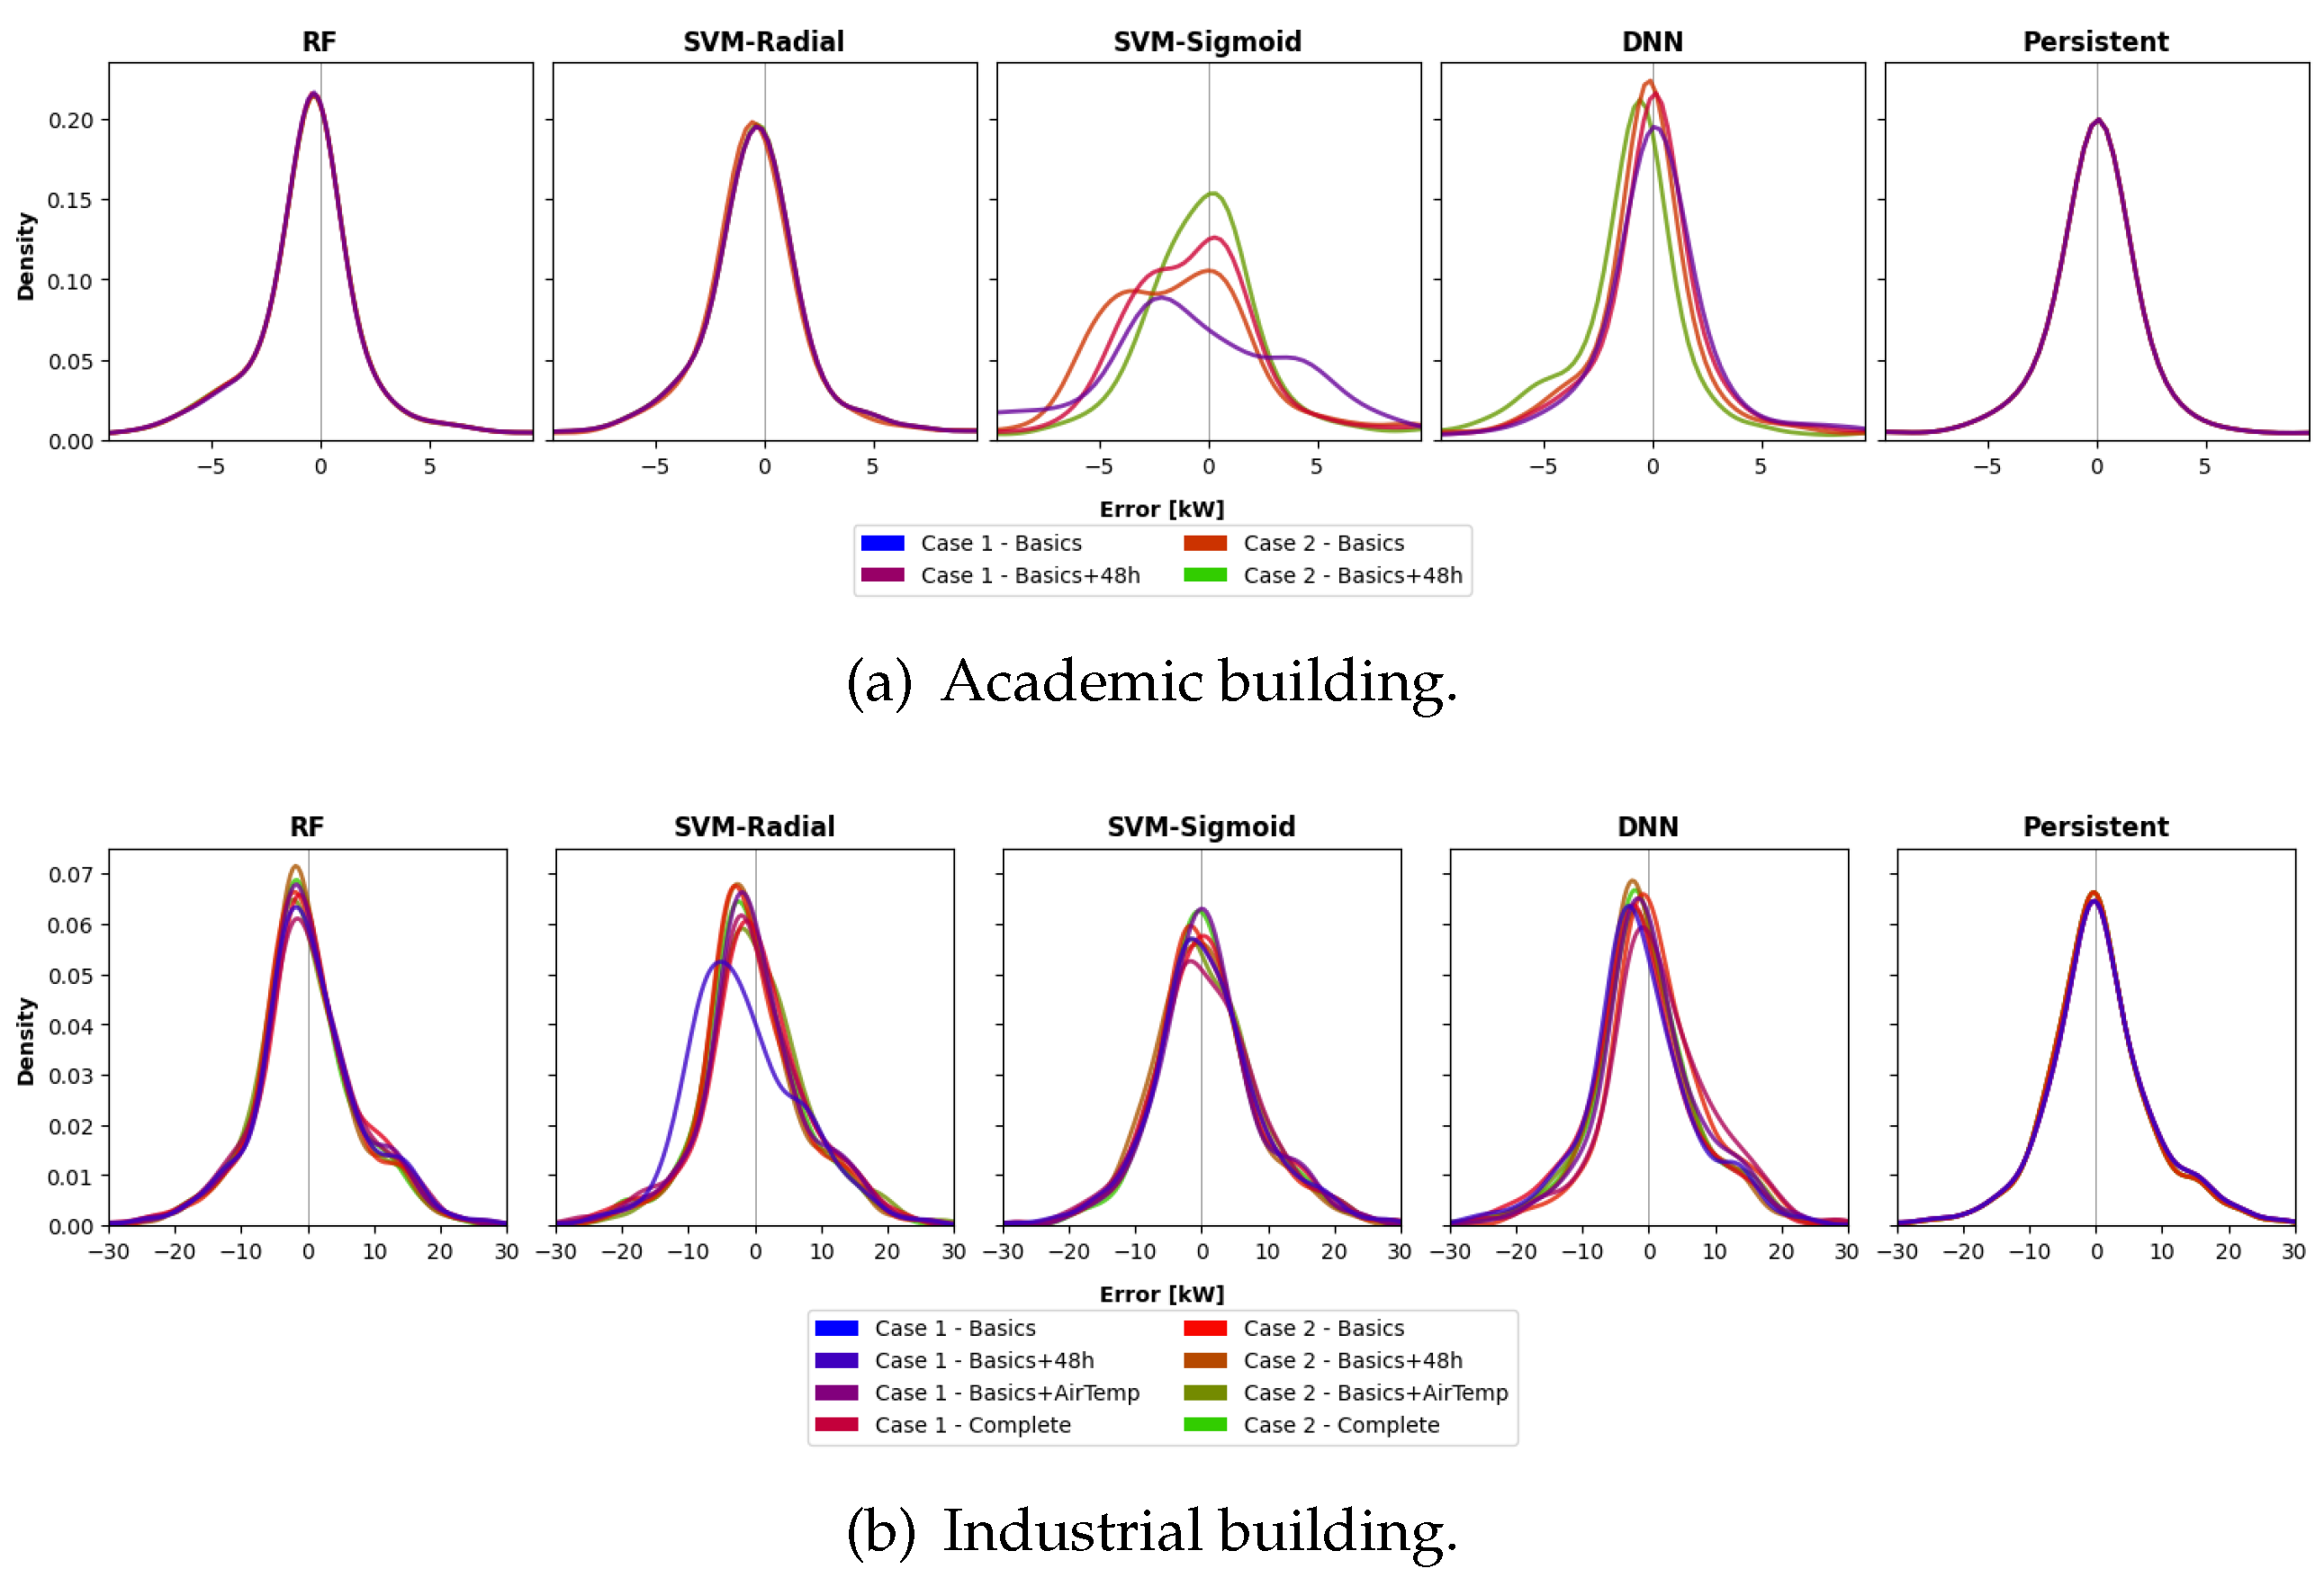
Figure 8.
Prediction of a day for Academic building in both (a) with and (b) without base load.
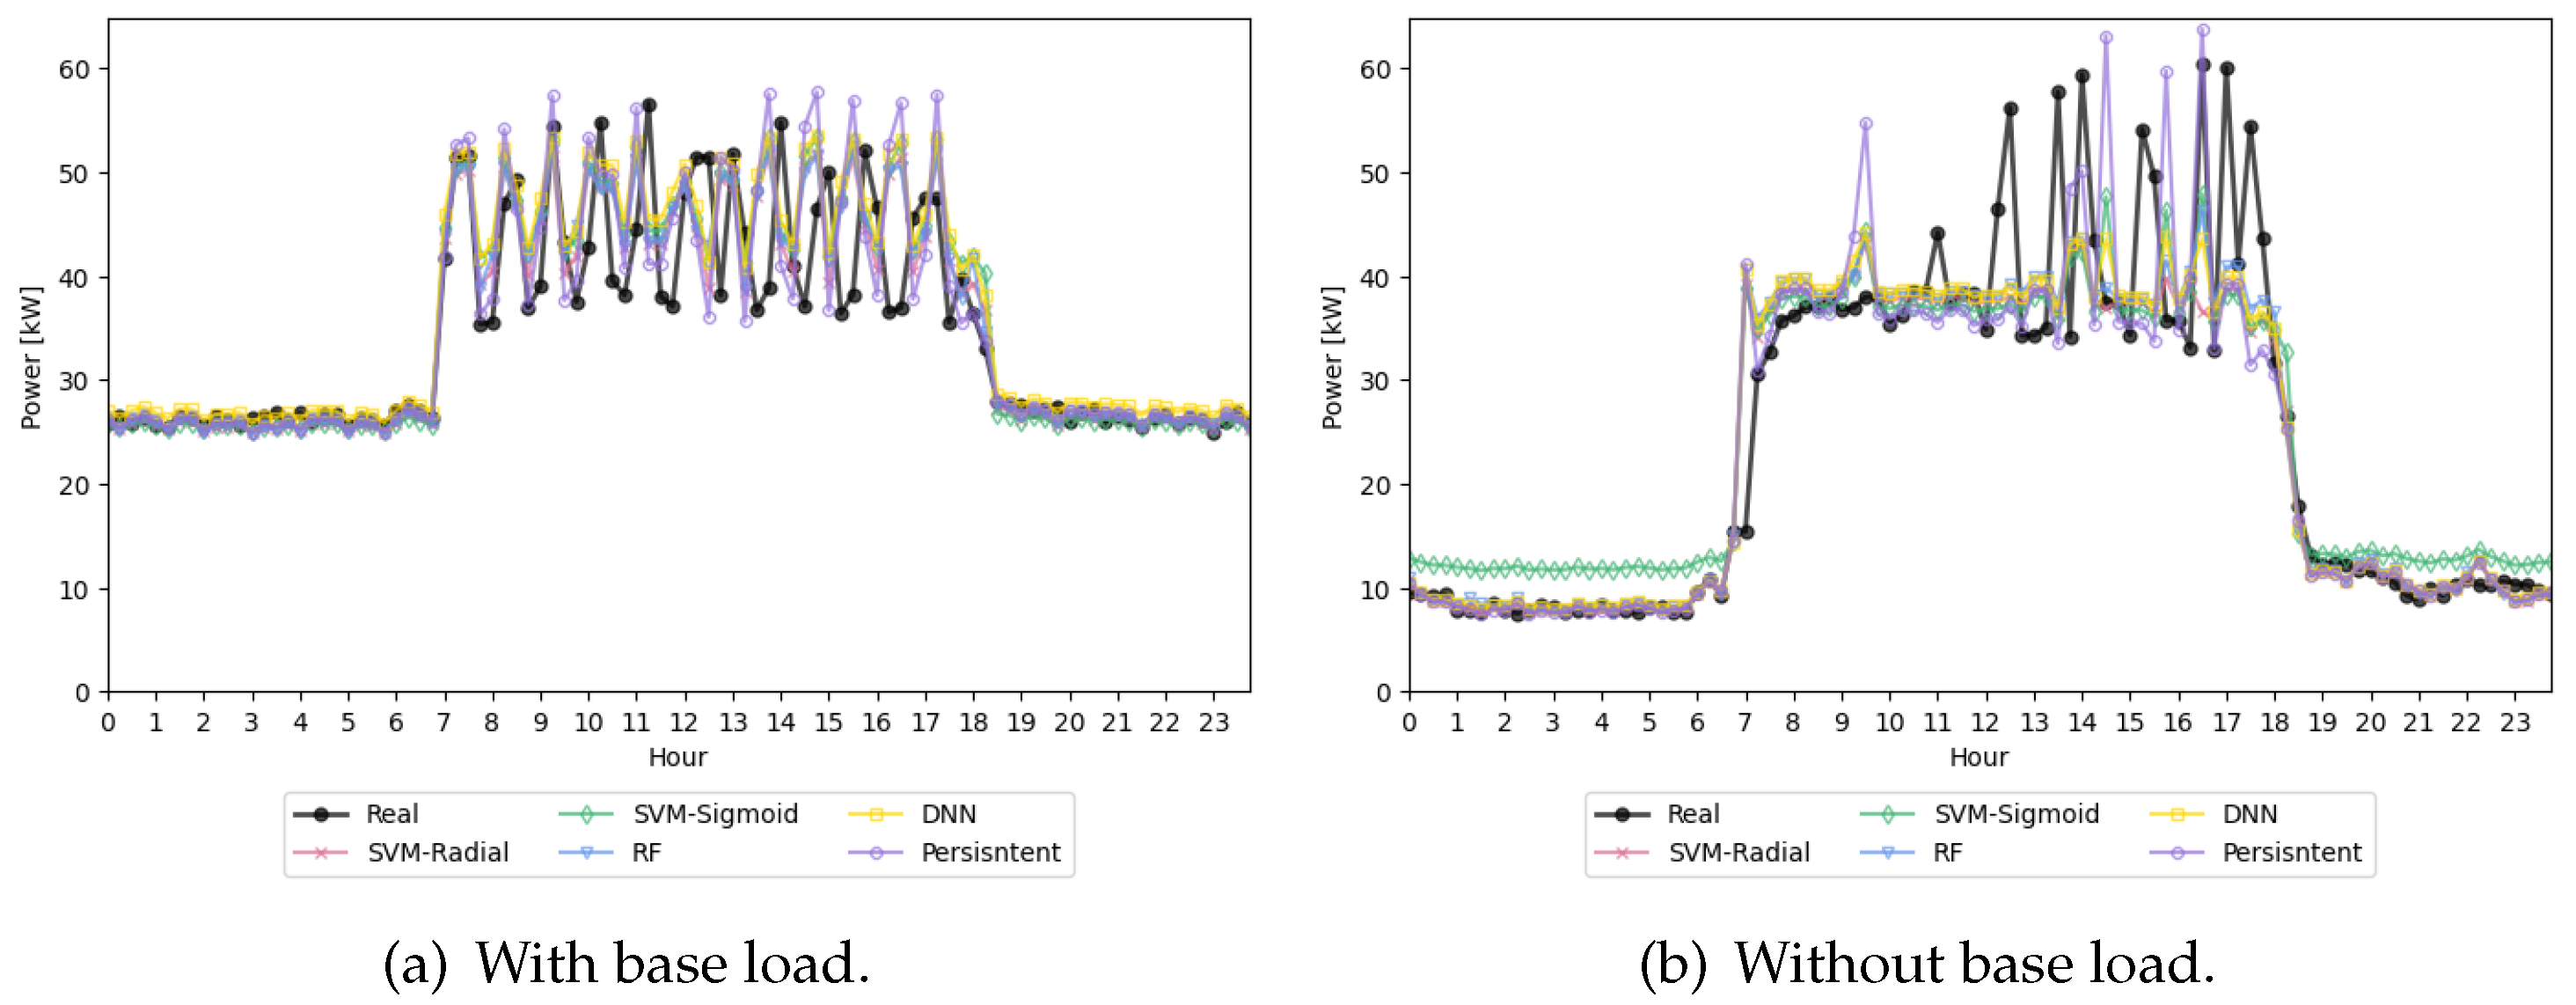
Figure 9.
Prediction of a day for Industrial building in both (a) with and (b) without base load.
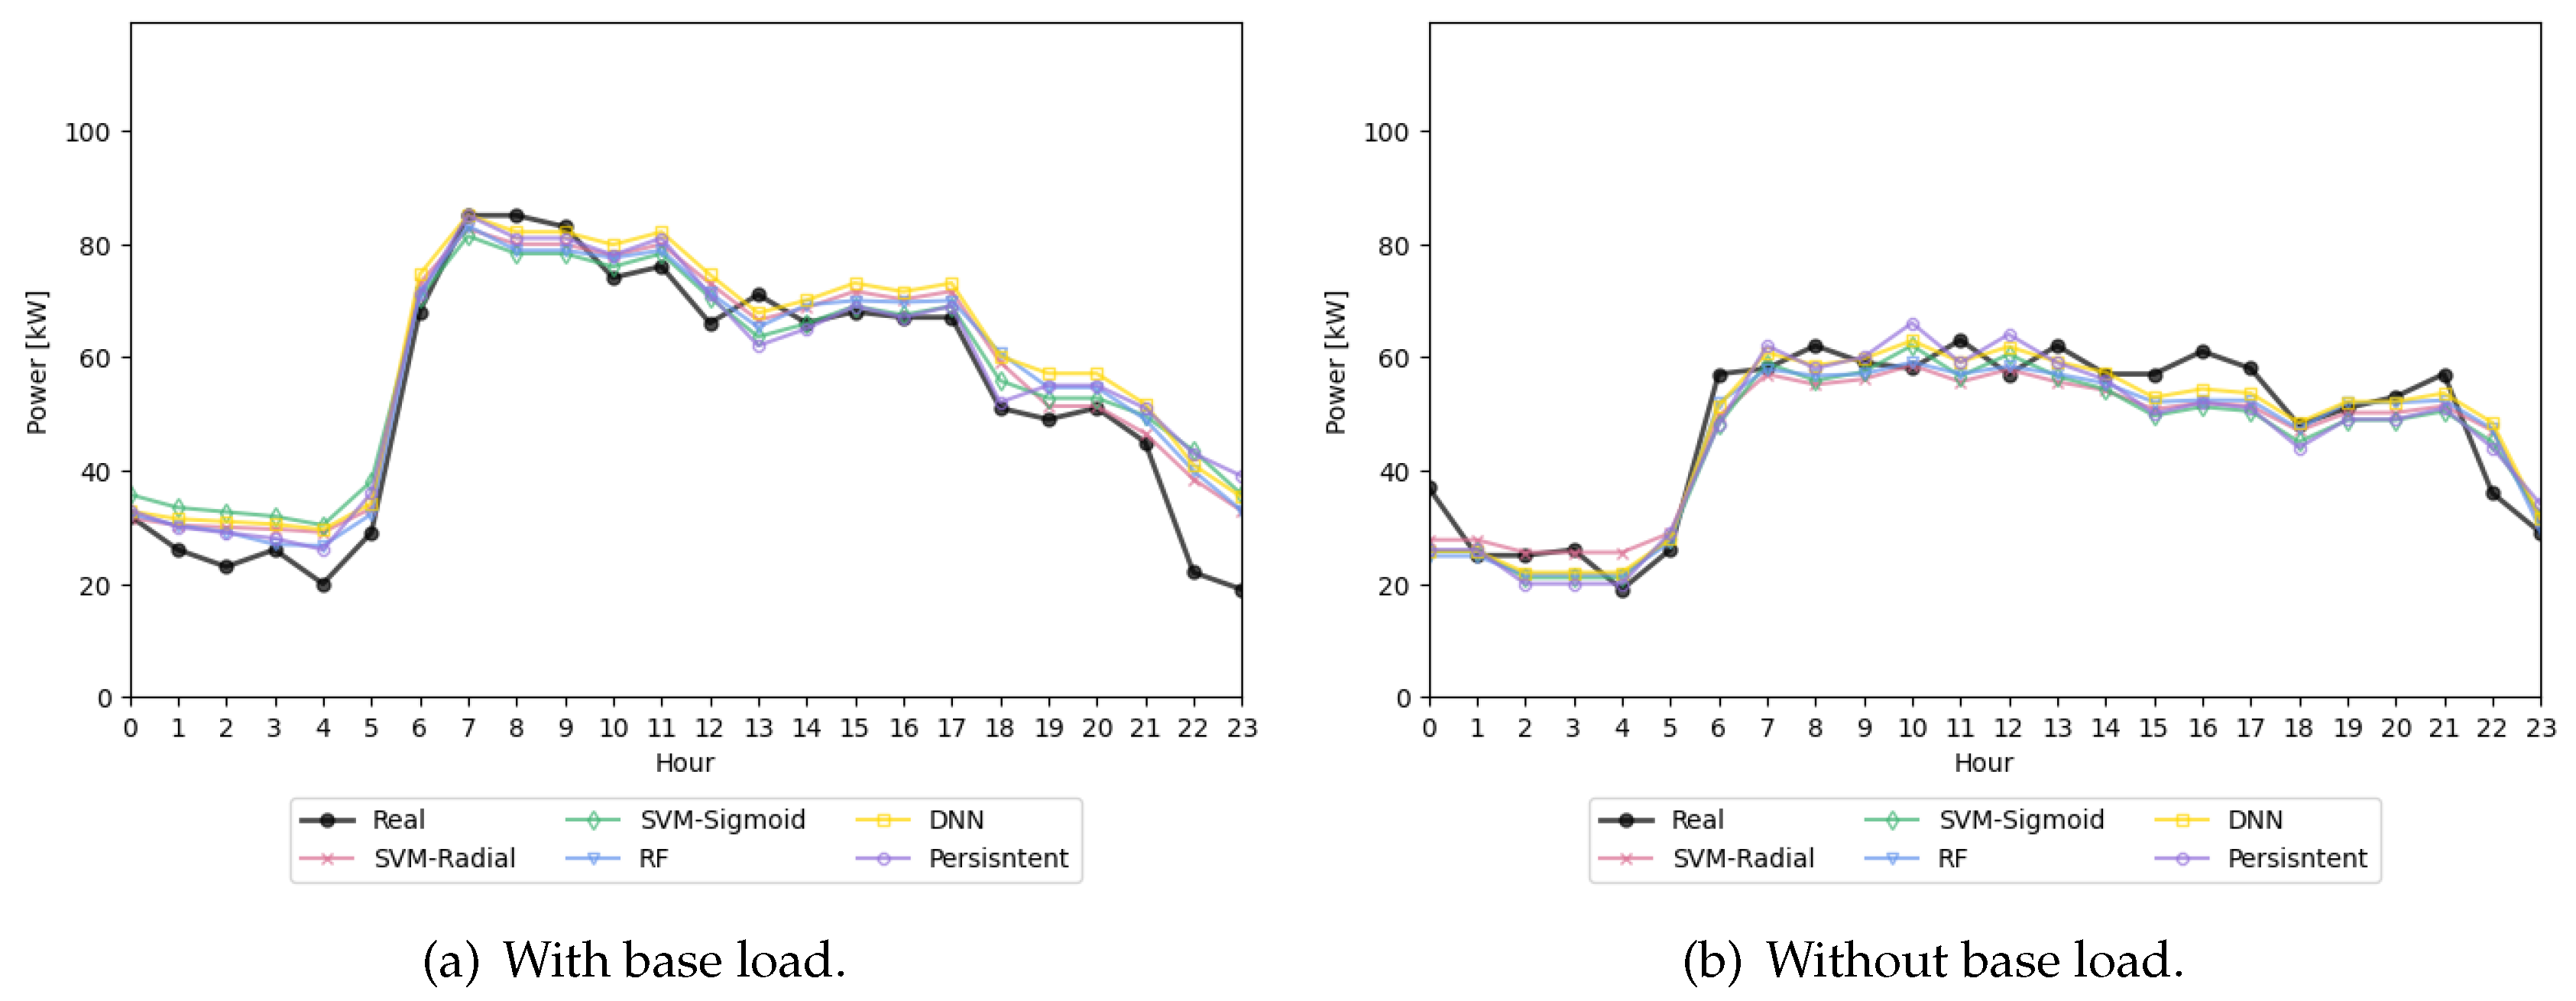

Table 1.
Raw data. Statistics of Academic building.
| Raw Data | Consumption (kW) | ||||||
|---|---|---|---|---|---|---|---|
| Length | Frequency | Days | Min. | Max. | Mean | Stand. dev. | |
| Academic | 92,160 | 15 min | 960 | 0 | 10,410 | 20.24 | 40.87 |
Table 2.
Clean Data. Statistics of both Academic and Industrial building.
| Clean Data | Consumption (kW) | ||||||
|---|---|---|---|---|---|---|---|
| Length | Frequency | Days | Min. | Max. | Mean | Stand. Dev. | |
| Academic | 69,216 | 15 min | 721 | 0.15 | 64.66 | 23.65 | 14.74 |
| Industrial | 8,759 | 1 h | 365 | 10 | 119 | 41.82 | 23.21 |
Table 3.
Correlation between factors concerning the consumption for both Industrial and Academic buildings.
Table 3.
Correlation between factors concerning the consumption for both Industrial and Academic buildings.
| Academic | Industrial | |||
|---|---|---|---|---|
| Working hours | Off-hours | Working hours | Off-hours | |
| Temperature | 0.205508 | 0.012566 | -0.196301 | -0.177106 |
| Irradiation | 0.176214 | 0 | 0.033515 | -0.033712 |
| Workday | Holiday | Workday | Holiday | |
| Pprev 24 h | 0.816096 | 0.926576 | 0.887726 | 0.154234 |
| Pprev 48 h | 0.710268 | 0.915227 | 0.854311 | 0.272240 |
Table 4.
Input features combinations of Academic and Industrial building.
| Label combination | |||||||
|---|---|---|---|---|---|---|---|
| Label | Type | Academic | Industrial | ||||
| Basics |
Basics +48h |
Basics |
Basics +48h |
Basics +AirTemp |
Compl. | ||
| Pprev 24 h | Fractional | • | • | • | • | • | • |
| Holiday | Boolean | • | • | • | • | • | • |
| Base Power | Boolean | • | • | • | • | • | • |
| Work hours | Boolean | • | • | • | • | • | • |
| Air temp. | Boolean | • | • | ||||
| Pprev 48 h | Fractional | • | • | • | |||
Table 5.
Performance comparison of ML models for power prediction in academic and industrial buildings.
Table 5.
Performance comparison of ML models for power prediction in academic and industrial buildings.
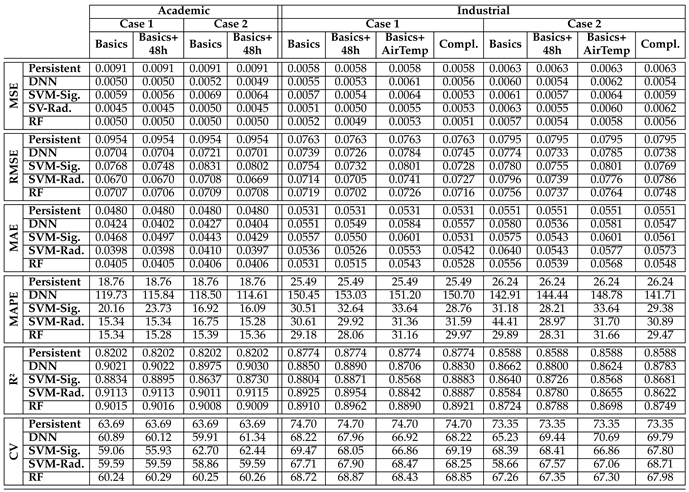
Table 6.
Absolute error summary for both Academic and Industrial buildings.
Disclaimer/Publisher’s Note: The statements, opinions and data contained in all publications are solely those of the individual author(s) and contributor(s) and not of MDPI and/or the editor(s). MDPI and/or the editor(s) disclaim responsibility for any injury to people or property resulting from any ideas, methods, instructions or products referred to in the content. |
© 2024 by the authors. Licensee MDPI, Basel, Switzerland. This article is an open access article distributed under the terms and conditions of the Creative Commons Attribution (CC BY) license (http://creativecommons.org/licenses/by/4.0/).
Copyright: This open access article is published under a Creative Commons CC BY 4.0 license, which permit the free download, distribution, and reuse, provided that the author and preprint are cited in any reuse.


