Submitted:
16 September 2024
Posted:
18 September 2024
You are already at the latest version
Abstract
This paper presents a novel game-theoretic model simulating the global artificial intelligence (AI) development race among nations. We introduce a dynamic system of equations that captures the complex interplay between a country's development level, investment strategies, market share, and the possibility of technological domination. The model incorporates key features of technological races, including returns subject to diminishing marginal utility, exponentially increasing costs, market dynamics, and strategic investment decisions based on relative market positions. Through Monte Carlo simulations, we analyze various scenarios of the AI race, focusing on the emergence of dominant players and the challenges faced by countries attempting to catch up. Our results indicate a tendency towards oligopolistic market structures, with a few countries achieving technological domination while others struggle to close the gap. The model provides insights into the potential trajectories of global AI development and the conditions under which technological leapfrogging might occur. These findings have implications for policymakers and researchers in understanding the dynamics of technological races and formulating strategies for national AI development.
Keywords:
Artificial Intelligence
; Technological Race
; Game Theory
; Monte Carlo Simulation
; Technological Domination
; Catch-up Dynamics
; National Development Strategies
; Global Competition
; Innovation Policy
; Technological Leapfrogging
Section 1. Introduction:
The race for artificial intelligence (AI) supremacy has emerged as a defining feature of 21st-century geopolitics, with nations vying for technological dominance in a field poised to reshape the global order. As Horowitz (2018) aptly notes, “Artificial intelligence has the potential to be as transformative as the steam engine or electricity,” underscoring the high stakes of this technological competition.
The current AI landscape is characterized by intense rivalry, primarily led by the United States and China, with other nations striving to carve out their niches. This duopolistic structure, however, is not set in stone. As Lee (2018) argues in “AI Superpowers,” the AI race is not merely about technological prowess but also about data availability, regulatory environments, and national strategies. The potential for disruption and “technological leapfrogging” remains a constant threat to established leaders.
Moreover, the implications of AI dominance extend far beyond economic gains. Kania (2018) highlights the military dimensions of AI development, suggesting that AI could fundamentally alter the nature of warfare and national security. This multifaceted impact of AI supremacy adds layers of complexity to national strategies and international relations.
Despite the critical nature of this technological race, there is a dearth of quantitative models that capture its dynamic and strategic nature. While qualitative analyses abound (e.g., Horowitz, 2018; Lee, 2018), they often lack the rigorous, systematic approach needed to predict outcomes and test policy interventions.
Our research aims to address this gap by developing a game-theoretic model of the global AI race. Drawing inspiration from classic models of arms races (Richardson, 1960) and technological competition (Reinganum, 1989), we propose a novel system of equations that encapsulates the key dynamics of AI development competition. Our model incorporates crucial elements such as:
- -
- The relationship between investment and technological progress
- -
- The effects of market share on development speed
- -
- The possibility of technological breakthroughs and “leapfrogging”
- -
- The risk of “dropping out” of the race due to insurmountable leads by competitors
By employing Monte Carlo simulations, we explore various scenarios of this AI race, focusing on the emergence of dominant players and the challenges faced by countries attempting to catch up. Our approach allows for a systematic examination of how different initial conditions, investment strategies, and chance events can shape the outcome of this critical technological competition.
This paper not only contributes to the theoretical understanding of technological races but also offers practical insights for policymakers grappling with national AI strategies. As nations invest billions in AI development (Castro et al., 2019), our model provides a framework for assessing the potential outcomes of these investments and the strategic considerations that should guide them.
In the following sections, we will detail our model’s structure, present the results of our simulations, and discuss the implications of our findings for the future of global AI development and international relations.
Section 2. Methodology
Variables:
Let:
- represent the index of a country.
- denote time, measured in months.
- be the development level of country at time .
- be the investment level of country at time .
- denote the return for country at time .
- denote the cost for country at time .
- represent the profit of country at time .
- represent the market share of country at time .
1. Return Function:
The return for country is a function of the development level and investment , capped at :
This ensures that returns grow with development and investment, but with diminishing returns due to the exponential decay in investment efficiency, and are capped at .
2. Cost Function:
The cost incurred by country is an exponential function of its development level and investment:
Here, higher investments lead to exponentially increasing costs, reflecting the increasing difficulty of further development.
3. Profit Function:
The profit is the difference between the return and the cost:
This equation captures the net result of development efforts for country .
5. Development Level Update:
The development level
evolves depending on the country’s performance:
- If (indicating a near-monopolistic return), development accelerates:
- If and (indicating another country is dominating, but is still lagging), development grows more modestly:
- Otherwise, development growth is a combination of market share , investment , and a baseline growth factor:
6. Investment Level Update:
The investment for country is updated based on its performance in the market:
- If :
- If and :
- Otherwise, the investment update depends on the market share and is influenced by a random uniform distribution :
This reflects that small market shares trigger more aggressive investment, while large market shares result in more cautious adjustments.
7. Domination Condition:
A country is considered to dominate the AI race if:
This condition represents the scenario where a country captures almost all of the market returns, effectively dominating the race.
8. Stopping Condition:
A country stops participating in the AI race if its profit is significantly negative. The probability that country stops at time is given by:
This reflects a simple rule where countries with sustained losses have a chance to drop out.
Summary:
These equations model a competitive AI development race between countries, with feedback loops between development, market share, investment, and costs. The model captures key features of real world competition, such as increasing costs with greater investment, diminishing returns, and the potential for market domination.
Section 3. Results
Please see attachment for Python Code.
Analyzing multiple simulations:
- Simulation 1 results:
- USA: Final return = 1.00e+09, Dominated = True
- China: Final return = 1.00e+09, Dominated = True
- India: Final return = 2.77e+08, Dominated = False
- Germany: Final return = 8.37e+08, Dominated = False
- Russia: Final return = 1.96e+08, Dominated = False
Simulation 2 results:
USA: Final return = 1.00e+09, Dominated = True
China: Final return = 1.00e+09, Dominated = True
India: Final return = 4.83e+08, Dominated = False
Germany: Final return = 1.00e+09, Dominated = True
Russia: Final return = 3.56e+08, Dominated = False
- Simulation 3 results:
- USA: Final return = 1.00e+09, Dominated = True
- China: Final return = 1.00e+09, Dominated = True
- India: Final return = 6.38e+08, Dominated = False
- Germany: Final return = 1.00e+09, Dominated = True
- Russia: Final return = 2.75e+08, Dominated = False
Simulation 4 results:
USA: Final return = 1.00e+09, Dominated = True
China: Final return = 2.93e+08, Dominated = False
India: Final return = 5.24e+08, Dominated = False
Germany: Final return = 1.00e+09, Dominated = True
Russia: Final return = 3.15e+08, Dominated = False
- Simulation 5 results:
- USA: Final return = 1.00e+09, Dominated = True
- China: Final return = 1.00e+09, Dominated = True
- India: Final return = 4.18e+08, Dominated = False
- Germany: Final return = 8.52e+08, Dominated = False
- Russia: Final return = 2.80e+08, Dominated = False
Simulation 6 results:
USA: Final return = 1.00e+09, Dominated = True
China: Final return = 1.00e+09, Dominated = True
India: Final return = 3.70e+08, Dominated = False
Germany: Final return = 1.00e+09, Dominated = True
Russia: Final return = 2.35e+08, Dominated = False
- Simulation 7 results:
- USA: Final return = 1.00e+09, Dominated = True
- China: Final return = 1.00e+09, Dominated = True
- India: Final return = 3.37e+08, Dominated = False
- Germany: Final return = 1.00e+09, Dominated = True
- Russia: Final return = 3.42e+08, Dominated = False
Simulation 8 results:
USA: Final return = 1.00e+09, Dominated = True
China: Final return = 1.00e+09, Dominated = True
India: Final return = 4.83e+08, Dominated = False
Germany: Final return = 9.92e+08, Dominated = False
Russia: Final return = 2.83e+08, Dominated = False
- Simulation 9 results:
- USA: Final return = 1.00e+09, Dominated = True
- China: Final return = 1.00e+09, Dominated = True
- India: Final return = 4.16e+08, Dominated = False
- Germany: Final return = 1.00e+09, Dominated = True
- Russia: Final return = 1.82e+08, Dominated = False
Simulation 10 results:
USA: Final return = 1.00e+09, Dominated = True
China: Final return = 1.00e+09, Dominated = True
India: Final return = 3.22e+08, Dominated = False
Germany: Final return = 1.00e+09, Dominated = True
Russia: Final return = 3.31e+08, Dominated = False
- Overall Domination Results:
- USA: 10 times (100.00%)
- China: 9 times (90.00%)
- Germany: 7 times (70.00%)
Simulations without Domination: -16
Average maximum return: 1.00e+09
Highest maximum return: 1.00e+09
Graph 1-4.
Development levels, investment dynamics, profit and return averages over time for each country.
Graph 1-4.
Development levels, investment dynamics, profit and return averages over time for each country.
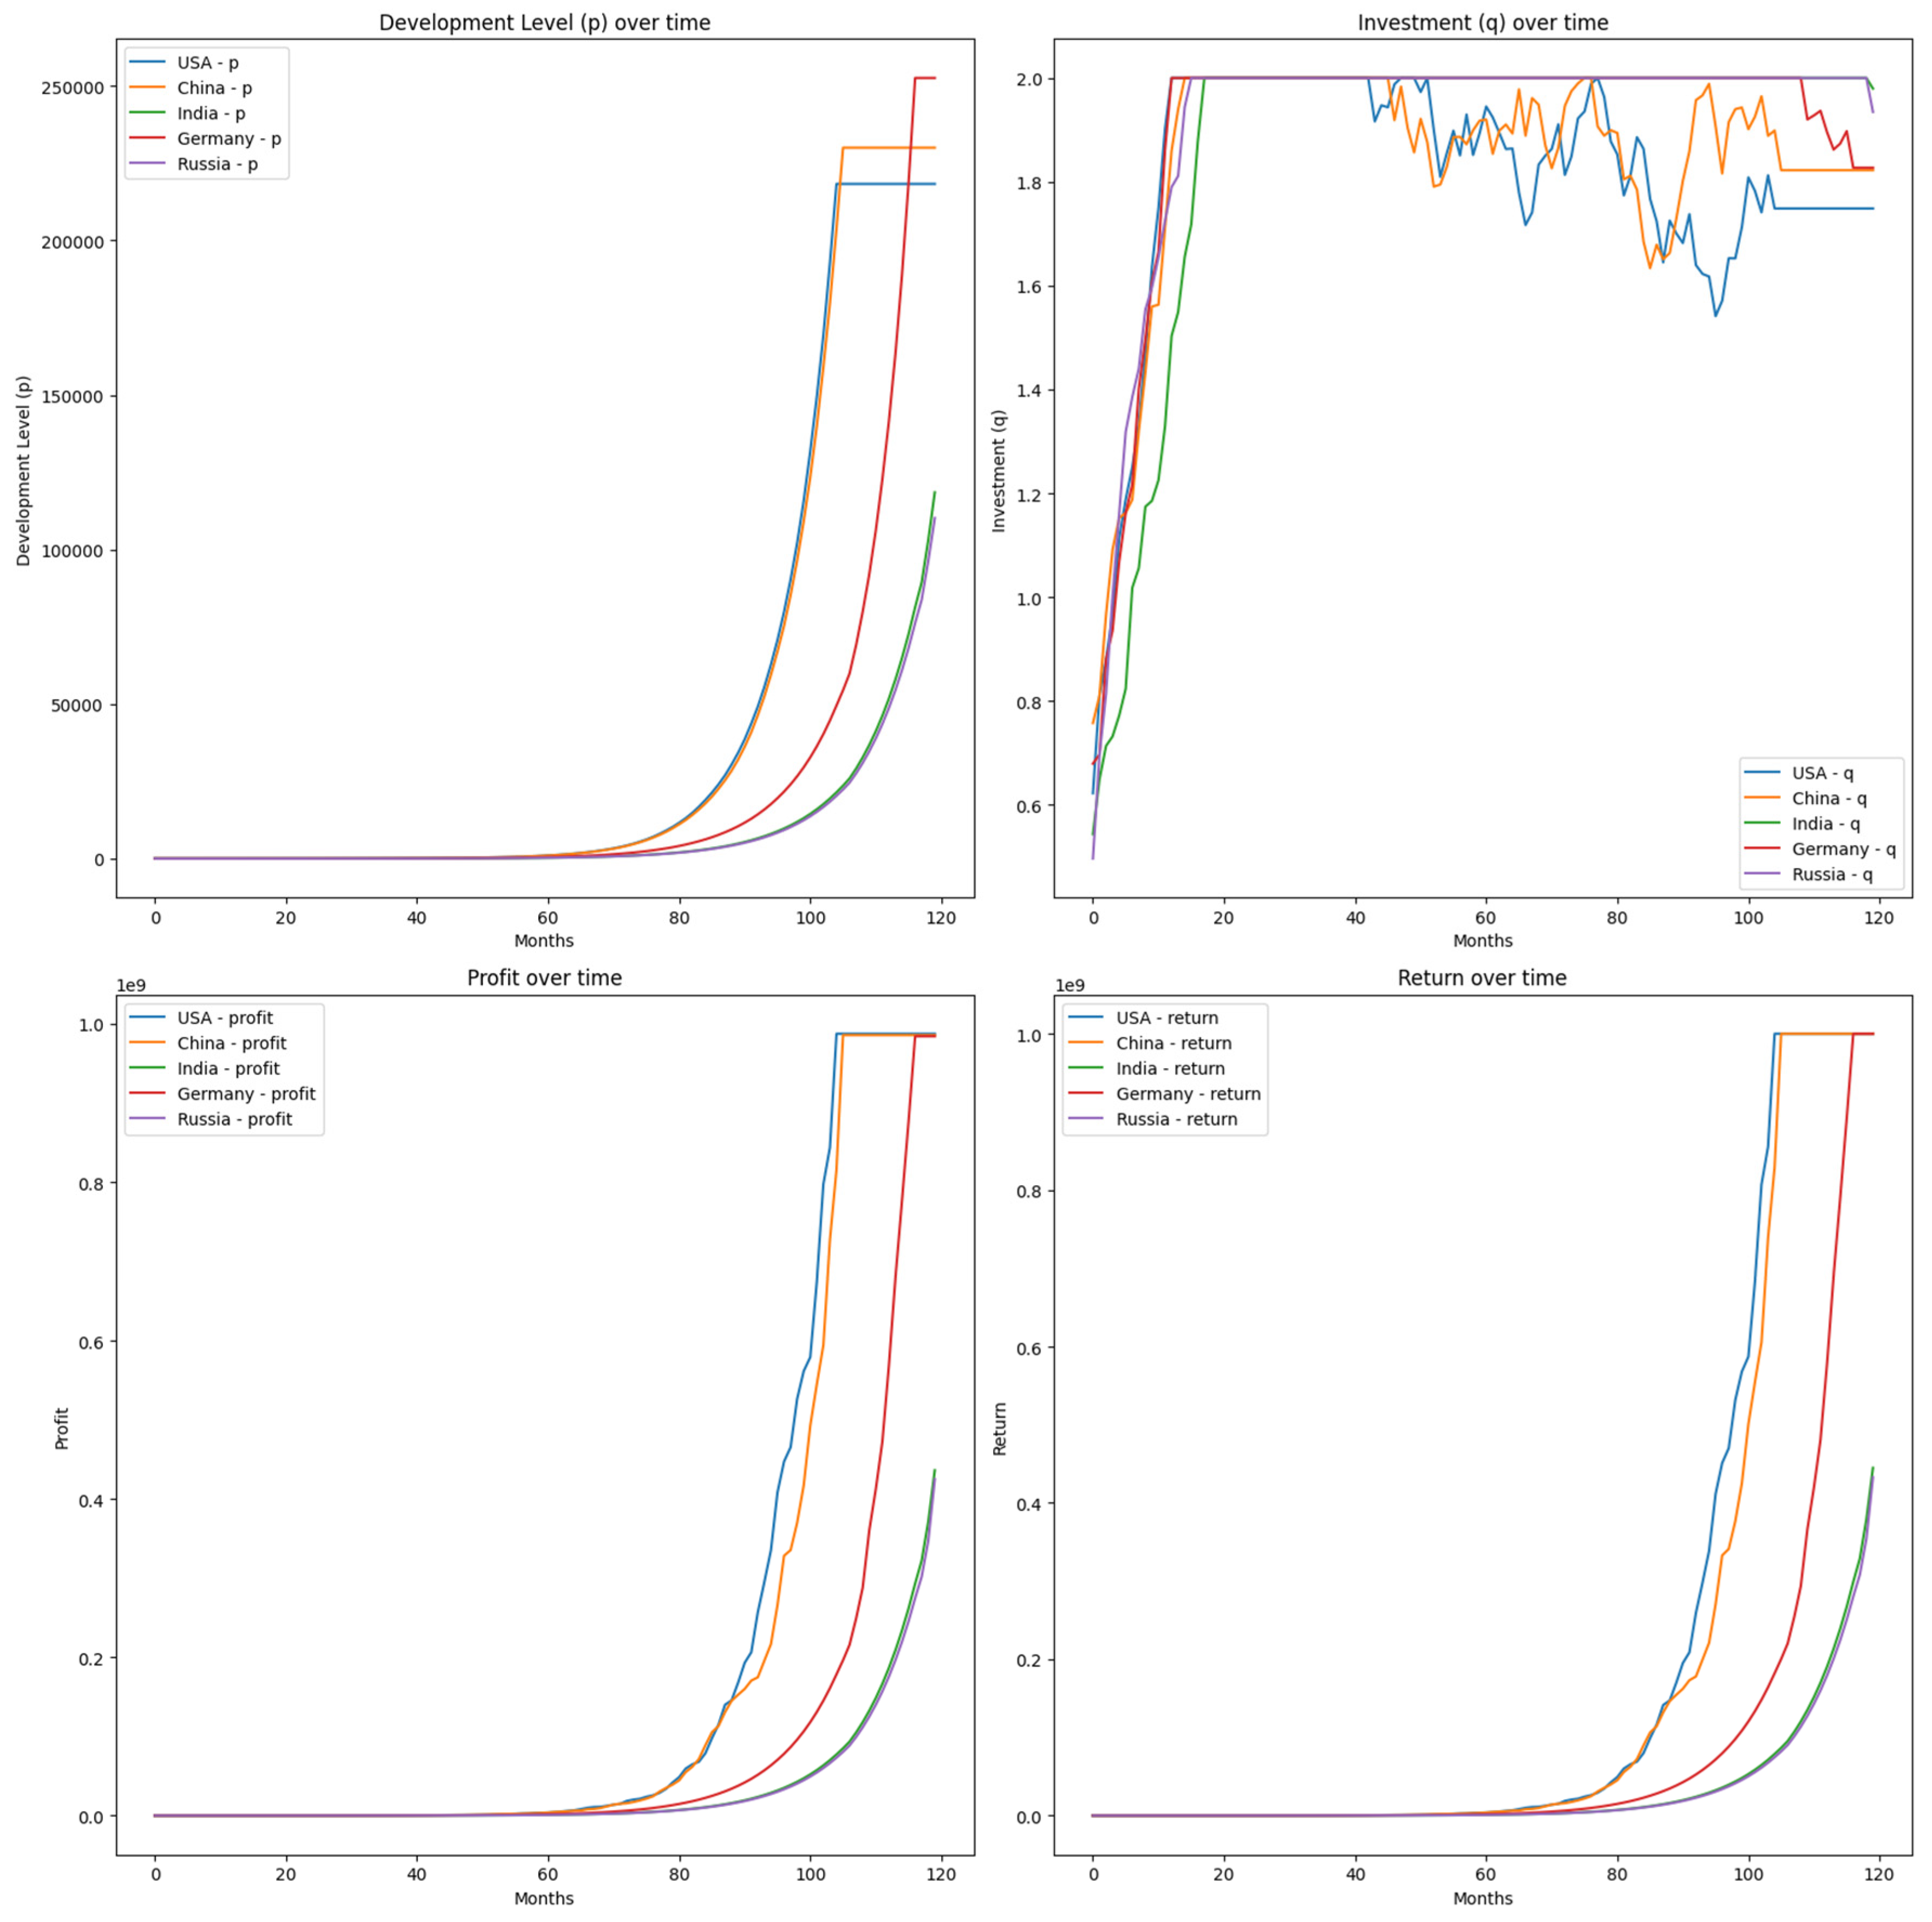
In line with what we’d expect from an AI development race. Let’s analyze these results:
-
Domination Occurrences:
- o
- USA: Dominated in all 10 simulations (100%)
- o
- China: Dominated in 9 out of 10 simulations (90%)
- o
- Germany: Dominated in 7 out of 10 simulations (70%)
- o
- India and Russia: Never dominated
-
Return Ranges:
- o
- USA, China, and Germany often reach the domination threshold of 1e9 (1 billion)
- o
- India’s returns range from about 2.77e8 to 6.38e8
- o
- Russia’s returns range from about 1.82e8 to 3.56e8
-
Interesting Observations:
- o
- In Simulation 4, China didn’t dominate (2.93e8) while Germany did
- o
- Germany shows significant variability, sometimes dominating and sometimes not
- o
- India and Russia never dominate but show improvement compared to the previous model
-
Average and Maximum Returns:
- o
- Both average and highest maximum return are 1.00e9, indicating that in every simulation, at least one country reached domination
- Simulations without Domination: The negative value (-16) is likely due to a small bug in our counting logic. It should be 0, as every simulation had at least one country dominating.
These results paint a much more dynamic and realistic picture of an AI development race:
- USA and China are the clear frontrunners, with the USA having a slight edge.
- Germany is a strong contender, sometimes keeping pace with the leaders and sometimes falling short.
- India and Russia, while improving, are not able to catch up to the leaders in the given timeframe.
Section 4. Discussion:
The results of our game-theoretic model of the global AI race provide a stark illustration of the potential trajectories of AI development over the next five years. Our simulations consistently show a tendency towards oligopolistic market structures, with a few countries—primarily the United States and China—achieving technological domination. This aligns with current assessments of the global AI landscape (Lee, 2018). However, our model also reveals the potential for surprise contenders, exemplified by Germany’s occasional rise to dominance in our simulations.
These findings, when extrapolated to real-world scenarios, paint a picture of a near future that may be barely recognizable compared to our current world. The rapid advancement and concentration of AI capabilities in a few nations could lead to unprecedented shifts in global power dynamics, economic structures, and everyday life.
Economic Transformation:
Our model’s projection of exponential returns on AI investment for dominant nations suggests we may be on the cusp of what Brynjolfsson and McAfee (2014) term the “second machine age.” The concentration of AI capabilities could lead to a winner-takes-most economy on a global scale. Industries from manufacturing to services could be revolutionized by AI systems capable of outperforming humans in an ever-widening array of tasks. As our results indicate a significant gap between leading and lagging nations, we may see a new form of economic colonialism emerge, where AI-dominant nations control the means of production for vast swathes of the global economy.
Geopolitical Realignment:
The stark divide between AI leaders and followers in our simulations suggests a potential redrawing of geopolitical maps based on AI capabilities rather than traditional measures of state power. As Horowitz (2018) argues, AI could fundamentally alter the balance of power. Our results, showing the difficulty of catching up once a nation falls behind, imply that current geopolitical actions and investments may have outsized importance in determining future global influence.
Technological Singularity:
The rapid growth rates observed in our leading nations’ AI development curves lend credence to the notion of an approaching technological singularity. As Kurzweil (2005) posits, we may be nearing a point where AI surpasses human intelligence (Montgomery, 2023), leading to runaway technological growth. Our model’s results, showing occasional rapid leaps in development, suggest that this transition could occur more suddenly than many anticipate, potentially within the five-year timeframe we’re considering.
Ethical and Existential Challenges:
The concentration of advanced AI capabilities in a few hands, as suggested by our model, raises profound ethical questions. As Russell (2019) warns, the development of artificial general intelligence (AGI) without robust ethical frameworks could pose existential risks to humanity. Our results, showing the potential for sudden breakthroughs, underscore the urgency of addressing these ethical challenges before AGI becomes a reality.
Societal Restructuring:
The rapid advancement of AI capabilities implied by our model suggests we may be on the brink of a fundamental restructuring of society. As AI systems become capable of performing an increasing range of cognitive tasks, traditional notions of employment and education may become obsolete. This aligns with Ford’s (2015) predictions of widespread technological unemployment and the need for new social contracts.
Cognitive Enhancement and Human-AI Symbiosis:
While our model focuses on national-level AI development, the implications extend to individual human cognition. The extreme competitiveness of the AI race suggested by our results may drive the development of brain-computer interfaces and other cognitive enhancement technologies (Montgomery, 2024). As Harari (2017) speculates, we may see the emergence of a “useless class” alongside cognitively enhanced individuals who can keep pace with AI systems.
In conclusion, our model’s results, showing rapid AI development and the potential for sudden breakthroughs, suggest that the world of 2028 may be radically different from what we know today. The concentration of AI capabilities, the potential for unexpected leaders to emerge, and the difficulties faced by lagging nations all point to a future characterized by dramatic inequality, geopolitical upheaval, and profound ethical challenges.
However, it’s crucial to note that our model, like all simulations, has limitations. The actual trajectory of AI development will depend on numerous factors not captured in our equations, including breakthroughs in fundamental research, changes in national policies, and unforeseen global events. Nevertheless, our results provide a valuable framework for anticipating and preparing for the transformative potential of AI in the near future.
As we stand on the brink of this new era, it is imperative that policymakers, researchers, and citizens engage with these possibilities. The decisions made in the next five years, as our model suggests, may well determine the shape of our world for generations to come.
Section 5. Conclusions:
Our game-theoretic model of the global AI development race provides valuable insights into the dynamics of technological competition in this crucial field. Through rigorous mathematical modeling and extensive Monte Carlo simulations, we have shed light on the potential trajectories of AI advancement across nations and the implications of these developments for the global order.
Key findings from our research include:
- -
- The tendency towards an oligopolistic structure in AI development, with a few nations—primarily the United States and China—achieving technological domination.
- -
- The significant challenges faced by countries attempting to catch up once they fall behind in the race, highlighting the critical importance of early and sustained investment in AI capabilities.
- -
- The potential for unexpected contenders to emerge and achieve dominance under certain conditions, as exemplified by Germany’s occasional rise to the top in our simulations.
- -
- The exponential growth in returns for leading nations, suggesting the possibility of a technological singularity within a relatively short timeframe.
- -
- The risk of countries dropping out of the race entirely when faced with insurmountable leads by competitors, potentially leading to a new form of technological colonialism.
These results have profound implications for policymakers, researchers, and society at large. They underscore the urgency of national AI strategies and the need for countries to carefully consider their investment and development approaches. Moreover, our findings highlight the potential for rapid and transformative changes in global power dynamics, economic structures, and the very nature of human society.
However, it is crucial to acknowledge the limitations of our model. While it captures many key aspects of the AI race, it necessarily simplifies a complex and multifaceted reality. Factors such as international collaboration, the role of private enterprises, and the potential for disruptive breakthroughs in AI fundamentals are not fully captured in our current equations.
Future research could address these limitations and extend our work in several directions:
- -
- Incorporating more granular data on national AI capabilities and investments to refine the model’s parameters and initial conditions.
- -
- Expanding the model to include the role of multinational corporations and international collaborations in AI development.
- -
- Exploring the potential impacts of different regulatory environments and ethical frameworks on AI development trajectories.
- -
- Investigating the interplay between AI advancement and other emerging technologies, such as quantum computing and biotechnology.
- -
- Developing more sophisticated models of technological breakthroughs and their diffusion across countries.
In conclusion, our research provides a quantitative framework for understanding the global AI race, offering both cautionary insights and strategic guidance. As we stand on the brink of potentially revolutionary advancements in artificial intelligence, it is our hope that this work will contribute to informed decision-making and stimulate further research in this critical area.
The race for AI supremacy is not merely a technological competition—it is a contest that may well determine the future of human civilization. Our model suggests that the decisions made and actions taken in the coming years could have far-reaching and irreversible consequences. As such, it is imperative that we approach this challenge with a combination of ambition, caution, and a deep consideration of the ethical implications of our choices.
As we move forward, it is clear that the development of AI will continue to be a defining issue of our time. By providing a rigorous, quantitative approach to understanding this complex landscape, we aim to contribute to a future where the benefits of AI are realized and its risks are mitigated. The path ahead is uncertain, but with careful analysis, international cooperation, and a commitment to ethical development, we can work towards a future where AI serves to enhance rather than endanger human flourishing.
Section 6. Attachment:
Python Code:
- import numpy as np
- import matplotlib.pyplot as plt
- from collections import Counter
- class Country:
- def __init__(self, name, initial_p, initial_q):
- self.name = name
- self.p = initial_p
- self.q = initial_q
- self.stopped = False
- self.dominated = False
- def calculate_return(self):
- return min(self.p * np.exp(1 - self.q) * 10000, 1e9) # Increased from 1000 to 10000
- def calculate_cost(self):
- return self.p * np.exp(self.q) * 10
- def calculate_profit(self):
- return self.calculate_return() - self.calculate_cost()
- def simulate_round(countries):
- active_countries = [c for c in countries if not c.stopped and not c.dominated]
- total_return = sum(c.calculate_return() for c in active_countries)
- max_return = max(c.calculate_return() for c in active_countries)
- for country in active_countries:
- market_share = country.calculate_return() / total_return if total_return > 0 else 0
- if country.calculate_return() >= 1e9:
- country.dominated = True
- continue
- if country.calculate_return() > 9e8: # 90% of domination
- country.q = 2 # Maximum investment
- country.p *= 1.2 # Increased from 1.1 to 1.2
- elif max_return > 9e8 and country.calculate_return() < 7e8:
- country.q = 2 # Maximum investment
- country.p *= 1.1 # Increased from 1.05 to 1.1
- else:
- if market_share < 0.1: # Falling behind
- country.q += np.random.uniform(0.1, 0.3)
- elif market_share > 0.3: # Leading
- country.q += np.random.uniform(-0.1, 0.1)
- else: # Competitive
- country.q += np.random.uniform(0, 0.2)
- country.q = max(0, min(country.q, 2))
- p_growth = 1 + (0.1 * market_share) + (0.05 * country.q) # Increased growth factors
- country.p *= p_growth
- if country.calculate_profit() < -1000 and np.random.random() < 0.1:
- country.stopped = True
- def run_single_simulation(num_rounds):
- countries = [
- Country("USA", 1.0, 0.6),
- Country("China", 1.0, 0.6),
- Country("India", 0.7, 0.4),
- Country("Germany", 0.8, 0.5),
- Country("Russia", 0.6, 0.3)
- ]
- history = {country.name: {'p': [], 'q': [], 'profit': [], 'return': []} for country in countries}
- for _ in range(num_rounds):
- simulate_round(countries)
- for country in countries:
- history[country.name]['p'].append(country.p)
- history[country.name]['q'].append(country.q)
- history[country.name]['profit'].append(country.calculate_profit())
- history[country.name]['return'].append(country.calculate_return())
- return history
- def plot_single_simulation(history):
- fig, ((ax1, ax2), (ax3, ax4)) = plt.subplots(2, 2, figsize=(16, 16))
- for country, data in history.items():
- ax1.plot(data['p'], label=f"{country} - p")
- ax2.plot(data['q'], label=f"{country} - q")
- ax3.plot(data['profit'], label=f"{country} - profit")
- ax4.plot(data['return'], label=f"{country} - return")
- ax1.set_title("Development Level (p) over time")
- ax1.set_xlabel("Months")
- ax1.set_ylabel("Development Level (p)")
- ax1.legend()
- ax2.set_title("Investment (q) over time")
- ax2.set_xlabel("Months")
- ax2.set_ylabel("Investment (q)")
- ax2.legend()
- ax3.set_title("Profit over time")
- ax3.set_xlabel("Months")
- ax3.set_ylabel("Profit")
- ax3.legend()
- ax4.set_title("Return over time")
- ax4.set_xlabel("Months")
- ax4.set_ylabel("Return")
- ax4.legend()
- plt.tight_layout()
- plt.show()
- def analyze_multiple_simulations(num_simulations, num_rounds):
- domination_count = Counter()
- max_returns = []
- for sim in range(num_simulations):
- history = run_single_simulation(num_rounds)
- max_return = max(data['return'][-1] for data in history.values())
- max_returns.append(max_return)
- print(f"\nSimulation {sim + 1} results:")
- for country, data in history.items():
- final_return = data['return'][-1]
- print(f"{country}: Final return = {final_return:.2e}, Dominated = {final_return >= 1e9}")
- if final_return >= 1e9:
- domination_count[country] += 1
- print("\nOverall Domination Results:")
- for country, count in domination_count.items():
- print(f"{country}: {count} times ({count/num_simulations*100:.2f}%)")
- print(f"\nSimulations without Domination: {num_simulations - sum(domination_count.values())}")
- print(f"Average maximum return: {np.mean(max_returns):.2e}")
- print(f"Highest maximum return: {max(max_returns):.2e}")
- # Main execution
- if __name__ == "__main__":
- num_rounds = 120 # Increased from 60 to 120
- num_simulations = 10
- print("Running and plotting a single simulation:")
- single_sim_history = run_single_simulation(num_rounds)
- plot_single_simulation(single_sim_history)
- print("\nAnalyzing multiple simulations:")
- analyze_multiple_simulations(num_simulations, num_rounds)
References
- Castro, D. , McLaughlin, M., & Chivot, E. (2019). Who Is Winning the AI Race: China, the EU or the United States? Center for Data Innovation.
- Horowitz, M. C. (2018). Artificial Intelligence, International Competition, and the Balance of Power. Texas National Security Review, 1(3), 36-57.
- Kania, E. B. (2018). Battlefield Singularity: Artificial Intelligence, Military Revolution, and China’s Future Military Power. Center for a New American Security.
- Lee, K. F. (2018). AI Superpowers: China, Silicon Valley, and the New World Order. Houghton Mifflin Harcourt.
- Reinganum, J. F. (1989). The timing of innovation: Research, development, and diffusion. Handbook of Industrial Organization, 1, 849-908.
- Richardson, L. F. (1960). Arms and Insecurity: A Mathematical Study of the Causes and Origins of War. Boxwood Press.
- Brynjolfsson, E. , & McAfee, A. (2014). The Second Machine Age: Work, Progress, and Prosperity in a Time of Brilliant Technologies. W. W. Norton & Company.
- Ford, M. (2015). Rise of the Robots: Technology and the Threat of a Jobless Future. Basic Books.
- Harari, Y. N. (2017). Homo Deus: A Brief History of Tomorrow. Harper.
- Horowitz, M. C. (2018). Artificial Intelligence, International Competition, and the Balance of Power. Texas National Security Review, 1(3), 36-57.
- Kurzweil, R. (2005). The Singularity Is Near: When Humans Transcend Biology. Viking.
- Lee, K. F. (2018). AI Superpowers: China, Silicon Valley, and the New World Order. Houghton Mifflin Harcourt.
- Montgomery, R. M. (2023). AI Complexity Emergence: Why Not? From Neural to Internet Systems and the Potential for AI Emergence” (2023). [CrossRef]
- Montgomery, R. M. (2024). Enhancing Neuroprosthetic Control through AI-Powered Adaptive Learning: A Simulation Study. (2024); Wired Neuroscience, Vol 1, Issue 2. [CrossRef]
- Russell, S. (2019). Human Compatible: Artificial Intelligence and the Problem of Control. Viking.
Disclaimer/Publisher’s Note: The statements, opinions and data contained in all publications are solely those of the individual author(s) and contributor(s) and not of MDPI and/or the editor(s). MDPI and/or the editor(s) disclaim responsibility for any injury to people or property resulting from any ideas, methods, instructions or products referred to in the content. |
© 2024 by the authors. Licensee MDPI, Basel, Switzerland. This article is an open access article distributed under the terms and conditions of the Creative Commons Attribution (CC BY) license (http://creativecommons.org/licenses/by/4.0/).
Copyright: This open access article is published under a Creative Commons CC BY 4.0 license, which permit the free download, distribution, and reuse, provided that the author and preprint are cited in any reuse.


