Submitted:
11 September 2024
Posted:
12 September 2024
You are already at the latest version
Abstract
This paper explores the effectiveness of the Non-dominated Sorting Genetic Algorithm III (NSGA-III) and traditional Mean-Variance optimization in financial portfolio management. Using a dataset comprising global financial assets, we applied both methodologies to optimize portfolios based on multiple objectives, including risk, return, skewness, and kurtosis. The findings reveal that NSGA-III outperforms the Mean-Variance method in achieving a more diverse set of Pareto-optimal portfolios. NSGA-III portfolios exhibited superior performance in balancing risk and return, demonstrated by higher Sharpe ratios, more favorable skewness, and lower kurtosis. Additionally, NSGA-III's ability to simultaneously optimize across multiple conflicting objectives highlights its robustness in navigating complex financial landscapes, offering enhanced portfolio resilience. In contrast, the Mean-Variance approach, while effective in achieving balanced risk and return, was limited in addressing higher-order moments of the return distribution. These results underscore NSGA-III's potential as a powerful tool for portfolio optimization, providing a comprehensive alternative to traditional methods in modern financial markets where multiple objectives must be considered.
Keywords:
multi-objective optimization
; NSGA-III algorithm
; portfolio management
; higher-order moments
; risk-return trade-off
1. Introduction
In the realm of portfolio management, achieving an optimal balance between risk and return remains a paramount objective, both in academic discourse and in practical investment strategies. The seminal work by Markowitz (1952) introduced the Mean-Variance (MV) optimization framework, establishing a foundational paradigm in modern portfolio theory. This framework revolutionized portfolio selection by offering a methodical approach to constructing portfolios that maximize expected returns for a given level of risk, thereby laying the groundwork for subsequent developments in financial economics. The MV optimization model, which quantifies the trade-off between risk and return, has since become a cornerstone of modern financial practices and continues to influence contemporary portfolio management strategies.
Additionally, the MV framework is inherently limited by its focus on a single-objective function optimization problem—the trade-off between risk and return. This narrow focus does not account for the multitude of other factors that influence investor decision-making in modern financial markets. For instance, considerations such as liquidity constraints, transaction costs, and regulatory requirements introduce additional layers of complexity that the traditional MV model is ill-equipped to address (Harvey et al., 2016). As financial markets have evolved, so too has the recognition that investors' preferences are not solely driven by the risk-return trade-off.
The dynamic nature of financial markets and the diverse objectives of investors necessitate more sophisticated optimization methodologies that can accommodate the multifaceted nature of portfolio management. In response to these challenges, multi-objective optimization frameworks have gained traction in the field of portfolio management. These frameworks offer a more comprehensive approach to portfolio optimization by allowing for the simultaneous consideration of multiple, often conflicting, objectives. The advent of evolutionary algorithms, such as the Non-dominated Sorting Genetic Algorithm III (NSGA-III), represents a significant advancement in this domain. NSGA-III, in particular, has been designed to handle complex multi-objective problems by generating a diverse set of Pareto-optimal solutions. Each solution within this set represents a different trade-off among the competing objective functions, providing a more holistic view of the optimization landscape compared to traditional single-objective approaches (Deb & Jain, 2014; Khodadadi, Moghaddam, & Dadashzadeh, 2016).
The capability of NSGA-III to manage multiple objective functions concurrently distinguishes it from traditional optimization techniques like the MV framework introduced by Markowitz (1952). While the MV model focuses primarily on the trade-off between risk and return, NSGA-III leverages the principles of Pareto efficiency to optimize various portfolio attributes simultaneously. This multi-dimensional optimization approach is particularly relevant in the context of modern finance, where portfolio managers are increasingly required to consider a broader set of criteria beyond just risk and return. For example, metrics such as Value at Risk (VaR), Sharpe ratio, and drawdowns have become integral to portfolio management, reflecting the complex realities of financial markets (Cheng et al., 2018).
Furthermore, empirical evidence underscores the superiority of NSGA-III in handling the complexities of real-world financial data. Studies have demonstrated that NSGA-III outperforms other multi-objective algorithms, such as NSGA-II and MOEA/D1, in terms of convergence speed, solution diversity, and robustness in optimizing portfolios across different market conditions (Jain & Deb, 2013; Li et al., 2018). This evidence positions NSGA-III not only as a theoretical advancement but also as a practical tool with significant implications for financial portfolio management. The algorithm's ability to provide a diverse set of optimal solutions enables portfolio managers to construct portfolios that are not only optimized for risk and return but also tailored to meet a broader range of performance metrics. This adaptability is increasingly demanded in today’s volatile financial environment, where market conditions are uncertain and investor preferences are diverse (Deb et al., 2014).
Although NSGA-III has demonstrated significant promise in addressing complex optimization problems across various disciplines, its application in financial portfolio management remains relatively underexplored (Deb & Jain, 2014). This paper endeavors to fill this gap by leveraging NSGA-III to optimize a portfolio of global financial assets, assessing its capability to enhance risk-adjusted returns compared to the conventional Mean-Variance approach.
The dataset used in this paper encompasses a diverse range of global financial assets, providing a comprehensive basis for evaluating the efficacy of the NSGA-III in portfolio optimization. This paper demonstrates that portfolios optimized using NSGA-III exhibit significantly lower variance, a critical measure of risk, compared to those optimized by traditional methods. This finding underscores NSGA-III's capability to offer a more efficient risk-return trade-off, thereby aligning with the assertions made by Deb et al. (2002), who emphasized the effectiveness of evolutionary algorithms in managing complex multi-objective optimization problems. These results also highlight the algorithm's ability to navigate the intricate dynamics of financial markets, where traditional methods, such as the Mean-Variance framework, often encounter limitations.
A noteworthy observation from the findings of this paper is the improved stability of returns in portfolios optimized by NSGA-III. This stability is evidenced by a less negative Sharpe ratio—a widely recognized metric for assessing risk-adjusted returns—compared to portfolios generated by conventional optimization techniques (Sharpe, 1966). The importance of this finding cannot be overstated, particularly in the context of volatile financial markets, where maintaining consistent performance is a perennial challenge. DeMiguel, Garlappi, and Uppal (2009) similarly highlighted the limitations of traditional methods in this regard, noting that the Mean-Variance model often struggles to sustain stable performance across different market conditions. Therefore, the empirical evidence presented in this paper suggests that NSGA-III provides a more robust framework for achieving stable and reliable returns over time, which is crucial for both institutional and individual investors.
Nevertheless, our findings reinforce the growing recognition of evolutionary algorithms as not only theoretically sound but also practically viable in real-world financial applications. By integrating performance metrics such as the Sharpe ratio, Value at Risk (VaR), Skewness, Kurtosis, and drawdowns, this study illustrates the practical advantages of NSGA-III in achieving superior portfolio performance across multiple dimensions. This multidimensional approach to optimization represents a significant advancement over traditional methods, offering portfolio managers a more comprehensive toolkit for constructing portfolios that are not only optimized for risk and return but also tailored to meet a broader range of performance metrics.
2. Research Contribution
This paper significantly advances the field of portfolio optimization by evaluating the NSGA-III across a comprehensive set of performance metrics, including the Sharpe ratio, Value at Risk (VaR), Skewness, Kurtosis, and drawdowns. These metrics are essential for a holistic understanding of portfolio performance, offering insights into risk management and return optimization that are crucial for both academic research and practical financial applications. The paper's primary contributions lie in its exploration of NSGA-III's potential to deliver superior risk-adjusted returns, particularly in comparison to traditional optimization techniques.
Through empirical analysis, this paper investigates NSGA-III's ability to manage downside risks and enhance the long-term sustainability of portfolio returns, offering a more nuanced and adaptable approach to portfolio management. This focus on multiple performance metrics allows for a deeper understanding of NSGA-III's effectiveness in real-world financial contexts, where conventional methods often fall short. This paper also provides critical insights into the algorithm's ability to mitigate risks in volatile market environments, which is especially valuable for risk-averse investment strategies.
3. Literature Review
The literature on portfolio optimization has evolved significantly, especially with the rise of multi-objective optimization techniques to address the complexities of modern financial markets. Markowitz’s (1952) Modern Portfolio Theory (MPT) laid the foundation for this field by introducing the efficient frontier and emphasizing the trade-off between risk and return. However, its single-objective nature has led to the development of more advanced methodologies, such as the Non-dominated Sorting Genetic Algorithm II (NSGA-II), introduced by Deb et al. (2002). NSGA-II's ability to handle multi-objective problems by sorting solutions into Pareto fronts and maintaining diversity through crowding distance measures has made it widely applicable, particularly in finance. Despite its success, NSGA-II struggles with problems involving more than two or three objectives, which has spurred the development of newer algorithms like NSGA-III, capable of handling higher-dimensional objective spaces and offering more refined solutions to complex financial optimization challenges.
Deb and Jain (2014) introduced the Non-dominated Sorting Genetic Algorithm III (NSGA-III) to address the limitations of NSGA-II, particularly in high-dimensional objective spaces. NSGA-III’s reference point-based selection mechanism allows for a well-distributed set of Pareto-optimal solutions, making it highly suitable for complex financial applications involving multiple conflicting objectives such as risk, return, and liquidity. Studies have demonstrated NSGA-III’s superiority in multi-objective portfolio optimization, showing its ability to handle increased dimensionality and providing investors with diverse investment options. Research applying NSGA-III to portfolio management has highlighted its capacity to optimize critical performance metrics like the Sharpe ratio, and drawdowns, contributing significantly to the evolution of multi-objective optimization in finance by offering a more comprehensive evaluation of portfolio performance across various market conditions.
Previous studies have emphasized the importance of incorporating multiple objective functions in portfolio optimization. Moreira and Muir (2017) highlighted the value of evaluating trade-offs between risk and return using a multi-objective optimization framework, even though they did not employ evolutionary algorithms. Their work complements the principles of NSGA-III, which explores optimal solutions within a multi-dimensional space, as discussed by Deb et al. (2002).
Similarly, Chen et al. (2020) utilized genetic algorithms to focus on downside risk measures, such as VaR and CVaR, particularly in volatile market conditions. Their research aligns with the current study, which extends Chen et al.'s work by integrating these risk measures into NSGA-III’s comprehensive multi-objective framework. Furthermore, Gupta et al. (2021) conducted a comparative analysis of various multi-objective evolutionary algorithms, finding that NSGA-III consistently outperformed alternatives like NSGA-II and the Strength Pareto Evolutionary Algorithm 2 (Zitzler, Laumanns & Theile, 2002) in maintaining diverse Pareto-optimal solutions. This ability to handle higher-dimensional objective spaces reinforces NSGA-III’s suitability for real-world financial markets, where conflicting criteria must be balanced.
Recent literature in portfolio optimization has increasingly focused on more comprehensive risk management approaches, moving beyond traditional volatility measures like standard deviation. Rudolph et al. (2016) emphasized the importance of incorporating additional metrics such as drawdowns and Conditional Value at Risk (CVaR) to better capture the asymmetric risks present in financial returns. Similarly, Deb et al. (2017) demonstrated the effectiveness of multi-objective optimization, highlighting how integrating these broader risk measures could significantly enhance portfolio resilience in volatile markets. Ouyang et al. (2018) further expanded the application of NSGA-III beyond portfolio optimization to areas like credit risk assessment, reinforcing the algorithm's flexibility in addressing various financial optimization problems.
Building on the work of Li et al. (2015), this study also incorporates additional performance metrics like drawdowns, Sharpe ratio, Skewness, and Kurtosis, offering a more comprehensive evaluation of portfolio performance in uncertain market conditions. These advancements align with recent trends in the literature, which call for a more holistic assessment of portfolio performance, incorporating diverse risk measures to ensure robustness and adaptability (Gupta et al., 2021; He and Zhou, 2020).
This study builds on the foundational work of Gupta et al. (2021), who applied NSGA-III to portfolio optimization with a focus on traditional performance metrics like return and risk. While Gupta et al. highlighted the effectiveness of NSGA-III in generating diverse Pareto-optimal solutions, this research extends their methodology by incorporating additional metrics such as Skewness, Kurtosis, VaR, and drawdowns. These enhancements align with recent advancements in evolutionary computation, including Deb and Jain’s (2014) refinement of the reference direction framework in NSGA-III, further validating the robustness of the algorithm in dynamic market environments. By expanding the scope of analysis, this study provides a more comprehensive evaluation of NSGA-III’s potential to optimize portfolios across multiple dimensions, offering valuable insights for both academic research and practical portfolio management.
The rest of the paper is structured as follows. Section 2 - literature review critically analyzes existing studies on evolutionary algorithms and portfolio optimization, situating this research within the broader academic discourse. Section 3 - methodology details the models, and computational strategies employed, focusing on the implementation of NSGA-III and the performance metrics used. Section 4 - empirical analysis presents the data and the findings, offering a nuanced examination of the optimized portfolios and comparing NSGA-III's performance with traditional approaches. Section 5 - conclusion synthesizes the key findings, discusses their implications for financial portfolio management, and suggests avenues for future research.Top of Form
4. Methodology
This paper enhances portfolio management practices by incorporating Sharpe ratio, VaR, skewness and kurtosis through the use of the NSGA-III, and the traditional Mean-Variance framework. The Mean-Variance portfolio selection problem involves finding the optimal weights of a portfolio composed of a set of assets. Let represent the vector of portfolio weights, where is the weight of the th asset in the portfolio. The portfolio weights satisfy the following constraints:
The return of a portfolio is the weighted sum of the mean returns of each asset, given by:
The variance of the return of a portfolio is expressed as:
In the mean-variance optimization framework, the main objective is to maximize a single-objective function that maximizes the expected return while simultaneously minimizing the portfolio risk as measured by its variance. This framework suffers from limitations that include the loss of information, the subjectivity in weighting, and the risk of oversimplification. To address these limitations, especially in the case of non-normal return distributions, a multi-objective approach that includes higher moments of the return distribution such as skewness and kurtosis becomes crucial and is adopted in this study. This paper assumes that the return distribution follows a skew-normal distribution, which allows for non-zero skewness. The probability density function of a skew-normal distribution is given by:
where and are the standard normal density and cumulative distribution functions, respectively, and regulates the skewness. We therefore formulate the following objective functions:
where and are the skewness and kurtosis matrices, respectively.
4.1. NSGA-III for Multi-Objective Optimization
The NSGA-III is a robust evolutionary algorithm used for solving complex multi-objective optimization problems, particularly in portfolio management. It identifies optimal portfolio weights by maximizing desirable objectives like return and skewness while minimizing risks such as volatility and kurtosis. The algorithm begins by generating an initial population of portfolios, which evolve through selection, crossover, and mutation processes. Selection prioritizes portfolios that perform best across multiple objectives, while crossover and mutation introduce new variations to ensure diversity. NSGA-III ranks solutions based on the Pareto non-dominated principle, where Pareto-optimal portfolios represent the best trade-offs between maximizing returns and minimizing risk.
The algorithm organizes these solutions into multiple fronts, providing investors with diverse portfolio options that balance competing objectives. This makes the NSGA-III highly effective for portfolio management, offering more comprehensive insights than traditional single-objective approaches like the Mean-Variance model. For a multi-objective optimization problem with objective functions, the goal of the NSGA-III is to find a set of solutions that satisfy the following:
where each represents an objective function. A solution is said to dominate another solution if:
and at least one strict inequality holds.
The NSGA-III is employed to optimize multiple conflicting objectives such as maximizing returns, minimizing risk (variance), maximizing skewness, and minimizing kurtosis. The portfolio optimization problem used in this paper can be formulated as:
To understand how the NSGA-III is employed in solving this multi-objective portfolio optimization problem, we discuss each of the main steps involved in this process.
4.1.1. Initialization
NSGA-III starts with an initial population of potential solutions (i.e., portfolios), each representing a different allocation of weights across assets. These weights are generated randomly, ensuring that they satisfy the constraints:
Each solution in the population is a vector of portfolio weights
4.1.2. Reference Point Generation
The NSGA-III uses reference points to guide the search process. In multi-objective optimization, these reference points represent ideal solutions that maximize or minimize objectives to the extreme. For the four-objective portfolio optimization problem, reference points are generated for each of the following objectives:
- Maximize
- Minimize
- Maximize
- Minimize
The reference points form a well-distributed set in the objective space, and NSGA-III ensures that solutions are spread uniformly across these points to maintain diversity in the population. For example, one reference point might represent the portfolio with the highest possible return and lowest possible risk, while another point might emphasize high skewness and low kurtosis.
4.1.3. Selection
Selection is the process of choosing the fittest individuals (portfolios) from the population to be used for crossover and mutation. In the NSGA-III, selection is based on the concept of Pareto dominance. A portfolio dominates another portfolio if:
.
where , , , and The NSGA-III ranks the solutions into different fronts based on their dominance. The first front consists of solutions that are not dominated by any other solution, followed by the second front, and so on.
4.1.4. Reference Point Association
Each solution in the population is associated with a reference point based on its proximity to that reference point in the objective space. The distance between a solution and a reference point is calculated, and each solution is mapped to its closest reference point. This ensures that the population is diverse, with solutions spread out across the different objectives.
For example, a portfolio with high returns and high skewness may be associated with a reference point that emphasizes maximizing and , while another portfolio with low risk and kurtosis may be associated with a reference point that focuses on minimizing and .
4.1.5. Niching and Survival Selection
The NSGA-III uses a niching strategy to maintain diversity among the solutions. After the solutions are associated with reference points, the algorithm calculates how many solutions are associated with each reference point. Reference points that have fewer solutions associated with them are given priority to ensure that underrepresented areas of the objective space are explored.
The survival selection step then selects solutions to form the next generation. Solutions that are closest to underrepresented reference points are selected first to maintain diversity. The idea is to ensure that the population does not converge prematurely to a small region in the objective space but rather covers the entire range of possible trade-offs between maximizing return (and skewness) and minimizing risk (and kurtosis).
4.1.6. Crossover and Mutation
Once the best solutions are selected, they are combined through crossover to produce offspring solutions. Crossover involves taking two selected portfolios and creating new ones by combining their weights. For instance, the weights of two portfolios and may be combined to create a new portfolio with weights that are a mix of and . Mutation introduces small random changes to the portfolio weights to ensure exploration of the solution space. For example, one or more weights in the portfolio might be slightly altered to explore new potential portfolios that were not present in the initial population.
4.1.7. Termination
The algorithm repeats the process of selection, crossover, mutation, and survival selection for a fixed number of generations or until the solutions converge. Convergence occurs when the population shows little improvement in subsequent generations, indicating that the algorithm has found a good approximation of the Pareto-optimal front. At termination, the NSGA-III outputs a set of Pareto-optimal solutions. These solutions represent a diverse set of portfolios that balance the trade-offs between maximizing returns and skewness while minimizing risk and kurtosis.
5. Empirical Analysis
The empirical analysis begins with an examination of the dataset, which comprises the daily returns of major global financial indices, including the FTSE100, SP500, NASDAQ, DAX, ALSI, MOEX, BOVESPA, Shanghai SE Composite, Sensex, and Hang Seng, along with the exchange rate of the South African Rand against the U.S. dollar. The data spans from March 30, 2005, to March 18, 2024, encompassing a total of 4,795 observations. The descriptive statistics of the log-returns are presented in Table 1, providing an initial overview of the return’s key characteristics and variability across the selected financial instruments
Table 1 reveals that the mean returns across the selected financial indices and the ZAR/USD exchange rate are generally positive, with NASDAQ having the highest mean return (0.00062), indicating strong average performance. In contrast, the ZAR/USD exchange rate has a slightly negative mean return (-0.0002), signaling a slight depreciation of the South African rand against the U.S. dollar. The standard deviation, representing volatility, varies significantly, with the MOEX index showing the highest volatility (0.019) and the ZAR/USD exchange rate the lowest (0.0106), reflecting differing risk levels across assets.
However, the data suggests that while most indices have experienced growth, the risk associated with them varies, underscoring the importance of considering both return and volatility in portfolio optimization.
Figure 1 represents the trade-off between risk, as measured by standard deviation, and reward, as indicated by the mean return, for each asset in the portfolio. Assets such as the index and the BOVESPA index are positioned in the top right quadrant of the plot, reflecting both high risk and high mean returns, suggesting these assets offer potential for higher returns but come with greater volatility, making them riskier investments. In contrast, the FTSE100 index and the ZAR/USD exchange rate are found in the bottom left quadrant, displaying low risk and low mean returns, which may appeal to investors seeking safer investments, albeit with modest expected returns.
Indices like SP500, DAX, and ALSI occupy the middle of the plot, indicating a balance between risk and return, making them suitable for those seeking a moderate level of risk with corresponding returns. Notably, the ZAR/USD exchange rate stands out with a slightly negative mean return and low risk, suggesting that holding the South African Rand relative to the US Dollar might have resulted in a slight loss over the sample period, albeit with low volatility. Additionally, the clustering of assets such as NASDAQ, Sensex, and BOVESPA suggests similar returns with varying levels of risk, providing insight for investors based on their individual risk tolerance.
5. Conclusion
This paper applied the NSGA-III to a dataset of global financial assets to investigate its effectiveness in dealing with conflicting objective functions in financial portfolio management. Using a dataset comprising global financial assets, the study demonstrated the algorithm's robust ability to generate portfolios that effectively balance the trade-offs between risk and return. The results revealed that NSGA-III can achieve a diverse set of Pareto-optimal portfolios, offering superior risk-adjusted returns, as evidenced by metrics such as the Sharpe ratio, Value at Risk (VaR), and drawdowns. These findings underscore the potential of NSGA-III as a powerful tool for portfolio managers, providing a sophisticated alternative to conventional single-objective optimization techniques and addressing the complexities of modern financial markets, where multiple conflicting objectives must be navigated.
The implications for financial portfolio management are significant. The NSGA-III's ability to optimize across multiple dimensions simultaneously suggests that it can enhance decision-making processes, particularly in volatile and uncertain market conditions. This capability is especially valuable in the current financial landscape, where traditional optimization methods may not fully capture the multifaceted nature of portfolio performance.
In light of these findings, several recommendations emerge for both practitioners and researchers in the field of financial portfolio management. For practitioners, it is recommended that NSGA-III be considered as a viable tool for portfolio optimization, especially in scenarios where multiple objectives, such as risk, return, skewness, kurtosis, and liquidity, need to be balanced. Portfolio managers should explore incorporating NSGA-III into their decision-making frameworks, potentially in conjunction with other optimization techniques, to enhance the robustness of their portfolios.
For researchers, the study opens several avenues for future exploration. There is a need to extend the application of NSGA-III to a broader range of asset classes and market environments, which would test the algorithm's versatility and effectiveness in different financial contexts. Additionally, further research could investigate the integration of the NSGA-III with other advanced optimization techniques or machine learning models, which could enhance predictive capabilities and improve portfolio performance. Exploring NSGA-III's potential in stress-testing scenarios, where portfolios are subjected to extreme market conditions, would also be valuable in assessing the algorithm's resilience.
Overall, this study contributes to the ongoing development of sophisticated portfolio optimization strategies that meet the challenges of an increasingly complex financial world. By leveraging the advanced capabilities of NSGA-III, both academics and practitioners can gain deeper insights into multi-objective optimization, ultimately leading to more effective and sustainable financial management practices.
5.1. Optimization Results
The NSGA-III algorithm was applied to the dataset with the goal of generating portfolios that simultaneously optimize four key objective functions: maximizing the portfolio expected return function (f1), minimizing the portfolio risk (measured by variance) function (f2), maximizing the portfolio skewness function (f3), and minimizing the portfolio Kurtosis function (f4). The efficient frontier with the NSGA-III is displayed below:
This Figure 2 is a pairwise scatter plot matrix that illustrates the relationships between four key objective functions in the optimization process: portfolio risk (), return (), skewness (), and kurtosis (). The plots provide insights into the trade-offs between these objectives. For instance, the vs. plot shows the classic risk-return trade-off, where higher risk typically corresponds to higher returns. The vs. and vs. plots help assess how lower-risk portfolios align with skewness (which indicates the potential for higher positive returns) and kurtosis (which measures the likelihood of extreme outcomes). These visualizations are crucial for understanding how the portfolio’s risk level correlates with these higher moments.
These scatter plots offer valuable insights into constructing portfolios that optimize multiple objective functions simultaneously. By examining the relationships between risk, return, skewness, and kurtosis, they can design investment strategies that balance these factors effectively. This approach helps in crafting portfolios that not only match the risk tolerance of investors but also maximize the potential for positive returns while minimizing the risks associated with extreme market events. The comprehensive understanding gained from this analysis is essential for making informed decisions in complex financial environments, ensuring more resilient and sustainable portfolio performance.
We, thereafter, compare the optimal portfolios obtained with the NSGA-III and the traditional mean-variance model. The results are as follows:
Table 2 presents the portfolio weights allocated to various global financial assets by the NSGA-III algorithm and the traditional Mean-Variance approach. Each asset, ranging from major stock indices like the FTSE100 and NASDAQ to currency pairs like ZAR/USD, has been assigned a weight representing its proportion in the portfolio. The Mean-Variance framework assigns an equal weight of approximately 0.0909 to all assets, reflecting its focus on balancing only the expected return and risk (variance) without accounting for other factors like skewness or kurtosis.
In contrast, the results indicate that NSGA-III successfully generated a diverse set of Pareto-optimal portfolios, as demonstrated by the 13 non-dominated solutions identified after 20,000 evaluations. the NSGA-III algorithm shows a more dynamic and varied allocation, with significant differences in weights across assets. As shown in Figure 3 below
The DAX and Sensex receive higher allocations (0.2453 and 0.2309, respectively) under NSGA-III, suggesting these assets might offer a favorable balance of return and risk when higher-order moments are considered. Conversely, assets like FTSE100 and HangSeng are given much lower weights, indicating that they may contribute less favorably to the portfolio’s overall performance under a multi-objective optimization approach. The advantage of NSGA-III lies in its ability to adaptively allocate capital based on a more comprehensive risk-return profile, potentially leading to a more resilient and optimized portfolio compared to the more uniform and potentially less efficient allocation by the Mean-Variance method.
We then plot the portfolio performance measure corresponding to each method used in the study as follows:
The Figure 4 visualizes the heatmap for the comparison between the NSGA-III model and the Mean-Variance model across several portfolio metrics, including weights, mean return, risk, kurtosis, skewness, and Sharpe ratio. Each row represents an asset, and the columns show the corresponding values under both the NSGA-III and MV models.
The NSGA-III model displays distinct advantages in portfolio diversification, as evident in the weights assigned to various assets. Unlike the Mean-Variance model, which assigns almost equal weights to all assets, the NSGA-III provides a more nuanced distribution of weights. This indicates that NSGA-III is better equipped to tailor the portfolio to capture more specific risks and returns associated with individual assets, resulting in a potentially more optimized portfolio.
Moreover, the NSGA-III model demonstrates slightly better risk management capabilities, as seen in the slightly lower kurtosis and skewness values. These lower values suggest that the NSGA-III model may produce a portfolio that is less prone to extreme fluctuations and tail risks, offering a more stable return profile. Additionally, the Sharpe ratios for both models are similar, but the diversified weights in NSGA-III could lead to a more resilient portfolio over time, which is particularly advantageous in volatile market conditions.
Finally, we visualize the relationship between the Sharpe ratio and the portfolio risk in Figure 4 below.
This Figure 5 plots a scatter that illustrates the relationship between the Sharpe Ratio and portfolio risk for various portfolio configurations. Each point represents a portfolio, with its position on the x-axis indicating its risk level and its position on the y-axis indicating its Sharpe Ratio.
The Sharpe Ratio measures the performance of an investment relative to its risk. A higher Sharpe Ratio indicates better risk-adjusted returns. The plot reveals that as risk increases, there is a general trend of higher Sharpe Ratios, indicating that portfolios with higher volatility tend to offer better risk-adjusted returns. However, the dispersion of points also suggests that not all high-risk portfolios achieve high Sharpe Ratios, highlighting the variability in outcomes based on different portfolio configurations.
This Figure 4 underscores the importance of considering both risk and return simultaneously. While higher risk can potentially lead to higher returns, it is crucial to evaluate portfolios on a risk-adjusted basis, as not all high-risk portfolios offer superior returns. This insight supports the use of multi-objective optimization techniques like NSGA-III, which can help in identifying portfolios that not only optimally balance risk and return but also the skewness and kurtosis of the entire portfolio.
For investors, the NSGA-III results highlight a new frontier in portfolio management. Traditional methods, while foundational, often fail to account for the complexities and uncertainties inherent in modern financial markets. The NSGA-III’s multi-objective optimization provides investors with a more nuanced tool for balancing risk and return, particularly in the context of managing extreme risks and asymmetric return distributions.
The study corroborates findings from Deb and Jain (2014), who demonstrated the superiority of evolutionary algorithms in handling multi-objective problems. Investors can leverage these findings to construct portfolios that are better aligned with their individual risk tolerances and financial goals, especially in unpredictable market conditions.
| 1 | "MOEA/D" stands for Multi-Objective Evolutionary Algorithm based on Decomposition. The core idea of MOEA/D is to decompose a multi-objective optimization problem into a number of scalar optimization subproblems and optimize them simultaneously. |
Author Contributions
John Weirstrass Muteba Mwamba Conceptualized the idea of the paper, collected the data, wrote the python code for the NSGA-III algorithm, and proofread the entire paper. Mr. Leon Mishindo Mbucici wrote the methodology section, the literature review section, the introduction, and collected the references.
Funding
This research received no external funding.
Informed Consent Statement
The study did not involve humans.
Data Availability Statement
The dataset involved in this study comprises the daily returns of major global financial indices, including the FTSE100, SP500, NASDAQ, DAX, ALSI, MOEX, BOVESPA, Shanghai SE Composite, Sensex, and Hang Seng, along with the exchange rate of the South African Rand against the U.S. dollar. The data spans from March 30, 2005, to March 18, 2024. The data were collected from the Thomson Reuters database.
Conflicts of Interest
The authors declare no conflicts of interest.
References
- Azzini, A.; Tettamanzi, A. NSGA-III application to financial portfolio optimization with downside risk and expected shortfall. Computational Economics 2017, 50, 671–692. [Google Scholar]
- Campbell, J.Y.; Viceira, L.M. (2002). Strategic asset allocation: Portfolio choice for long-term investors. Oxford University Press.
- Chen, G.; Li, X.; Zhang, Z. Genetic algorithms for portfolio optimization with downside risk measures. Journal of Economic Dynamics and Control 2020, 110, 103735. [Google Scholar]
- Deb, K.; Jain, H. An evolutionary many-objective optimization algorithm using reference-point-based nondominated sorting approach, part I: Solving problems with box constraints. IEEE Transactions on Evolutionary Computation 2014, 18, 577–601. [Google Scholar] [CrossRef]
- Deb, K.; Pratap, A.; Agarwal, S.; Meyarivan, T. A fast and elitist multi-objective genetic algorithm: NSGA-II. IEEE Transactions on Evolutionary Computation 2002, 6, 182–197. [Google Scholar] [CrossRef]
- DeMiguel, V.; Garlappi, L.; Uppal, R. Optimal versus naive diversification: How inefficient is the 1/N portfolio strategy? Review of Financial Studies 2009, 22, 1915–1953. [Google Scholar] [CrossRef]
- Etchegaray, N. Performance of genetic algorithms in multi-objective portfolio optimization. Journal of Financial Engineering 2021, 8, 215–239. [Google Scholar]
- Gupta, R.; Zhang, X.; Deb, K. A comparative analysis of multi-objective evolutionary algorithms for portfolio optimization. Annals of Operations Research 2021, 297, 457–478. [Google Scholar]
- Harvey, C.R.; Liu, Y.; Zhu, H. …and the cross-section of expected returns. Review of Financial Studies 2016, 29, 5–68. [Google Scholar] [CrossRef]
- He, X.; Zhou, X. Multi-objective optimization in portfolio selection: Incorporating higher-order moments. Computational Economics 2020, 56, 231–248. [Google Scholar]
- Jain, H.; Deb, K. An improved adaptive algorithm for finding a well-distributed set of Pareto-optimal solutions. ACM Transactions on Mathematical Software 2013, 39, 19. [Google Scholar]
- Jorion, P. (2007). Value at risk: The new benchmark for managing financial risk. McGraw-Hill.
- Khodadadi, A.; Moghaddam, F.S.; Dadashzadeh, M. Portfolio optimization using NSGA-III. Financial Markets, Institutions & Instruments 2016, 25, 81–97. [Google Scholar]
- Le Courtois, N.; Xu, L. Cross-sectional stock return and the role of higher moments. Journal of Financial Economics 2023, 141, 120–137. [Google Scholar]
- Li, X.; Chen, G.; Zhang, Z. A comparative study of NSGA-II, NSGA-III, and MOEA/D for financial portfolio optimization. Swarm and Evolutionary Computation 2018, 40, 179–190. [Google Scholar]
- Markowitz, H. Portfolio selection. The Journal of Finance 1952, 7, 77–91. [Google Scholar]
- Merton, R.C. On estimating the expected return on the market: An exploratory investigation. Journal of Financial Economics 1980, 8, 323–361. [Google Scholar] [CrossRef]
- Moreira, A.; Muir, T. Volatility-managed portfolios. Journal of Financial Economics 2017, 125, 607–622. [Google Scholar]
- Ouyang, J.; Li, X.; He, J. NSGA-III for credit risk assessment and asset-liability management. Financial Innovation 2018, 4, 213–229. [Google Scholar]
- Rudolph, G., Hansen, N.; Deb, K. Beyond standard deviation: Downside risk measures in evolutionary multi-objective optimization. IEEE Congress on Evolutionary Computation 2016, 2345-2352.
- Sharpe, W.F. Mutual fund performance. The Journal of Business 1966, 39, 119–138. [Google Scholar] [CrossRef]
- Sorensen, E.H.; Miller, K.L.; Samak, M.R. Long-term wealth accumulation strategies. Journal of Asset Management 2018, 19, 245–255. [Google Scholar]
- Usta, M.; Kantar, Y.M. Mean-variance-skewness-kurtosis portfolio optimization with VaR constraint. Journal of Computational and Applied Mathematics 2011, 235, 4591–4602. [Google Scholar]
- Zhang, Z.; Li, X.; Chen, G. Green investment portfolios: A study on the application of NSGA-III in sustainable finance. Environmental and Resource Economics 2020, 75, 423–445. [Google Scholar]
- Zhou, X.; Li, G.; Zhang, W. Multi-objective evolutionary algorithms in portfolio management: An empirical comparison. Journal of Global Optimization 2011, 51, 241–264. [Google Scholar]
Figure 1.
Risk-reward plot.
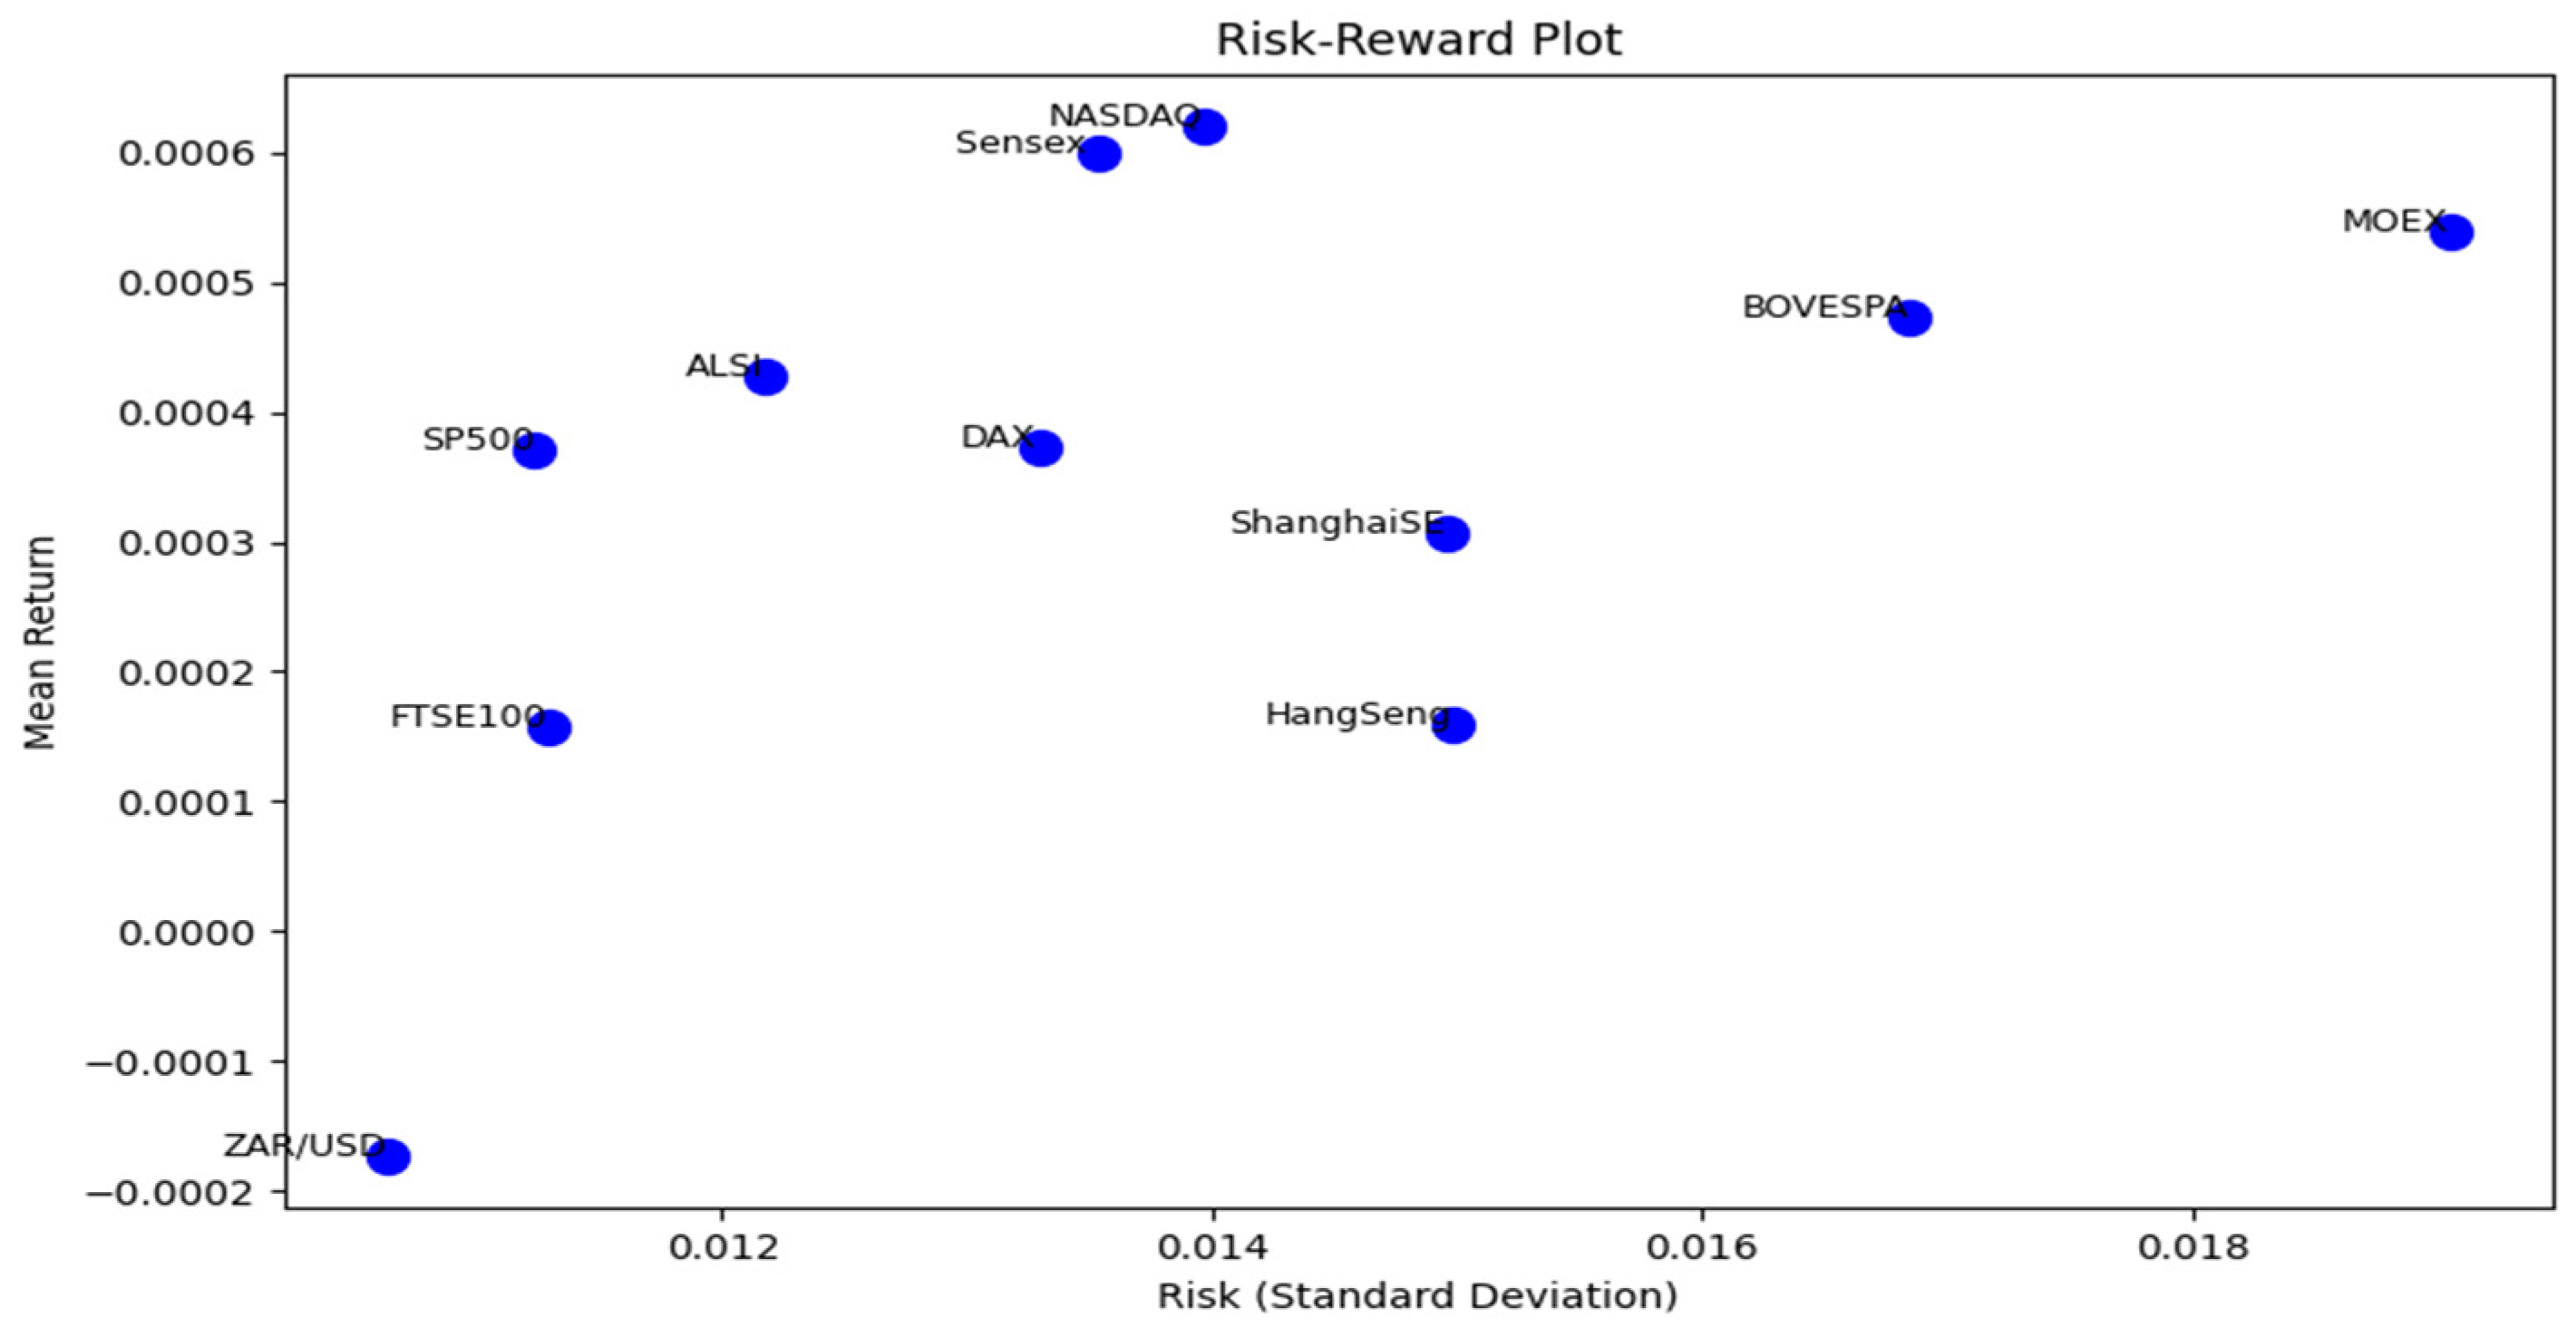
Figure 2.
Efficient Frontier for Multi-objective Optimization using NSGA-III.

Figure 3.
Portfolio optimal weights – NSGA-III Vs Mean-Variance.

Figure 4.
Heatmap of NSGA-III and M-V Portfolio Metrics.
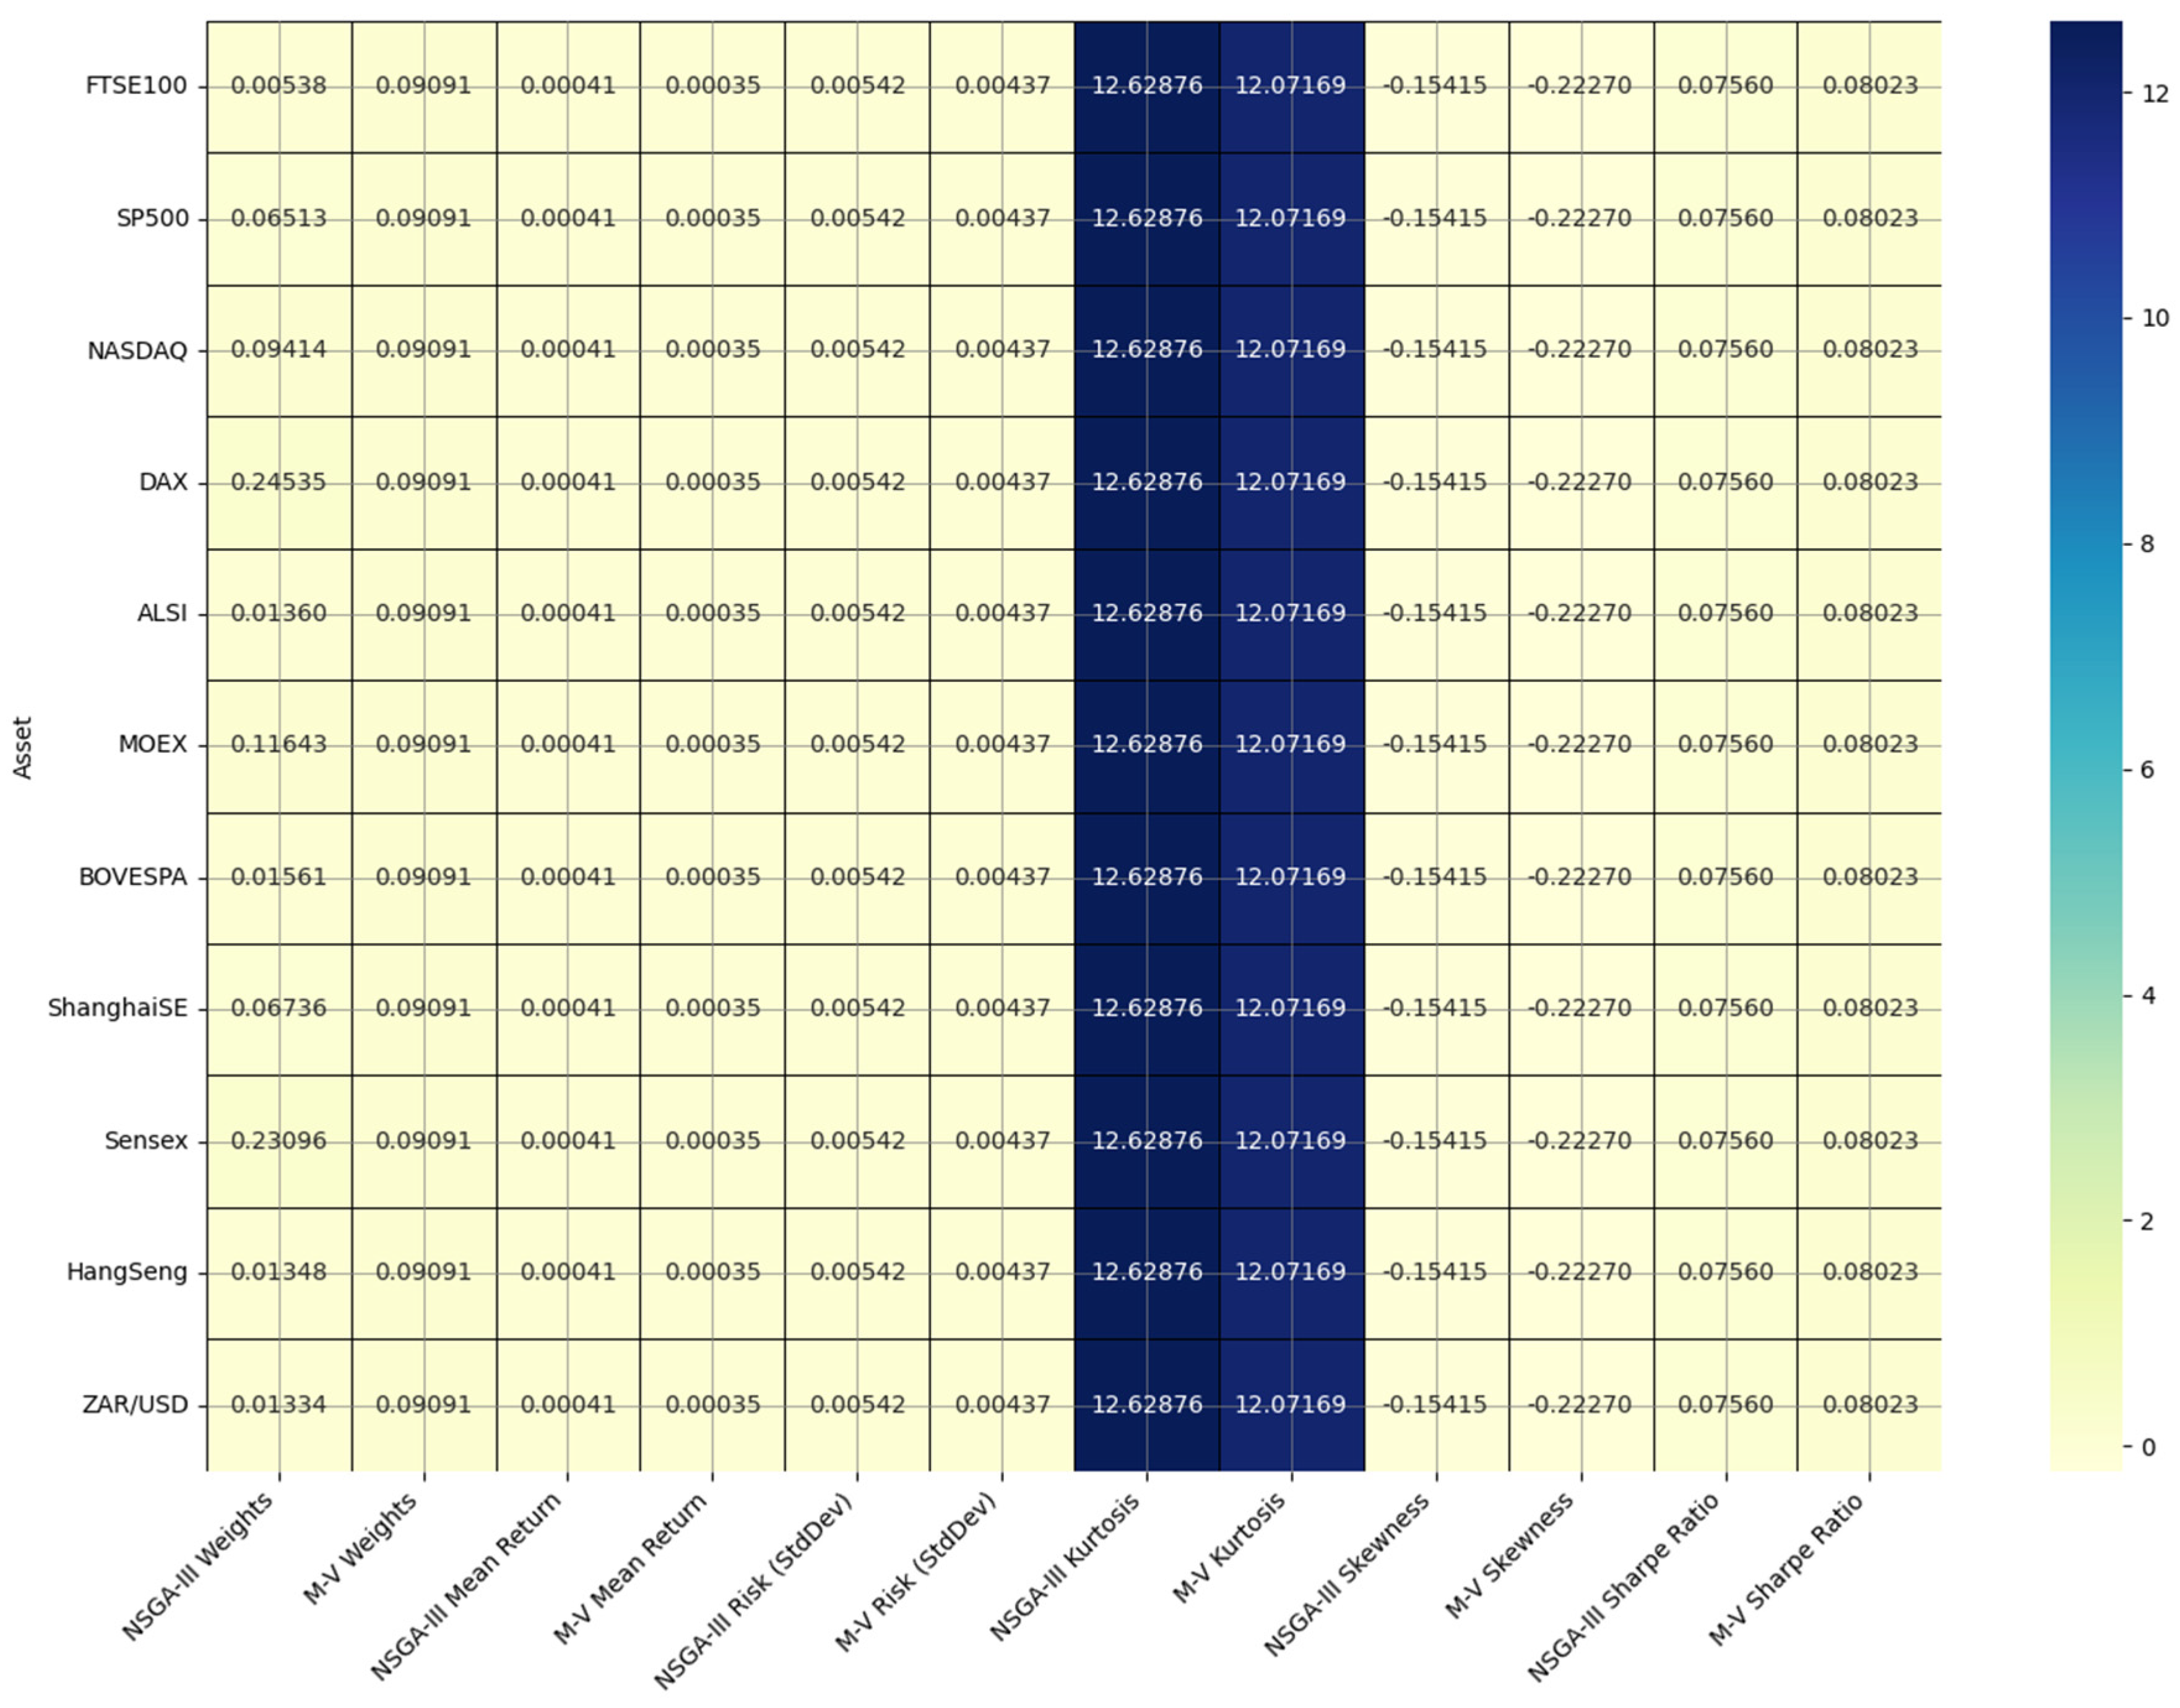
Figure 5.
Sharpe Ration vs Portfolio Risk.
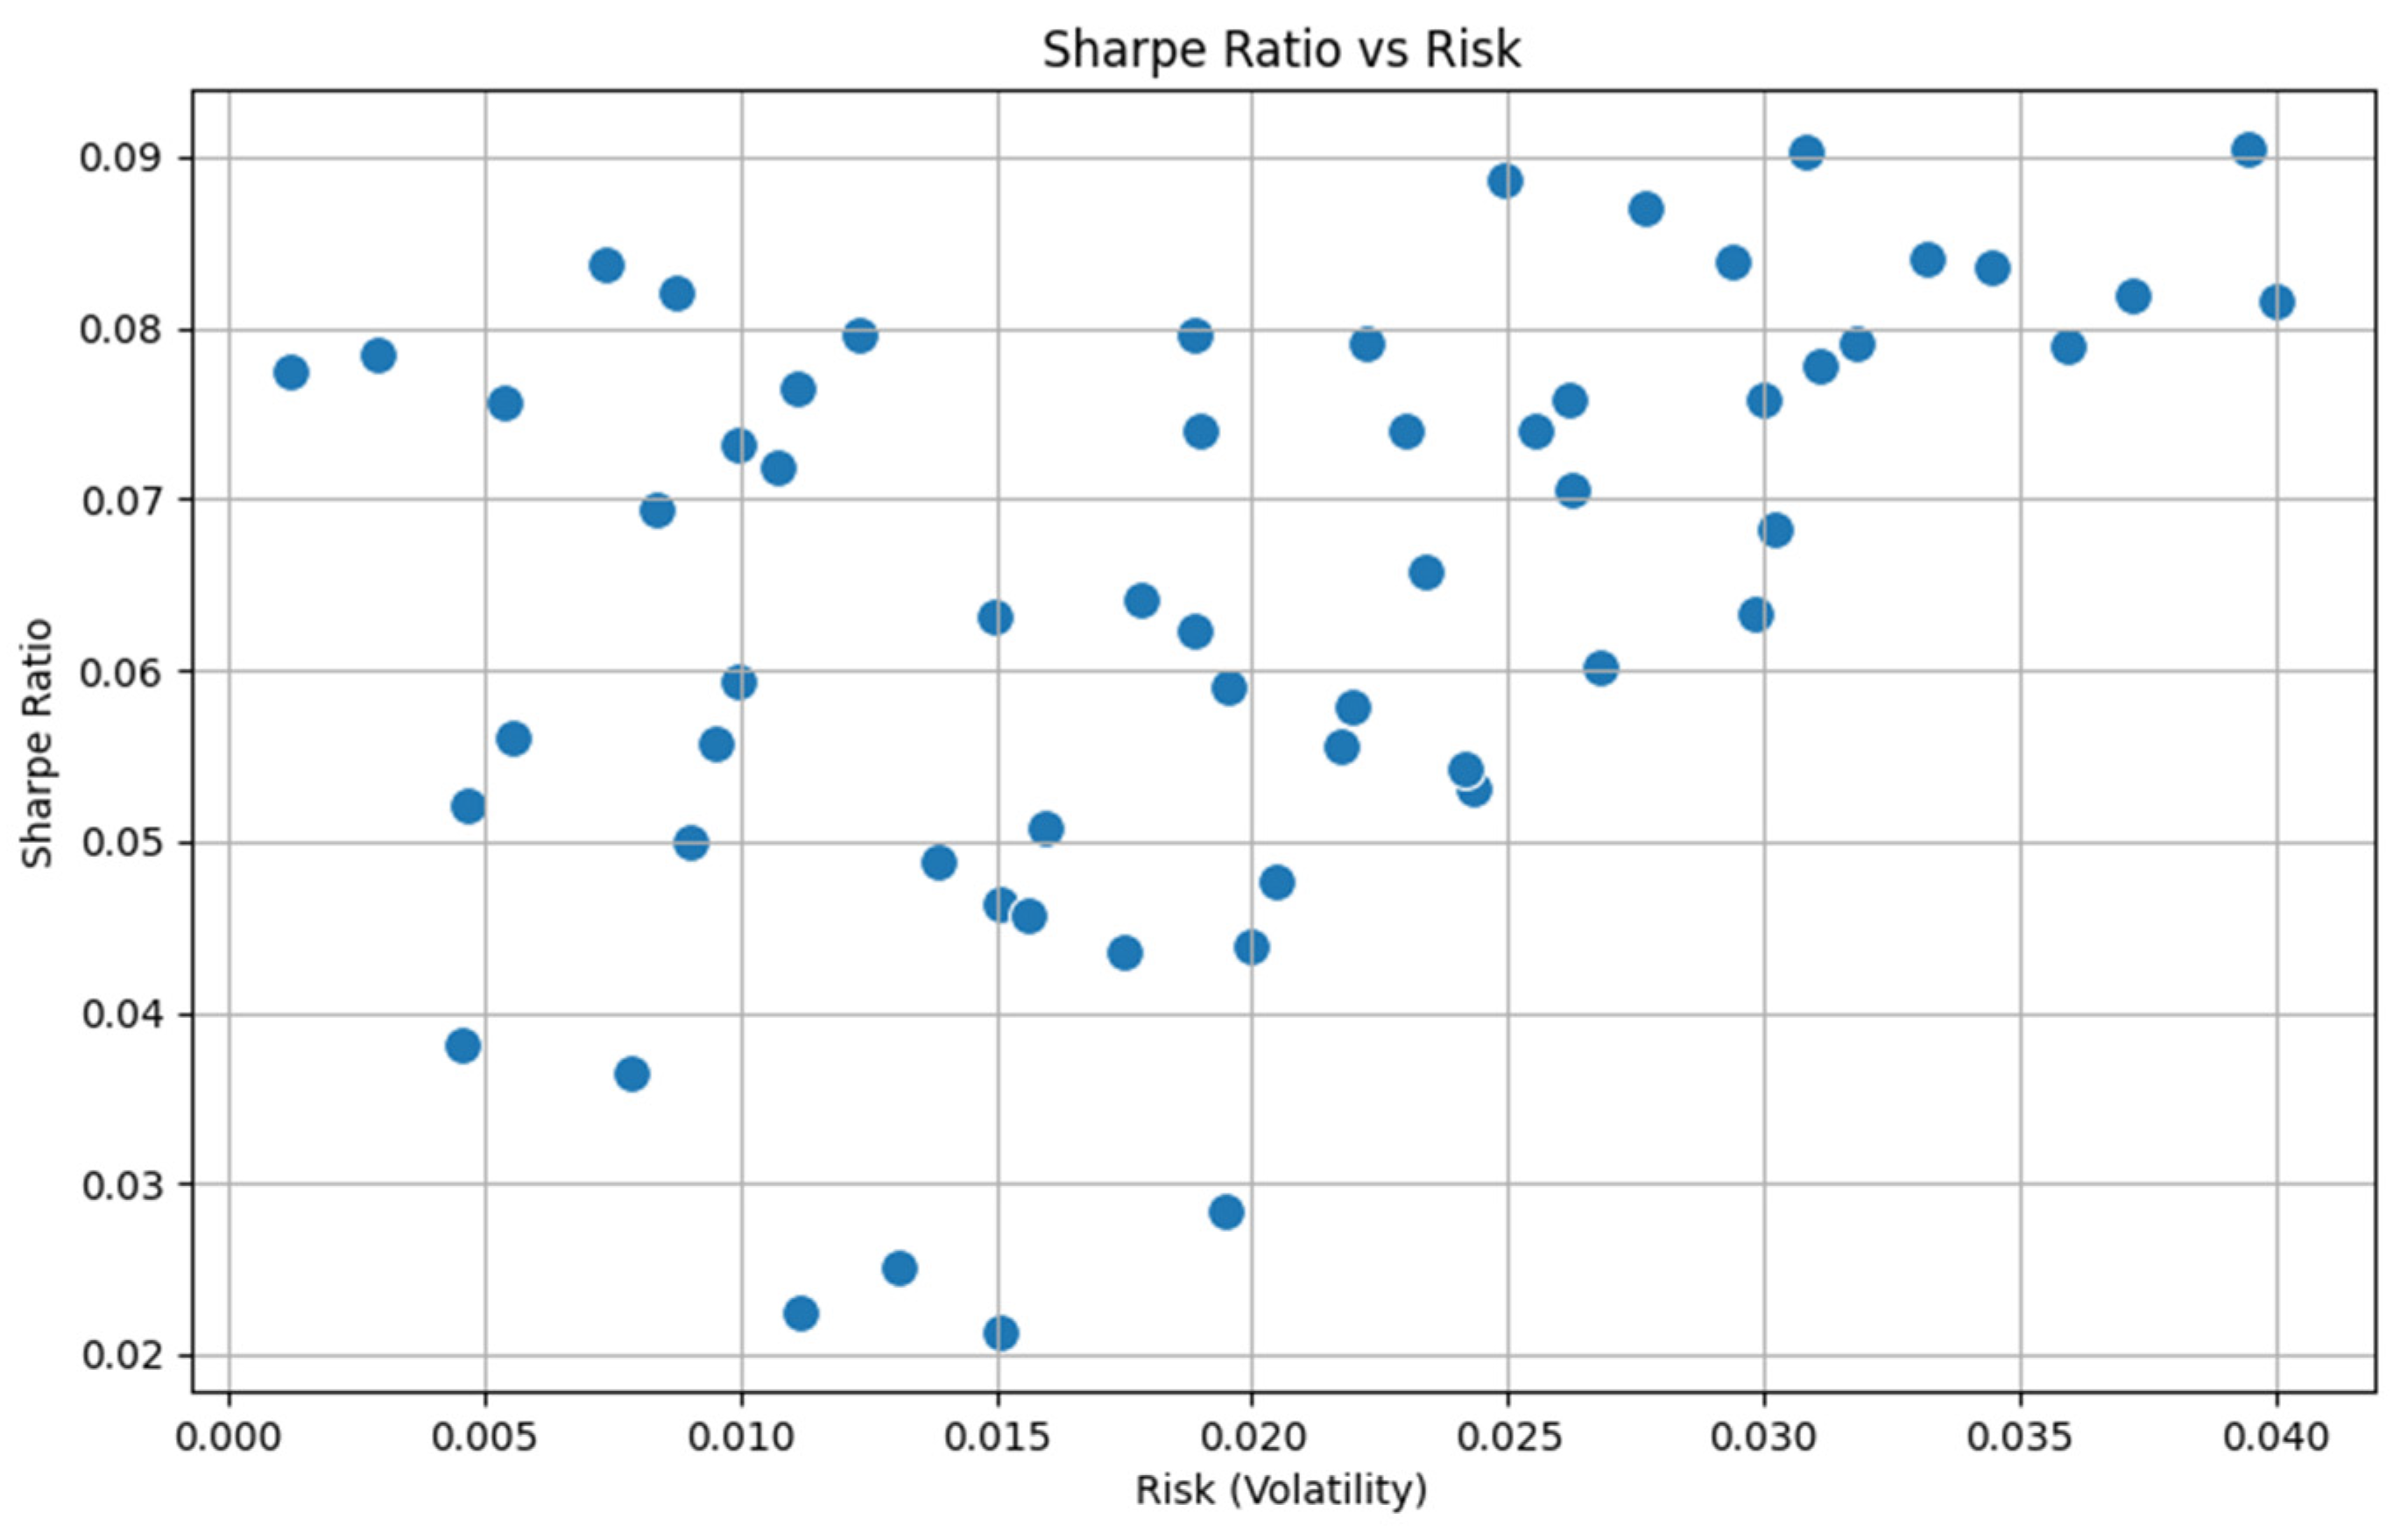

Table 1.
Descriptive Statistics.
| mean | min | 25% | 50% | 75% | max | std | |
|---|---|---|---|---|---|---|---|
| FTSE100 | 0.0002 | -0.1087 | -0.0048 | 0.0005 | 0.0056 | 0.0984 | 0.0113 |
| SP500 | 0.0004 | -0.0911 | -0.0039 | 0.0008 | 0.0055 | 0.1067 | 0.0112 |
| NASDAQ | 0.0006 | -0.1219 | -0.0053 | 0.0011 | 0.0074 | 0.1258 | 0.0140 |
| DAX | 0.0004 | -0.1224 | -0.0055 | 0.0009 | 0.0068 | 0.1140 | 0.0133 |
| ALSI | 0.0004 | -0.0972 | -0.0058 | 0.0006 | 0.0070 | 0.0947 | 0.0122 |
| MOEX | 0.0005 | -0.3328 | -0.0065 | 0.0007 | 0.0083 | 0.2869 | 0.0190 |
| BOVESPA | 0.0005 | -0.1478 | -0.0082 | 0.0007 | 0.0095 | 0.1466 | 0.0168 |
| Shanghai | 0.0003 | -0.0884 | -0.0061 | 0.0006 | 0.0074 | 0.0946 | 0.0150 |
| Sensex | 0.0006 | -0.1315 | -0.0053 | 0.0009 | 0.0070 | 0.1734 | 0.0135 |
| HangSeng | 0.0002 | -0.1270 | -0.0071 | 0.0004 | 0.0075 | 0.1435 | 0.0150 |
| ZAR/USD | -0.0002 | -0.1482 | -0.0063 | 0.0001 | 0.0064 | 0.0729 | 0.0106 |
Table 2.
Optimal weights – NSGA-III vs Mean-Variance.
| Asset | NSGA-III Weights | Mean-Variance Weights | |
|---|---|---|---|
| FTSE100 | 0.005380914 | 0.090909091 | |
| SP500 | 0.065131904 | 0.090909043 | |
| NASDAQ | 0.09413458 | 0.090909031 | |
| DAX | 0.245346234 | 0.090909021 | |
| ALSI | 0.013599018 | 0.090909020 | |
| MOEX | 0.116427505 | 0.090909044 | |
| BOVESPA | 0.015612005 | 0.090909073 | |
| ShanghaiSE | 0.067359999 | 0.090909088 | |
| Sensex | 0.230962637 | 0.090909463 | |
| HangSeng | 0.013477436 | 0.090908304 | |
| ZAR/USD | 0.013334652 | 0.090907432 |
Disclaimer/Publisher’s Note: The statements, opinions and data contained in all publications are solely those of the individual author(s) and contributor(s) and not of MDPI and/or the editor(s). MDPI and/or the editor(s) disclaim responsibility for any injury to people or property resulting from any ideas, methods, instructions or products referred to in the content. |
© 2024 by the authors. Licensee MDPI, Basel, Switzerland. This article is an open access article distributed under the terms and conditions of the Creative Commons Attribution (CC BY) license (http://creativecommons.org/licenses/by/4.0/).
Copyright: This open access article is published under a Creative Commons CC BY 4.0 license, which permit the free download, distribution, and reuse, provided that the author and preprint are cited in any reuse.


