Submitted:
12 September 2024
Posted:
12 September 2024
You are already at the latest version
Preprints on COVID-19 and SARS-CoV-2
Abstract
Background/Objectives:
The COVID-19 pandemic reduced in-person pediatric visits in the United States by over 50%, while telehealth visits increased significantly. The national use of telehealth for children and the factors influencing its use have been rarely studied. This study aimed to investigate the prevalence of telehealth use during the COVID-19 pandemic and explore the potential factors linked to its use at the state level.
Methods:
A cross-sectional study of the National Survey of Children’s Health (2021-22) sponsored by the federal Maternal and Child Health Bureau was performed. We used the least absolute shrinkage and selection operator (LASSO) regression to predict telehealth use during the pandemic. A bar map showing the significant factors from the multivariable regression was created.
Results:
Of the 101,136 children, 15.25% reported using telehealth visits due to COVID-19, and 3.67% reported using telehealth visits due to other health conditions. The Northeast states showed the highest telehealth use due to COVID-19. In the Midwest and Southern states, children had a lower prevalence of telehealth usage unrelated to COVID-19. The LASSO regressions demonstrated that telehealth usage (due to and not due to) was associated with age, insurance type, household income, usual source of pediatric preventive care, perceived child health, blood disorders, allergy, brain injury, seizure, ADHD, anxiety, depression, and special needs.
Conclusions:
This study demonstrated significant variability in the use of telehealth among states during the COVID-19 pandemic. Understanding who uses telehealth and why, as well as identifying access barriers, helps maximize telehealth potential and improve healthcare outcomes for all.
Keywords:
NSCH
; COVID-19
; Telehealth
; Video
; Telephone
; LASSO
; Machine learning
1. Introduction
Severe Acute Respiratory Syndrome Coronavirus 2 (SARSCoV-2), commonly known as COVID-19, was first reported in December 2019 in China. Due to its rapid spread worldwide, it was declared a pandemic on March 11, 2020, by the World Health Organization [1]. This global outbreak directly and indirectly affects regular medical operations and healthcare [2]. As of December 31, 2021, more than 287 million confirmed cases worldwide, with 5.4 million people dying from this disease, which is considered a “once-in-a-century pathogen”[3,4]. During the COVID-19 pandemic, many non-urgent care visits, including primary care visits, had to be postponed or canceled even though healthcare facilities remained open [5,6,7,8]. This led to missed preventive care such as vaccinations, delayed diagnosis of new medical conditions like Type 1 diabetes, and inadequate management of chronic diseases, including obesity, depression, anxiety, and ADHD [9]. A study found that outpatient, emergency department, and inpatient visits decreased significantly by 80.9%, 37.0%, and 30.2%, respectively, across all age groups [10]. In the United States (US), in-person well and acute pediatric visits decreased by more than 50% in 2020 compared to 2019 [9,11]. Additionally, a Canadian study revealed a 58% reduction in pediatric emergency department visits nationwide during the COVID-19 pandemic [12].
However, some technological methods offered potential solutions to address the changes demonstrated in healthcare visits during the pandemic [13,14,15]. A retrospective cohort study among more than four million participants in California found that telehealth usage increased substantially during the COVID-19 pandemic [10]. Another retrospective cohort study also conducted at California’s Stanford Children’s Health revealed that telehealth visits increased by 40% in 2020 compared to 2019 [11]. Telemedicine originated in the 1970s, which meant “healing at a distance.”[16] Chung and Lee’s study further proposed the definition of distance healing into three categories: mHealth (the use of mobile or wireless technologies for healthcare service), dHealth (a wider range of smart and connected devices, including data mining and artificial intelligence, etc.), and eHealth (a broader scope than mHealth, primarily encompassing the use of information and communications technologies) [13]. Telehealth, by definition, refers to healthcare services involving all healthcare professions [17]. It can be considered as both mHealth and dHealth [13]. Based on the National Survey of Children’s Health data, this study defined "telehealth" as any healthcare visit by video or telephone [18].
While previous studies have examined telehealth use among specific populations, there is still limited research exploring, and national information is still lacking. The findings did not represent the U.S. child population's use of telehealth, and the factors affecting its use in children are rarely investigated. This study aimed to examine the prevalence of telehealth use during the COVID-19 pandemic and explored the potential factors associated with telehealth use at the state level.
2. Materials and Methods
2.1. Source of Data
This study utilized the 2021 and 2022 National Survey of Children’s Health (NSCH) database. The SAS dataset from the Child and Adolescent Health Measurement Initiative (CAHMI) was accessed on June 5, 2024, from childhealthdata.org. The Data Resource Center for Child and Adolescent Health, supported by Cooperative Agreement U59MC27866 from the U.S. Department of Health and Human Services, Health Resources and Services Administration (HRSA), Maternal and Child Health Bureau (MCHB), collected comprehensive data on physical and mental health, access to quality health care, and various aspects of children’s family, neighborhood, school, and social contexts [18,19,20]. This data encompasses children aged 0 to 17 across all 50 states and the District of Columbia.
The surveys are administered through both mail and web-based methods by the U.S. Census Bureau,, including the prior version of the NSCH and a second survey that incorporates questions related to children with special needs: “National Survey of Children with Special Health Care Needs.” Additional information about the sampling and administration process, survey methodology, nonresponse bias analysis, and other pertinent information can be found on the survey’s website [19]. The survey results were adjusted to represent the population of noninstitutionalized children nationally and in each state by weighting for demographic factors such as age, sex, race, and household size to provide representative data for each state [21].
2.2. Participants
The NSCH is a public database that does not contain any personal identifiers. The 2021 NSCH survey took place between July 2021 and January 2022, while the 2022 NSCH was conducted from July 2022 to January 2023. After obtaining approval from the Institutional Review Board (IRB) at the primary author’s university (IRB waiver number 24-052), we downloaded the 2021 and 2022 NSCH datasets on 06-06-2024. The combined datasets included a total of 104,995 children. We excluded 3,859 children due to a lack of information on telehealth use, leaving us with 101,136 children for the analyses.
2.3. Study Variables
2.3.1. Outcomes
The use of telehealth during the COVID-19 pandemic was assessed by asking parents whether their child had any healthcare visits by video or phone in the past 12 months and, if so, whether these visits were due to the pandemic. The possible responses were 1) No telehealth visits, 2) Telehealth visits not due to COVID-19, or 3) Telehealth visits due to COVID-19. For the purposes of this study, "had no telehealth visits" was considered as not having telehealth visits. The use of telehealth was then categorized as "telehealth visits not due to COVID-19" or "telehealth visits due to COVID-19."
2.3.2. Covariates
The covariates included in the analyses as potential factors to be regressed on telehealth use were 1) demographics: age, sex, race/ethnicity, child born in the United States, parent’s highest education level, family structure of the child’s household, number of family members, household had difficulty covering basics like food or housing, residence in metropolitan areas, English is the primary language spoken at home and household income, 2) health behaviors: type of Insurance, consistent health insurance coverage during the past 12 months, missed, delayed, or skipped preventive check-ups due to COVID, usual source of pediatric preventive care, personal doctor or nurse for child, perceived child health, 3) parents’ physical and mental health, and 4) health conditions: allergy to food, drug, or insect, asthma, blood disorders, brain injury, cerebral palsy, seizure, attention-deficit/hyperactivity disorder (ADHD), autism spectrum disorder (ASD), headache, Tourette syndrome, anxiety, depression, deafness or problems with hearing, blindness or problems with seeing, and child with special health care needs (CSHCN). The poverty level variable in 2021 had 18.78%, and in 2022 had 19.53% missing values, which were imputed by the U.S. Census Bureau data. The NSCH defines CSHCN as children who have or are at increased risk for chronic physical, developmental, behavioral, or emotional conditions that require more health and related services than other children [18].
2.4. Statistical Methods
The prevalence was calculated using the SAS SURVEYFREQ procedure since subsetting the data by states does not compromise the survey's design structure. The results will represent the population of noninstitutionalized children nationally and in each state[18,21]. To identify predictors for telehealth use during the COVID-19 pandemic, we employed a Least Absolute Shrinkage and Selection Operator (LASSO). The LASSO method is designed to automatically select sparse models with nonzero coefficients for only a small fraction of the predictor (i.e., models with fewer parameters to avoid overfitting problems). The LASSO regression is a type of linear regression using a shrinkage method to bring data values closer to a central point, like the mean. This shrinkage method uses the least square method, which minimizes the sum of squared residuals by adding a shrinkage penalty term. This penalized sum of squared residuals for LASSO regression can be denoted as , where is the actual response value for the ith observation, is the predicted response value based on the multiple linear regression model, the LASSO shrinkage parameter ≥ 0, and β is the LASSO estimator. When λ is 0, the penalty term has no effect. The LASSO estimators are the same as the Ordinary Least Squares (OLS) estimators. However, the LASSO is unlike the OLS model, which can produce very poor predictions when the number of predictors is large relative to the sample size [22]. The LASSO regression helps automatically select a subset of regressors by shrinking many of the estimated coefficients exactly to zero, eliminating those corresponding regressors from the model, and then calculating the coefficients with a moderate level of shrinkage [22]. The LASSO regression uses mean squared prediction error (MSPE) to compare prediction models.
We used the R glmnet package to select variables via LASSO regression. This method determines the optimal penalization coefficient λ value by using 10-fold cross-validation and one-standard error criterion. The 10-fold cross-validation will create 10 separate estimates of the MSPE, each produced sequentially, leaving out one of the 10 subsamples [22]. It forces certain variables with a zero-shrinkage coefficient to be excluded and generates a parsimonious model using the optimal λ value. When selecting optimal models, the study found that using the minimum cross-validation error often results in an overfit model. As a solution, Breiman and colleagues suggested using the maximum (one standard error rule) λ value to create a more parsimonious model [23].
The data was split randomly into the training set (70%) and validation set (30%) within the LASSO method to cross-validate the selected models. The prediction model selected from the training set was applied to the validation set to validate and evaluate the prediction efficacy. The receiver operating characteristic (ROC) curve and the area under the curve (AUC) were estimated to verify the discrimination performance in the training and validation sets. The optimal cutoff also estimated the sensitivity and specificity through Youden's J Index. The Calibration plot with a binary fringe plot and nomogram was created by the R rms package with 1000 bootstrapping re-sample.
For the p-values of univariate models, we used the false discovery rate (FDR) method to adjust the p-values of the multiple comparisons. Factors that were found to be significant in the univariate models were included in the multivariable regression analyses. All analyses were performed in SAS package version 9.4 (SAS Institute Inc, NC, USA) and R package version 4.4.0 (R Core Team 2023. R: A Language and Environment for Statistical Computing. R Foundation for Statistical Computing, Vienna. https://www.R-project.org/). A bar map regarding the significant factors from the multivariable regression was created using the ArcGIS 10.8.2 Online map package (Esri, CA, USA).
3. Results
3.1. Prevalence of Telehealth Use Due to the COVID-19 Pandemic by States
Across the United States, it's estimated that 16,583 (15.25%; 95% Confidence Interval (CI) = [14.77% -15.74%]) U.S. children and adolescents under 18 years old reported that they had healthcare visits by video or phone due to the COVID-19 pandemic, while 3,797 (3.67%; 95% CI = [3.42% -3.92%]) had telehealth visits not related to the pandemic. The use of telehealth due to the COVID-19 pandemic varied widely by state, ranging from 7.0% to 31.9%. Children living in the District of Columbia reported the highest percentage of telehealth use (31.91%; 95% CI = [28.03% - 35.79%]), followed by the State of Massachusetts (27.18%; 95% CI = [24.25% - 30.12%]) and Maryland (25.66%; 95% CI = [25.54%-28.79%]). On the other hand, Idaho (7.43%; 95% CI = [5.68% - 9.19%]), Wyoming (7.40%; 95% CI = [5.79% - 9.01%]), and North Dakota (6.99%; 95% CI = [5.26% - 8.73%]) were the three lowest prevalence of telehealth usage due to COVID-19. (Table 1)
The prevalence of using telehealth not due to the COVID-19 pandemic was lower and ranged from 2.3% to 10.4% between states and districts. The District of Columbia had the highest telehealth usage at 10.35% (95% CI = [7.16% - 13.54%]), followed by the State of Florida at 6.53% (95% CI = [4.74% - 8.32%]) and California at 5.70% (95% CI = [4.25%-7.16%]). North Dakota (2.31%; 95% CI = [1.49% - 3.12%]), Idaho (2.27%; 95% CI = [1.43% - 3.10%]), and Oklahoma (2.26%; 95% CI = [1.49% - 3.04%]) reported the lowest prevalence of telehealth usage not related to COVID-19.
3.2. Univariate Logistic Regression Analyses
3.2.1. Telehealth usage due to COVID-19
The univariate analyses showed that the following factors were associated with the use of telehealth for healthcare visits due to the COVID-19 pandemic. Age, race/ethnicity, parents’ highest education level, living in metropolitan areas, household income, usual source of pediatric preventive care, a personal doctor or nurse for children, child health perception, CSHCN, family structure of the children’s household, number of family members, type of insurance, insurance coverage during the past 12 months, and children’s health conditions (Table 2). We did not find sex and places where children were born that were associated with the use of telehealth.
3.2.2. Telehealth usage NOT due to COVID-19
Table 2 also demonstrated the factors associated with the use of telehealth for healthcare visits not related to the COVID-19 pandemic, including age, parent’s highest education level, number of family members, children living in metropolitan areas, type of insurance, household income, missed preventive care due to COVID-19 pandemic, usual source of pediatric preventive care, a personal doctor or nurse for children, poor child health perception, and CSHCN.
Factors significantly associated with the use of telehealth in the univariate analyses were included in the LASSO regression.
3.3. Multivariable Logistic Regression Modeling by LASSO Method
3.3.1. Telehealth usage due to COVID-19
The LASSO analysis selected 17 variables for the final multivariable logistic regression model (Figure 1). The maximum (one standard error rule) λ = 0.008425. Table 3 demonstrates the multivariable logistic regression of the factors associated with telehealth use due to the COVID-19 pandemic. These factors included insurance type, household income, missed preventive care due to COVID-19, usual source of pediatric preventive care, personal doctor or nurse for child, perceived child health, health conditions (allergy, brain injury, seizure, ADHD, anxiety, and depression), and CSHCN. Parent’s education level was also found to be associated with the use of telehealth. Specifically, compared to household income 400% FPL, children in a household income of 200-399%, 100-199%, and 0-99% FPL were less likely to use telehealth healthcare visits during the pandemic (OR = 0.68; 95% CI = [0.63-0.72], p<0.0001, OR = 0.69; 95% CI = [0.63-0.76], p<0.0001, and OR = 0.64; 95% CI = [0.57-0.72], p<0.0001). Missed preventive care in the past 12 months due to the COVID-19 pandemic were more likely to use telehealth due to COVID-19 (OR = 1.25). Not having a usual source of pediatric preventive care and not having a personal doctor or nurse for children were less likely to use telehealth visits (OR = 0.50; 95% CI = [0.46-0.55], p<0.0001 and OR =0.75; 95% CI = [0.70-0.81], p<0.0001). The perception of children’s health was associated with telehealth visits. Poorer health perception demonstrated more telehealth use (OR = 1.26 in good health perception and OR = 1.98 in fair to poor health perception). Health conditions such as allergy (OR = 1.13), brain injury (OR = 1.35), seizure (OR = 1.80), ADHD (OR = 1.67), anxiety (OR = 2.17), and depression (OR = 1.78) were found to be associated with telehealth use. Children who needed special health care were found to be more likely to use telehealth (OR = 3.04; 95% CI = [2.83-3.26], p<0.0001).
3.3.2. Telehealth usage NOT due to COVID-19
Fifteen variables were selected by the LASSO method for the final multivariable logistic regression model with the minimum λ = 0.001157 (Figure 1). These factors were slightly different from the reason due to COVID-19. They were age, missed preventive care due to COVID-19, usual source of pediatric preventive care, perceived child health, health conditions (blood disorders, anxiety, and depression), and CSHCN. Older children were less likely to use telehealth visits during the pandemic. The ORs were 0.68. Missed preventive care in the past 12 months due to the COVID-19 pandemic were less likely to use telehealth due to COVID-19 (OR = 0.70; 95% CI = [0.60-0.81], p<0.0001). Not having a usual source of pediatric preventive care were less likely to use telehealth visits (OR = 0.73, p=0.0031). The perception of children’s health was associated with telehealth visits. Poorer health perception demonstrated more telehealth use (OR = 1.35 in good health perception and OR = 1.98 in fair to poor health perception). Health conditions such as blood disorder (OR = 2.30), anxiety (OR = 1.41), and depression (OR = 1.83) were found to be associated with telehealth use. Children who needed special healthcare were found to be more likely to use telehealth (OR = 1.72; 95% CI = [1.44-2.06], p<0.0001).
The common factors for telehealth use due to COVID-19 and not due to COVID-19 included missed preventive care due to COVID-19, the usual source of pediatric preventive care, perceived child health, anxiety, depression, and CSHCN.
3.4. Prediction Performance of Selected Model by LASSO method
3.4.1. Telehealth usage due to COVID-19
In the LASSO regression training set, the ROC curve reveals that the resulting model has great discrimination with an area under the curve (AUC) of 0.765 (95% CI: 0.757 - 0.772) (Figure 2A). The validation set also shows great discrimination in LASSO regression, with 0.766 (95% CI: 0.755 - 0.777) AUC. The calibration plots of models were used to provide better information about the selected models, graphically showing good agreement between the predicted and observed data in the training and validation cohorts (Figure 2C,D).
3.4.2. Telehealth usage NOT due to COVID-19
The LASSO regression training set to predict telehealth usage not related to COVID-19 showed good discrimination with an area under the curve (AUC) of 0.640 (95% CI: 0.618 - 0.662) (Figure 2A). The validation set also shows good discrimination in LASSO regression, with 0.621 (95% CI: 0.586 - 0.657) AUC. The calibration plots of models were used to provide better information about the selected models, graphically showing good agreement between the predicted and observed data in the training and validation cohorts (Figure 2C,D). A curve that falls below the 45-degree line means underestimating the probability of the outcome. If the curve is above the line, the model may be overfitting.
3.5. Prevalence Map and Predictors for Telehealth Use
Figure 3 combined different predictors to show potential associations between telehealth usage, health behaviors, and health conditions at the state level. Figure 3A illustrates the associations between telehealth use due to COVID-19, health behaviors, health conditions, and household income at the state level. The Northeast showed the highest telehealth use due to COVID-19. Conversely, the Midwest (Indiana, Nebraska, North Dakota, and South Dakota), South (Alabama, Mississippi, and Tennessee), and West (Idaho, Montana, Nevada, and Wyoming) had the lowest telehealth use rates. These states generally fell into the highest tertile for not being insured, lacking a usual source of pediatric preventive care, not having a personal doctor or nurse for the child, reporting fair to poor health perception, having allergies to drug, food, or insect, experiencing brain injuries, ADHD, anxiety, and depression. Apart from Midwestern states, most states generally had the highest tertile for low household income (0-99% FPL). This was especially evident in the southern states. Three states (Alabama, Mississippi, and Montana) had the highest percentage of special health care needs.
Figure 3B reveals a lower prevalence of telehealth usage during the pandemic, unrelated to COVID-19, in the Midwest (Nebraska, North Dakota, and South Dakota) and Southern states (Alabama, Louisiana, Mississippi, Oklahoma, and Tennessee). These states, especially Louisiana, Mississippi, and Oklahoma, generally had the highest tertile of predictors, such as not having a usual source of pediatric preventive care, fair to poor health perception, anxiety, depression, and CSHCN (Figure 3B). However, Nebraska was an exception, with the lower levels of all the predictors. One difference between the South and the Midwest was the prevalence of blood disorders (e.g., sickle cell disease) in children, with Southern states more likely to be in the highest tertile for blood disorders. On the other hand, nine states (Colorado, Delaware, Iowa, Missouri, New Jersey, Ohio, Rhode Island, Virginia, and Wisconsin) were in the lowest tertile for all predictors. Yet, they still had relatively higher telehealth usage during the pandemic, not related to the disease of COVID-19. Overall, children in the Northeast and West used more telehealth during the pandemic, unrelated to COVID-19.
4. Discussion
The COVID-19 pandemic significantly boosted the need for telehealth services. On average, monthly telehealth visits surged by over 2,500% during the COVID-19 pandemic in 2020 compared to 2019 [15]. The significant rise in telehealth utilization has led to a transformation in healthcare delivery that is expected to endure even after the pandemic. This sets the stage for permanently incorporating pediatric telehealth services following the pandemic [15,24].
This large population-based repeated cross-sectional study, using the National Survey of Children's Health (NSCH) database, included 101,136 children aged 0 to 17 across all 50 states in the US during the COVID-19 pandemic (2021 - 2022). We aimed to investigate the prevalence of telehealth use in US children during the COVID-19 pandemic and explore the potential factors associated with telehealth use at the state level. This study examined the use of telehealth because of 1) COVID-19 and 2) other health conditions during the pandemic. Of the 101,136 children, 16,583 (15.25%) reported using telehealth visits due to COVID-19, and 3,797 (3.67%) reported using telehealth visits due to other health conditions, showing significant variation between states and districts.
In the telehealth usage because of the COVID-19 model, the LASSO regression found that telehealth usage was independently associated with insurance type, household income, missed preventive care due to COVID-19, usual source of pediatric preventive care, personal doctor or nurse for child, perceived child health, allergy, brain injury, seizure, ADHD, anxiety, depression, and CSHCN. On the other hand, the telehealth visits due to other health conditions model selected age, missed preventive care due to COVID-19, usual source of pediatric preventive care, perceived child health, blood disorders, anxiety, depression, and CSHCN as the predictors. This study, the first to investigate telehealth usage during the COVID-19 pandemic in US children between 0 to 17 years, provides crucial insights and emphasizes the need for further research in pediatric telehealth visits. The LASSO regression is a shrinkage variable selection method that avoids overfitting problems in the analysis and overestimating how well the model performs. It can also reduce the complexity of high-dimensional data. The authors deemed that LASSO regression is suitable for selecting predictors of telehealth usage [25,26,27,28,29].
Although the prevalence of telehealth visits varied across the states, we found geographic differences existed in the use of telehealth for both reasons (COVID-19 and other health conditions) during the COVID-19 pandemic. Our study, consistent with previous findings, [24,30] found that midwestern states (Nebraska, North Dakota, and South Dakota) and southern states (Alabama, Mississippi, and Tennessee) had the lowest telehealth usage percentages regardless of the reasons for visits. Although the univariate analyses found that children who lived in a metropolitan area were more likely to use telehealth for both reasons during the pandemic, the LASSO regression did not select this variable in the multivariable models when adjusted for other covariates. This finding was similar to the previous study [31,32]. However, another study conducted in Canada revealed that telehealth visits among rural patients increased from 11 to 147 per 1,000 patients from 2012 to 2019, continuing until June 2020. Meanwhile, the growth in telehealth visits was even more significant for urban patients, rising from 7 to 220 visits per 1,000 patients during the same period [33].
Accessing the quality of internet-based healthcare delivery is gradually being regarded as a superdeterminant of health. It impacts healthcare outcomes more than traditional social determinants of health [34]. The digital divide refers to the gap between those with and without access to reliable broadband or high-speed internet [35]. The States of Nebraska, North Dakota, and South Dakota were in the geographic areas with rural broadband access below the national median or unreliable broadband access, while all three southern states (Alabama, Mississippi, and Tennessee) were considered in the geographic regions with rural broadband access below the national median [36,37,38]. According to the Federal Communications Commission and Broadband Now (https://broadbandnow.com/, a comparison and research website that does not offer internet), 14.5 to 42 million people in the US lack access to reliable broadband service. This internet access discrepancy can significantly impact healthcare visits and health outcomes [36,39,40,41].
Limited broadband availability is associated with reduced use of telehealth services, largely due to financial limitations [41,42,43]. Household income was associated with the use of digital technologies. Wealthier families were more likely to adopt telehealth visits because of COVID-19 care during the pandemic [24,30,42]. This supported our findings, as the children reported a relatively lower household income (0-99% FPL) in the southern states than in other geographic regions, i.e., when they had COVID-19 and needed healthcare visits, they were less likely to use telehealth visits than children living in other states.
The lower broadband accessibility in the three midwestern states (Nebraska, North Dakota, and South Dakota) could be due to factors other than household income. These states have large rural areas with low population densities, making it economically challenging for service providers to establish broadband infrastructure due to high costs and a smaller potential customer base. Additionally, these states' economies are primarily based on agriculture, which may not create as much demand for high-speed internet compared to more urban and industrialized regions, resulting in less investment in broadband infrastructure [44]. This lack of broadband infrastructure became evident during the pandemic, leading to a lack of access to telehealth visits via the Internet (note: connecting to telehealth appointments via phone can be an obstacle due to lower-quality reception). In 2021, the Infrastructure Investment Bill and American Jobs Act allocated $65 billion to improve broadband access and established the Affordable Connectivity Program (ACP). Under this initiative, eligible households can receive a $30 per month discount on their internet subscription and a one-time discount of up to $100 for purchasing a laptop, desktop computer, or tablet [41]. A survey by Education Superhighway (https://www.educationsuperhighway.org/, a nonprofit organization that connects classrooms with high-speed internet) found that 75% of people were unaware of the program’s existence. For example, the survey found 277,968 eligible households in Idaho, 114,650 in North Dakota, and 129,617 in South Dakota, with enrollment rates of 9%, 7%, and 10%, respectively. These rates are lower compared to states with higher enrollment rates, such as Ohio (35%).
Compared to uninsured children, children with either public or private insurance tended to visit healthcare providers through telehealth because of COVID-19. When there was a reliable internet connection (e.g., in the States of Idaho and Nevada), the insurance status could play a role in these children's healthcare experiences, necessitating a more nuanced approach to healthcare provision that considers the unique challenges [19]. Conversely, uninsured children in those internet unmet states (Alabama, Mississippi, Nebraska, North Dakota, and Tennessee) were not in the highest tertiles. In addition, insurance types were not associated with telehealth visits due to other health conditions. Our findings were similar to those of previous studies among adults. The study found that telemedicine visits were not associated with insurance coverage [24]. The Centers for Medicare and Medicaid Services (CMS) 1135 Waiver and Coronavirus Aid, Relief and Economic Security (CARES) Act have established several flexibilities and waivers to help healthcare providers during the COVID-19 pandemic [45,46,47]. Although the CARES Act and CMS 1135 Waiver did not restrict an existing relationship between patients and providers, [46] in southern states like Alabama, Mississippi, and Tennessee, children without a personal doctor or nurse were less likely to use telehealth because of COVID-19. This was not the case in midwestern and western states such as Idaho, Montana, Nebraska, North Dakota, and South Dakota, where children generally had personal doctors or nurses and had lower telehealth use due to COVID-19. Physicians likely tended to use telehealth to treat patients with chronic diseases in fields such as endocrinology, rheumatology, gastroenterology, nephrology, and cardiology who were between 40 and 60 years of age [30,46].
During the pandemic, age was found to be associated with telehealth visits that were not related to COVID-19. Consistent with previous studies, younger children were more likely to use digital technologies than older ones [48]. Research also indicated that parents of children with disabilities use the internet more frequently compared to parents of healthy children. Studies have demonstrated that online supports offer valuable practical and emotional assistance to parents, particularly when their child's disability is uncommon [48,49,50]. The lockdown resulted in the cessation of in-person healthcare services for children with disabilities who were particularly vulnerable to the pandemic’s impact on healthcare delivery. These children may have varying clinical conditions. However, they all have common special healthcare needs that demand intensive interventions [51,52,53]. This explained the findings of our study that children with special health care needs care were more likely to use telehealth during the pandemic. However, there are many potential barriers to the use of telehealth on CSHCN. About 27% of parents reported feeling unprepared for and unsupported in the level of expected involvement in their child's therapeutic services during the pandemic [54].
Regardless of the reasons for using telehealth visits, anxiety, depression, and CSHCN were found to be independently associated with telehealth use during the pandemic. Mental health was the most commonly concerned health condition that used telehealth visits during the COVID-19 pandemic [55,56]. Our findings are consistent with the previous studies. A study found a rapid increase in telehealth usage for mood and anxiety disorders (74.7%), psychosis (73.2%), substance use (83.6%), social problems (64.6%), and neurodevelopmental disorders (69.8%) from March 2020 through February 2021 [57]. This increase could be due to the increased incidences of mental health during the COVID-19 pandemic [58].
4.1. Study Limitations
This study has limitations as it did not explore household internet accessibility. Future studies should consider including this factor to better understand the reasons for children's use of telehealth. This would lead to a more comprehensive understanding of the factors influencing telehealth usage. The questionnaire asked if the child had any healthcare visits by video or phone in the past 12 months, not due to COVID-19 or due to COVID-19. The use of telehealth was only counted once in the dataset. However, it's possible that children used telehealth for other health conditions and later used it due to COVID-19 in the past 12 months. This may underestimate the prevalence of telehealth usage. The findings of this study were based on the US child population; the generalization to other populations may be inappropriate. Lastly, this is a cross-sectional study, the causational inference of the association between predictors and telehealth use should be cautious.
4.2. Conclusions
The increased use of telehealth during the COVID-19 pandemic is expected to continue even after the pandemic ends. This trend presents an opportunity to revolutionize healthcare delivery. To ensure that telehealth remains a significant and beneficial part of healthcare, it is important to understand who is using the technology effectively and why, as well as to identify any barriers to access. By addressing these issues, we can maximize the potential of telehealth and improve healthcare outcomes for all.
Author Contributions
Conceptualization, Y-SL and JS.; methodology, Y-SL and JS; data analysis and curation, Y-SL, JS, and ST; writing—original draft preparation, Y-SL; writing—review and editing, Y-SL, JS, MES, SH, ST, and MYC; supervision, JS and MES. All authors have read and agreed to the published version of the manuscript.
Funding
This research received no external funding.
Institutional Review Board Statement
The study is waived of IRB review with the number 24-052.
Data Availability Statement
All data is provided within the manuscript.
Conflicts of Interest
The authors declare no conflicts of interest.
References
- Ciotti, M.; Ciccozzi, M.; Terrinoni, A.; Jiang, W.-C.; Wang, C.-B.; Bernardini, S. The COVID-19 pandemic. Critical reviews in clinical laboratory sciences 2020, 57, 365–388. [Google Scholar] [CrossRef] [PubMed]
- Hwang, Y.; Khasag, A.; Jia, W.; Jenkins, A.; Huang, C.-N.; Yabe, D.; Kim, D.-M.; Kadowaki, T.; Lee, M.-K. Diabetes and COVID-19: IDF perspective in the Western Pacific region. diabetes research and clinical practice 2020, 166, 108278. [Google Scholar] [CrossRef] [PubMed]
- Padhan, R.; Prabheesh, K. The economics of COVID-19 pandemic: A survey. Economic analysis and policy 2021, 70, 220–237. [Google Scholar] [CrossRef]
- Msemburi, W.; Karlinsky, A.; Knutson, V.; Aleshin-Guendel, S.; Chatterji, S.; Wakefield, J. The WHO estimates of excess mortality associated with the COVID-19 pandemic. Nature 2023, 613, 130–137. [Google Scholar] [CrossRef]
- Boxley, C.; Dixit, R.; Adams, K.; Anderson, R.; Ratwani, R.M.; Booker, E. The impact of COVID-19 on primary care accessibility and the role of telehealth for patients with chronic conditions. Health Policy and Technology 2023, 12, 100772. [Google Scholar] [CrossRef] [PubMed]
- Hangartner, N.; Di Gangi, S.; Elbl, C.; Senn, O.; Bisatz, F.; Fehr, T. Impact of the COVID-19 pandemic on emergency outpatient consultations and admissions of non-COVID-19 patients (ECCO)—A cross-sectional study. PLoS ONE 2022, 17, e0269724. [Google Scholar] [CrossRef]
- Sisó-Almirall, A.; Kostov, B.; Sánchez, E.; Benavent-Àreu, J.; González-de Paz, L. Impact of the COVID-19 pandemic on primary health care disease incidence rates: 2017 to 2020. The Annals of Family Medicine 2022, 20, 63–68. [Google Scholar] [CrossRef] [PubMed]
- Haileamlak, A. The impact of COVID-19 on health and health systems. Ethiopian Journal of Health Sciences 2021, 31, 1073. [Google Scholar]
- Brown, C.L.; Montez, K.; Amati, J.B.; Simeonsson, K.; Townsend, J.D.; Orr, C.J.; Palakshappa, D. Impact of COVID-19 on pediatric primary care visits at four academic institutions in the Carolinas. International journal of environmental research and public health 2021, 18, 5734. [Google Scholar] [CrossRef]
- Xu, S.; Glenn, S.; Sy, L.; Qian, L.; Hong, V.; Ryan, D.S.; Jacobsen, S. Impact of the COVID-19 pandemic on health care utilization in a large integrated health care system: Retrospective cohort study. Journal of medical Internet research 2021, 23, e26558. [Google Scholar] [CrossRef]
- Cahan, E.M.; Maturi, J.; Bailey, P.; Fernandes, S.; Addala, A.; Kibrom, S.; Krissberg, J.R.; Smith, S.M.; Shah, S.; Wang, E. The impact of telehealth adoption during COVID-19 pandemic on patterns of pediatric subspecialty care utilization. Academic Pediatrics 2022, 22, 1375–1383. [Google Scholar] [CrossRef] [PubMed]
- Finkelstein, Y.; Maguire, B.; Zemek, R.; Osmanlliu, E.; Kam, A.J.; Dixon, A.; Desai, N.; Sawyer, S.; Emsley, J.; Lynch, T. Effect of the COVID-19 pandemic on patient volumes, acuity, and outcomes in pediatric emergency departments: A nationwide study. Pediatric emergency care 2021, 37, 427–434. [Google Scholar] [CrossRef] [PubMed]
- Chuang, M.Y. , Lee Y-S. Exploring Technology Domains for Diabetes Care and Management under Pandemic: A preliminary scoping review. Asia Pacific Journal of Health Management 2023, 18, 281–309. [Google Scholar]
- Doraiswamy, S.; Abraham, A.; Mamtani, R.; Cheema, S. Use of telehealth during the COVID-19 pandemic: Scoping review. Journal of medical Internet research 2020, 22, e24087. [Google Scholar] [CrossRef]
- Williams, S.; Hill, K.; Xie, L.; Mathew, M.S.; Ofori, A.; Perry, T.; Wesley, D.; Messiah, S.E. Pediatric telehealth expansion in response to COVID-19. Frontiers in pediatrics 2021, 9, 642089. [Google Scholar] [CrossRef]
- Strehle, E.; Shabde, N. One hundred years of telemedicine: Does this new technology have a place in paediatrics? Archives of disease in childhood 2006, 91, 956–959. [Google Scholar] [CrossRef]
- Organization, W.H. Telemedicine: Opportunities and developments in member states - Report on the second global survey on eHealth (Global Observatory for eHealth Series, 2); Geneva, Switzerland, (2010).
- NSCH. National Survey of Children’s Health. Available online: https://www.childhealthdata.org/learn-about-the-nsch/methods (accessed on 5/30).
- Gurney, J.G.; McPheeters, M.L.; Davis, M.M. Parental report of health conditions and health care use among children with and without autism: National Survey of Children's Health. Archives of pediatrics & adolescent medicine 2006, 160, 825–830. [Google Scholar]
- Child; Initiative, A.H.M. National Survey of Children’s Health (2 Years Combined Data Set): SPSS Data Set.[Internet]. Child and Adolescent Health Measurement Initiative, 2021.
- Shaw, T.E.; Currie, G.P.; Koudelka, C.W.; Simpson, E.L. Eczema prevalence in the United States: Data from the 2003 National Survey of Children's Health. Journal of Investigative Dermatology 2011, 131, 67–73. [Google Scholar] [CrossRef]
- Stock, J.H.; Watson, M.W. Introduction to econometrics; Pearson: 2020.
- Breiman, L. Classification and regression trees; Routledge: 2017.
- Chang, E.; Penfold, R.B.; Berkman, N.D. Patient characteristics and telemedicine use in the US, 2022. JAMA network open 2024, 7, e243354–e243354. [Google Scholar] [CrossRef]
- Ing, E.B.; Ing, R. The use of a nomogram to visually interpret a logistic regression prediction model for giant cell arteritis. Neuro-Ophthalmology 2018, 42, 284–286. [Google Scholar] [CrossRef]
- Zlotnik, A.; Abraira, V. A general-purpose nomogram generator for predictive logistic regression models. The Stata Journal 2015, 15, 537–546. [Google Scholar] [CrossRef]
- Chun, F.K.-H.; Graefen, M.; Briganti, A.; Gallina, A.; Hopp, J.; Kattan, M.W.; Huland, H.; Karakiewicz, P.I. Initial biopsy outcome prediction—Head-to-head comparison of a logistic regression-based nomogram versus artificial neural network. European urology 2007, 51, 1236–1243. [Google Scholar] [CrossRef] [PubMed]
- Bertens, L.C.; Moons, K.G.; Rutten, F.H.; van Mourik, Y.; Hoes, A.W.; Reitsma, J.B. A nomogram was developed to enhance the use of multinomial logistic regression modeling in diagnostic research. Journal of clinical epidemiology 2016, 71, 51–57. [Google Scholar] [CrossRef] [PubMed]
- Shin, M.-S.; Lee, J.-Y. Building a Nomogram for Metabolic Syndrome Using Logistic Regression with a Complex Sample—A Study with 39,991,680 Cases. In Proceedings of the Healthcare; 2022; p. 372. [Google Scholar]
- Doximity. 2020 State of Telemedicine Report: Examining Patient Perspectives and Physician Adoption of Telemedicine Since the COVID-19 Pandemic. Available online: https://c8y.doxcdn.com/image/upload/Press%20Blog/Research%20Reports/2020-state-telemedicine-report.pdf (accessed on.
- Huang, M.; Wen, A.; He, H.; Wang, L.; Liu, S.; Wang, Y.; Zong, N.; Yu, Y.; Prigge, J.E.; Costello, B.A. Midwest rural-urban disparities in use of patient online services for COVID-19. The Journal of Rural Health 2022, 38, 908–915. [Google Scholar] [CrossRef] [PubMed]
- Pullyblank, K.; Krupa, N.; Scribani, M.; Chapman, A.; Kern, M.; Brunner, W. Trends in telehealth use among a cohort of rural patients during the COVID-19 pandemic. Digital Health 2023, 9, 20552076231203803. [Google Scholar] [CrossRef]
- Chu, C.; Cram, P.; Pang, A.; Stamenova, V.; Tadrous, M.; Bhatia, R.S. Rural telemedicine use before and during the COVID-19 pandemic: Repeated cross-sectional study. Journal of medical Internet research 2021, 23, e26960. [Google Scholar] [CrossRef]
- Turcios, Y. Digital access: A super determinant of health. Substance Abuse and Mental Health Services Administration 2023, 1–9. [Google Scholar]
- Philip, L.; Cottrill, C.; Farrington, J.; Williams, F.; Ashmore, F. The digital divide: Patterns, policy and scenarios for connecting the ‘final few’in rural communities across Great Britain. Journal of rural studies 2017, 54, 386–398. [Google Scholar] [CrossRef]
- Commission, F.C. Mapping broadband health in America. Accessed on March 2020, 28. [Google Scholar]
- Stewart, A. Internet Access Measures the Impact of the Digital Divide and COVID-19. Available online: https://www.shadac.org/news/internet-access-measures-impact-digital-divide-and-covid-19 (accessed on.
- U.S. Department of Commerce, C.B. U.S. Department of Commerce, C.B. 2015 American Community Survey (ACS) Public Use Microdata Sample (PUMS) data. Available online: https://www.census.gov/programs-surveys/acs/microdata.html (accessed on.
- Obermier, T.R. Residential internet access cost in Nebraska. Great Plains Research 2018, 28, 149–154. [Google Scholar] [CrossRef]
- Commission, F.C. Eighth Broadband Progress Report. Available online: https://www.fcc.gov/reports-research/reports/broadband-progress-reports/eighth-broadband-progress-report (accessed on.
- ForbesAdvisor. Millions Of Americans Are Still Missing Out On Broadband Access And Leaving Money On The Table—Here’s Why. Available online: https://www.forbes.com/advisor/personal-finance/millions-lack-broadband-access/ (accessed on.
- Kyle, M.A.; Blendon, R.J.; Findling, M.G.; Benson, J.M. Telehealth use and satisfaction among US households: Results of a national survey. Journal of patient experience 2021, 8, 23743735211052737. [Google Scholar] [CrossRef] [PubMed]
- Sisk, B.; Alexander, J.; Bodnar, C.; Curfman, A.; Garber, K.; McSwain, S.D.; Perrin, J.M. Pediatrician attitudes toward and experiences with telehealth use: Results from a national survey. Academic pediatrics 2020, 20, 628–635. [Google Scholar] [CrossRef]
- Administration, N.T.a.I. Office of Internet Connectivity and Growth 2023 Annual Report. Available online: https://www.ntia.gov/report/2024/office-internet-connectivity-and-growth-2023-annual-report (accessed on.
- Services, C.f.M.a.M. Coronavirus waivers & flexibilities. Available online: https://www.cms.gov/coronavirus-waivers (accessed on.
- Shaver, J. The state of telehealth before and after the COVID-19 pandemic. Primary Care: Clinics in Office Practice 2022, 49, 517–530. [Google Scholar] [CrossRef] [PubMed]
- Khera, N.; Knoedler, M.; Meier, S.K.; TerKonda, S.; Williams, R.D.; Wittich, C.M.; Coffey, J.D.; Demaerschalk, B.M. Payment and Coverage Parity for Virtual Care and In-Person Care: How Do We Get There? Telemedicine Reports 2023, 4, 100–108. [Google Scholar] [CrossRef] [PubMed]
- Baumann, I.; Jaks, R.; Robin, D.; Juvalta, S.; Dratva, J. Parents’ health information seeking behaviour–does the child’s health status play a role? BMC family practice 2020, 21, 1–9. [Google Scholar] [CrossRef]
- Yardi, S.; Caldwell, P.H.; Barnes, E.H.; Scott, K.M. Determining parents' patterns of behaviour when searching for online information on their child's health. Journal of paediatrics and child health 2018, 54, 1246–1254. [Google Scholar] [CrossRef]
- Nicholas, D.; McNeill, T.; Montgomery, G.; Stapleford, C.; McClure, M. Communication features in an online group for fathers of children with spina bifida: Considerations for group development among men. Social Work with Groups 2004, 26, 65–80. [Google Scholar] [CrossRef]
- Provenzi, L.; Grumi, S.; Borgatti, R. Alone with the kids: Tele-medicine for children with special healthcare needs during COVID-19 emergency. Frontiers in psychology 2020, 11, 2193. [Google Scholar] [CrossRef]
- Aishworiya, R.; Kang, Y.Q. Including children with developmental disabilities in the equation during this COVID-19 pandemic. Journal of autism and developmental disorders 2021, 51, 2155–2158. [Google Scholar] [CrossRef]
- Riley, E.N.; Cordell, K.D.; Shimshock, S.M.; Perez Figueroa, R.E.; Lyons, J.S.; Vsevolozhskaya, O.A. Evaluation of telehealth in child behavioral health services delivery during the COVID-19 pandemic. Psychiatric Services 2023, 74, 237–243. [Google Scholar] [CrossRef]
- Pinkerton, L.M.; Murphy, A.; Bruckner, E.; Risser, H. Therapy service delivery for children with disabilities during COVID-19: Parent perceptions and implementation recommendations. Journal of Community Psychology 2023, 51, 2430–2441. [Google Scholar] [CrossRef] [PubMed]
- Cunningham, N.R.; Ely, S.L.; Garcia, B.N.B.; Bowden, J. Addressing pediatric mental health using telehealth during coronavirus disease-2019 and beyond: A narrative review. Academic pediatrics 2021, 21, 1108–1117. [Google Scholar] [CrossRef] [PubMed]
- Schweiberger, K.; Hoberman, A.; Iagnemma, J.; Schoemer, P.; Squire, J.; Taormina, J.; Wolfson, D.; Ray, K.N. Practice-level variation in telemedicine use in a pediatric primary care network during the COVID-19 pandemic: Retrospective analysis and survey study. Journal of medical internet research 2020, 22, e24345. [Google Scholar] [CrossRef] [PubMed]
- Saunders, N.R.; Toulany, A.; Deb, B.; Strauss, R.; Vigod, S.N.; Guttmann, A.; Chiu, M.; Huang, A.; Fung, K.; Chen, S. Acute mental health service use following onset of the COVID-19 pandemic in Ontario, Canada: A trend analysis. Canadian Medical Association Open Access Journal 2021, 9, E988–E997. [Google Scholar] [CrossRef]
- Madigan, S.; Racine, N.; Vaillancourt, T.; Korczak, D.J.; Hewitt, J.M.; Pador, P.; Park, J.L.; McArthur, B.A.; Holy, C.; Neville, R.D. Changes in depression and anxiety among children and adolescents from before to during the COVID-19 pandemic: A systematic review and meta-analysis. JAMA pediatrics 2023. [Google Scholar] [CrossRef]
Figure 1.
Identification of the optimal penalization coefficient λ in the LASSO regression. (A,B) are telehealth visits were due to COVID-19; (C,D) are Telehealth Visits but Not Due to COVID-19.
Figure 1.
Identification of the optimal penalization coefficient λ in the LASSO regression. (A,B) are telehealth visits were due to COVID-19; (C,D) are Telehealth Visits but Not Due to COVID-19.
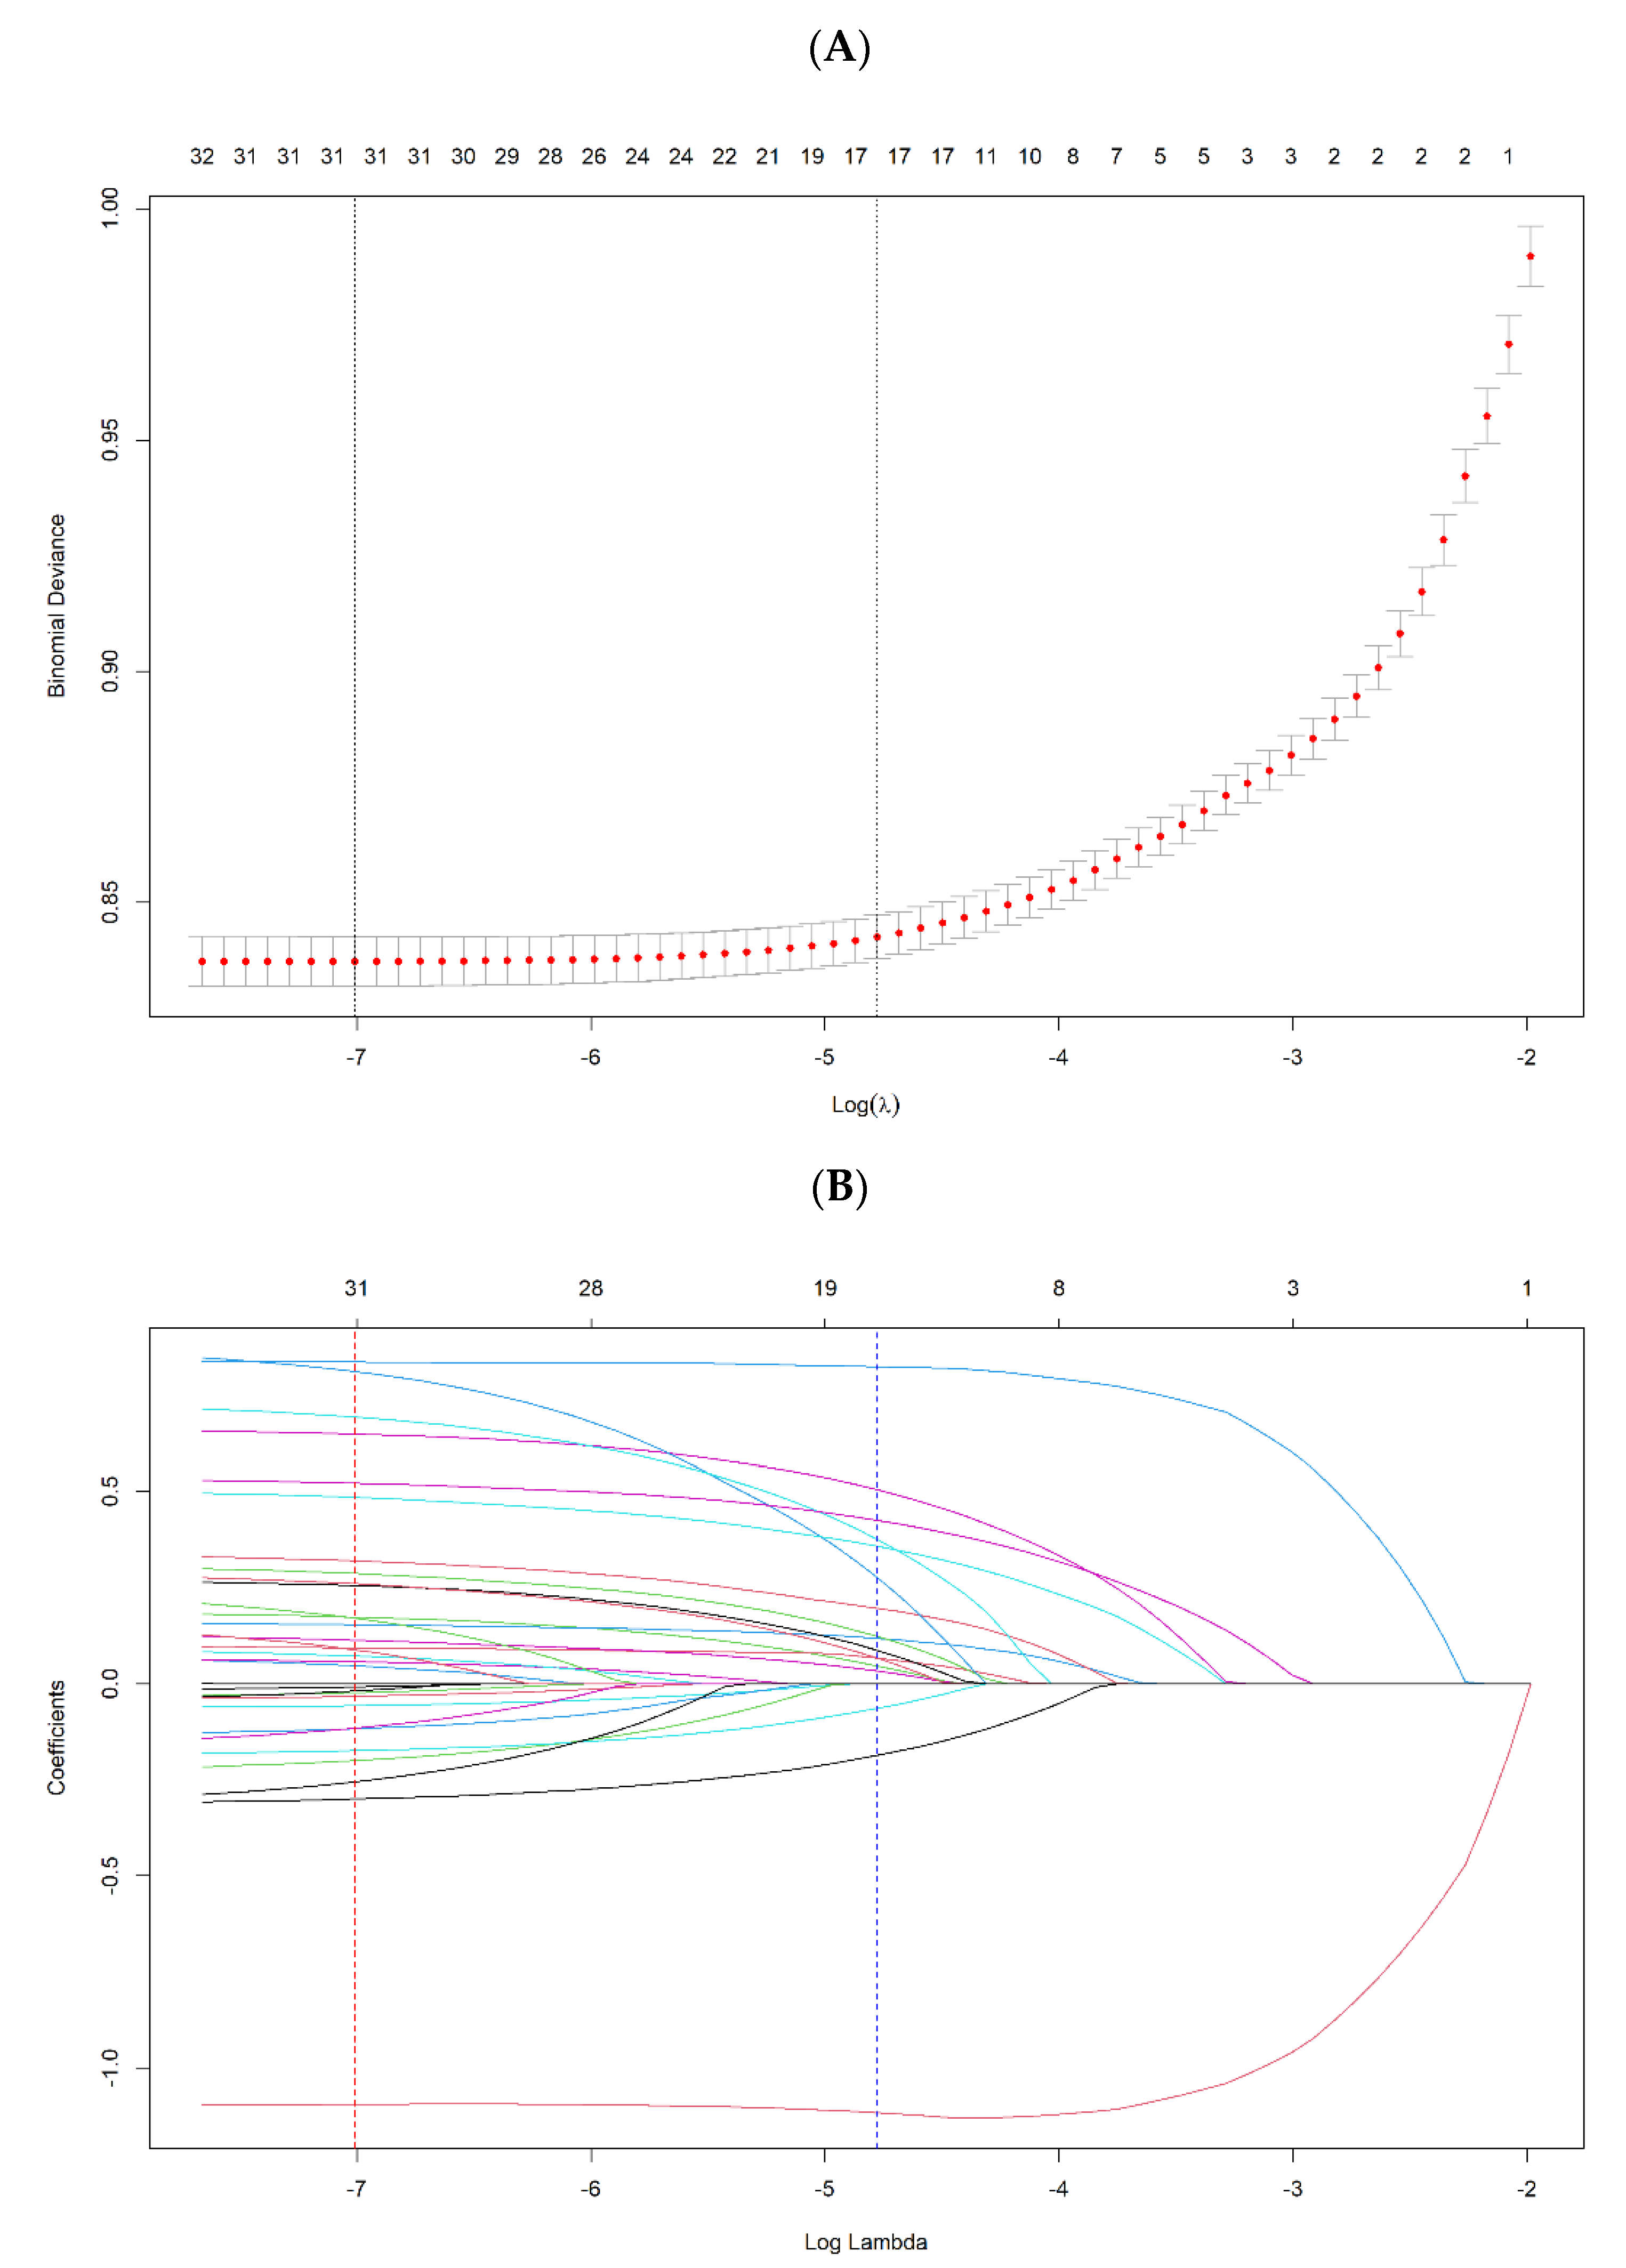
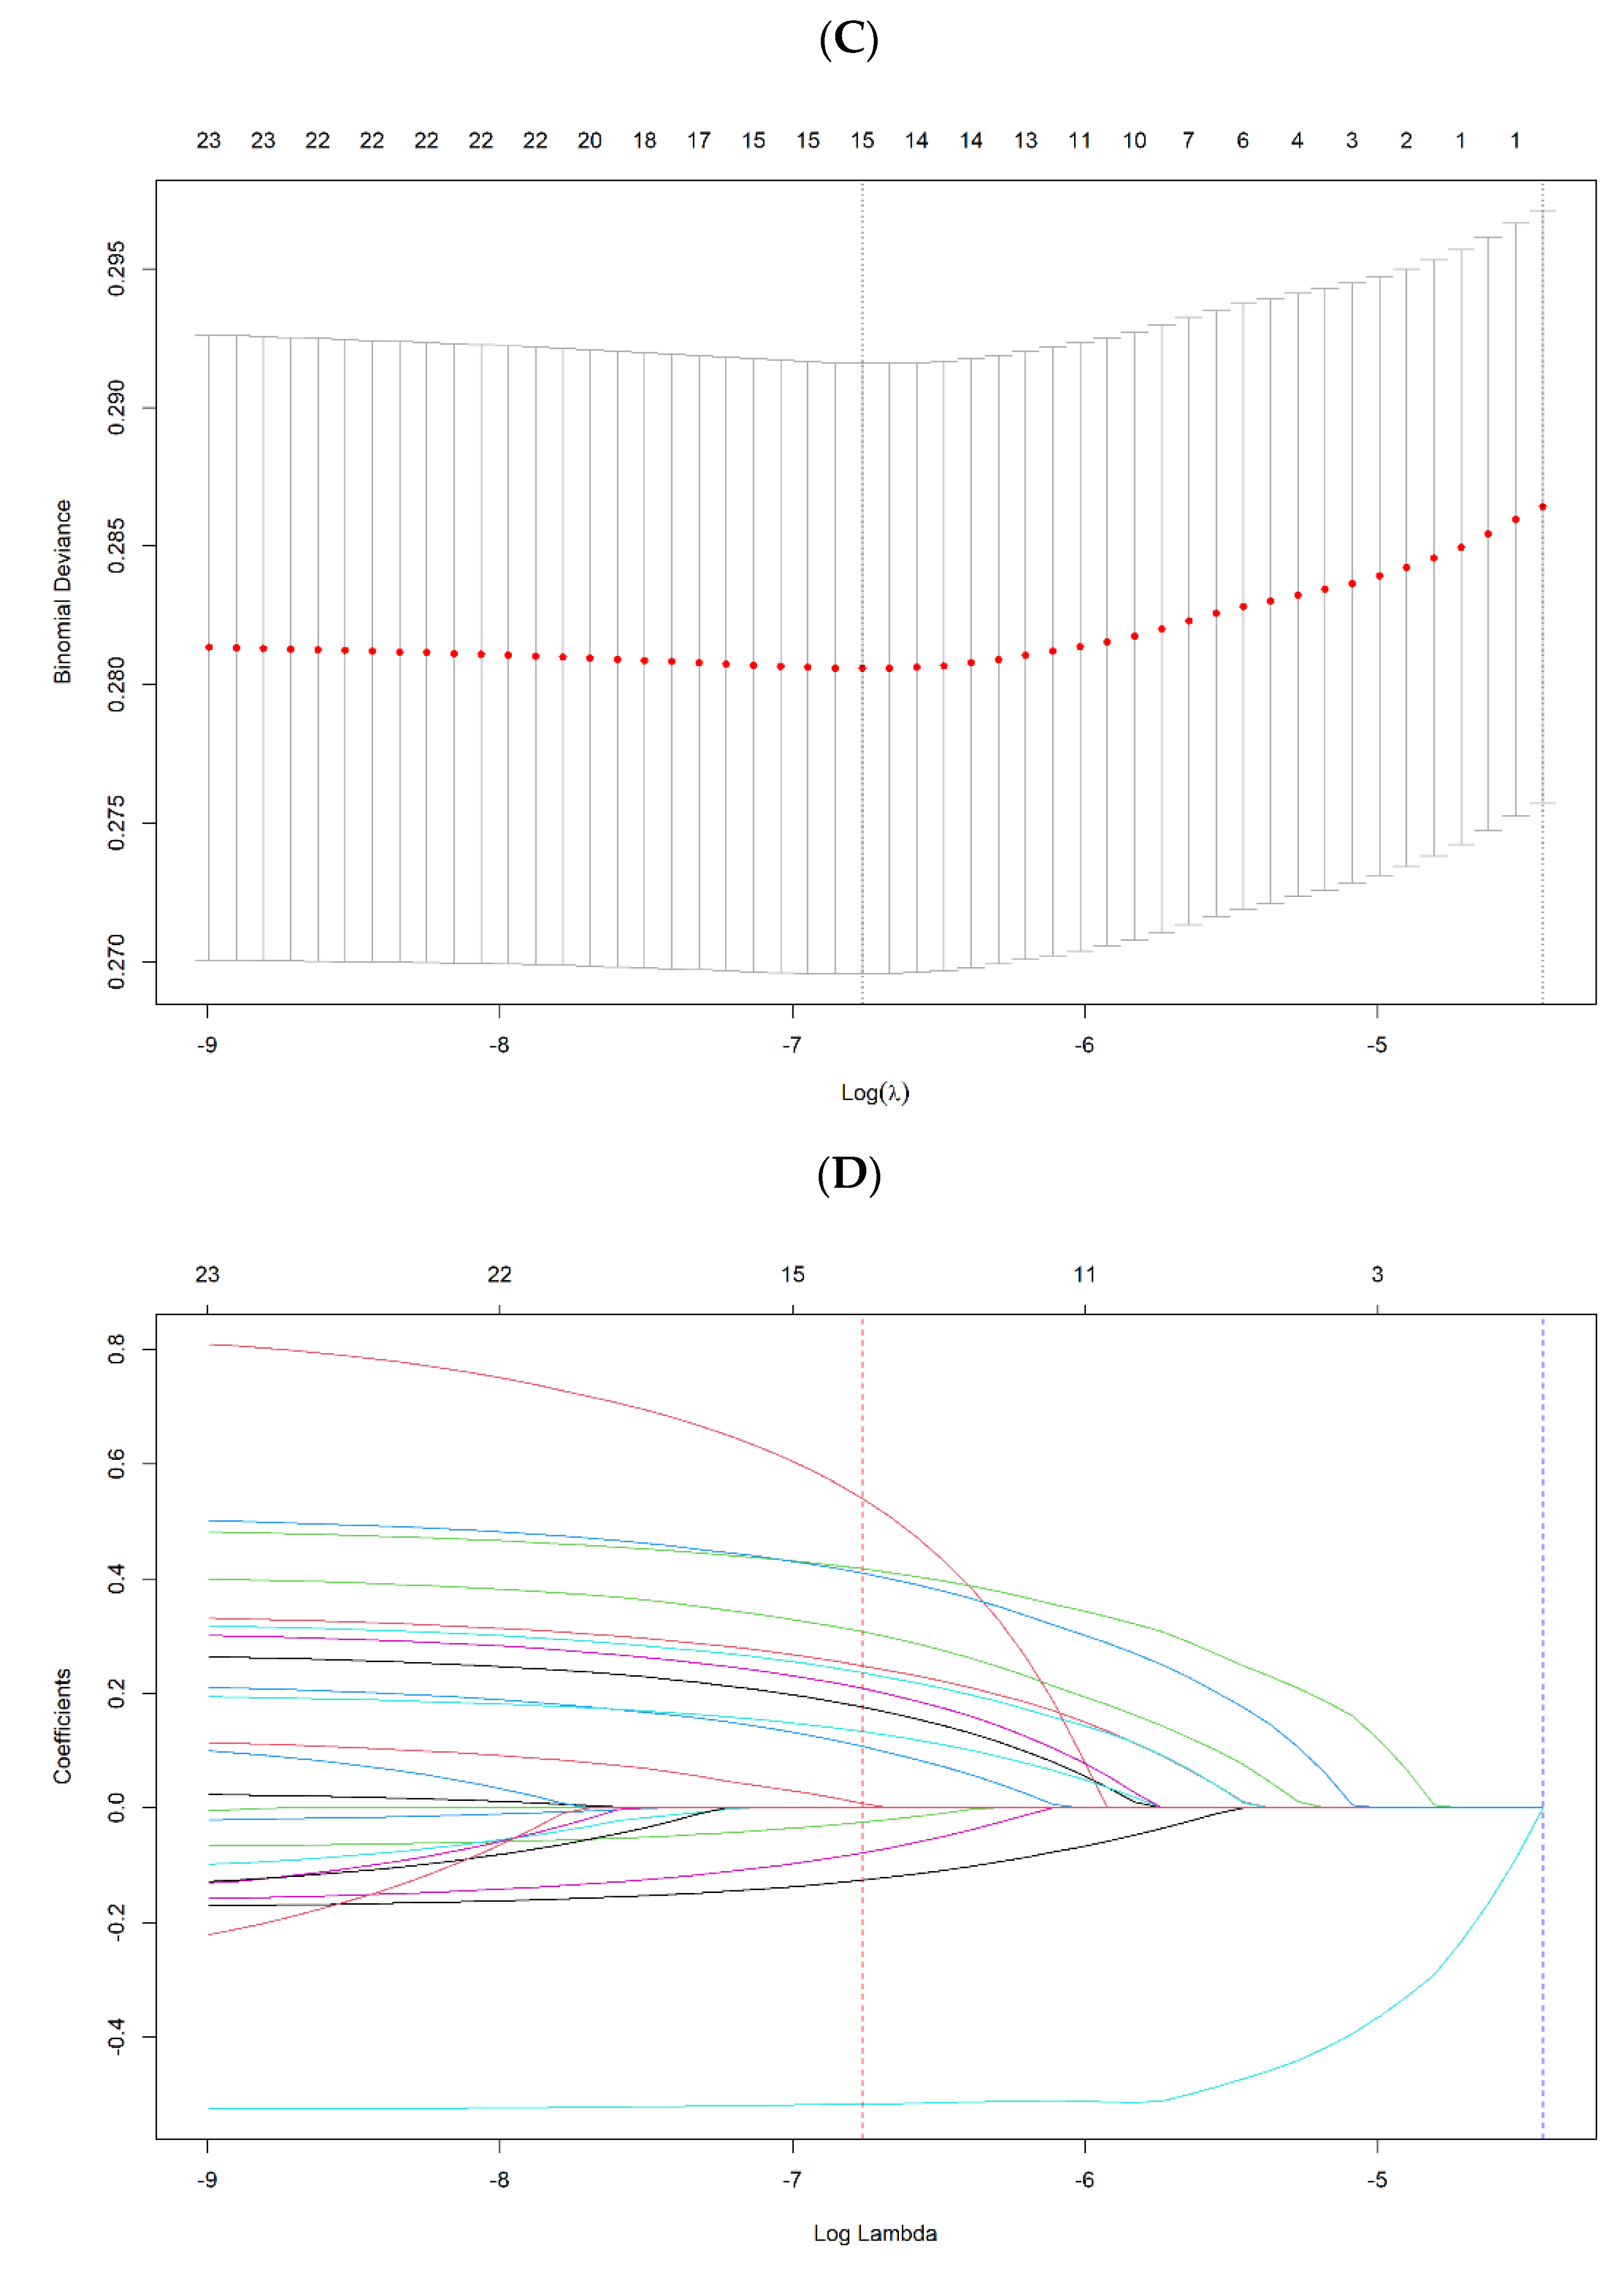
Figure 2.
(A,B) are ROC curves illustrating the capability in predicting the use of telehealth for telehealth visits due to COVID-19; (C,D) are the calibration plots of the binary fringe plot with 1000 bootstrapping re-sample of LASSO regression for telehealth visits due to COVID-19; (E,F) are ROC curves illustrating the capability in predicting the use of telehealth for telehealth visits but not due to COVID-19; (G,H) are the calibration plots of the binary fringe plot with 1000 bootstrapping re-sample of LASSO regression for telehealth visits but not due to COVID-19.
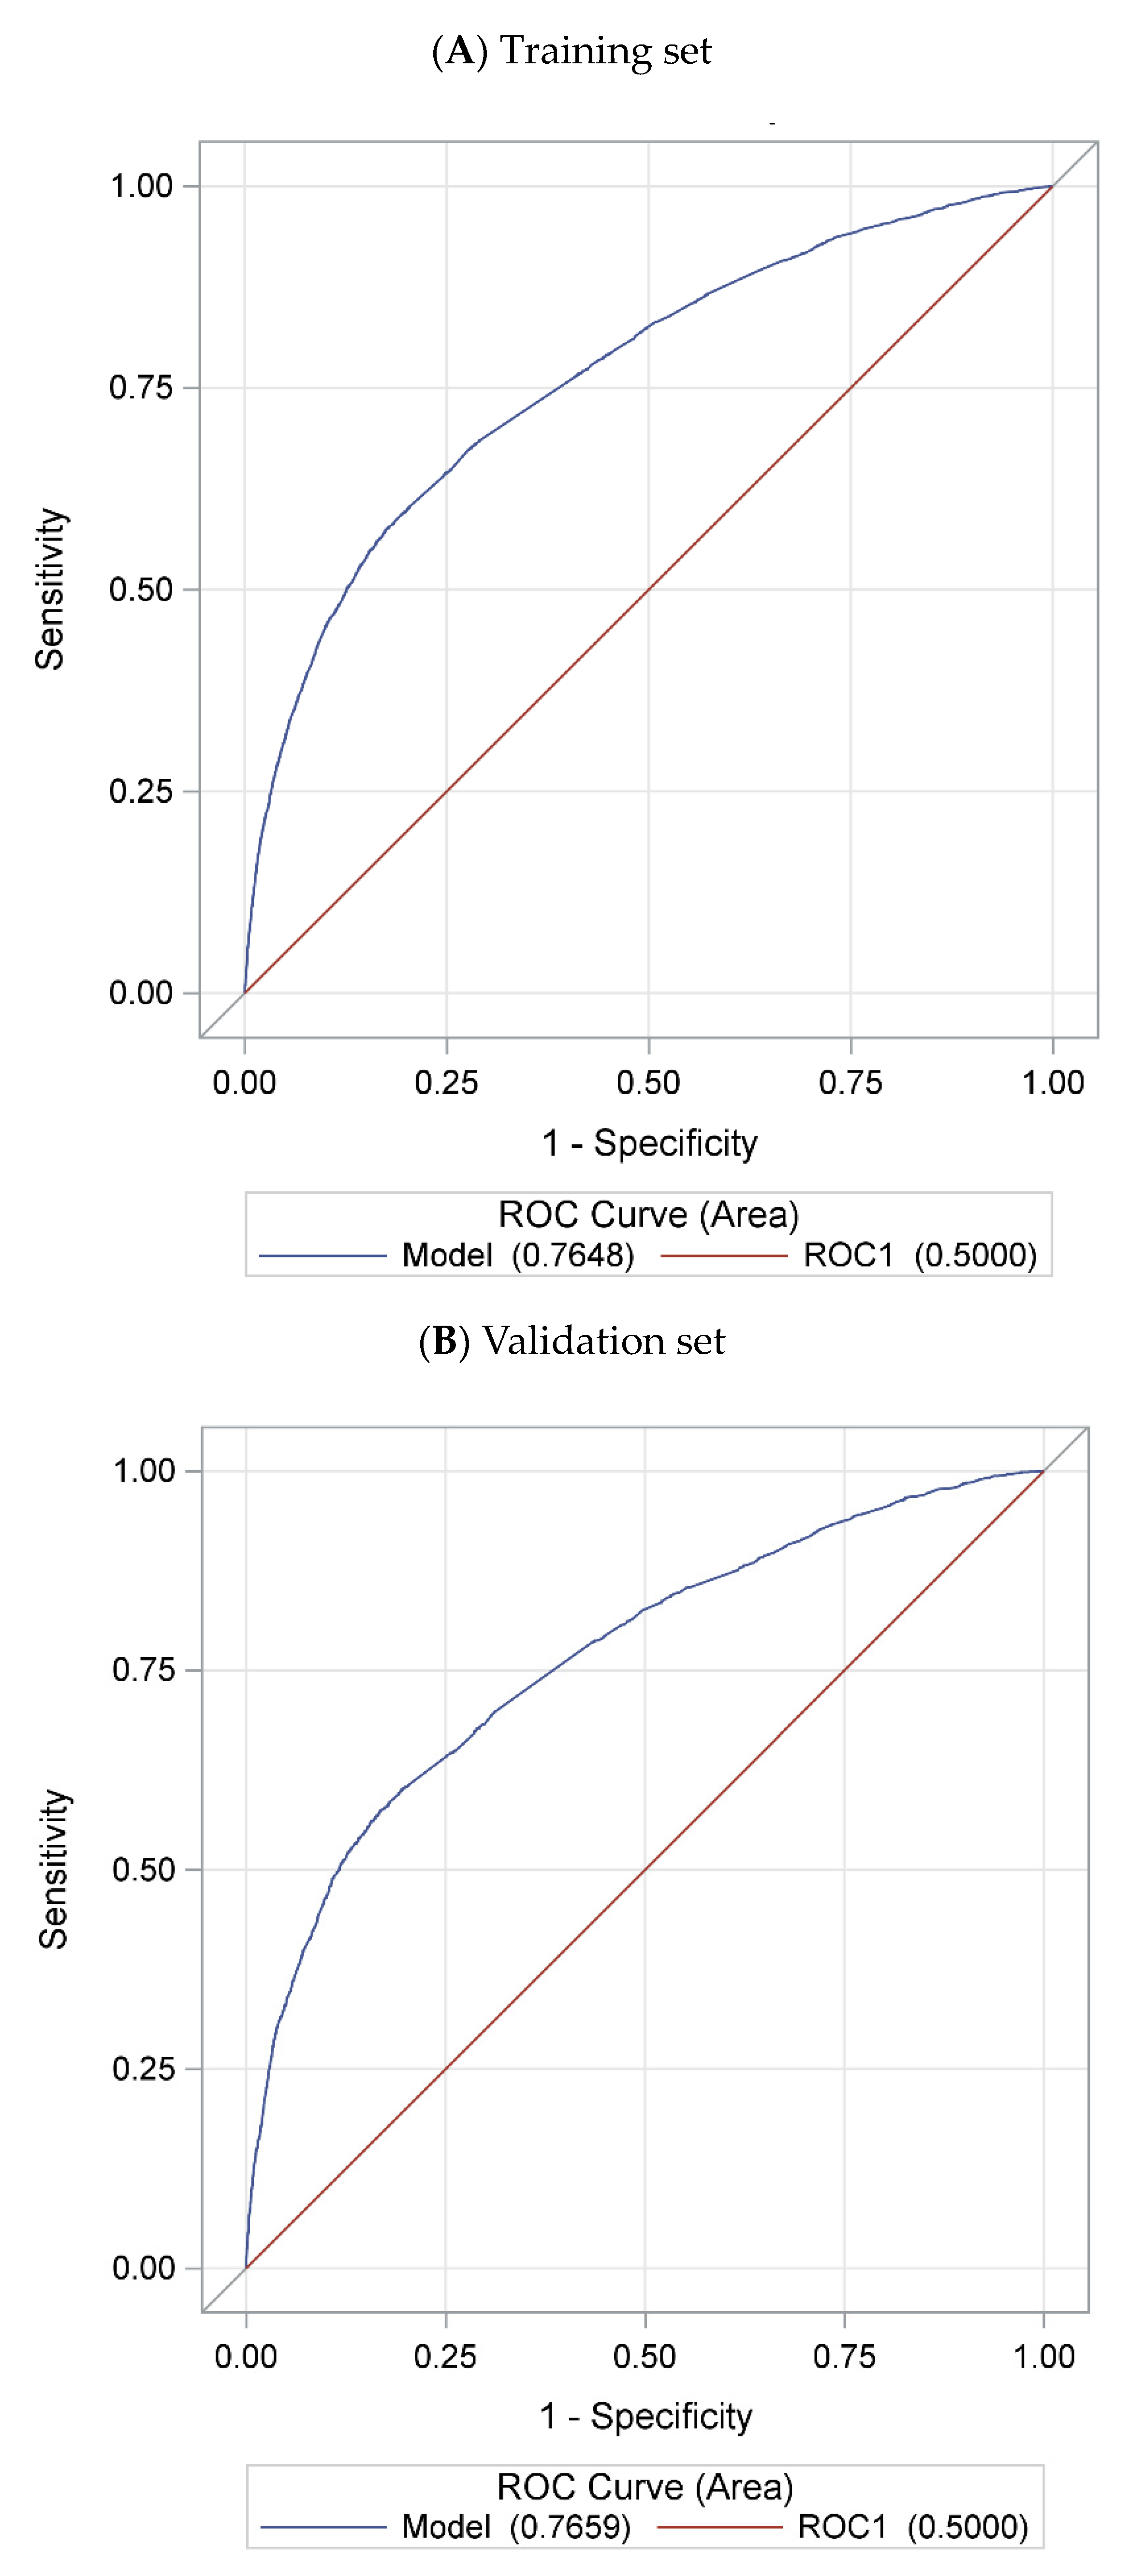
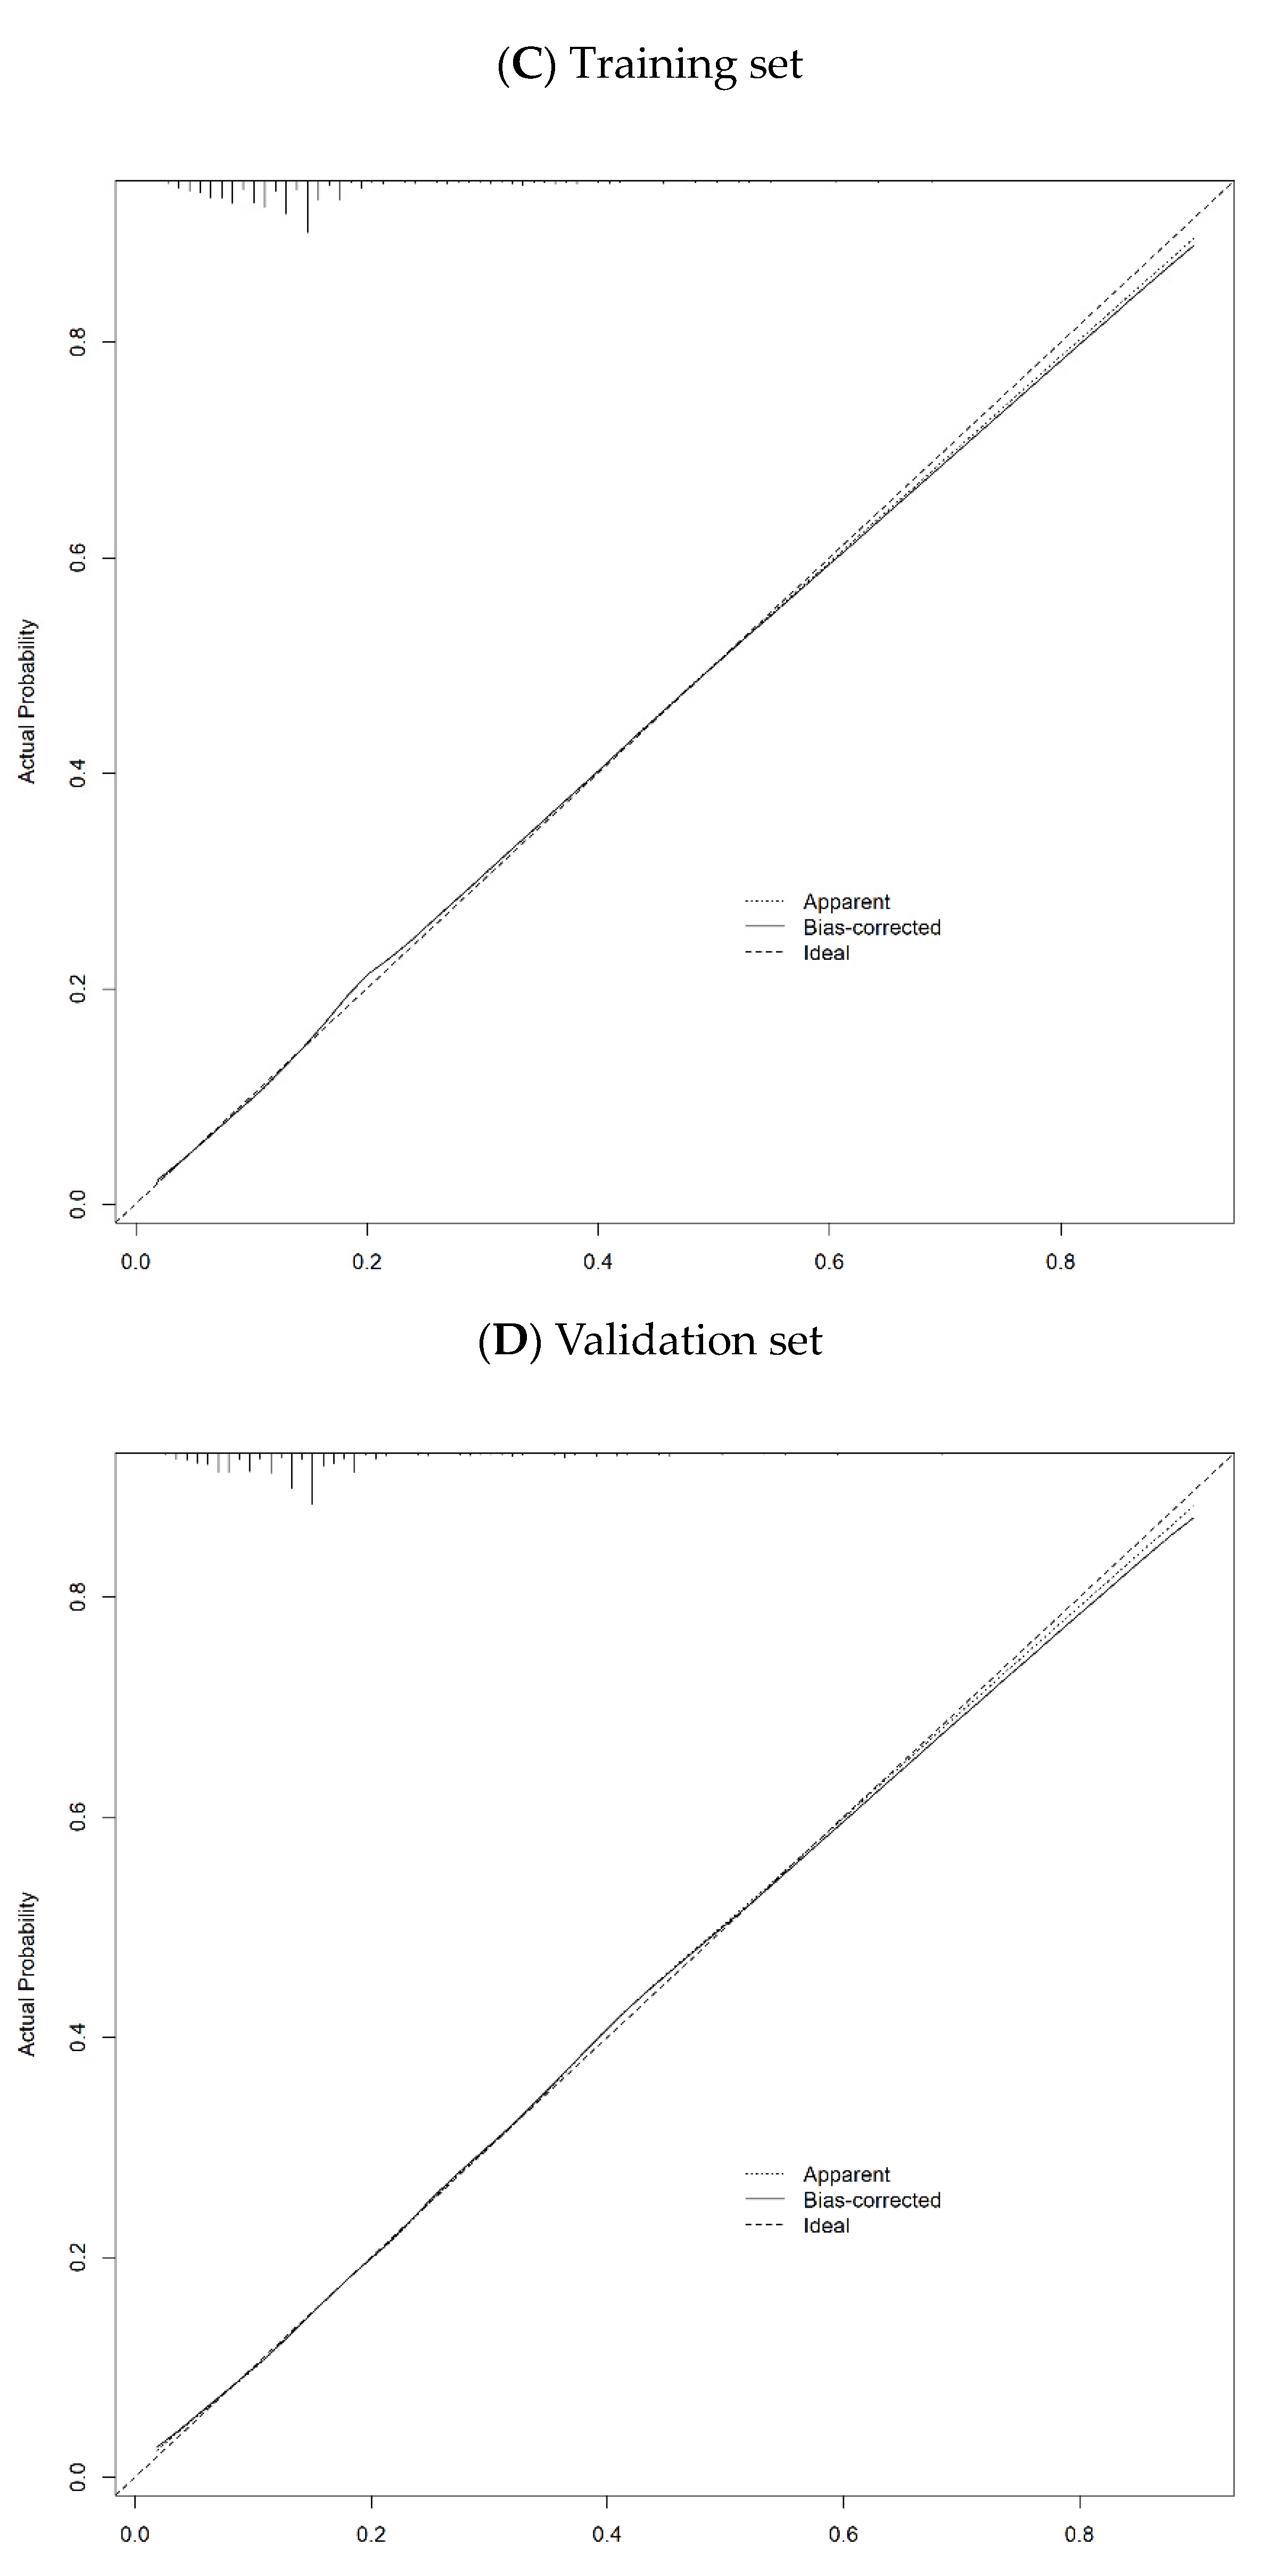
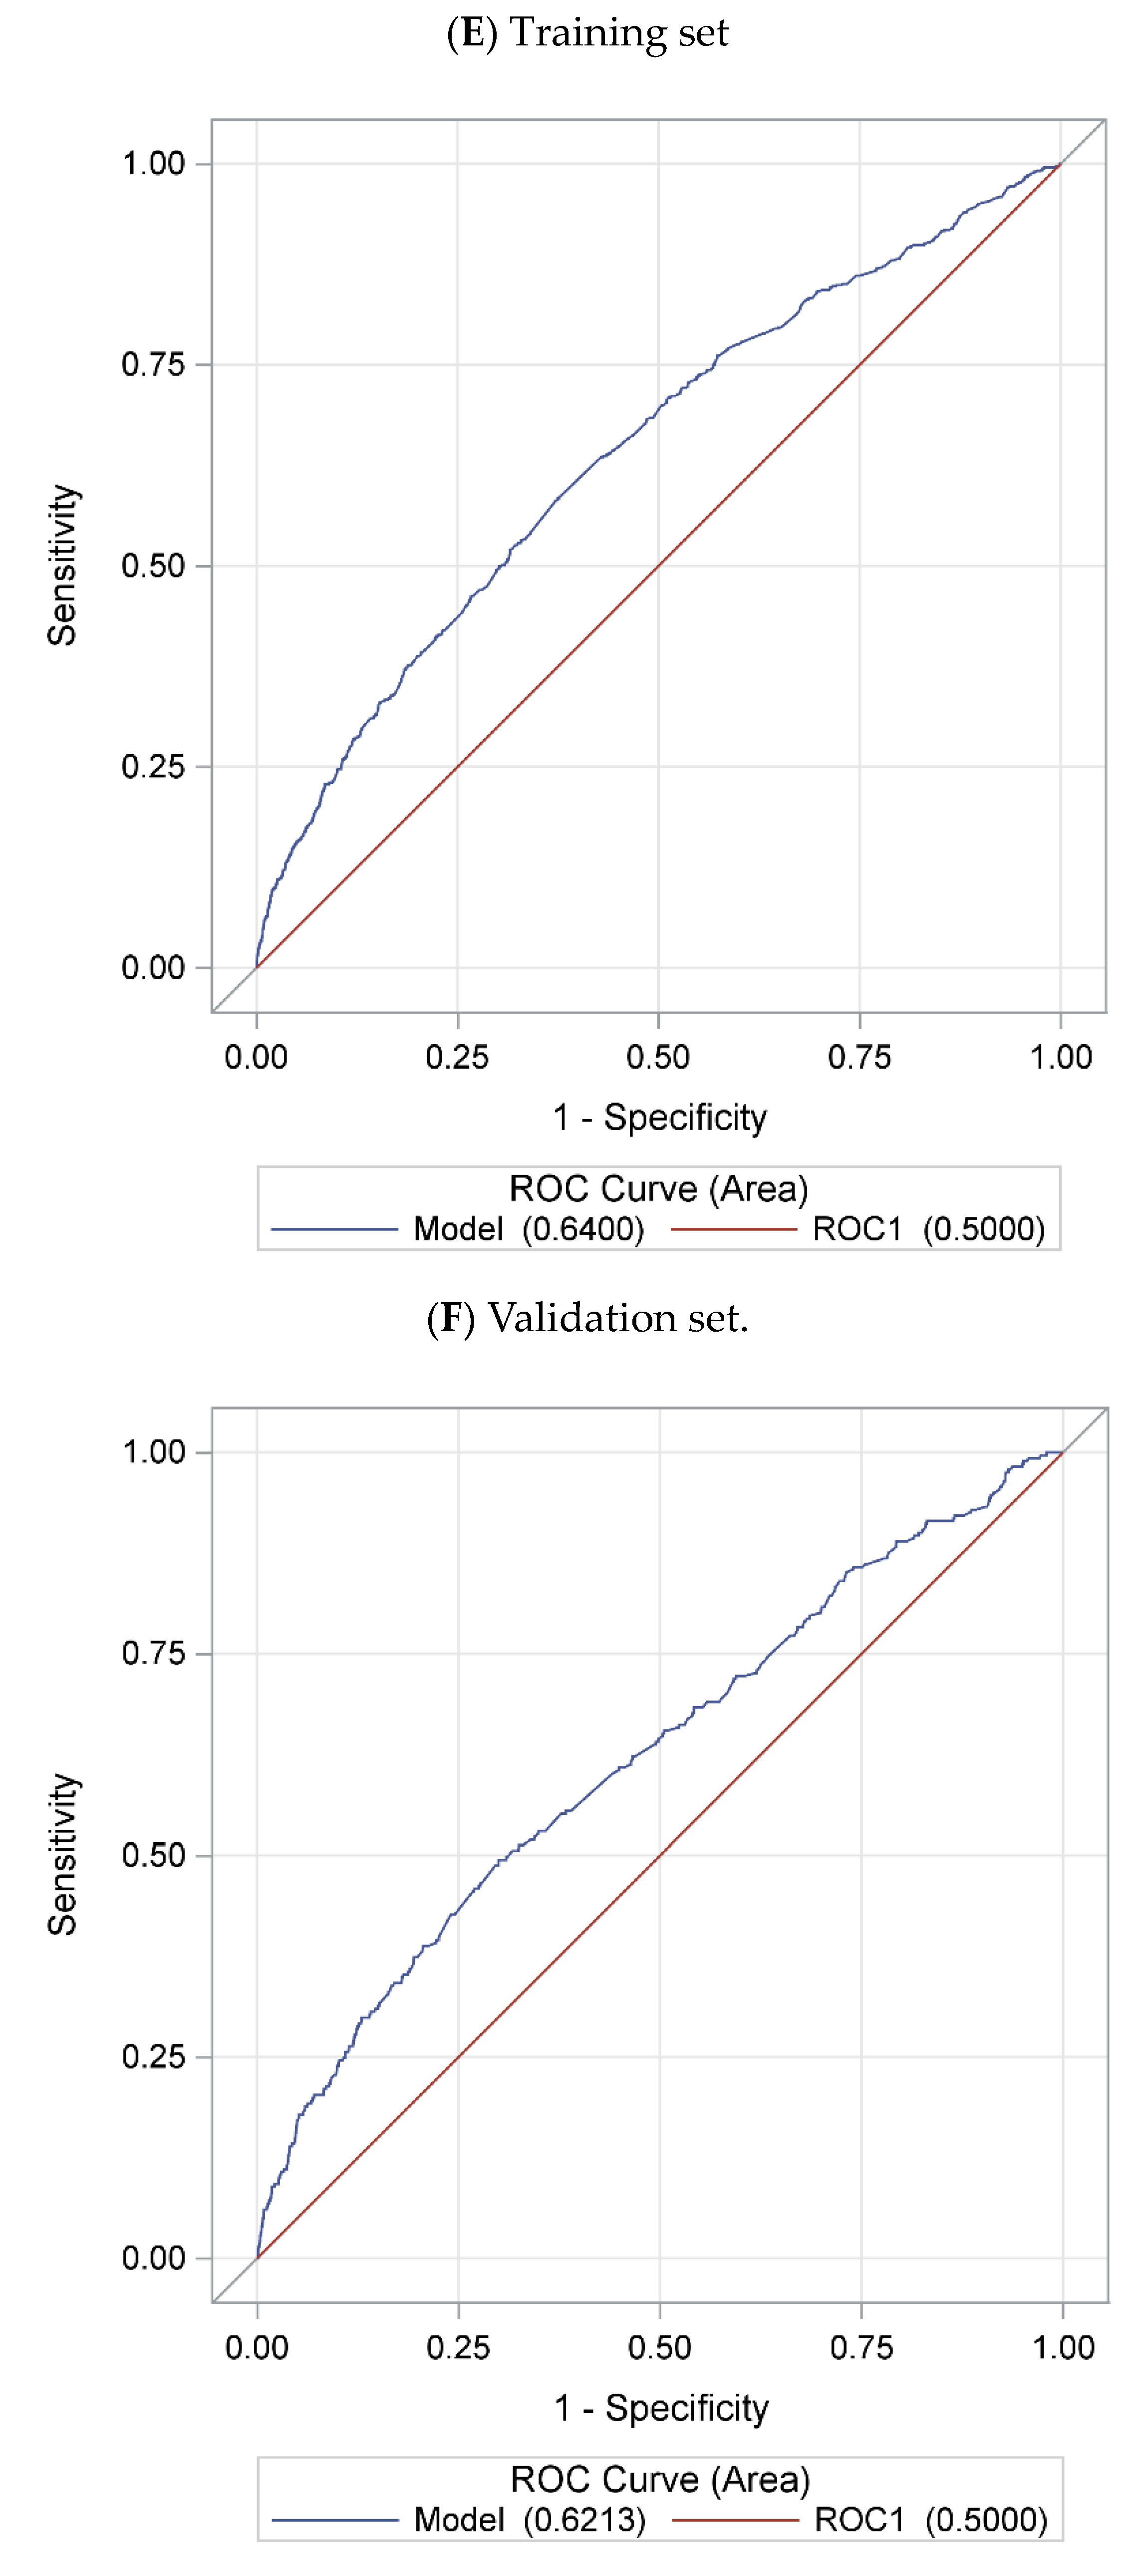
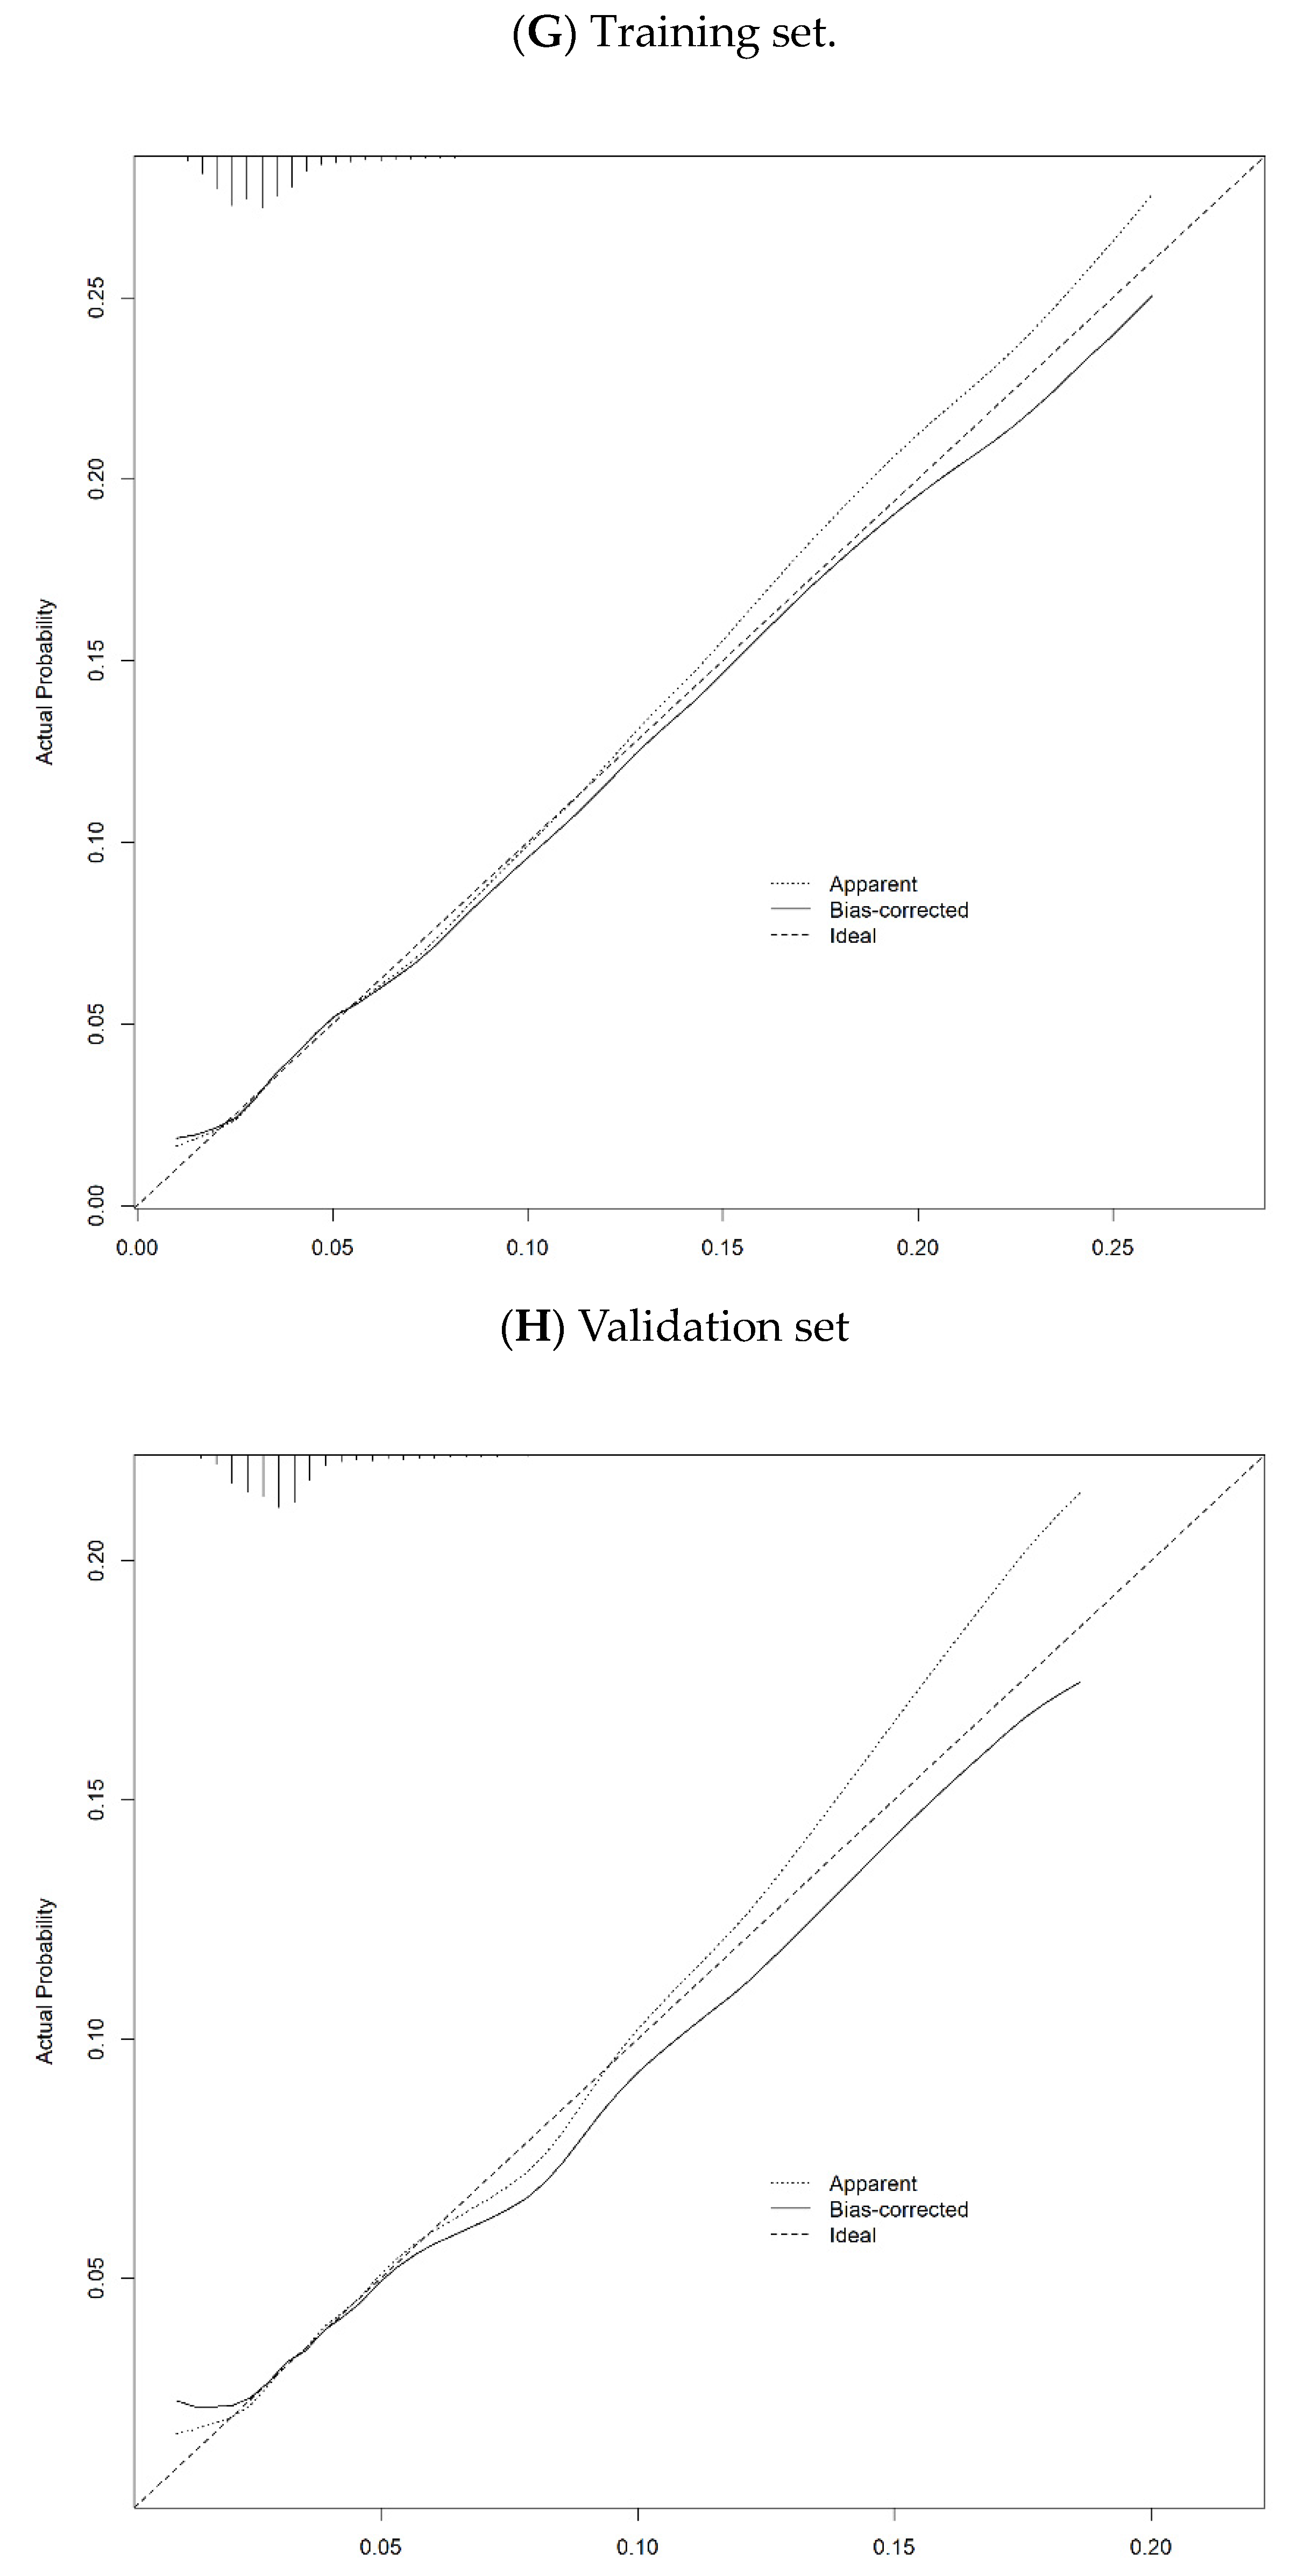
Figure 3.
Prevalence map of telehealth use during COVID-19 pandemic.
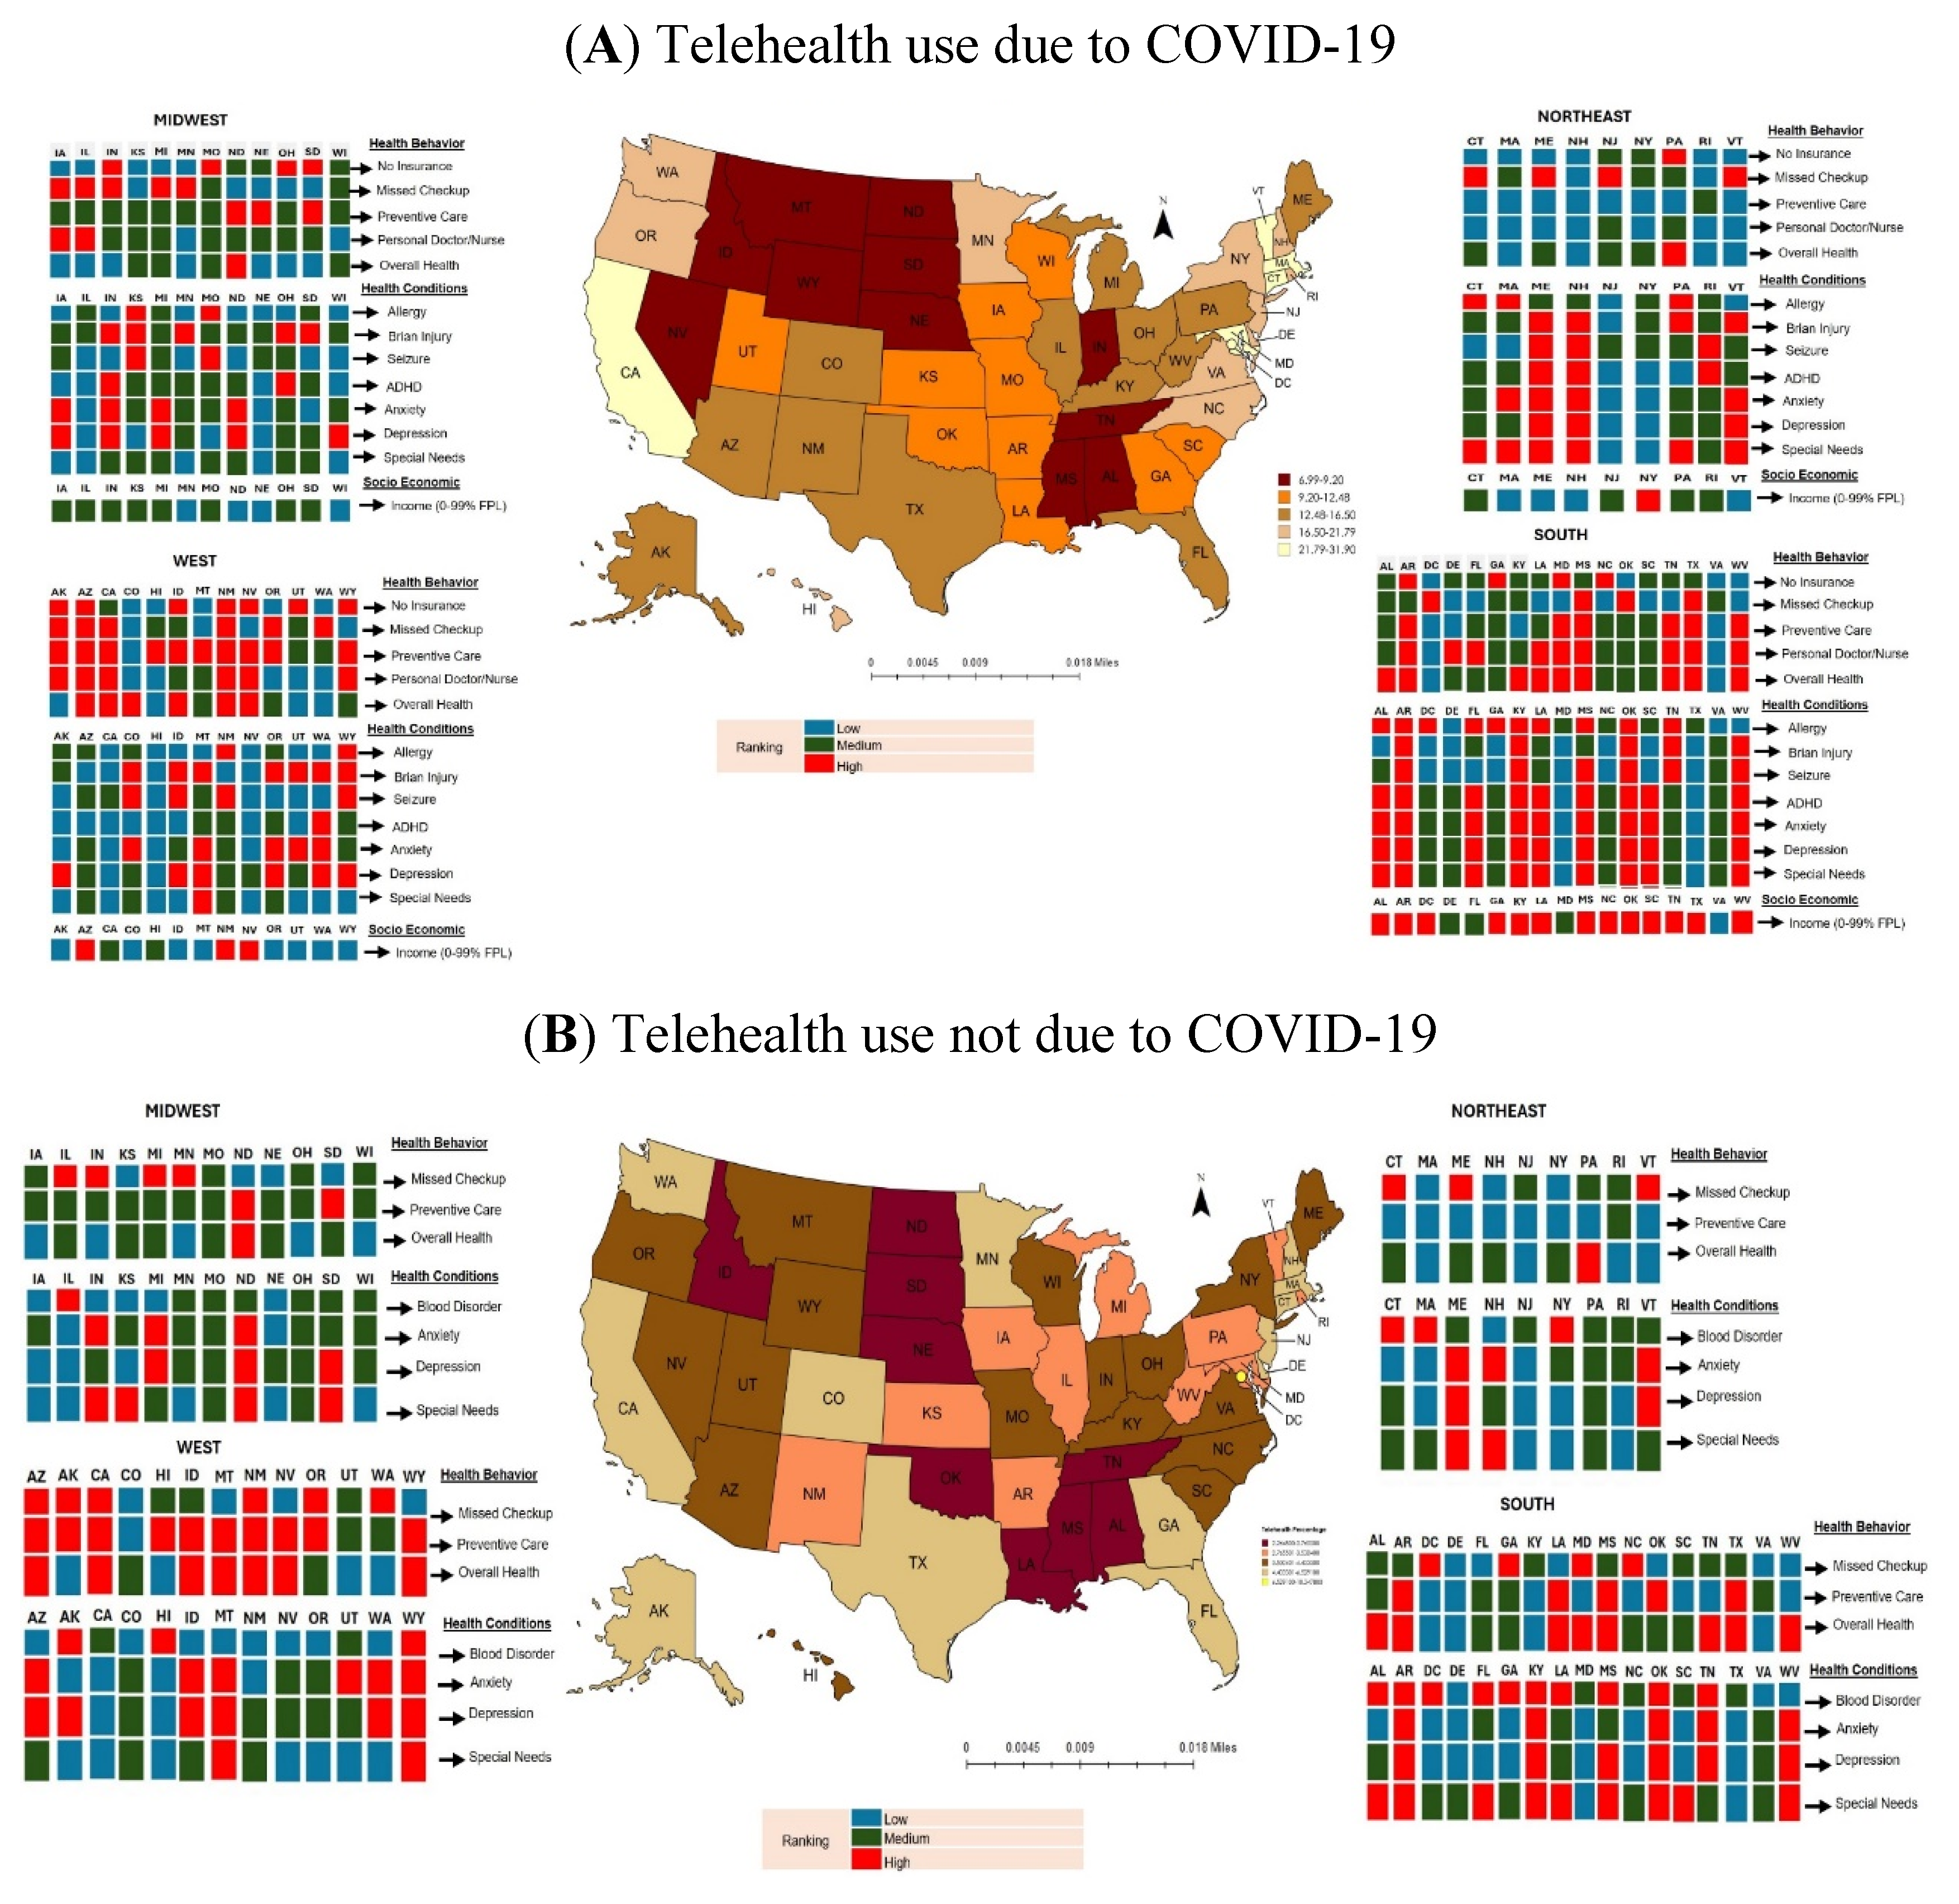

Table 1.
Prevalence of telehealth use due to COVID-19 by States between 2021 and 2022 (N=101,136).
| Telehealth Visits were Due to COVID-19 (n=16,583) |
Telehealth Visits but Not Due to COVID-19 (n=3,797) |
||||||
| State/District | Frequency1 | Percentage2 | 95 % Confidence Interval | State/District | Frequency1 | Percentage2 | 95 % Confidence Interval |
| North Dakota | 100 | 6.99 | (5.26, 8.73) | Oklahoma | 48 | 2.26 | (1.49, 3.04) |
| Wyoming | 133 | 7.40 | (5.79, 9.01) | Idaho | 41 | 2.27 | (1.43, 3.10) |
| Idaho | 133 | 7.43 | (5.68, 9.19) | North Dakota | 45 | 2.31 | (1.49, 3.12) |
| Mississippi | 140 | 7.45 | (5.84, 9.07) | Louisiana | 44 | 2.32 | (1.44, 3.20) |
| Montana | 140 | 7.47 | (5.81, 9.13) | Tennessee | 70 | 2.34 | (1.60, 3.09) |
| South Dakota | 133 | 8.18 | (6.39, 9.97) | Nebraska | 54 | 2.53 | (1.67, 3.39) |
| Alabama | 149 | 8.22 | (6.46, 9.99) | Mississippi | 44 | 2.66 | (1.65, 3.67) |
| Nebraska | 204 | 8.59 | (7.10, 10.08) | South Dakota | 51 | 2.71 | (1.80, 3.61) |
| Tennessee | 239 | 8.67 | (7.11, 10.23) | Alabama | 48 | 2.77 | (1.58, 3.95) |
| Nevada | 156 | 9.20 | (7.25, 11.16) | Arkansas | 56 | 2.91 | (1.93, 3.89) |
| Utah | 189 | 10.21 | (8.37, 12.05) | West Virginia | 49 | 2.99 | (1.94, 4.04) |
| Missouri | 188 | 10.27 | (8.31, 12.23) | New Mexico | 62 | 3.13 | (2.00, 4.27) |
| Indiana | 206 | 11.07 | (9.21, 12.94) | Iowa | 55 | 3.14 | (2.05, 4.24) |
| Georgia | 338 | 11.34 | (9.60, 13.08) | Illinois | 46 | 3.14 | (1.85, 4.44) |
| Arkansas | 193 | 11.55 | (9.37, 13.74) | Kansas | 59 | 3.35 | (2.31, 4.40) |
| Iowa | 218 | 11.86 | (9.94, 13.79) | Vermont | 48 | 3.45 | (2.24, 4.65) |
| Wisconsin | 375 | 11.97 | (10.17, 13.78) | Rhode Island | 40 | 3.53 | (2.09, 4.97) |
| Louisiana | 184 | 11.99 | (9.61, 14.36) | Missouri | 51 | 3.60 | (2.30, 4.90) |
| Oklahoma | 204 | 12.01 | (9.88, 14.14) | Ohio | 101 | 3.64 | (2.74, 4.55) |
| Kansas | 220 | 12.35 | (10.33, 14.37) | Wisconsin | 88 | 3.67 | (2.60, 4.74) |
| South Carolina | 228 | 12.49 | (10.34, 14.63) | New York | 211 | 3.68 | (2.89, 4.47) |
| Ohio | 434 | 13.19 | (11.68, 14.71) | Kentucky | 47 | 3.75 | (2.28, 5.21) |
| Florida | 249 | 13.47 | (11.33, 15.60) | North Carolina | 68 | 3.75 | (2.49, 5.01) |
| Illinois | 271 | 13.95 | (11.77, 16.14) | Hawaii | 67 | 3.77 | (2.46, 5.07) |
| Arizona | 217 | 14.00 | (11.45, 16.55) | South Carolina | 48 | 3.79 | (2.32, 5.25) |
| Michigan | 247 | 14.22 | (12.02, 16.41) | Montana | 43 | 3.81 | (2.26, 5.36) |
| Kentucky | 234 | 14.22 | (11.89, 16.54) | Nevada | 60 | 3.88 | (2.51, 5.25) |
| Texas | 250 | 14.66 | (12.15, 17.18) | Maine | 55 | 3.92 | (2.54, 5.30) |
| Alaska | 279 | 14.68 | (12.41, 16.96) | Michigan | 64 | 3.92 | (2.64, 5.20) |
| West Virginia | 252 | 14.86 | (12.47, 17.24) | Wyoming | 92 | 4.02 | (3.01, 5.03) |
| Colorado | 542 | 16.01 | (14.17, 17.86) | Indiana | 59 | 4.15 | (2.75, 5.55) |
| Pennsylvania | 407 | 16.24 | (14.21, 18.26) | Utah | 76 | 4.16 | (2.98, 5.35) |
| New Mexico | 294 | 16.44 | (13.90, 18.97) | Arizona | 61 | 4.27 | (2.77, 5.78) |
| Maine | 312 | 16.51 | (14.28, 18.73) | Pennsylvania | 97 | 4.28 | (3.05, 5.51) |
| New York | 866 | 16.85 | (14.77, 18.93) | Oregon | 202 | 4.37 | (3.48, 5.26) |
| Minnesota | 279 | 16.95 | (14.49, 19.40) | Virginia | 63 | 4.40 | (3.03, 5.77) |
| North Carolina | 279 | 17.45 | (14.74, 20.16) | Massachusetts | 53 | 4.60 | (2.86, 6.33) |
| Virginia | 318 | 17.56 | (15.00, 20.11) | Texas | 70 | 4.68 | (3.23, 6.13) |
| Washington | 322 | 17.78 | (15.25, 20.31) | Georgia | 107 | 4.69 | (3.51, 5.87) |
| Delaware | 323 | 18.08 | (15.56, 20.59) | Maryland | 62 | 4.82 | (3.10, 6.54) |
| Hawaii | 411 | 18.84 | (16.49, 21.19) | New Jersey | 66 | 4.88 | (3.34, 6.42) |
| Rhode Island | 341 | 19.48 | (16.69, 22.27) | Delaware | 71 | 4.90 | (3.30, 6.50) |
| New Jersey | 337 | 20.40 | (17.60, 23.21) | New Hampshire | 48 | 4.92 | (3.16, 6.69) |
| New Hampshire | 343 | 20.53 | (18.02, 23.05) | Alaska | 62 | 5.04 | (3.24, 6.84) |
| Oregon | 1290 | 21.80 | (20.22, 23.37) | Colorado | 150 | 5.07 | (3.95, 6.18) |
| Connecticut | 388 | 23.29 | (20.38, 26.20) | Connecticut | 67 | 5.23 | (3.59, 6.86) |
| California | 1154 | 23.65 | (21.24, 26.07) | Minnesota | 73 | 5.27 | (3.58, 6.97) |
| Vermont | 414 | 24.61 | (21.82, 27.39) | Washington | 71 | 5.34 | (3.56, 7.12) |
| Maryland | 405 | 25.66 | (22.54, 28.79) | California | 307 | 5.70 | (4.25, 7.16) |
| Massachusetts | 438 | 27.18 | (24.25, 30.12) | Florida | 88 | 6.53 | (4.74, 8.32) |
| District of Columbia | 617 | 31.91 | (28.03, 35.79) | District of Columbia | 89 | 10.35 | (7.16, 13.54) |
1Raw frequency of surveyed subjects with telehealth use due to COVID-19. 2Weighted percentage of state pediatric population with telehealth use due to COVID-19.
Table 2.
Univariate logistic regression analyses for association of factors with telehealth visits.
| Telehealth Visits were Due to COVID-19 | Telehealth Visits but Not Due to COVID-19 | |||||
| Variables | OR1 | 95% C.I.2 | p-value3 | OR1 | 95% C.I.2 | p-value3 |
| Age | ||||||
| <4 | 1 | 1 | ||||
| 4-8 | 0.89 | 0.84-0.95 | 0.0001* | 0.74 | 0.66-0.82 | <.0001* |
| 9-12 | 1.14 | 1.07-1.21 | <.0001* | 0.76 | 0.67-0.85 | <.0001* |
| 13-17 | 1.42 | 1.34-1.50 | <.0001* | 0.91 | 0.82-1.01 | 0.1110 |
| Sex | ||||||
| Female | 1 | 1 | ||||
| Male | 0.99 | 0.95-1.03 | 0.4574 | 0.95 | 0.88-1.03 | 0.2925 |
| Race/Ethnicity | ||||||
| Black, non-Hispanic | 1 | 1 | ||||
| Hispanic | 1.25 | 1.13-1.38 | <.0001* | 1.07 | 0.89-1.29 | 0.4674 |
| White, non-Hispanic | 1.17 | 1.07-1.27 | 0.0008* | 0.94 | 0.80-1.10 | 0.4427 |
| Other/Multi-racial, non-Hispanic | 1.20 | 1.08-1.32 | 0.0005* | 1.02 | 0.84-1.22 | 0.8931 |
| Child born in the United States | ||||||
| No | 1 | 1 | ||||
| Yes | 1.09 | 0.96-1.23 | 0.1792 | 0.90 | 0.73-1.12 | 0.3880 |
| Parent’s highest education level | ||||||
| Less than high school | 1 | 1 | ||||
| High school/GED | 1.34 | 1.13-1.59 | 0.0009* | 1.20 | 0.89-1.63 | 0.2925 |
| Greater than high school | 2.08 | 1.77-2.44 | <.0001* | 1.51 | 1.14-2.00 | 0.0097* |
| Family structure of child’s household | ||||||
| Two parents, currently married | 1 | 1 | ||||
| Two parents, not currently married | 0.92 | 0.84-1.00 | 0.0651 | 0.92 | 0.77-1.09 | 0.3777 |
| Single parent | 1.00 | 0.95-1.06 | 0.9081 | 0.93 | 0.84-1.03 | 0.2552 |
| Grandparent household | 0.86 | 0.75-0.98 | 0.0212* | 0.79 | 0.61-1.03 | 0.1266 |
| Other | 1.48 | 1.22-1.78 | <.0001* | 1.41 | 0.98-2.03 | 0.1107 |
| Number of family members | ||||||
| 1 or 2 | 1 | 1 | ||||
| 3 | 0.94 | 0.87-1.02 | 0.1677 | 1.09 | 0.92-1.28 | 0.3777 |
| 4 | 0.83 | 0.76-0.90 | <.0001* | 0.91 | 0.78-1.08 | 0.3444 |
| 5+ | 0.69 | 0.63-0.75 | <.0001* | 0.79 | 0.66-0.94 | 0.0149* |
| Difficulty covering basics | ||||||
| Never or rarely | 1 | 1 | ||||
| Somewhat or very often | 1.26 | 1.18-1.34 | <.0001* | 1.05 | 0.93-1.19 | 0.4497 |
| Residence in metropolitan area | ||||||
| No | 1 | 1 | ||||
| Yes | 1.69 | 1.59-1.80 | <.0001* | 1.36 | 1.21-1.52 | <.0001* |
| English is the primary language spoken at home | ||||||
| No | 1 | 1 | ||||
| Yes | 1.35 | 1.24-1.46 | <.0001* | 0.92 | 0.80-1.05 | 0.2925 |
| Type of Insurance | ||||||
| Uninsured | 1 | 1 | ||||
| Public | 2.38 | 2.06-2.74 | <.0001* | 1.33 | 1.06-1.67 | 0.0259* |
| Private | 2.48 | 2.15-2.84 | <.0001* | 1.34 | 1.08-1.66 | 0.0172* |
| Public + Private | 3.80 | 3.24-4.47 | <.0001* | 1.78 | 1.36-2.34 | <.0001* |
| Consistent health insurance coverage during the past 12 months | ||||||
| No | 1 | 1 | ||||
| Yes | 1.97 | 1.75-2.21 | <.0001* | 1.31 | 1.08-1.59 | 0.0138* |
| Household income | ||||||
| 400% FPL4 | 1 | 1 | ||||
| 200-399% FPL | 0.69 | 0.66-0.73 | <.0001* | 0.81 | 0.74-0.89 | 0.0319* |
| 100-199% FPL | 0.72 | 0.68-0.76 | <.0001* | 0.80 | 0.71-0.90 | 0.0003* |
| 0-99% FPL | 0.68 | 0.64-0.73 | <.0001* | 0.86 | 0.76-0.97 | <.0001* |
| Missed preventive care in past 12 months due to the COVID-19 pandemic | ||||||
| No | 1 | 1 | ||||
| Yes | 1.49 | 1.40-1.58 | <.0001* | 0.73 | 0.63-0.86 | 0.0003* |
| Usual source of pediatric preventive care | ||||||
| Yes | 1 | 1 | ||||
| No | 0.40 | 0.38-0.43 | <.0001* | 0.57 | 0.51-0.64 | <.0001* |
| Personal doctor or nurse for child | 1 | |||||
| Yes | 0.56 | 0.53-0.59 | <.0001* | 0.83 | 0.76-0.91 | 0.0003* |
| No | ||||||
| Perceived child health | ||||||
| Excellent or very good | 1 | 1 | ||||
| Good | 2.59 | 2.42-2.76 | <.0001* | 2.05 | 1.80-2.33 | <.0001* |
| Fair or poor | 4.91 | 4.25-5.67 | <.0001* | 3.55 | 2.71-4.65 | <.0001* |
| Mother’s physical health | ||||||
| Excellent or very good | 1 | 1 | ||||
| Good | 1.21 | 1.15-1.27 | <.0001* | 1.07 | 0.98-1.18 | 0.2116 |
| Fair or poor | 1.47 | 1.34-1.60 | <.0001* | 1.20 | 1.01-1.43 | 0.0696 |
| Father’s physical health | ||||||
| Excellent or very good | 1 | 1 | ||||
| Good | 1.16 | 1.10-1.22 | <.0001* | 1.05 | 0.95-1.17 | 0.3712 |
| Fair or poor | 1.34 | 1.21-1.48 | <.0001* | 0.99 | 0.80-1.22 | 0.9105 |
| Mother’s mental health | ||||||
| Excellent or very good | 1 | 1 | ||||
| Good | 1.34 | 1.28-1.40 | <.0001* | 1.05 | 0.96-1.16 | 0.3542 |
| Fair or poor | 1.61 | 1.49-1.73 | <.0001* | 1.21 | 1.04-1.41 | 0.0261* |
| Father’s mental health | ||||||
| Excellent or very good | 1 | 1 | ||||
| Good | 1.29 | 1.22-1.36 | <.0001* | 1.07 | 0.96-1.19 | 0.2925 |
| Fair or poor | 1.75 | 1.59-1.92 | <.0001* | 1.13 | 0.93-1.39 | 0.2925 |
| Child had the health conditions (Yes vs. No) | ||||||
| Allergy to food, drug, or insect | 1.86 | 1.78-1.95 | <.0001* | 1.41 | 1.29-1.54 | <.0001* |
| Asthma | 2.23 | 2.08-2.39 | <.0001* | 1.69 | 1.47-1.95 | <.0001* |
| Blood disorders | 1.95 | 1.52-2.50 | <.0001* | 2.31 | 1.50-3.56 | 0.0004* |
| Brain injury | 2.09 | 1.91-2.29 | <.0001* | 1.77 | 1.48-2.12 | <.0001* |
| Cerebral palsy | 6.54 | 4.88-8.78 | <.0001* | 2.02 | 0.98-4.17 | 0.0965 |
| Seizure | 6.32 | 5.15-7.75 | <.0001* | 4.01 | 2.73-5.90 | <.0001* |
| Attention-deficit/hyperactivity disorder (ADHD) | 4.22 | 3.98-4.46 | <.0001* | 2.56 | 2.27-2.88 | <.0001* |
| Autism Spectrum Disorder (ASD) | 3.83 | 3.50-4.20 | <.0001* | 2.24 | 1.84-2.73 | <.0001* |
| Headache | 3.03 | 2.73-3.37 | <.0001* | 2.21 | 1.78-2.74 | <.0001* |
| Tourette Syndrome | 5.79 | 4.28-7.85 | <.0001* | 3.13 | 1.66-5.89 | 0.0010* |
| Anxiety | 5.81 | 5.50-6.14 | <.0001* | 3.40 | 3.05-3.80 | <.0001* |
| Depression | 6.78 | 6.28-7.33 | <.0001* | 4.78 | 4.13-5.53 | <.0001* |
| Deafness or problems with hearing | 1.99 | 1.69-2.34 | <.0001* | 1.43 | 1.01-2.02 | 0.0807 |
| Blindness or problems with seeing | 1.81 | 1.56-2.10 | <.0001* | 1.21 | 0.87-1.68 | 0.3260 |
| Special health care needs | ||||||
| No | 1 | 1 | ||||
| Yes | 5.11 | 4.90-5.34 | <.0001* | 2.83 | 2.60-3.07 | <.0001* |
1OR = Odds Ratio. 2C.I. = Confidence Interval. 3False Discovery Rate p-value. 4Federal Poverty Level. *p-value < 0.05.
Table 3.
Multivariable logistic regression analysis for association of factors with telehealth visits.
Table 3.
Multivariable logistic regression analysis for association of factors with telehealth visits.
| Telehealth Visits were Due to COVID-19 | Telehealth Visits but Not Due to COVID-19 | |||||
| OR1 | 95% C.I.2 | p-value3 | OR1 | 95% C.I.2 | p-value3 | |
| Age | ||||||
| <4 | -- | -- | -- | 1 | ||
| 4-8 | -- | -- | -- | 0.81 | 0.65-1.01 | 0.1157 |
| 9-12 | -- | -- | -- | 0.68 | 0.53-0.87 | 0.0080* |
| 13-17 | -- | -- | -- | 0.68 | 0.54-0.86 | 0.0056* |
| Parent’s highest education level | ||||||
| Less than high school | 1 | 1 | ||||
| High school/GED | 0.89 | 0.70-1.14 | 0.3590 | 0.78 | 0.50-1.22 | 0.3964 |
| Greater than high school | 1.23 | 0.98-1.55 | 0.0935 | 0.93 | 0.61-1.41 | 0.7635 |
| Number of family members | ||||||
| 1 or 2 | -- | -- | -- | 1 | ||
| 3 | -- | -- | -- | 1.03 | 0.77-1.38 | 0.8258 |
| 4 | -- | -- | -- | 0.87 | 0.65-1.16 | 0.4735 |
| 5+ | -- | -- | -- | 0.83 | 0.62-1.12 | 0.3601 |
| Type of Insurance | ||||||
| Uninsured | 1 | -- | -- | -- | ||
| Public | 1.45 | 1.19-1.76 | 0.0003* | -- | -- | -- |
| Private | 1.55 | 1.29-1.88 | <.0001* | -- | -- | -- |
| Public + Private | 2.06 | 1.65-2.57 | <.0001* | -- | -- | -- |
| Household income | ||||||
| 400% FPL4 | 1 | -- | -- | -- | ||
| 200-399% FPL | 0.68 | 0.63-0.72 | <.0001* | -- | -- | -- |
| 100-199% FPL | 0.69 | 0.63-0.76 | <.0001* | -- | -- | -- |
| 0-99% FPL | 0.64 | 0.57-0.72 | <.0001* | -- | -- | -- |
| Missed preventive care in past 12 months due to the COVID-19 pandemic | ||||||
| No | 1 | 1 | ||||
| Yes | 1.25 | 1.18-1.33 | <.0001* | 0.70 | 0.60-0.81 | <.0001* |
| Usual source of pediatric preventive care | ||||||
| Yes | 1 | 1 | ||||
| No | 0.50 | 0.46-0.55 | <.0001* | 0.73 | 0.61-0.87 | 0.0031* |
| Personal doctor or nurse for child | ||||||
| Yes | 1 | 1 | ||||
| No | 0.75 | 0.70-0.81 | <.0001* | 1.06 | 0.91-1.24 | 0.5304 |
| Perceived child health | ||||||
| Excellent or very good | 1 | 1 | ||||
| Good | 1.26 | 1.14-1.40 | <.0001* | 1.35 | 1.06-1.73 | 0.0360* |
| Fair or poor | 1.98 | 1.58-2.47 | <.0001* | 1.98 | 1.20-3.26 | 0.0213* |
| Mother’s mental health | ||||||
| Excellent or very good | -- | -- | -- | 1 | ||
| Good | -- | -- | -- | 0.97 | 0.83-1.14 | 0.7635 |
| Fair or poor | -- | -- | -- | 0.92 | 0.69-1.22 | 0.6235 |
| Child had the health conditions (Yes vs. No) | ||||||
| Allergy to food, drug, or insect | 1.13 | 1.06-1.21 | 0.0003* | -- | -- | -- |
| Asthma | -- | -- | -- | 1.26 | 0.99-1.60 | 0.1031 |
| Blood disorders | -- | -- | -- | 2.30 | 1.18-4.49 | 0.0360* |
| Brain injury | 1.35 | 1.19-1.54 | <.0001* | -- | -- | -- |
| Cerebral palsy | 1.43 | 0.94-2.17 | 0.1121 | -- | -- | -- |
| Seizure | 1.80 | 1.32-2.46 | 0.0003* | -- | -- | -- |
| Attention-deficit/hyperactivity disorder (ADHD) | 1.67 | 1.53-1.82 | <.0001* | 1.12 | 0.88-1.41 | 0.4753 |
| Autism Spectrum Disorder (ASD) | 1.12 | 0.98-1.28 | 0.1166 | 1.33 | 0.96-1.85 | 0.1386 |
| Headache | 1.08 | 0.92-1.25 | 0.3590 | -- | -- | -- |
| Anxiety | 2.17 | 1.99-2.37 | <.0001* | 1.41 | 1.11-1.80 | 0.0171* |
| Depression | 1.78 | 1.57-2.01 | <.0001* | 1.83 | 1.33-2.52 | 0.0015* |
| Special health care needs | ||||||
| No | 1 | 1 | ||||
| Yes | 3.04 | 2.83-3.26 | <.0001* | 1.72 | 1.44-2.06 | <.0001* |
1OR = Odds Ratio. 2C.I. = Confidence Interval. 3False Discovery Rate p-value. 4Federal Poverty Level. *p-value < 0.05.
Disclaimer/Publisher’s Note: The statements, opinions and data contained in all publications are solely those of the individual author(s) and contributor(s) and not of MDPI and/or the editor(s). MDPI and/or the editor(s) disclaim responsibility for any injury to people or property resulting from any ideas, methods, instructions or products referred to in the content. |
© 2024 by the authors. Licensee MDPI, Basel, Switzerland. This article is an open access article distributed under the terms and conditions of the Creative Commons Attribution (CC BY) license (http://creativecommons.org/licenses/by/4.0/).
Copyright: This open access article is published under a Creative Commons CC BY 4.0 license, which permit the free download, distribution, and reuse, provided that the author and preprint are cited in any reuse.


