Submitted:
04 September 2024
Posted:
09 September 2024
You are already at the latest version
Abstract
This is a methodological contribution to reference mode development in system dynamics model conceptualization. Existing behavior mode taxonomies-developed for various modeling phases-provide no comprehensive method for mode classification based on an exhaustive set of mutually exclusive modes, and derivation of questions the simulation model should answer. Novice modelers need such guidance. The article proposes a conceptual framework for systemic behavior with a hierarchical taxonomy of elementary, composite, and overlaid modes. A structured method identifies the intervals of each respective mode, orders them into episodes and then condenses the variables’ episodes to systemic episodes. Each transition then gives rise to a fundamental question for the model under development. Three classical cases illustrate the application and contrast the proposed taxonomy to others in the extant literature. The article then discusses some validation criteria referring to reference modes and their link to the dynamic hypothesis, current limitations, and questions for further research.
Keywords:
model conceptualization
; reference behavior modes
; systemic behavior
; modeling competence development
; validation
Introduction
System dynamicists develop endogenous explanations of dynamic behaviors in complex systemic problems. Such explanations underpin the analysis and design of decision policies. The initial phases of the modeling process include conceptualization, which produces three interdependent components: (1) a time horizon, (2) a set of variables with a standardized classification of behavior modes (reference modes), and (3) an initial version of the causal structure driving these modes (dynamic hypothesis). These components adjust to one another through iterations during model conceptualization. Since validation should be part of each stage of model development (Groesser and Schwaninger, 2012), and because the quality of the conceptualization outputs is relevant for the downstream stages (Homer, 2019), basic standards for the three products of conceptualization would facilitate their integration in validation.
This article focuses on the development of reference behavior modes. It supposes that to develop reference modes, modelers must convert time series and qualitative behavior data into behavior modes that (1) are understandable amongst modelers, (2) provoke fundamental questions concerning basic features of these modes that need to be answered (but there may be further questions in specific cases), and (3) are comparable with the simulated behavior modes of the future model, which are still unknown during the first iteration of conceptualization.
System behavior classification is a complex task: transform the time series data of the variables representing the system state and its unfolding into behavior modes that allow to ask the questions that the endogenous causal structure must answer. Experienced modelers will recognize behavior modes when looking at a graph because they already have learned the relevant skills. Novice modelers, though, need detailed guidance (Schaffernicht and Groesser, 2016) and will turn to published material in search of orientation to decide which features of the time series the future simulation model should replicate. Yet, detailed descriptions of methods and techniques are scarce in educational materials.
In the research literature, authors have discussed behavior modes as a relevant topic for model analysis (Hekimoğlu, Barlas, and Luna-Reyes, 2016; Naumov and Oliva, 2018; Walrave, 2016). Ford (1999) used behavior patterns help to identify dominant blocks in a model’s structure and the shifts between them based on typical curvature patterns. Comparison of simulated behavior patterns to a specific set of reference modes is part of model validation (Barlas and Kanar, 1999; Boğ and Barlas, 2005). Behavior modes are useful for detecting influential model structures (Mojtahedzadeh, Andersen, and Richardson, 2004), sensitivity analysis (Hekimoğlu et al., 2016), parameter specification (Yücel and Barlas, 2011), setting intervention points (Walrave, 2016), scenario analysis (Edali, 2022) and policy analysis (Saleh et al., 2010).
Even though modes are also important for model conceptualization (Homer, 2019; Martinez-Moyano and Richardson, 2013), research articles have focused on other aspects of conceptualization (Andersen et al., 2012; Kim and Andersen, 2012; Tomoaia-Cotisel et al., 2022). The SD competence framework includes behavior modes (Schaffernicht and Groesser, 2016). Yet, it does not establish model conceptualization as a separate skill; instead, elements of conceptualization appear as part of the fourth of seven skills: (project initialization, p. 67). Thus, a modeler establishes (a) the symptoms that give rise to the project, (b) the reference modes, (c) a preliminary model boundary, and (d) formulates a conceptual model. These skills build on the atomic behavior patterns (Ford, 1999) included in skills 1 (dynamic reasoning) and 2 (SD language skill). Still, the competence framework identifies no specific methods or techniques. Textbooks briefly describe conceptualization topics and tasks (Morecroft, 2015; Randers, 1980; Richardson and Pugh, 1989; Sterman, 2000). They usually progress from simpler to more complex behavior modes combined with the standard formulations able to drive them. Yet, the descriptions of methods and their application in these book chapters are sparse and have little detail.
Here, it is proposed that such guidance should satisfy three criteria. First, it should be exhaustive and allow to map a mode on any time series. Second, it should also be exact and free of ambiguities, tagging each time series shape with only one mode. Third, novices must find it comprehensible: it ought not to depend on prior knowledge of concepts they have not yet learned (Ford, 1999). These criteria can be satisfied by a combination of (a) conceptual framework and (b) structured method. The conceptual framework needs two components:
C1: A coherent set of definitions for state, behavior, pattern and mode, and the relationship between the system represented by the model and the variables representing its state at each moment.
C2: A comprehensible set of mutually exclusive (exact) and exhaustive modes that capture all potentially relevant features of a variable’s time series and allow to map each time series unequivocally to one mode.
The structured method should have procedures for the following rule sets:
R1: Rules for detecting each elementary mode of a variable in the time horizon.
R2: Rules for representing the sequence of distinct modes displayed by a variable in the time horizon as episodes.
R3: Rules for representing the system’s episodes based on the variables’ episodes.
R4: Rules for generating the set of fundamental questions that the endogenous structure must answer.
Currently, elements of the framework and the method have been discussed in diverse contributions to the model conceptualization literature, but an explicit set of rules or guidelines consistent with an internally consistent framework is yet unpublished. The articles and books usually include a set of simple modes based on slope and curvature, and several composite modes. Specific differences between articles stem from different purposes in analysis, validation, or parametrization. Each of the textbooks establishes and consistently uses a set of modes. But across these books and the behaviors they discuss, it occurs that a behavior treated in one book cannot be unequivocally classified using another book’s taxonomy, as shown below.
As a step forward, this article introduces (a) a conceptual framework with a set of fundamental definitions and a hierarchical taxonomy of behavior modes for conceptualization, and (b) a structured method for punctuating the system’s behavior over the time horizon into episodes and generating fundamental questions regarding the causes of each episode and each transition between episodes are derived.
The article is organized into two main parts. First, the methodological framework with its conceptual and procedural part is introduced in three steps: a set of definitions clarifies clarify what is meant by behavior, pattern, and mode at the level of a variable and at the systemic level. Then, diverse prior contributions are used to develop a hierarchical set of behavior modes for model conceptualization. This is followed by a procedure and four sets of rules. The second part of the article applies the framework to three classical cases that contain a range of behavior patterns: urban dynamics, market growth and underinvestment, and world dynamics. These examples highlight how the framework fulfills the above criteria and allow to compare its results to other published taxonomies. The discussion section proposes four new practical and three theoretical questions that call for further research.
Concepts and Method
The Conceptual Framework
A Coherent Set of Definitions (C1)
Behavior and dynamic behavior are generic terms with different meanings across disciplines like psychology, cognitive science, or physics. In SD, they refer to how the values of variables change over time (Richardson and Pugh, 1989). When represented as a behavior-over-time graph, the slope and curvature reveal behavior visually. The perception and representation of quantities appears to be common to all humans, regardless of acculturation: more is up (Lakoff and Johnson, 1980). But if a graph represents behavior, the conceptual definition of behavior remains implicit. A variable’s dynamic behavior has several relevant features representing its state and how the state changes over time (Schaffernicht, 2010). The state of a variable refers to the value (quantity) a point in time. Modelers trained in mathematical analysis may also be tempted to include the instantaneous slope of its change over time (first momentum), and the curvature (second momentum). But keep in mind that we are looking at time series consisting of discrete measurements, and therefore we must first construct these pieces of information. The change of a variable’s state over a time interval has two elementary properties:
- (a)
- Direction: the values increase, decrease, or remain constant (detectable as the sign of the slope).
- (b)
- Speed: the increases or decreases can have larger or lower absolute values (detectable by comparison of the absolute values of the slopes of two successive curve segments).
- (c)
- Over two successive intervals, different aspects of behavior can change, leading to a dynamic (of) behavior expressed in two properties at a second level:
- (d)
- Acceleration: the speed can change (acceleration or deceleration, and in principle also linear), and it is a marker for reinforcing and balancing feedback and detectable as curvature in graphs.
- (e)
- Turning points: the direction can switch between any of the three possible values.
Last but not least, there are inflection points: when examining three successive intervals, acceleration can shift between positive and negative values (acceleration or deceleration), and this reveals loop dominance shifts (Ford, 1999).
Value, direction and speed, acceleration, turning points and inflection points are organized into three hierarchical groups of behavioral properties of the behavior of variables over any time horizon. Modelers apply taxonomies to classify such behaviors and use labels to refer to them in language. The literature contains different name labels. The respective shapes of variables have been called behavior pattern (Barlas and Kanar, 1999; Boğ and Barlas, 2005; Ford, 1999), reference mode (Ford, 2019; Randers, 1980; Richardson and Pugh, 1989; Sterman, 2000), and behavior mode (Ford, 2019). For comprehensibility, this article proposes to use “pattern” and “mode” for two distinct representations of behavior. Dictionaries define the term pattern as “a natural […] configuration,” a “reliable sample of traits, acts, tendencies, or other observable characteristics of a person, group, or institution”; a mode is “a particular form or variety of something” or “a particular functioning arrangement or condition” (Merriam-Webster, 2022). Drawing on these definitions, behavior will refer to the original data. The behavior modes are generic classes of behavior, according to a specific set of defining feature types and feature values. Behavior patterns are the sets of feature values a person can detect in (possibly smoothed) behaviors when applying (intuitively or deliberately) a taxonomy of behavior modes. Developing the reference (behavior) modes-those modes that a model shall replicate-is part of the model conceptualization phase (Randers, 1980; Richardson and Pugh, 1989; Sterman, 2000).
Note that a variable can transit between different combinations of direction and speed in the time horizon: each turning point and each inflection point mark a behavior shift. This is captured here by the notion of episode: one tuple of direction and acceleration is an episode, and the sequence of episodes represents a variable’s dynamic behavior. The taxonomy of variable behavior modes introduced below extracts patterns from time series according to the three levels of properties and unequivocally maps behaviors to modes.
Of course, it takes more than one variable to represent a dynamic problem endogenously: the problems to be modeled are generated by sets of interacting variables such that the system emerges inside a conceptual boundary. The endogenously driven variables build sets of interlocking feedback loops that are the system underneath the problem (Forrester, 1969; Groesser and Schaffernicht, 2012). Therefore, “systems behavior is a change which leads to events in itself or other systems” (Ackoff, 1971).
Such a system may have a unitary name (say, market, city, economy, or world), but we represent its behavior by referring to the behaviors of its essential variables. System behavior is the combined behavior of a set of essential variables. Here, a variable is essential if the modeler believes the system is not well represented without it.
A system is in one state at each point in time, and its state can change over time (Sawicki et al., 2016). The state of the system is represented by the state of the variables representing the system. Stock variables refer to describe the state of a system (Hassan and Khodeir, 2021), and their values are the most basic level of description of behavior. Flow variables like GDP or profits are reported at certain points in time when the information about the flow in the reported time interval represents the current state of information. Consider classical applications as examples: urban dynamics (Alfeld and Graham, 1976; Forrester, 1999) used firms, housing, and people. The market growth and underinvestment model (Forrester, 1975) used capacity, sales force, and orders backlog. Population, natural resources, capital, agricultural capital fraction, and pollution represented the planetary system in World Dynamics (Forrester, 1971).
According to the previous argumentation, the system is in a behavior mode represented by the essential variables’ respective modes at any point in time. As a result, an episode at the system level lasts for the duration between two consecutive episode transitions of one or several essential variables.
The dynamic hypothesis and the simulation model to be developed shall help to explain all these aspects of behavior. Hence, the initial description of behaviors ought to contain all aspects to be explained. The essential questions then refer to (a) the systemic episodes and (b) the transitions between them.
A Hierarchical Set of Behavior Modes for Conceptualization (C2)
Forrester (1969) defines accelerating and decelerating increase as “simple” modes. Then, several “composite” modes are introduced and explained by the first and second order balancing loop, the reinforcing loop and interacting loops: oscillation, overshoot and collapse, and overshoot and oscillation. No specific discussion of conceptualization is given, but the connection between mode and structure is clear in the sequence of topics.
Richardson and Pugh (1989) use two examples to describe how conceptualization proceeds (p. 45-50) combining graphs and textual description without a previously defined set of behavior modes.
In a section on “the reference mode as a guide to model structure”, Randers (1980) states that graph and text are complementary elements with different advantages: a graph is clearer in conveying a general shape, while the text may identify more (details) of the model’s purpose (p. 121-122).
Sterman (2000) defines “reference modes” (p. 89) and dedicates an entire chapter to the “fundamental behavior modes exponential growth, goal-seeking, and exponential decay (p. 108-127). The graphs on these pages represent goal-seeking only with negative slope, and the graphs for goal-seeking and exponential decay exhibit negative convex curves. He underlines the connection between behavior modes and causal structure (p. 116), reinforced by various examples. Then, a case study illustrates the conceptualization process (p. 159-168). It seems noteworthy that the textual parts of the conceptualization examples do not explicitly identify the behavior modes one can see in the graphs. The three textbooks implicitly trust in readers to detect these modes and refer to them in their reasoning.
The main standard formulations are also presented in a management-oriented textbook by Morecroft (2015), yet without explicitly introducing a taxonomy of behavior modes. Another management-oriented textbook focuses on the iterative aspect of modeling in a single case displaying S-shaped growth (Schaffernicht and Groesser, 2018).
Research articles have applied mode taxonomies designed for parameter estimation, model analysis, or validation purposes (Barlas and Kanar, 1999; Boğ and Barlas, 2005; Edali, 2022; Ford, 1999, 2019; Hekimoğlu et al., 2016; Saleh et al., 2010; Walrave, 2016; Yücel and Barlas, 2011). According to the respective behavior variety they faced, some have emphasized specific subsets of behavior properties, or combined various simple modes. But unlike model analysis and validation, where reference modes have already been defined, model conceptualization must be prepared for the full set of imaginable patterns, regardless of their respective relative frequency in the previously known cases.
To get a perspective on the overall set of modes, consider the following set of synonyms for mode labels used by the different authors:
- Constant increase: constant growth, linear growth.
- Accelerating increase: growth, explosive growth, expansion, recovery.
- Decelerating increase: asymptotic growth, logarithmic growth, goal-seeking growth.
- Constant decrease: constant decline, linear decline.
- Accelerating decrease: collapse, exponential collapse.
- Decelerating decrease: exponential decay, asymptotic decay, goal-seeking decline.
The names used as synonyms refer only to observable features of the shape to be classified (direction and acceleration) to assure comprehensiveness. For the rest of this article, only these synonyms are used. The combined set of all modes in the cited literature starts with seven elementary models, which cannot be further decomposed. The term “elementary” avoids repeating “atomic” or “fundamental” which have already been used by other authors for different taxonomies. The idea to use indivisible slices of curves to classify modes was already mentioned by (Ford, 1999). The elementary modes are constant increase, constant decrease, accelerating increase, decelerating increase, accelerating decrease, decelerating decrease, steady state. The remaining modes can be composed from the elementary ones: S-shaped growth, S-shaped degrowth, oscillation, overshoot and collapse, overshoot and oscillation, decelerating decrease and accelerating increase, decelerating increase and accelerating decrease, S-shaped growth and S-shaped degrowth, and S-shaped degrowth and S-shaped growth. The following Table 1 gives an oversight of how the literature covered the elementary modes.
Table 1 reveals that Ford (1999, 2019) and Barlas et al. (1999, 2006) include at least all elementary modes with changing speed (slope). The remaining taxonomies all include accelerating increase but leave out some other elementary modes. Decelerating increase and decelerating decrease appear in only 5 of the 8 sources and accelerating decrease only in 4. This is in part because the textbooks focus on the frequently encountered modes at the expense of exhaustivity. But here, exhaustivity is relevant: less frequent modes need to be recognized too. Note also that individuals without prior modeling knowledge may hesitate if a convex curve with negative slope is a case of exponential decay or of goal-seeking (Sterman, 2000). Ford’s glossary (2019) includes two named modes for all four nonlinear elementary modes.
All other modes can be understood as concatenations or overlays of elementary modes. Concatenation leads to composite modes. On might also consider “compound”, “combined” or “complex”. Yet, this article sticks to the term used by Forrester (1969). Each composite mode combines specific sequences of elementary modes:
- S-shaped growth: accelerating increase, decelerating increase.
- S-shaped degrowth: accelerating decrease, decelerating decrease.
- Oscillation: repeats accelerating increase, decelerating increase, accelerating decrease, decelerating decrease.
- Overshoot and collapse: accelerating increase, decelerating increase, accelerating decrease, decelerating decrease.
- Overshoot and oscillation: S-shaped growth, oscillation
- Decelerating decrease and Accelerating increase: decelerating decrease, accelerating increase.
- Decelerating increase and Accelerating decrease: decelerating increase, accelerating decrease.
- S-shaped growth and S-shaped degrowth: S-Shaped growth, S-Shaped degrowth.
- S-shaped degrowth and S-shaped growth: S-Shaped degrowth, S-Shaped growth.
Like with the elementary modes, some composite modes are discussed by most authors, while others are mentioned sparsely.
Table 2 reveals S-shaped growth and oscillation to be the most frequent cases:
Some behaviors combine several elementary or composite modes at a time. Several “overlaid” modes allow to map them: constant increase and oscillation and constant decrease and oscillation (Barlas and Kanar, 1999; Boğ and Barlas, 2005), and it is in principle possible to overlay oscillation with S-shaped composite modes and their respective elementary modes.
The taxonomy proposed here has three hierarchical levels. The following Figure 1 exhibits the nonlinear modes and illustrates that the elementary modes are exhaustive and mutually exclusive. All composite and overlaid modes can be constructed from them; inversely, any composite or overlaid mode can be decomposed in a set of elementary modes without ambiguities.
Figure 1 illustrates the hierarchical organization of the entire modes set. Each of the composite modes can be unequivocally composed from elementary modes. This also holds for the overlaid modes, which consist of composite modes.
Consider next the question of bottom-up versus top-down. Any time horizon will contain a slice of a variable’s behavior, and if classifying based on composite modes, the choice of a wider or more narrow time horizon may lead to different classifications for the same time series. For instance, narrowing the time horizon, overshoot and collapse appears to be S-shaped growth, and by restricting the time window further, the variable displays accelerating increase or decelerating increase. Several combinations are possible, and as portrayed in Figure 2, enlarging the time horizon can turn overshoot and collapse into oscillation:
The method discussed here operates bottom-up to avoid punctuation problems. Of course, experienced SD modelers with expertise in composite modes may routinely associate certain standard formulations to modes like oscillation, S-shaped growth, or overshoot and collapse. They may prefer proceeding top-down. Here, bottom-up classification based on elementary modes is chosen for the sake of an explicit and comprehensible set of rules. A second point in favor of bottom-up mode classification is that directly classifying by composite modes like S-shaped growth or overshoot and collapse will not distinguish and record the turning points and the inflection points. Since such points of transition need to be replicated by the simulation model and explained by the modeler, it seems advisable to first detect the elementary modes and then develop a secondary and aggregated description in terms of composite modes.
A Structured Method with Rule-Based Tasks
Procedure
The method follows a straightforward procedure with four tasks, each of which implements one of the rules R1-R4 (p.4):
For each essential variable:
Task T1: Classify the elementary modes of each curve segment between two data points.
Task T2: Detect the set of suggested episodes.
Task T3: Establish the system episodes.
Task T4: Generate the essential questions.
Detecting the Set of Elementary Modes (R1)
Since elementary modes are characterized by direction and acceleration, any combination of rules based on these properties of a variable allows to assign an elementary mode to a particular segment of a time series. Assuming time series with measurements at discrete times and linear interpolation in between, one straightforward way to classify follows simple steps:
- 1)
- Slope: for each interval between a pair of data points, the slope is the difference between the measurements.
- 2)
- Direction is the sign of the slope.
- 3)
- Curvature: for each sequence of two intervals, the curvature is the absolute value of the difference between the slopes. Acceleration is the curvature.
Let there be n data points with a running index i from 1 to n, and with values vi. Then, there will be n-1 segments segj, each defined by the values of a data point tuple vi-vi-1. Further, let the difference vt-vt-1 stand for the segment’s slope sk. There will also be n-2 curvatures cl defined by a tuple of adjacent segments, which can be identified based on the sign and the absolute size of the segments’ respective slopes. Figure 3 represents this in an exemplary graph:
In Figure 3, n=8: 8 consecutive data points are connected by segments 1 to 7. All elementary modes except steady state and linear increase or decrease are contained in this curve. To detect them, two types of change must be detected. The sign of a segment’s slope discriminates between increase and decrease. Acceleration and deceleration can be detected using the relationship between the respective signs of each tuple of sequential segments and between the absolute values of both slopes. For the segment tuples (seg1, seg2) and (seg4, seg5), abs(si) < abs(si-1), and the slopes of the members of each tuple have the same sign in each case: negative for (seg1, seg2), and positive for (seg4, seg5). These are cases of deceleration. The slopes of the segments in tuples (seg3, seg4) and (seg6, seg7) also have the same sign, but abs(si) > abs(si-1): this is acceleration. In the tuples (seg3, seg4) and (seg5, seg6), the signs of the slopes are inverse, and they are cases of acceleration independently of the slopes’ absolute values.
This pattern of relationships between the slopes’ sign and absolute value is exploited by the following procedural rule to determine the elementary modes along the curve (presupposing that the values of each slope si have already been computed as si = vi-1—vi). Because of its simplicity, this procedure can be performed manually, using a spreadsheet, or coding it in a programming language.
The procedure creates an array with the values v in its first column, followed by two new columns: slope for the difference vi-1—vi, and mode for the elementary mode. The procedure first iterates through the values to determine each segment’s slope, starting at the second data point. To decide the mode, it decides for each segment if there is acceleration or deceleration as compared to the previous segment (starting at the second segment or third data point). Eventually, it iterates through the segments to determine if it represents increase or decrease, concatenating with the classifications conducted by the second step; if it finds neither increase nor decrease, it concludes steady state:
| Rule classify_segment: |
| For each segment i from 2 to n do: slope(i) ← v(i)-v(i-1) End for For each tuple of segments from 2 to n, do: If sign(slopei) = sign(slopei-1) then If sign(slopei) <>0 If (abs(slopei) > abs(slopei-1)) then mode ← “Accelerating” Else if (abs(slopei) < abs(slopei-1)) then mode ← “Decelerating” Else mode ← “Linear” Else mode ← “Linear” Else if (sign(slopei) ≠ sign(slopei-1)) and sign(slopei) <>0 then mode ← “Accelerating” Else mode ← “Linear” End for For each segment i from 2 to n do: slope(i) ← v(i)-v(i-1) If sign(slopei) >0 then mode ← concatenate(mode; “ increase”) Else If sign(slopei) <0 then mode ← concatenate(mode; “ decrease”) Else mode ← “Steady state” End for End |
Rules for Representing Episodes (R2)
The episodes are easy to extract from this table by detecting the rows where the respective mode changes. The following procedure constructs a second table, which stores the variables’ episodes, assigning a unique number as an identifier and copying value and mode. To do so, it compares each row (measurement point) to the respective next row: if the mode changes, a transition occurs from this measurement point to the next one.
| Rule classify_variable_episodes: |
| episodes = 1 For each segment i from 3 to n-1 do: If mode(i) ← mode(i+1) Then episode(i) ← episodes Else episodes ← episodes + 1 episode(i) ← episodes transition(i) ← 1 End for |
This table stores the variable name, a sequential number for the episode, its start and ending times, start and ending values, and the mode. Note that these variable episodes are suggestions. In time series, the values of a variable may include changes of different proportions. Thus, the absolute value of a slope may display variations without changes in the slope’s sign. This is illustrated by the data points for two variables A and B in Figure 4, where all segments show increase (sign(sk)>0), but slope tuples switch back and forth between acceleration and deceleration:
Between each tuple of segments (seg1 to seg4 for A and seg5 to seg8 for B), the absolute value of the respective slope increases, decreases, and then increases again, suggesting turning points. This implies a transition of elementary modes between acceleration and deceleration. However, a modeler may esteem that for A, these changes are irrelevant and decide not to account for them. The same modeler may suspect, though, that B is a case where oscillations overlay an increase and decide that the model should probably explain these. Therefore, the episodes found by the rule described above are suggestions to be accepted or rejected by the modeler, who can also concatenate the episodes of elementary modes into episodes of composite modes. Taking this decision with the graph of the essential variables in sight can provide important information because an insignificant-looking variation of slopes of one variable might be related to more pronounced oscillatory swings in another variable, making it advisable to keep the suggested episodes.
Establishing the System Episodes (R3)
The system’s episodes are the superposition of the variables’ modes: each time one or more variable(s) transit from one mode to another one, the system transits into a new episode. This can be thought of as a subset of the rows in the table constructed before, and Figure 5 illustrates the principle. In the figure, the mode labels are abbreviated: accelerating decrease (AD), decelerating decrease (DD), accelerating increase (AI), and decelerating increase (DI).
In Figure 5, two variables A and B each go through several episodes, transitions occurring at turning and inflection points marked by solid dots. When one variable enters a new mode, the system transits too. There are six systemic modes, identified by a sequential number because there is no meaningful and simple way to combine the labels of the variables’ respective modes. Between these episodes, there are five transitions.
Generating the Essential Modeling Questions (R4)
Each systemic episode and each transition give rise to two questions:
- During an episode: why does each essential variable maintain its mode while the others are in their respective modes and value ranges?
- For episode transitions triggered by a variable’s episode transition: why does this variable transit to the new mode when it has reached this value and while the other essential variables keep behaving in their respective modes?
Both questions are related to one another, each referring either to an episode or a transition. Since in general, systemic mode transitions are triggered by one variable switching episodes, the two questions can be formulated using one basic phrase skeleton, where variables, the time indices, values, and elementary modes are in <>, optional parts that can be unnecessary or even required several times are in []:
Why does <variable> maintain <former mode> and then, around <time>, when its value is <value> <unit>, it switches to <new mode>, while [<other variable> is <other value> <other unit> and continues in <mode>]?
This skeleton can be populated using the variables of each specific case. For instance, in the abstract example given in Figure 5, there would be five transitions between the six systemic episodes. The transition from episode 1 to 2 would be addressed by the following essential question:
Why does A maintain accelerating decrease and then, around t1, when its value is A1 units, it switches to decelerating decrease, while B is B1 units and continues in accelerating increase?
Each transition gives rise to one essential question. This assures that every systemic mode, and every transition turns into a deliverable for the modeler. Since the systemic mode contains the modes of all essential variables, every possible relevant feature of the problem’s behavior turns into a checklist for the SD model under development. As far as the usefulness of the simulation model is determined by its ability to replicate the relevant behavior features, this checklist is also a useful tool model validation. Furthermore, modelers can classify the simulated data using the same method to get the simulated system’s episodes and contrast these to the reference modes.
Application to Classical Cases
Urban Dynamics
The seminal work on urban decay (Forrester, 1999) revealed that to influence the development of a city, one has to understand the interplay between firms, housing, and people. Figure 5 depicts the behavior of the system “city” as manifested in these three variables. The dots represent transitions between episodes:
The procedures identify thirteen systemic episodes, based on four episodes for firms, and six episodes for each housing and people. These are depicted in Figure 7:
Figure 7 confirms the visual impression that the three variables pass through almost identical sequences of elementary modes, through accelerating and decelerating increase, followed by accelerating and decelerating decrease. Around year 85, a first transition occurs when accelerating increase becomes decelerating increase. The main columns of these are reproduced in Table 3, where the column “Trans.” is equal to 1 for the years when a mode transition occurs (the complete table with all columns is included in the supplementary material).
The modeling questions draw on the values computed by the procedures. The first essential question for the modeler is then:
Why does firms maintain accelerating increase and then, around year 85, when its value is 82%, it switches to decelerating increase, while
housing is 85% and continues in accelerating increase, and
people is 66% and continues in accelerating increase?
The previously published taxonomies also classify the three variable’s behaviors into modes. Ford (1999) would find a repetitive sequence: exponential → logarithmic → exponential → logarithmic. The slope is not included in this taxonomy. Barlas and diverse co-authors have used four elementary modes they labeled as positive/negative exponential growth/decline and a series of composite and overlaid modes (Barlas and Kanar, 1999; Boğ and Barlas, 2005; Yücel and Barlas, 2011). Therefore, they would identify four modes analogous to the elementary modes: positive exponential growth → negative exponential growth → positive exponential decline → negative exponential decline.
These authors might also apply the composite mode S-shaped growth with decreasing rate followed by decline to equilibrium (Yücel and Barlas, 2011). Ford (2019) would find a sequence of four modes, but in two of them more than one mode maps to the behavior: exponential growth → asymptotic growth or goal-seeking → exponential collapse → asymptotic decay or exponential decay or goal-seeking. Sterman (2000) would map a mode to three of the four episodes, and two modes map to one of the episodes: exponential growth → goal-seeking → (no mode defined for accelerating growth) → exponential decay or goal-seeking. Of course, the composite mode S-shaped growth and collapse could be used by experienced modelers.
Market Growth and Underinvestment
Another influential model explained how a firm’s policies regarding capacity and sales can undermine potential growth (Forrester, 1975). Here, the essential variables were sales force, capacity, and orders backlog. Figure 7 represents their behavior. Except for the capacity’s initial 40 months, there is accelerating growth, overlaid by oscillations of different proportions.
The oscillations are also manifest in the representation of the systemic episodes visible in Figure 8, where they appear as repeated cycles of the four elementary modes AI→DI→AD→DD for the backlog and cycles of AI→DI for the other two variables. During the 130 months, the system goes through 18 episodes, and the sales force and the backlog are quicker to transition between elementary modes. Figure 8 also suggests that the cycles are of different lengths. The amplitude is visible in the graph only. In the case of the sales force, it is tiny, leading to the question if these transitions need to be explained by the modeler. Again, the transitions detected by the method proposed here are suggestions that can be overturned by the modeler. Maintaining the interval between months 50 and 130 as a succession of AI→DI for the sales force does not make a huge numerical difference, but it conserves the fact that all essential variables of the system oscillate while they keep an underlying trend of accelerating increase.
This example with the oscillations also illustrates that the number of systemic modes and transitions may become huge, implying many essential questions. But modelers ought not to abstract the oscillations away to keep the number of questions at a tractable level, since the alternation of positive and negative slopes of the backlog is likely a relevant feature. As an alternative, one can opt for representing the oscillations in a more compact manner. For instance, capacity is much slower to transit between episodes than the salesforce or capacity; this can lead to more high-level questions, which are less repetitive. Keep in mind that the questions generated by the method are suggestions, and therefore the set can be expanded by modelers to accommodate for the patterns they discover, possibly using composite or overlaid modes.
Assuming we keep the oscillations, Ford (1999) would classify repeated cycles of exponential → logarithmic → exponential → logarithmic. Barlas and co-authors would find cycles of positive exponential growth → negative exponential growth → positive exponential decline → negative exponential decline. Ford (2019) would find cycles of four modes: exponential growth → asymptotic growth or goal-seeking → exponential collapse → asymptotic decay or exponential decay or goal-seeking. Likewise, Sterman (2000) would map out cycles of exponential growth → goal-seeking → (no mode defined for accelerating growth) → exponential decay or goal-seeking. Even though an overlaid mode of oscillation around linearly growing trend has been used before (Boğ and Barlas, 2005), this example could be classified as oscillation around accelerating increase.
World Dynamics
The World Dynamics model and book (Forrester, 1971) opened a long-lasting debate. It conceptualized the planetary system using five essential variables: population, capital, capital agriculture fraction (representing the fraction of total capital dedicated to agriculture), natural resources, and pollution. The graph in Figure 9 represents their respective behaviors and 16 dots representing transitions between episodes between 1935 and 2100 (truncating the initial years because no mode transitions occur).
All variables except natural resources go through a sequence of elementary modes AI→DI→AD→DD, which is salient in Figure 10 (over the entire time span from 1900-2100). However, population also performs an initial DD→AI→DI that is hardly visible in the graph of Figure 9 beyond the dots. Moreover, Figure 10 displays an initial AI→DI for the capital agriculture fraction, too.
Should a modeler keep these transitions or opt to consider the years until 1990 as one period of accelerating increase? In the market growth case, the other variables’ behavior justified the decision to conserve the sales force’s minor oscillations, but here, the other variables do not oscillate. Is it relevant to explain these initial transitions in the trajectories of population and the capital agriculture fraction to understand how the planetary system crumbles under the weight of an overshot human population and activity? If the answer is “no”, the initial transitions can be dropped, and number of essential questions decreases from 16 to 13.
Now, the number of systemic episodes and transitions is also driven up by the larger number of essential variables. The number of episodes reveals systemic complexity, which may come from complex behaviors like oscillations (with many turning and inflection points) and from complex structure (suggested by an increasing number of variables).
For World dynamics, the prior taxonomies would classify natural resources differently than the other four essential variables. Since their behavior is equivalent to the Urban dynamics case, here, we focus on natural resources. Ford (1999) would recognize this behavior as exponential → logarithmic. Barlas and co-authors would find positive exponential decline → negative exponential decline. Ford (2019) would identify exponential collapse → asymptotic decay or exponential decay or goal-seeking. Last but not least, Sterman (2000) would indicate exponential growth → goal-seeking → (no mode defined for accelerating growth) → exponential decay or goal-seeking.
Discussion
In the three application examples, the elementary modes map exactly one mode to each subset of time series data of each variable between a tuple of turning or inflection points. Additionally, composite modes or overlaid modes could be attributed to these behaviors, thus obtaining a compressed description, without sacrificing the turning and inflection points. Based on these elementary modes, system behavior was consistently classified, and fundamental modeling questions could be derived.
The previously published taxonomies were partially useful, but each showed weak points. Slope is not perceived by the “atomic” modes (Ford, 1999). The name labels used by Barlas and co-authors include implicit references to causal structure (“exponential”), thus contradicting comprehensibility (Ford, 1999). The modes mentioned in the SD glossary (Ford, 2019) have more than one mode for some elementary shapes (combinations of slope and acceleration) and are therefore not mutually exclusive. And the “simple” modes (Sterman, 2000) do not contain a mapping for behaviors of accelerating decrease: they are not exhaustive in this sense. Of course, there are good reasons why the atomic modes do not account for slope: they are meant to reveal traces of feedback loops. Taxonomies developed for use in model analysis or calibration (Barlas and co-authors) can trust their users to be familiar with exponential formulations. The SD glossary is a sort of general dictionary, not devised to aid novices in model conceptualization. And the very detailed textbook by Sterman (2000) includes a rich set of composite modes, being very able to classify any slice of variable behavior. Nevertheless, in terms of model conceptualization tools, they collide with the criteria of comprehensibility, exhaustiveness, and mutual exclusivity identified above for the conceptual framework. Recurring to composite and overlaid modes is always possible for experienced modelers, who already know how to identify fundamental questions the SD model needs to answer. However, novices need explicit guidance. This guidance is offered by the proposed methodological framework, which uses the behavior modes of the essential variables to construct an explicit representation of system behavior, and then derives fundamental modeling questions from it.
The proposed method and the concepts that it is based on have the advantages of being explicit, simple, and replicable in the elementary mode classification procedures, the construction of system behavior, and the derivation of fundamental questions that can even be used as quality criteria for the simulation model, thereby becoming useful for model validation. One can debate if the point made by Ford (1999) in favor of describing behavior features without reference to causal structure is more or less important than keeping the most frequently used name labels: clearly, “exponential” is a reference to causal structure and understandable for those acquainted with exponential functions. Other individuals must get used to the name-a case of rote learning; yet it is by far the most frequently used word when referring to accelerating increase. Thus, independently of the name labels used, the framework is recommended for instructional materials and activities, particularly in the many areas where mathematical literacy is sparse (OECD, 2023), and where modeling novices should not be expected to be skilled curve interpreters.
It is proposed here that reference modes should comply to the following minimum criteria:
- 1)
-
Identification of
- a)
- a tentative time horizon
- b)
- the essential variables.
- 2)
- Classification of behaviors that accounts for turning and inflection points and the intervals between them in terms of slope and acceleration.
- 3)
- Classification of system behavior as a sequence of time intervals during which none of the essential variables passes through a turning point or an inflection point.
- 4)
- Formulation of a fundamental question for each transition in the system behavior.
One current limitation is the workload of manually classifying each variable’s episodes, constructing the systemic episodes, and deriving the fundamental questions. The variables’ episodes can be easily classified by a spreadsheet implementing the logic of the rule-based tasks. However, a software tool allowing to inspect the suggested episodes on a graph and to automatically construct the systemic episodes and propose the fundamental questions will significantly increase the method’s attractivity.
Some weak points call for further research. One such issue is the status of composite modes, which are currently not formally part of the method. For instance, in application example 1, using composite modes appeared as a possible handicap for novice modelers. In example 2, it rather seemed to be an enhancement. This reveals that currently, there is no clear set of criteria to decide when composite modes should be used together with or even instead of elementary modes. The current framework should be further developed to include composite and overlaid modes.
Another issue is the absence of objective criteria to decide whether to keep or to exclude minor episodes. Related to this, original time series may need to be simplified before classifying modes, smoothing irrelevant variability away. However, relevant turning points and inflection points should not be modified by such simplifications. Moreover, simplification methods should not be too complex to be understood by novice modelers.
There are also some theoretical questions referring to how humans perceive and mentally deal with behavior. First, how do humans with different experiences and prior knowledge intuitively categorize curves? Anecdotical evidence suggests that direction is much more salient than curvature (acceleration). Second, are curves an intuitive representation of dynamic behavior? Drawing a coordinate system with a curve to represent a variable’s behavior appears to be a method developed in the occidental culture of the Enlightenment; if so, how intuitive are behavior graphs for individuals from other cultures? Third, do name labels influence the recognition of relevant behavior features? For instance, “exponential growth” is by far more frequently mentioned than other terms like “exponential decay” or “exponential collapse” and will be more available to laypeople when reflecting on how something is changing. Laypeople have no reason to be acquainted with the exponential function and should intuitively associate “exponential” to acceleration; therefore, they may intuitively think of “exponential decay” as accelerating decrease, which would be wrong and may lead to unlucky conclusions and decisions. Empirical research would be welcome to answer these questions.
Conclusion
SD examines the relationship between structure and behavior. During model conceptualization, modelers identify the behavior modes that the model-to-be-developed must replicate, together with a tentative causal structure. While behavior modes are important for several tasks during model formalization, validation, and analysis, this article focused on conceptualization. It proposed that a systematic approach to reference mode development needs a coherent conceptual framework with a set of definitions and a comprehensible, mutually exclusive, and exhaustive set of modes, together with a structured method for detecting and sequencing the modes of essential variables and for combining them to represent the systemic modes and eventually derive a set of fundamental questions the model must answer.
Based on the critical examination of the extant literature, a basic set of terms and a hierarchical set of elementary, composite, and overlaid behavior modes was proposed. The elementary modes cover the possible combinations of slope and acceleration of a variable’s change over time. The behavior of variables is mapped to episodes of elementary modes; then, the episodes of the variables are combined to represent the systemic episodes. Each transition between systemic episodes is then turned into a fundamental question. This procedure was applied to three classical cases: urban dynamics, market growth and underinvestment, and world dynamics. These cases allowed to demonstrate that the elementary modes capture the relevant behavior features of the variables, are straightforward to superpose as systemic episodes and to turn into fundamental questions. Concerning the previously published taxonomies, several shortcomings were found: the “atomic” modes ignore slopes, the glossary modes are not mutually exclusive, the “simple” modes are not exhaustive, and Barlas’ indivisible modes make extensive use of the term “exponential”, colliding with comprehensibility.
The current combination of conceptual framework and structured method complies to these criteria, and it is a step towards the formalization of model conceptualization tasks. Still, there are some limitations. The first one is that the method does not yet include the composite and the overlaid modes. The second limitation is the lack of software support. Some further questions regarding intuitive representations of variables’ behavior and the effect of name labels on cognitive load call for additional research.
References
- Ackoff RL. 1971. Towards a System of Systems Concepts. Management Science 17(11). [CrossRef]
- Alfeld LE, AK Graham. 1976. Introduction to Urban Dynamics. Wright-Allen Press, Cambridge, MA.
- Andersen DL, LF Luna-Reyes, VG Diker, L Black, E Rich, DF Andersen. 2012. The disconfirmatory interview as a strategy for the assessment of system dynamics models. System Dynamics Review 28(3): 255-275. [CrossRef]
- Barlas Y, K Kanar. 1999. A dynamic pattern-oriented test for model validation. Proceedings of the Proceedings of 4th systems science European congress, pp. 269-286. Citeseer.
- Boğ S, Y Barlas. 2005. Automated dynamics pattern testing, parameter calibration and policy improvement. Proceedings of the International System Dynamics Conference. Boston, MA. System Dynamics Society.
- Edali M. 2022. Pattern-oriented analysis of system dynamics models via random forests. System Dynamics Review 38(2): 135-166. [CrossRef]
- Fiddaman T. 2010a. Urban Dynamics. In MetaSD.
- Fiddaman T. 2010b. The World Dynamics Model. In MetaSD.
- Ford DN. 1999. A behavioral approach to feedback loop dominance analysis. System Dynamics Review 15(1): 3-36.
- Ford DN. 2019. A system dynamics glossary. System Dynamics Review 35(4): 369-379.
- Forrester JW. 1969. Principles of Systems. MIT Press.
- Forrester JW. 1971. World Dynamics. Wright-Allen Press, Cambridge, MA.
- Forrester JW. 1975. Market Growth as Influenced by Capital Investment. Industrial Management Review 9(2): 23.
- Forrester JW. 1999. Urban Dynamics. Pegasus Press, Waltham, MA.
- Groesser SN, MF Schaffernicht. 2012. Mental models of dynamic systems: taking stock and looking ahead. System Dynamics Review 28(1): 22. [CrossRef]
- Groesser SN, M Schwaninger. 2012. Contributions to model validation: hierarchy, process, and cessation. System Dynamics Review 28(2): 157-181. [CrossRef]
- Hassan SA, MH Khodeir. 2021. A Model for Reducing the Cost of Refueling in a Flight Route Problem With Discounted Fuel Prices In Said Ali Hassan, A.W. Mohamed (eds.), Handbook of Research on Decision Sciences and Applications in the Transportation Sector. IGI Global, Hershey, Pennsylvania, pp. 419.
- Hekimoğlu M, Y Barlas, L Luna-Reyes. 2016. Sensitivity analysis for models with multiple behavior modes: a method based on behavior pattern measures. System Dynamics Review 32(3-4): 332-362. [CrossRef]
- Homer J. 2019. Best practices in system dynamics modeling, revisited: a practitioner’s view. System Dynamics Review 35(2): 177-181. [CrossRef]
- Kim H, DF Andersen. 2012. Building confidence in causal maps generated from purposive text data: mapping transcripts of the Federal Reserve. System Dynamics Review 28(4): 311-328.
- Lakoff G, M Johnson. 1980. Metaphors we live by. The University of Chicago Press, Chicago. [CrossRef]
- Martinez-Moyano IJ, GP Richardson. 2013. Best practices in system dynamics modeling. System Dynamics Review 29(2): 102-123. [CrossRef]
- Merriam-Webster. 2022. Pattern. Merriam-Webster. Retrieved 2022-28-2. Available from https://www.merriam-webster.com/dictionary/pattern.
- Mojtahedzadeh M, D Andersen, GP Richardson. 2004. Using Digest to implement the pathway participation method for detecting influential system structure. System Dynamics Review 20(1): 1-20. [CrossRef]
- Morecroft JD. 2015. Strategic Modelling and Business Dynamics. John Wiley, Chichester.
- Naumov S, R Oliva. 2018. Refinements on eigenvalue elasticity analysis: interpretation of parameter elasticities. System Dynamics Review 34(3): 426-437. [CrossRef]
- OECD. 2023. PISA 2022 Results (Volume I): The State of Learning and Equity in Education. OECD, Paris.
- Randers J. 1980. Elements of the System Dynamics Method. Productivity Press, Cambridge, MA.
- Richardson G, A Pugh. 1989. Introduction to System Dynamics Modeling. Pegasus Communications, Waltham, MA.
- Saleh M, R Oliva, CE Kampmann, PI Davidsen. 2010. A comprehensive analytical approach for policy analysis of system dynamics models. European Journal of Operational Research 203(3): 673-683. [CrossRef]
- Sawicki S, RZ Frantz , VM Basto Fernandes, F Roos-Frantz, I Yevseyeva, R Corchuelo. 2016. Characterising Enterprise Application Integration Solutions as Discrete-Event Systems. In Miranda F., C. Abreu (eds.), Handbook of Research on Computational Simulation and Modeling in Engineering. IGI Global, Hershey, Pennsylvania, pp. 824.
- Schaffernicht M, S Groesser. 2016. A competence development framework for learning and teaching system dynamics. System Dynamics Review 32(1): 52-81. [CrossRef]
- Schaffernicht MF. 2010. Causal loop diagrams as means to improve the understanding of dynamic problems: a critical analysis. Systems Research and Behavioral Science 27(6): 13.
- Schaffernicht MF, SN Groesser. 2018. Growth Dynamics in New Markets: Improving Decision Making through Model-Based Management. John Wiley, Chichester.
- Sterman J. 2000. Business dynamics—Systems Thinking and Modelling for a Complex World. McGraw-Hill.
- Tomoaia-Cotisel A, SD Allen, H Kim, D Andersen, Z Chalabi. 2022. Rigorously interpreted quotation analysis for evaluating causal loop diagrams in late-stage conceptualization. System Dynamics Review 38(1): 41-80. [CrossRef]
- Walrave B. 2016. Determining intervention thresholds that change output behavior patterns. System Dynamics Review 32(3-4): 261-278. [CrossRef]
- Yücel G, Y Barlas. 2011. Automated parameter specification in dynamic feedback models based on behavior pattern features. System Dynamics Review 27(2): 195-215. [CrossRef]
Figure 1.
A three-level taxonomy of behavior modes.
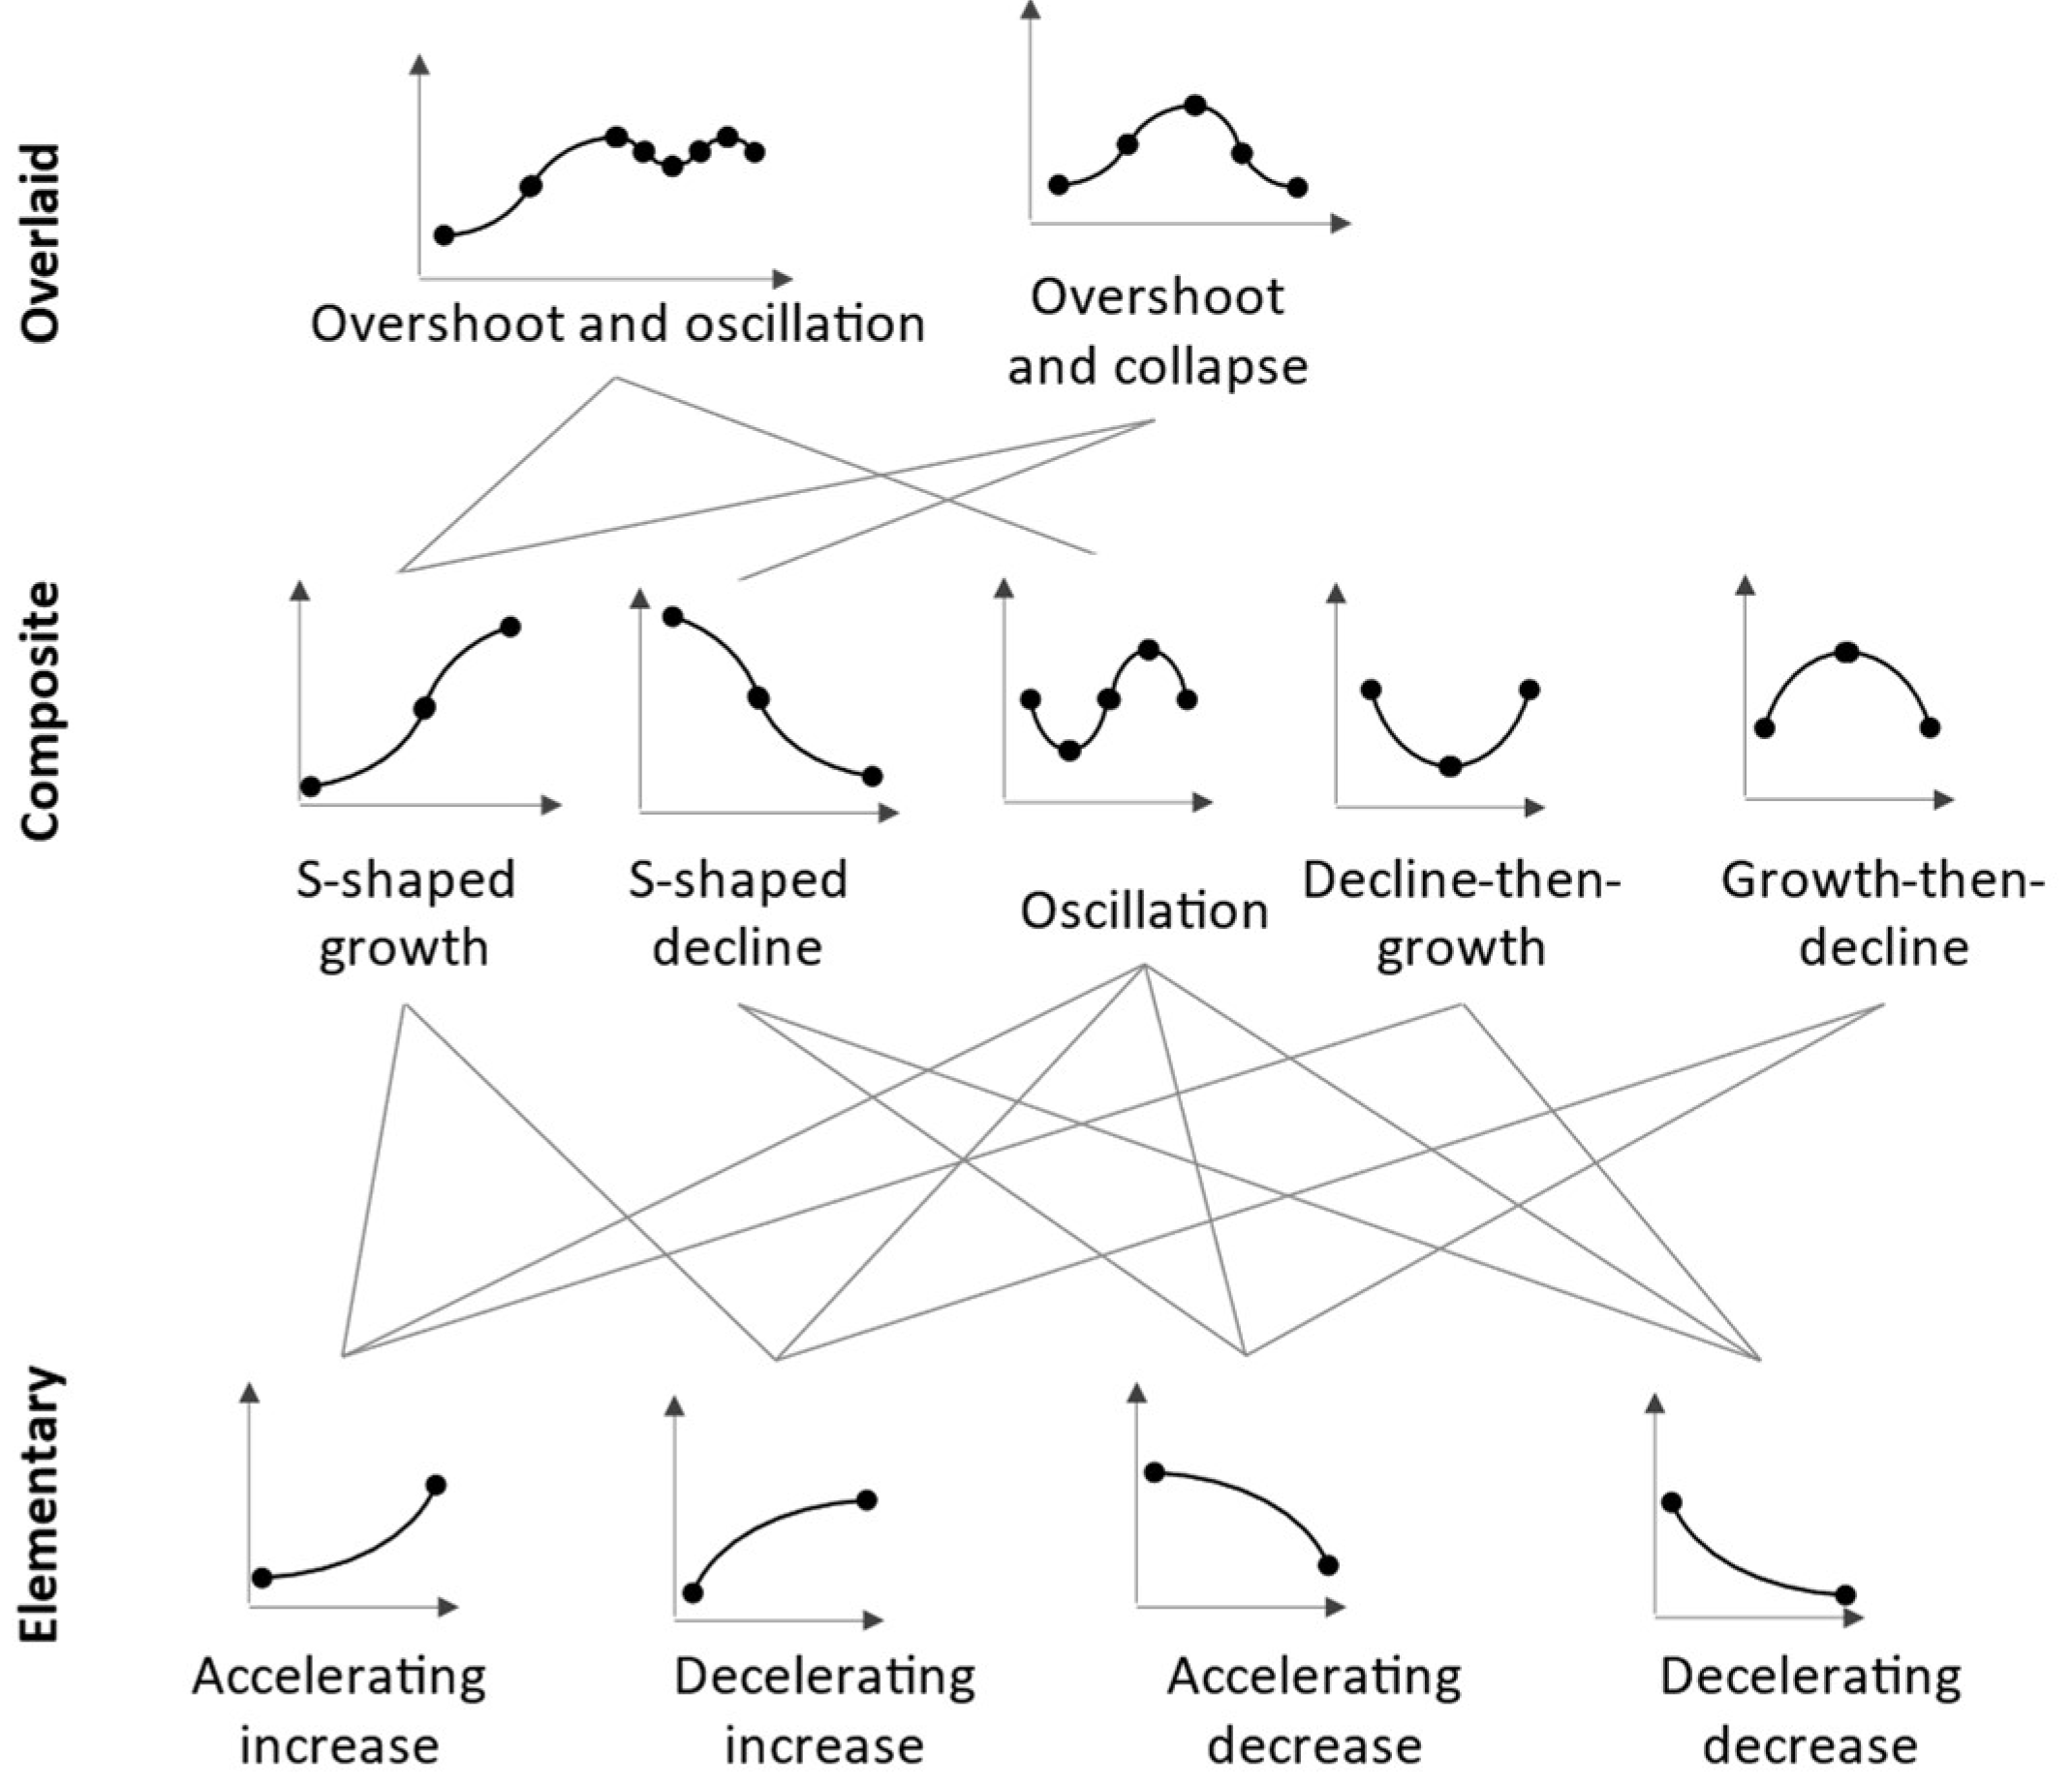
Figure 2.
Punctuating time horizons.
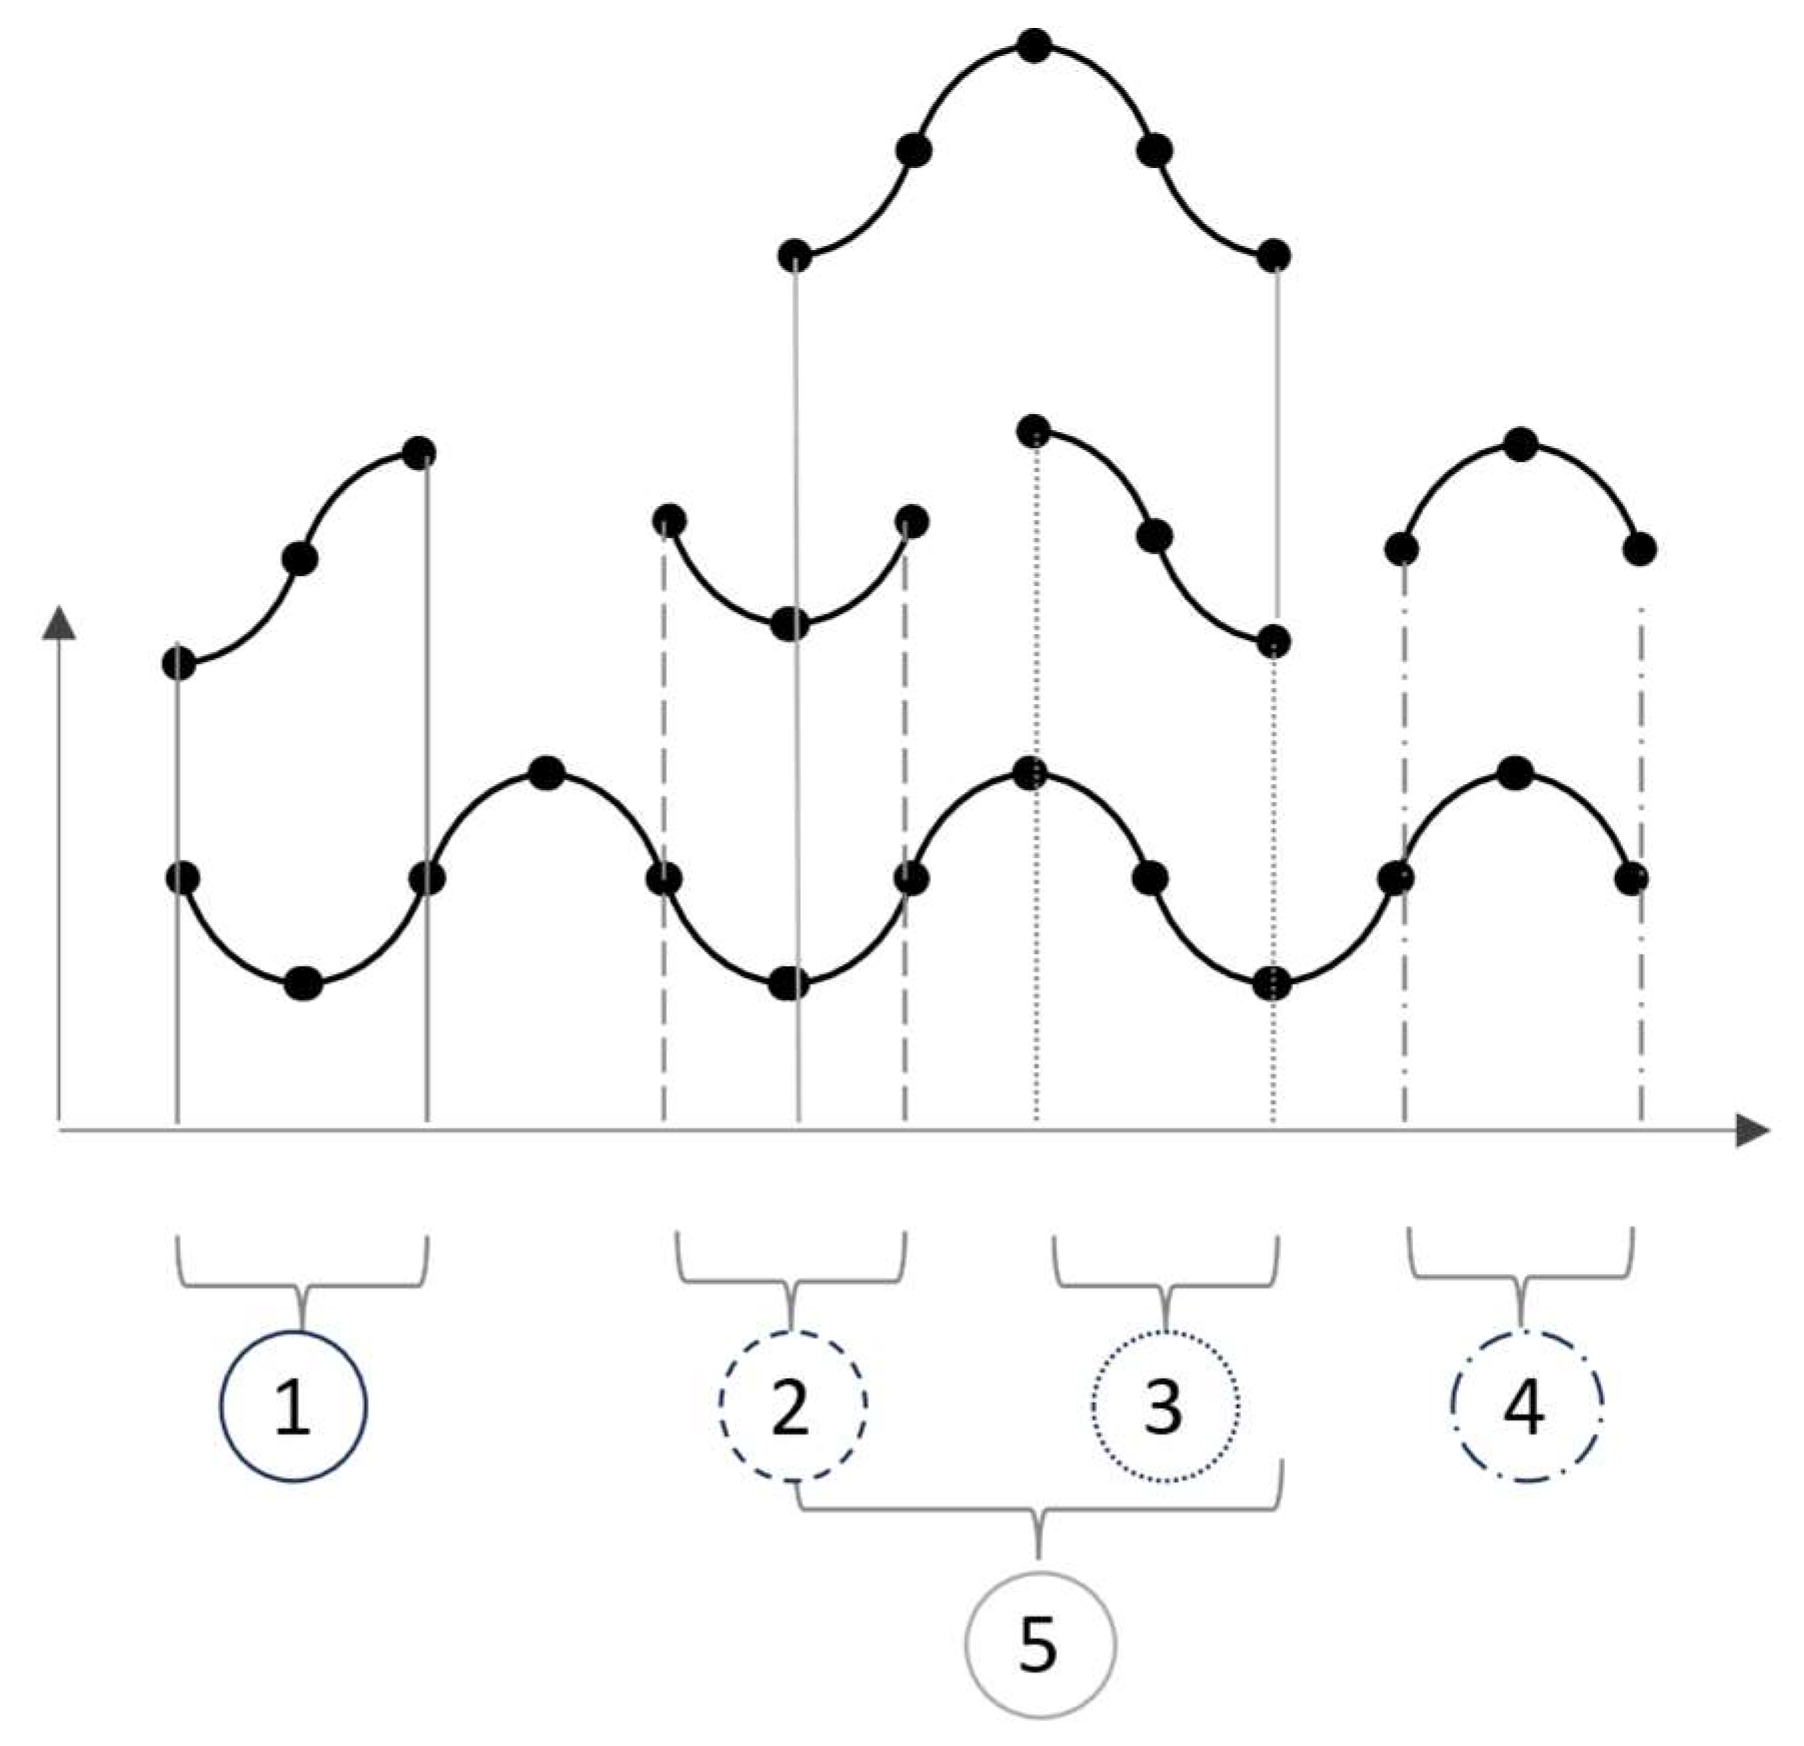
Figure 3.
Data points and slopes.
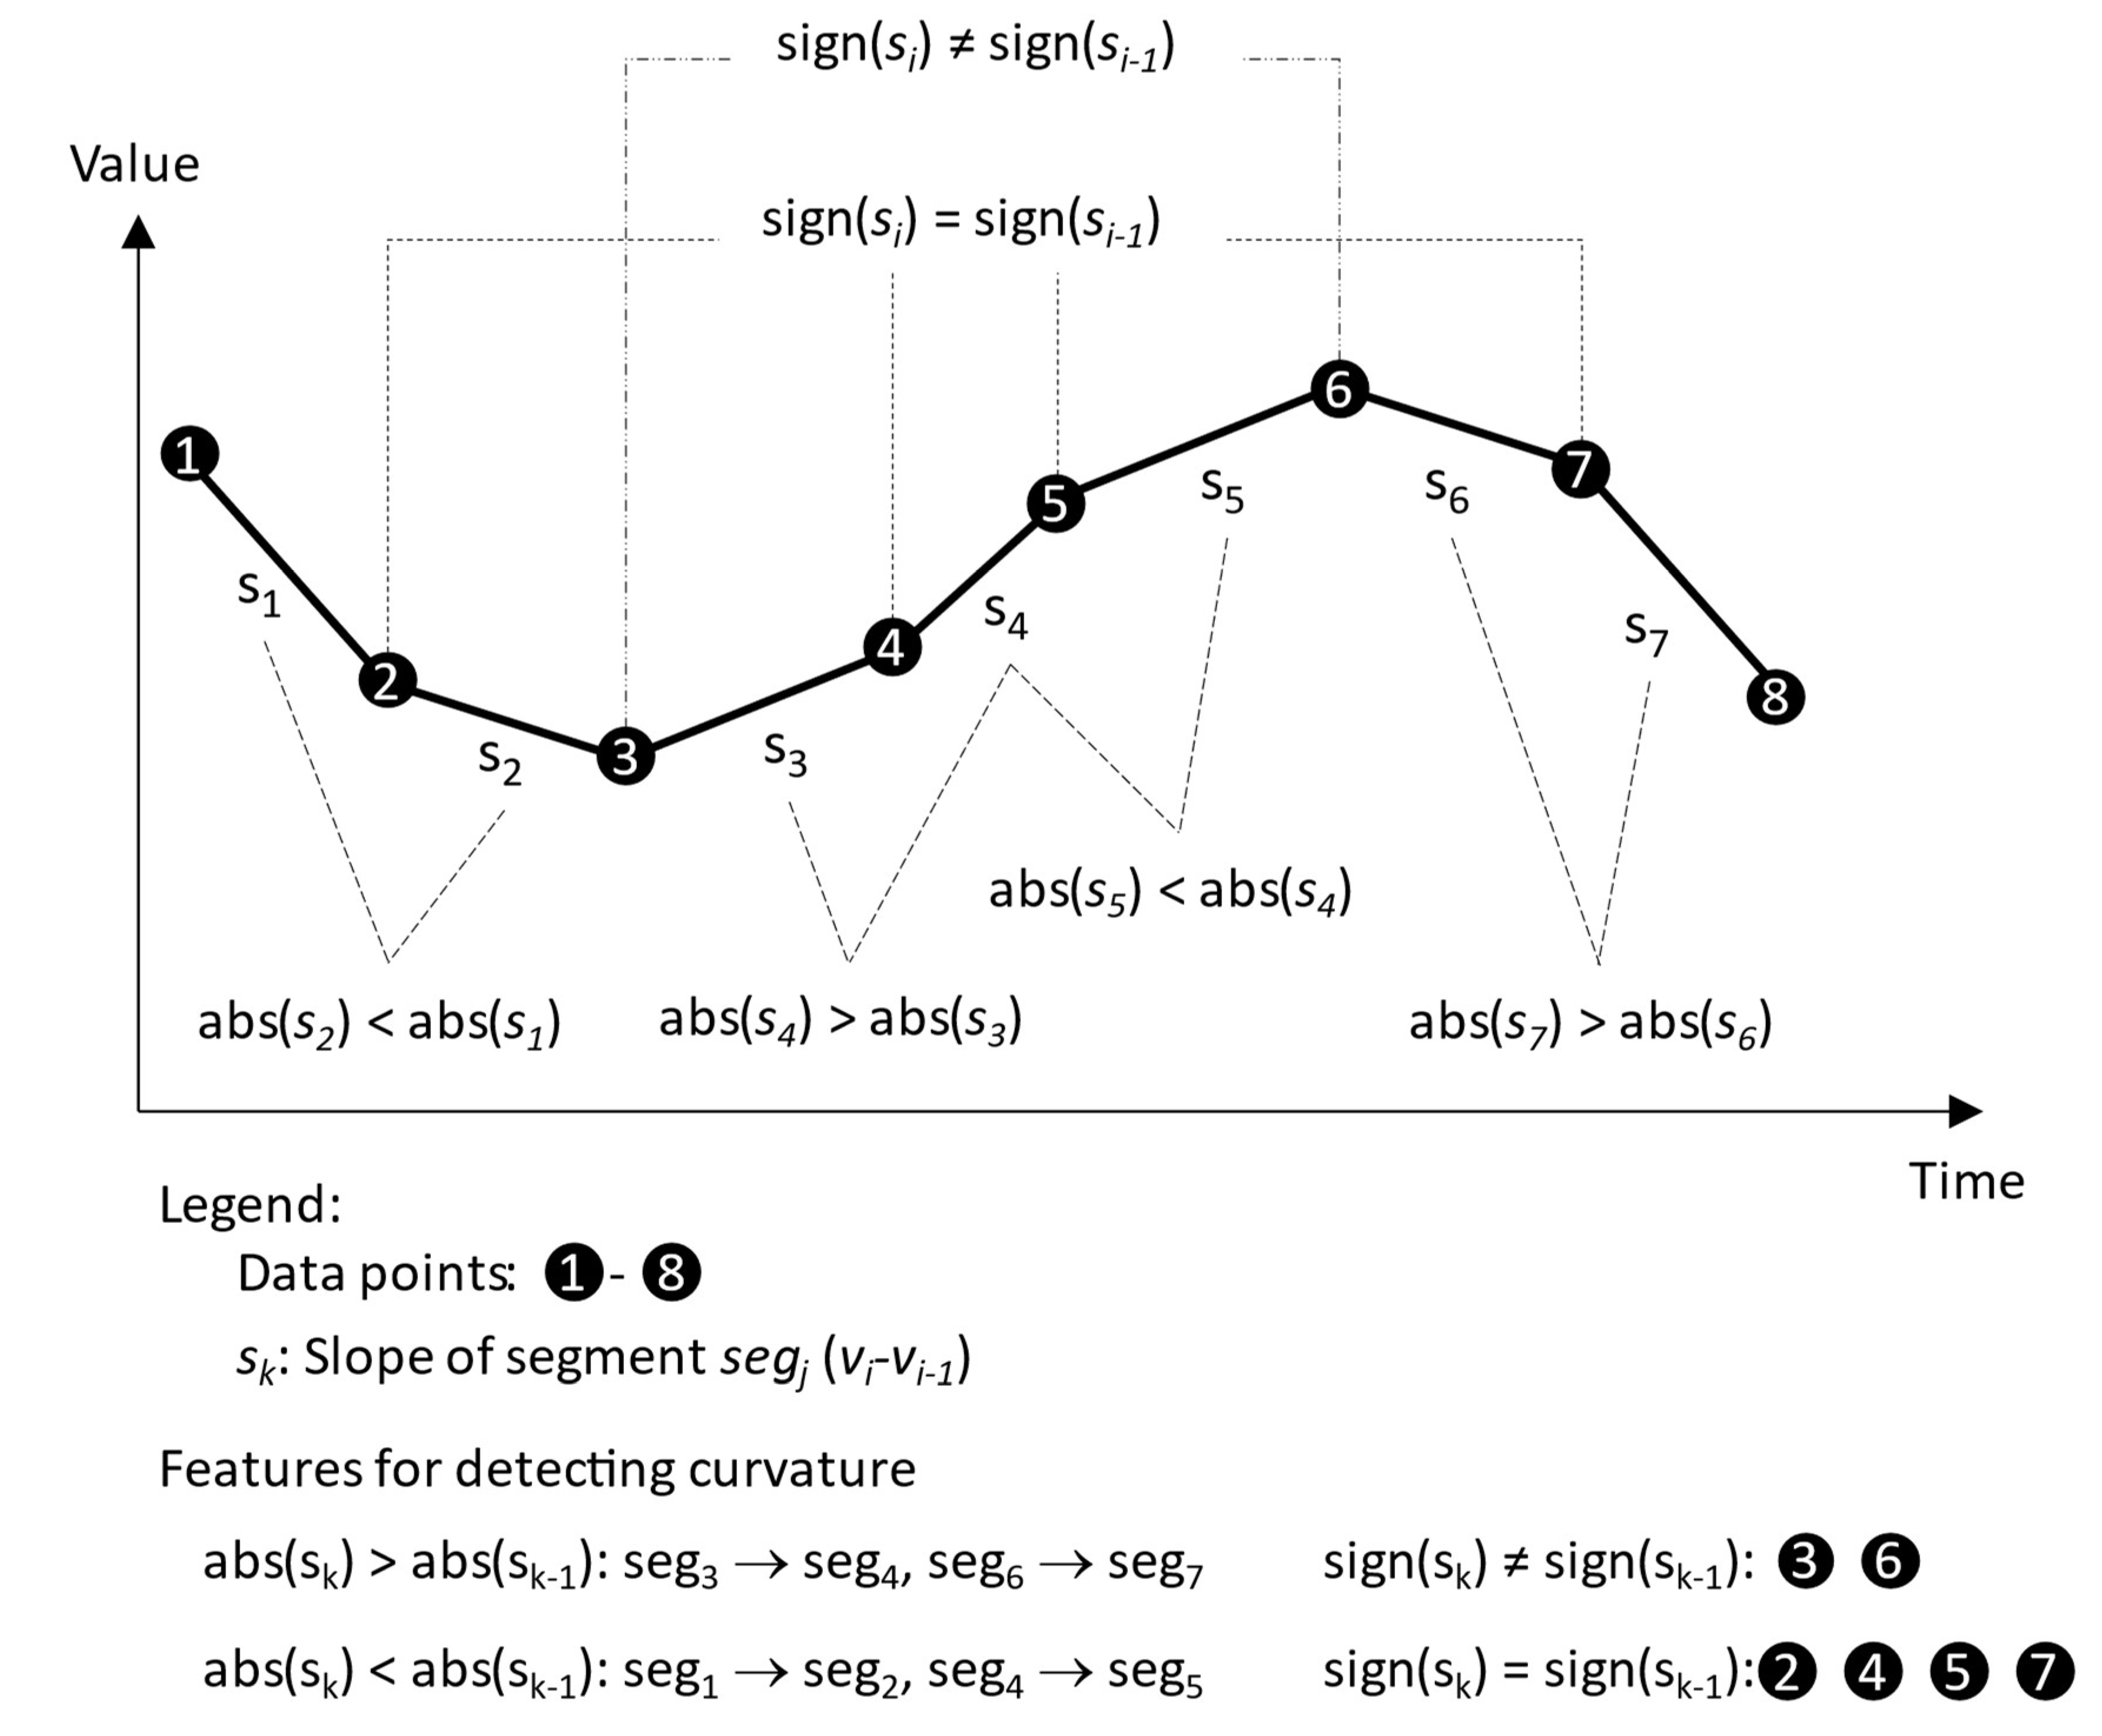
Figure 4.
Two examples of variations that lead to different decisions regarding episodes.
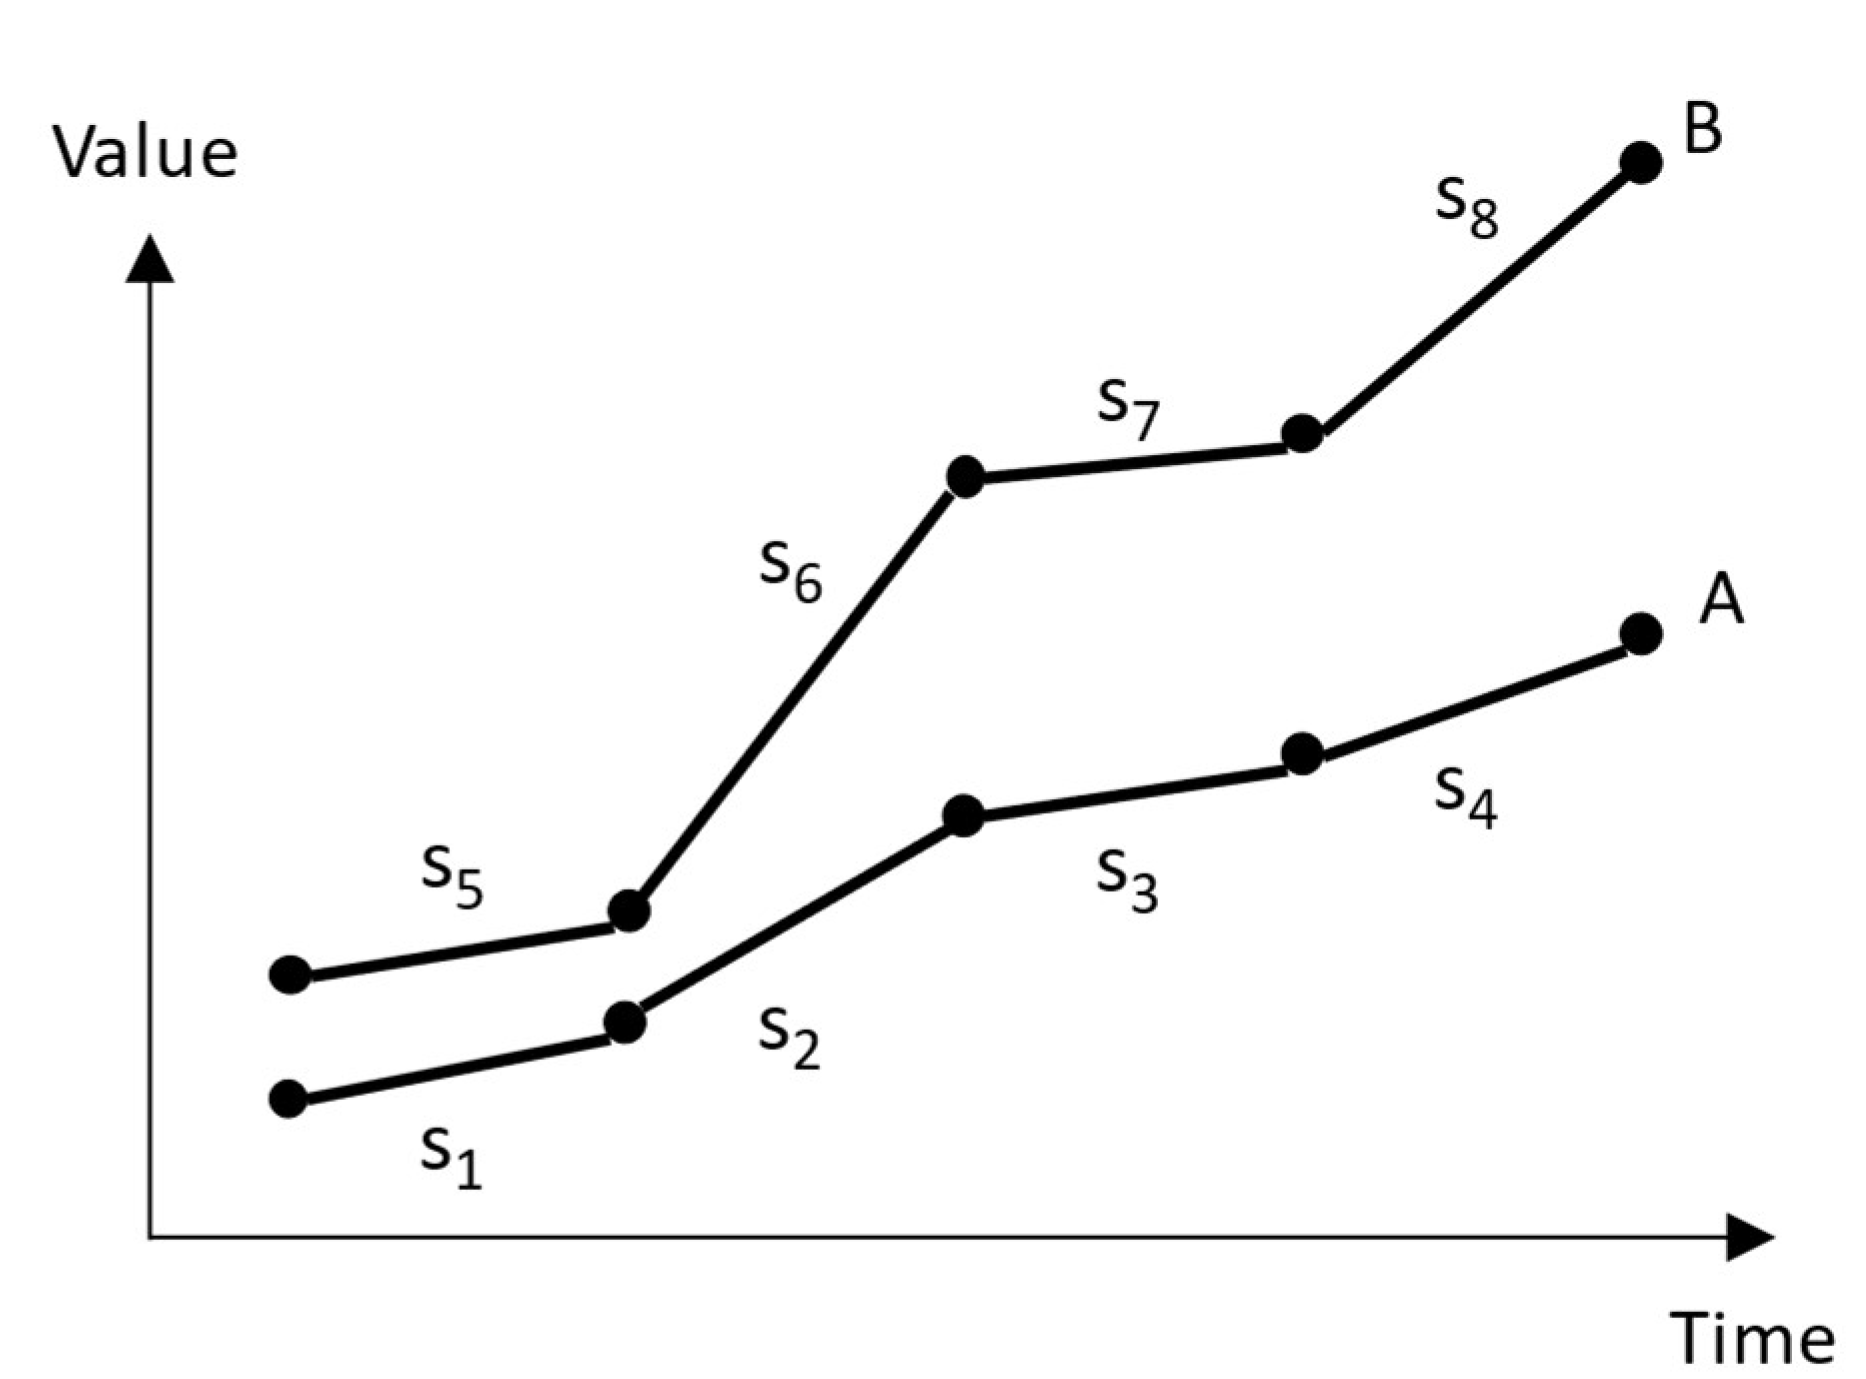
Figure 5.
Systemic behavior modes are the union of the variables’ modes.
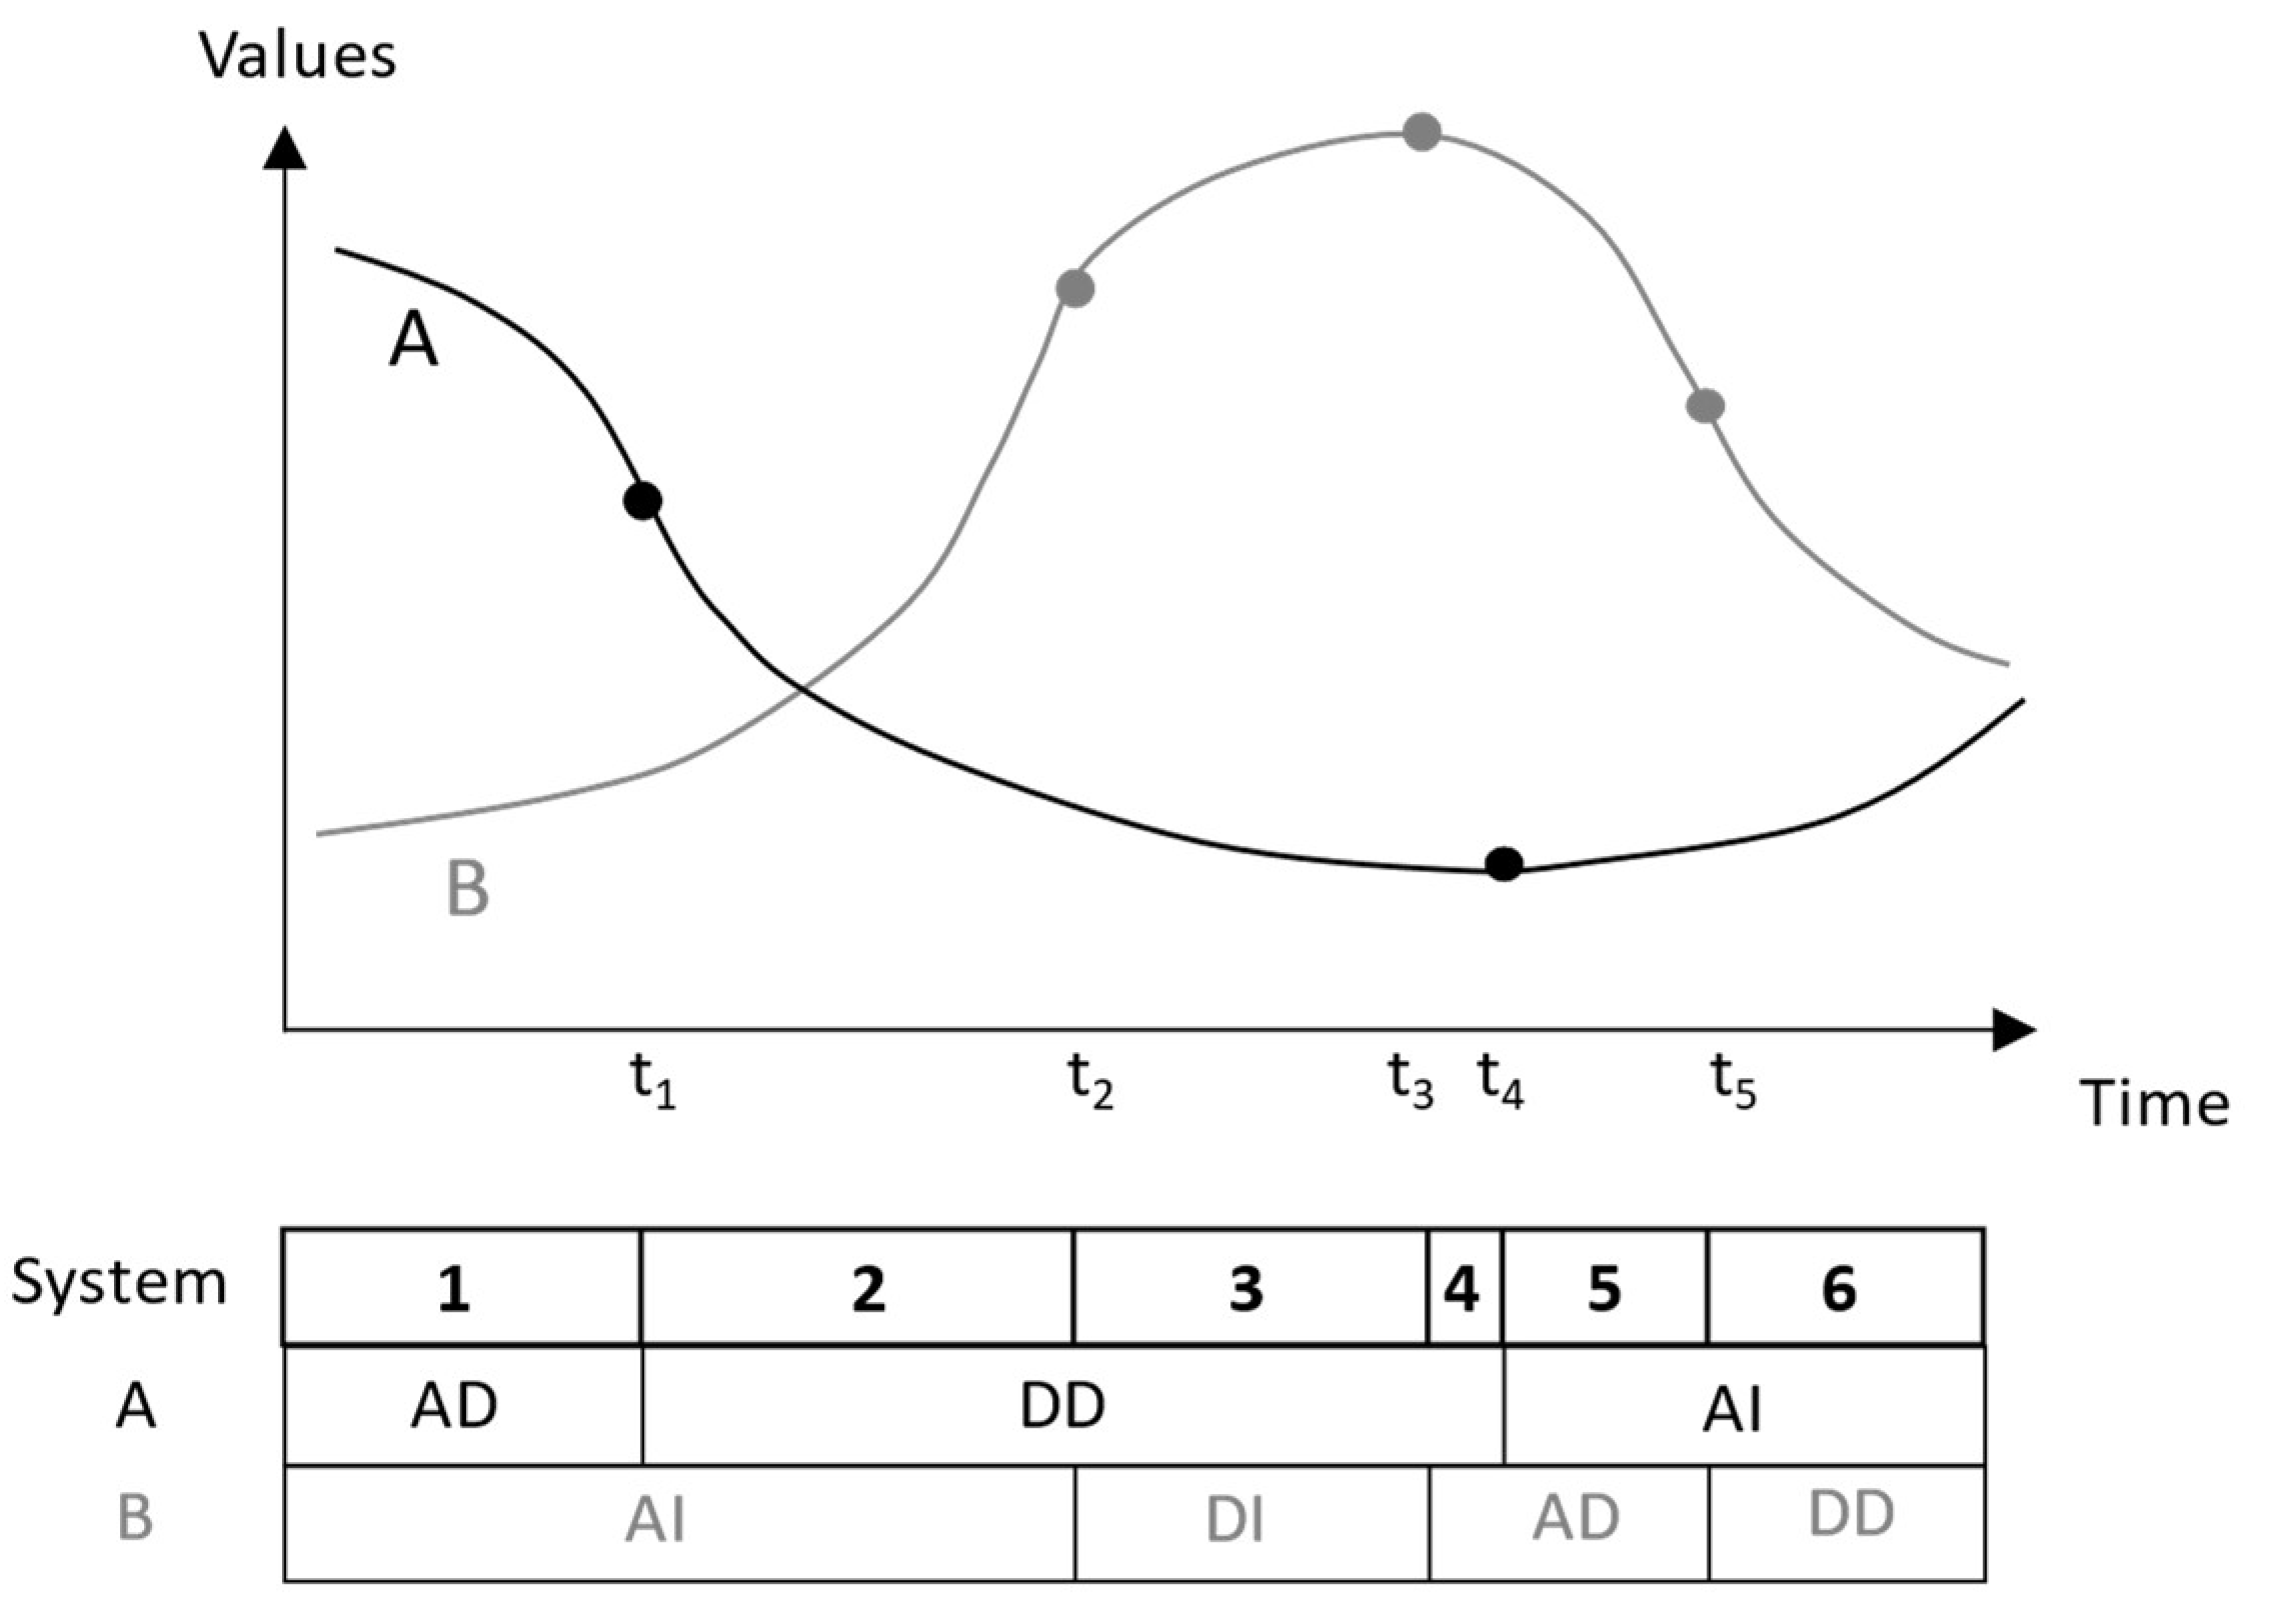
Figure 6.
Behavior of firms, housing, and people in the Urban Dynamics case. Own data extracted from simulating the model by (Fiddaman, 2010a).
Figure 6.
Behavior of firms, housing, and people in the Urban Dynamics case. Own data extracted from simulating the model by (Fiddaman, 2010a).
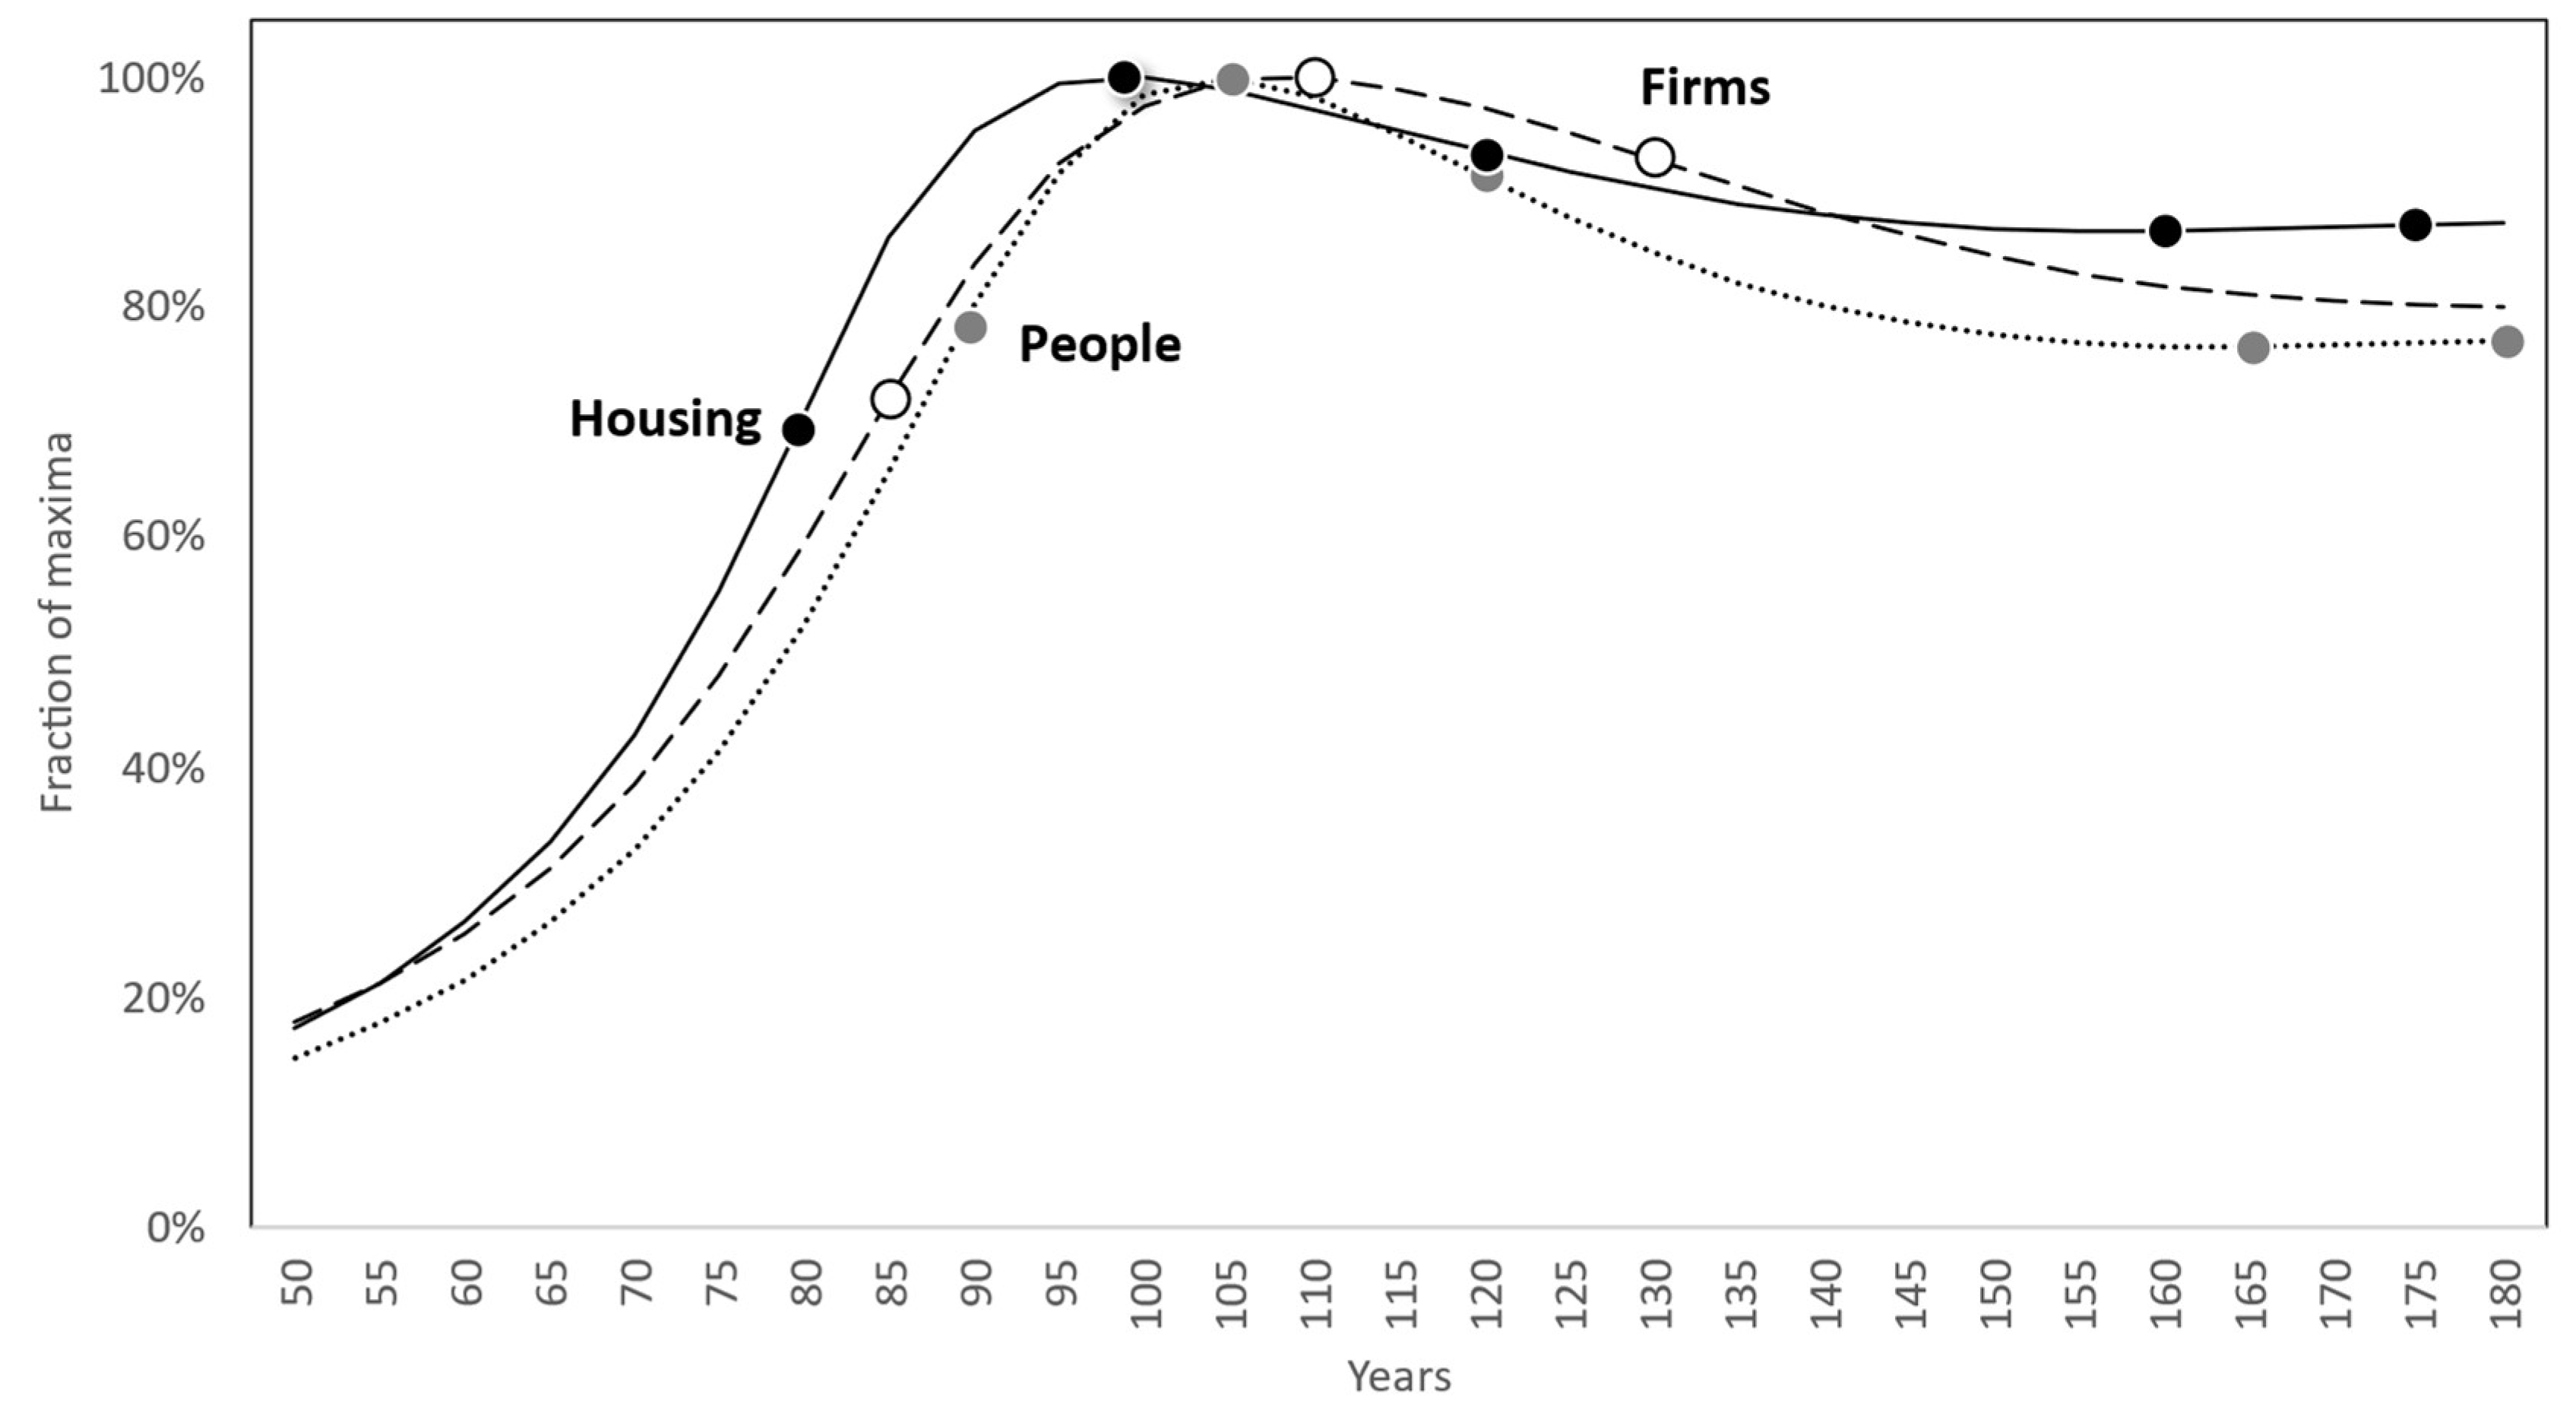
Figure 7.
Sistemic episodes of a city. AI is accelerating increase, DI is decelerating increase, AD is accelerating decrease, and DD is decelerating decrease.
Figure 7.
Sistemic episodes of a city. AI is accelerating increase, DI is decelerating increase, AD is accelerating decrease, and DD is decelerating decrease.
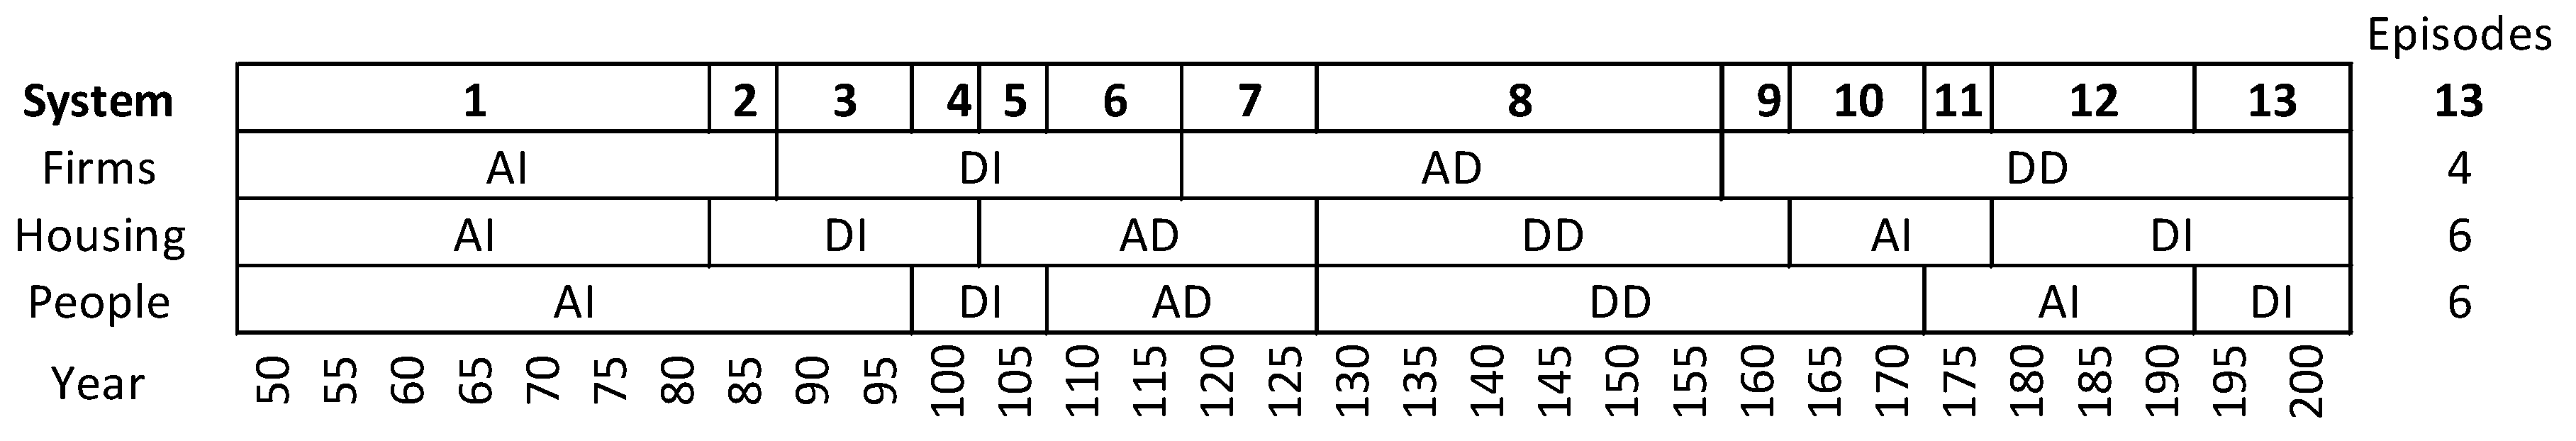
Figure 8.
The behavior of sales force, capacity, and backlog in the market growth case. Own data extracted from the model redeveloped from the original equations.
Figure 8.
The behavior of sales force, capacity, and backlog in the market growth case. Own data extracted from the model redeveloped from the original equations.
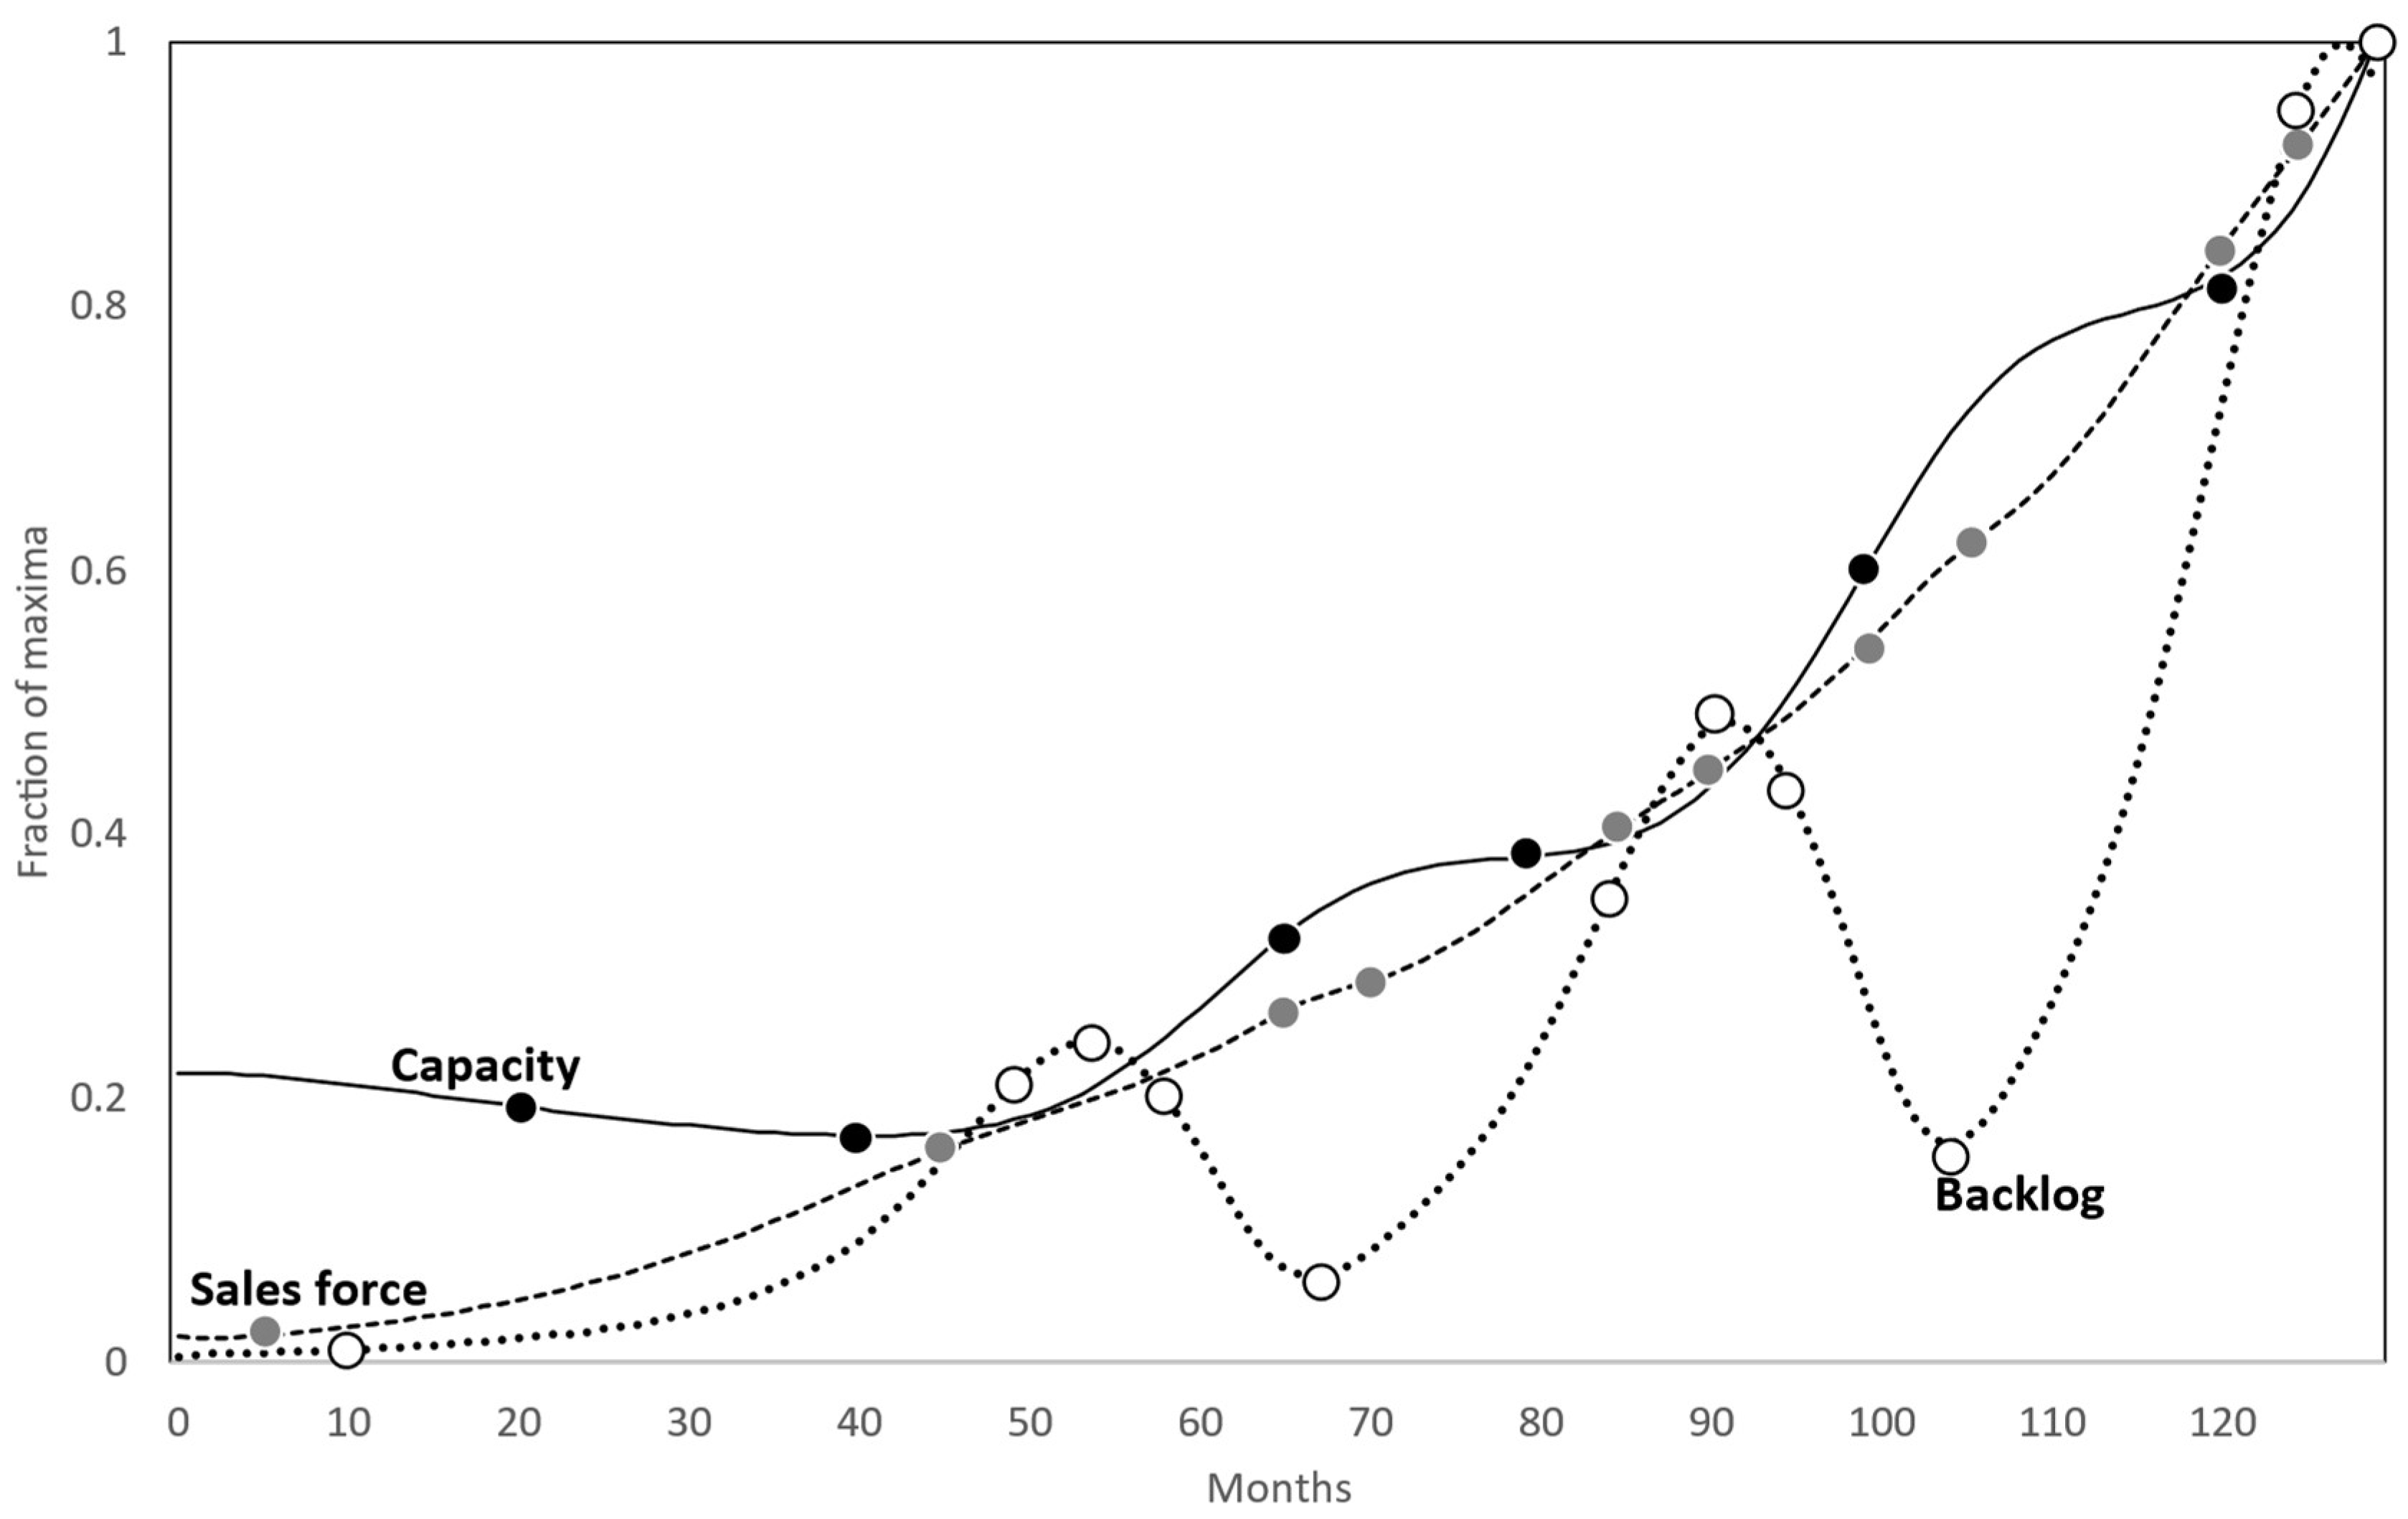
Figure 9.
Sistemic episodes of the company’s growth.
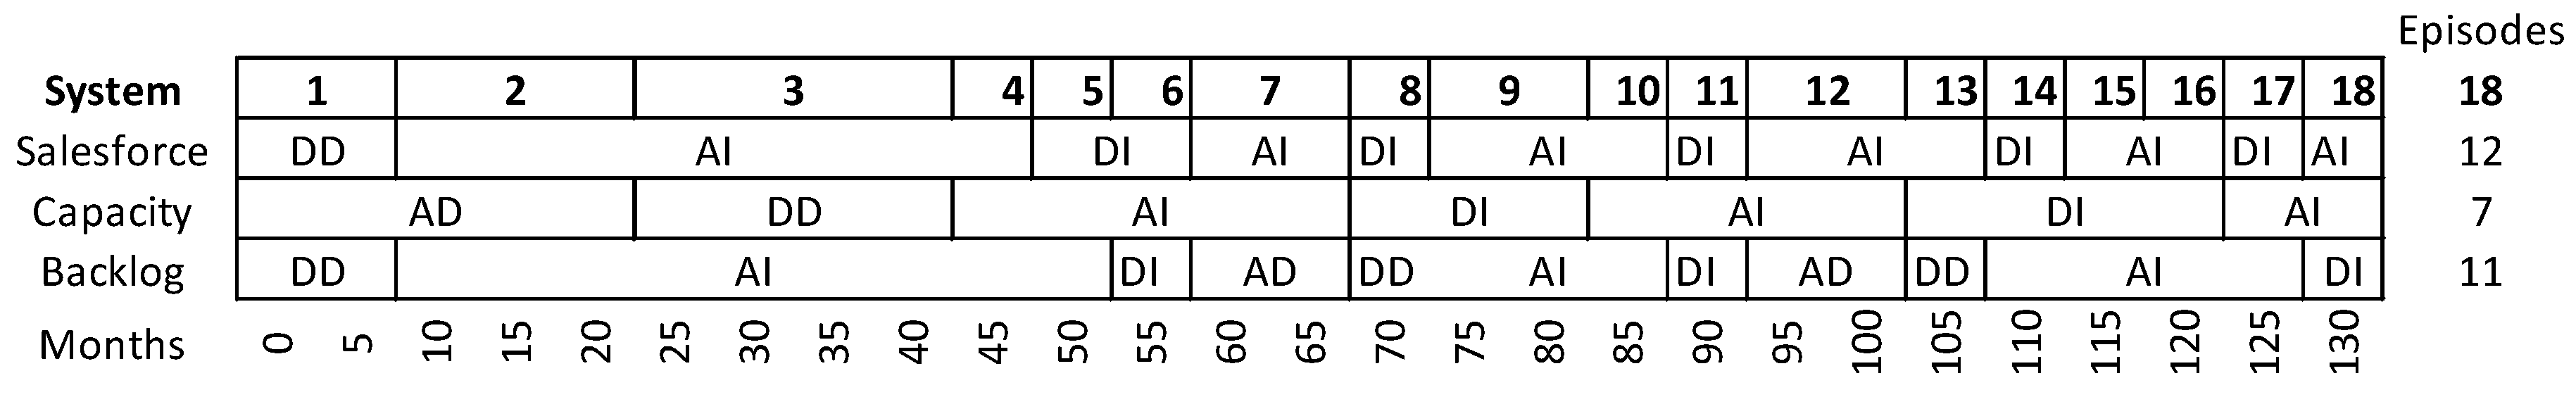
Figure 10.
The behavior of population, capital, capital agriculture fraction, natural resources, and pollution in the World Dynamics case. Own data extracted from the model by (Fiddaman, 2010b).
Figure 10.
The behavior of population, capital, capital agriculture fraction, natural resources, and pollution in the World Dynamics case. Own data extracted from the model by (Fiddaman, 2010b).
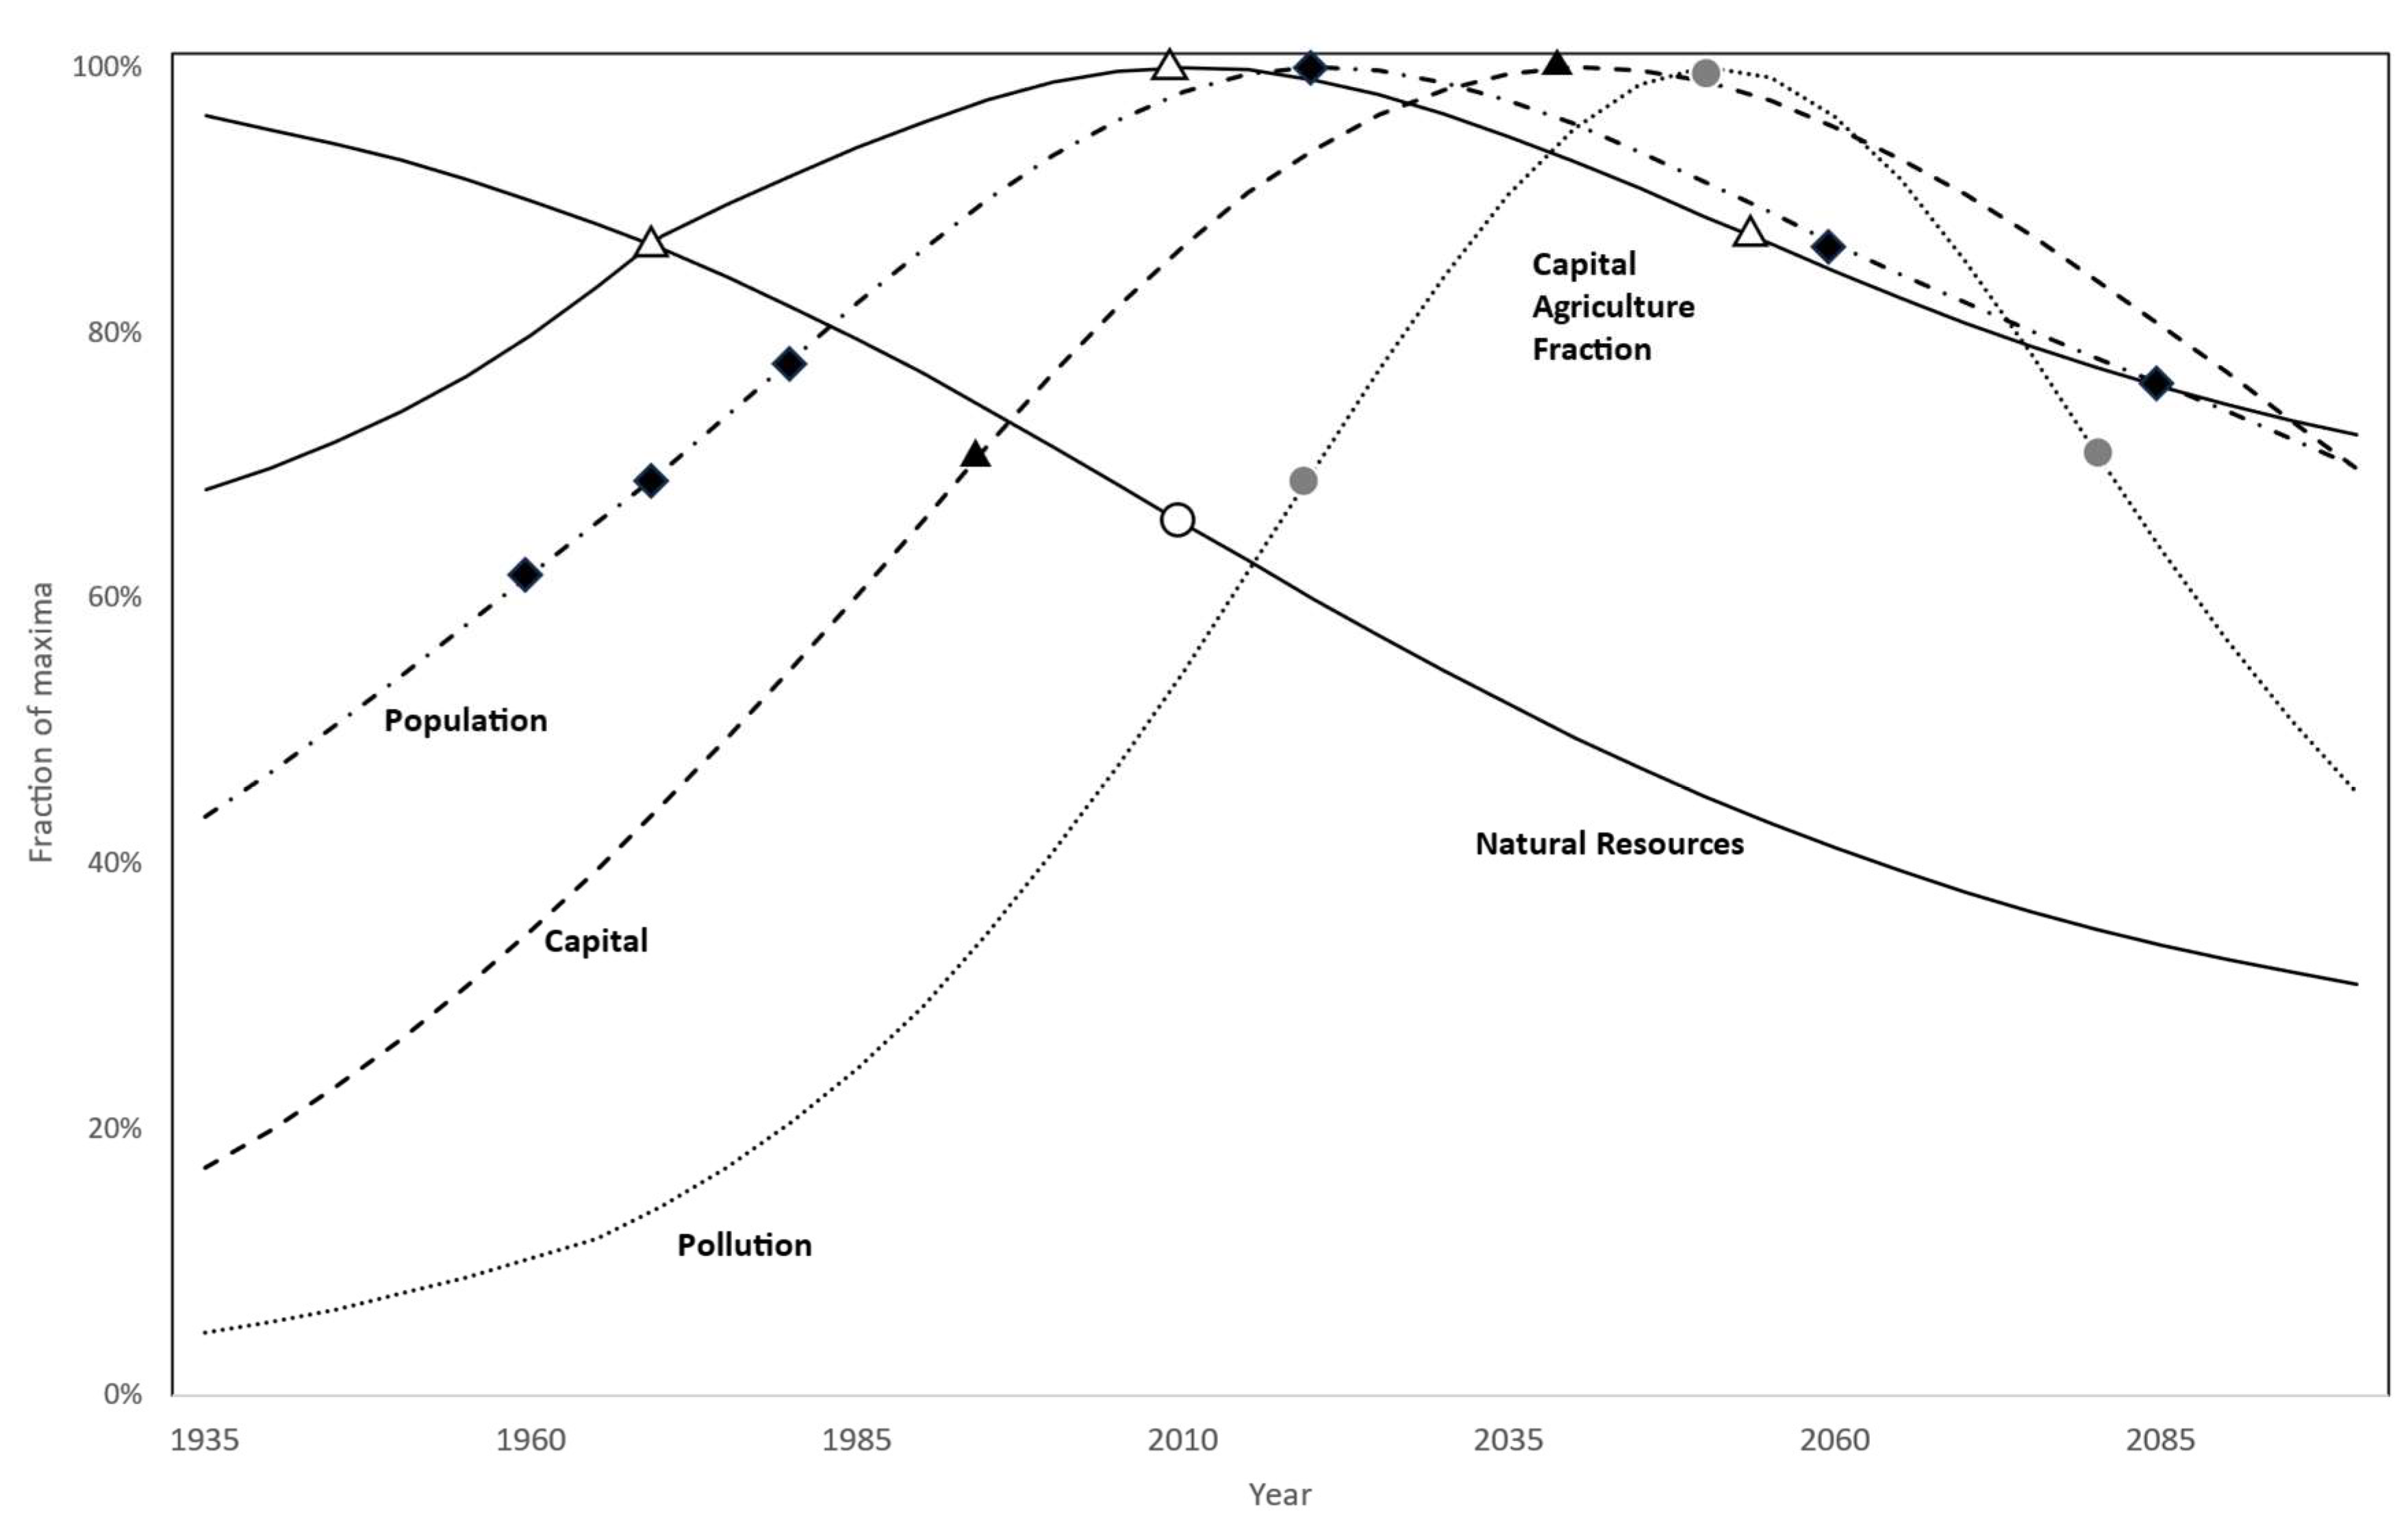
Figure 11.
Sistemic episodes of the planetary system.
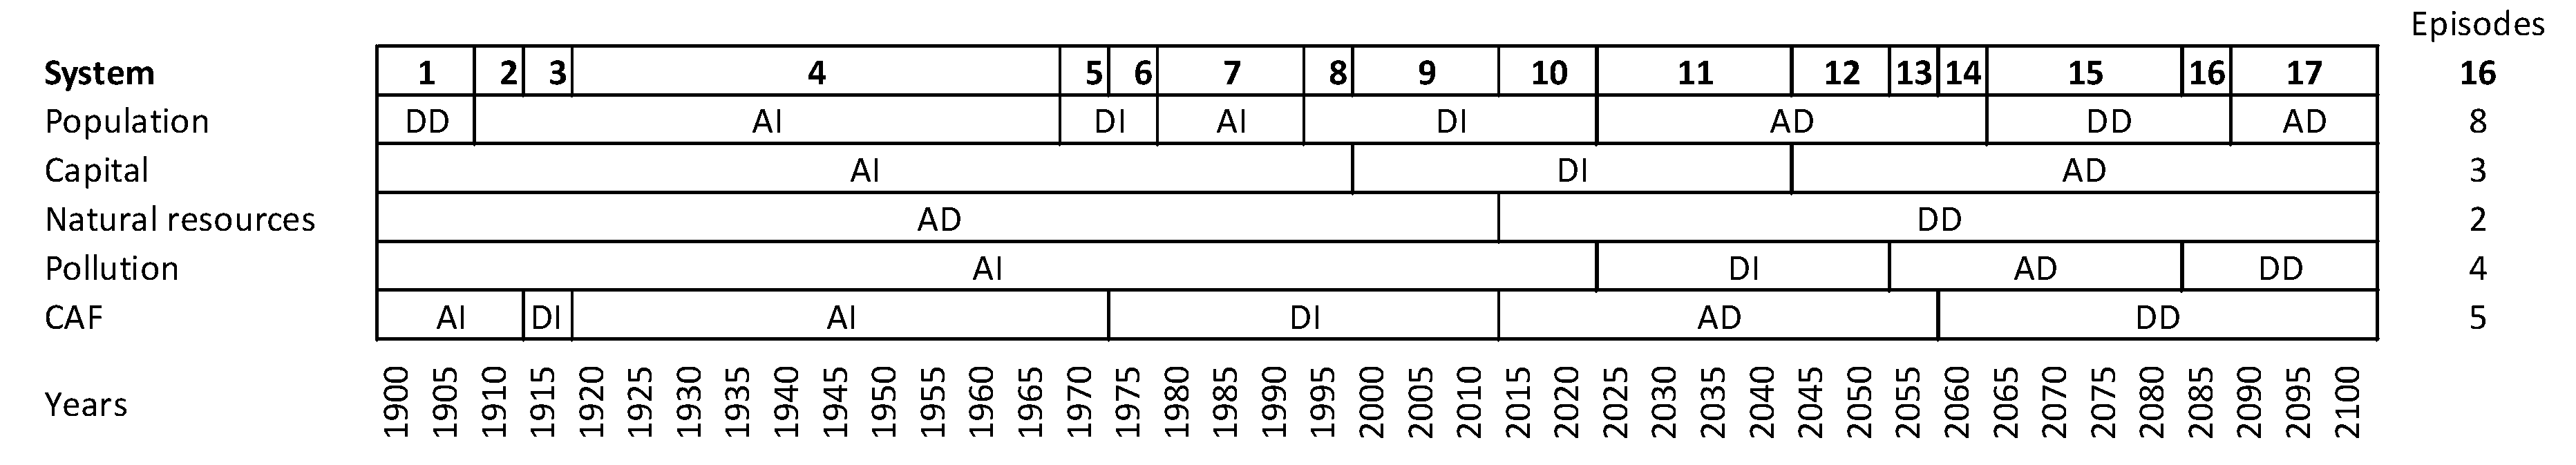

Table 1.
Elementary behavior modes in the literature. The numbers correspond to the number of name labels the respective authors used referring to each elementary mode.
Table 1.
Elementary behavior modes in the literature. The numbers correspond to the number of name labels the respective authors used referring to each elementary mode.
| Elementary modes | Ford (1999) | Sterman (2000) | Ford (2019) | Barlas et al. (1999, 2006) | Morecroft (2015) | Randers (1980) | Richardson and Pugh (1981) | Forrester (1969) |
| Constant increase | - | - | - | 1 | 1 | - | - | - |
| Constant decrease | - | - | - | 1 | 1 | - | - | - |
| Accelerating increase | 1 | 1 | 2 | 1 | 1 | 1 | 1 | 1 |
| Decelerating increase | 1 | - | 2 | 1 | - | - | 1 | 1 |
| Accelerating decrease | 1 | - | 2 | 1 | 1 | - | - | - |
| Decelerating decrease | 1 | 2 | 2 | 1 | - | - | 1 | - |
| Steady-state | - | - | - | 1 | - | - | - |
Table 2.
Composite modes in the literature.
| Composite modes | Sterman (2000) | Ford (2019) | Barlas et al. (1999, 2006) | Morecroft (2014) | Randers (1980) | Richardson and Pugh (1981) | Forrester (1969) |
|---|---|---|---|---|---|---|---|
| S-shaped growth | 1 | 1 | 1 | 1 | 1 | 1 | - |
| S-shaped degrowth | - | - | 1 | - | - | 1 | - |
| Oscillation | 1 | 1 | 1 | 1 | 1 | 1 | 1 |
| Overshoot and collapse | 1 | - | - | - | - | - | 1 |
| Overshoot and oscillation | 1 | - | - | - | - | - | 1 |
| Decelerating decrease and Accelerating increase | - | - | 1 | 1 | 1 | - | - |
| Decelerating increase and Accelerating decrease | - | - | - | 1 | 1 | - | - |
| S-shaped growth and S-shaped degrowth | - | - | 1 | - | - | - | - |
| S-shaped degrowth and S-shaped growth | - | - | 1 | - | - | - | - |
Table 3.
Elementary modes and episode transitions in the Urban Dynamics case.
| System | Year | Firms | Housing | People | ||||||
|---|---|---|---|---|---|---|---|---|---|---|
| Transition | Value(%) | Mode | Trans. | Value (%) | Mode | Trans. | Value (%) | Mode | Trans. | |
| 1 | 80 | 59.60 | A.I. | 70.85 | A.I. | 1 | 52.32 | A.I. | ||
| 1 | 85 | 72.07 | A.I. | 1 | 86.08 | D.I. | 65.87 | A.I. | ||
| 1 | 90 | 83.78 | D.I. | 95.36 | D.I. | 80.08 | A.I. | 1 | ||
| 1 | 100 | 97.61 | D.I. | 100.00 | D.I. | 1 | 98.49 | D.I. | ||
| 1 | 105 | 99.80 | D.I. | 98.89 | A.D. | 100.00 | D.I. | 1 | ||
| 1 | 110 | 100.00 | D.I. | 1 | 97.23 | A.D. | 98.27 | A.D. | ||
| 1 | 120 | 97.31 | A.D. | 93.67 | A.D. | 1 | 91.37 | A.D. | 1 | |
| 1 | 130 | 92.82 | A.D. | 1 | 90.33 | D.D. | 84.74 | D.D. | ||
| 1 | 160 | 81.82 | D.D. | 86.67 | D.D. | 1 | 76.67 | D.D. | ||
| 1 | 165 | 81.05 | D.D. | 86.77 | A.I. | 76.60 | D.D. | 1 | ||
| 1 | 175 | 80.28 | D.D. | 87.12 | A.I. | 1 | 76.87 | A.I. | ||
| 1 | 180 | 80.14 | D.D. | 87.29 | D.I. | 77.08 | A.I. | 1 | ||
| 1 | 195 | 80.06 | D.D. | 1 | 87.58 | D.I. | 77.48 | D.I. | ||
| 13 | 4 | 5 | 5 | |||||||
Disclaimer/Publisher’s Note: The statements, opinions and data contained in all publications are solely those of the individual author(s) and contributor(s) and not of MDPI and/or the editor(s). MDPI and/or the editor(s) disclaim responsibility for any injury to people or property resulting from any ideas, methods, instructions or products referred to in the content. |
© 2024 by the authors. Licensee MDPI, Basel, Switzerland. This article is an open access article distributed under the terms and conditions of the Creative Commons Attribution (CC BY) license (http://creativecommons.org/licenses/by/4.0/).
Copyright: This open access article is published under a Creative Commons CC BY 4.0 license, which permit the free download, distribution, and reuse, provided that the author and preprint are cited in any reuse.


