

Submitted:
03 September 2024
Posted:
04 September 2024
You are already at the latest version
Abstract
Using different frequency group period phase synchronization, a precise frequency detecting technology is presented. On the basis of the phase comparison for different frequencies, a high-accuracy frequency measuring can be achieved by quantization of phase comparison results and analysis of quantization results. Using the phase coincidence points between comparison signals as the counter’s open and close signals, the time interval between the same phase coincidence points is a group period. Via the detection and analysis of the phase coincidence points, the ±1-word counting error can be eliminated, and measuring speed is also improved. By using FPGA technology, the measuring device can be simplified, and the development cost can be reduced. Testing results indicate that the frequency measuring accuracy with 10−13/s level can be achieved. The technology is greater than the common frequency measuring technology in more ways than one, such as power consumption, device volume, measuring rate, etc., so it plays an important role in Beidou satellite positioning, precise timing, high-precision time frequency transfer and comparison, scientific metrology and other fields.
Keywords:
frequency detecting
; group quantization
; phase synchronization
; group period
1. Introduction
With the development of aeronautics and astronautics, location services and scale applications, air to earth and sea technology, high-tech communication, and high precision radar detection, the measuring precision of frequency signals, especially RF signal, is required to be higher [1,2,3]. At present, frequently used frequency detecting technologies are mainly pulse frequency measuring technology, analog interpolation detecting technology, multi-cycle synchronous measuring technology and time vernier detecting technology, etc. The pulse frequency measuring and multi-cycle synchronous measuring technologies exist the counting error with ± 1 word [4,5,6]. Due to the filling frequencies often no more than 10−9Hz, the frequency detecting’s accuracy is Often no more than 10−9/s. The produced frequency detecting meter via these methods has the characteristics of simple equipment structure and low developing cost, but its detecting precision is very low. The counting error with ± 1 word still exists in the analog interpolation detecting and time vernier detecting technologies, but it can be down to about 0.0001 by using the interpolator, the detecting precision can also reach the 10−11/s. The frequency detecting instruments using these two technologies have good accuracy, but the system’s structure and design are the obvious complexity, at the same time, the higher developing costs limit their applications [7,8,9]. The frequency measuring technology by phase coincidence detecting effectively eliminates the counting error with ± 1 word in the frequency detecting, making the frequency detecting precision up to the 10−10/s, but the phase coincidence points are not unique and random, further improving frequency detecting precision is very difficult.
Considering the above, a precise frequency detecting technology is proposed based on group period synchronization. The technology combines the group period’s change rule and the compared signals’ frequency relations, which not only solves many frequency measuring’s problems for phase coincidence detecting, but also miniaturizes the equipment, narrows the developing costs, and increases the system’s frequency measuring accuracy.
2. Methods
A number of tests indicate that the phase coincidence points between two different frequency signals repeats at the group period intervals, that is, group period synchronization [10,11]. A precise frequency measuring can be get by using the change rule [12,13].
Suppose that there are two stable signals, and , the and signals’ period are the and , respectively. Then the relationship between the signals and is as follows.
In Formula (3), and () are integers greater than zero, respectively. The is called the least common multiple period, and the is called the greatest common factor period. As shown in Figure 1. In Figure 1, the and are the reference and measured signals, the is the phase coincidence point.
As you can see, in a ,
When the and maintain integer multiples, the phase differences in a are shown in Formula (5).
From the Formula (5) , the , , ... , and are some phase differences in the , and are the numbers for front edge pulses. When the signals and do not maintain integer multiples, let , is the phase shift caused by the frequency deviation between the and . The phase differences in a are described below.
The differences of phases within the 1st are
The differences of phases within the 2nd are
The differences of phases within the 3rd are
The differences of phases within the are
The differences of phases within the are
It can be seen from the Formula (6) to the Formula (10) that we can find the regularity of the change of phase differences in the process of phase comparison of different frequencies. In an adjacent , the value corresponding to the phase difference is equal to , written as, . The difference of phase between the 1st and the is equal to in the same position. When , the phase coincidence points in a will change periodically. The time interval among the periodic changes is equal to a group period , written as,
Therefore, the can be obtained by observing the time interval between the periodic changes of the , and the can be calculated by the .
Thus, the signal can be calculated by the formula .
It can be seen from Formula (12) that there is a big error in the actual measurement. When counting the , the ± 1 word-counting error will cause the actual measuring results to be the integer multiples. Although the period is small, this kind of error is not allowed. By analyzing the and the , the phase differences’ change rule can be get. Whenever two identical phase differences occur in the same time, it is a group period shown in Figure 1. When and are counted in a group period, and the results are and , the Formula (14) is obtained, and both sides of the Formula (14) represent integral multiples of the group period.
As can be seen in Figure 1, the 3rd phase coincidence point in the 1st is the same as the 3rd phase coincidence point in the nth , and this phase coincidence point’s repetition occurs at the same time as a . The 3rd phase coincidence point’s counting value in the 1st is recorded and used as the gate’s open signal, and the 3rd phase coincidence point’s counting value in the nth occurs as the gate’s close signal. By counting the and , respectively, between the open and close signals, the frequency of the is get by Formula (14).
According to the group period’s change rule, the precise frequency linking among different frequencies signals is get, and the measured signal’s period is detected by the reference signal. Because the inherent regularity between the two signals leads to the same phase coincidence point’s repetition, if the between the and is processed, and then the phase quantization results of the phase coincidence point are detected by a high frequency clock, the phase coincidences information can be get conveniently. The signal , the signal , and the phase coincidence point are counted at the same time, and the phase coincidence point is used to generate the gate, and then the signals and are counted at the same gate time, the measuring error resulted in the counting error can be overcome.
If the phase coincidence point counting has a counting error of ± 1 word with a probability of 50%, the close signal must appear at the period of the integer group period, we only need to multiply an integer coefficient at both ends of Formula (14) to resolve the effect of the counting error.
Therefore, in frequency measuring, even if the phase coincidence point’s counting error is ± 1 word, it will not affect the frequency measuring’s results. But the counting error with ± 1 word in phase coincidence point counting will lead to the gate time prolonged and the measuring speed slowing down.
3. Discussion
According to frequency detecting’s principle by the phase coincidence point, the key to improve the frequency detecting precision lies in the acquisition and measurement of the . The are get by the phase comparison between the signals and after shaping processing, then the phase coincidence point’s front and back edges are extracted, respectively, and the high frequency clock is counted between the phase coincidence point’s front and back edges, the same counting results are taken as the open and close signals, respectively, and are transmitted to the MCU for data processing and realization. Figure 2 is this system’s frequency detecting design scheme.
The TSG4102A RF signal generator is used to generate the measured signals, the sine wave signals with the 3.3 V amplitude. The reference signal is provided by the BVA8607B-M high stability Crystal oscillator. The measured signal and the reference signal are connected to FPGA through the FPGA chip’s global clock pin, respectively. In this experiment, a 100MHz signal and a 1GHz signal are produced by an internal PLL in FPGA. The 100MHz signal is used to delay the reference and measured signals to produce narrow pulse signals. First, a narrow pulse signal is transmitted to the different frequency phase comparison module to generate a group period consisting. Secondly, a high frequency clock produced by an internal PLL in FPGA is used to quantify and count the . Then, the time when the phase coincidence points are chosen as the counter’s open signal, and the open signal begins to count the pulses. of the and . The same phase coincidence point occurs as the counter’s close signal, and the close signal is used to end the reference and measured signals’ pulses counting. The reference and measured signals’ pulses counting is completed in the gate time. Finally, the reference and measured signals’ pulses counting results are transmitted to the data processing module through the serial port generated by the FPGA instantiation, and the data processing module obtains the measured signal’s frequency measuring result through formula (14).
3.1. Narrow Pulse Extraction
Because FPGA can directly recognize the sine wave that can be converted into a square wave pulse signal in a chip, therefore, two phase comparison signals can be directly transmitted to the clock pin of the FPGA without signal shaping circuit. As shown in Figure 3.
In Figure 3, the delay circuit is formed by D flip-flops from the FPGA, and by adjusting the D flip-flop’s clock period, its pulse width is more suitable for the delay width. Besides its own delay effect, the delay circuit can also reduce the comparison signals’ noise. The square wave pulse signal is transmitted to an inverter to get another signal opposite to the original square pulse signal’s phase. The inverse and delayed square wave pulse signals are transmitted to the phase coincidence detecting circuit formed by “AND” logic gate to achieve the narrow pulse signal with the same frequency as the square wave pulse signal. As shown in Figure 4.
3.2. Different Frequency Phase Comparison
Figure 5 is the different frequency phase comparison scheme.
After pulse extraction, the measured and reference signals are transformed into the same frequency narrow pulse at the same time, which is beneficial to the processing of phase differences and reduces the uncertainty caused by the sine wave signal rising too long, and it makes the phase comparison more stable. If the narrow pulse signals with the same frequency as the reference and measured signals are transmitted to the different frequency phase comparison processing module, the can be get. As shown in Figure 6.
3.3. Different Frequency Phase Quantization
After extracting the in Figure 6, using a high frequency clock to quantize the phase comparison’s results in FPGA chip to process the and select the gate signal more conveniently. As shown in Figure 7.
As can be seen from Figure 7, each phase coincidence point is quantized during the phase comparison process. The PLL from FPGA provides high-frequency quantizing clock. The quantized phase coincidence points are counted through this high-frequency quantizing clock. The time when the results of two counts are the same is the counter gate.
4. Results
At present, we has developed a high-accuracy frequency detecting system on group period synchronization. The frequency detecting system’s measurement scope is 1-20MHz. The frequency detecting accuracy with E-13/s can be achieved. In the frequency detecting experiment, using the Cesium atomic clock 5071A 10MHz signal as the system’s external reference clock to verify the frequency detection system’s measuring accuracy. Using a TSG4102A RF signal generator with the frequency stability of 2E-11/s to generate the measured signal. Table 1 is the system’s frequency measuring experiment results.
From Table 1, the system’s measuring accuracy with E-13/s can get. Because the two comparative signals come from different frequency sources, and the two frequency sources’ phase noise produces a cumulative effect on the system’s measuring error, causing the after phase comparison to produce jitter. The two comparative signals’ counting generates an error within the gate time. The error-prone counting result is transmitted to the microcontroller, which processes the data to reduce the system’s frequency stability. However, since the detection of the is not used in frequency detection, the measuring error is to some extent suppressed. In practical applications, the frequency stability was improved by increasing the FPGA system’s clock frequency and optimizing the host computer’s algorithms, thus reducing the influence of additional noise on the frequency stability and achieving measurement results with frequency stability better than E-13/s or even higher.
5. Conclusion
The proposed precise frequency detecting technology based on group period synchronization is no longer to use the common frequency measuring technology to increase the measuring accuracy by simply depending on the improving line circuit or the developing microelectronic devices, but utilizing the and change rules and inherent relations between the frequency signals, and applying these rules to periodic signals’ interrelations processing to implement phase detecting and processing without the normalized frequency. The proposed precise frequency detecting technology based on group synchronization no longer relies solely on the traditional phase comparison technology, or improvements in circuit design or advancements in microelectronic devices to improve measuring accuracy. Instead, it utilizes the inherent interrelations and change rule among comparison signals and applies these rules to the relationships’ processing between frequency signals, in order to complete phase processing, measuring and comparing without the normalized frequency. According to the distribution rule of the phase between different frequencies signals, phase measurement is used to complete the gate selection, overcoming the difficulties of finding the and its randomness. The frequency testing results indicate that the frequency detecting accuracy can get the level of the10−13/s. Compared with the common frequency measuring technologies such as time vernier, phase comparison and analog interpolation technologies [14,15], the proposed technology has the characteristics of high measuring precision, simple system structure, low developing cost, and high system stability. With the development of modern electronic science and the improvement of FPGA integration technology, the measuring precision of this new technology of frequency measuring system may be further improved, and it will be more widely used in the field of precise time and frequency measurement.
Author Contributions
B.D. analyzed the principle and proposed the project and wrote the paper. Y.S. analyzed the experiment data and performed the experiments and system test.
Funding
This work was funded by the National Natural Science Foundation of China (No.62173140), Hunan Key R&D Program Project(No.2022GK2067), and Natural Science Foundation of Hunan Province (No. 2021JJ30452).
Data Availability Statement
All data that was used for this research is available upon request.
Conflicts of Interest
The authors declare no conflict of interest.
References
- Wang, D.; Zhang, X.D.; An, X.; et al. Microwave Frequency Measurement System Using Fixed Low Frequency Detection Based on Photonic Assisted Brillouin Technique. IEEE Transactions on Instrumentation and Measurement. 2023, 72, 8001810. [Google Scholar] [CrossRef]
- Li, S.P.; Qing, T. J.; Fu, B.; et al. High-Accuracy and Fast Measurement of Optical Transfer Delay. IEEE Transactions on Instrumentation and Measurement. 2021, 70, 8000204. [Google Scholar] [CrossRef]
- X.M. Zhang, P. Cheng, Y.K. Ci, et al., “Microwave frequency measurement method using microwave phase detection.” IET Science, Measurement & Technology, vol.10, no.3, pp.234-238, 2016. [CrossRef]
- Ge, J.; Wang, M.K.; Hu, X.Y; et al. Show more High-precision frequency measurement approach of diminishing multi-source errors for UAV-based aeromagnetic survey. Measurement, 2024,227:114312. [CrossRef]
- Du, B.Q.; Shi, L.L.; Chen, Y.M.; et al. Phase Group Synchronization between Any Signals and Its Physical Characteristics. Science China Physics, Mechanics &Astronomy. 2014, 57, 674–679. [Google Scholar] [CrossRef]
- Zhu, B.B.; Xue, M.; Yu, C.G.; et al. Broadband instantaneous multi-frequency measurement based on chirped pulse compression. Chinese Optics Letters. 2021, 19, 101202. [Google Scholar] [CrossRef]
- Liu, J.L.; Shi, T.X.; Chen, Y. High-accuracy multiple microwave frequency measurement with two-step accuracy improvement based on stimulated Brillouin scattering and frequency-to-time mapping. Journal of Lightwave Technology. 2020, 39, 2023–2032. [Google Scholar] [CrossRef]
- Xue, M.; Lv, M.H.; Wang, Q.; et al. Broadband optoelectronic frequency response measurement utilizing frequency conversion. IEEE Transactions on Instrumentation and Measurement. 2021, 70, 7004205. [Google Scholar] [CrossRef]
- Wang, D.; Zhang, X.D.; Zhao, X.P.; et al. Photonic microwave frequency measurement with improved resolution based on bandwidth-reduced stimulated Brillouin scattering. Optical Fiber Technology. 2022, 68, 102803. [Google Scholar] [CrossRef]
- Huang, C.J.; Chan, E.H.W. All-Optical Pulsed Signal Doppler Frequency Shift Measurement System. IEEE Photonics Journal 2021, 13, 5800107. [Google Scholar] [CrossRef]
- Lukin, K. A.; Vyplavin, P. L.; Palamarchuk, V. P.; et al. Phase Measurement Accuracy in Noise Waveform Synthetic Aperture Radar. IEEE Transactions on Aerospace and Electronic Systems. 2015, 51, 3363–3373. [Google Scholar] [CrossRef]
- Burt, E.A.; Yi, L.; Tucker, B.; et al. JPL Ultrastable Trapped Ion Atomic Frequency Standards. IEEE Transactions on Ultrasonics, Ferroelectrics, and Frequency Control. 2016, 63, 1013–1021. [Google Scholar] [CrossRef] [PubMed]
- Enzer, D.G.; Diener, W.A.; Murphy, D.W.; et al. Drifts and Environmental Disturbances in Atomic Clock Subsystems: Quantifying Local Oscillator, Control Loop, and Ion Resonance Interactions. IEEE Transactions on Ultrasonics, Ferroelectrics, and Frequency Control. 2017, 64, 623–633. [Google Scholar] [CrossRef] [PubMed]
- Georgakopoulos, D.; Quigg, S. Precision Measurement System for the Calibration of Phasor Measurement Units. IEEE Transactions on Instrumentation and Measurement. 2017, 66, 1441–1445. [Google Scholar] [CrossRef]
- Zhao, X.D.; Laverty, D.M.; McKernan, A.; et al. GPS-Disciplined Analog-to-Digital Converter for Phasor Measurement Applications. IEEE Transactions on Instrumentation and Measurement. 2017, 66, 2349–2357. [Google Scholar] [CrossRef]
Figure 1.
Group period phase synchronization.
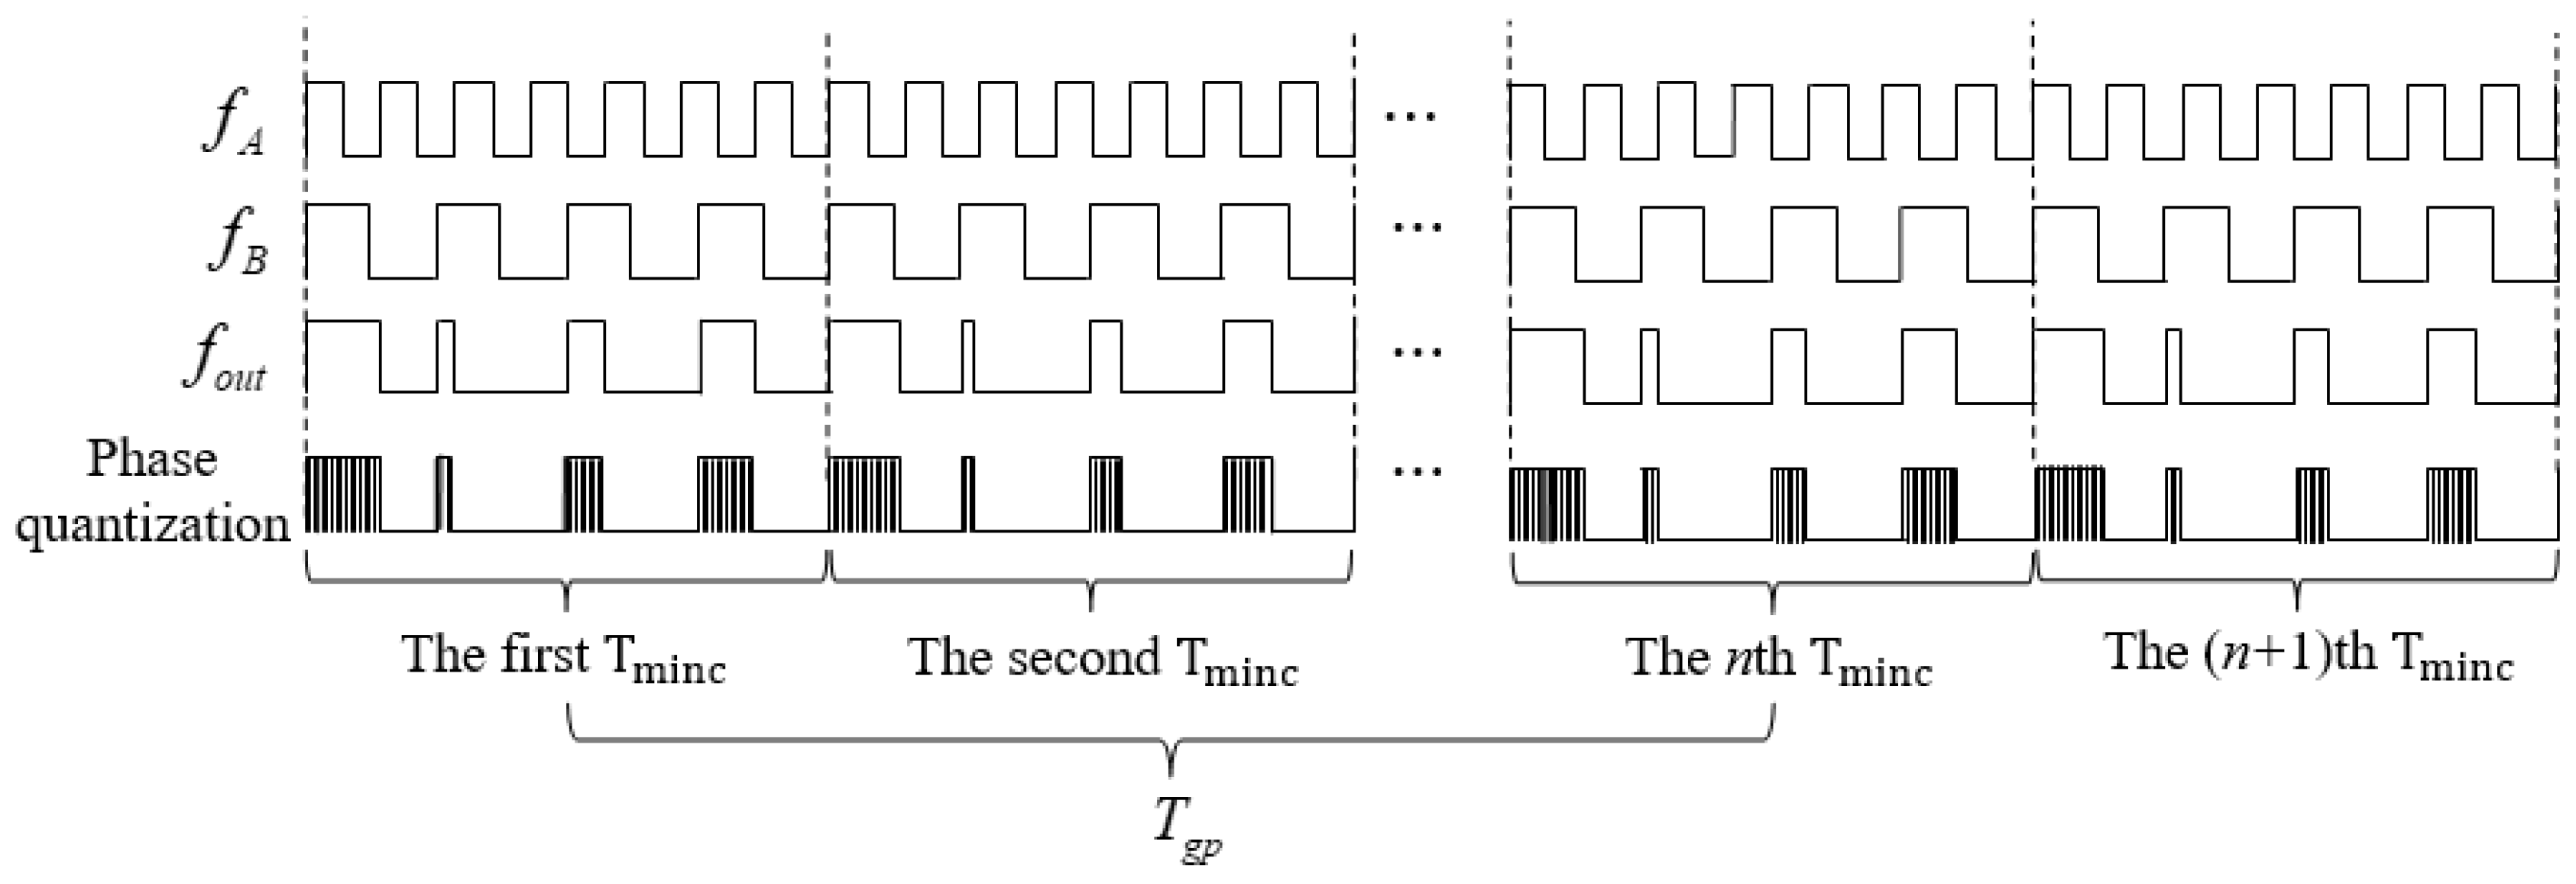
Figure 2.
Frequency detecting design scheme on group period synchronization.
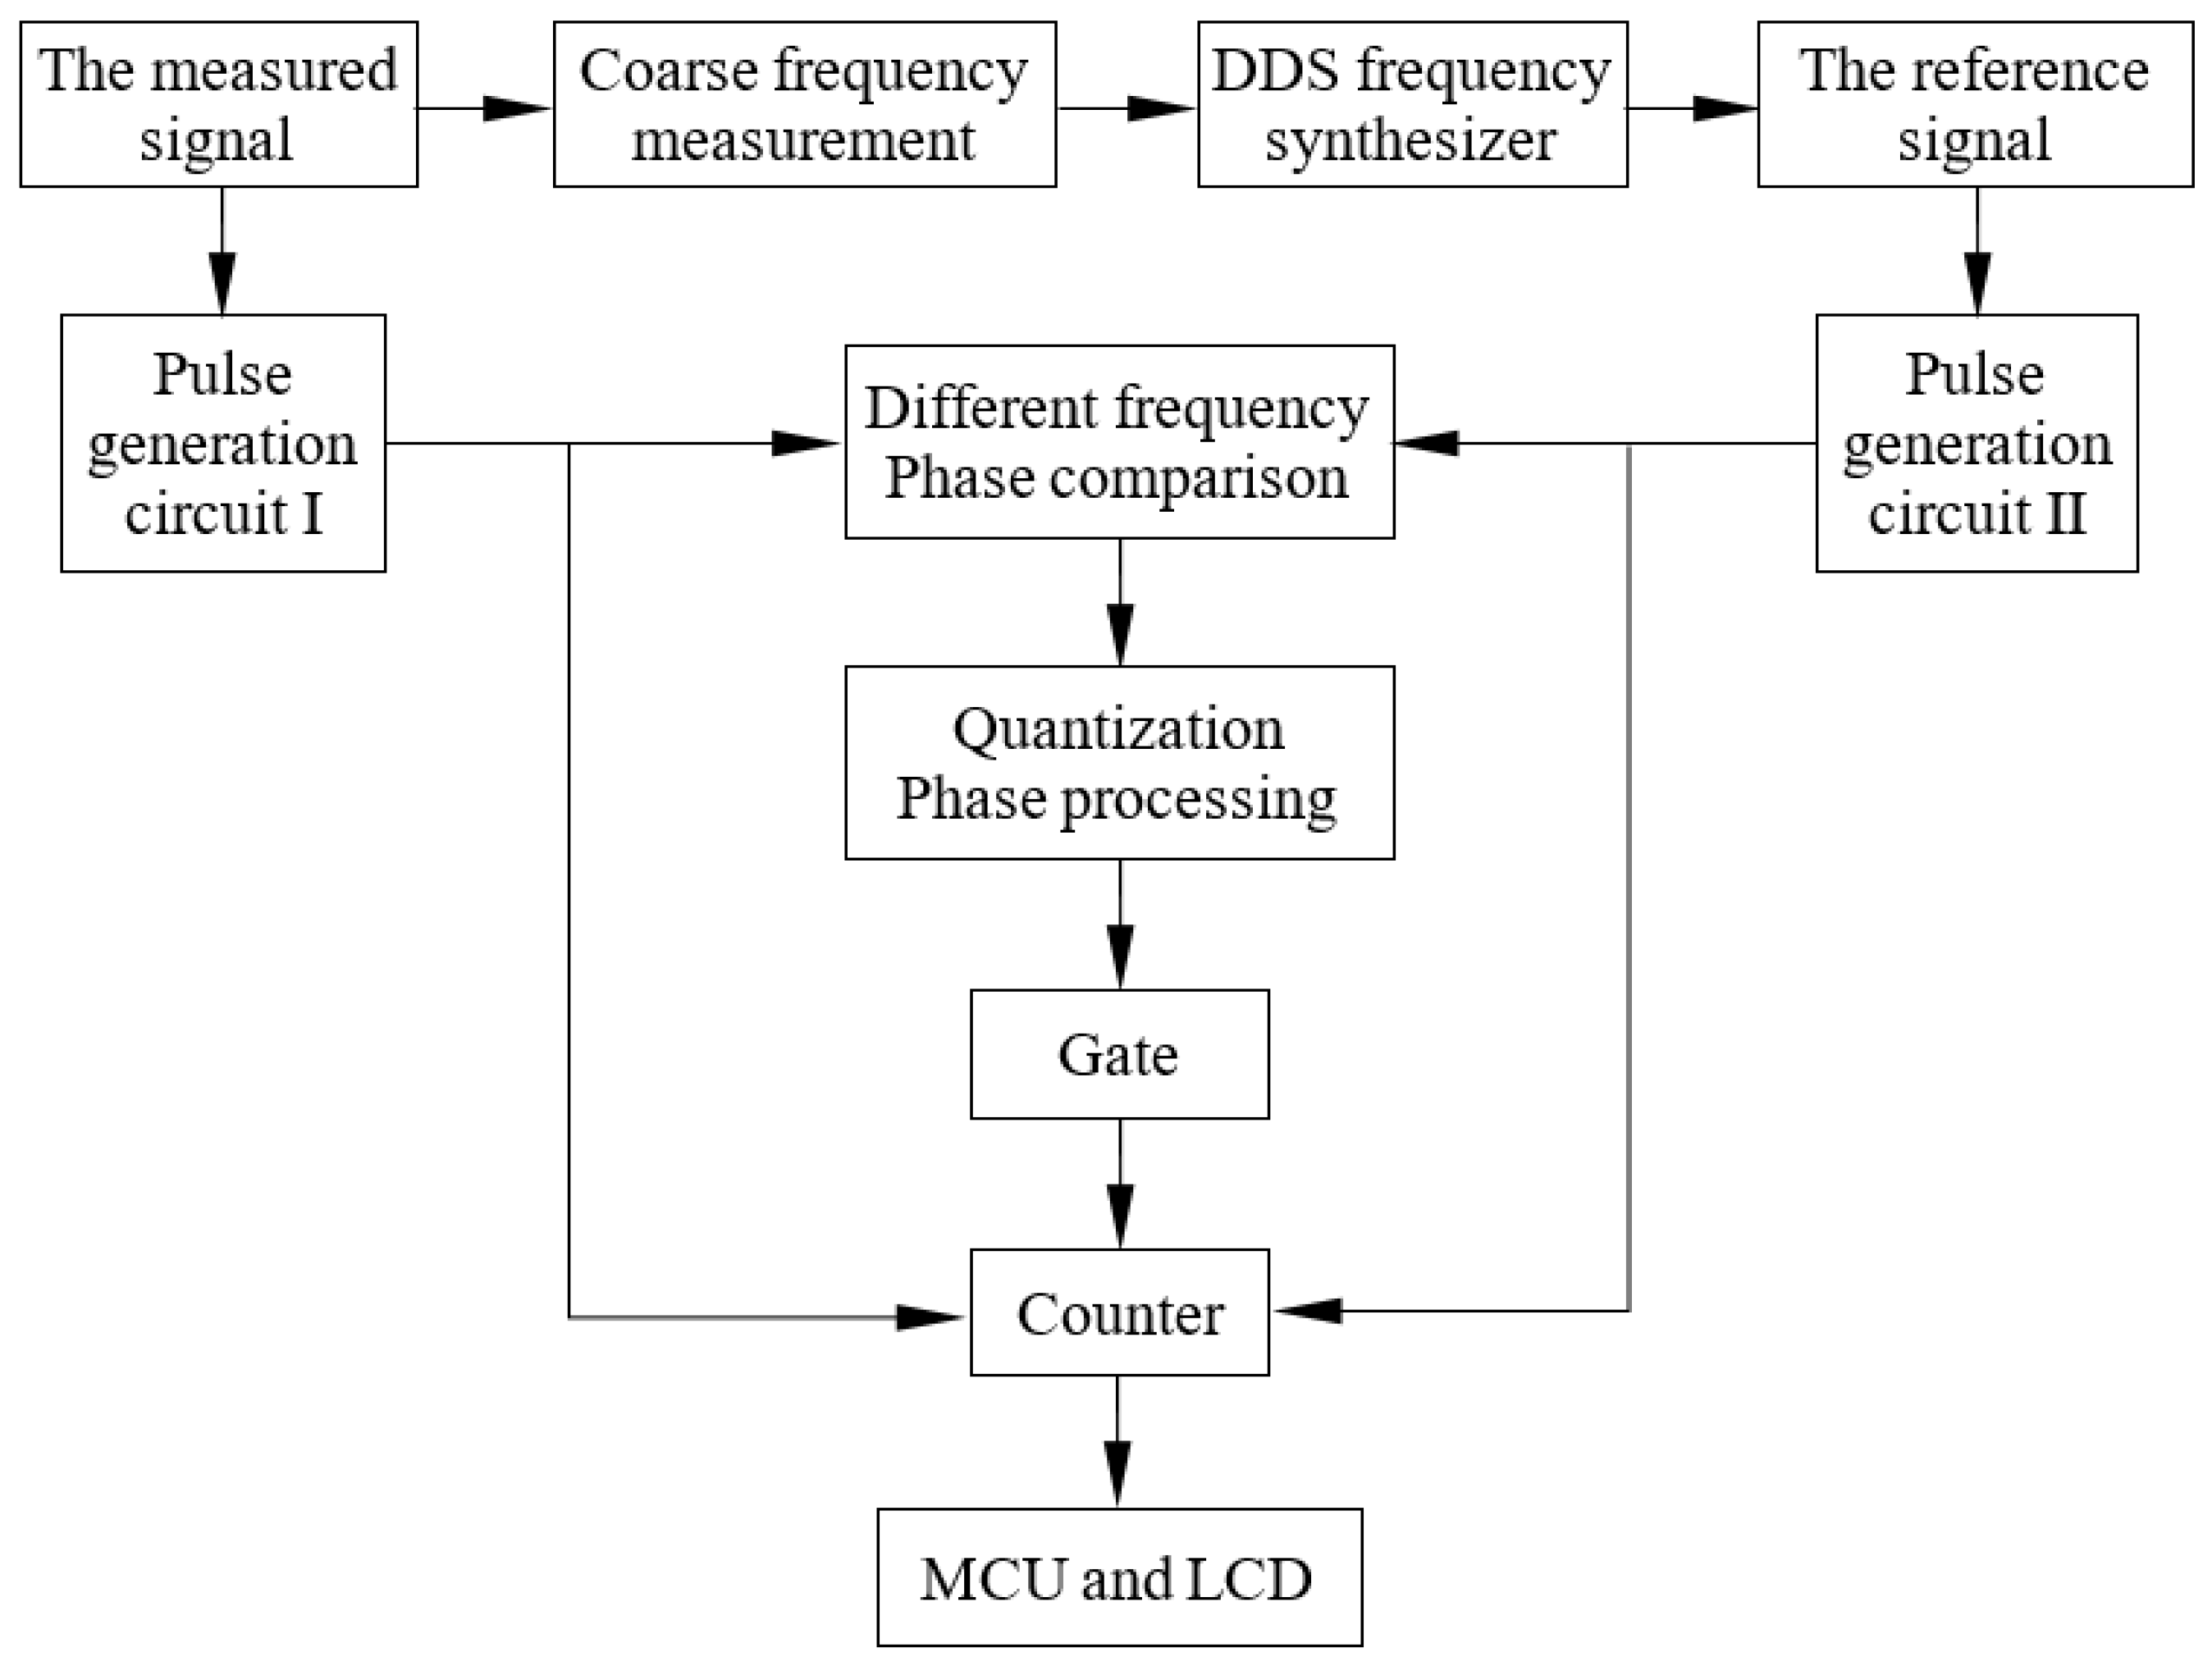
Figure 3.
Narrow pulse extraction scheme.
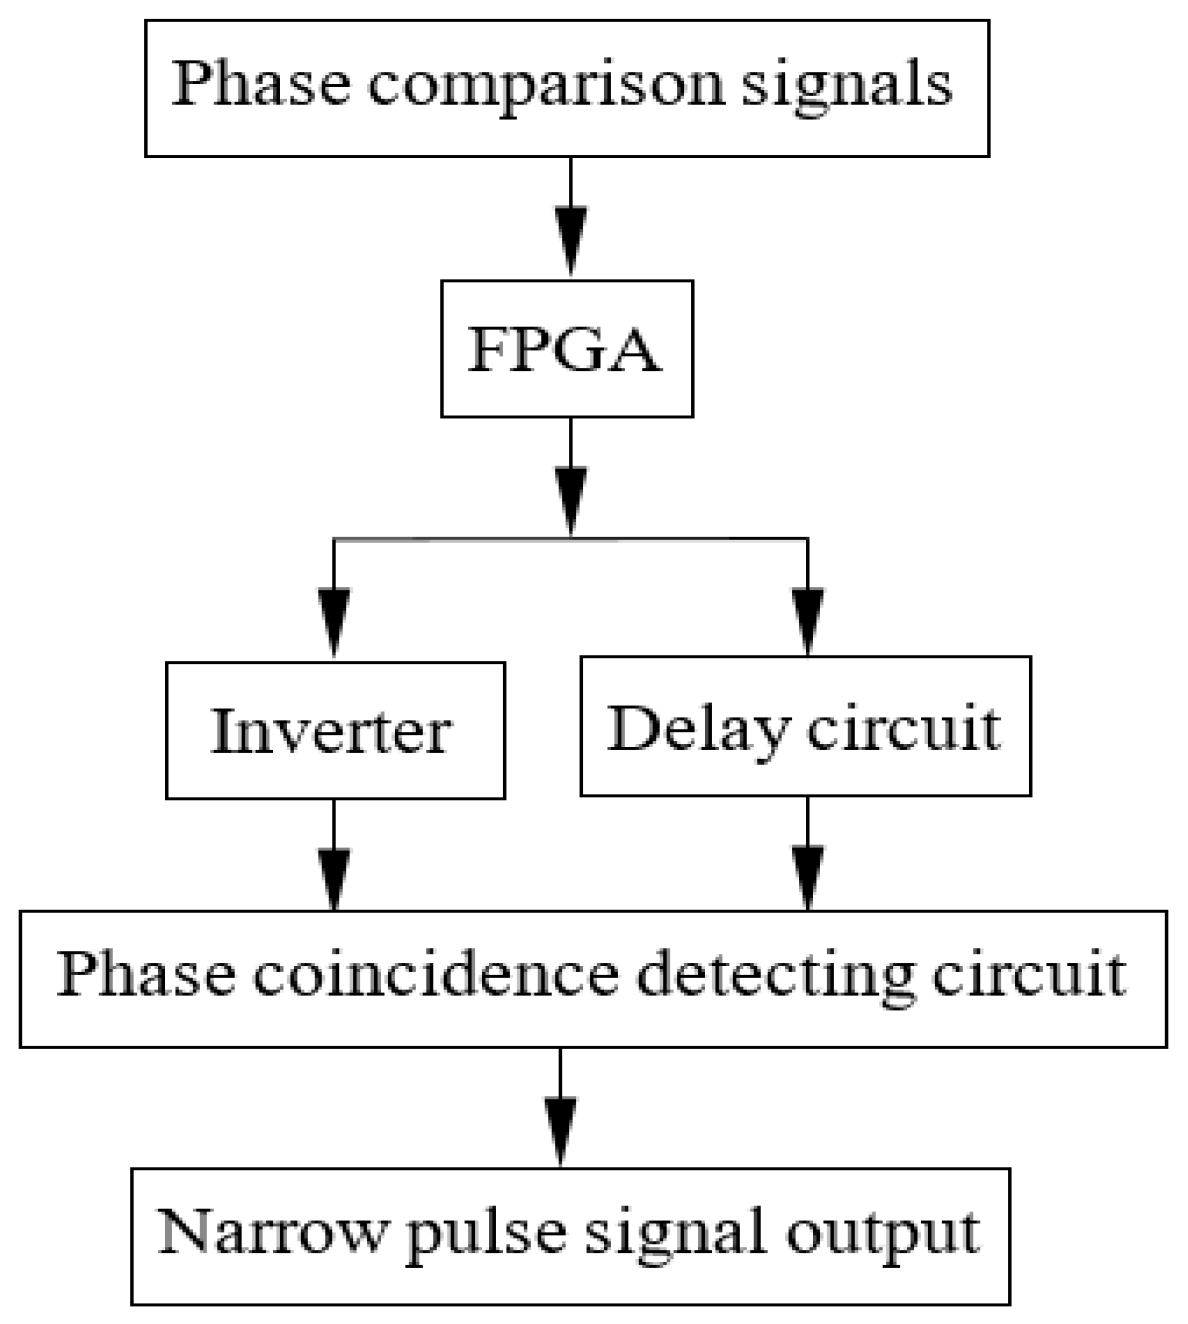
Figure 4.
Narrow pulse extraction results.
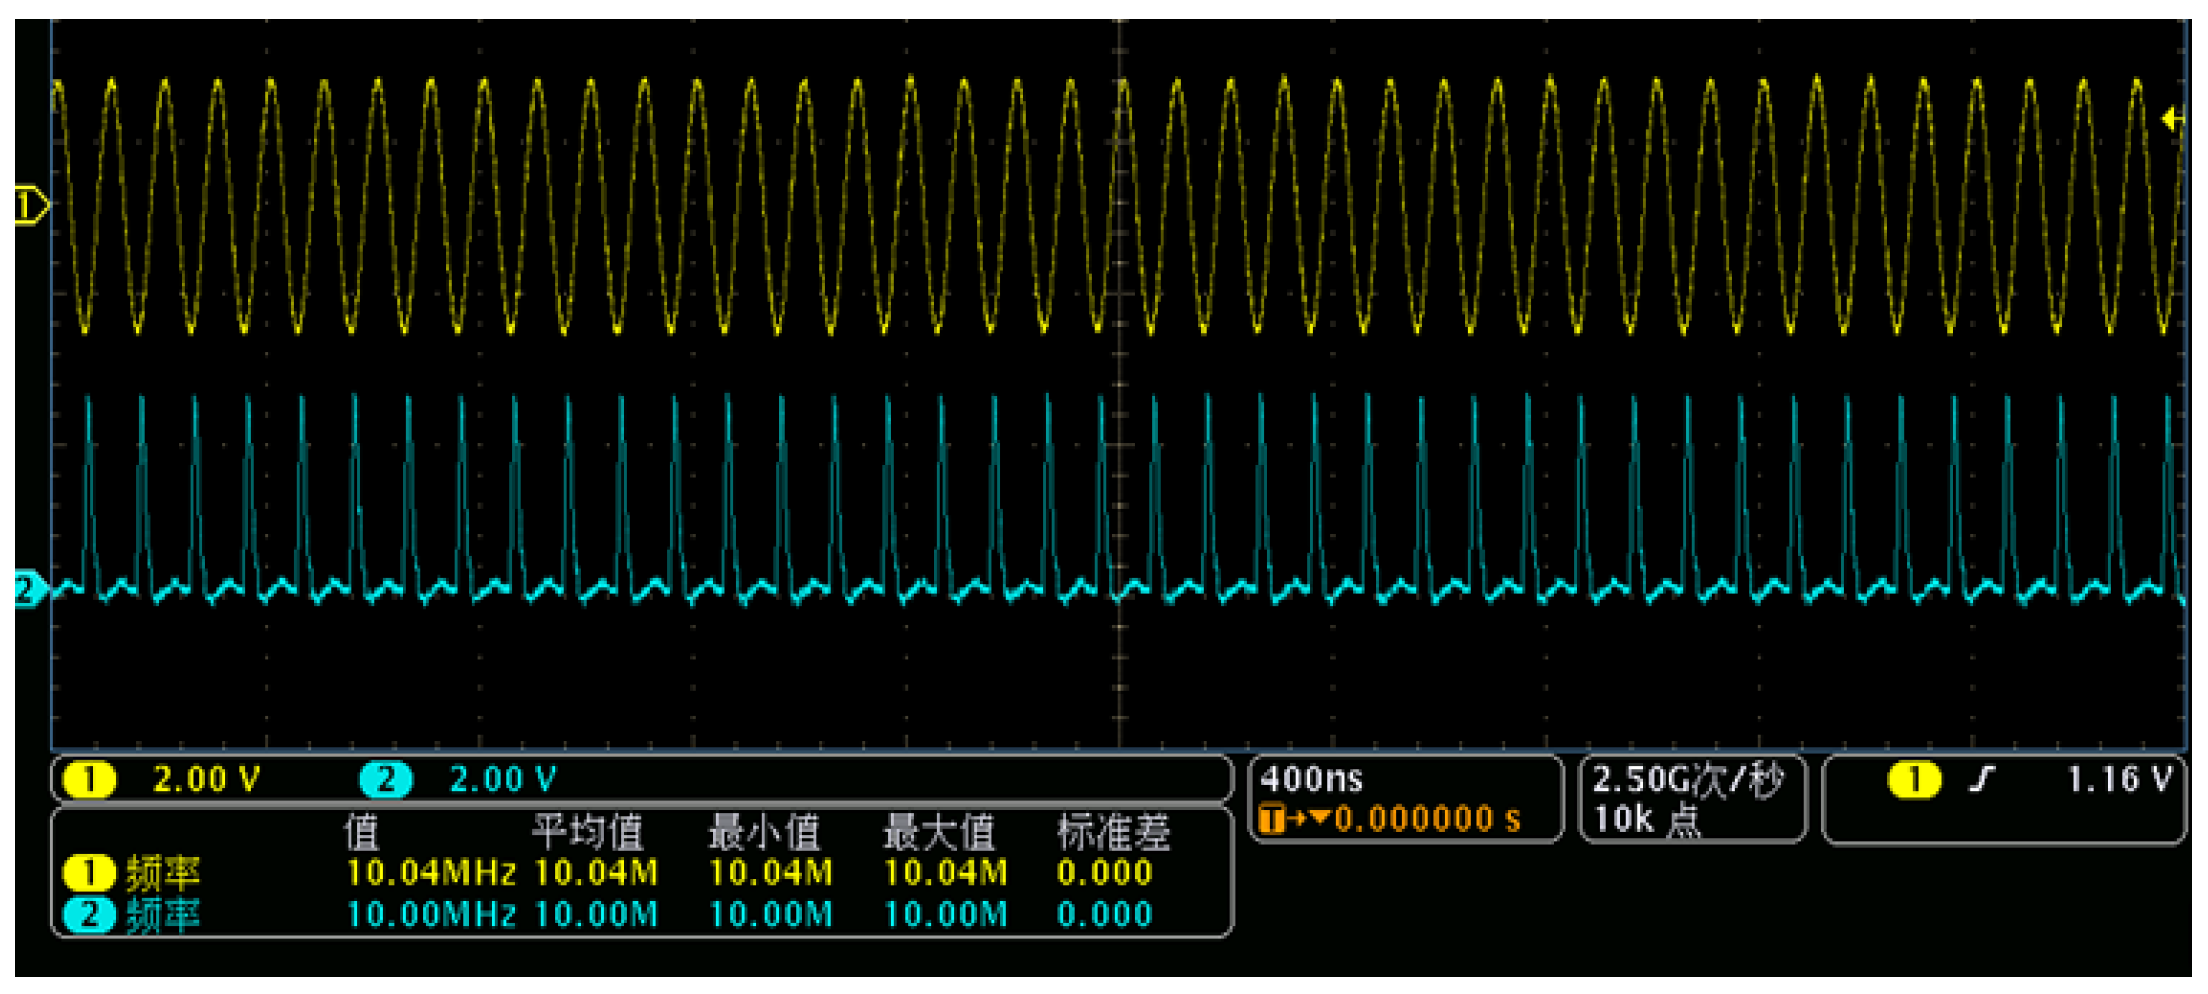
Figure 5.
Different frequency phase comparison scheme.
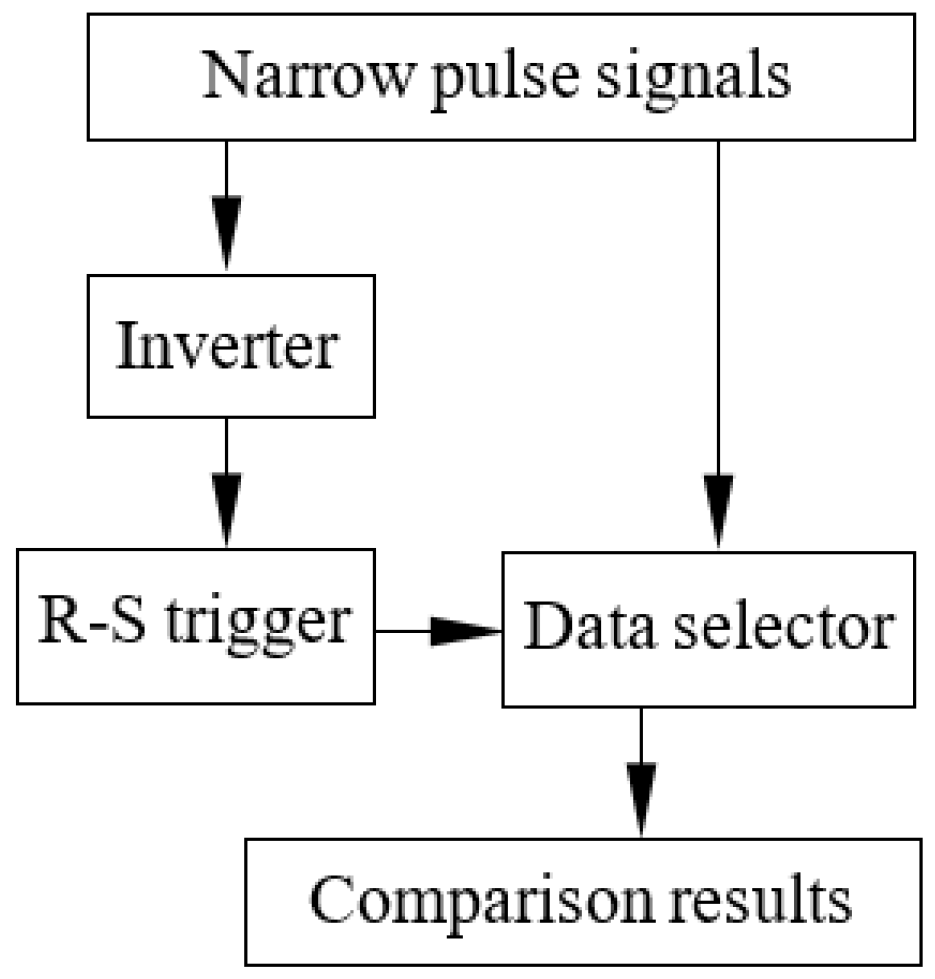
Figure 6.
Different frequency phase comparison results.
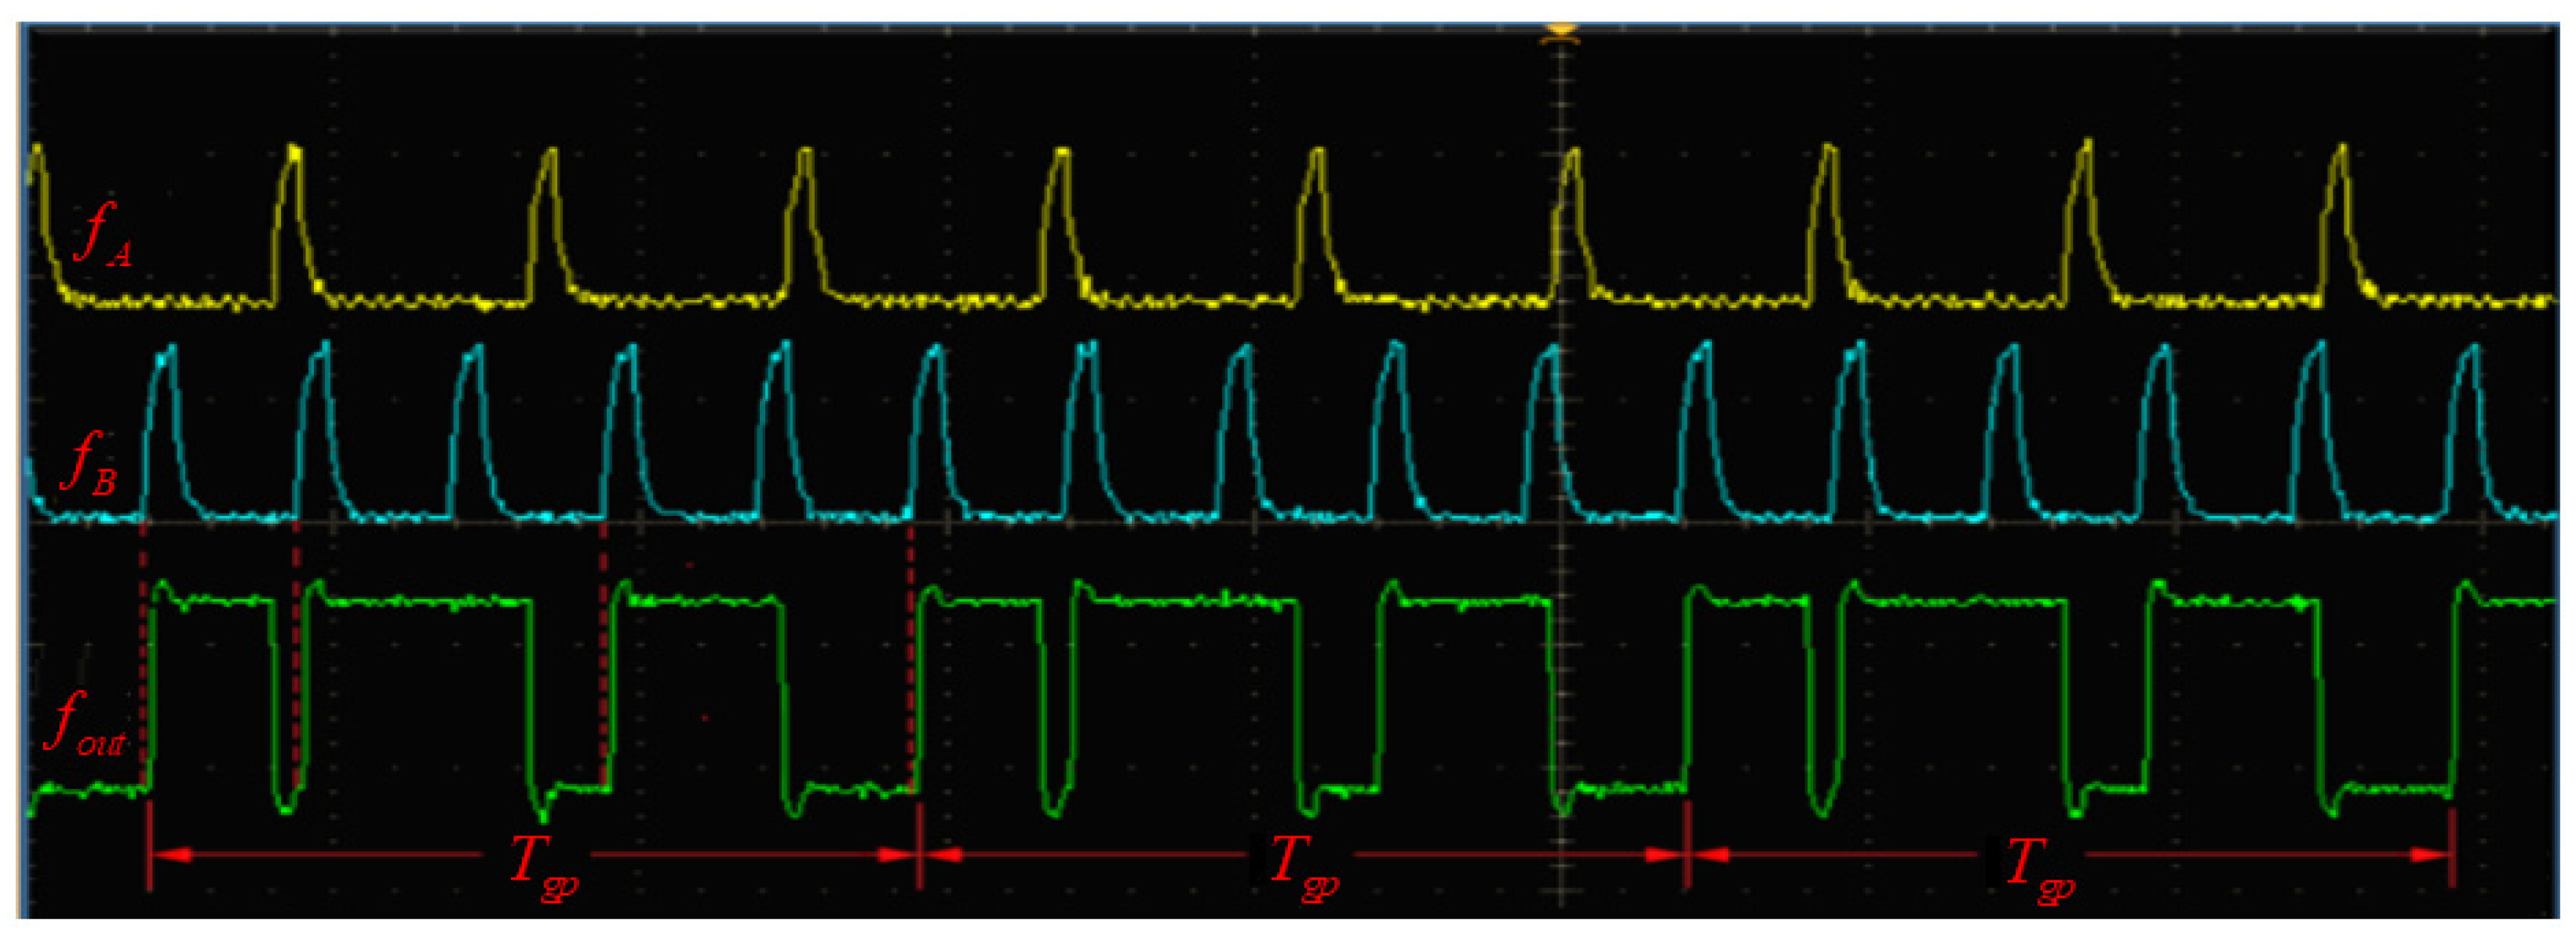
Figure 7.
Quantizing phase processing results.


Table 1.
Frequency measuring experiment results.
| The measured frequency /MHz |
Measuring results /Hz |
Frequency differences /Hz |
Frequency stability /s−1 |
|---|---|---|---|
| 6.4960 | 6495999.455 | 0.544 | 5.26×10⁻¹³ |
| 10.354 | 10353999.188 | 0.811 | 2.35×10⁻¹³ |
| 11.340 | 11339997.628 | 2.371 | 6.69×10⁻¹³ |
| 11.917 | 11916997.238 | 2.761 | 5.21×10⁻¹³ |
| 12.071 | 12070997.004 | 2.995 | 3.91×10⁻¹³ |
| 12.880 | 12879996.967 | 3.023 | 2.91×10⁻¹³ |
| 12.685 | 12684996.867 | 3.132 | 2.86×10⁻¹³ |
| 13.560 | 13559996.549 | 3.450 | 6.39×10⁻¹³ |
| 15.615 | 15614996.211 | 3.788 | 2.21×10⁻¹³ |
| 15.754 | 15753996.236 | 3.763 | 2.97×10⁻¹³ |
| 16.384 | 16383999.849 | 0.150 | 1.76×10⁻¹³ |
| 18.023 | 18022996.541 | 3.458 | 7.09×10⁻¹³ |
Disclaimer/Publisher’s Note: The statements, opinions and data contained in all publications are solely those of the individual author(s) and contributor(s) and not of MDPI and/or the editor(s). MDPI and/or the editor(s) disclaim responsibility for any injury to people or property resulting from any ideas, methods, instructions or products referred to in the content. |
© 2024 by the authors. Licensee MDPI, Basel, Switzerland. This article is an open access article distributed under the terms and conditions of the Creative Commons Attribution (CC BY) license (http://creativecommons.org/licenses/by/4.0/).
Copyright: This open access article is published under a Creative Commons CC BY 4.0 license, which permit the free download, distribution, and reuse, provided that the author and preprint are cited in any reuse.