
Submitted:
31 August 2024
Posted:
02 September 2024
You are already at the latest version
Abstract
We describe a forecast system based on the Weather Research and Forecasting (WRF) model for the prediction of high-impact weather events affecting power utilities, particularly conditions conducive to wildfires. The system was developed for Pacific Gas and Electric Corporation (PG&E) to operationally forecast conditions in Northern and Central California. It was established in 2014 and has been periodically improved. In the current configuration, WRF forecasts are routinely performed multiple times each day on a 2-km grid, and the results are used as input to wildfire fuel moisture, fire probability, and wildfire spread models. Components of the system include a stochastically perturbed ensemble; an annually updated reanalysis covering more than 30 years; and validation against PG&E’s extensive mesonet and other observing networks. We describe the development and validation of the next operational edition. Configurations tested include irrigation triggered by crop growing season and an ensemble-based approach with intelligently sub-selected Global Ensemble Forecast System (GEFS) members. The latter approach allows for enhanced uncertainty sampling in WRF forecasts and can greatly improve WRF forecasts when calibrated by observations.
Keywords:
Weather Research and Forecasting (WRF) model
; wildfire weather
; Diablo winds
; ensemble weather forecasting
; power utility
1. Introduction
High-impact weather events test the reliability and durability of power utilities and can be challenging to forecast and manage operationally. Examples of high-impact weather events include high winds from winter storms or offshore wind events, which can topple powerlines; hot and dry conditions, which can result in wildfires, especially when driven by high winds; and heat waves, which can result in high electric loads leading to equipment stress and possible rotating power outages. We describe the evolution of a system for predicting weather conditions for Pacific Gas and Electric Company (PG&E), whose service territory covers most of Northern and Central California. PG&E is responsible for maintaining and operating gas and electric services to approximately 5.5 million electric customers and 4.5 million natural gas customers. They maintain and manage over 106,000 miles of overhead distribution lines and over 18,000 miles of overhead transmission lines [1].
Of critical interest during the past decade is the threat of wildfires. The devastating November 2018 Camp Fire, which began in the western foothills of the northern Sierra Nevada mountains, was the deadliest and most destructive wildfire in California history. The communities of Paradise and Concow were almost completely destroyed, 85 lives were lost, and overall damages were assessed at over $16 billion. The cause was traced to a hook on a PG&E transmission line that failed during a dry offshore wind event. A retrospective study found that utility equipment was responsible for up to 14 wildfires over a 9-year period [2] (p. 100).
The Camp Fire was driven by a strong downslope windstorm [3,4], and such events are common in both Northern and Southern California. These winds are commonly called Diablo Winds in Northern California, and Santa Ana Winds in Southern California. They are a manifestation of offshore flow, in which high surface pressure over the Great Basin coupled with a surface trough off the California coast leads to strong downslope winds. Aloft, 500-hPa winds were from the north-northeast, nearly perpendicular to the northern Sierra Nevada crest, and a level of critical stability had ascended to around 600 hPa [3,4]. These conditions met the classic criteria for downslope windstorms, which include flow perpendicular to the mountain range and a stable layer near and above the mountain crest [5]. Similar conditions were associated with the Wine Country complex of fires, which occurred in the Coast Range during October 2017. That event was characterized by strong winds gusting to 30–48 m s–1 near and downstream of the mountain crests [6].
An example of a winter storm with damaging winds occurred on 20–21 March 2023, associated with a rapidly strengthening mid-latitude “bomb” cyclone that came ashore in central California. The event was characterized by strong southerly winds, heavy precipitation, and heavy mountain snow. The National Weather Service issued numerous High Wind Warnings for the event along the California coast from San Francisco to San Diego. Winds gusted as high as 89 MPH (39.8 m s–1) in Santa Clara County, and over 470,000 PG&E customers experienced outages [7]. Additional extreme winter storms occurred in January 2008 and February 2024, each disrupting service to over one million PG&E customers.
1.1. PG&E’s Mandate and Operations
In order to prevent the ignition of wildfires caused by PG&E’s electric assets during offshore wind events, PG&E implemented its Public Safety Power Shutoff (PSPS) program in 2018 [2]. The program involves proactively shutting off electricity in communities that are in high-threat areas and are predicted to experience extreme fire weather conditions. PSPS is a highly effective mitigation strategy for preventing utility-related wildfires and is layered atop other mitigation and prevention tools, such as undergrounding of power infrastructure, inspection programs, vegetation management, and system hardening.
In addition to PSPS, PG&E developed its Enhanced Powerline Safety Settings (EPSS) program in 2021. When enabled on distribution powerlines, EPSS reduces the number of fire ignitions caused from tree strikes, animal incidents, equipment failure, and other outage modes, by as much as 68%. This is accomplished by adjusting sensitivity settings on equipment to deenergize powerlines within 0.1 sec after a disturbance is registered. Although EPSS is an effective and relatively low-cost mitigation strategy, it can impact more customers per outage than PSPS as fuses are bypassed by design when it is enabled [2].
With these operational wildfire mitigation programs, there is a critical need for accurate high-resolution mesoscale forecasts days in advance to intelligently select powerlines for PSPS and EPSS. Such forecasts can reduce customer outages and wildfire risk, while increasing safety and reliability by enabling more targeted operational implementation of mitigation techniques.
1.2. PG&E’s Operational Mesoscale Modeling System (POMMS)
The operational wildfire mitigation programs are informed by high-resolution weather forecasts obtained via PG&E’s Operational Meteorological Modeling System (POMMS) along with fuel and vegetation characteristics driven by the weather forecasts. DTN and PG&E developed POMMS in 2014 based on WRF version 3.5.1 running on a 3-km horizontal grid (Table 1). An improved POMMS (version 2) was introduced in 2018. An accompanying 30-year (1989-2018) WRF reanalysis was generated to assist in past event analysis and for use in PG&E’s operational risk models. The reanalysis was forced by NCEP’s Climate Forecast System Reanalysis (CFSR) and Climate Forecast System Version 2 (CFSv2) [8].
After the Camp Fire, the first major PSPS events in late 2018 through 2019 were scoped using POMMS version 2. The model was found to have a fast wind bias for most locations and, particularly during offshore wind events, was found to have a dry bias and high wind bias in the western Sierra Nevada foothill slopes. With the very active 2019 wildfire season and a need for more precise and accurate wildfire mitigation forecasts, PG&E, DTN, and Atmospheric Data Solutions (ADS; recently acquired by Technosylva) undertook another effort toward improving POMMS. Various model configurations were tested on six high-impact offshore wind events in 2018 and 2019. The outcome was POMMS version 3 (POMMS v3), which became operational in 2020. This version was based on WRF version 4.1.2 with a 2-km grid. A 30-year reanalysis climatology (1989-2020) was also created and is updated annually for ongoing training of operational risk models.
Current operations of POMMS v3 include both deterministic and stochastically-perturbed ensemble forecasts initialized with either Global Forecast System (GFS) or European Centre for Medium-Range Weather Forecasting (ECMWF) forecasts. We have found the mean of the WRF forecast ensemble (deterministic and stochastically-perturbed members) to have better skill than any single WRF deterministic model. Therefore, the current wildfire mitigation programs, along with other outage and fire risk models (described below), are based on the POMMS v3 ensemble mean output.
1.3. Fire Potential Index and Fuel Moisture Calculations
The wildfire mitigation programs rely on PG&E’s Fire Potential Index (FPI) model, a balanced random forest classification machine learning model that is driven by POMMS v3. The model combines gridded weather inputs (temperature, vapor pressure deficit, wind speed, friction velocity, and turbulent kinetic energy), dead fuel moisture (DFM), live fuel moisture (LFM) in shrubs, soil moisture, solar irradiance, topographic characteristics (such as ruggedness, a measure of terrain variability; and slope), type of combustible fuel (grass, shrub, timber, and low- and high-density urban), and vegetation characteristics to predict the probability of large and catastrophic fires [2] (pp. 767-773).
To obtain a gridded high-resolution DFM dataset, we force a process-based model developed by Nelson [9] with our historical reanalysis and operational forecasts. The Nelson model simulates the moisture content of 1-h, 10-h, 100-h and 1000-h time-lagged fuel classes using several weather variables as input, including temperature, relative humidity, solar radiation, and rainfall. It models the transfer of heat and moisture within the fuel and the exchange of heat and moisture with the ambient environment. Comparison with field observations suggests that the model performs reasonably well [10].
For the LFM dataset, we adopt a machine learning-based framework where the daily LFM content for various vegetation species is modeled as a function of several weather predictors (including temperature, relative humidity, vapor pressure deficit, winds, rainfall, and solar radiation), with temporal scales ranging from short-term (1-7 days) to long-term (1-8 month) periods. A random forest regression model is used to relate the weather predictors to LFM content, while minimizing the root-mean squared error (RMSE) of the moisture content against the historical LFM content observations from the U.S. Department of Agriculture (USDA) Field Sample Database. Based on the various verification metrics, this model compares favorably with similar models developed in other studies [11].
1.4. Motivation for Upgrading
We seek to enhance identification of weather and wildfire risks to minimize the impacts on PG&E’s customers and infrastructure through more targeted application of its PSPS and EPSS programs. To accomplish this, we need to improve upon the performance of POMMS v3, which currently drives every operational wildfire mitigation decision. Ongoing internal validation studies indicate the model has a low wind speed bias in higher terrain, a high wind speed bias in flatter and lower elevation terrain, and a warm and dry bias in summer.
Here we examine several techniques toward improving the model’s accuracy. These include upgrading to a newer version of WRF; introducing model irrigation; reducing the grid spacing; and implementing new forecast ensemble approaches.
1.5. Outline of the Paper
In section 2, we describe the current WRF configuration and mode of operations in order to establish a baseline. In section 3, we describe experiments used to determine optimal settings for the next version of POMMS, the forecast validation methodology, and a set of cases involving high-impact weather for validation. We present results in section 4, and in the following section, offer a discussion and concluding remarks.
2. Current Operational WRF Configuration
We previously undertook an extensive validation process in which we determined optimal settings for our current operational version of POMMS (v3; Table 1). The process utilized surface wind, temperature, and humidity observations from selected Automated Surface Observing Stations (ASOS); Remote Automated Weather Stations (RAWS); and the growing PG&E mesonet, which was inaugurated in 2018 and contains over 1,550 stations as of August 2024. An emphasis was placed on predicting wind storms associated with wildfires.
The configuration is based on Weather Research and Forecasting Model (WRF) [12,13] version 4.1.2 (Table 2). A domain with 2-km horizontal grid spacing covering PG&E’s service territory is nested within grids of 6- and 18-km (Figure 1). The vertical grid has 51 levels and a 20 hPa top. Land use data is derived from a Moderate Resolution Imaging Spectroradiometer (MODIS) 30-sec dataset. We selected the Noah-MP land surface model [14] and the Mellor-Yamada-Nakanishi-Niino (MYNN) surface layer and planetary boundary layer (PBL) schemes [15]. Based on initial verification results, we reduced the roughness lengths for a couple of land use categories, thereby improving the slight low wind speed bias in higher terrain (Table 3).
The forecasts are initialized using either GFS forecasts available on a ¼° grid or ECMWF forecasts on a 1/8° grid, along with 1/12° NOAA sea-surface temperature (SST) analyses. Cycling of soil temperature, soil moisture, and snow cover is applied, with values used from a previous run.
Observations are assimilated on the outermost grid, followed by a brief spin-up period in order for model fields to become internally consistent. Specifically, the outer grid is started 3 hours before the nominal initialization time. 3DVAR data assimilation is applied on the outer grid using conventional surface and upper-air observations, as well as aircraft data, from the Meteorological Assimilation Data Ingest System (MADIS). The nested grids are spawned after the outer grid has run for 3 hours.
2.1. Stochastically-Perturbed Ensemble
In order to provide a measure of forecast uncertainty, several ensemble members are stochastically perturbed. Each member utilizes stochastically perturbed physics tendencies (SPPT), the stochastic kinetic-energy backscatter scheme (SKEBS), and the stochastically perturbed parameter scheme (SPP) [13]. Random perturbations are applied to all grids, and a different random seed is used for each member.
The mean value of all stochastically perturbed and deterministic runs is found to perform slightly better than any single deterministic run. It also provides better run-to-run consistency, which is important when scoping longer-range weather events. Notably, PG&E’s meteorologists found that the GFS-based deterministic runs exhibited considerable run-to-run variability in the 3 to 5 day range.
2.2. Schedule
A GFS-initialized deterministic run is launched every day at 0000, 0600, 1200, and 1800 UTC, while an ECMWF-initialized deterministic run is launched every day at 0000 and 1200 UTC. This is supplemented by a 6-member stochastically-perturbed ensemble that is run every day at 0000 and 1200 UTC. Half of the ensemble members are initialized with GFS, and the other half with ECMWF.
During critical weather events, PG&E has the ability to launch a fine-scale 0.67-km selectable nest on-demand within the 2-km domain for tactical decision making. These runs are launched using a GUI (Figure 2). To maintain computational stability in grids that span the Sierra Nevada, the maximum adaptive time step is reduced slightly (Table 2).
2.3. Historical Reanalysis
A 30-year WRF reanalysis was constructed using CFSR and CFSv2 data. Each reanalysis year was initialized on July 29 at 0000 UTC. This allowed a 3-day spin-up period, which was discarded. The reanalysis year thus begins on August 1 of each year. Spectral nudging was applied on the two outermost grids at mid- and upper levels. The reanalysis is updated annually.
The reanalysis is utilized by PG&E meteorologists and data scientists to train fire probability and outage probability models. The latest version of FPI was trained using a novel fire occurrence dataset [16] and hourly weather and fuel moisture reanalysis data. PG&E’s outage model also leverages hourly reanalysis data and the location and time of over 500,000 power outages, as well as other model features, to train a multi-classification machine learning model. The models are then deployed operationally to match the schedule and resolution of POMMS and are the foundation of PG&E’s operational wildfire mitigation decisions.
The size, scope, and frequency of Diablo wind events can be estimated using the reanalysis. For example, PG&E constructed a climatology of Diablo wind occurrence over PG&E’s service territory for the 31-year period 1990-2020 (Figure 3). The criteria were as follows:
- Wind direction between 350° and 112.5° (north to east-southeast)
- Wind speed ≥ 8.9 m s–1 (20 mph)
- Relative humidity ≤ 25%
- The above criteria met for a minimum of 3 consecutive hours over an extent of at least 900 km2.
- Each event must be spaced 6 hours apart from another event.
In this climatology, a strong peak of greater than 12 days per year is noted over the High Sierra. Elsewhere, the Coast Range north of San Francisco Bay and the northern Sierra Nevada experience about 5–6 Diablo wind events per year.
3. Methodology
3.1. WRF Experiments
Desiring to continuously improve the forecast system, we selected a recent version of WRF (version 4.5.2) [12,13] as a candidate for inclusion in POMMS version 4 (Table 1). We wanted to investigate or revisit options that have been added or updated since our last version of POMMS. Examples include the irrigation scheme in Noah-MP and the use of a gravity wave drag scheme. Experiments on finer grids will give guidance on the trade-off between the accuracy afforded by higher resolution and the associated higher computing costs. Finally, we are interested in evaluating the use of intelligently sub-selected Global Ensemble Forecast System (GEFS) [17] members to drive an improved WRF ensemble. These experiments are summarized in Table 4.
3.1.1. Initialization
Rather than using global reanalysis data to initialize our experiments, we chose operational global forecast model runs that would have been available at the time of initialization, with the intent of providing a more realistic characterization of errors at typical forecast lead times. For most experiments we used GFS forecasts available on a 0.25° global grid with 3-hour output intervals. Each GFS run was initialized 6 hours prior to the event, and a 3-hour spinup period was applied on the outermost WRF grid. For example, the 24 October 2019 0000 UTC WRF run utilized the 23 October 1800 UTC GFS forecast, and the outer grid was initialized on 23 October at 2100 UTC.
Ensemble experiments were initialized using GEFS forecasts available on a 0.5° global grid with 6-hour output intervals, and a 6-hour spinup was applied on the outermost WRF grid. (As an exception, case 1 utilized a 1° GEFS grid.)
3.1.2. Control Experiments
The initial set of experiments compare the POMMS v3 configuration (WRF version 4.1.2; C41) with a similar configuration based on WRF version 4.5.2 (C45). As with the current operational version, we reduced the roughness length for two vegetation categories (Table 3). We also made two minor configuration changes. First, C45 uses the default MYNN PBL scheme closure level of 2.6, whereas C41 uses the 3rd-order closure. Second, C45 uses the SST fields from the initial model (GFS), rather than from a NOAA analysis.
3.1.3. Irrigation and Gravity Wave Drag
Much of California is used for agriculture, with large concentrations of irrigated crops in the Central Valley, Salinas Valley, and various wine-growing regions. Irrigation adds moisture to the soil and lower atmosphere and is potentially important for reducing model dry and warm biases. One research group using an earlier version of WRF (3.8.1) determined that the addition of irrigation helped to alleviate a warm, dry bias in the crop-growing season in the central United States [18].
WRF now has a dynamic irrigation scheme within Noah-MP to estimate irrigation water requirements and apply water in the irrigated croplands (Figure 4). The scheme irrigates based on sprinkler, drip, and surface flooding methods. We tested the option in which irrigation is triggered based on crop season planting and harvesting dates. According to a standard WRF Noah-MP table, these dates are April 22 to October 28. This experiment, denoted IRR, is a variant of C45.
Our previous POMMS implementation did not include gravity wave drag (GWD). We therefore tested a basic gravity wave drag parameterization that includes the subgrid topography effects of gravity wave drag and low-level flow blocking. In our experiments we elected to apply the gravity wave drag parameterization to the two outermost grids only. These tests also include the triggered irrigation of experiment IRR and are referred to as F45. This experiment serves as the baseline for subsequent experiments.
3.1.4. Higher Resolution Horizontal Grid
Decreasing horizontal grid spacing allows for better resolution of terrain and land surface features, but at significant added computational cost. We compared results with grid spacings of 1.5 km and 1 km (experiments F1P5 and F1P0, respectively) against our baseline 2-km grid (Table 5).
3.1.5. Initialization with GEFS Forecasts
The GEFS is a stochastically perturbed 30-member (20-member prior to 2020) ensemble based on the GFS. The computational cost would be prohibitive if we were to initialize a high-resolution WRF forecast corresponding to each member. We therefore test a forecast strategy using 9 representative GEFS members that are dynamically selected to maintain the large-scale flow diversity of the entire GEFS ensemble. The intended outcome is a WRF ensemble that is more accurate than a single WRF forecast at higher resolution, yet also provides meaningful information about forecast uncertainty.
This selection strategy involves analyzing the forecast 500 hPa geopotential height field (Z500) over an area roughly the extent of the 6-km nest in two ways. First, we perform principal component analysis using the mean Z500 on the second day of the forecast and identify the four GEFS members with the largest magnitude of the two leading principal components. Second, we perform self-organizing map (SOM) analysis based on the mean Z500 to classify the GEFS forecasts into five SOM nodes. We then identify five GEFS members closest to the centroid of each SOM node [19]. Overall, we select the 9 GEFS members that capture both the mean and outlier behavior of the large-scale flow in the full ensemble.
To compare with other experiments, we analyze the mean, 25th percentile, and 75th percentile of the various validation measures from the resulting WRF ensemble. In this manner the GEFS-based forecasts are calibrated at each observation location.
3.2. Validation
The surface observing networks used in validation are shown in Figure 5, with station counts shown in Table 6. Observing networks are:
- ASOS. Winds are measured at the WMO standard of 10 m above ground level (AGL) and air temperature and dew point temperature at 2 m AGL.
- RAWS. Winds are measured 6.1 m (20 ft) AGL, while air temperature and relative humidity are measured between 1.2 and 2.5 m AGL.
- PG&E mesonet. The height of the instrument package varies depending on the available mounting points at each location, ranging from 2.1 to 14.3 m AGL, with a mean of 7.4 m and a standard deviation of 1.3 m AGL.
We eliminated any stations previously determined through statistical analysis to be of questionable quality. We then adjusted the WRF wind speed at 10 m to the anemometer or instrument height under the assumption that wind speed follows a logarithmic profile [20]. Further, we performed a gust factor analysis for each station, where the gust factor is defined as hourly maximum wind gust divided by hourly maximum wind speed [21]. Specifically, we examined a 60-day moving average spanning all of the cases (or the period of record, if shorter) of the gust factor for each station. Stations that failed to show a relatively constant gust factor or a stable seasonal pattern were omitted from the validation.
We validated the following surface variables:
- Wind speed at 10 m. Separate categories were validated depending on threshold: all wind speeds, and wind speeds (whether observed or simulated) exceeding a threshold of 5 or 10 m s–1.
- Air temperature at 2 m.
- Vapor pressure deficit (VPD) at 2 m. Because the moisture content of saturated air is exponentially related to temperature, validation metrics based on relative humidity and dew point temperature can be misleading. We therefore chose VPD as our humidity variable. A measure of dryness, it is simply the difference between the saturation vapor pressure (a function of temperature) and actual vapor pressure (a function of specific humidity). VPD is increasingly used as a component in fire weather indices such as the Hot-Dry-Windy Index [22]. Because of its dependence on temperature, VPD errors are strongly influenced by temperature errors.
Statistical measures assessed are root-mean-square error (RMSE), bias (mean error), and correlation. RMSE was chosen over mean absolute error (MAE) because it gives greater weight to more extreme errors.
3.3. Case Descriptions
We selected six recent cases to study, all of which were associated with high-impact weather events within the PG&E service territory. One case involved an early spring storm with strong winds and widespread rain and snow, depending on elevation. The remainder involved a combination of hot, dry, and windy conditions associated with wildfires. For each case a series of 120-hour WRF forecast experiments was run, with validation focused on a 48 or 72-hour period encompassing the critical period of the event (Table 7).
3.3.1. Case 1: Intense Downslope Windstorm, October 2019
A strong offshore northerly wind event occurred from 26–28 October 2019 as a quick-moving, positively tilted shortwave trough embedded in a highly amplified ridge pattern over the eastern North Pacific Ocean dropped down from southwestern Canada and into the Great Basin (Figure 6). It became even more amplified with its axis becoming more positively tilted as it dug into the Desert Southwest. A maximum wind gust of 102 MPH (45.6 m s–1) was recorded at the Pine Flat Road PG&E weather station (PG305, elevation 3308 ft [1008 m]) in Sonoma County on 27 October at 08:00 PDT, and numerous stations across northern California recorded gusts of 30 m s–1 or more during the event. The Redding-Sacramento (KRDD-KSAC) pressure gradient, an important metric for forecasting northerly winds, peaked at 10.6 hPa, exceeding the historical 99.9 percentile for this metric. The wildfire threat led PG&E to de-energize approximately 935,000 customers, making it by far the largest PSPS event in the company’s history. PG&E’s inspectors found more than 550 instances of utility equipment damage and related hazards in the de-energized areas, any of which could have potentially sparked a fire had powerlines been energized.
3.3.2. Case 2: Offshore Wind Event, January 2021
A late-season strong offshore wind event occurred from 18–19 January 2021 during an unusually dry and abnormally warm winter. A small shortwave trough moving through a highly amplified eastern North Pacific ridge then moved offshore of California and helped to pull another positively tilted trough in the Western U.S. westward toward central California (Figure 7). It ultimately became a strong cut-off low that moved off the Southern California coast. At the same time a strong ridge of high pressure built into the Pacific Northwest. Owing to the abnormally dry fuels and lack of recent precipitation, PG&E issued a PSPS affecting 5,200 customers in the southern Sierra Nevada foothills. Wind gusts exceeding 35 m s–1 were recorded in that area. PG&E’s inspectors identified 423 incidents of utility equipment damage and related hazards resulting from high winds experienced in the de-energized areas.
3.3.3. Case 3: Dixie Fire in Northern Sierra Nevada, July 2022
The Dixie Fire started on 13 July 2021 in the Feather River Canyon of the northern Sierra Nevada mountains, burning over 960,000 acres before being fully extinguished in October. Caused by a tree falling onto a PG&E distribution line resulting, it was the largest wildfire of the 2021 California wildfire season and the largest single wildfire in the state’s history [23]. It was associated with very hot temperatures and a significant annual precipitation deficit (Figure 8).
3.3.4. Case 4: Heat Wave and Wildfire Conditions, September 2022
A significant heat wave occurred over California from 4–9 September 2022 as a strong upper-level high pressure area built westward from the Four Corners region (Figure 9). For example, San Jose International Airport (KSJC) reached 106°F (41.1°C) on the 6th, breaking the maximum temperature record for September. Also on that day, the all-time peak electrical load of 52,061 MW was recorded by the California Independent System Operator (CAISO). Several large wildfires ignited across the state during the first nine days of the month. The Mosquito Fire, California’s largest wildfire of the year, ignited on the 6th and spread through the Sierra Nevada foothills of Placer and El Dorado counties west of Lake Tahoe. It eventually burned more than 75,000 acres [23].
3.3.5. Case 5: Northwesterly Wind Event, February 2023
On 20–21 February 2023, a shortwave trough originating in the Gulf of Alaska strengthened and amplified into a longwave trough as it moved south off the Pacific Northwest coast, bringing high winds and cold temperatures to California. An associated strong jet stream developed over Oregon and Northern California (Figure 10). Wind gusts exceeded 26 m s–1 in the San Francisco Bay Area and 35 m s–1 in the southern Sierra Nevada foothills. Nearly 400,000 PG&E customers experienced a service disruption during the event.
3.3.6. Case 6: Late Winter Storm, March 2023
As previously mentioned, on 20–21 March 2023, a rapidly strengthening mid-latitude “bomb” cyclone associated with a cold, deep upper-level low originating from the Gulf of Alaska dropped south off California (Figure 11). The surface low had a minimum pressure of 986 hPa at 1800 UTC just before making landfall. Radar and satellite imagery near the time of landfall revealed two individual mesoscale low pressure centers rotating around the main low, creating a Fujiwhara effect. The event produced strong southerly winds, heavy precipitation, and heavy mountain snow, causing a service disruption to more than 500,000 PG&E customers.
4. Results
A summary of validation results by experiment, for all cases and observing networks combined, is presented in Figure 12 and listed in Table 8 and Table 9. Validation data counts by variable and event for each experiment are shown in Table 10. Complete validation results, disaggregated by case and observing network, are provided in Supplementary Table S1.
4.1. Control Experiments
Wind speeds in the version 4.5.2 control configuration (C45) were improved compared with the version 4.1.2 configuration (C41) for all wind thresholds and for all statistical measures (RMSE, bias, and correlation; Figure 12 (a-c); Table 8). In both experiments it is evident that WRF has a high wind speed bias overall, but a low bias at higher wind speeds. For instance, in C45 the overall wind speed bias is +0.32 m s–1, while for speeds ≥ 10 m s–1 the bias is -2.27 m s–1. At the highest threshold, C45 reduced the slow bias by 33% and reduced RMSE by 5% compared to C41.
Despite these improvements in wind speeds, the previous version (C41) still performed better overall for temperature and VPD (Figure 12 (d-e); Table 9). Although both experiments exhibit warm and dry biases overall, the biases are greater in C45 than C41. This was particularly true for warm season events (Table S1). We note that VPD error is highly correlated with temperature error, because saturation vapor pressure is an exponentially increasing function of temperature.
4.2. Irrigation and Gravity Wave Drag
Irrigation triggered based on crop season (experiment IRR) reduced the warm, dry bias during the warm season events compared to C45. The most significant impact was during the July 2021 case, in which the temperature RMSE and bias was reduced by 10% and 19%, respectively, with concomitant reductions in VPD error (Table S1).
The introduction of gravity wave drag (experiment F45) brought about further incremental improvements. Compared with C45, the new baseline configuration with gravity wave drag on the two outermost domains and triggered irrigation (F45) improved upon almost all validation measures. For instance, the bias of wind speeds ≥ 10 m s–1 improved by 16%.
4.3. Higher Resolution Horizontal Grid
Not surprisingly, runs with horizontal grid spacings of 1.5 and 1 km (experiments F1P5 and F1P0) outperformed their baseline 2-km counterpart (F45). For instance, comparing the 1- and 2-km results, the slow bias for winds ≥ 10 m s–1 was reduced by 20%, the warm bias was reduced by 12%, and the dry bias was reduced by 9%. Concomitant improvements in RMSE and correlation were also noted. We report on the computational aspects of these higher-resolution runs in Appendix A.
4.4. Ensemble Forecasts Initialized with GEFS
The mean (FGM) and percentile values (FG25, FG75) of the 9-member ensemble initialized with GEFS generally provided greater accuracy compared with all other experiments on a 2-km grid. They also compared favorably with finer-grid experiment (F1P5, F1P0) metrics.
For all wind speeds, FGM and FG25 had lowest the RMSE and smallest bias. FG25 actually had a small negative bias. These results indicate that the positive wind speed bias in the deterministic runs is reduced at least in some of the GEFS members. For winds ≥ 10 m s–1, FG75 reduced the RMSE by 14% and reduced the slow wind bias by almost 50% compared to the current operational baseline (C41). Furthermore, FG75 had the lowest RMSE and a bias that was smaller than all experiments except the 1-km grid (F1P0).
For temperature, the 25th percentile (FG25) provides the highest accuracy of any of the WRF version 4.5.2 experiments. FG25 has lowest RMSE in all experiments and lowest bias in almost all experiments except C41. Similarly, for VPD, the 25th percentile (FG25) has the lowest RMSE and bias in all configurations.
5. Discussion and Conclusions
An operational WRF-based system for predicting high-impact weather was built in 2014 for PG&E and has been improved upon since then. We have constructed a testing and validation environment for exploring new features and techniques with the latest available version of WRF.
Compared with our current system based on WRF version 4.1.2, a configuration based on version 4.5.2 resulted in significantly reduced wind speed error. This was especially true for the highest speeds, which are associated with high-impact weather such as wildfires.
Several studies have noted systematic warm biases in weather and climate models during the summertime over the Great Plains (see [18] and references therein). Much of this can be attributed to model soil moisture conditions that are too dry. This inhibits evapotranspiration, preventing a repartitioning of net radiation into latent heating. One result is that fewer shallow clouds are available to cool the surface [24].
It was therefore unfortunate that temperature and humidity errors increased with the newer configuration, with a noticeable warm and dry bias during warm season events. The reasons for this are unknown to us. Nevertheless, owing to the critical importance of accurate wind speed predictions for a variety of events, including wildfire weather and cool-season windstorms, we opted to proceed with version 4.5.2 as the candidate for the next version of POMMS. We note that during offshore wind events, which are associated with dry air, high winds are the main driver of rapid fire spread as opposed to temperature and moisture. Further, the ensemble approach we described can address much of the model biases.
A study using an earlier version of WRF coupled with a provisional irrigation scheme was able to reduce the warm, dry bias over the Central United States during summertime [18]. We therefore tested the addition of irrigation triggered by crop growing season and found that it does indeed reduce the summertime warm and dry bias. We recognize, however, that the irrigation scheme in WRF has certain limitations. For instance, irrigation in WRF is managed through static tables for various land use types, but land use patterns may change over time. Further, the application of model irrigation may vary significantly from real-world values. In particular, actual irrigation might not be applied during droughts when there is a shortage of surface water, or in periods of abundant precipitation. Modeled irrigation could be a valuable tool but we have limited control over seasonality and areal coverage. For these reasons, the application of modeled irrigation should be closely monitored, particularly over long simulations such as year-long reanalyses.
Experiments using higher resolution grids were consistently more accurate than their 2-km counterparts. This comes at a higher computational cost, however, although the cost increase was less than might have been expected purely from scaling the number of grid points and time steps (Appendix A).
We introduced an approach in which a WRF ensemble is initialized using a subset of GEFS ensemble members. These members are selected based on the GEFS mean large-scale flow and a representative sample of its diversity. The intended outcome is a WRF ensemble that, when calibrated by observations, is more accurate than a single WRF forecast at higher resolution, yet also provides meaningful information about forecast uncertainty.
We find that judiciously chosen members of a WRF ensemble initialized in this manner with GEFS can be more accurate than higher-resolution deterministic runs. For instance, the 75th percentile of the GEFS-based ensemble initialized results improves wind forecasts greater than 10 m s–1 and outperforms the higher resolution experiments. Additionally, we found that using the 25th percentile for temperature and VPD provides the greatest reduction in the summertime warm and dry bias. These findings can be recalibrated once the ensemble forecast system has been in routine operation for a period of time. A further advantage of the ensemble approach is that it reduces run-to-run variations that can impair operational use of forecast results. This is especially important when scoping longer-range (up to 5 days) events.
Finally, it is worth noting that the WRF forecasts presented here are limited by the grid scale representations of terrain, land use, and vegetation. This is particularly true regarding the necessarily smoothed terrain field required by WRF. In recent years, machine learning models, especially deep learning models, have been used to improve weather forecasts produced by mesoscale models such as WRF by employing very-high resolution terrain data [25]. This approach holds promise for cost-efficiently improving wind forecasts in complex terrain and is worthy of future investigation.
Supplementary Materials
The following supporting information can be downloaded at the website of this paper posted on Preprints.org: Table S1. Comma-separated value file containing validation statistics, grouped by experiment, case, and observing network. Column descriptions: case: Case identified by start date (Table 6) or “ALL” for all networks combined; experiment: Experiment (Table 4); network: Observing network (Table 7) or “ALL” for all networks combined; all_speed_n: Number of observations used in validating all wind speeds; all_speed_rmse: Root mean square error (RMSE) of all wind speeds; all_speed_bias: Bias (mean error) of all wind speeds; all_speed_corr: Correlation of all wind speeds; speed_ge_5_n: Number of observations used in validating wind speeds (observed or simulated) ≥ 5 m s–1; speed_ge_5_rmse: RMSE of any wind speeds (observed or simulated) ≥ 5 m s–1; speed_ge_5_bias: Bias of any wind speeds (observed or simulated) ≥ 5 m s–1; speed_ge_10_n: Number of observations used in validating wind speeds (observed or simulated) ≥ 10 m s–1; speed_ge_10_rmse: RMSE of any wind speeds (observed or simulated) ≥ 10 m s–1; speed_ge_10_bias: Bias of any wind speeds (observed or simulated) ≥ 10 m s–1; temp_n: Number of observations used in validating temperature; temp_rmse: RMSE of temperature; temp_bias: Bias of temperature; temp_corr: Correlation of temperature; vpd_n: Number of observations used in validating vapor pressure deficit (VPD); vpd_rmse: RMSE of VPD; vpd_bias: Bias of VPD; vpd_corr: Correlation of VPD.
Author Contributions
Conceptualization, SS; Methodology, RC, SS, AE, XQ, SC, WZ, RL; Software, RC, XQ, WZ, RL; Validation, RC, XQ, WZ, RL, TG; Formal Analysis, XQ, RC; Investigation, RC, XQ; Resources, AE; Data Curation, RC, XQ, WZ, RL; Writing – Original Draft Preparation, RC, XQ, AE, ED; Writing – Review & Editing, RC, XQ, AE, ED, TG, SL; Visualization, RC, XQ, WZ, RL; Supervision, SS, AE;Project Administration, SS, AEFunding Acquisition, SS. All authors have read and agreed to the published version of the manuscript.
Funding
This project is funded by Pacific Gas and Electric Company.
Institutional Review Board Statement
Not applicable.
Informed Consent Statement
Not applicable.
Data Availability Statement
Data is contained within the article or supplementary material.
Acknowledgments
Kyle Keys managed DTN’s high-performance computing infrastructure. Shaun Tanner managed PG&E’s team responsible for implementing and operationalizing POMMS, and Bereket Habtezion of PG&E assisted with data management.
Conflicts of Interest
The authors declare no conflicts of interest.
Appendix A: Computing
Computing was performed on Amazon Web Services (AWS) Hpc6a instances. Each instance has two 48-core 3rd Gen AMD EPYC 7003 series processors, for a total of 96 cores. Using AWS’s Elastic Fabric Adaptor, jobs are run on 16 tasks per instance, with 6 cores per task. For all experiments reported here, including experiments at higher resolution, 3 instances were used.
In our higher-resolution experiments, we found computing performance was better than expected based on scaling the number of grid points and time steps. In an ideal case, when grid extent remains constant as horizontal grid spacing decreases, the computing performance ratios are expected to follow the cube of the ratios of the grid spacing. That is, performance is expected to scale according to the horizontal grid spacing as well as the time step, which itself is constrained by the grid spacing. A configuration with a 1-km innermost grid therefore should cost eight times as much as a 2-km configuration. In our experiments, computing cost with the 1-km nested grid (F1P0) was only 6.2 times as much as the 2-km grid (F45). Similarly, the cost increase for the 1.5-km grid (F1P5) was only 1.7 times as much, compared with an expected 3.4 factor. We surmise that improved parallel computing efficiency on larger grids played a role in these results. We also note our setup was not designed to measure ideal computational scaling. In particular, the extents of the two outer domains varied, as did the ratio of the grid spacing between domains (Table 5).
References
- Pacific Gas and Electric, Co. Company Profile. https://www.pge.com/en/about/company-information/company-profile.html (accessed 2024-07-26).
- Pacific Gas and Electric, Co. 2023-2025 Wildfire Mitigation Plan R4. 2024. https://www.pge.com/assets/pge/docs/outages-and-safety/outage-preparedness-and-support/pge-wmp-r4-010824.pdf (accessed 2024-07-22).
- Mass, C.F.; Ovens, D. The Synoptic and Mesoscale Evolution Accompanying the 2018 Camp Fire of Northern California. Bull. Am. Meteorol. Soc. 2021, 102, E168–E192. [Google Scholar] [CrossRef]
- Brewer, M.J.; Clements, C.B. The 2018 Camp Fire: Meteorological Analysis Using In Situ Observations and Numerical Simulations. Atmosphere 2020, 11, 47. [Google Scholar] [CrossRef]
- Durran, D.R. Mountain Waves and Downslope Winds. In Atmospheric Processes over Complex Terrain; Meteorological Monographs; American Meteorological Society, 1990; Vol. 45, pp. 59–81. [Google Scholar]
- Mass, C.F.; Ovens, D. The Northern California Wildfires of 8–9 October 2017: The Role of a Major Downslope Wind Event. Bull. Am. Meteorol. Soc. 2019, 100, 235–256. [Google Scholar] [CrossRef]
- The Weather Channel. How The California Bomb Cyclone Happened; The Weather Channel. https://weather.com/storms/severe/news/2023-03-22-california-bomb-cyclone (accessed 2024-07-24).
- Saha, S.; Moorthi, S.; Wu, X.; Wang, J.; Nadiga, S.; Tripp, P.; Behringer, D.; Hou, Y.-T.; Chuang, H.; Iredell, M.; Ek, M.; Meng, J.; Yang, R.; Mendez, M.P.; Dool, H. van den; Zhang, Q.; Wang, W.; Chen, M.; Becker, E. The NCEP Climate Forecast System Version 2. J. Clim. 2014, 27, 2185–2208. [Google Scholar] [CrossRef]
- Nelson Jr, R.M. Prediction of Diurnal Change in 10-h Fuel Stick Moisture Content. Can. J. For. Res. 2000, 30, 1071–1087. [Google Scholar] [CrossRef]
- Carlson, J.D.; Bradshaw, L.S.; Nelson, R.M.; Bensch, R.R.; Jabrzemski, R. Application of the Nelson Model to Four Timelag Fuel Classes Using Oklahoma Field Observations: Model Evaluation and Comparison with National Fire Danger Rating System Algorithms. Int. J. Wildland Fire 2007, 16, 204–216. [Google Scholar] [CrossRef]
- Capps, S.B.; Zhuang, W.; Liu, R.; Rolinski, T.; Qu, X. Modelling Chamise Fuel Moisture Content across California: A Machine Learning Approach. Int. J. Wildland Fire 2021, 31, 136–148. [Google Scholar] [CrossRef]
- Skamarock, W.C.; Klemp, J.B.; Dudhia, J.; Gill, D.O.; Liu, Z.; Berner, J.; Wang, W.; Powers, J.G.; Duda, J.G.; Barker, D.; Huang, X. A Description of the Advanced Research WRF Model Version 4.3. 2021. [Google Scholar] [CrossRef]
- National Center for Atmospheric Research (NCAR). WRF Users Guide documentation. https://www2.mmm.ucar.edu/wrf/users/wrf_users_guide/build/html/ (accessed 2024-07-10).
- He, C.; Valayamkunnath, P.; Barlage, M.; Chen, F.; Gochis, D.; Cabell, R.; Schneider, T.; Rasmussen, R.; Niu, G.-Y.; Yang, Z.-L.; Niyogi, D.; Ek, M. The Community Noah-MP Land Surface Modeling System Technical Description Version 5.0. 2023. [Google Scholar] [CrossRef]
- Olson, J.B.; Kenyon, J.S.; Angevine, W.A.; Brown, J.M.; Pagowski, M.; Sušelj, K. A Description of the MYNN-EDMF Scheme and the Coupling to Other Components in WRF–ARW. 2019, No. 61. [CrossRef]
- McClure, C.D.; Pavlovic, N.R.; Huang, S.; Chaveste, M.; Wang, N. Consistent, High-Accuracy Mapping of Daily and Sub-Daily Wildfire Growth with Satellite Observations. Int. J. Wildland Fire 2023, 32, 694–708. [Google Scholar] [CrossRef]
- Zhou, X.; Zhu, Y.; Hou, D.; Fu, B.; Li, W.; Guan, H.; Sinsky, E.; Kolczynski, W.; Xue, X.; Luo, Y.; Peng, J.; Yang, B.; Tallapragada, V.; Pegion, P. The Development of the NCEP Global Ensemble Forecast System Version 12. Weather Forecast. 2022, 37, 1069–1084. [Google Scholar] [CrossRef]
- Qian, Y.; Yang, Z.; Feng, Z.; Liu, Y.; Gustafson, W.I.; Berg, L.K.; Huang, M.; Yang, B.; Ma, H.-Y. Neglecting Irrigation Contributes to the Simulated Summertime Warm-and-Dry Bias in the Central United States. Npj Clim. Atmospheric Sci. 2020, 3, 1–10. [Google Scholar] [CrossRef]
- Capps, S.; Qu, X. Sampling Global Ensemble Members for Operational Downscaling in Forecasting Weather Events (Patent Pending), 2024.
- Cao, Y.; Fovell, R.G. Downslope Windstorms of San Diego County. Part I: A Case Study. Mon. Weather Rev. 2016, 144, 529–552. [Google Scholar] [CrossRef]
- Cao, Y.; Fovell, R.G. Downslope Windstorms of San Diego County. Part II: Physics Ensemble Analyses and Gust Forecasting. Weather Forecast. 2018, 33, 539–559. [Google Scholar] [CrossRef]
- Srock, A.F.; Charney, J.J.; Potter, B.E.; Goodrick, S.L. The Hot-Dry-Windy Index: A New Fire Weather Index. Atmosphere 2018, 9, 279. [Google Scholar] [CrossRef]
- California Department of Forestry and Fire Protection (CAL FIRE). Incidents. https://www.fire.ca.gov/incidents (accessed 2024-07-10).
- Hua, W.; Dong, X.; Liu, Q.; Zhou, L.; Chen, H.; Sun, S. High-Resolution WRF Simulation of Extreme Heat Events in Eastern China: Large Sensitivity to Land Surface Schemes. Front. Earth Sci. 2021, 9. [Google Scholar] [CrossRef]
- Dujardin, J.; Lehning, M. Wind-Topo: Downscaling near-Surface Wind Fields to High-Resolution Topography in Highly Complex Terrain with Deep Learning. Q. J. R. Meteorol. Soc. 2022, 148, 1368–1388. [Google Scholar] [CrossRef]
Figure 1.
Topography of WRF outer domain and location of two nested domains. Grid spacings are 18, 6, and 2 km, respectively.
Figure 1.
Topography of WRF outer domain and location of two nested domains. Grid spacings are 18, 6, and 2 km, respectively.
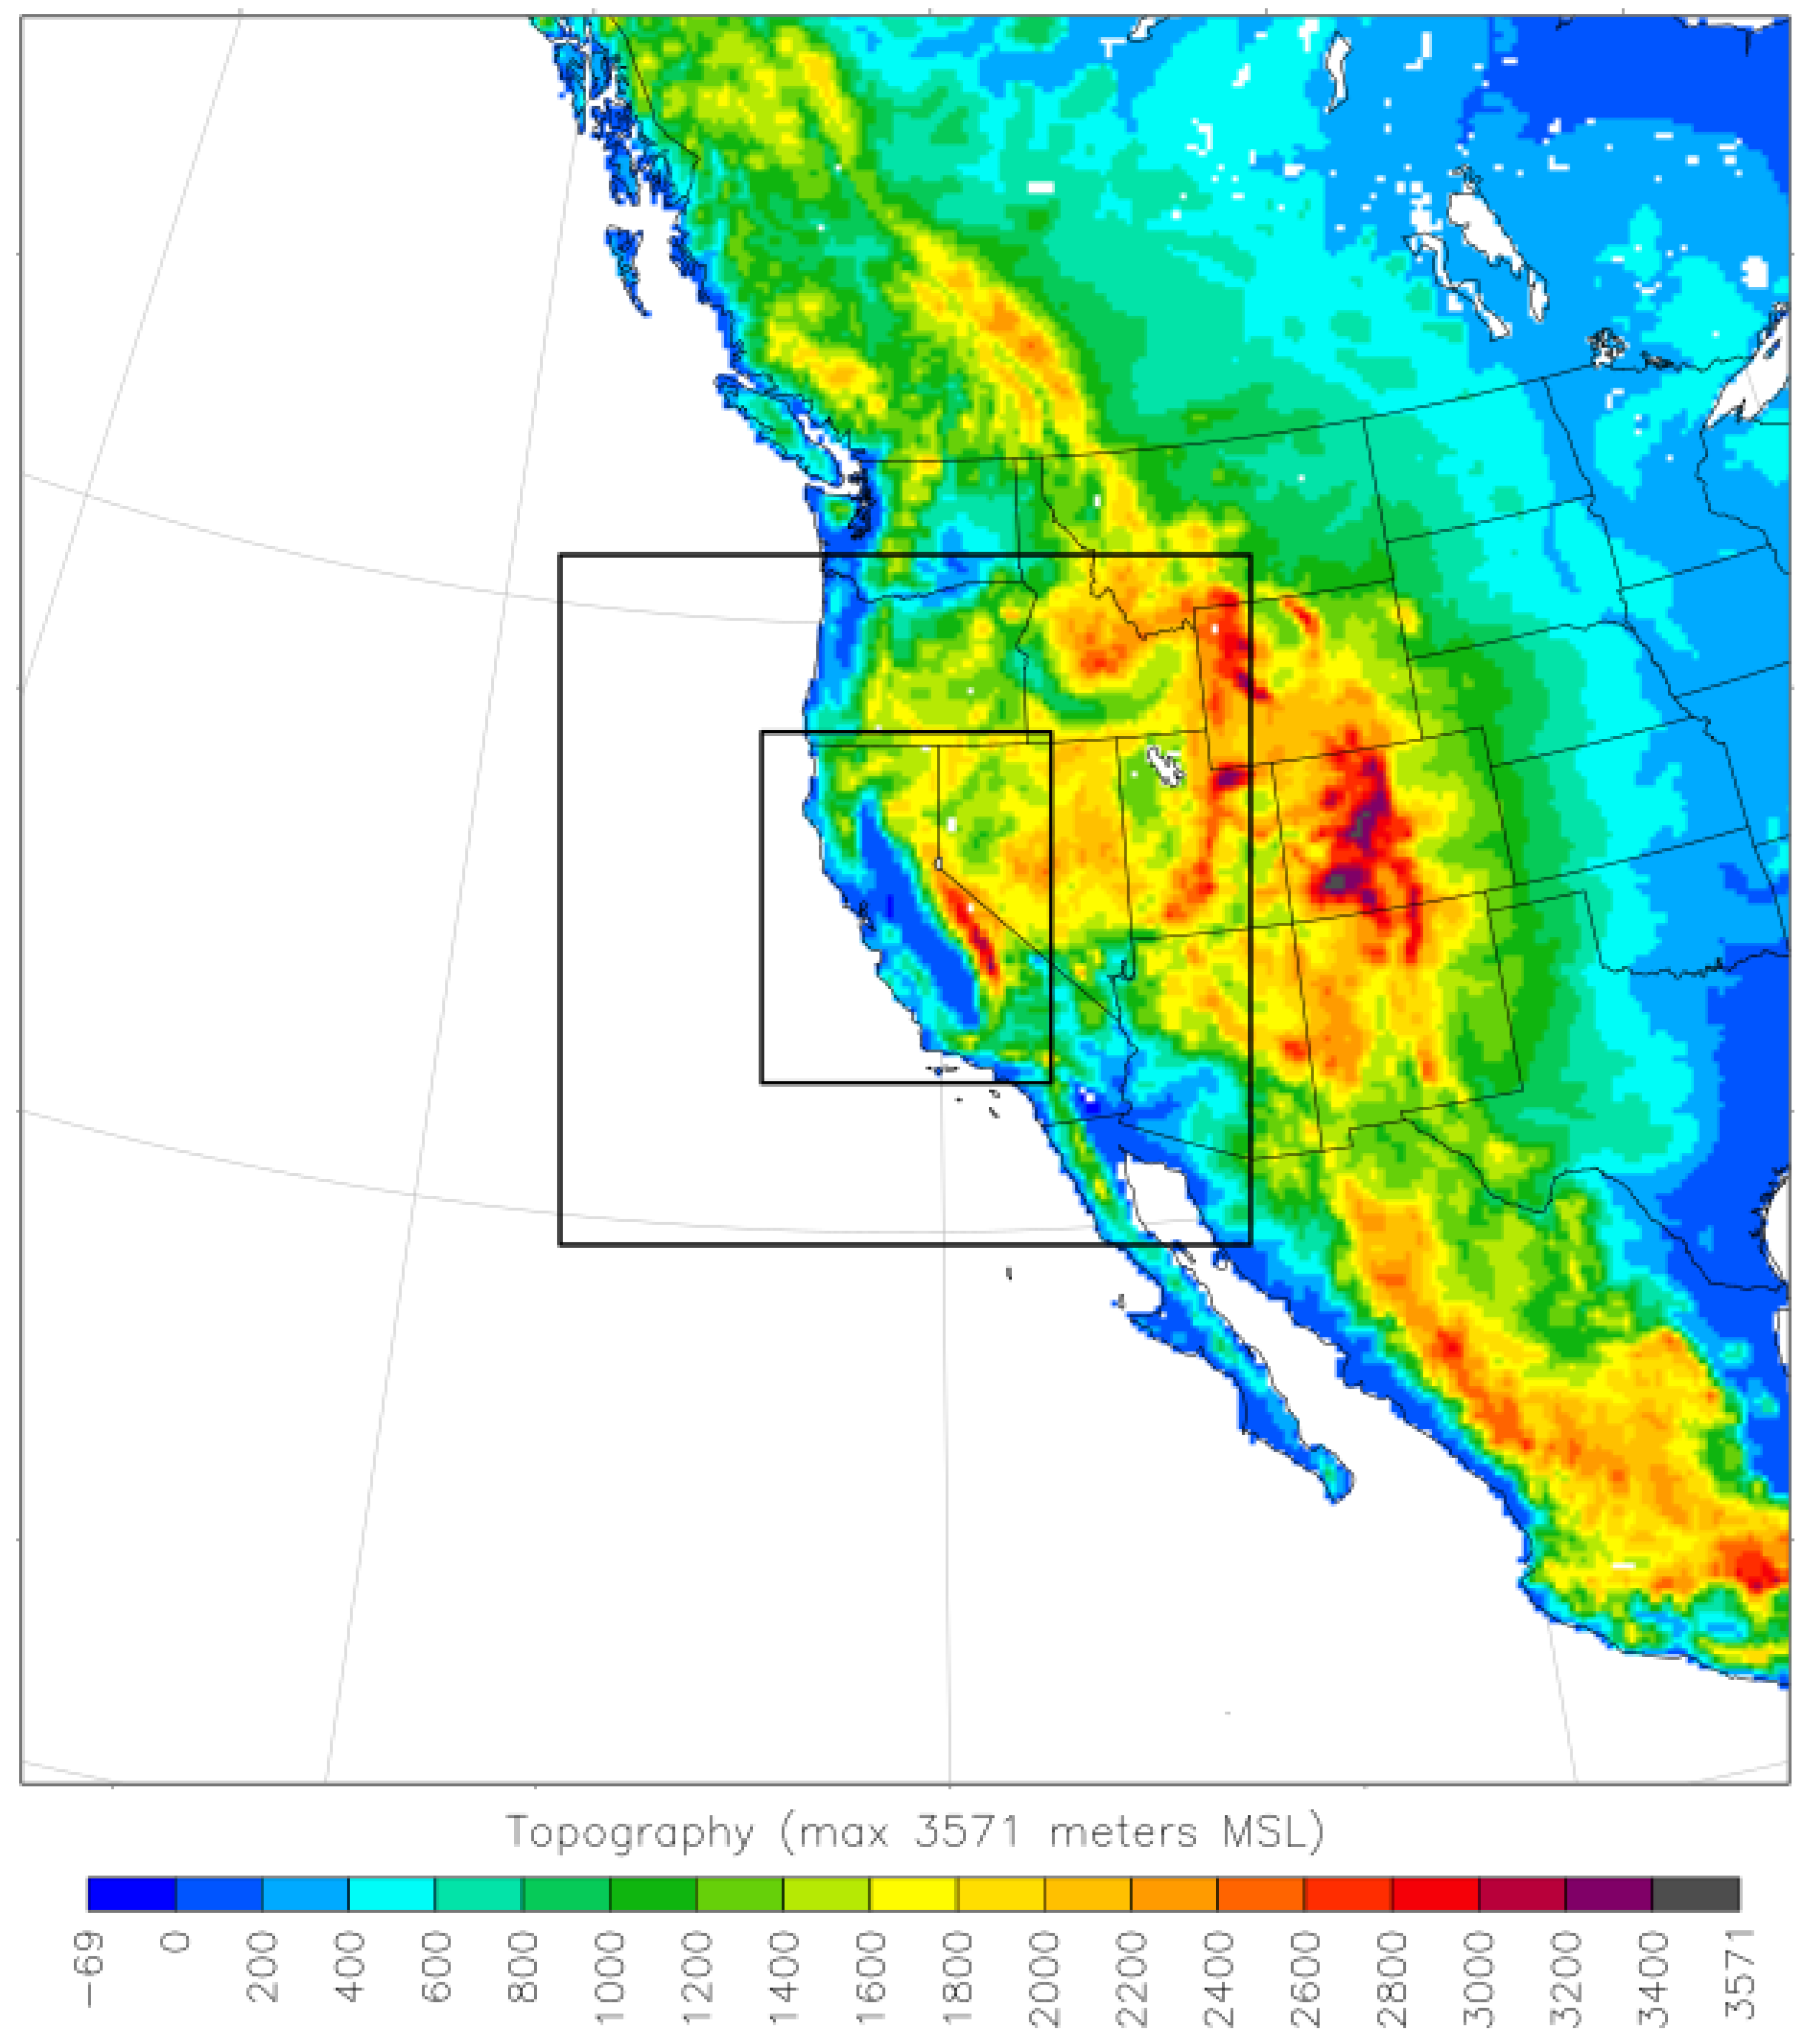
Figure 2.
WRF nested grids of 0.67-km grid spacing (shaded) that can be launched on-demand during critical weather events. Each grid is 215 x 215 km.
Figure 2.
WRF nested grids of 0.67-km grid spacing (shaded) that can be launched on-demand during critical weather events. Each grid is 215 x 215 km.
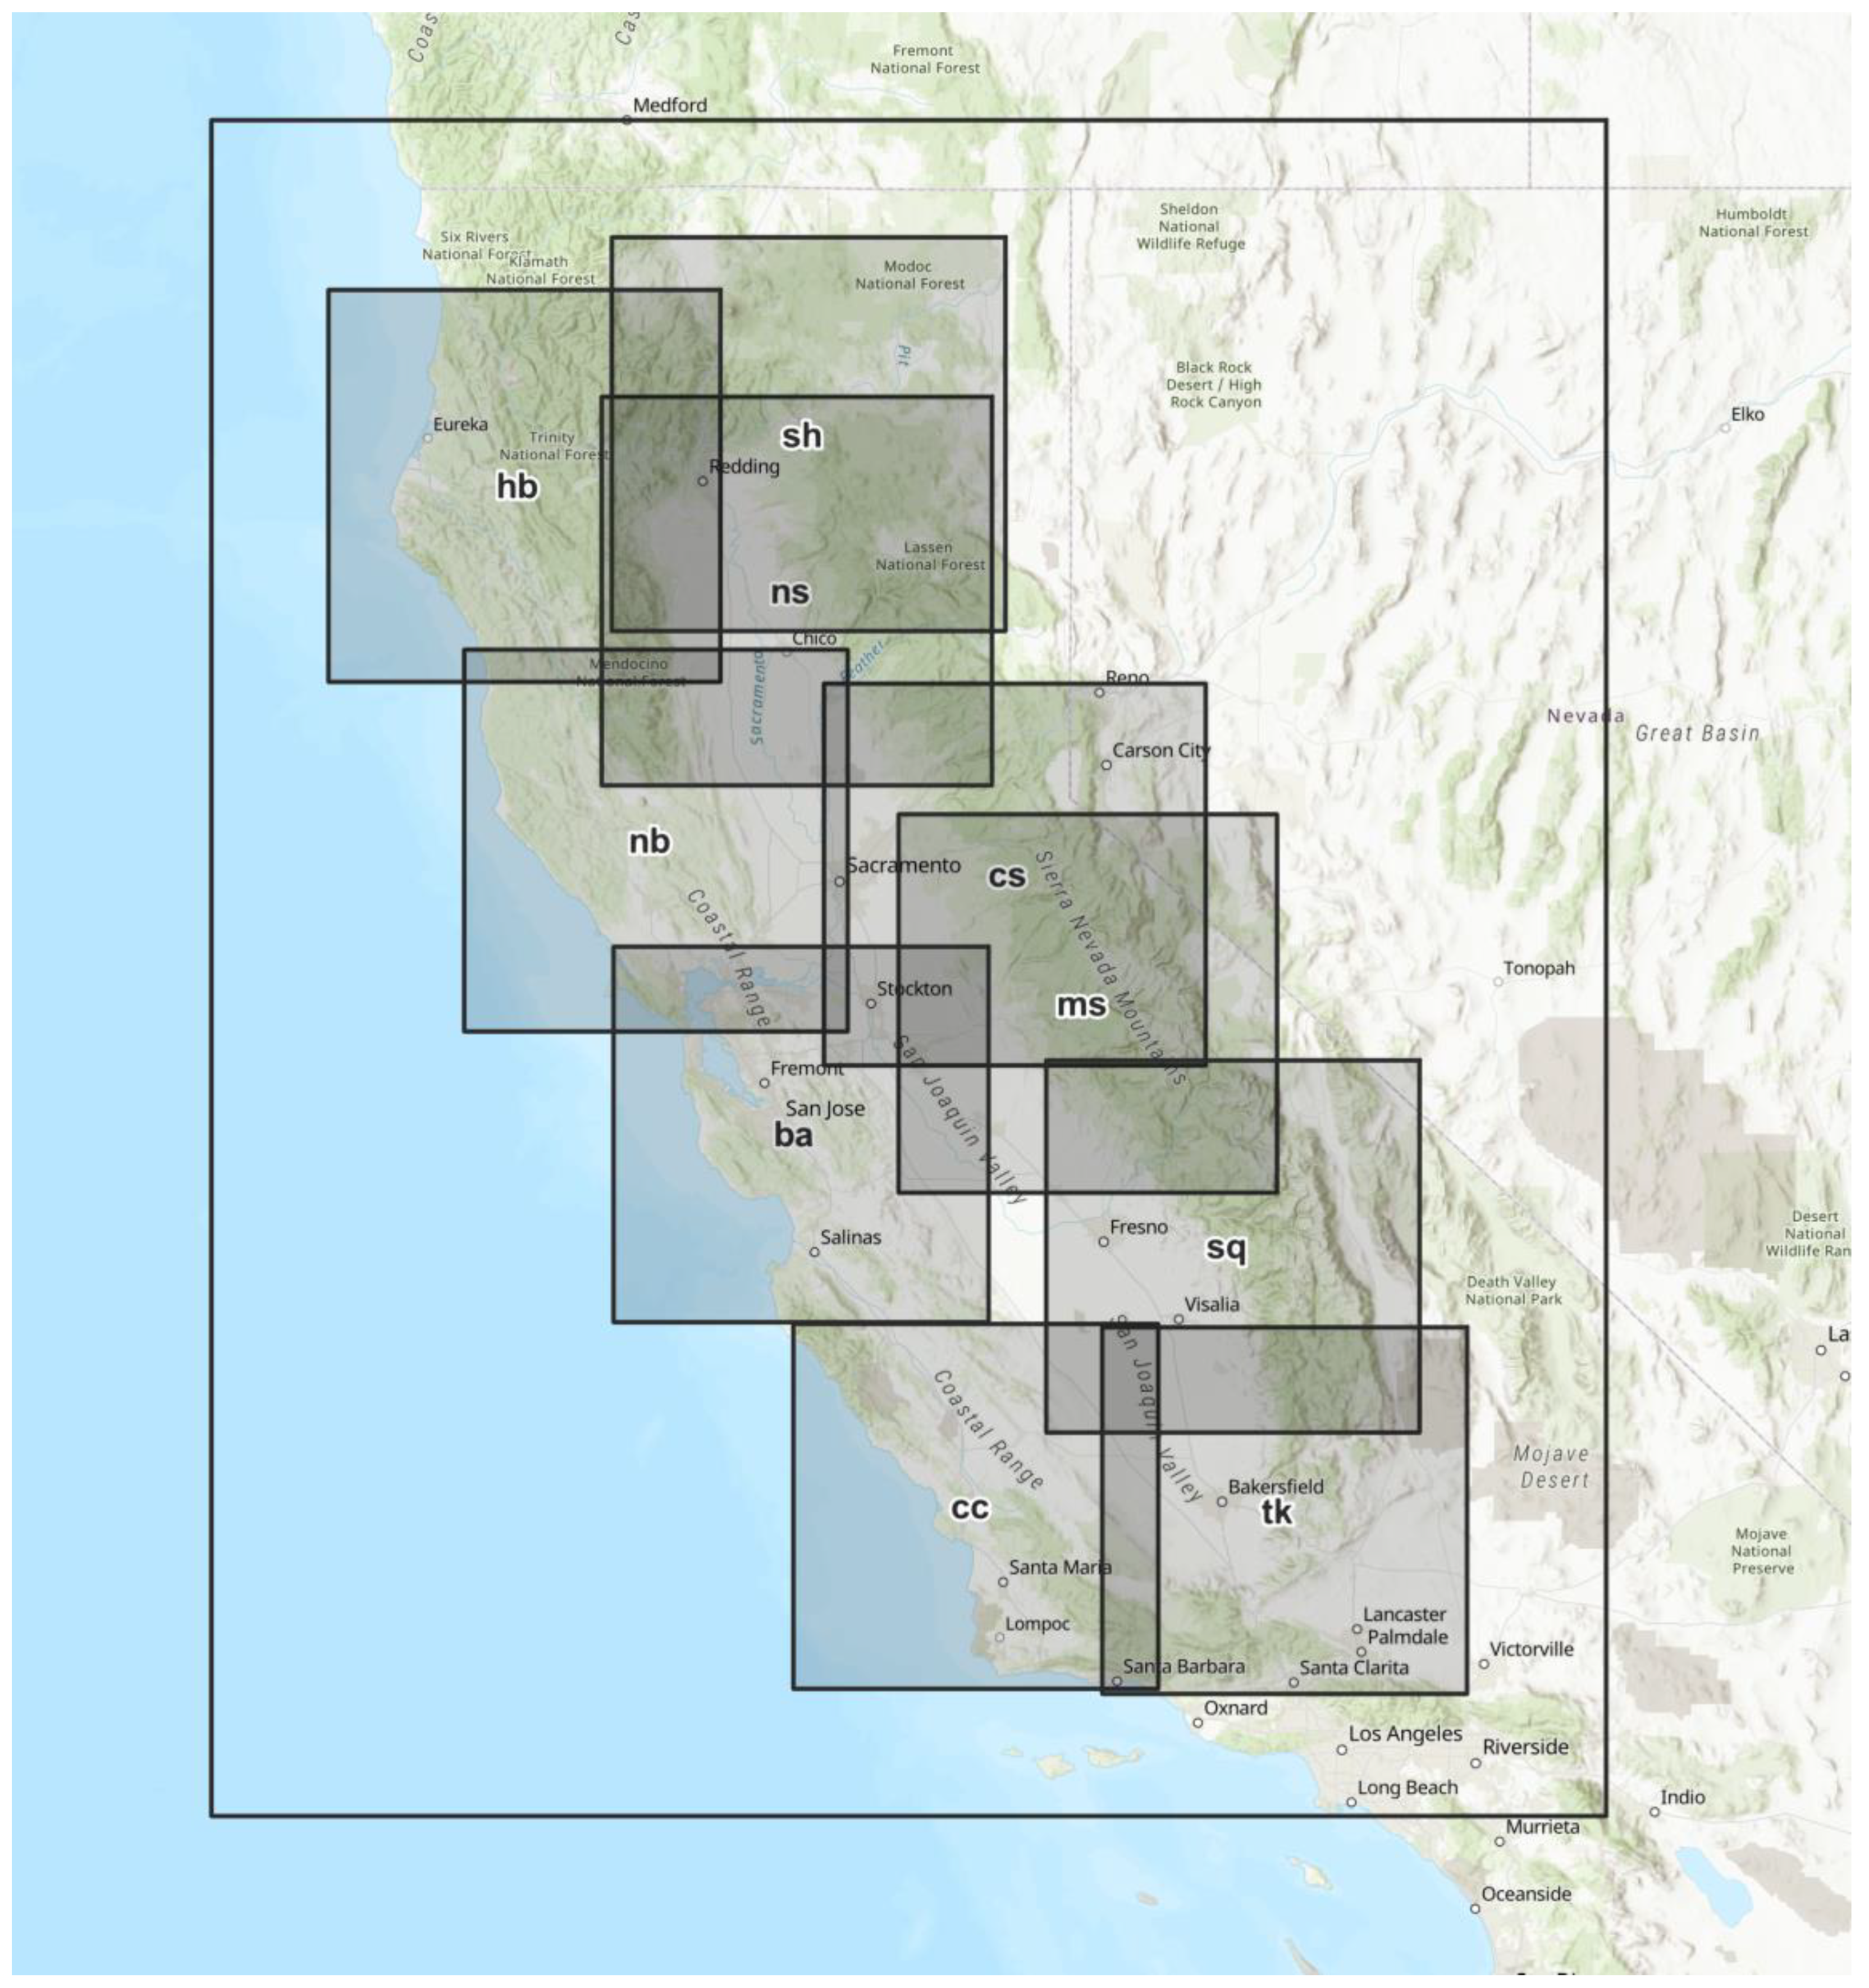
Figure 3.
Average annual number of Diablo wind events over PG&E’s service territory derived from the POMMS v3 31-year (1990-2020) reanalysis.
Figure 3.
Average annual number of Diablo wind events over PG&E’s service territory derived from the POMMS v3 31-year (1990-2020) reanalysis.
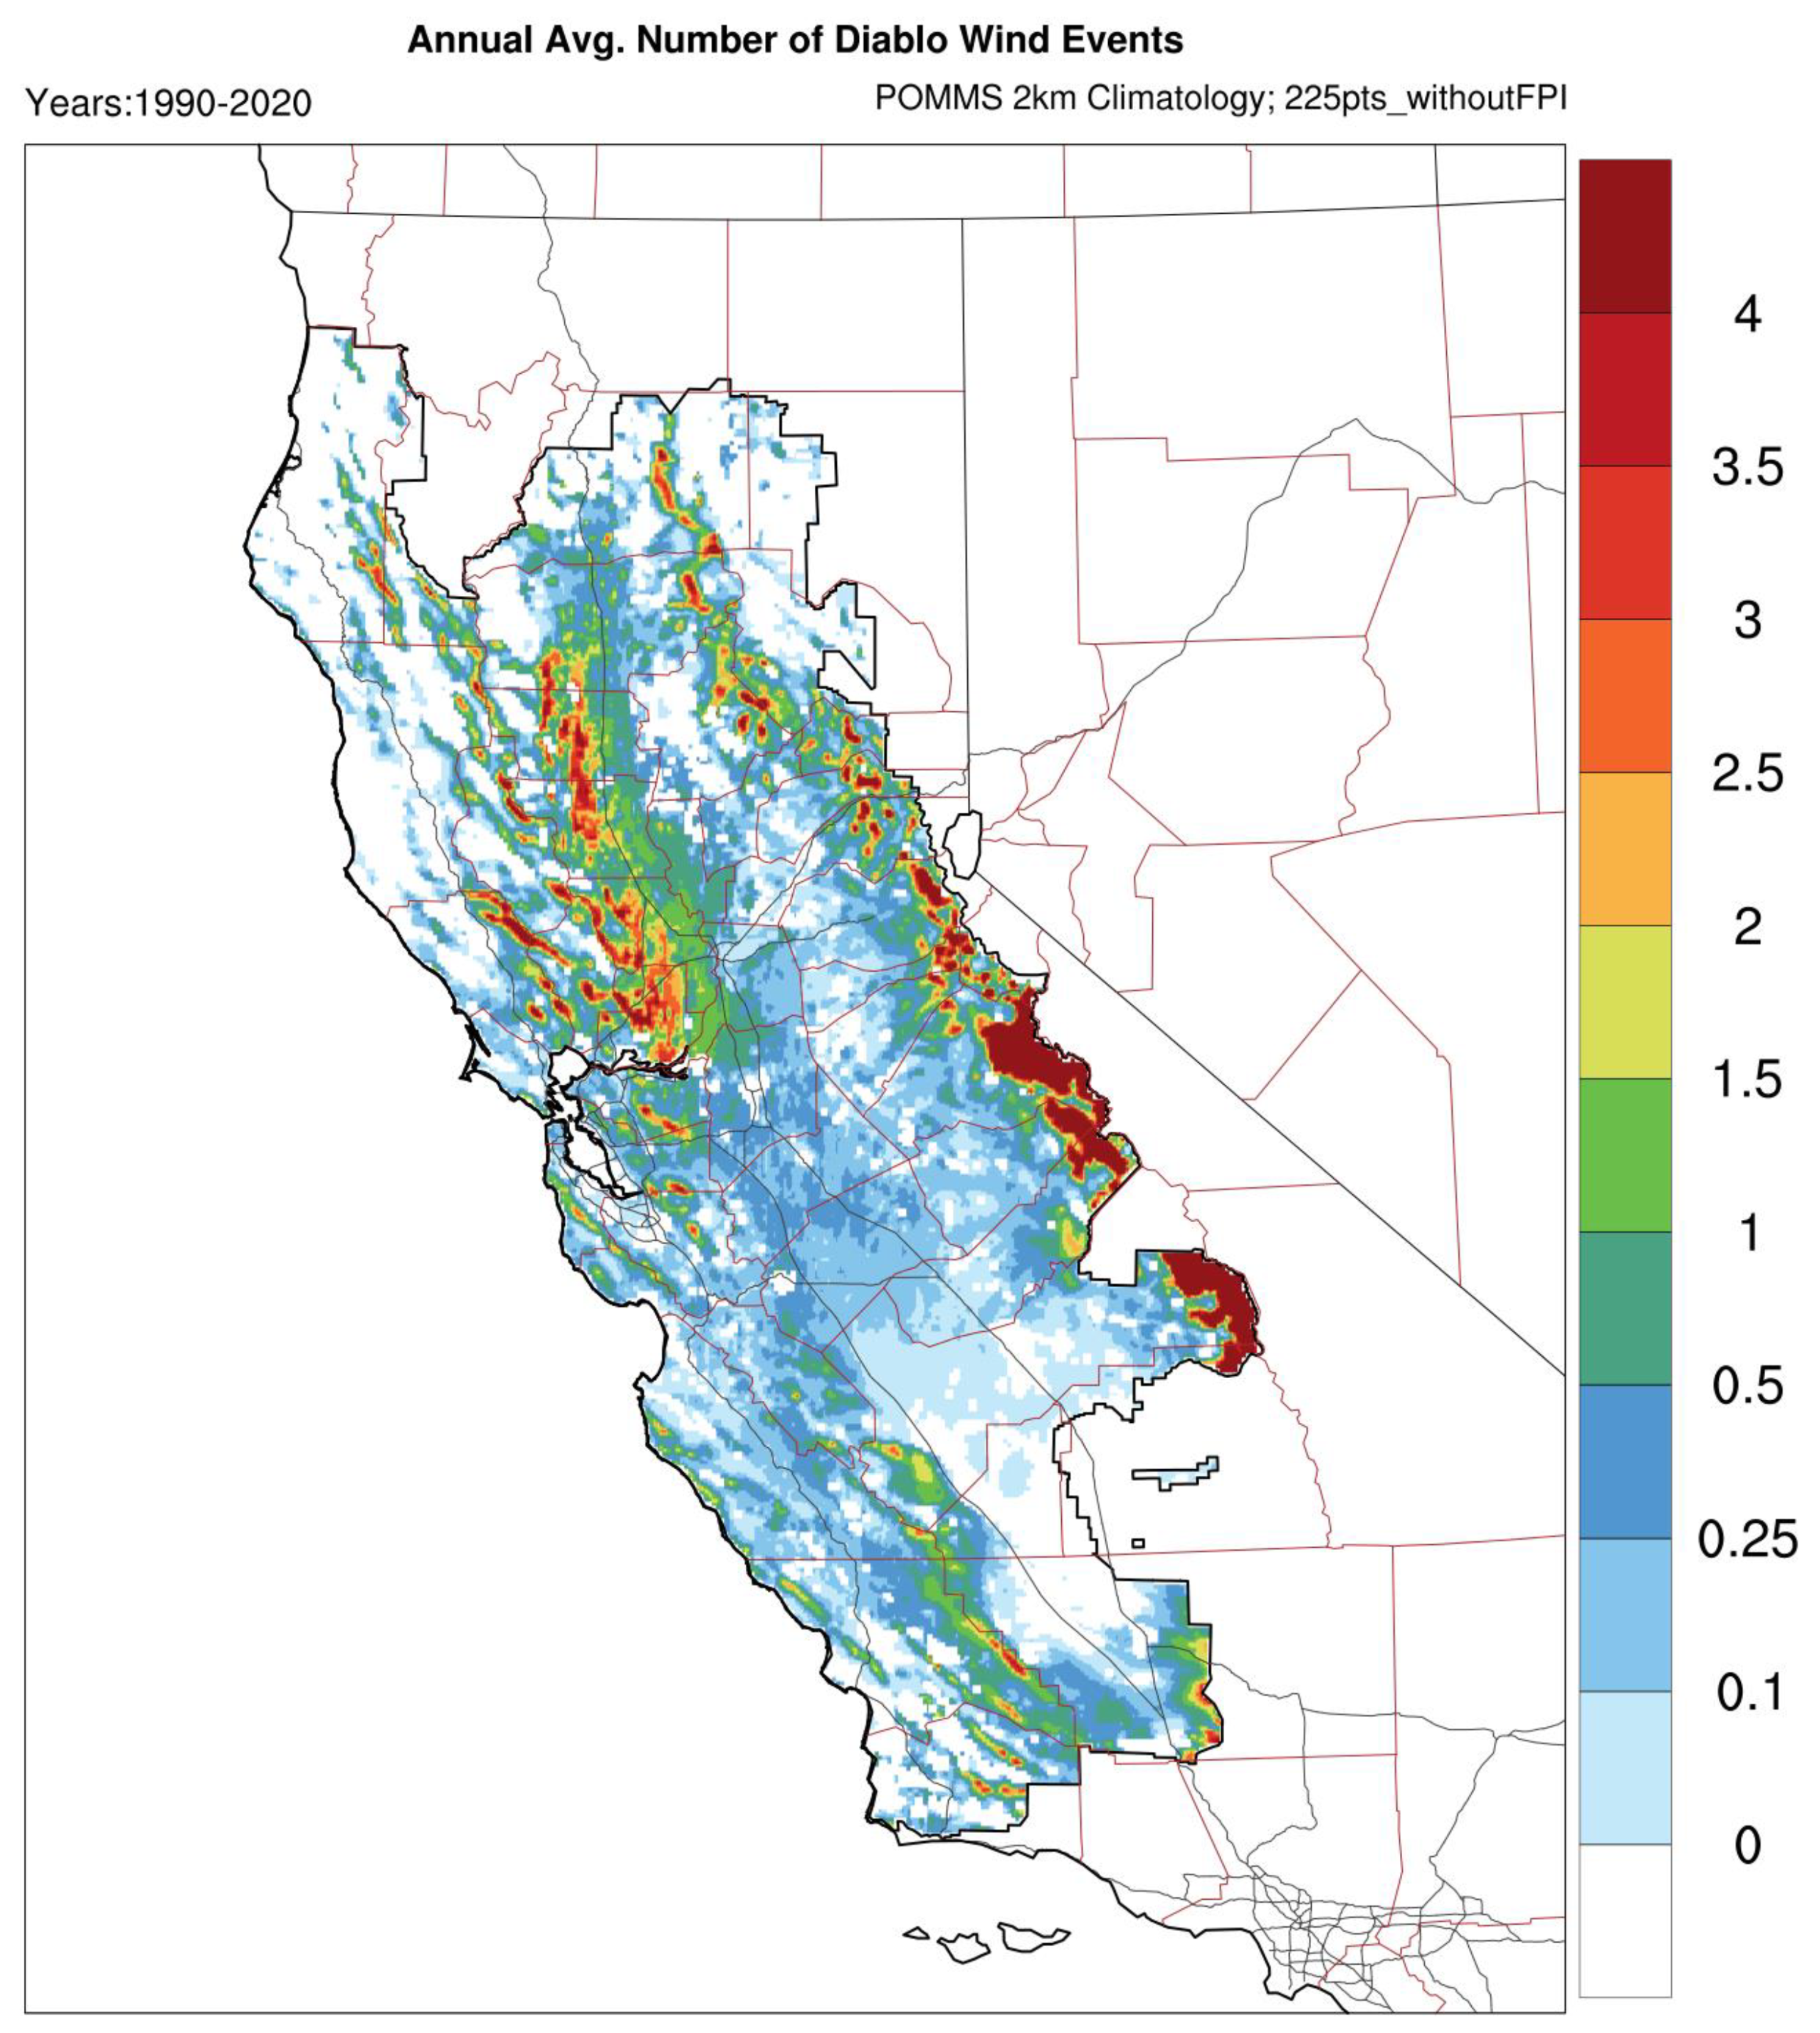
Figure 4.
Irrigation fraction (range 0 to 1) in the WRF Noah-MP scheme on the 2-km grid.
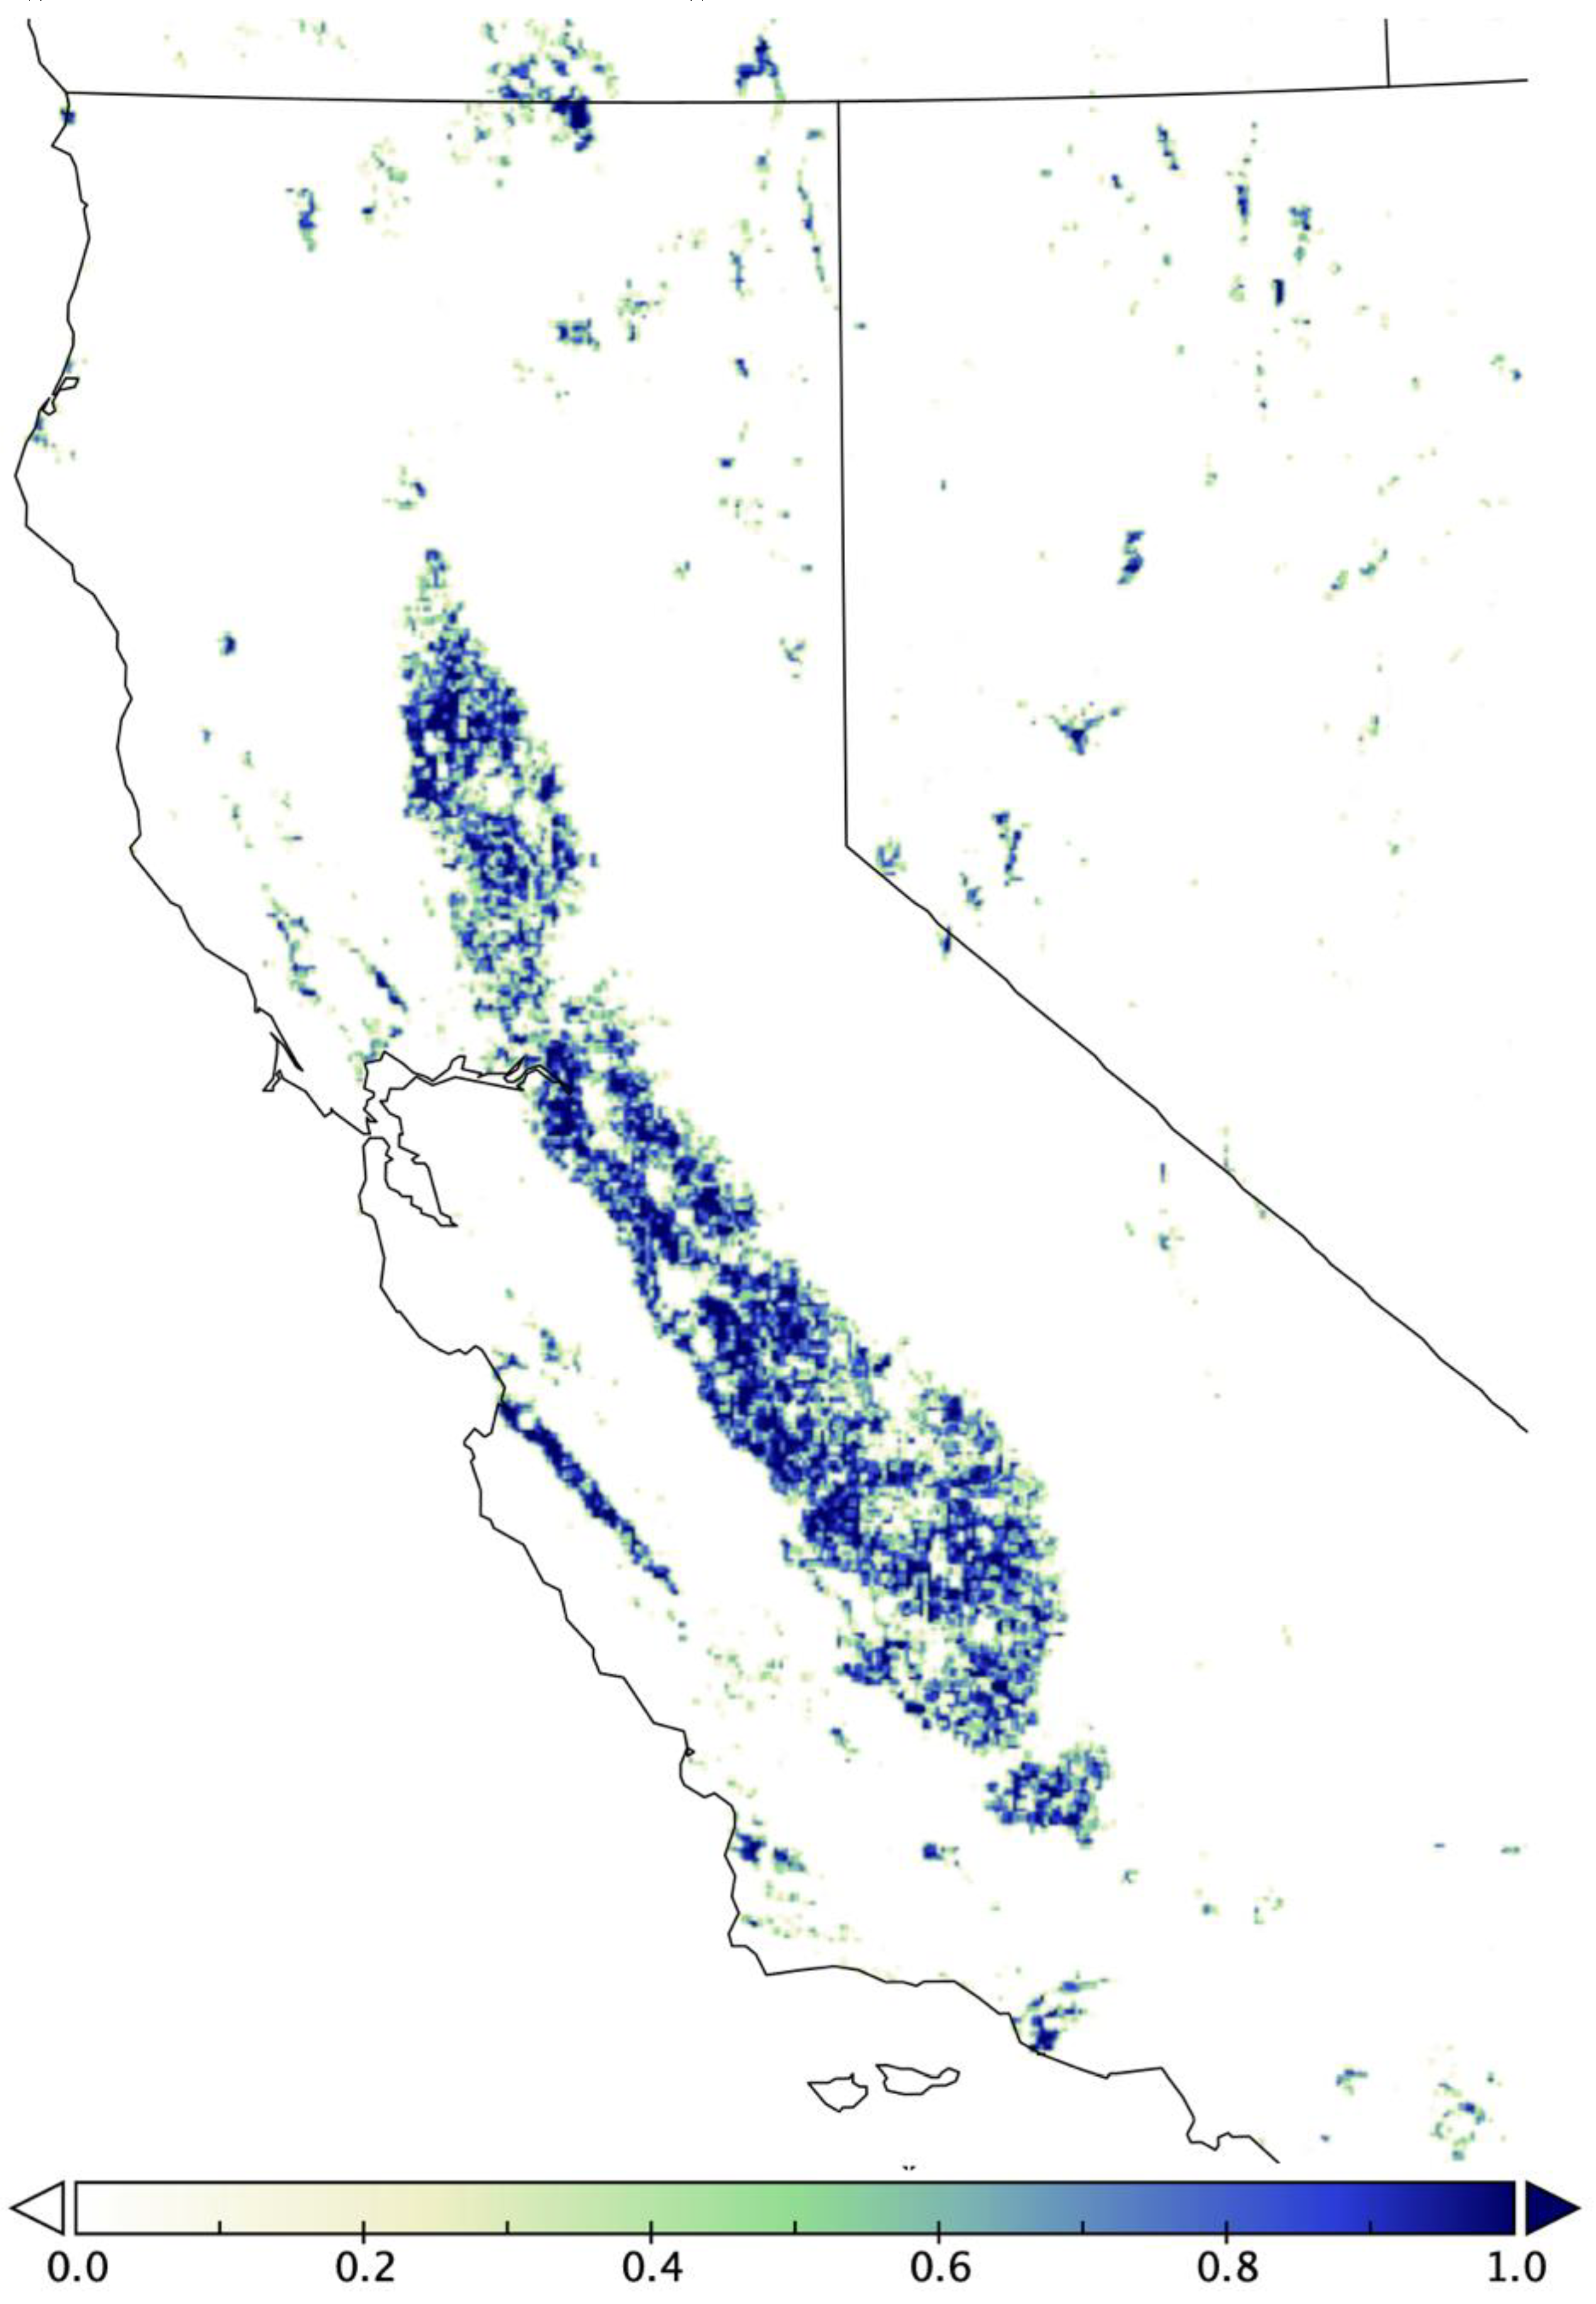
Figure 5.
Stations used in validation.
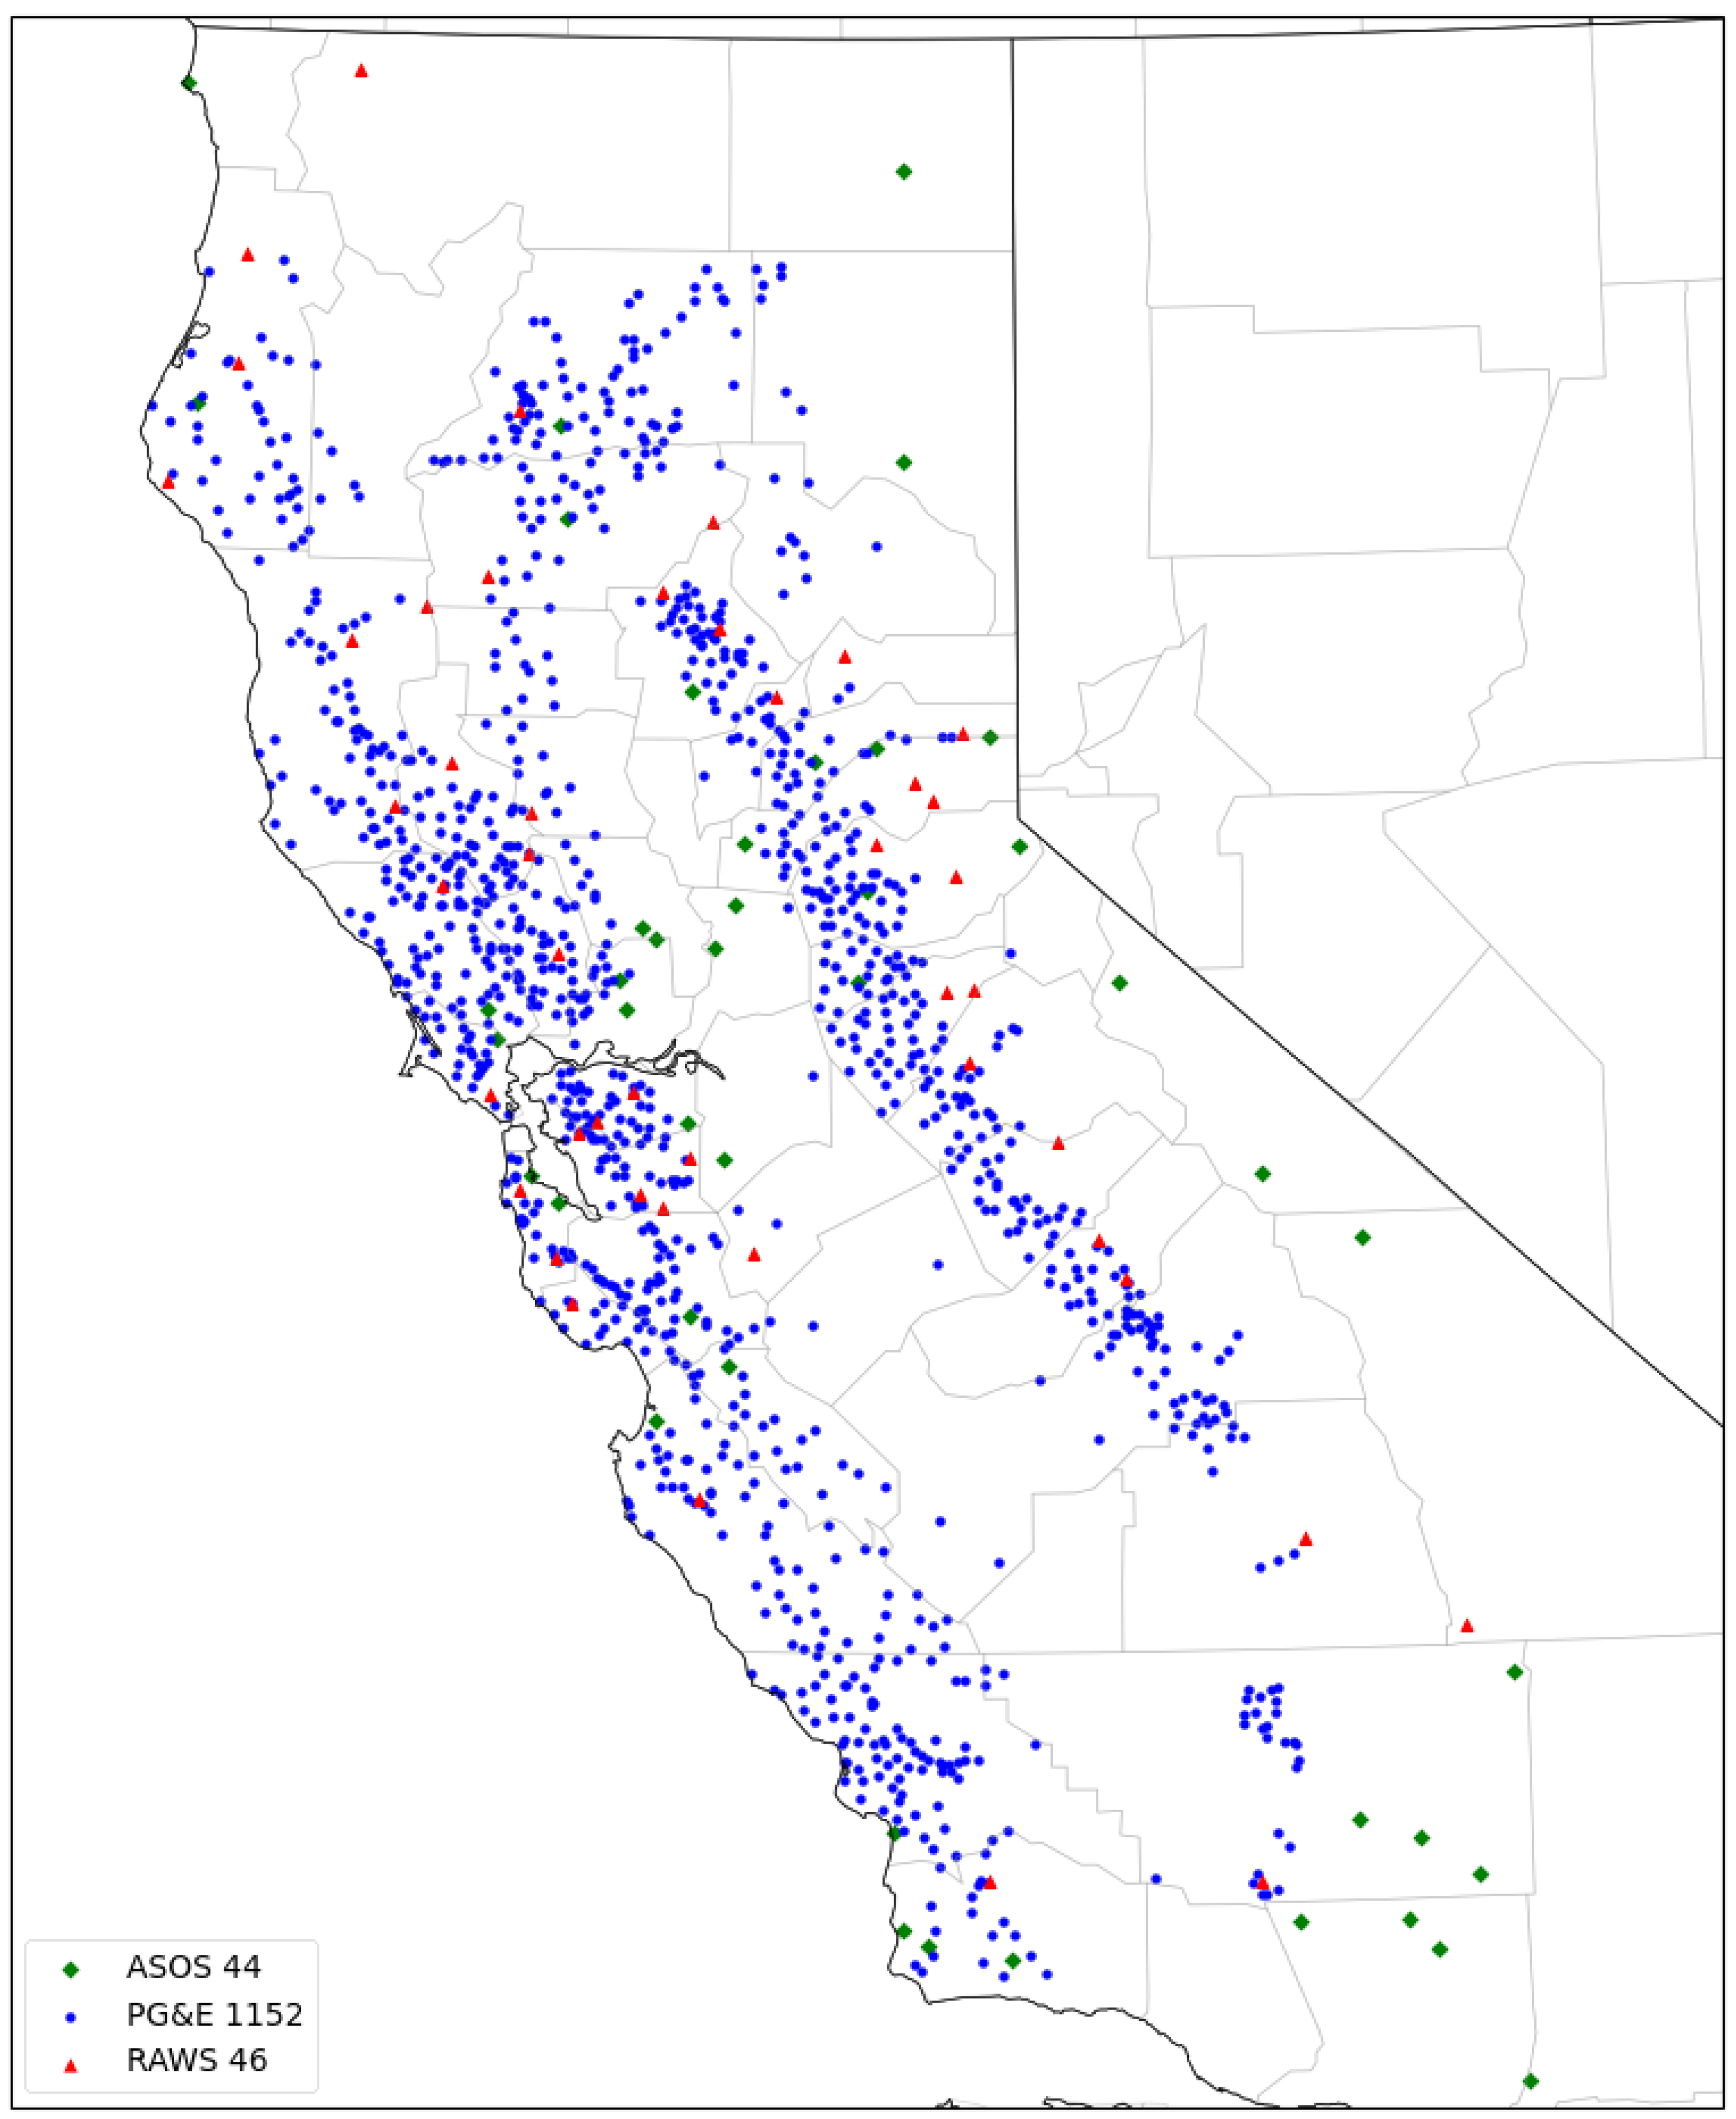
Figure 6.
NCEP Global Data Assimilation System (GDAS) analysis of (a) 500 hPa geopotential heights (10 dm contour interval) and winds; and (b) sea level pressure (2 hPa contour interval) and 10-m winds, with areas of simulated composite radar reflectivity ≥ 20 dBZ filled, valid 27 October 2019 at 1200 UTC.
Figure 6.
NCEP Global Data Assimilation System (GDAS) analysis of (a) 500 hPa geopotential heights (10 dm contour interval) and winds; and (b) sea level pressure (2 hPa contour interval) and 10-m winds, with areas of simulated composite radar reflectivity ≥ 20 dBZ filled, valid 27 October 2019 at 1200 UTC.
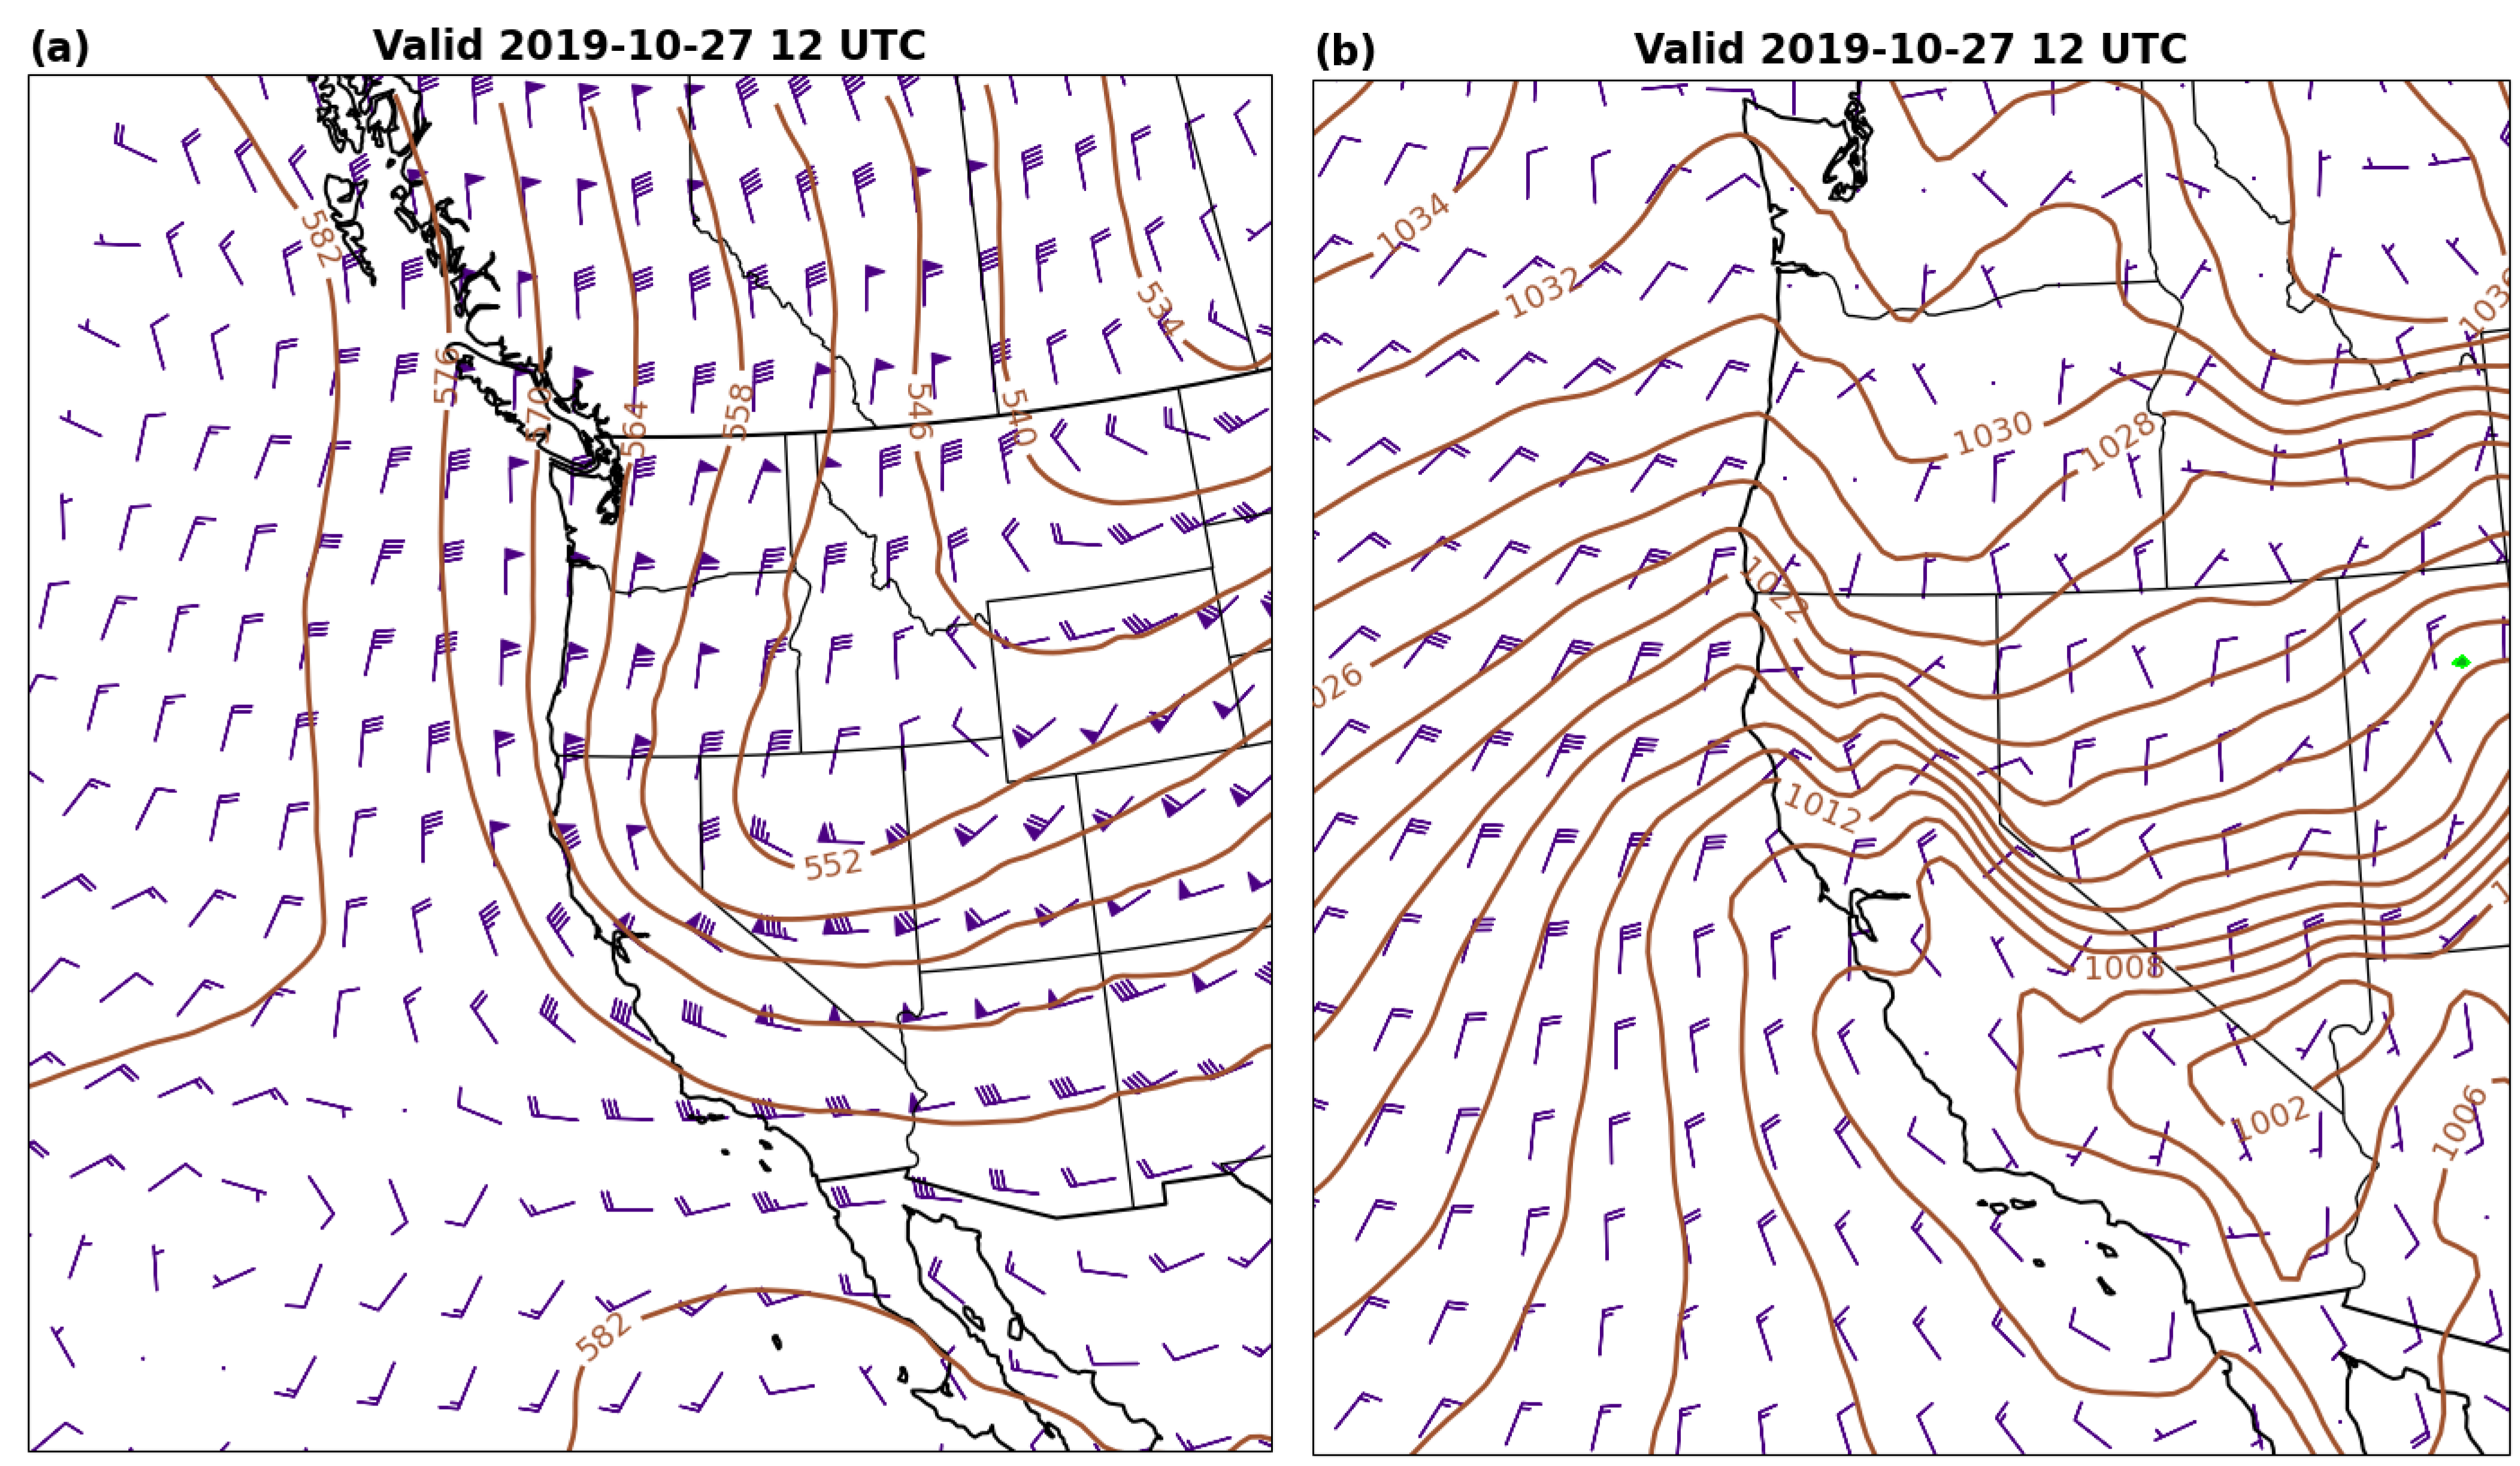
Figure 7.
As in Figure 6, except valid 19 January 2021 at 1200 UTC.
Figure 7.
As in Figure 6, except valid 19 January 2021 at 1200 UTC.
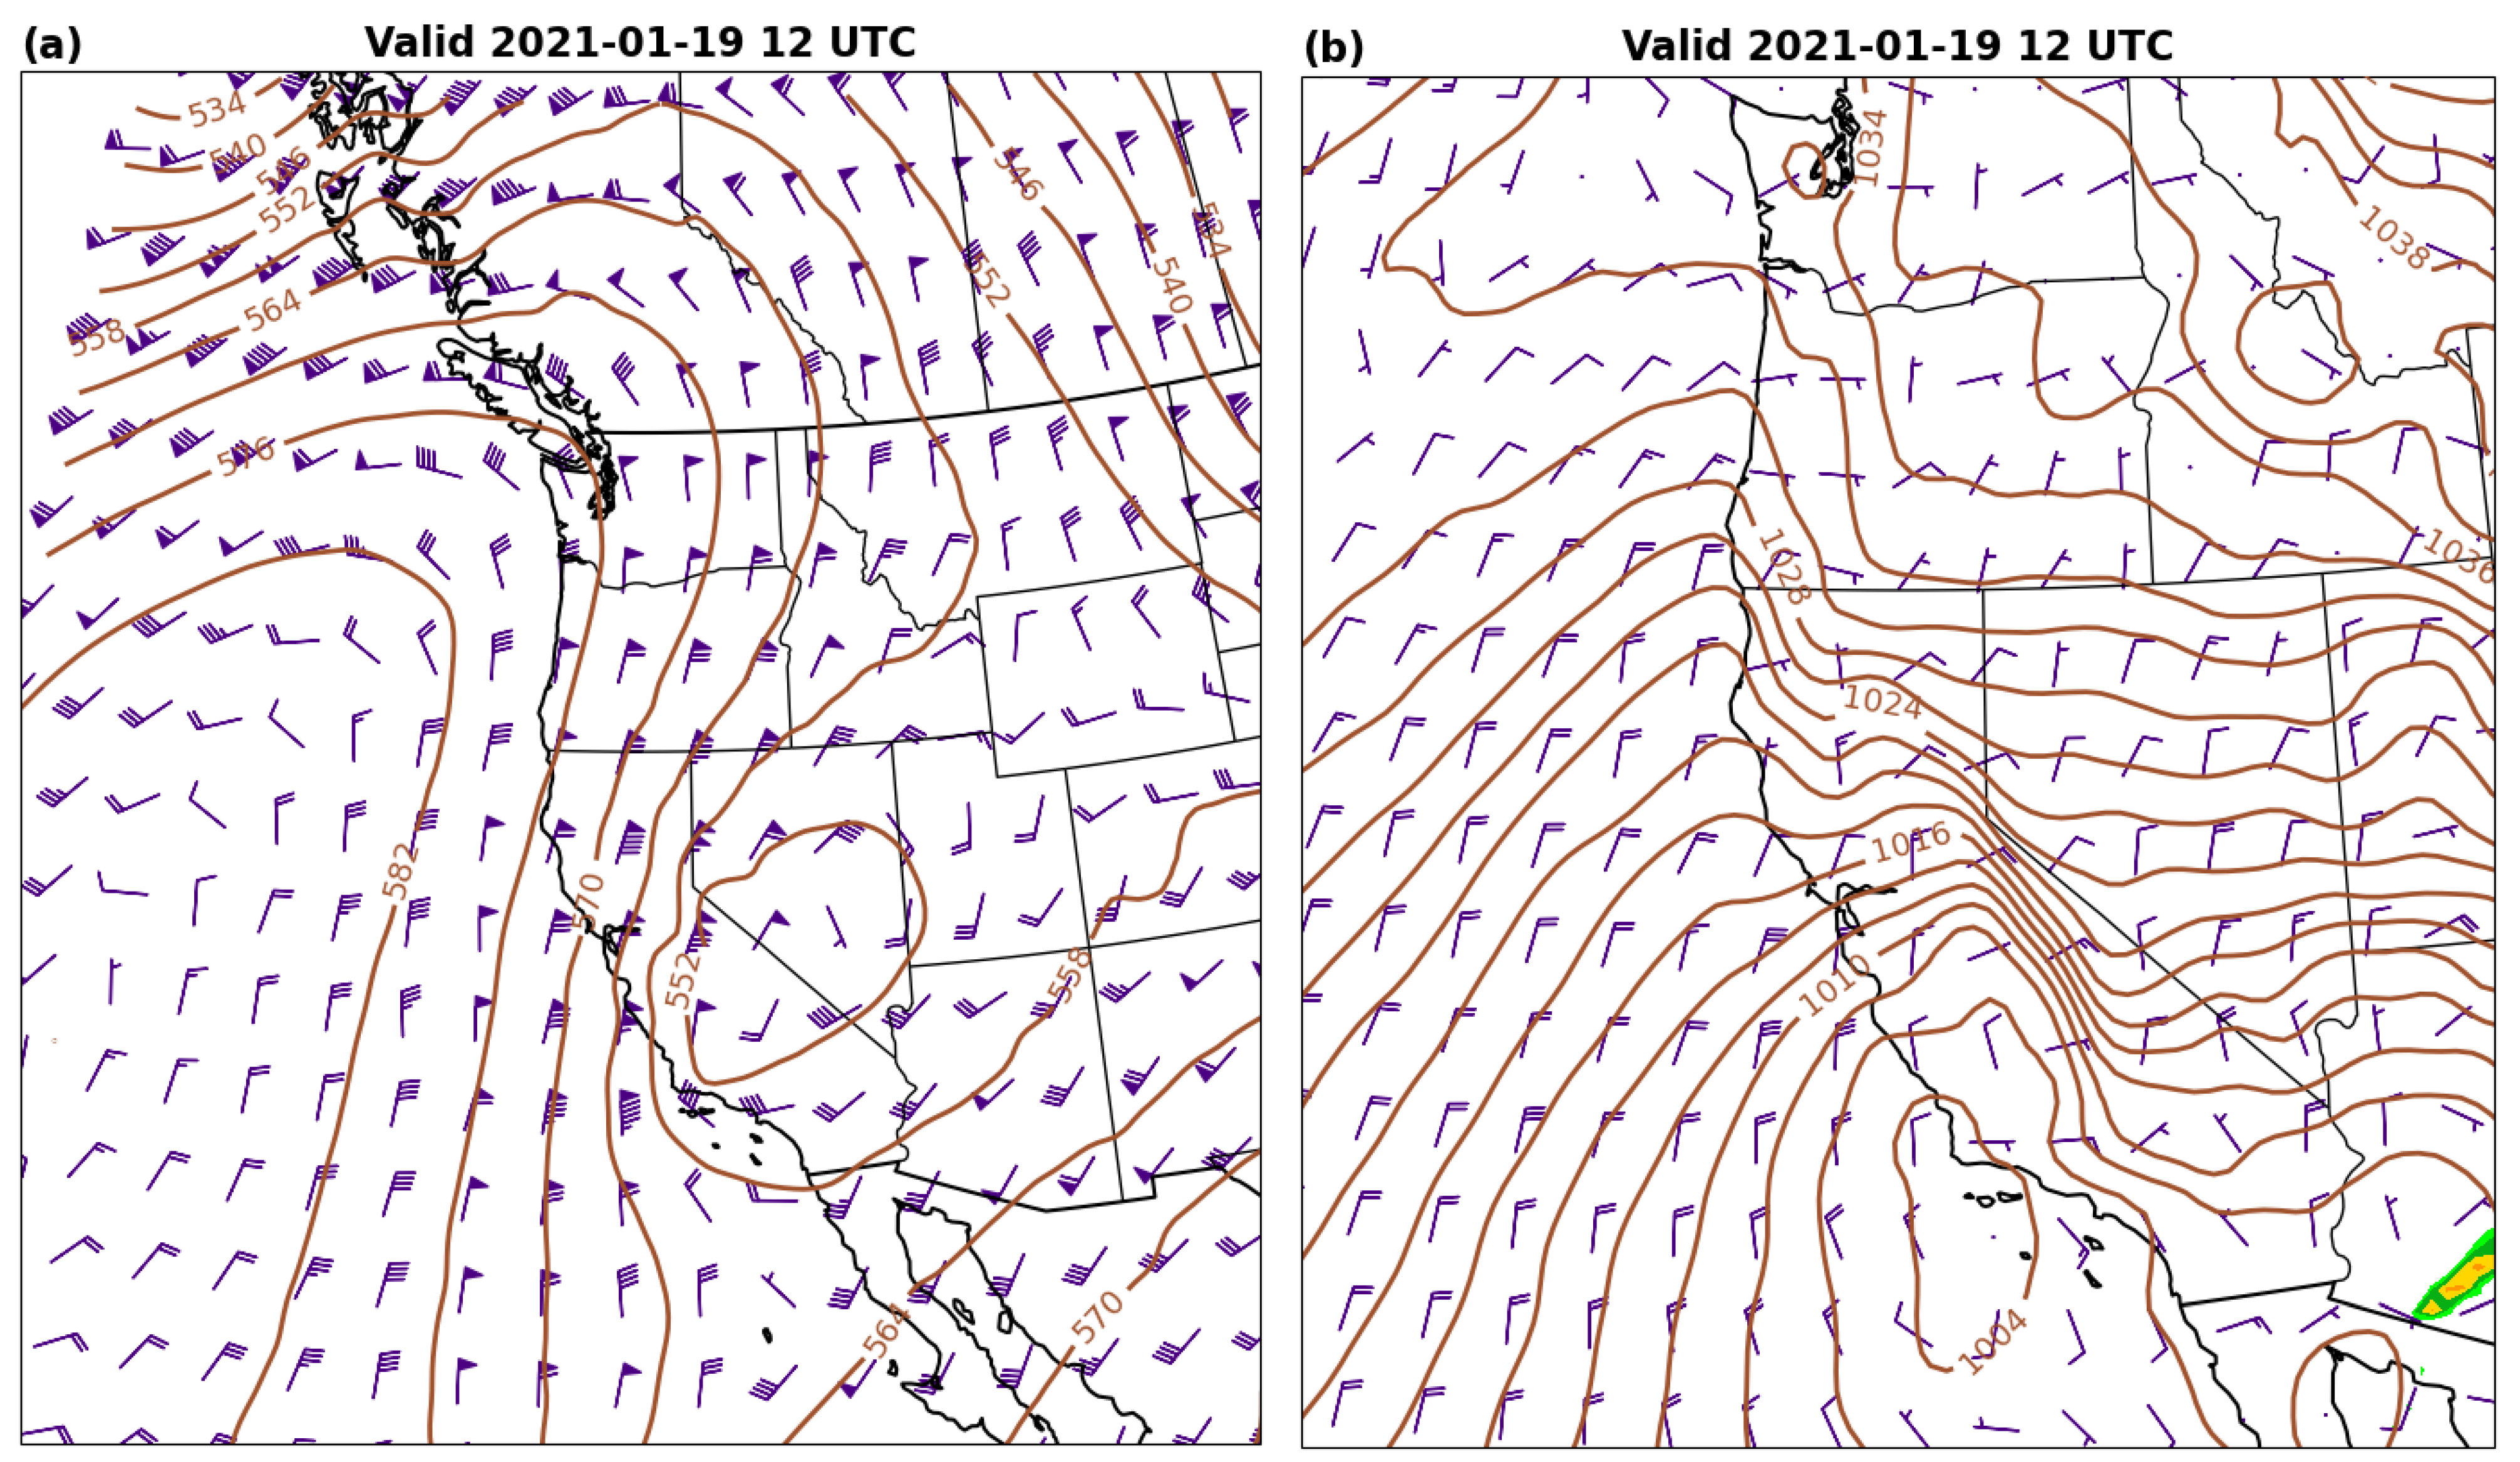
Figure 8.
As in Figure 6, except valid 13 July 2021 at 1200 UTC.
Figure 8.
As in Figure 6, except valid 13 July 2021 at 1200 UTC.
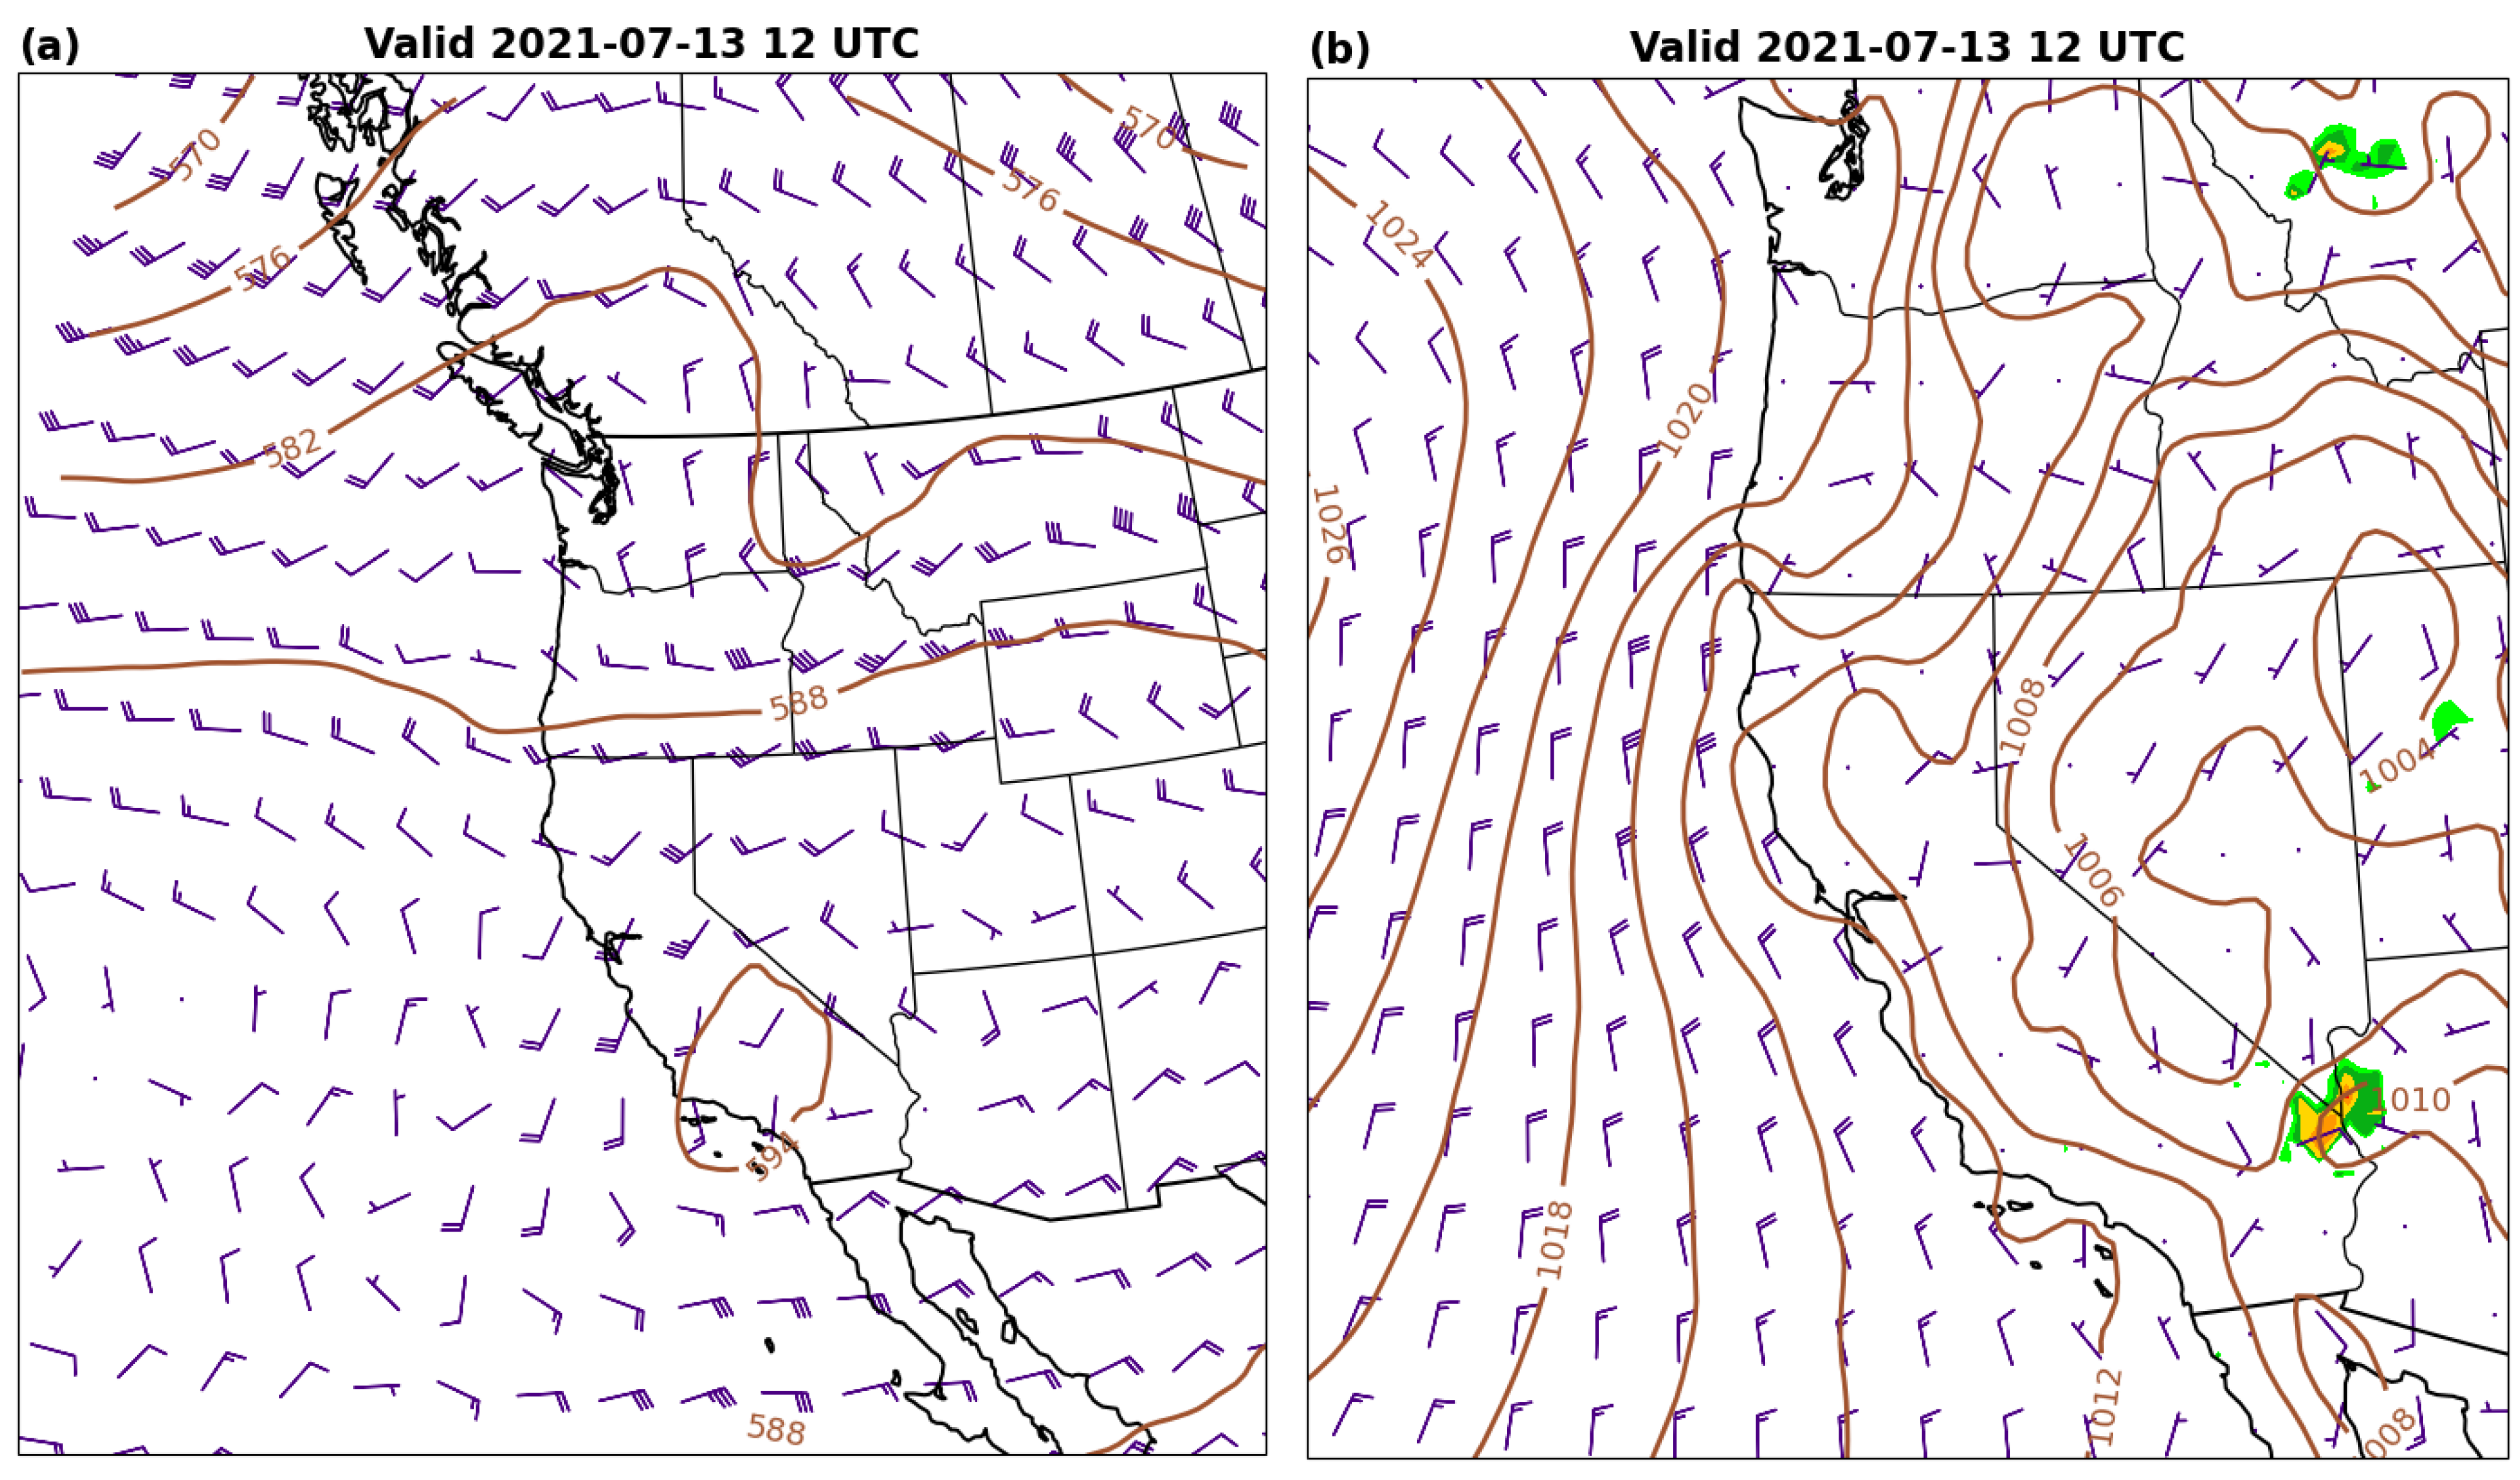
Figure 9.
As in Figure 6, except valid 7 September 2022 at 0000 UTC.
Figure 9.
As in Figure 6, except valid 7 September 2022 at 0000 UTC.
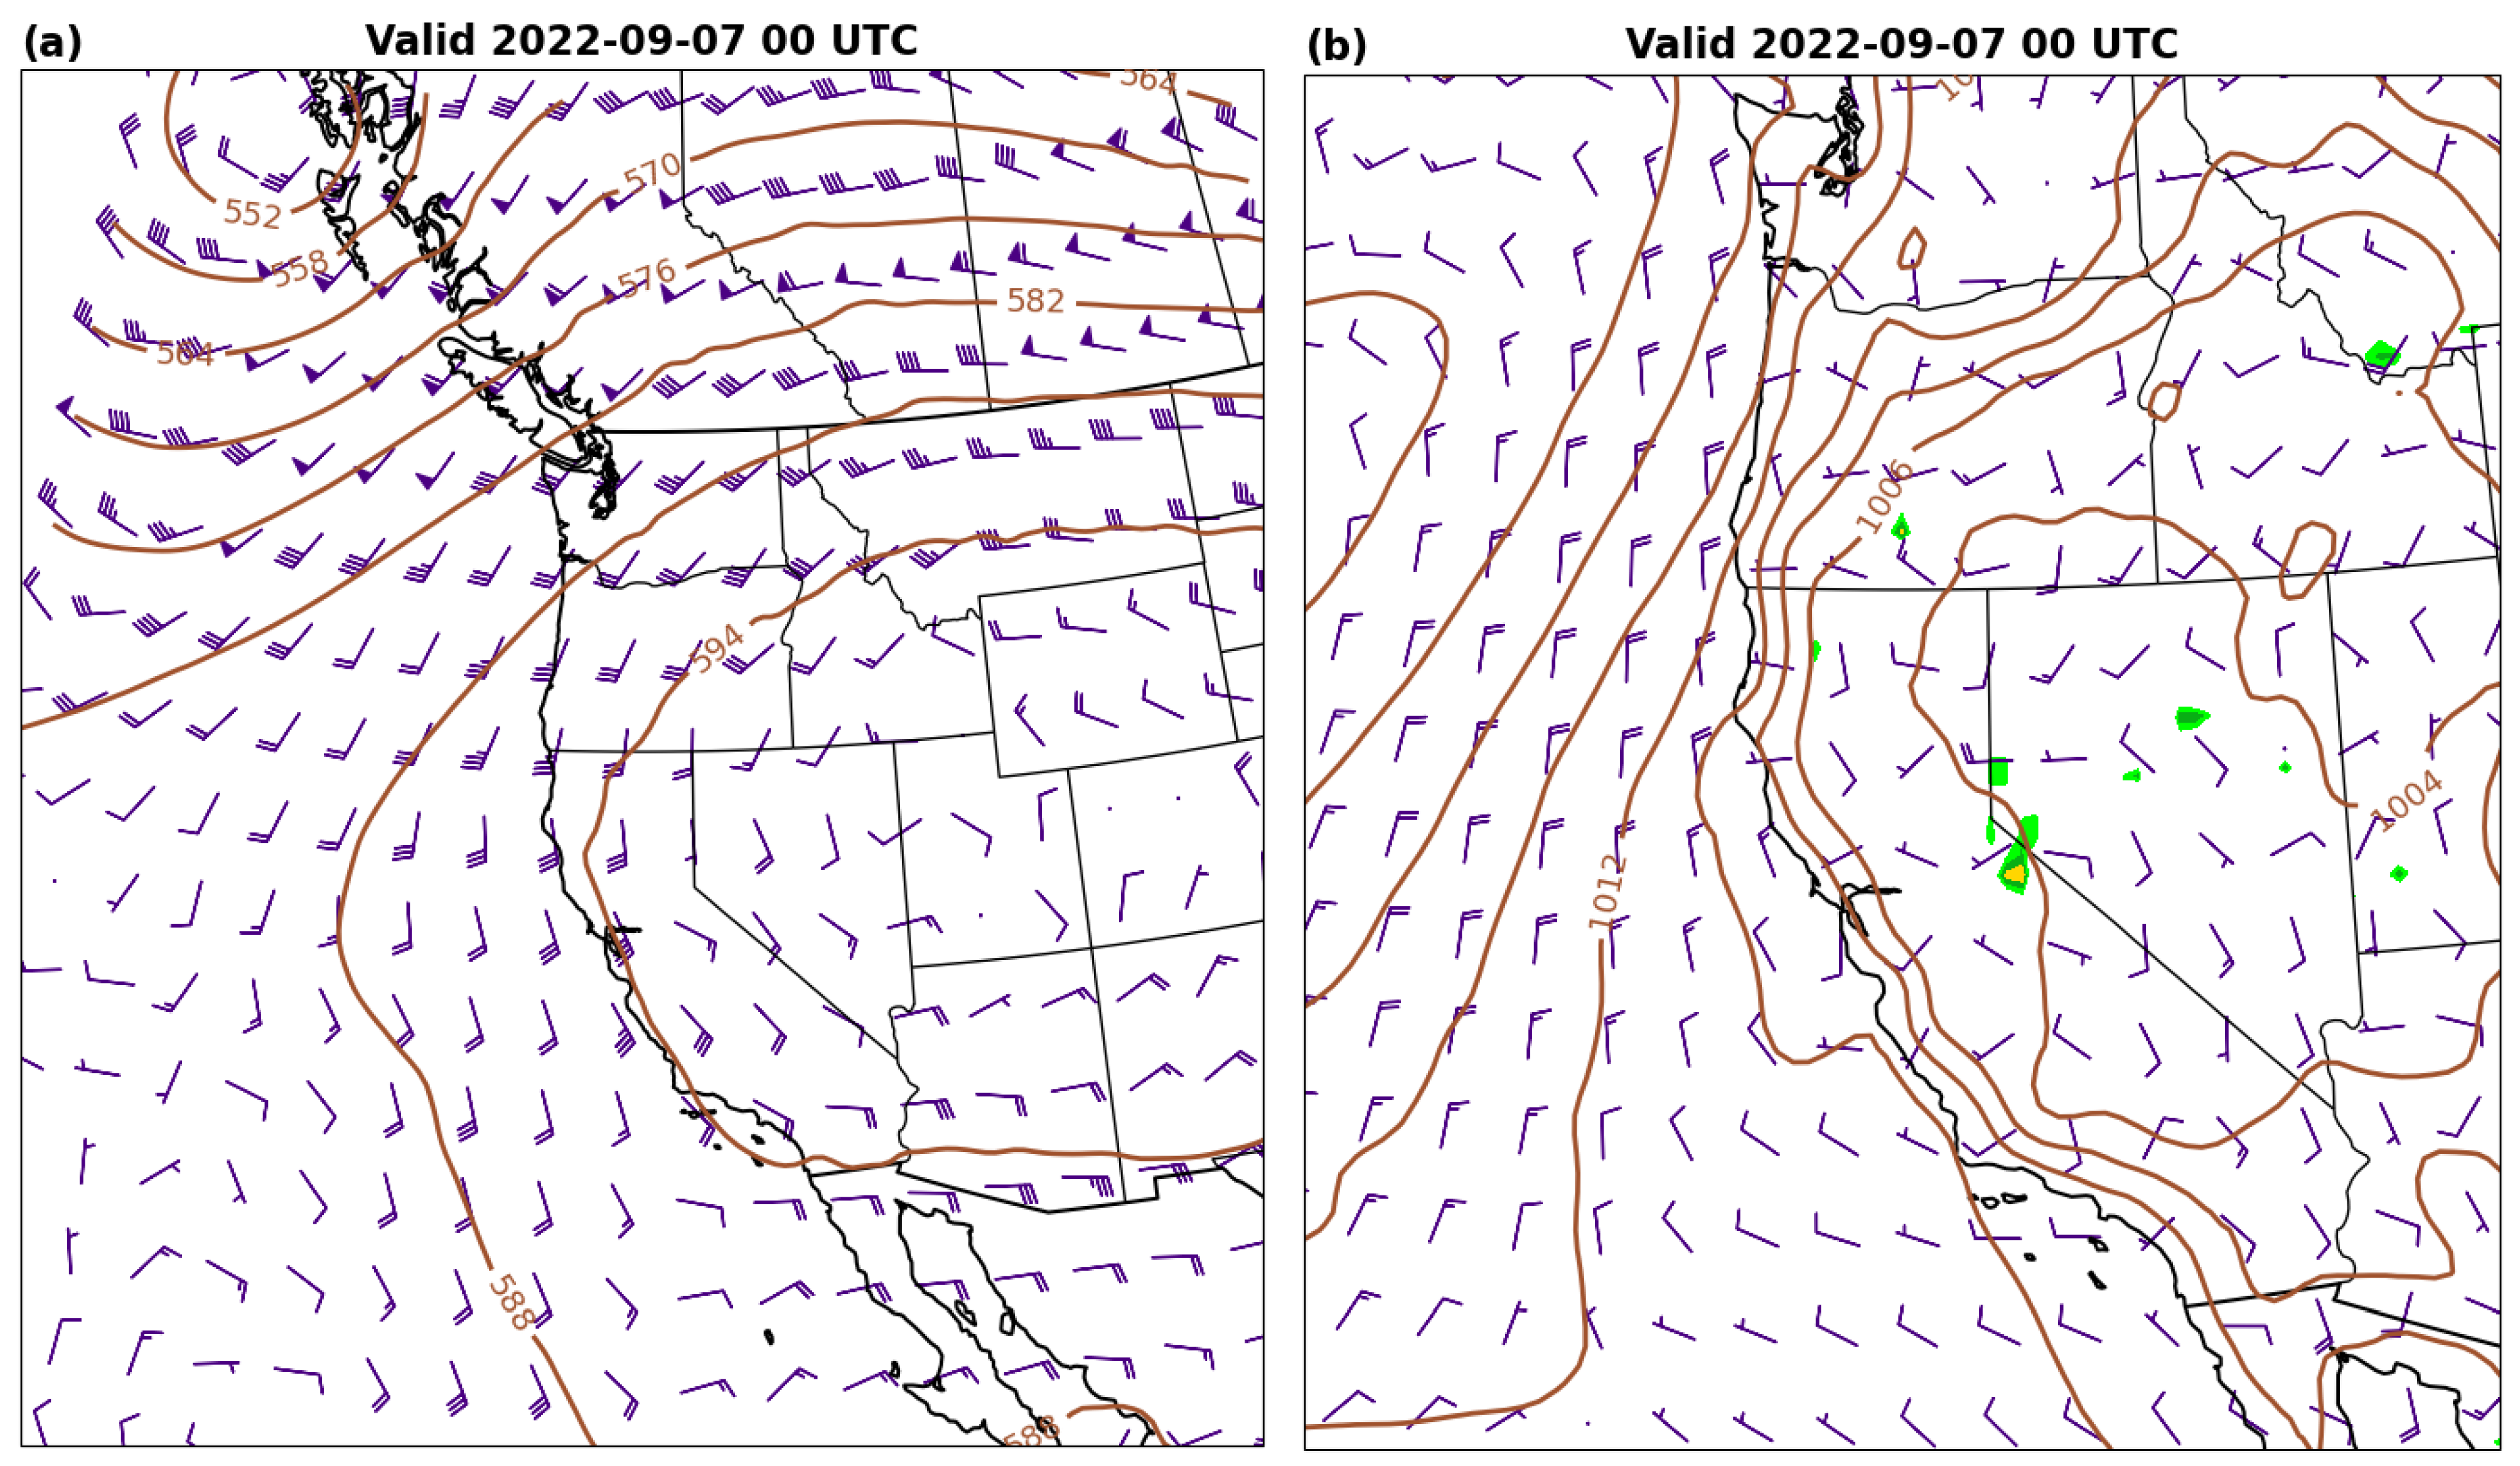
Figure 10.
As in Figure 6, except valid 21 February 2023 at 1800 UTC.
Figure 10.
As in Figure 6, except valid 21 February 2023 at 1800 UTC.
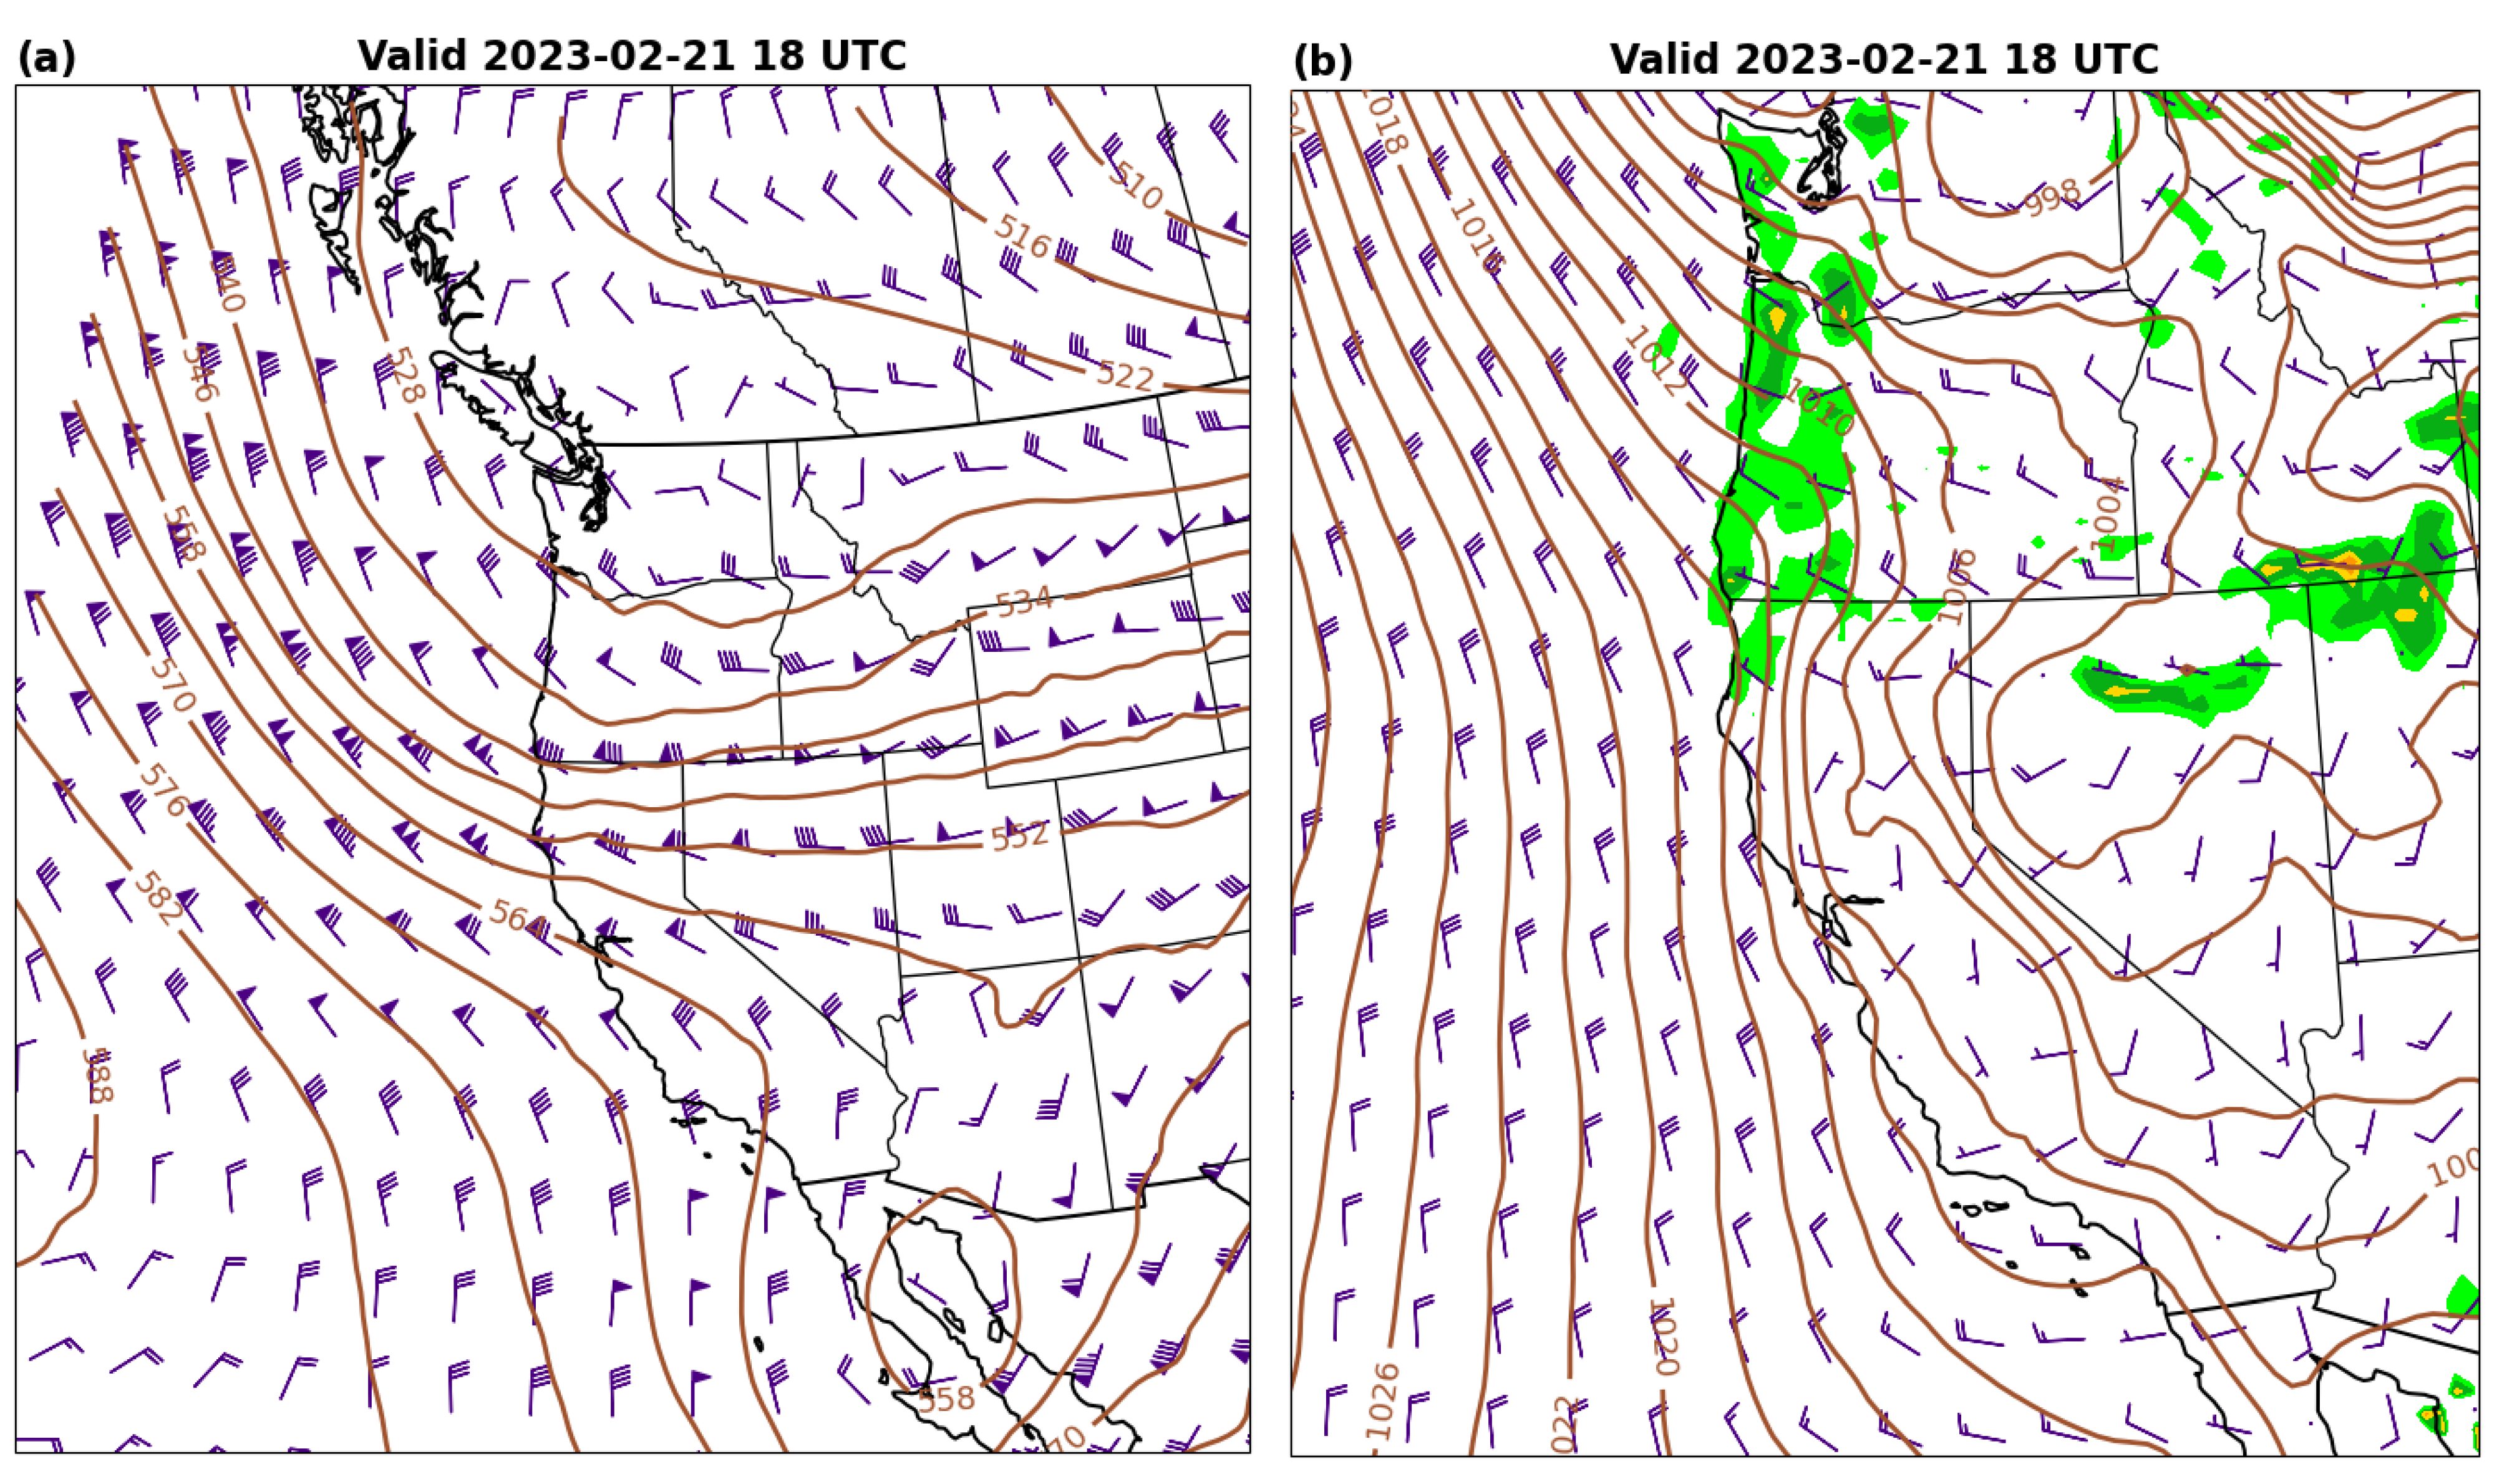
Figure 11.
As in Figure 6, except valid 21 March 2023 at 1200 UTC.
Figure 11.
As in Figure 6, except valid 21 March 2023 at 1200 UTC.
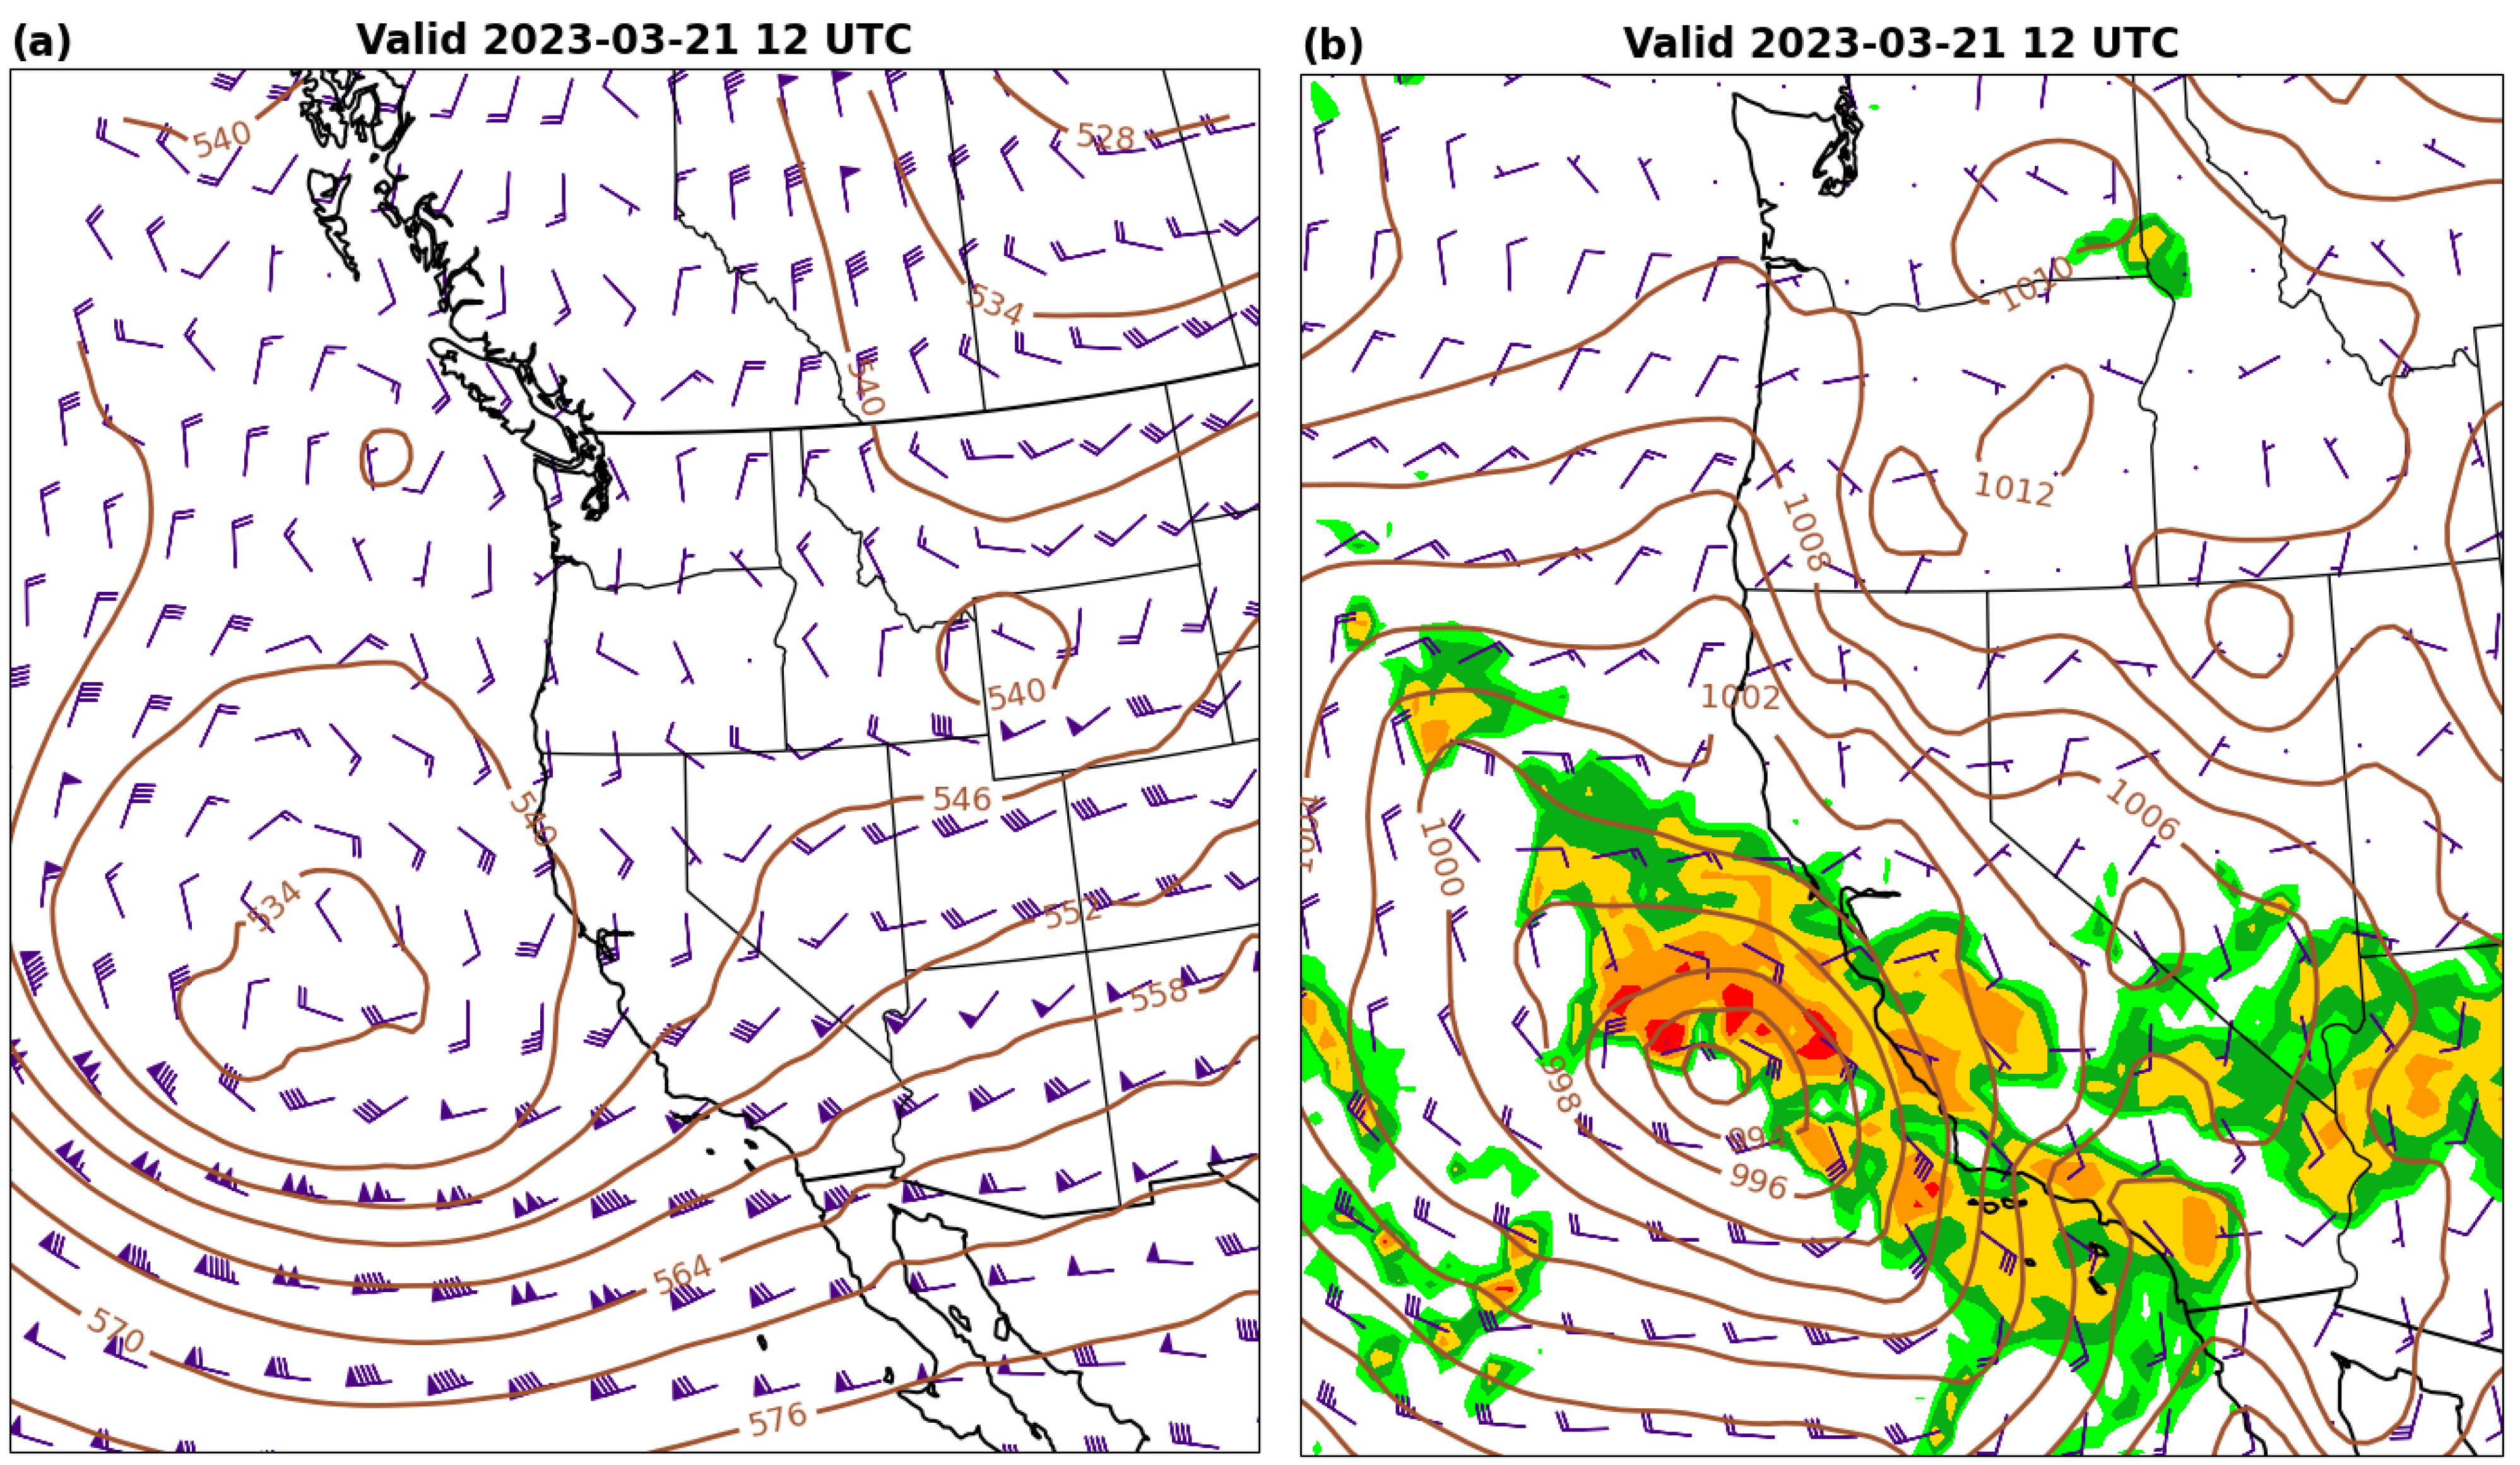
Figure 12.
Validation of experiments for all cases and observing networks combined. Variables shown are (a) all wind speeds; (b) wind speeds ≥ 5 m s–1; (c) wind speeds ≥ 10 m s–1; (d) temperature; and (e) vapor pressure deficit.
Figure 12.
Validation of experiments for all cases and observing networks combined. Variables shown are (a) all wind speeds; (b) wind speeds ≥ 5 m s–1; (c) wind speeds ≥ 10 m s–1; (d) temperature; and (e) vapor pressure deficit.
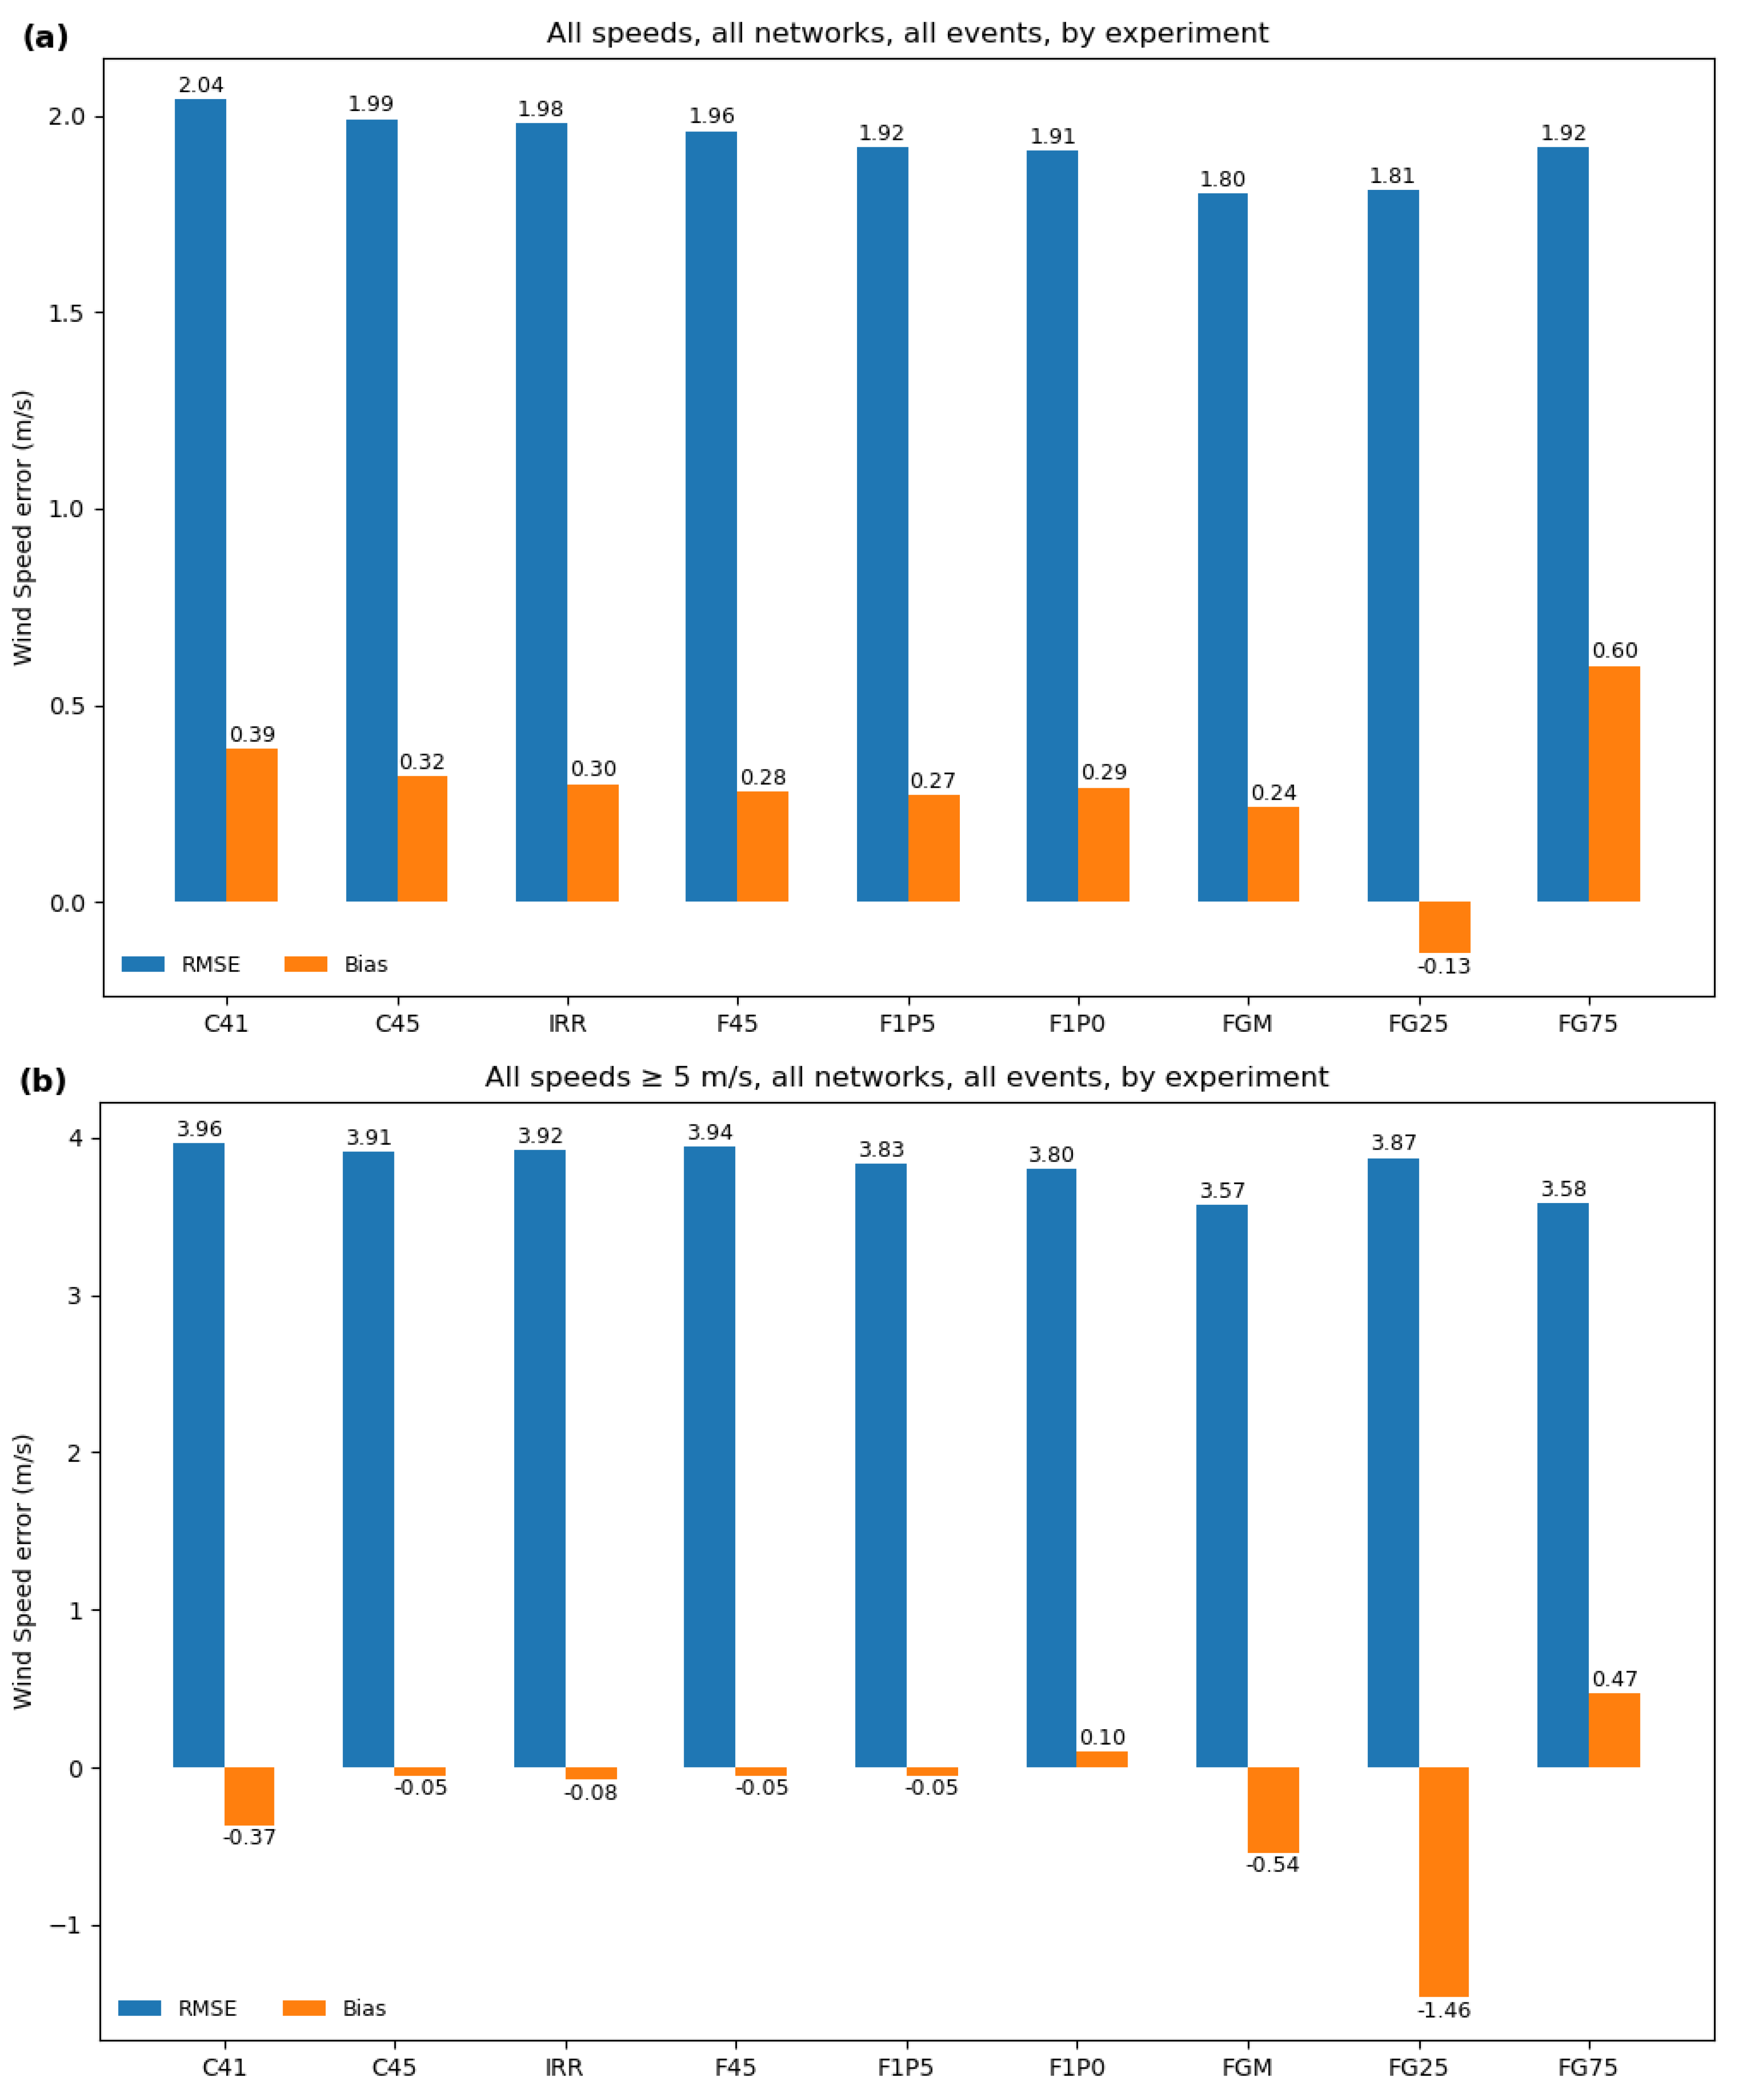
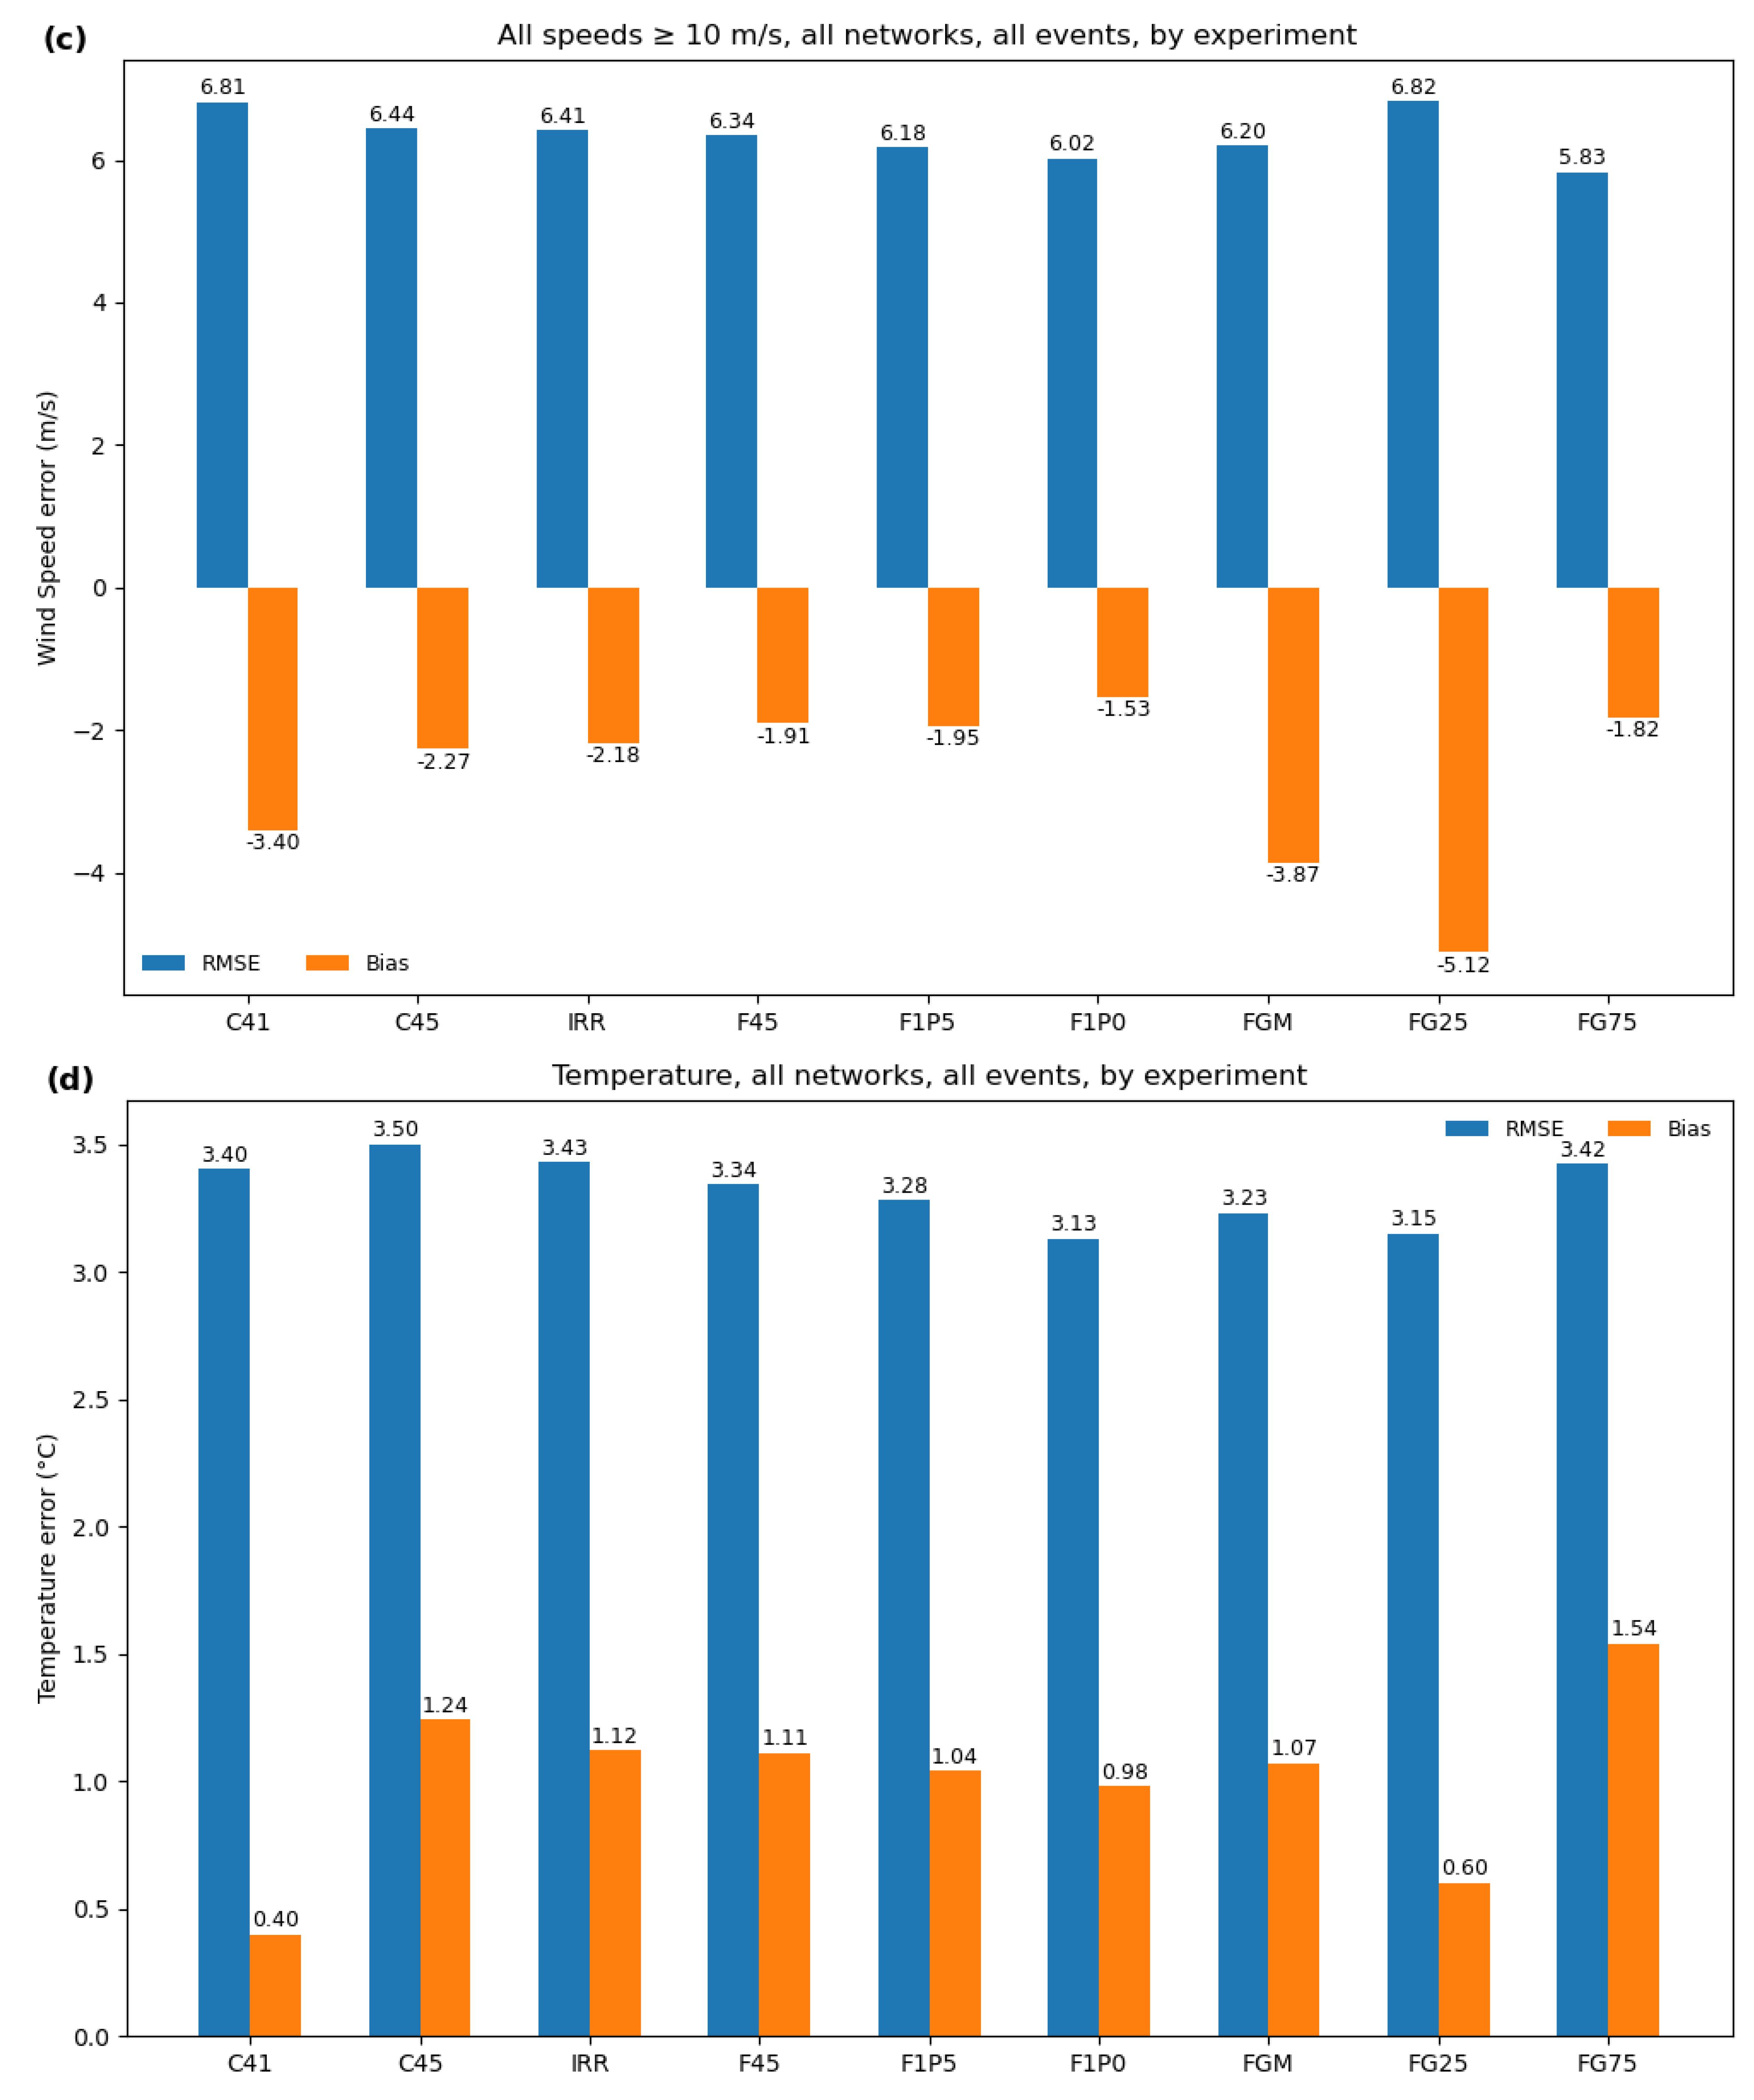
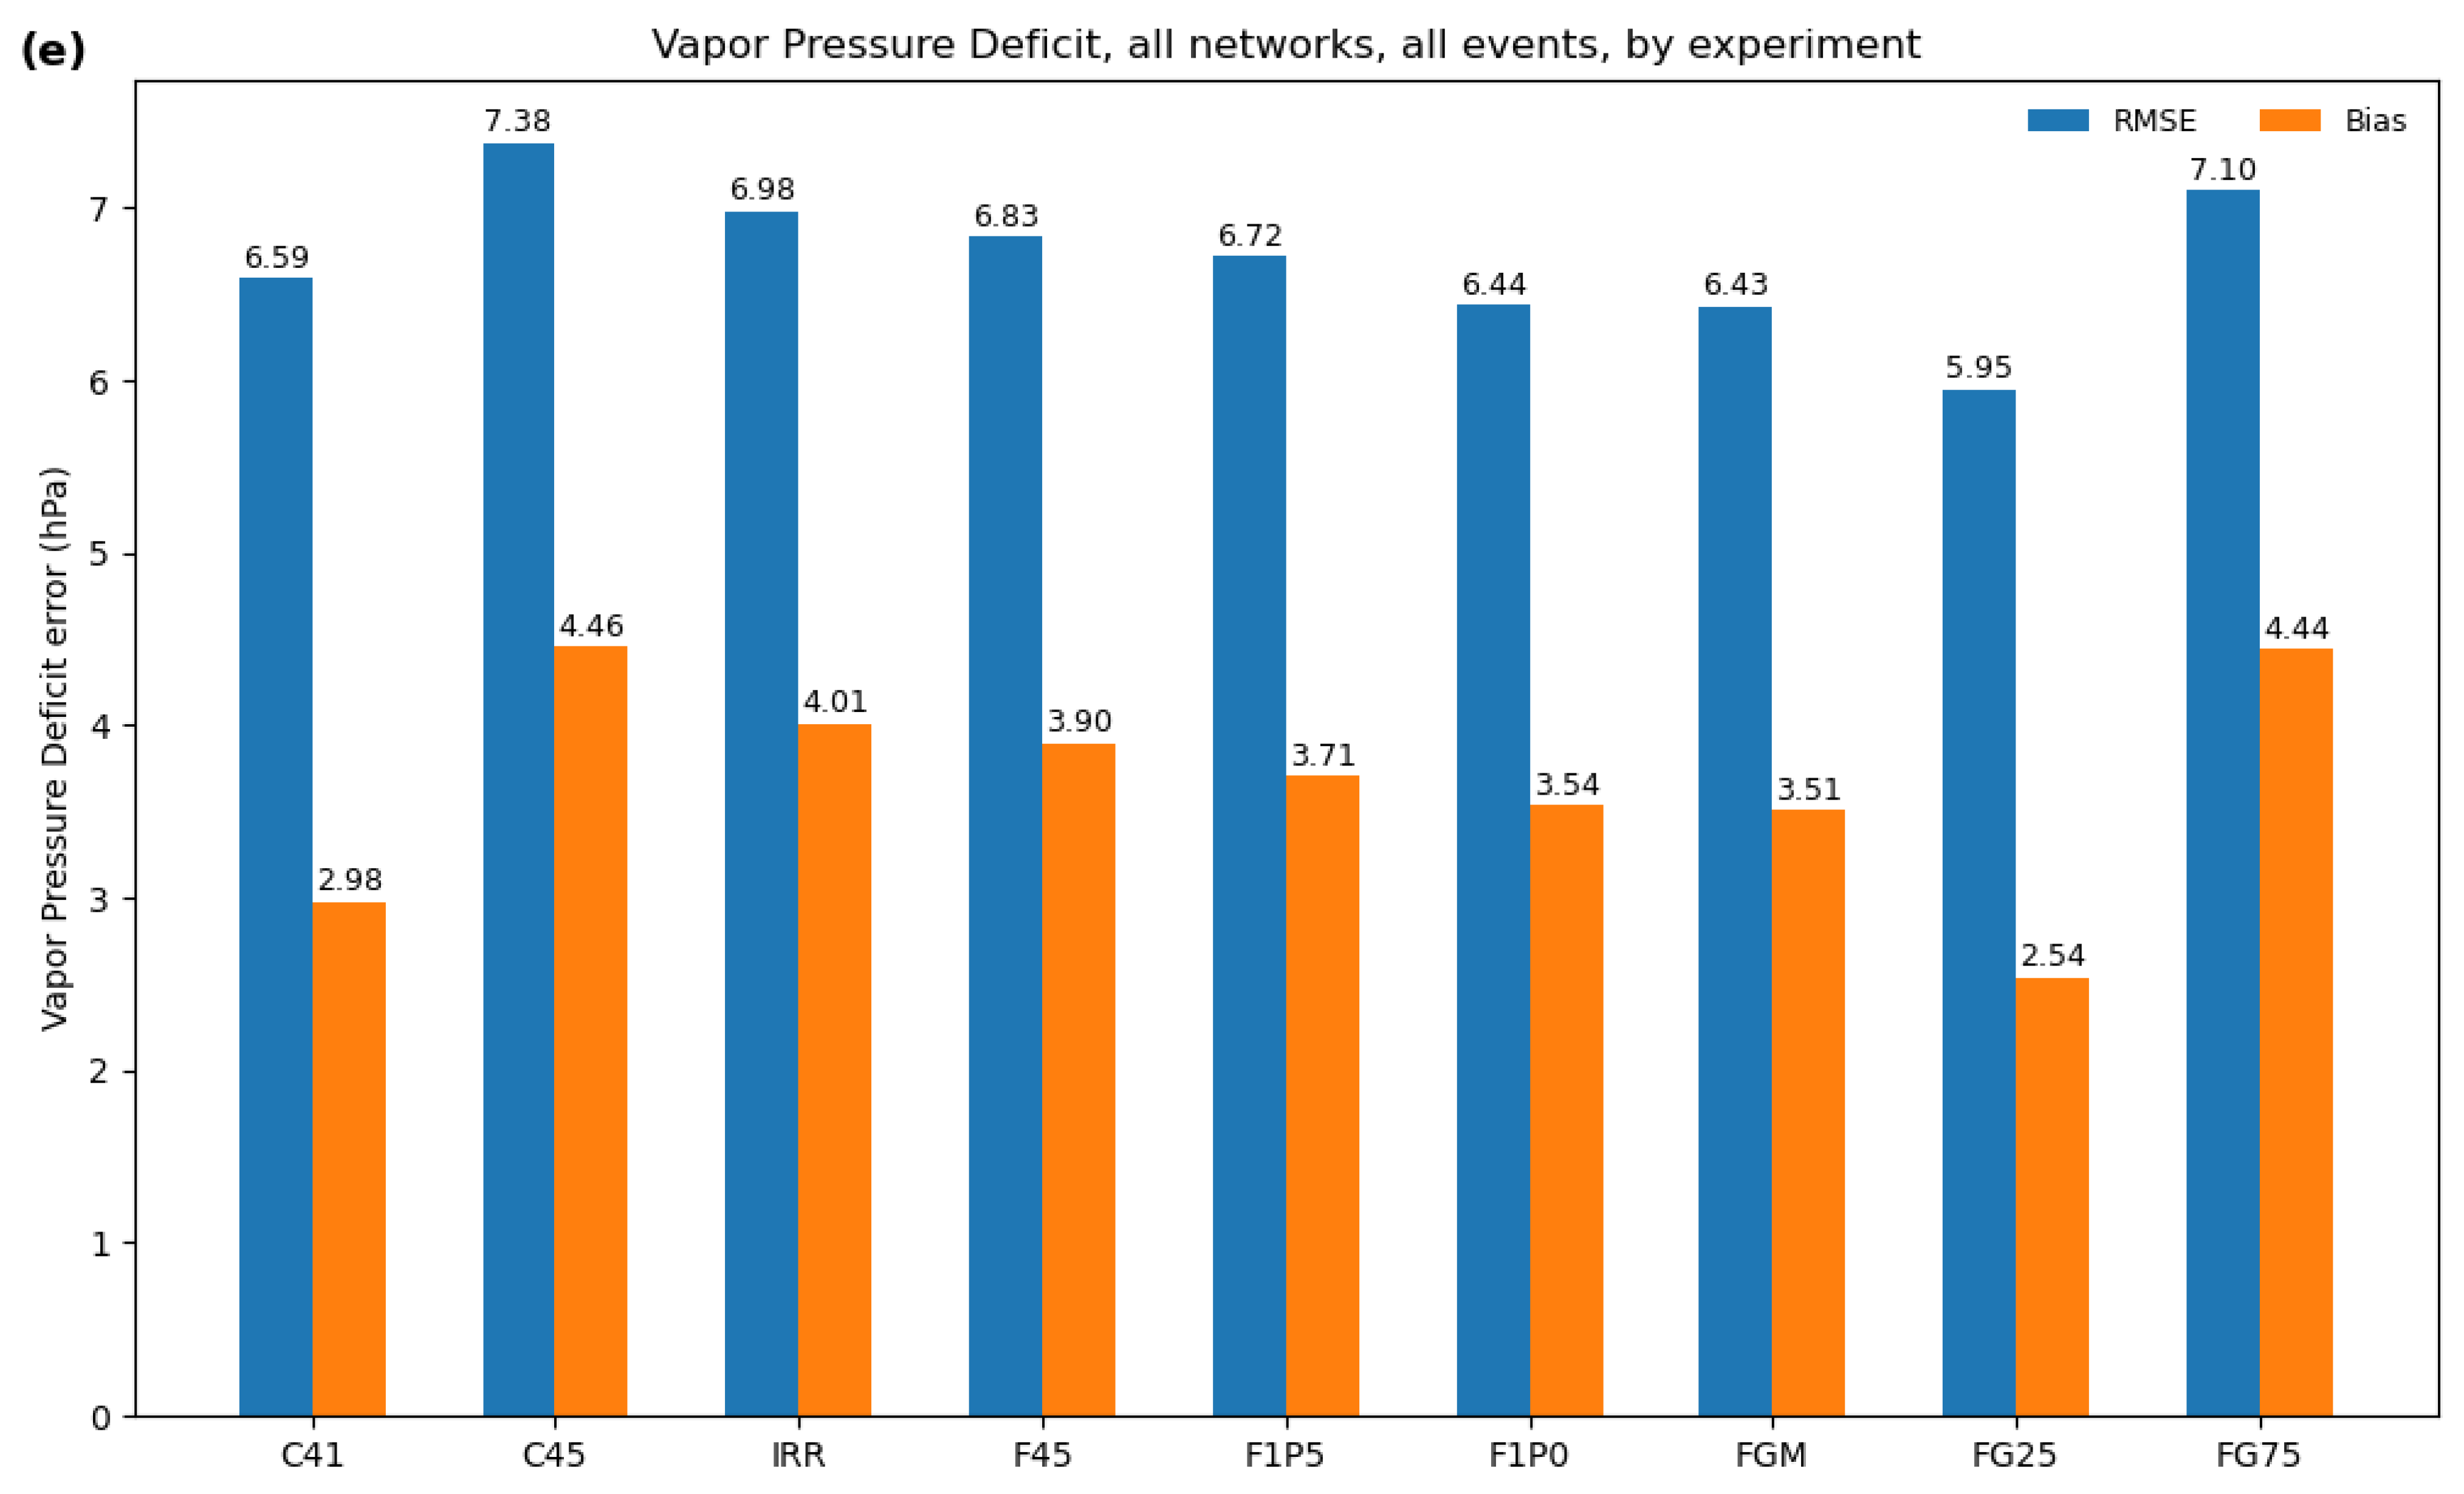

Table 1.
History of the PG&E Operational Mesoscale Modeling System (POMMS).
| POMMS Version | Year Implemented | WRF Version | Key Features |
|---|---|---|---|
| 1 | 2014 | 3.5.1 | Single 3-km grid using boundary conditions from a 12-km WRF run. |
| 2 | 2018 | 4.0.2 | Nested 3-km grid, MYNN surface layer scheme, RUC land surface model, 30-year reanalysis. |
| 3 | 2020 | 4.1.2 | Nested 2-km grid, Noah-MP land surface model, stochastically-perturbed ensemble, 30-year reanalysis. See text and Table 2 for details. |
| 4 | 2024 | 4.5.2 | Nested 2-km grid, irrigation triggered by crop growing season, a GEFS-based ensemble, and a 30-year reanalysis. |
Table 2.
Summary of settings for current WRF version 4.1.2 configuration.
| Parameter | Setting |
|---|---|
| Horizontal grid | 18-km outer grid with nests of 6- and 2-km. |
| Vertical grid | 51 levels with a 20 hPa top. Thickness of lowest level is 50 m. |
| Time step | Adaptive. Maximum time step is 144, 48, 16, and 5.33 sec on the respective grids, where the fourth value refers to the 0.67-km on-demand nests. For 0.67-km grids spanning the Sierra Nevada, the maximum time step is reduced slightly for stability (120, 40, 13.33, 4.44 sec). |
| Land use | MODIS 30-arcsec with lakes. Roughness length adjusted for two land use categories (See Table 3). |
| Radiation | Rapid Radiative Transfer Model for General Circulation Models (RRTMG) for both long- and shortwave radiation. |
| Land surface model | Noah-MP. Using climatological albedo and Leaf Area Index (LAI) from GEOGRID files. |
| Surface layer scheme | MYNN surface layer |
| PBL scheme | MYNN 3rd-order PBL scheme |
| Microphysics | Thompson microphysics, which has ice, snow and graupel processes suitable for high-resolution simulations, along with ice and rain number concentrations. The Kain-Fritsch cumulus parameterization is applied on the outer grid. |
| Diffusion and dispersion | Smagorinsky first-order closure is used for horizontal turbulent diffusion. Upper-level damping is applied. |
| Background models | GFS (0.25° grid) or ECMWF (0.125° grid). NOAA 1/12° SST analysis. |
| Data assimilation | 3DVAR data assimilation is applied on the outer grid at T-3 hours. Data assimilated include conventional surface and upper-air observations, aircraft data, and satellite-derived winds. |
Table 3.
Roughness length adjustment in MPTABLE.TBL.
| Category (LUINDEX) | Default value (m) | Adjusted value (m) |
|---|---|---|
| Evergreen Broadleaf Forest (2) | 1.10 | 0.70 |
| Urban (13) | 1.00 | 0.60 |
Table 4.
WRF experiments.
| Experiment ID | WRF Version | Grid Spacing (km) | Irrigation | Gravity Wave Drag | Description |
|---|---|---|---|---|---|
| C41 | 4.1.2 | 2.0 | No | No | POMMS v3 Control |
| C45 | 4.5.2 | 2.0 | No | No | POMMS v4 Control |
| IRR | 4.5.2 | 2.0 | Yes | No | Triggered irrigation |
| F45 | 4.5.2 | 2.0 | No | Option 1 (outermost two grids) | Final POMMS v4 configuration |
| F1P5 | 4.5.2 | 1.5 | No | Option 1 (outermost two grids) | Final POMMS v4 configuration (1.5-km grid) |
| F1P0 | 4.5.2 | 1.0 | No | Option 1 (outermost two grids) | Final POMMS v4 configuration (1.0-km grid) |
| FGM | 4.5.2 | 2.0 | No | Option 1 (outermost two grids) | Final POMMS v4 configuration (GEFS initialization, mean value) |
| FG25, FG75 | 4.5.2 | 2.0 | No | Option 1 (outermost two grids) | Final POMMS v4 configuration (GEFS initialization, 25th and 75th percentile) |
Table 5.
Horizontal grid spacing used in experiments. The top row is the baseline 2-km grid, while the bottom two rows are for higher-resolution experiments. The number of grid points is given in parentheses.
Table 5.
Horizontal grid spacing used in experiments. The top row is the baseline 2-km grid, while the bottom two rows are for higher-resolution experiments. The number of grid points is given in parentheses.
| Experiment | Outer Grid | Middle Grid | Inner Grid |
|---|---|---|---|
| All except F1P5, F1P0 | 18 km (270 × 270) | 6 km (316 × 316) | 2 km (397 × 481) |
| F1P5 | 22.5 km (150 × 157) | 7.5 km (208 × 229) | 1.5 km (531 × 641) |
| F1P0 | 15 km (206 × 217) | 5 km (256 × 289) | 1 km (796 × 961) |
Table 6.
Station counts for observing networks used in validation.
| Network | Number Used |
|---|---|
| ASOS | 44 |
| RAWS | 46 |
| PG&E Mesonet | 1152 |
Table 7.
List of case studies. Each WRF run is 120 h in duration. Validation periods are 48 or 72 h.
Table 7.
List of case studies. Each WRF run is 120 h in duration. Validation periods are 48 or 72 h.
| Case Number | Description | Classification | WRF Start Time (UTC) | Validation Start (UTC) | Validation Period (h) |
|---|---|---|---|---|---|
| 1 | Intense downslope windstorm | High winds; hot and dry | 2019-10-24 00:00 | 2019-10-25 00:00 | 72 |
| 2 | Late-season strong offshore wind event | High winds | 2021-01-17 00:00 | 2021-01-18 00:00 | 48 |
| 3 | Dixie Fire in northern Sierra Nevada | Hot and dry | 2021-07-11 12:00 | 2021-07-12 12:00 | 48 |
| 4 | Heat wave and Mosquito Fire (northern Sierra Nevada) | Hot and dry | 2022-09-04 00:00 | 2022-09-05 00:00 | 72 |
| 5 | Northwesterly wind event in central and Southern California | High winds | 2023-02-19 12:00 | 2023-02-20 12:00 | 48 |
| 6 | Late winter storm | High winds; heavy precipitation | 2023-03-19 12:00 | 2023-03-20 12:00 | 48 |
Table 8.
Validation of wind speeds by threshold and experiment for all cases and observing networks combined. Threshold values are for either the simulated or observed speed exceeding the threshold.
Table 8.
Validation of wind speeds by threshold and experiment for all cases and observing networks combined. Threshold values are for either the simulated or observed speed exceeding the threshold.
| Wind Speed (all speeds; m s–1) | Wind Speed (speeds ≥ 5 m s–1) | Wind Speed (speeds ≥ 10 m s–1) | ||||||||
|---|---|---|---|---|---|---|---|---|---|---|
| Experiment | N | RMSE | Bias | Correlation | N | RMSE | Bias | N | RMSE | Bias |
| C41 | 324769 | 2.04 | 0.39 | 0.48 | 63663 | 3.96 | -0.37 | 8406 | 6.81 | -3.40 |
| C45 | 324769 | 1.99 | 0.32 | 0.55 | 65346 | 3.91 | -0.05 | 9118 | 6.44 | -2.27 |
| IRR | 324769 | 1.98 | 0.30 | 0.56 | 64781 | 3.92 | -0.08 | 9226 | 6.41 | -2.18 |
| F45 | 324769 | 1.96 | 0.28 | 0.57 | 64669 | 3.94 | -0.05 | 9517 | 6.34 | -1.91 |
| F1P5 | 324769 | 1.92 | 0.27 | 0.60 | 64110 | 3.83 | -0.05 | 9306 | 6.18 | -1.95 |
| F1P0 | 324769 | 1.91 | 0.29 | 0.61 | 65071 | 3.80 | 0.10 | 9709 | 6.02 | -1.53 |
| FGM | 324769 | 1.80 | 0.24 | 0.65 | 60424 | 3.57 | -0.54 | 7744 | 6.20 | -3.87 |
| FG25 | 324769 | 1.81 | -0.13 | 0.62 | 54469 | 3.87 | -1.46 | 7280 | 6.82 | -5.12 |
| FG75 | 324769 | 1.92 | 0.60 | 0.65 | 69885 | 3.58 | 0.47 | 9225 | 5.83 | -1.82 |
Table 9.
Validation of temperature and vapor pressure deficit by experiment for all cases and observing networks combined.
Table 9.
Validation of temperature and vapor pressure deficit by experiment for all cases and observing networks combined.
| Temperature (°C) | Vapor pressure deficit (hPa) | |||||||
|---|---|---|---|---|---|---|---|---|
| Experiment | N | RMSE | Bias | Correlation | N | RMSE | Bias | Correlation |
| C41 | 328497 | 3.40 | 0.40 | 0.88 | 328490 | 6.59 | 2.98 | 0.82 |
| C45 | 328497 | 3.50 | 1.24 | 0.89 | 328490 | 7.38 | 4.46 | 0.84 |
| IRR | 328497 | 3.43 | 1.12 | 0.89 | 328490 | 6.98 | 4.01 | 0.84 |
| F45 | 328497 | 3.34 | 1.11 | 0.89 | 328490 | 6.83 | 3.90 | 0.85 |
| F1P5 | 328497 | 3.28 | 1.04 | 0.89 | 328490 | 6.72 | 3.71 | 0.85 |
| F1P0 | 328497 | 3.13 | 0.98 | 0.90 | 328490 | 6.44 | 3.54 | 0.86 |
| FGM | 328497 | 3.23 | 1.07 | 0.90 | 328490 | 6.43 | 3.51 | 0.86 |
| FG25 | 328497 | 3.15 | 0.60 | 0.90 | 328490 | 5.95 | 2.54 | 0.86 |
| FG75 | 328497 | 3.42 | 1.54 | 0.89 | 328490 | 7.10 | 4.44 | 0.85 |
Table 10.
Validation data counts by variable and event for each experiment.
| Case Number | Temperature | Vapor Pressure Deficit | All wind speeds | Winds ≥ 5 m s–1 | Winds ≥ 10 m s–1 |
|---|---|---|---|---|---|
| 1 | 42762 | 42758 | 41869 | 7860 | 1386 |
| 2 | 38248 | 38248 | 37975 | 19405 | 4002 |
| 3 | 51990 | 51989 | 51381 | 5896 | 408 |
| 4 | 88078 | 88077 | 81071 | 4920 | 58 |
| 5 | 53280 | 53279 | 52725 | 15939 | 2197 |
| 6 | 54139 | 54139 | 53748 | 10649 | 1466 |
| All | 328497 | 328490 | 324769 | 64669 | 9517 |
Disclaimer/Publisher’s Note: The statements, opinions and data contained in all publications are solely those of the individual author(s) and contributor(s) and not of MDPI and/or the editor(s). MDPI and/or the editor(s) disclaim responsibility for any injury to people or property resulting from any ideas, methods, instructions or products referred to in the content. |
© 2024 by the authors. Licensee MDPI, Basel, Switzerland. This article is an open access article distributed under the terms and conditions of the Creative Commons Attribution (CC BY) license (http://creativecommons.org/licenses/by/4.0/).
Copyright: This open access article is published under a Creative Commons CC BY 4.0 license, which permit the free download, distribution, and reuse, provided that the author and preprint are cited in any reuse.