Submitted:
26 August 2024
Posted:
27 August 2024
You are already at the latest version
Abstract
Road safety and the effectiveness of the transportation system as a whole are significantly impacted by driver comfort. Road surface quality can play a significant part in the driver’s comfort experienced on roads in any country. This study employs a Random Forest technique to examine the association between road roughness and drivers' comfort during long-distance driving. Using Random Forest, a dependable machine learning technique that can handle big datasets and detect nonlinear correlations, this work aims to shed light on the complex dynamics between road conditions and driver’s comfort. 1,048,576 rows of data from MIRANDA, an application developed at the University of Gustave Eiffel, were used in this study as part of the data collected from a probe vehicle. The data collected includes an International Roughness Index (IRI). The IRI thresholds offer a simple method for assessing driver comfort and road irregularity. While highlighting how uneven and uncomfortable the road is, the research's findings (Road Roughness: SD – 0.73; Driver's Comfort: - Mean, 10.01, SD – 0.64) also contribute to the standardization of road condition evaluation and maintenance communication. This finding is anticipated to aid in the development of strategies for improving the welfare of long-haul drivers and fixing road infrastructure to comply with standard road index, ultimately leading to the creation of more efficient and sustainable transportation systems.
Keywords:
road roughness
; driver’s comfort
; random forest
; long-haul
; transportation
; probe vehicle
; correlation
1. Introduction
Since long-haul road transportation makes it possible to carry goods across great distances, it is essential to the global economy. Despite its vital relevance, the comfort of driver’s during these lengthy drives is frequently disregarded. Uncomfortable driving circumstances, like those brought on by uneven roads, have been linked to driver weariness, a drop in attention span, and a higher chance of collisions, according to [1]. Due to its versatility, long-haul transportation is essential to international trade. But long-distance driving can be taxing on drivers, compromising both their safety and well-being due to its demanding nature. Long-haul truck drivers deal with a variety of difficulties while driving for extended periods of time, including exhaustion, tension, and discomfort. Long-haul drivers’ comfort has a significant impact on their safety, degree of weariness, and general well-being [2] as discomfort can lead to fatigue, musculoskeletal disorders, and ultimately, safety risks [3].
Road roughness is a major aspect that affects driving experience because it can affect comfort and pleasure in general on lengthy trips. This aligns with the studies conducted in [4,5], which indicated that extended exposure to unfavorable road conditions, like uneven pavements may result in driver fatigue, discomfort, and even musculoskeletal diseases. The presence of potholes, bumps, and uneven surfaces on a road can greatly affect how comfortable drivers are. According to [6], the performance of drivers, job satisfaction, and general well-being are all directly impacted by their level of comfort and contentment.
Furthermore, the level of discomfort brought on by bad road conditions can raise stress levels, impair the focus of a driver, and raise the likelihood of an accident [7]. Road roughness accounted for the majority of accidents recorded as its consequential drowsy effects result into drivers losing control, driving outside the designated lane, and consequently having a headon collision with oncoming vehicles or hitting external objects [8]. Therefore, the enhancement of road safety and maximizing the effectiveness of transportation systems require an understanding of the components, correlation and connection between road roughness and drivers’ comfort. Transportation authorities and legislators can improve road infrastructure and lessen the detrimental effects of bad road conditions on the well-being of drivers by examining how road roughness affects the comfort of drivers, gives priority to investments in road maintenance, contributes to infrastructure improvements as well as technological advancements. Moreover, cultivating a culture of road safety and sustainability requires advocating for and raising awareness of the significance of road conditions for driver comfort.
Understanding the connection between road roughness and driver’s comfort during long-distance driving is the focus of this study. The techniques used to investigate the relationships between various factors that affect a driver are frequently insufficient to fully capture their intricacies. This study’s primary goal is to investigate and clarify the intricate relationships between road roughness and the comfort of drivers during long-distance driving using the Random Forest machine learning technique. In doing so, the study hopes to offer insights that can help with enhancing the quality of life of a driver and guiding the upkeep and improvement of road infrastructure. This study is anticipated to provide significant advances to our understanding of how road roughness affects driver comfort as well as to our knowledge of the critical elements and relationships that cause discomfort when traveling long distances. The study encourages a data-driven decision-making approach by showcasing the effectiveness of Random Forest in conducting the correlation analysis, notably in capturing nonlinear correlations and handling huge, complicated datasets. In the end, it seeks to enhance the safety of long-haul drivers by addressing important issues influencing their working environment.
Research in the transportation sector has been using the Random Forest approach as well as other machine learning algorithms for tasks such as route optimization, traffic prediction, and safety analysis. The benefit of using the Random Forest approach include its capability of managing extensive and intricate datasets. Random Forests is a potent machine learning technique that can identify nonlinear correlations among variables [9]. Random Forests handle multidimensional data and find significant predictor variables when analyzing the relationship between road roughness and drivers’ comfort. Its capacity to produce precise forecasts and feature importance rankings makes it an excellent choice for examining the complex relationships between road roughness and driver comfort. Using Random Forest analysis, we can find subtle trends in the data that other statistical techniques would miss, giving stakeholders and policymakers in the transportation sector important new information to support decision-making. In order to provide a thorough understanding of the complex interaction between road conditions and drivers’ comfort during long-haul transportation, this study explores the use of Random Forest regression which is adept at handling complex, non-linear relationships [10]. Traditional methods for studying this relationship, such as surveys or simple statistical analysis, often struggle to capture the intricacies involved [11]. By leveraging Random Forest, we aim to gain a deeper understanding of how road roughness interacts with other factors to influence driver comfort in long-haul transportation.
2. Related Work
The impact of bumpy roads on driving habits, ride quality, and automobile performance has been the subject of earlier research. To evaluate the effect of road roughness on the comfort of drivers, related and relevant literature in this domain is discussed.
The expert-authored research study in [12] describes how to model the vibrational responses of a vehicle-driver coupling system addressing low-frequency vehicle vibration difficulties and determining joint parameters of the driver model through experimental data. The study predicts vehicle accelerations and simulates vertical vehicle vibrations using a radial basis neural network and random vibration theory. The best viscose damping for shock absorbers to reduce car body acceleration and the efficiency of neural networks in simulating intricate systems are two important discoveries. Using Gaussian functions, the radial basis neural network exhibits quick convergence and precise vertical vibration parameter predictions. According to the study’s findings, car vibrations can be efficiently analyzed using a neural network approach which has implications for improving vehicle dynamics analysis. Expanding the use of radial basis neural networks, experimenting with other basis functions, and examining the effects of various network designs and learning techniques on prediction accuracy are some of the research directions that have been suggested.
The study in [13] employs a neural network to investigate the connection between the IRI and pavement distress. It seeks to determine how well IRI serves as a pavement performance indicator and to comprehend the ways in which different types of distress affect IRI. The paper addresses the difficulty of effectively deciding road work operations and emphasizes the necessity for transportation ministries to have access to useful information. The study predicts IRI from distress ratings by analyzing data from pavement camera photos using a back-propagation neural network. The findings reveal a strong connection (0.944) between the distress measures and IRI, suggesting that IRI is a good indicator of pavement distress. The results demonstrate the differential impacts of various types of distress on IRI and validate that IRI is a dependable performance metric. The study comes to the conclusion that IRI makes inspection jobs easier and suggests using it for pavement management. It also suggests doing more research to extend the neural network model and investigate how repair tactics affect IRI over the long run.
In order to assist infrastructure managers in forecasting driver reactions and pavement loading, the work in [14] examines the dynamic interaction between road roughness and heavy vehicles. It discusses how road roughness affects heavy vehicles, with a particular emphasis on pavement dynamic wheel loading (DWL) and the sense of ride quality by drivers. The process comprised utilizing indices such as Profile Index (PIt) and Overall Root Mean Square Profile Elevation (ORMSPE), assessing DWL data, and employing RoadRuf software and power spectral density (PSD) analysis to create a roughness index from surface profile data. The study discovered that road roughness in several frequency bands closely predicts DWL and that low-frequency vibrations of the vehicle body have a substantial impact on perceived ride quality. The results emphasize the significance of taking into account both high-frequency and low-frequency vibrations when predicting DWL as well as the impact of variables like climate and subgrade soil type. The study concludes that road roughness has a major effect on heavy trucks and suggests more investigation into other aspects such as vegetation and maintenance history that affect pavement dynamic wheel loading.
The authors in [15] examine how road profiles acquired from laser profilometer measurements can be characterized using signal processing techniques, particularly power spectrum density (PSD) analysis and wavelet transform (WT). The work attempts to solve the difficulty of differentiating between deterioration processes by efficiently analyzing road roughness data to comprehend pavement structures and identify contributory factors. As analytical methods, PSD and discrete wavelet transform are used in the study to treat longitudinal profile data as a signal and look at the contained information. Two 100-meter trial roadway sections in Victoria, Australia provided the data. Wavelet-based analysis provides better diagnostic capabilities than PSD for multiresolution analysis and roughness assessment, successfully identifying high-frequency flaws like cracks and potholes, according to the results of wavelet decomposition of smooth and rough profiles. The results show that wavelet analysis helps with maintenance efforts by offering useful insights about pavement roughness and structural issues. In order to achieve more accuracy and efficiency, the study recommends conducting additional research to combine sophisticated signal processing techniques with other data sources. It concludes that signal processing, in particular wavelet analysis, is a viable strategy for detailed and precise road roughness analysis.
In order to establish comfort limits for road users, the authors in [16] focus on assessing road roughness and its effects on whole-body vibration (WBV). The primary goal is to create a relationship between road roughness as determined by the International Roughness Index (IRI) and the weight bearing variation (WBV) that drivers experience. Threshold values will be set for both indexes in order to evaluate comfort. In order to enhance road engineering techniques, the study links WBV to road unevenness indices, specifically the IRI, in order to address the problem of vehicle vibration caused by pavement roughness. In order to evaluate weighted vertical acceleration (a_WZ) as the WBV index in accordance with ISO standards, a vehicle model for dynamic simulations had to be created. At various speeds, a_WZ and IRI showed a strong association. In order to determine IRI and calibrate the vehicle model, data collecting involved measuring pavement geometry data. The results showed a considerable association between road roughness and WBV, with significant correlations (R2 from 0.75 to 0.93) found between a_WZ and IRI values. The results suggest threshold values for assessing road user comfort, which may be included in technical requirements for road design and upkeep. The study concludes that these threshold values must be set in order to evaluate comfort, and it suggests more research to create more intricate models in order to improve knowledge and road engineering techniques.
Using an instrumented test vehicle, the authors in [17] examine the effects of rough road surfaces on the ability to identify bridge frequencies. The main goal is to examine how road surface roughness affects the vehicle’s response and how it affects bridge frequency identification. The work tackles the issue of surface roughness causing vehicle spectrum distortion, which makes precise bridge frequency identification more difficult. The methodology consists of an approximation closed-form theory to analyze the influence of surface roughness and numerical simulations using vehicle-bridge interaction elements. Vehicle acceleration responses are recorded on bridges with different levels of roughness as part of data collecting, and bridge frequencies are extracted from these responses as part of data processing. Findings indicate that surface roughness can make it difficult to identify a bridge’s frequency; countermeasures are suggested. The results highlight how crucial it is to take road surface conditions into consideration for accurate bridge frequency detection. The study concludes that road roughness has a major impact on how vehicles respond to it and suggests more research to create sophisticated methods for enhancing bridge frequency recognition even in the presence of surface roughness.
The research work in [18] assesses the increases in dynamic load that cars impart to road surfaces as a result of surface irregularity vibrations. The primary goal is to ascertain the dynamic impacts brought about by the interaction of the vehicle and pavement, with a focus on evaluating the dynamic overload brought on by surface irregularities. By measuring the vibrational stress brought on by these abnormalities, the study addresses the problem of dynamic overload on road pavements. Methodologically, the Quarter Car Model (QCM) in Matlab® is used to assess the force transferred between the pavement and three vehicle types (car, bus, and truck). Road roughness profiles are developed in accordance with ISO 8608 criteria, indicating different damage levels. The dynamic overload caused by vibrational stress on pavements is revealed by the study’s analysis, which also demonstrates that pavement surface degradation can be used to forecast dynamic overload. The results shed light on the dynamic consequences of vehicle-road pavement interaction and offer recommendations for pavement upkeep and design. The study’s conclusion offers a helpful method for assessing vibrations brought on by surface irregularities and recommends that more research be done using a wider variety of road conditions and vehicle types to improve our knowledge of dynamic impacts on pavements. The author in [19] suggests using accelerometers and sensors incorporated into the car to monitor pavement conditions. The main objective is to present a new measure called the road impact factor (RIF) that is developed from accelerometer data in order to assess pavement roughness in an efficient and economical manner. The research discusses the drawbacks of existing ride-quality metrics, such as the costly and specialized international roughness index (IRI). The process comprised combining the spectral properties of the power spectral density (PSD) with the localization of the IRI to get the RIF and its time-wavelength-intensity-transform (TWIT). An inertial profiler based on laser data collecting confirmed the direct proportionality between RIF and IRI. Results showed that TWIT enables low-cost, repeatable performance metrics at various speeds, and that RIF and IRI are proportionate. According to the study, RIF and TWIT could offer more effective substitutes for conventional techniques for evaluating pavement roughness; additional investigation is advised to apply these indices in practical settings for better pavement management.
The goal of the study in [20] was to use GPS and Z-axis accelerometers to create an efficient and affordable system for calculating the International Roughness Index (IRI). The complexity and cost of traditional IRI measurement techniques, which are usually installed on full-size cars, make them impractical for temporary use. The researchers created a measurement system, modeled the relationship between Z-axis acceleration and IRI, and verified it with a small-scale field test. The outcomes showed that the new approach is an excellent substitute for conventional methods for pavement maintenance since it provides improved efficiency and good accuracy. It is advised to carry out extensive testing, investigate technology integration, and optimize the system further. The main objective of the authors in [21] was to create a predictive system for evaluating pavement roughness, with an emphasis on low-traffic highways in India. The bump integrator is a commonly used technique for evaluating road roughness. The main issue it addresses is its inherent speed limits, which lead to considerable biases when the survey speed deviates from the typical 32 km/h. In order to build a generalized equation for converting bump integrator values at different speeds to the standard speed, the process entails choosing 15 road segments and doing bump integrator tests at various speeds (20 to 50 km/h). Initial IRI values, age, faulting, traffic data, and transverse cracking severity levels are some of the factors that are collected when gathering data. To develop and validate the predictive models, the data is analyzed through SPSS’s linear regression analysis. The results show that different equations can convert BI values at varying rates; however, for wider applicability, a generalized equation is required. Results indicate that although the bump integrator works well, conversion equations are required due to its speed sensitivity in order to guarantee precise roughness readings. These conversion equations are developed as the study ends, and additional research is advised to improve the model and determine whether it can be used to different kinds of roads and conditions.
The goal of the authors in [22] was to provide a real-time method for using in-pavement strain sensors to continually evaluate road roughness. The main objective is to connect sensor data to current road roughness indices in order to give an economical approach. The study suggests a real-time approach utilizing in-pavement sensors to replace the time-consuming, expensive, and sporadic present methods. The methodology used theoretical and computational research, supported by field testing, to establish a link between stresses recorded by in-pavement sensors and the International Roughness Index (IRI). Glass fiber reinforced polymer packaged fiber Bragg grating (GFRP-FBG) sensors were used in data gathering. These sensors were placed in panels at MnROAD and calibrated throughout construction to provide a continuous road roughness report. The outcomes demonstrated a high degree of accuracy within 3.3% of the IRI estimations, demonstrating the efficacy of this approach. The results indicate that in-pavement strain sensors deliver more frequent and current information and represent a dependable, affordable, and real-time alternative for monitoring road roughness. The study’s recommendation for future research is to increase the application of in-pavement strain sensors in transportation engineering for better road infrastructure upkeep and monitoring. Road roughness has an effect on vehicle energy dissipation and fuel consumption, as examined in the research article [23]. The main objective is to measure the correlation between the parameters of road roughness and the fuel consumption of vehicles through an analysis of the rolling resistance energy dissipation process. The work employs a mechanistic model that incorporates random vibration techniques to predict fuel consumption, thereby addressing the difficulty of knowing how road roughness influences energy dissipation in a vehicle’s suspension system. The International Roughness Index (IRI) and dissipated energy were compared to data on road roughness profiles, vehicle dynamic characteristics, and energy dissipation in order to determine scaling correlations. Results show that dissipated energy is impacted by the road waviness number and the marginal probability distribution of road roughness profiles, and it scales with the square of IRI. The findings support engineering sustainability by highlighting the significance of taking road roughness into account when evaluating the environmental impact of pavement structures. The study comes to the conclusion that the mechanistic model is a useful tool for measuring how much road roughness affects fuel consumption. It suggests more research to improve the model and look at other variables influencing vehicle energy dissipation.
The authors in [24] conduct a study to measure the comfort and dread-zone borders of drivers in left turn across path/opposite direction (LTAP/OD) scenarios which are a significant cause of traffic deaths worldwide. In addition to introducing the dread zone, a narrower safety margin that drivers avoid but may enter in certain situations, it investigates the dynamic spatiotemporal envelopes within which drivers feel safe. Data on post encroachment time (PET), lateral acceleration, and self-reported comfort and risk were gathered under hurried and pleasant driving settings using a test-track experiment involving 22 drivers. The findings indicated that drivers that were in a hurry were willing to accept larger lateral accelerations and shorter time gaps, which are two important parameters influencing driver behavior. These results highlight the need for more research on how these zones change across various settings and populations in order to improve road safety, as these discoveries are critical for developing sophisticated driver assistance systems and autonomous cars.
The authors in [25] conducted a study financed by the German Federal Ministry of Transport and Digital Infrastructure which focuses on the evaluation of data on pavement evenness in three dimensions that are gathered by contemporary road mapping systems. It seeks to create relevant and useful methods for evaluating the evenness and roughness of road surfaces by applying cutting-edge data processing techniques. To precisely interpret the pavement profiles and advance road building and maintenance techniques, the research analyzes a range of statistical models and indexes. The study emphasizes how crucial precise pavement evaluation is to improve both driving comfort and road safety. In order to better understand how distress kinds like cracking, rutting, and raveling affect pavement roughness in the Jazan road network, the work in [26] examines the relationship between pavement condition evaluation and roughness measurements. Data collecting, correlation analysis, modeling the association between distress and the International Roughness Index (IRI), and utilizing statistical regression techniques to determine the model’s adequacy are all part of the approach. The findings show that whereas rutting has no effect on IRI, cracking and raveling do. The results emphasize how crucial it is to take various forms of distress into account when evaluating the quality of the pavement and the ride. The study suggests that for a more thorough pavement evaluation method, distress data and roughness measures should be integrated.
The authors in [27] present a practical and affordable compact road profiler that measures road roughness in real time using GPS and accelerometers. The primary goal is to improve pavement management systems (PMS) by offering precise data on road conditions that is combined with geographic information systems (GIS) for analysis and visualization. The study overcomes the drawbacks of conventional high-speed profilers by proving that the novel profiler which takes into account both inner and outer wheel path data, detects road roughness more accurately and increases monitoring accuracy. The importance of road class, local network, and seasonal fluctuations in PMS is highlighted by the findings. The paper makes recommendations for additional research to hone the technology and investigates wider applications as well as the implementation of this technology for municipal road management to enhance maintenance plans and user happiness. The goal of the study in [28] is to improve the reliability and accuracy of the iDRIMS system’s International Roughness Index (IRI) estimation process by utilizing frequency domain analysis. It overcomes earlier drawbacks, including susceptibility to sensor positions at different vehicle speeds and errors in IRI estimations. Using a genetic algorithm (GA) for parameter optimization, a half car (HC) model is implemented for vehicle modeling, and numerical simulations are run to assess performance. A smartphone-based system is used to gather data, which is then used to measure car responses, identify vehicle parameters through drive testing, and estimate IRI using acceleration responses. The outcomes show that the IRI estimate process is reliable, strong, and accurate. According to the study, this approach greatly increases the accuracy of IRI estimations under a variety of road conditions. It also suggests that this method be adopted for practical road condition evaluations and that it be further explored for real-world road assessments and scalability to different vehicles and road profiles.
The study in [29] focuses on Drainage Pavement (DP), Dense Particle Size Ascon (DPSA), and Dense Particle Size Gap Type Ascon (DPSGTA) to investigate the effects of various pavement types and ages on accident risk on urban expressway routes. The study defines accident risk as the number of accidents per vehicle kilometers traveled (VKT) using data on traffic accidents, road surface maintenance records, traffic volume, route geometry, and weather. It takes into account variables including weather, road shape, and pavement age. The results show that pavement age has a major impact on accident risk, and that friction, surface roughness, and permeability are important contributors in the incidence of accidents. By strengthening our knowledge of the connection between accident risks and pavement conditions, the research hopes to improve road safety and facilitate the creation of efficient pavement management techniques. Using the Roadroid smartphone app and a conventional inertial profiler, the study paper in [30] explores the “Use of a Smart Phone based Application to Measure Roughness of Polyurethane Stabilized Concrete Pavement,” with the goal of assessing these pavement sections. For long-term performance, it tackles the requirement to evaluate ride quality, surface elevation, surface deflection, and subbase/subgrade structural integrity. Both roughness measuring tools were used in the study, and ProVAL software was used to evaluate the data and produce the International Roughness Index (IRI). The standard profiler yielded more precise measures than Roadroid, which understated roughness because of fluctuations and small overcorrections according to the results. The results indicate that while Roadroid provides a more affordable option for less essential evaluations, traditional profilers are still required for high-volume roads that demand a high level of ride quality. The study concludes that Roadroid offers objective values at a lower cost than subjective evaluations and suggests more research to increase the accuracy of smartphone apps for pavement evaluation.
In order to assess road surface conditions, the study in [31] uses response-based methods. Its goals are to give a summary of contemporary approaches, highlight variations, and suggest future research emphasis areas. To address the dearth of a thorough analysis of response-based techniques currently used for road pavement applications, the study collected papers from the previous 15 years utilizing databases such as Scopus and Google Scholar. It looked at methods for measuring road profiles and detecting anomalies using onboard sensors and Internet of Things (IoT) technology. It discovered that machine-learning methods have potential but are limited by their reliance on data. The analysis of 130 publications showed that crowdsourcing, data aggregation, and GPS accuracy are enhancing algorithms for roughness index calculation and pothole identification. The results point to the necessity for more studies in the areas of fleet vehicle algorithms, active suspension systems, and raising estimation accuracy. In order to improve road surface assessment, the study’s conclusion makes recommendations for further research on GPS accuracy, data fusion, and crowdsourcing issues.
Sufficient road maintenance is essential for social benefits, cost savings, economic growth, and environmental impact mitigation. Road roughness is commonly quantified by the International Roughness Index (IRI) because of its correlation with road use costs. Evaluating the state of road networks is essential. Due to the high expense of traditional road roughness data gathering, smartphone accelerometers and GPS data are being investigated as a potential alternative for measuring vertical acceleration. The accuracy of smartphone applications varies, but recent developments indicate that they have the potential to provide real-time, network-wide road status assessments. Numerous variables, including vehicle type, speed, suspension, tire pressure, and driving style, affect how accurate these evaluations are. The application of machine learning and multivariate regression in predictive models has shown promise in providing precise road roughness estimation, hence facilitating both strategic and economical road management choices [32].
The goal of the study in [33] is to provide a machine learning pipeline that uses in-car sensors—specifically, vertical acceleration and driving speed—to estimate road roughness. It tackles the problem of ongoing road roughness monitoring which is required because roads deteriorate over time. The process entails gathering data from passenger car sensors and using supervised machine learning models, such as support vector machines, naive Bayes, random forests, linear regression, k-nearest neighbor, and multi-layer perceptron neural networks. The study shows that these models perform well in evaluating road conditions and can forecast road roughness with accuracy. The results imply that this technology is ideally suited for monitoring pavement conditions in the future improving the upkeep of road infrastructure and improving passenger safety. The study concludes that road roughness may be accurately estimated by machine learning models trained on sensor data. It suggests more research be done to investigate real-time implementation for useful road maintenance applications, extend datasets, and investigate advanced approaches. The goal of the study in [34] is to examine how road roughness—as measured by the International Roughness Index (IRI)—relates to the passenger’s whole-body vibration (WBV) at various vehicle speeds and road classifications. Over a distance of 1,860 km, data was gathered from nine passenger cars to measure WBV on the feet and seat surfaces. In contrast to vertical seat surface vibrations alone, the study found significantly lower thresholds for overall vibration values when using the RMS of frequency-weighted acceleration to propose IRI thresholds that drop with vehicle speed. The results highlight the necessity of using real vehicle vibration data rather than simulations to establish IRI criteria and highlight how crucial it is to take vehicle speed and road category into account for precise road roughness assessments and enhanced passenger comfort. More research on a wider range of road conditions and vehicle kinds is one of the recommendations of the study.
The study in [35] highlights the composition and longevity of asphalt pavement which has been in use since the 1920s and explores the role that pavement quality, in particular, plays in sustaining foot and vehicle activity. The study evaluates the viability of obtaining roughness data on various road networks using inexpensive smartphone sensors, highlighting the necessity of a smooth road surface for improved ride quality and resistance to deformation. Roughness data was gathered from 15 locations, which included federal, state, and highway roads using Huawei Nova 2i cellphones installed on a car using the Roadbounce technique. Repeated loads weaken pavement, causing surface degradation and roughening of the surface, according to the study. According to analysis, state roads were not as good for riding as expressway routes. For road condition surveys, the Roadbounce program is proven to be efficient and cost-effective, offering dependable roughness ratings for repair scheduling. In addition to taking into account vehicle operating expenses and implementing Roadbounce for roughness measures, the study advises local authorities to compare the results of the roughness index with those obtained using industry-standard profilers.
The goal of the research in [36] is to forecast mean free-flow speed (FFS) in urban arterials by applying machine learning algorithms. The primary goal is to increase road safety through the development of precise prediction models through machine learning (ML) approaches such as Random Forest (RF), Support Vector Machine (SVM), and Artificial Neural Network (ANN). The study uses data from 11 urban arterials to train models and test data from two roads for evaluation, taking into account traffic aspects, geometric characteristics, and pavement conditions. This helps to address the paucity of research on urban speeds and road characteristics in Jordan. The ML models’ superior performance over traditional linear regression shows how well they can forecast FFS and comprehend dynamic traffic dynamics. The results indicate that these models can improve planning, traffic control, and road safety; thus, local governments and transportation organizations should embrace them. To increase the generalizability of the model, future research should concentrate on utilizing data from various pavement conditions. In order to improve ride comfort, the authors in [37] look at the vibration characteristics of vehicles and uses the ISA algorithm to create comfortable speed plans. It provides a speed control method in order to alleviate the discomfort that uneven roads, particularly those with lower gradient, might bring. Using machine learning techniques, the process entails building a road recognition system, comfortable speed algorithms, and a simulation test platform for road roughness and vehicle vibration. Road recognition with machine learning and statistical feature extraction from vibration signals were two of the data collection methods. The car was found to be rather comfortable on A-grade roads but uncomfortable on B- and E-grade roads. The ride comfort was significantly enhanced by the ISA-based speed strategies. The study emphasizes how road slopes affect passenger comfort and suggests more research to maximize these tactics for different road conditions and car kinds.
The goal of the research in [38] is to develop a mathematical model that takes into account both vibrations caused by engines and vibrations caused by pavement roughness in order to establish a correlation between the two. The study shows that by examining how vehicles react to abnormalities in the pavement, a more accurate model for forecasting the International Roughness Index (IRI) is required. The research processes data from vehicle tests and roadway assessments using a quarter-car model and multiple analytical techniques like power spectral density analysis and Laplace transforms. The suggested model takes into consideration variables like driving speed and sample rate and shows better accuracy than current methods. The study improves knowledge of the interactions between vehicles and pavement and makes recommendations for further research to evaluate the model in various scenarios. In [39], Hanandeh further established that pavement management systems that include artificial neural networks (ANN) and genetic algorithms (GA) have demonstrated efficacy in forecasting and evaluating pavement conditions. A complete measure of pavement surface characteristics is provided by the Pavement Quality Index (PQI), which includes several indices such as the Ride Quality Index (RQI) and the Pavement Condition Index (PCI). With additional hidden layers, ANN models perform better and have demonstrated excellent accuracy in forecasting metrics like the International Roughness Index (IRI) and optimizing maintenance procedures. GA techniques, which are frequently combined with ANN, have improved resurfacing and shown even greater accuracy. In comparison to conventional methods, the combination of ANN and GA provides better forecasts and decision-making for pavement care, as demonstrated by case studies that include evaluations of streets such as Mecca and Medina.
The authors in [40] present a novel method for tracking the state of road pavement by utilizing video recordings and vibration data gathered from an e-bike and a personal sedan vehicle. The major goal is to enhance road quality maintenance by offering an accurate and economical way to monitor road pavement. The research tackles the exorbitant expenses and temporal limitations linked to conventional techniques. The technology uses vibration data and video records from test vehicles using sensors combined with dynamic monitoring tools. In addition to field inspections for the assessment of pavement quality, data gathering methods on test vehicles involve the use of a smartphone application at different speeds and iterations. The findings show that pavement monitoring may be accomplished with both private automobiles and e-bikes with the accuracy of the data being greatly impacted by travel speed and monitoring repetitions. The results highlight the significance of speed and frequency in data precision and imply that these vehicles are appropriate for pavement monitoring. The paper continues by providing motivations for the use of this technique for efficient road maintenance planning and quality improvement, and it suggests more research into variables including weather, traffic flow, and equipment precision. The work in [41] proposes an unsupervised learning-based system for road condition monitoring employing public transit buses as mobile sensors. The technology utilizes GPS and accelerometer data obtained from buses in conjunction with k-means and Self-Organizing Map (SOM) algorithms to determine damaged portions and evaluate the roughness of the road. The inferred road conditions are updated on a digital map to provide dynamic maintenance suggestions. The system was tested by using information from more than 1150 km of bus routes in Gujarat, India, and it proved to be a feasible solution for widespread use in detecting road roughness. The method provides a scalable, affordable alternative for repair scheduling and ongoing road condition monitoring.
In order to support sustainable transportation planning, the research in [42] aims to predict the International Roughness Index (IRI) of asphalt concrete pavement on arterial roads in Sri Lanka using cutting-edge machine learning algorithms. It tackles the problem of precisely forecasting road roughness, which is essential for pavement repair and upkeep. The study used pavement age and cumulative traffic volume as predictors and used five machine learning models, including Random Forest and XGBoost. The factor importance was interpreted using SHapley Additive exPlanations (SHAP) analysis, which improved model transparency. Analysis of data from 259 road segments revealed that machine learning models performed better than conventional regression, with Random Forest producing the most accurate forecasts. Results show that explainable AI techniques are superior at forecasting IRI which benefits road authorities by enabling them to schedule repairs on time, prolong pavement life, and encourage sustainability. The study finds that transportation engineers can benefit from explainable AI and recommends more research into more sophisticated methods and variables to increase forecast accuracy. In [43], Ali et al. describe the creation of models that use Multiple Linear Regression (MLR) and Artificial Neural Networks (ANNs) to estimate the International Roughness Index (IRI) based on pavement distress in different climate areas. The principal aim of this study is to examine the correlation between IRI and pavement distress by employing information from the Long-Term Pavement Performance (LTPP) database. Findings show that IRI can be predicted with accuracy using both MLR and ANN models, with ANN models outperforming MLR models. Significant relationships between IRI and pavement distress metrics are found in the study, indicating that these models may improve pavement management choices. It suggests investigating more variables and improving prediction models, with a focus on utilizing ANN approaches to improve pavement maintenance decision-making.
With a special emphasis on two-wheelers, the study in [44] examines the effects of pavement and geometric design parameters on run-off road crashes on rural two-lane roads’ horizontal curves. The study gathers information on crash frequencies, pavement surface conditions, and geometric design factors and uses Generalized Estimating Equations (GEE) to analyze crash data and geometric design features. Important discoveries show that variables like cross-slope, sight distance, and curve radius have a big impact on crash frequencies. In order to enhance safety outcomes, the study emphasizes the significance of integrating these geometric design qualities into road safety interventions and suggests doing so in road design and maintenance procedures. It is advised to conduct more research to examine other variables influencing crash frequencies. The problem of subjective and manual evaluations in gravel road maintenance is addressed in the study [45]. The principal aim was to devise a mechanism for evaluating road conditions by amalgamating audio and picture data. GoPro cameras and audio recordings were used to gather data on gravel roads in Sweden. The data was then processed to identify pertinent areas and created into spectrograms. After comparing feature-level and decision-level fusion methods, the study concluded that the OR gate decision-level method was the most successful. Findings indicated that this technique could improve objective, real-time assessments of road conditions and could be used with inexpensive devices such as cellphones. According to the study’s findings, combining auditory and visual data gives a viable, affordable, and precise way to maintain gravel roads. It also has the potential to include the community and lead to future technical breakthroughs.
The literature demonstrates a restricted use of particular machine learning methods, such as the Random Forest approach, to examine the connection between road irregularity and driver comfort. Although a number of different algorithms are discussed, not enough is known about how Random Forest in particular might offer insights into passengers’ comfort levels when traveling long distances. Thus, by examining vertical acceleration data, this study focuses on the ability of Random Forest algorithms to forecast and evaluate driver comfort.
3. Methodology
To ensure an effective evaluation that gives the desired result, this study adopts subjective and objective assessment approaches. For the objective assessment, we employ the use of MIRANDA, a mobile application developed at the University of Gustave Eiffel, France. The application which is loaded on a smartphone is mounted on a driver’s vehicle, and captures and records the acceleration of the vehicles’ movements as well as other variables. For the subjective assessment, the study subjected the data collected through objective assessment to further computation using python scripts to calculate the magnitude of the acceleration from which the road roughness level was determined. The driver’s comfort level was also computed from the acceleration values (x, y, and z) alongside the acceleration magnitude. The data captured from these two assessments were then subjected to random forest machine learning analysis to evaluate the road roughness level and predict the driver’s comfort level. Using many decision trees and combining their predictions, Random Forest as a supervised machine learning technique, increases accuracy and robustness. In order to model the association between road roughness and drivers’ comfort, the analysis was further subjected to Pearson and Spearman Correlation analysis to evaluate the correlation between the driver’s comfort and the status of the road.
Table A1 and Table A2 (Appendix A and Appendix B) show the data collected and the one computed from it, while Figure 1 is the system model.
3.1. Detailed Analysis of the Model’s Components
3.1.1. Initializing and Loading MIRANDA App
The device used for measurement is an Android smartphone. The device utilized was a 6.5-inch Blackview BV9200 Rugged Smartphone running Android 12 with 256 GB of RAM, a 50 Megapixel camera, and 3G/4G connectivity. Raw data is provided by the sensors included in most smartphones (time, acceleration, GPS locations, etc.). The Miranda (Measurement of Road Indicators by Nomadic devices) application is installed on smartphones. The measurement session is managed by the Miranda application which also handles setting, survey activation and deactivation, measurement file production, and other tasks. During the test drive, the smartphone is integrated into a probe vehicle and utilized to gather data. Over the course of the data collection, eight (8) different probe vehicles were used. From these, 5,242,880 rows of data were generated; however, due to the maximum number of rows an Excel file could return, only 1,048,576 rows of data could be captured and used for this study.
3.1.2. The Server and Database
The gathered data is sent to a back-end server where the data is automatically analyzed to produce an estimated road profile and the associated indicator. An uploaded database contains the completed data/information. The finished data/information is uploaded to a database.
3.1.3. Converted & Merged Zipped Data
The data generated through the MIRANDA app and the sensor-based smartphone, were stored as zip files (https://filesender.renater.fr/?s=download&token=64a52d74-9a45-4747-9c47-9859095abcb1). Figure 2 and Figure 3 show the python scripts written to convert and also merge the various zip files/folders.
3.1.4. Preprocessing and Feature Selection
The collected data was further processed using data cleaning techniques (removal of incomplete/missing data). A filter feature selection technique was deployed to remove noisy or unwanted/irrelevant features. Figure 4 and Figure 5 show the python scripts used in some preprocessing done and direct selection of variables/columns from the study’s dataset.
3.1.5. Data Splitting
Data splitting involves partitioning the dataset into subsets to enhance training and testing. For this study, the dataset is divided into training dataset and testing dataset in the proportion of 80:20. Figure 6 is the python code snippet used for the splitting.
3.1.6. Model Initialization and Training
As a common practice in machine learning, the random initialization seed value is 42 to ensure consistency and reproducibility of results. The model training (X_train and y_train) was specified to allow the model to learn how the independent variables relate to the dependent variables. Figure 7 presents the python scripts that were used for this.
3.1.7. Model Prediction, Model Evaluation and Correlation Outputs
To avoid overfitting, the prediction is carried out on x_test data. This also assisted in ensuring that our model generalizes to new, unseen data. Performance evaluation (using Mean Squared Error (MSE), Mean Absolute Error (MAE) and R-Squared (R2) metrics) are also computed by predicting on the x_test data. Figure 8 shows the python codes executed to carry this out and also some outputs; Figure 9 and Figure 10 show the correlation analysis and plots, respectively, using both Pearson and Spearman’s correlation types.
4. Results and Discussion
4.1. The Model
As stated in 3.1.7, the random forest regression model was evaluated using the metrics: Mean Squared Error (MSE), Mean Absolute Error (MAE) and R-Squared (R2) (Equations (1)–(3))
where:
n—number of data points/observations (1,048,576 rows of data)
—actual value of the target variable (accl_magnitude) for the i-th data point
—predicted value of the target variable (accl_magnitude) for the i-th data point
—squared difference (or error) between actual and predicted values for each data point
where:
n—number of data points/observations (1,048,576 rows of data)
—actual value of the target variable (accl_magnitude) for the i-th data point
—predicted value of the target variable (accl_magnitude) for the i-th data point
—absolute difference (or error) between actual and predicted values for each data point
where:
SSres -- the residual sum of squares
SStot - - the total sum of squares
n—number of data points/observations (1,048,576 rows of data)
—actual value of the target variable (accl_magnitude) for the i-th data point
—predicted value of the target variable (accl_magnitude) for the i-th data point
—mean value of the actual values of the target variable
The results computed show:
Mean Squared Error (MSE): 0.0005853207475788095
Mean Absolute Error (MAE): 0.004572441049036803
R-squared (R²): 0.9985087891157983
The results of this random forest regression model show that the model has operated successfully. The very low MSE value of 0.00059 shows how well the model’s predictions match the actual values. A low MSE indicates that large errors are extremely infrequent because squaring the errors penalizes larger errors more severely. Additionally, the MAE value of 0.00457 is quite low, meaning that the average error of the forecasts is only 0.00457 units. This tiny inaccuracy serves as additional proof of the model’s excellent forecast accuracy. An R-squared score of 0.9985 indicates that the features included in the model account for about 99.85% of the variance in the target variable (accl_magnitude). This is a very high number, meaning that practically all of the data variability is captured by the model.
4.2. The Metrics
Road roughness is commonly measured using the International Roughness Index (IRI), which is a commonly recognized standard. Road roughness is measured in meters per kilometer (m/km), with rougher roads denoted by greater numbers. Table 1 and Table 2 show the comparison between the IRI values and relevant acceleration measures, such as the acceleration magnitude (accl_magnitude) and standard deviation of vertical acceleration (accl_z), for road roughness and driver comfort levels, as presented in this study.
With the study’s computed results of:
Road Roughness Level (Standard Deviation of accl_z): 0.7288071585301953
Driver’s Comfort (Mean of accl_magnitude): 10.0101394667174
Driver’s Comfort (Standard Deviation of accl_magnitude): 0.6411496881655732
The Road Roughness Level (Standard Deviation of accl_z) of 0.7288 falls within the Moderately Rough category which corresponds to an IRI value between 2 to 4 m/km. This suggests that the road condition is average, with noticeable vertical movement.
The Driver’s Comfort (Mean of accl_magnitude) of 10.0101 m/s² and (Standard Deviation of accl_magnitude) of 0.6411 m/s² places the ride in the Uncomfortable category. This corresponds to an IRI value between 4 to 6 m/km. This indicates that the road conditions are rough enough to cause discomfort during driving.
4.3. The Correlation Matrix
From Figure 10a, there is a moderate negative correlation (-0.48) between accl_x and accl_y, meaning that increases in accl_x typically lead to decreases in accl_y. The association between accl_x and accl_z is weak (-0.14), and there is a modest inclination for accl_z to decrease as accl_x grows. The very poor positive correlation (0.10) between accl_x and accl_magnitude suggests that there is hardly any linear relationship between the two variables. For accl_y and accl_z, a moderately positive correlation (0.32) indicates that there may be some relationship between increases in accl_y and rises in accl_z. Increases in accl_z are strongly correlated (0.74) with increases in accl_magnitude, suggesting a strong positive relationship between the two variables. For time and other variables, there is no significant linear relationship between time and the other variables, as evidenced by the extremely weak correlations (from -0.02 to 0.26) with the acceleration components.
In a nutshell, the matrix shows that there is a substantial correlation (0.74) between the variables accl_z and accl_magnitude, suggesting a close relationship between them. Furthermore, accl_x and accl_y have a moderately negative association (-0.48), while accl_y and accl_z have a moderately positive correlation (0.32). On the other hand, time has weak correlations with the other variables, indicating that it does not have a significant and linear impact on the acceleration readings.
4.4. Implication of Findings
The results of this study have important ramifications for transportation agencies and decision makers in government. By prioritizing smoother road surfaces and minimizing discomfort and safety hazards for long-haul drivers, infrastructure investments and maintenance strategies can be guided by an understanding of the influence that road roughness has on drivers’ comfort. Additionally, the application of Random Forest analysis highlights the usefulness of machine learning in managing complicated datasets and capturing non-linear correlations, both of which can be extended to other transportation-related research fields. The study emphasizes the potential for raising driver well-being, lowering accident rates, and fostering a culture of road safety and sustainability through better road conditions.
5. Conclusion, Recommendation and Suggestions for Further Research
By clarifying the complex relationship between road roughness and drivers’ comfort, this study adds to the expanding corpus of research on road transportation. The study’s conclusion highlights how important road conditions are in affecting long-haul drivers’ comfort and safety. The use of Random Forest regression has shed important light on the complex interactions between driver discomfort and road roughness. It is advised that transportation authorities give road maintenance and infrastructure upgrades first priority in order to promote driver well-being and lower safety hazards, especially in areas that largely rely on long-haul transportation. To get a more thorough understanding of the variables affecting driver comfort, it is advised that future study investigate the inclusion of further factors such vehicle type, speed, and driver characteristics into the analysis. Furthermore, the broadening of the study to include other road conditions and geographic areas can offer a more comprehensive understanding of the findings’ worldwide application. The usefulness of cutting-edge technologies, including real-time road monitoring systems, in reducing the negative effects of uneven roads on driver comfort may also be the subject of future study.
Author Contributions
Conceptualization, K.A.M., D.K., and D.L.; methodology, A.O.O.; software, A.O.O.; formal analysis, A.O.O.; investigation, A.O.O.; resources, A.O.O.; data curation, A.O.O.; writing—original draft preparation, A.O.O.; writing—review and editing, K.A.M., D.K., D.L. and A.O.O.; visualization, A.O.O.; supervision, K.A.M., and D.L. All authors have read and agreed to the published version of the manuscript.
Funding
This project is made possible through funding received from The Transport and Education Training Authority (TETA), project number: TETA22/R&K/PR0011.
Institutional Review Board Statement
Not applicable
Informed Consent Statement
Not applicable
Data Availability Statement
Not applicable.
Acknowledgments
The authors appreciate the funding provided by The Transport and Education Training Authority (TETA) for the execution of this research project. The encouragement and enabling environment from Tshwane University of Technology (TUT) is herewith appreciated.
Conflicts of Interest
The authors declared no conflict of interest.
Appendix A

Table A1.
Originally Converted and Extracted Data (few rows…).
| s/n | Temps Acquisition (ms) | Latitude | Longitude | Précision (m) | Vitesse (m/s) | Acceleration x (m/s²) | Acceleration y (m/s²) | Acceleration z (m/s²) | Gyro x (rad/s) | Gyro y (rad/s) | Gyro z (rad/s) | Magneto x (mGauss) | Magneto y (mGauss) | Magneto z (mGauss) | Azimut auto (°) | Tangage auto (°) | Roulis auto (°) | Azimut_accMagnet (°) | Tangage_accMagnet (°) | Roulis_accMagnet (°) |
| 1 | 0 | -26 | 28.3 | 4.4 | 0.04 | 0.13 | -4 | 9.1 | -0 | 0 | 0 | -35 | -18 | 117 | 46.3 | 23.2 | 1.6 | 52.3 | 23.3 | -1.9 |
| 2 | 7 | -26 | 28.3 | 4.4 | 0.04 | 0.16 | -4 | 9.45 | -0 | 0 | 0 | -35 | -18 | 117 | 46.3 | 23.2 | 1.6 | 52.7 | 23 | -1.6 |
| 3 | 10 | -26 | 28.3 | 4.4 | 0.04 | 0.34 | -3.9 | 9.31 | 0 | 0 | 0 | -35 | -18 | 117 | 46.3 | 23.2 | 1.6 | 52 | 22.7 | -0.9 |
| 4 | 15 | -26 | 28.3 | 4.4 | 0.04 | 0.45 | -3.9 | 9.05 | -0 | 0.01 | 0 | -35 | -18 | 117 | 46.4 | 23.2 | 1.6 | 54.3 | 22.5 | -2.1 |
| 5 | 24 | -26 | 28.3 | 4.4 | 0.04 | 0.23 | -3.8 | 9.12 | -0 | 0 | 0 | -35 | -18 | 117 | 46.4 | 23.2 | 1.6 | 54.4 | 23.1 | -2.8 |
| 6 | 24 | -26 | 28.3 | 4.4 | 0.04 | 0.15 | -4 | 9 | -0 | 0 | 0 | -35 | -18 | 117 | 46.4 | 23.2 | 1.6 | 52.7 | 22.9 | -1.5 |
| 7 | 30 | -26 | 28.3 | 4.4 | 0.04 | 0.34 | -4 | 9.17 | -0 | 0 | 0 | -35 | -18 | 117 | 46.4 | 23.2 | 1.6 | 50 | 23.8 | -0.9 |
| 8 | 35 | -26 | 28.3 | 4.4 | 0.04 | 0.3 | -4 | 9.5 | -0 | -0 | -0 | -35 | -18 | 117 | 46.4 | 23.2 | 1.6 | 52.6 | 23.5 | -2.1 |
| 9 | 41 | -26 | 28.3 | 4.4 | 0.04 | 0.14 | -3.9 | 9.4 | -0 | 0 | 0 | -35 | -18 | 117 | 46.4 | 23.2 | 1.6 | 53.1 | 23 | -1.8 |
| 10 | 44 | -26 | 28.3 | 4.4 | 0.04 | 0.26 | -4 | 9.45 | -0 | 0 | 0 | -35 | -18 | 117 | 46.4 | 23.2 | 1.6 | 51.9 | 22.7 | -0.9 |
| 11 | 49 | -26 | 28.3 | 4.4 | 0.04 | 0.38 | -3.9 | 9.31 | -0 | -0 | 0 | -35 | -18 | 117 | 46.4 | 23.2 | 1.6 | 53 | 22.8 | -1.6 |
| 12 | 57 | -26 | 28.3 | 4.4 | 0.04 | 0.3 | -4 | 9.06 | -0 | 0.01 | 0 | -35 | -18 | 117 | 46.4 | 23.1 | 1.6 | 54.4 | 22.7 | -2.3 |
| 13 | 59 | -26 | 28.3 | 4.4 | 0.04 | 0.2 | -3.9 | 9.16 | -0 | 0 | 0 | -35 | -18 | 117 | 46.4 | 23.2 | 1.6 | 51.9 | 23.7 | -1.9 |
| 14 | 64 | -26 | 28.3 | 4.4 | 0.04 | 0.35 | -4.1 | 9.12 | -0 | 0 | 0 | -35 | -18 | 117 | 46.4 | 23.1 | 1.6 | 51.5 | 23.3 | -1.3 |
| 15 | 74 | -26 | 28.3 | 4.4 | 0.04 | 0.46 | -4 | 9.33 | -0 | -0 | 0 | -35 | -18 | 117 | 46.4 | 23.1 | 1.6 | 51.9 | 24 | -2.2 |
| 16 | 75 | -26 | 28.3 | 4.4 | 0.04 | 0.24 | -4 | 9.43 | -0 | -0 | 0 | -35 | -18 | 117 | 46.4 | 23.2 | 1.6 | 54.1 | 23.4 | -2.8 |
| 17 | 80 | -26 | 28.3 | 4.4 | 0.04 | 0.12 | -3.9 | 9.41 | -0 | 0 | 0 | -35 | -18 | 117 | 46.4 | 23.2 | 1.6 | 52.4 | 23 | -1.4 |
| 18 | 85 | -26 | 28.3 | 4.4 | 0.04 | 0.39 | -3.9 | 9.44 | 0 | 0 | 0 | -35 | -18 | 117 | 46.4 | 23.2 | 1.6 | 51.9 | 22.7 | -0.8 |
| 19 | 91 | -26 | 28.3 | 4.4 | 0.04 | 0.41 | -3.9 | 9.2 | -0 | -0 | 0 | -35 | -18 | 117 | 46.4 | 23.2 | 1.6 | 54.7 | 22.7 | -2.4 |
| 20 | 95 | -26 | 28.3 | 4.4 | 0.04 | 0.17 | -3.8 | 9.02 | -0 | 0 | 0 | -35 | -18 | 117 | 46.4 | 23.1 | 1.6 | 54.9 | 22.7 | -2.5 |
| 21 | 100 | -26 | 28.3 | 4.4 | 0.04 | 0.14 | -3.9 | 8.98 | -0 | 0 | 0 | -35 | -18 | 117 | 46.5 | 23.1 | 1.6 | 51.9 | 23 | -1 |
| 22 | 108 | -26 | 28.3 | 4.4 | 0.04 | 0.35 | -4 | 9.18 | -0 | 0 | 0 | -35 | -18 | 117 | 46.5 | 23.1 | 1.6 | 50.5 | 23.6 | -0.9 |
| 23 | 109 | -26 | 28.3 | 4.4 | 0.04 | 0.31 | -4 | 9.47 | -0 | -0 | 0 | -35 | -18 | 117 | 46.5 | 23.1 | 1.6 | 52.6 | 23.6 | -2.2 |
| 24 | 115 | -26 | 28.3 | 4.4 | 0.04 | 0.2 | -4 | 9.35 | -0 | 0 | 0 | -35 | -18 | 117 | 46.5 | 23.1 | 1.6 | 53 | 23.1 | -1.9 |
| 25 | 125 | -26 | 28.3 | 4.4 | 0.04 | 0.24 | -4 | 9.39 | -0 | 0 | 0 | -35 | -18 | 117 | 46.5 | 23.1 | 1.6 | 52.3 | 22.9 | -1.2 |
| 26 | 125 | -26 | 28.3 | 4.4 | 0.04 | 0.45 | -3.9 | 9.35 | -0 | -0 | 0 | -35 | -18 | 117 | 46.5 | 23.2 | 1.6 | 52.7 | 22.9 | -1.5 |
| 27 | 130 | -26 | 28.3 | 4.4 | 0.04 | 0.36 | -4 | 9.13 | -0 | 0 | 0 | -35 | -18 | 117 | 46.5 | 23.1 | 1.6 | 55.3 | 22.7 | -2.7 |
| 28 | 134 | -26 | 28.3 | 4.4 | 0.04 | 0.13 | -4 | 9.17 | -0 | 0 | 0 | -35 | -18 | 117 | 46.5 | 23.2 | 1.6 | 53 | 23.5 | -2.3 |
| 29 | 141 | -26 | 28.3 | 4.4 | 0.04 | 0.19 | -4.1 | 9.05 | -0 | 0 | 0 | -35 | -18 | 117 | 46.5 | 23.1 | 1.6 | 50.7 | 23.4 | -0.8 |
| 30 | 144 | -26 | 28.3 | 4.4 | 0.04 | 0.52 | -4.1 | 9.36 | -0 | -0 | 0 | -35 | -18 | 117 | 46.5 | 23.2 | 1.6 | 49.9 | 24.2 | -1.2 |
| 1048541 | 1238693 | -26 | 28.2 | 2.1 | 16.4 | -1.1 | 0.84 | 8.91 | 0.02 | -0 | 0.01 | 5.3 | 38.4 | -11 | 355 | 2.1 | -4.7 | -6.4 | 0.5 | 5.2 |
| 1048542 | 1238695 | -26 | 28.2 | 2.1 | 16.4 | -0.8 | 0.12 | 9.02 | 0.01 | 0 | 0.01 | 5.3 | 38.4 | -11 | 355 | 1.8 | -5 | -5.7 | -5.4 | 6.9 |
| 1048543 | 1238702 | -26 | 28.2 | 2.1 | 16.4 | -1 | -0.6 | 9.85 | 0.01 | -0 | 0 | 5.3 | 38.4 | -11 | 355 | 1.6 | -5.1 | -6.4 | -0.8 | 5.1 |
| 1048544 | 1238711 | -26 | 28.2 | 2.1 | 16.4 | -0.8 | -0.3 | 10.6 | 0.01 | -0 | 0 | 5.3 | 38.4 | -11 | 355 | 1.8 | -5 | -6.3 | 3.5 | 6 |
| 1048545 | 1238711 | -26 | 28.2 | 2.1 | 16.4 | -1.2 | -0.3 | 9.31 | 0 | -0 | 0 | 5.3 | 38.4 | -11 | 355 | 1.6 | -4.8 | -6.7 | 1.4 | 4.2 |
| 1048546 | 1238720 | -26 | 28.2 | 2.1 | 16.4 | -1.2 | -0.7 | 10.5 | -0 | -0 | 0.01 | 5.3 | 38.4 | -11 | 355 | 1.7 | -4.8 | -5.8 | 2 | 7.5 |
| 1048547 | 1238728 | -26 | 28.2 | 2.3 | 16.5 | -1.2 | -0.7 | 12.1 | -0 | -0 | 0.01 | 5.3 | 38.4 | -11 | 355 | 1.8 | -4.9 | -6.1 | 3.6 | 6.7 |
| 1048548 | 1238728 | -26 | 28.2 | 2.3 | 16.5 | -0.1 | -0.5 | 11.1 | 0.01 | -0.1 | 0 | 5.2 | 38.5 | -11 | 355 | 1.8 | -5.1 | -6.2 | 3.5 | 5.5 |
| 1048549 | 1238737 | -26 | 28.2 | 2.3 | 16.5 | -0.2 | -0.3 | 10.3 | 0.02 | -0 | 0 | 5.2 | 38.5 | -11 | 355 | 1.8 | -5.1 | -7.6 | 2.4 | 0.6 |
| 1048550 | 1238737 | -26 | 28.2 | 2.3 | 16.5 | -0.2 | -0.3 | 9.35 | 0.01 | -0 | 0.01 | 5.2 | 38.5 | -11 | 355 | 1.6 | -5 | -7.4 | 1.4 | 1 |
| 1048551 | 1238744 | -26 | 28.2 | 2.3 | 16.5 | -0.7 | -0.5 | 10.5 | 0.01 | 0.02 | 0.01 | 5.2 | 38.5 | -11 | 355 | 1.4 | -4.9 | -7.3 | 1.6 | 1.4 |
| 1048552 | 1238746 | -26 | 28.2 | 2.3 | 16.5 | -1.4 | -0.7 | 9.15 | 0.01 | -0 | 0.01 | 5.3 | 38.5 | -11 | 355 | 1.7 | -4.7 | -6.9 | 2.5 | 3.6 |
| 1048553 | 1238754 | -26 | 28.2 | 2.3 | 16.5 | -1 | -0.4 | 9.64 | 0.02 | -0 | 0.02 | 5.3 | 38.5 | -11 | 355 | 2 | -4.6 | -5.4 | 4.4 | 8.8 |
| 1048554 | 1238755 | -26 | 28.2 | 2.3 | 16.5 | -0.5 | -0.5 | 9.4 | 0.02 | 0 | 0.01 | 5.3 | 38.5 | -11 | 355 | 2 | -4.8 | -6.3 | 2.5 | 5.6 |
| 1048555 | 1238761 | -26 | 28.2 | 2.3 | 16.5 | -0.6 | -0.5 | 10.8 | 0.03 | -0 | 0 | 5.3 | 38.5 | -11 | 355 | 1.7 | -4.7 | -7.1 | 3.3 | 2.9 |
| 1048556 | 1238770 | -26 | 28.2 | 2.3 | 16.5 | -0.2 | -0.3 | 11.5 | 0.02 | 0.01 | 0.01 | 5.5 | 38.6 | -11 | 355 | 1.8 | -4.5 | -7.3 | 2.5 | 3 |
| 1048557 | 1238771 | -26 | 28.2 | 2.3 | 16.5 | -1.1 | -0.4 | 9.42 | 0.03 | -0.1 | 0 | 5.5 | 38.6 | -11 | 355 | 2.1 | -4.4 | -7.9 | 1.6 | 1.1 |
| 1048558 | 1238779 | -26 | 28.2 | 2.3 | 16.5 | -1.5 | 0.05 | 9.82 | 0.02 | 0.01 | 0.01 | 5.5 | 38.6 | -11 | 355 | 2.3 | -4.5 | -6.2 | 2.6 | 6.6 |
| 1048559 | 1238781 | -26 | 28.2 | 2.3 | 16.5 | -0.3 | 0.09 | 10.4 | 0.03 | 0.04 | 0.01 | 5.5 | 38.6 | -11 | 355 | 2 | -4.6 | -5.6 | -0.3 | 8.5 |
| 1048560 | 1238788 | -26 | 28.2 | 2.3 | 16.5 | -0.6 | 0.02 | 9.51 | 0.02 | -0 | 0 | 5.7 | 38.6 | -11 | 355 | 1.7 | -4.5 | -8 | -0.5 | 1.5 |
| 1048561 | 1238797 | -26 | 28.2 | 2.3 | 16.5 | -0.9 | -0.4 | 11 | 0.02 | 0.01 | 0.01 | 5.7 | 38.6 | -11 | 355 | 1.6 | -4.6 | -7.3 | -0.1 | 3.7 |
| 1048562 | 1238797 | -26 | 28.2 | 2.3 | 16.5 | -0.4 | -0.3 | 10.1 | 0.02 | -0 | 0.01 | 5.7 | 38.6 | -11 | 355 | 1.9 | -4.3 | -7.1 | 2.1 | 4.7 |
| 1048563 | 1238805 | -26 | 28.2 | 2.3 | 16.5 | -0.4 | 0.2 | 9.88 | 0.02 | -0 | 0.01 | 5.7 | 38.6 | -11 | 355 | 2 | -4.3 | -7.8 | 1.9 | 2.4 |
| 1048564 | 1238806 | -26 | 28.2 | 2.3 | 16.5 | -0.2 | 0.4 | 9.58 | 0.02 | 0.02 | 0.01 | 5.8 | 38.6 | -11 | 355 | 1.6 | -4.4 | -7.7 | -1.1 | 2.5 |
| 1048565 | 1238813 | -26 | 28.2 | 2.3 | 16.5 | -0.5 | 0.02 | 8.85 | 0.02 | 0.01 | 0.01 | 5.8 | 38.6 | -11 | 355 | 1.2 | -4.3 | -8 | -2.4 | 1.3 |
| 1048566 | 1238816 | -26 | 28.2 | 2.3 | 16.5 | -0.9 | -0.8 | 8.68 | 0.02 | 0.03 | 0.01 | 5.8 | 38.6 | -11 | 355 | 1.1 | -4.2 | -7.5 | -0.1 | 3.3 |
| 1048567 | 1238823 | -26 | 28.2 | 2.3 | 16.5 | -1 | -1 | 9.4 | 0.02 | 0.01 | 0.01 | 5.8 | 38.6 | -11 | 355 | 1.5 | -4.1 | -7 | 5.2 | 5.9 |
| 1048568 | 1238830 | -26 | 28.2 | 2.3 | 16.5 | -0.7 | -0.5 | 10.1 | 0.02 | -0 | 0.01 | 5.7 | 38.6 | -11 | 355 | 1.7 | -4.1 | -6.8 | 6 | 6.3 |
| 1048569 | 1238831 | -26 | 28.2 | 2.3 | 16.5 | -0.1 | 0.02 | 10.2 | 0.02 | -0 | 0.01 | 5.7 | 38.6 | -11 | 355 | 1.7 | -4.2 | -7.3 | 3 | 4 |
| 1048570 | 1238840 | -26 | 28.2 | 2.3 | 16.5 | -0.1 | -0.3 | 10 | 0.02 | 0.01 | 0.01 | 5.7 | 38.6 | -11 | 355 | 1.6 | -4.2 | -8.2 | -0.1 | 0.8 |
| 1048571 | 1238841 | -26 | 28.2 | 2.3 | 16.5 | -0.5 | -0.7 | 9.77 | 0.02 | 0.02 | 0.01 | 5.7 | 38.6 | -11 | 355 | 1.6 | -4 | -8.4 | 1.7 | 0.3 |
| 1048572 | 1238847 | -26 | 28.2 | 2.3 | 16.5 | -0.9 | -0.9 | 8.66 | 0.02 | 0.01 | 0.01 | 5.6 | 38.6 | -11 | 355 | 1.9 | -3.9 | -7.6 | 4 | 2.7 |
| 1048573 | 1238857 | -26 | 28.2 | 2.3 | 16.5 | -1.5 | -0 | 8.7 | 0.02 | 0.02 | 0.01 | 5.6 | 38.6 | -11 | 355 | 2.1 | -3.9 | -6.6 | 5.6 | 6 |
| 1048574 | 1238857 | -26 | 28.2 | 2.3 | 16.5 | -1.4 | 0.6 | 9.95 | 0.02 | 0.01 | 0.01 | 5.6 | 38.6 | -11 | 355 | 2 | -4 | -5.2 | 0.2 | 10 |
| 1048575 | 1238865 | -26 | 28.2 | 2.3 | 16.5 | -0.2 | 0.59 | 10.3 | 0.02 | 0.01 | 0.01 | 5.6 | 38.6 | -11 | 355 | 1.8 | -4.1 | -5.7 | -3.4 | 8 |
Appendix B
Table A2.
Computed data.
| s/n | accl_x | accl_y | accl_z | time | accl_magnitude |
| 1 | 0.126 | -3.979 | 9.1 | 0.227273 | 9.932689314 |
| 2 | 0.155 | -3.96 | 9.445 | 0.227273 | 10.24273645 |
| 3 | 0.342 | -3.866 | 9.306 | 0.227273 | 10.08288431 |
| 4 | 0.45 | -3.871 | 9.052 | 0.227273 | 9.855244543 |
| 5 | 0.234 | -3.847 | 9.119 | 0.227273 | 9.900016465 |
| 6 | 0.146 | -3.967 | 8.995 | 0.227273 | 9.832010476 |
| 7 | 0.342 | -3.991 | 9.167 | 0.227273 | 10.00394592 |
| 8 | 0.304 | -4.031 | 9.495 | 0.227273 | 10.3197094 |
| 9 | 0.143 | -3.933 | 9.402 | 0.227273 | 10.19247477 |
| 10 | 0.258 | -3.969 | 9.447 | 0.227273 | 10.25013824 |
| 11 | 0.375 | -3.895 | 9.308 | 0.227273 | 10.09705472 |
| 12 | 0.301 | -3.974 | 9.064 | 0.227273 | 9.901483374 |
| 13 | 0.203 | -3.948 | 9.157 | 0.227273 | 9.973894024 |
| 14 | 0.354 | -4.062 | 9.121 | 0.227273 | 9.990885897 |
| 15 | 0.464 | -4.034 | 9.327 | 0.227273 | 10.17257986 |
| 16 | 0.237 | -4.012 | 9.43 | 0.227273 | 10.25071768 |
| 17 | 0.124 | -3.931 | 9.411 | 0.227273 | 10.19975774 |
| 18 | 0.39 | -3.948 | 9.44 | 0.227273 | 10.23974629 |
| 19 | 0.409 | -3.852 | 9.196 | 0.227273 | 9.97855706 |
| 1048555 | -0.567 | -0.476 | 10.793 | 0.434783 | 10.81836004 |
| 1048556 | -0.22 | -0.311 | 11.484 | 0.434783 | 11.49031666 |
| 1048557 | -1.094 | -0.433 | 9.421 | 0.434783 | 9.494185905 |
| 1048558 | -1.462 | 0.052 | 9.818 | 0.434783 | 9.926392698 |
| 1048559 | -0.28 | 0.09 | 10.381 | 0.434783 | 10.38516543 |
| 1048560 | -0.62 | 0.019 | 9.507 | 0.434783 | 9.527214178 |
| 1048561 | -0.897 | -0.404 | 10.97 | 0.434783 | 11.01402401 |
| 1048562 | -0.43 | -0.337 | 10.053 | 0.434783 | 10.06783383 |
| 1048563 | -0.438 | 0.196 | 9.88 | 0.434783 | 9.89164597 |
| 1048564 | -0.217 | 0.402 | 9.579 | 0.434783 | 9.589887069 |
| 1048565 | -0.507 | 0.016 | 8.848 | 0.434783 | 8.862528364 |
| 1048566 | -0.893 | -0.792 | 8.678 | 0.434783 | 8.75970302 |
| 1048567 | -1.039 | -0.993 | 9.402 | 0.434783 | 9.511213067 |
| 1048568 | -0.706 | -0.521 | 10.084 | 0.434783 | 10.12210121 |
| 1048569 | -0.136 | 0.021 | 10.242 | 0.434783 | 10.24292444 |
| 1048570 | -0.057 | -0.294 | 9.998 | 0.434783 | 10.00248414 |
| 1048571 | -0.462 | -0.679 | 9.77 | 0.434783 | 9.804457405 |
| 1048572 | -0.912 | -0.852 | 8.664 | 0.434783 | 8.753430413 |
| 1048573 | -1.537 | -0.031 | 8.702 | 0.434783 | 8.836749063 |
| 1048574 | -1.393 | 0.6 | 9.947 | 0.434783 | 10.06197088 |
| 1048575 | -0.172 | 0.593 | 10.347 | 0.434783 | 10.36540602 |
References
- Liu, Y.C.; Wu, T.J. Fatigued driver’s driving behavior and cognitive task performance: Effects of road environments and road environment changes. Safety Science 2009, 47, 1083–1089. [Google Scholar] [CrossRef]
- Dong, W.; Li, Y.; Sun, C.; Hu, Y. A review of the relationship between road roughness and driving comfort. International Journal of Environmental Research and Public Health 2020, 17, 4324. [Google Scholar]
- Hancock, P.A.; Rogers, W.A. Fatigue and Attention. In Handbook of Human Factors and Ergonomics, 5th ed. John Wiley & Sons, Ltd., 2019, pp. 24.1–24.43.
- Pickard; Burton, P. ; Yamada, H.; Schram, B.; Canetti, E.F.; Orr, R. Musculoskeletal disorders associated with occupational driving: a systematic review spanning 2006-2021. International Journal of Environmental Research and Public Health 2022, 19, 6837. [Google Scholar] [CrossRef] [PubMed]
- Chen, Y.L.; Alexander, H.; Hu, Y.M. Self-reported musculoskeletal disorder symptoms among bus drivers in the Taipei metropolitan area. International Journal of Environmental Research and Public Health 2022, 19, 10596. [Google Scholar] [CrossRef] [PubMed]
- Trivedi, N.; Abraham, J.; Dhar, U. Job Satisfaction and Occupational Stress among Drivers in Long-Distance Transportation: A Qualitative Study. Journal of Transportation Engineering, Part A: Systems 2019, 145, 04018078. [Google Scholar]
- Salmon, P.M.; Cornelissen, M.; Trotter, M.J.; Read, G.J.M. The Systems Thinking Scale: Measuring the Systems Thinking Capabilities of Individuals. Systems Research and Behavioral Science 2017, 34, 143–169. [Google Scholar]
- Mkwata, R.; Chong, E.E.M. Effect of pavement surface conditions on road traffic accident-A Review. in In E3S web of conferences, 2022.
- Breiman, L. Random forests. Machine Learning 2001, 45, 5–32. [Google Scholar] [CrossRef]
- Liaw; Wiener, M. Classification and Regression by Random Forest. R News 2002, 2, 18–22. [Google Scholar]
- Casey, M.B.; Azcona, S.M. Random Forest as a Predictive Analytics Alternative to Regression in Institutional Research. Practical Assessment, Research & Evaluation 2017, 22, 1–9. [Google Scholar]
- Yildirim, S.; Uzmay, I. Statistical analysis of vehicles’ vibration due to road roughness using radial basis artificial neural network. Applied Artificial Intelligence 2001, 15, 419–427. [Google Scholar] [CrossRef]
- Lin, J.D.; Yau, J.T.; Hsiao, L.H. Correlation analysis between international roughness index (IRI) and pavement distress by neural network. In 82nd Annual Meeting of the Transportation Research Board 2003, 12, 1–21. [Google Scholar]
- Hassan, R.A.; McManus, K. Assessment of interaction between road roughness and heavy vehicles. Transportation research record 2003, 1819, 236–243. [Google Scholar] [CrossRef]
- Hesami, R.; McManus, K.J. Signal processing approach to road roughness analysis and measurement. in In TENCON 2009-2009 IEEE Region 10 Conference, 2009.
- Cantisani, G.; Loprencipe, G. Road roughness and whole body vibration: Evaluation tools and comfort limits. Journal of Transportation Engineering 2010, 136, 818–826. [Google Scholar] [CrossRef]
- Yang, Y.B.; Li, Y.C.; Chang, K.C. Effect of road surface roughness on the response of a moving vehicle for identification of bridge frequencies. Interaction and multiscale mechanics 2012, 5, 347–368. [Google Scholar] [CrossRef]
- Agostinacchio, M.; Ciampa, D.; Olita, S. The vibrations induced by surface irregularities in road pavements–a Matlab® approach. European Transport Research Review 2014, 6, 267–275. [Google Scholar] [CrossRef]
- Bridgelall, R. Connected vehicle approach for pavement roughness evaluation. Journal of Infrastructure Systems 2014, 20, 04013001. [Google Scholar] [CrossRef]
- Du, Y.; Liu, C.; Wu, D.; Jiang, S. Measurement of International Roughness Index by Using Z-Axis Accelerometers and GPS. Mathematical Problems in Engineering 2014, 2014, 928980. [Google Scholar] [CrossRef]
- Pal, M.; Sutradhar, R. Pavement roughness prediction systems: a bump integrator approach. International Journal of Civil and Environmental Engineering 2014, 8, 1258–1261. [Google Scholar]
- Zhang, Z.; Deng, F.; Huang, Y.; Bridgelall, R. Road roughness evaluation using in-pavement strain sensors. Smart Materials and Structures 2015, 24, 115029. [Google Scholar] [CrossRef]
- Louhghalam; Tootkaboni, M. ; Ulm, F.J. Roughness-induced vehicle energy dissipation: Statistical analysis and scaling. Journal of Engineering Mechanics 2015, 141, 04015046. [Google Scholar]
- Bärgman, J.; Smith, K.; Werneke, J. Quantifying drivers’ comfort-zone and dread-zone boundaries in left turn across path/opposite direction (LTAP/OD) scenarios. Transportation Research Part F: Traffic Psychology and Behaviour 2015, 35, 170–184. [Google Scholar] [CrossRef]
- Ueckermann; Oeser, M. Approaches for a 3D assessment of pavement evenness data based on 3D vehicle models. Journal of Traffic and Transportation Engineering (english edition) 2015, 2, 68–80. [Google Scholar] [CrossRef]
- Mubaraki, M. Highway subsurface assessment using pavement surface distress and roughness data. International Journal of Pavement Research and Technology 2016, 9, 393–402. [Google Scholar] [CrossRef]
- Abulizi, N.; Kawamura, A.; Tomiyama, K.; Fujita, S. Measuring and evaluating of road roughness conditions with a compact road profiler and ArcGIS. Journal of Traffic and Transportation Engineering (English Edition) 2016, 3, 398–411. [Google Scholar] [CrossRef]
- Zhao, B.; Nagayama, T. IRI estimation by the frequency domain analysis of vehicle dynamic responses. in Procedia Engineering, 2017.
- Tsubota, T.; Fernando, C.; Yoshii, T.; Shirayanagi, H. Effect of road pavement types and ages on traffic accident risks. in Transportation research procedia, 2018.
- Fortunatus, M.; Onyango, L.; Fomunung, I.; Owino, J. Use of a smart phone based application to measure roughness of polyurethane stabilized concrete pavement. Civ. Eng. Res. J. 2018, 4, 555645. [Google Scholar]
- Nguyen, T.; Lechner, B.; Wong, Y.D. Response-based methods to measure road surface irregularity: A state-of-the-art review. European Transport Research Review 2019, 11, 1–18. [Google Scholar] [CrossRef]
- Wang, G.; Burrow, M.; Ghataora, G. Study of the factors affecting road roughness measurement using smartphones. Journal of Infrastructure Systems 2020, 26, 04020020. [Google Scholar] [CrossRef]
- Bajic, M.; Pour, S.M.; Skar, A.; Pettinari, M.; Levenberg, E.; Alstrøm, T.S. Road roughness estimation using machine learning. arXiv 2021, arXiv:2107.01199. [Google Scholar]
- Múčka, P. International roughness index thresholds based on whole-body vibration in passenger cars. Transportation Research Record 2021, 2675, 305–320. [Google Scholar] [CrossRef]
- Azizan, M.S.; Taher, M.N.M. Evaluation of Pavement Ride Quality on Road Networks Using Smartphone Application. Recent Trends in Civil Engineering and Built Environment 2021, 2, 323–329. [Google Scholar]
- Alomari, H.; Khedaywi, T.S.; Marian, A.R.O.; Jadah, A.A. Traffic speed prediction techniques in urban environments. Heliyon 2022, 8. [Google Scholar] [CrossRef] [PubMed]
- Wang, X.; Cheng, Z.; Ma, N. Road recognition based on vehicle vibration signal and comfortable speed strategy formulation using ISA algorithm. Sensors 2022, 22, 6682. [Google Scholar] [CrossRef] [PubMed]
- Liu, C.; Wu, D.; Li, Y.; Jiang, S.; Du, Y. Mathematical insights into the relationship between pavement roughness and vehicle vibration. International Journal of Pavement Engineering 2022, 23, 1935–1947. [Google Scholar] [CrossRef]
- Hanandeh, S. Introducing mathematical modeling to estimate pavement quality index of flexible pavements based on genetic algorithm and artificial neural networks. Case Studies in Construction Materials 2022, 16, e00991. [Google Scholar] [CrossRef]
- Shtayat; Moridpour, S. ; Best, B. Using e-bikes and private cars in dynamic road pavement monitoring. International Journal of Transportation Science and Technology 2022, 11, 132–143. [Google Scholar] [CrossRef]
- Rajput, P.; Chaturvedi, M.; Patel, V. Road condition monitoring using unsupervised learning based bus trajectory processing. Multimodal Transportation 2022, 1, 100041. [Google Scholar] [CrossRef]
- Sandamal, K.; Shashiprabha, S.; Muttil, N.; Rathnayake, U. Pavement roughness prediction using explainable and supervised machine learning technique for long-term performance. Sustainability 2023, 15, 9617. [Google Scholar] [CrossRef]
- Ali, A.; Heneash, U.; Hussein, A.; Khan, S. Application of Artificial neural network technique for prediction of pavement roughness as a performance indicator. Journal of King Saud University-Engineering Sciences 2024, 36, 128–139. [Google Scholar]
- Choudhary; Garg, R. D.; Jain, S.S. Estimating impact of pavement surface condition and geometrics design on two-wheeler run-off road crashes on horizontal curves. IATSS research 2024, 48, 108–119. [Google Scholar] [CrossRef]
- Saeed, N.; Alam, M.; Nyberg, R.G. A multimodal deep learning approach for gravel road condition evaluation through image and audio integration. Transportation Engineering 2024, 16, 100228. [Google Scholar] [CrossRef]
Figure 1.
System Model.
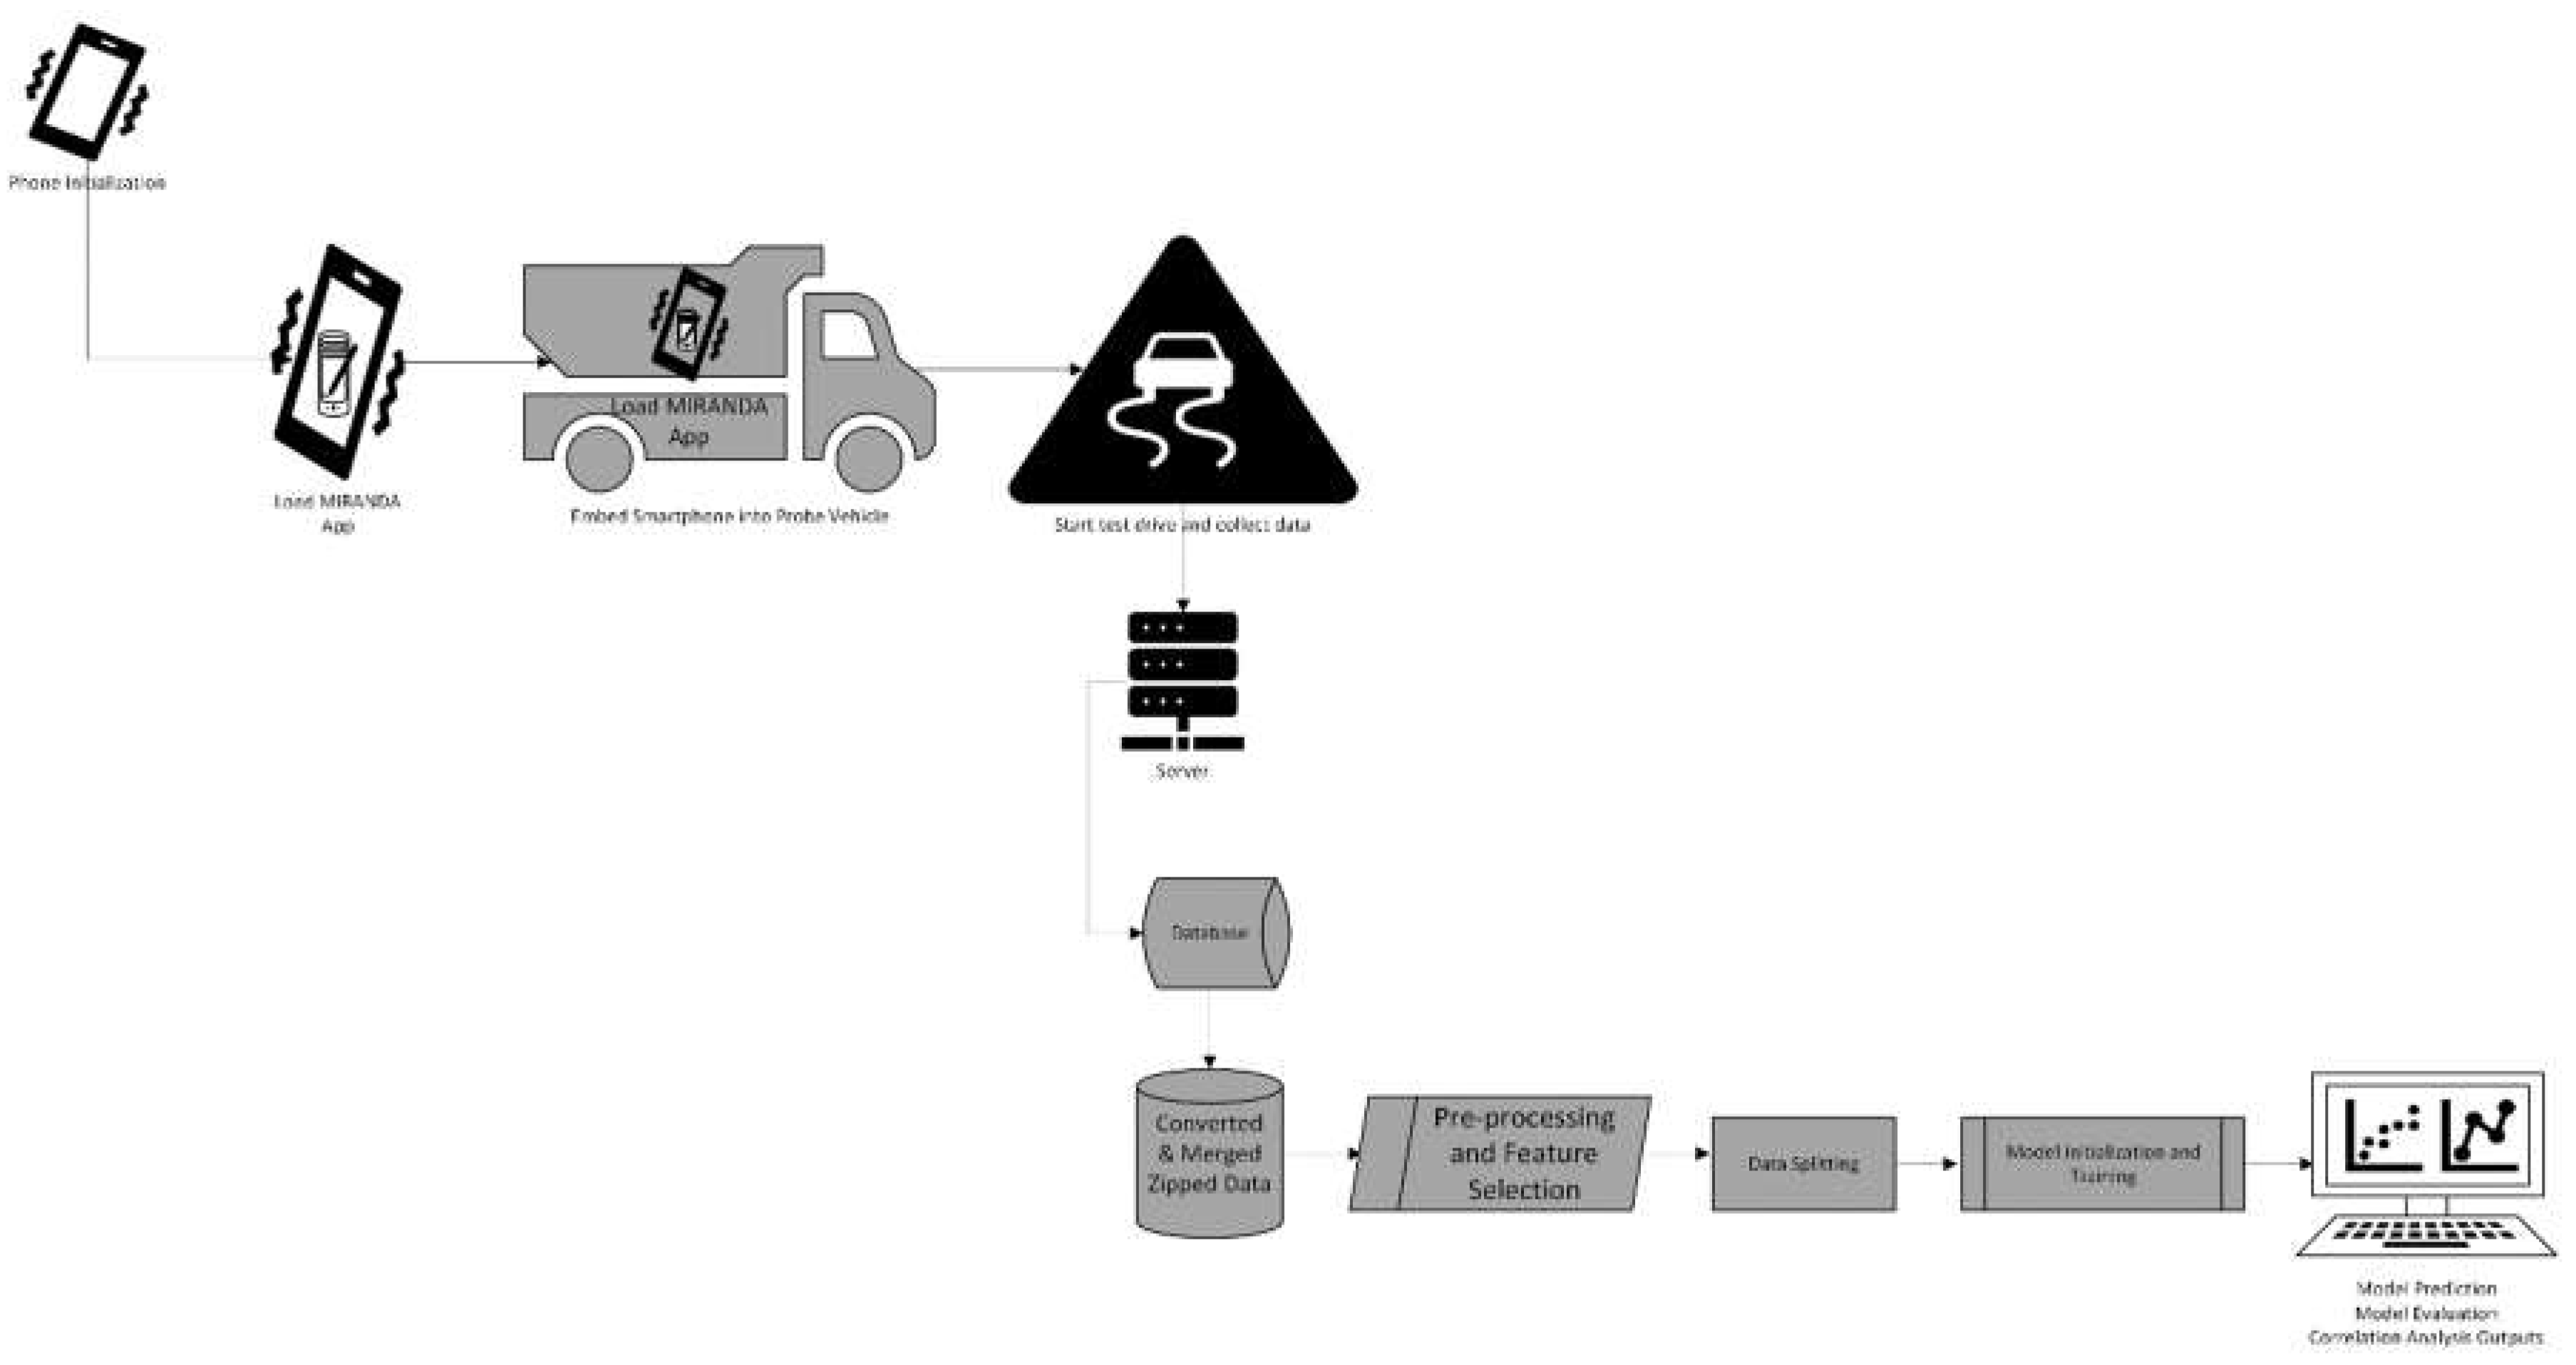
Figure 3.
Python File Merge Scripts.
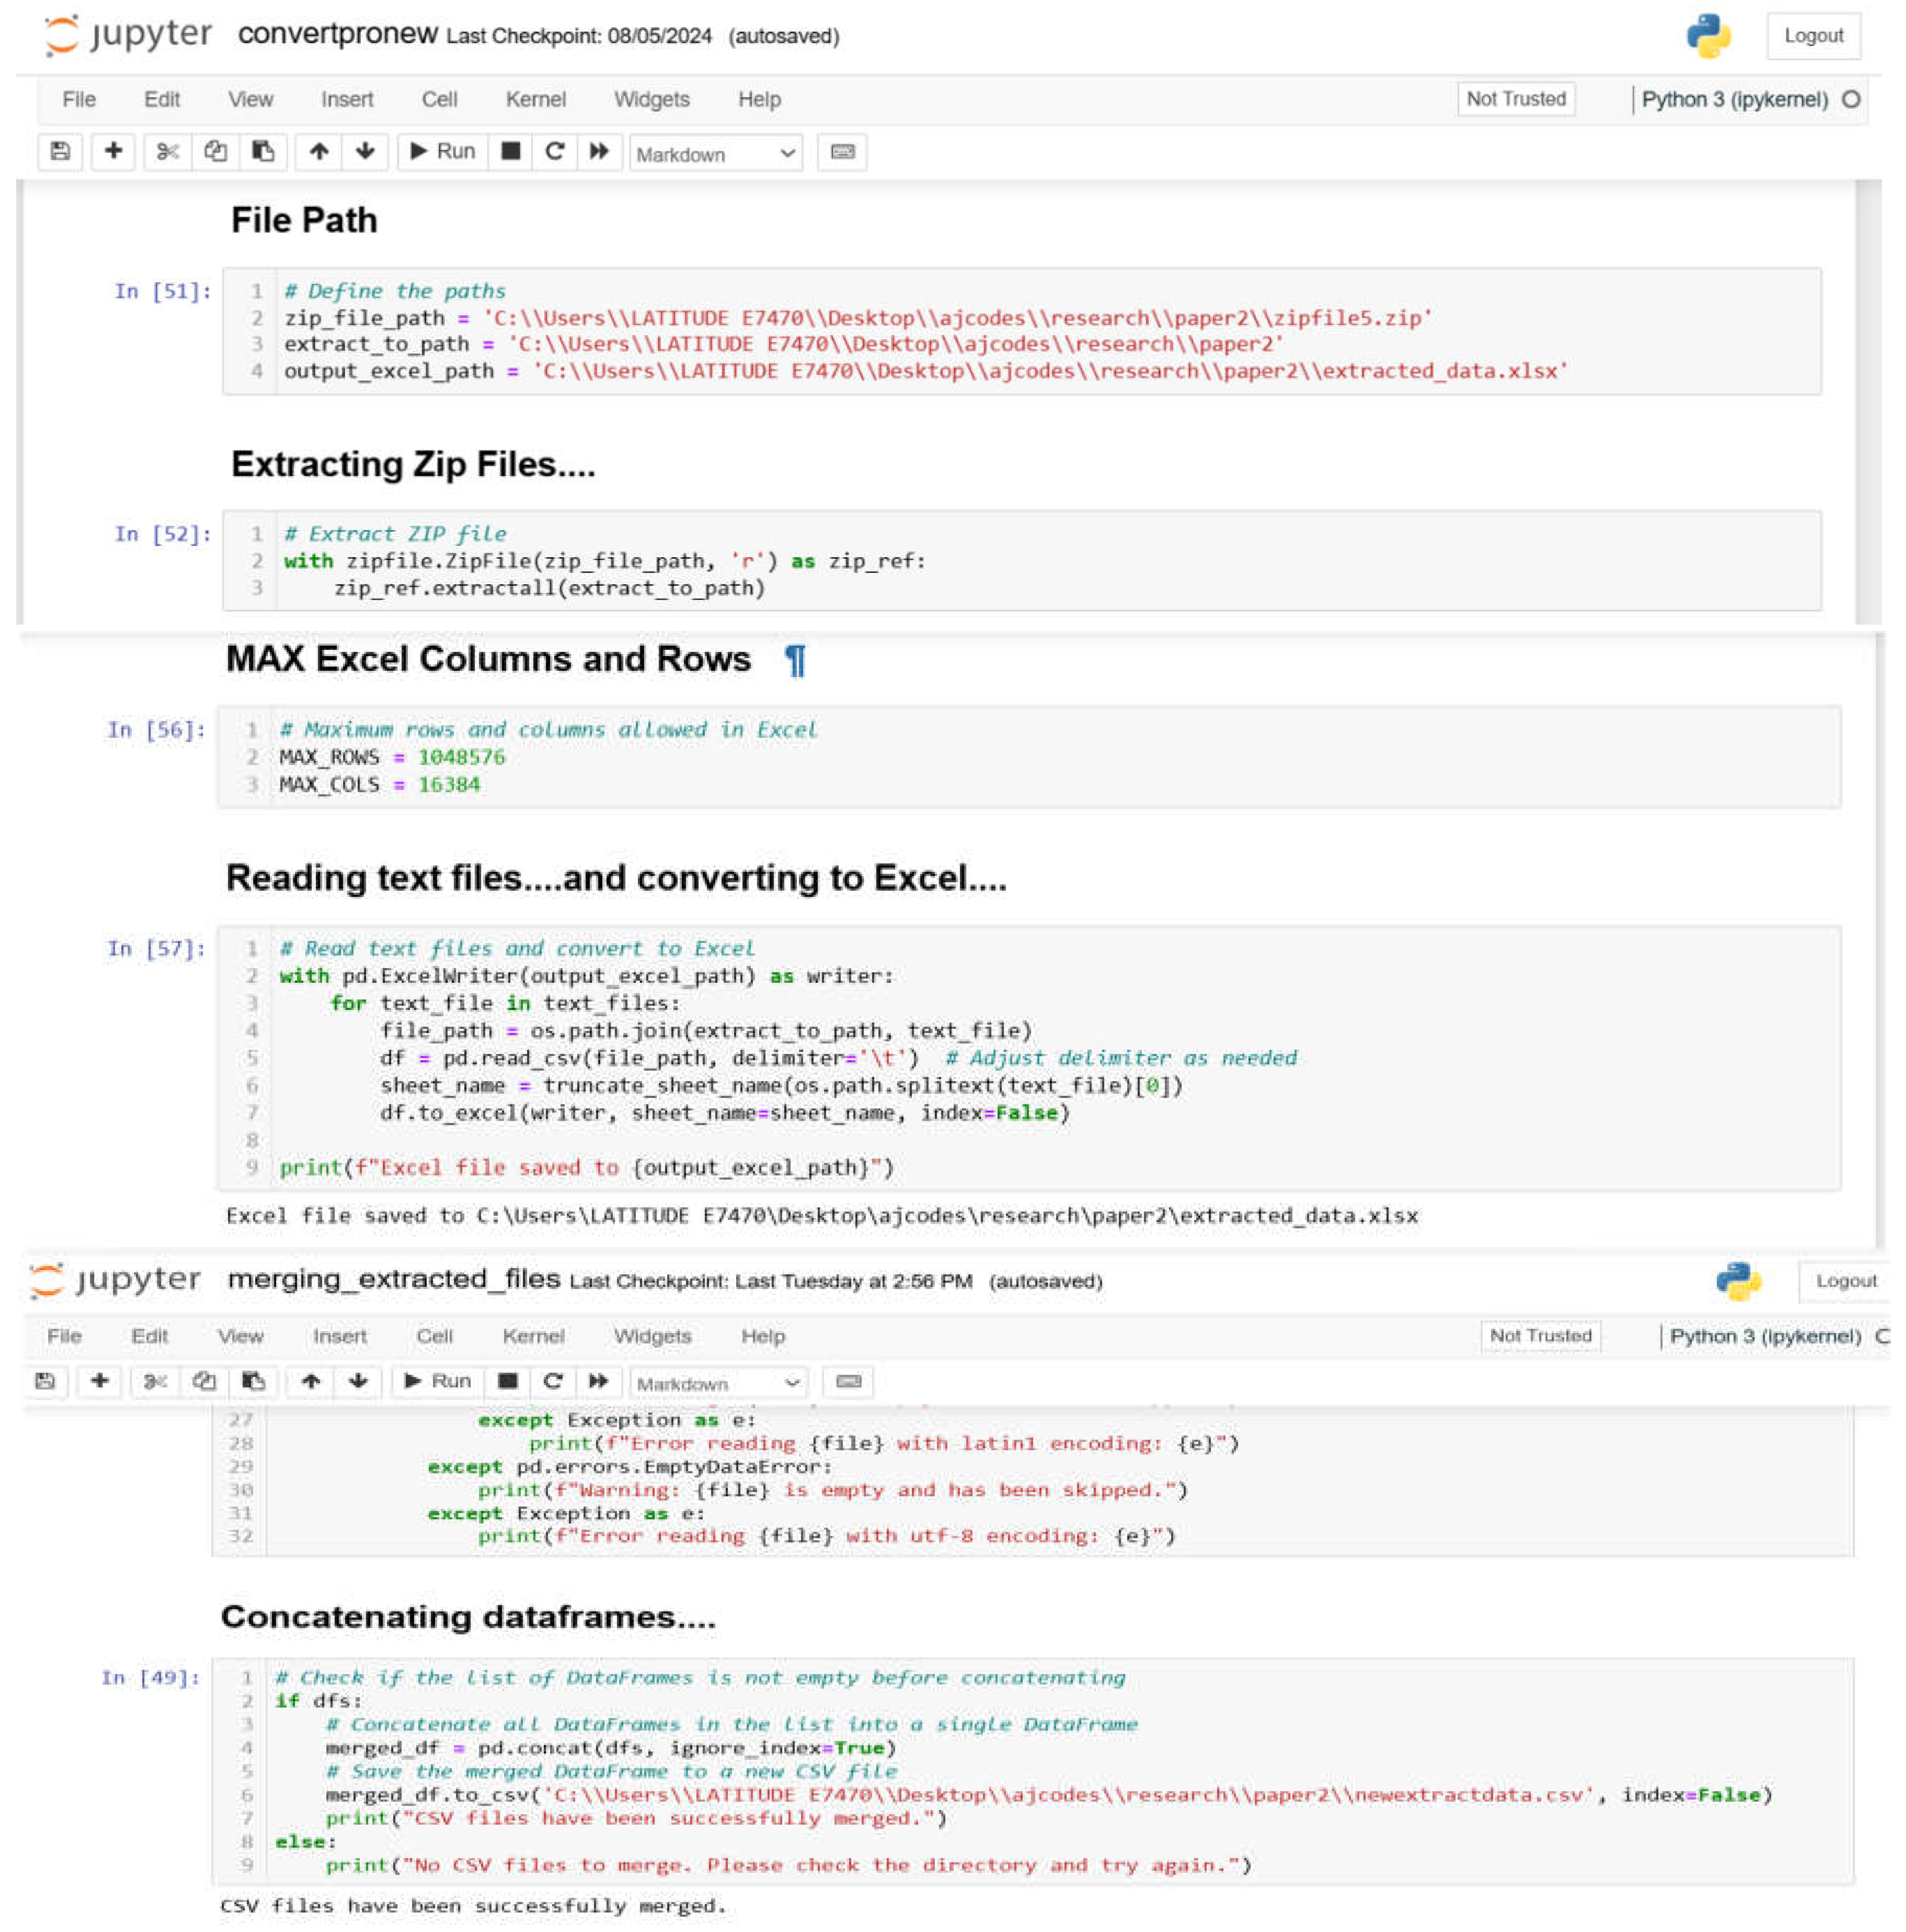
Figure 4.
Preprocessing done for accel_magnitude.
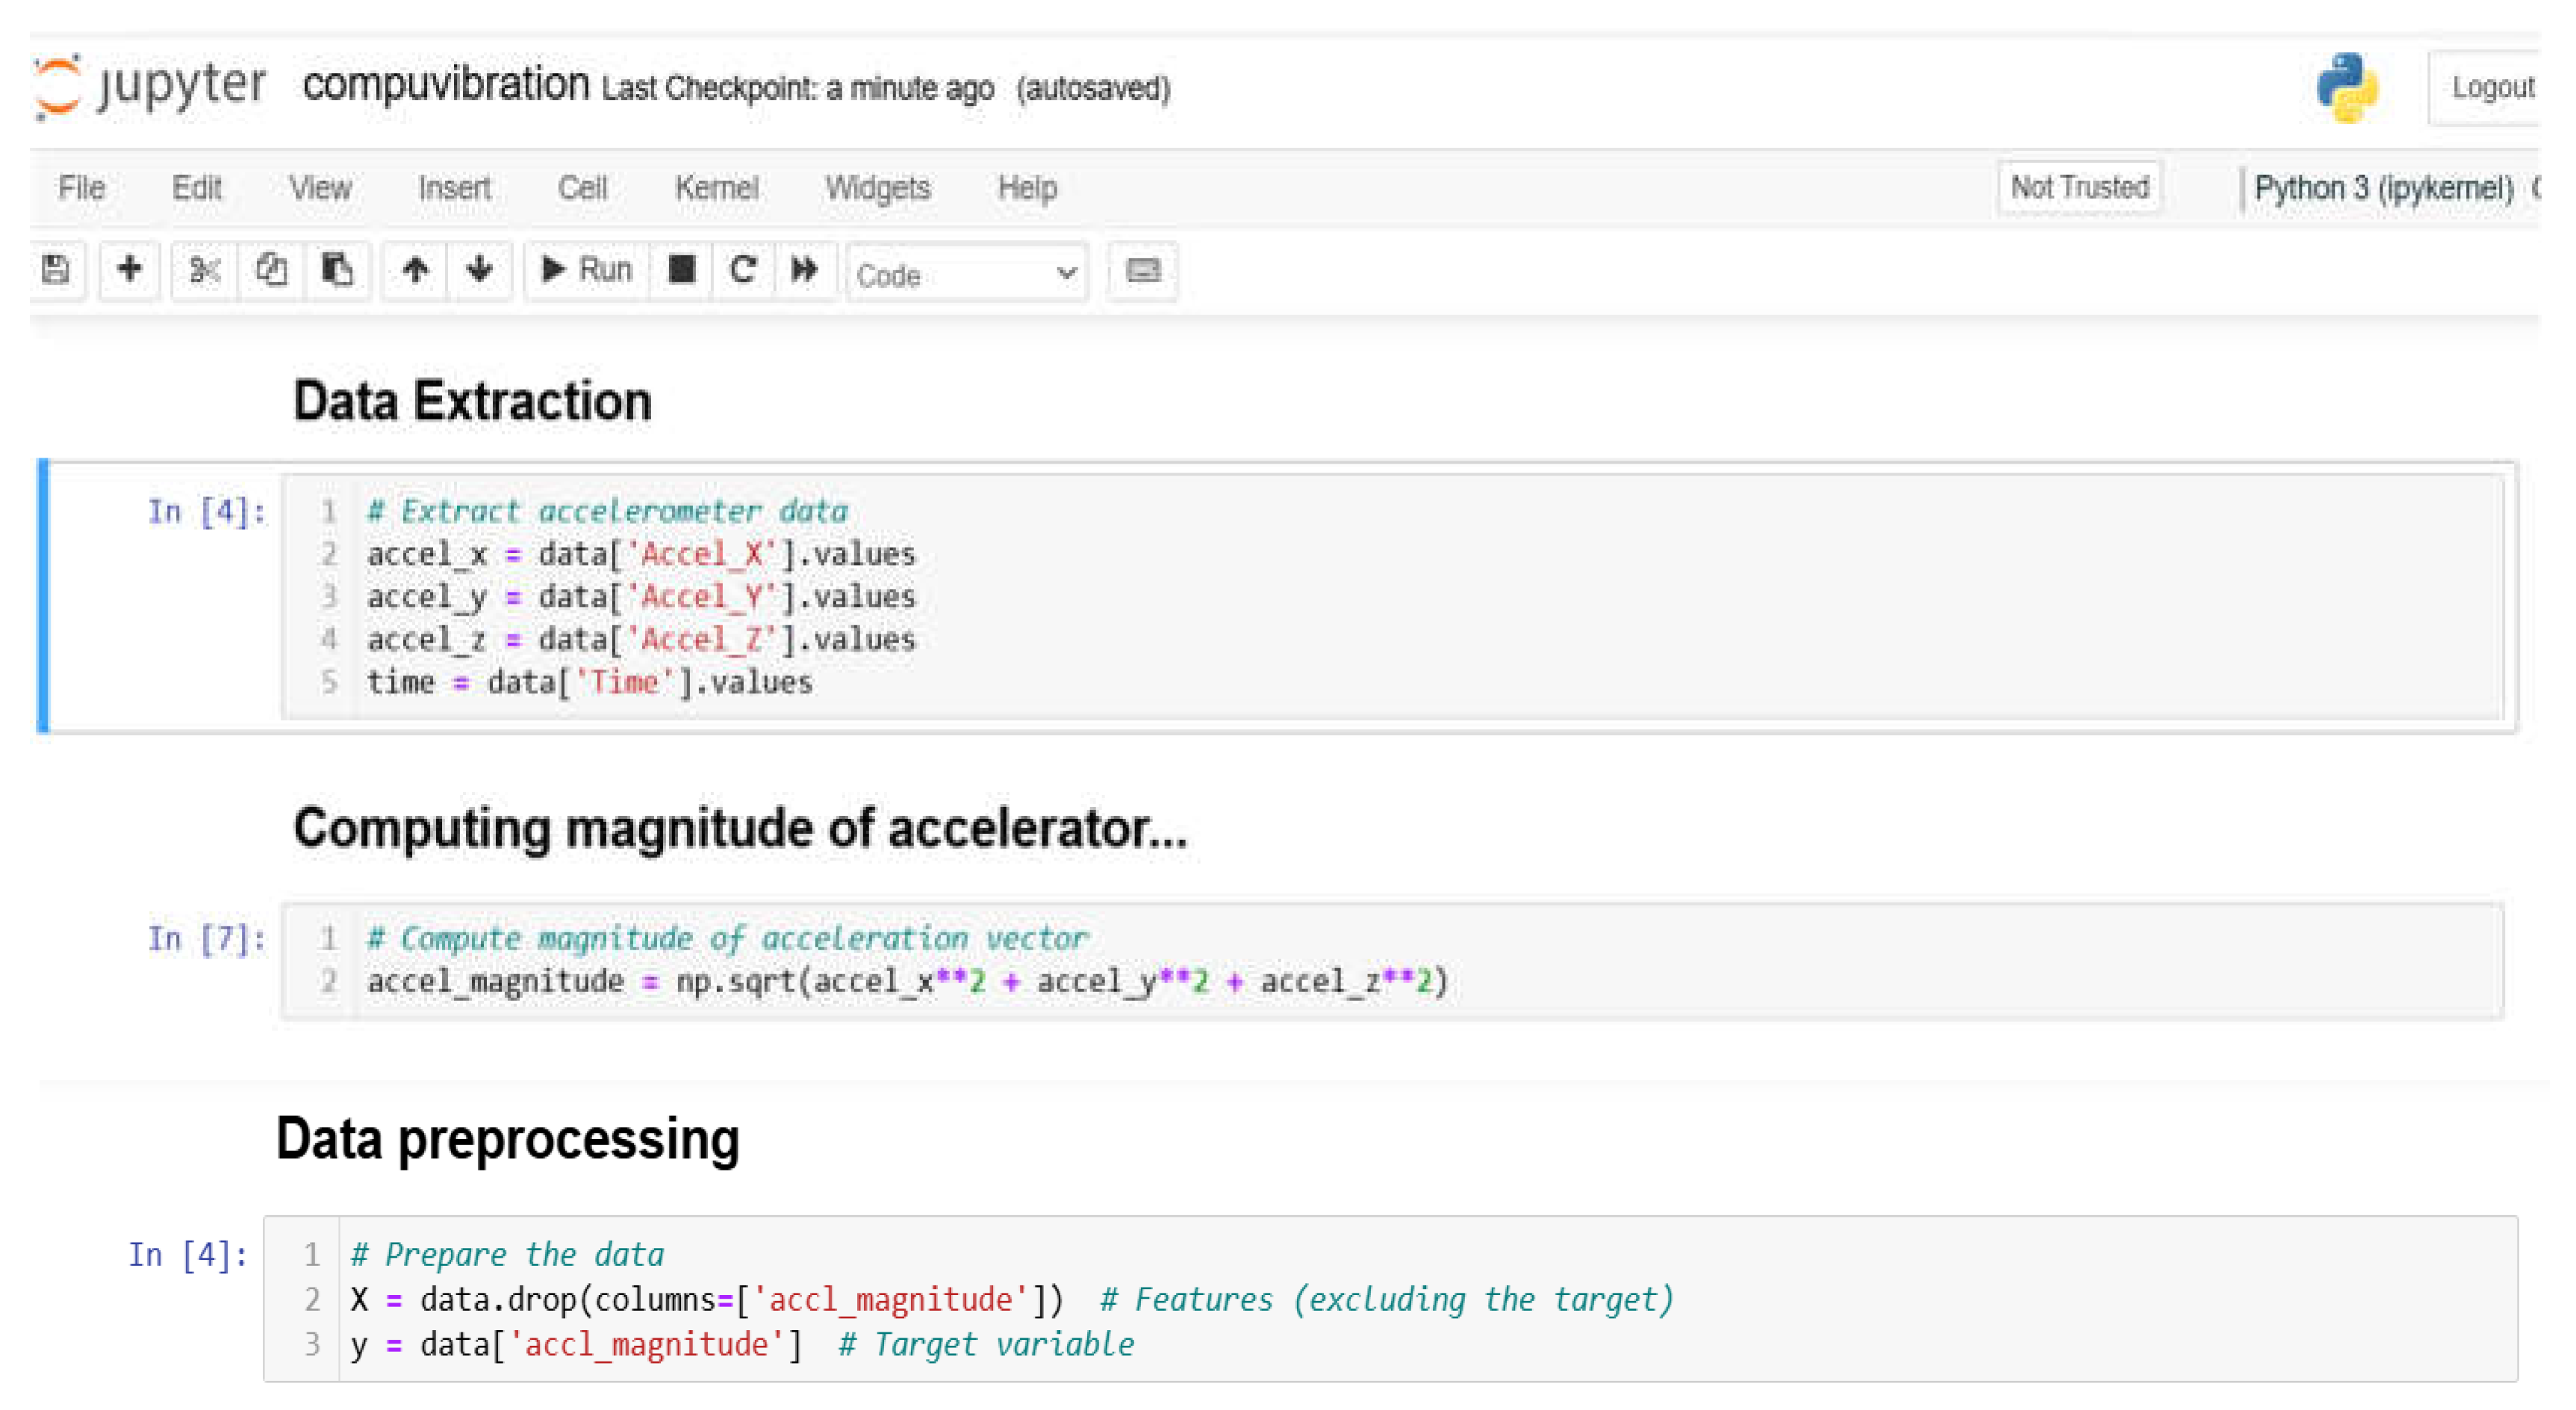
Figure 5.
Feature Selection.
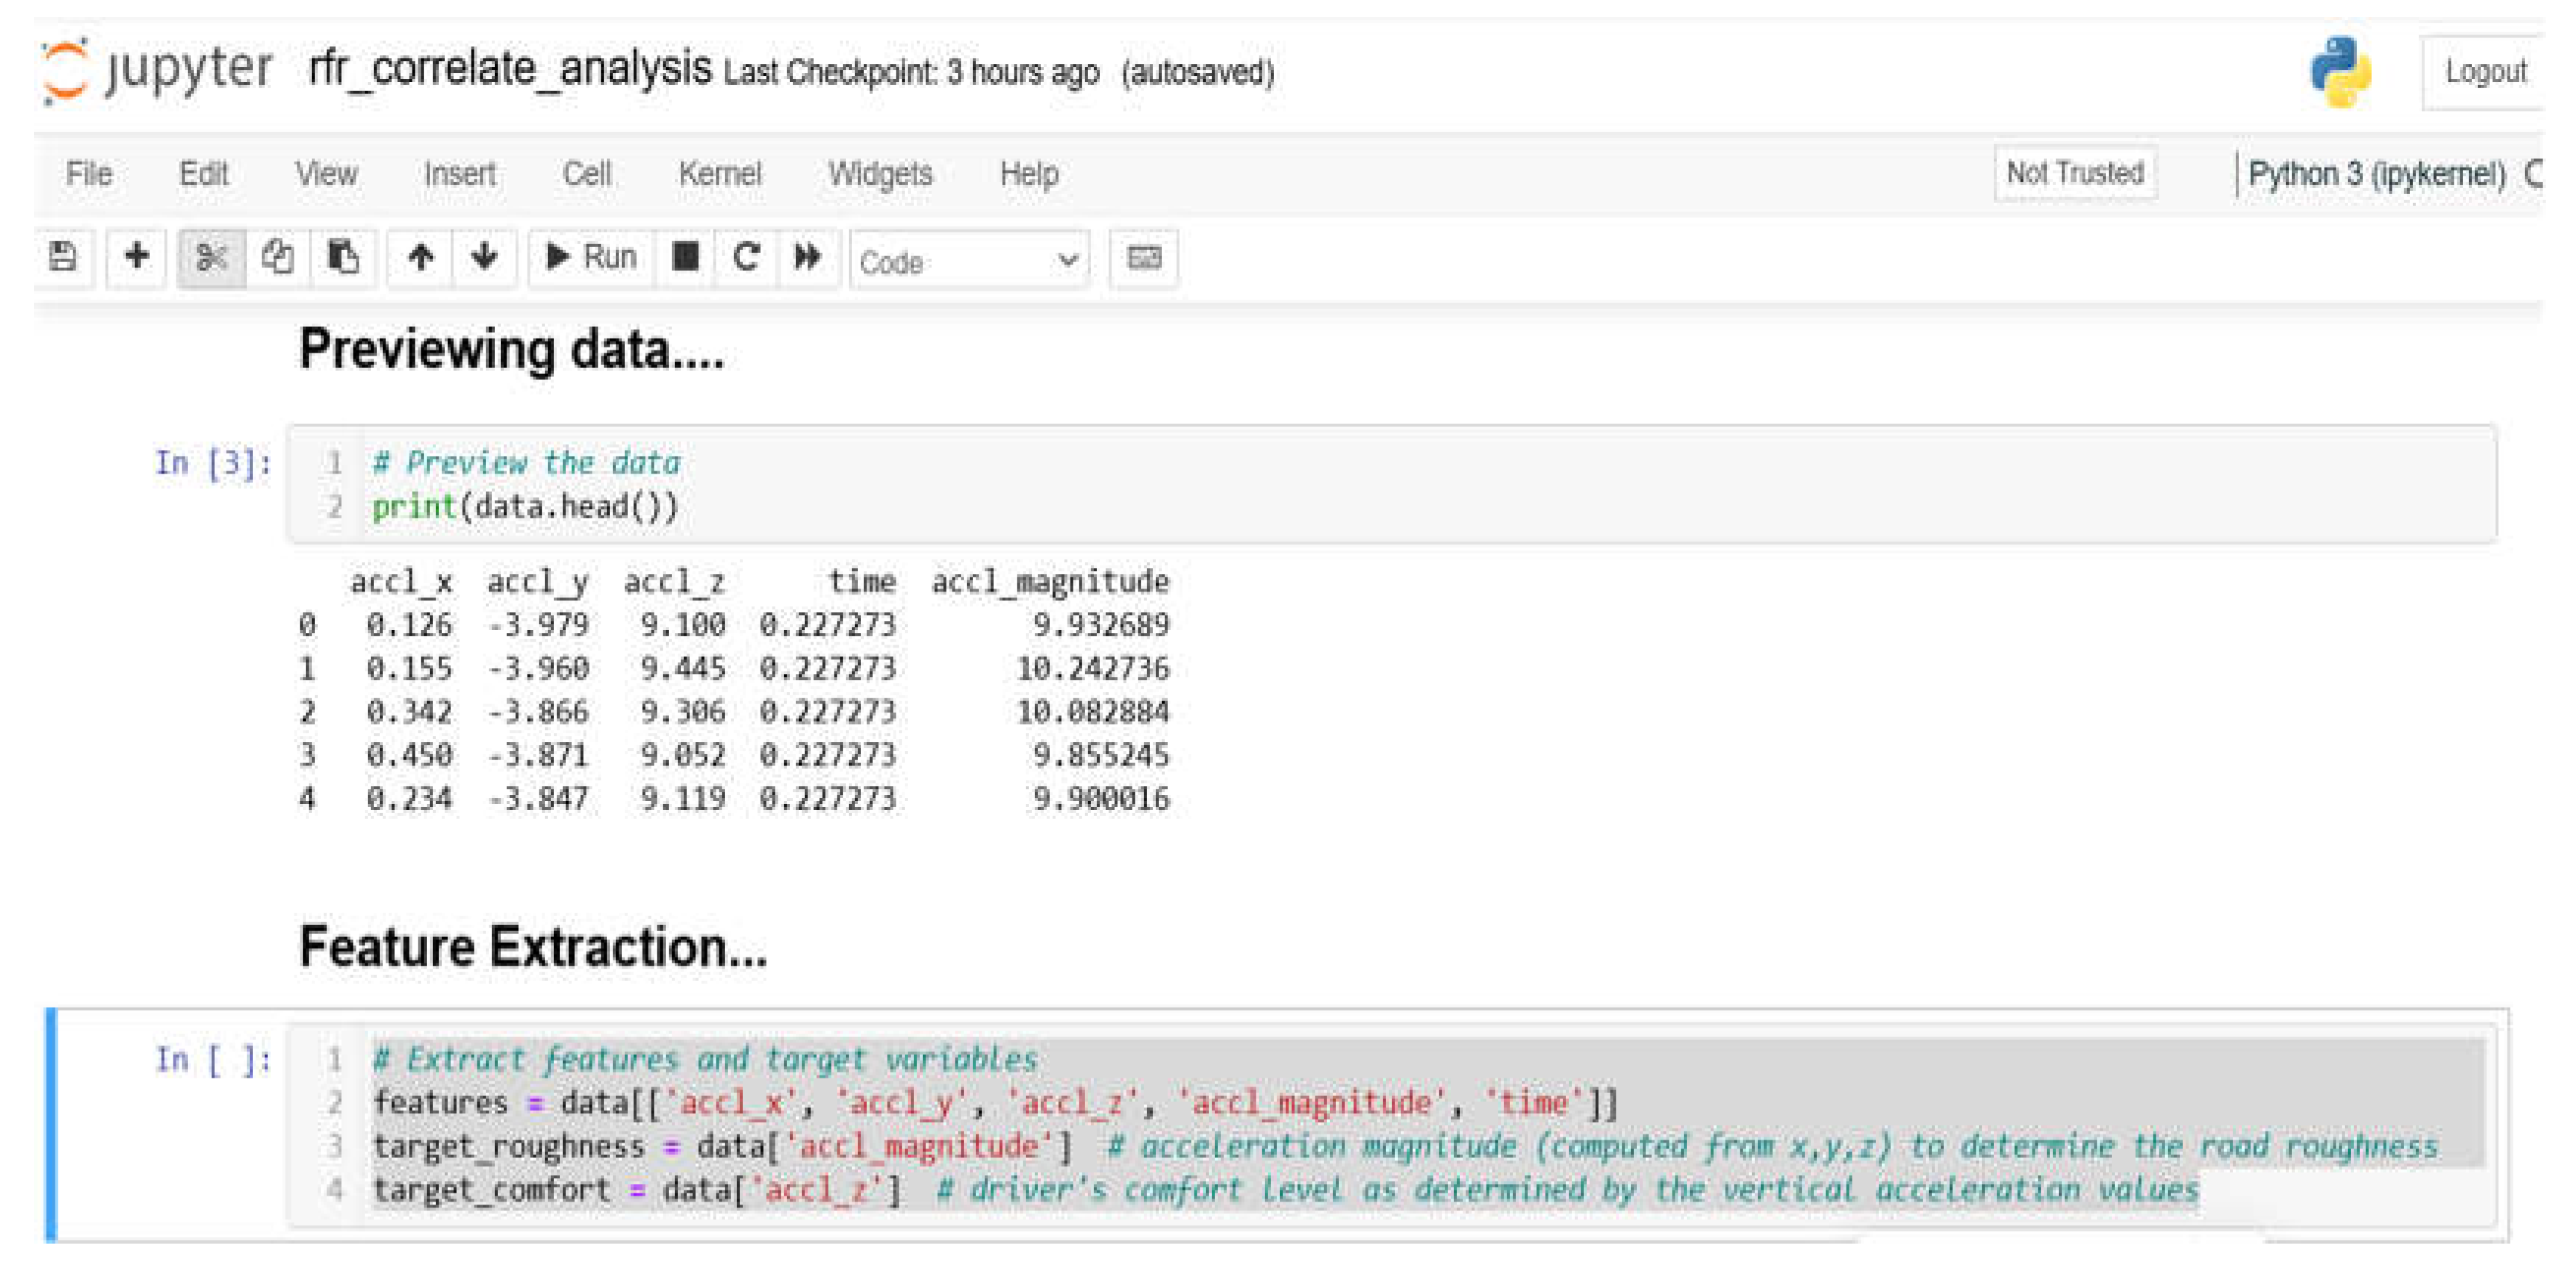
Figure 6.
Data splitting.
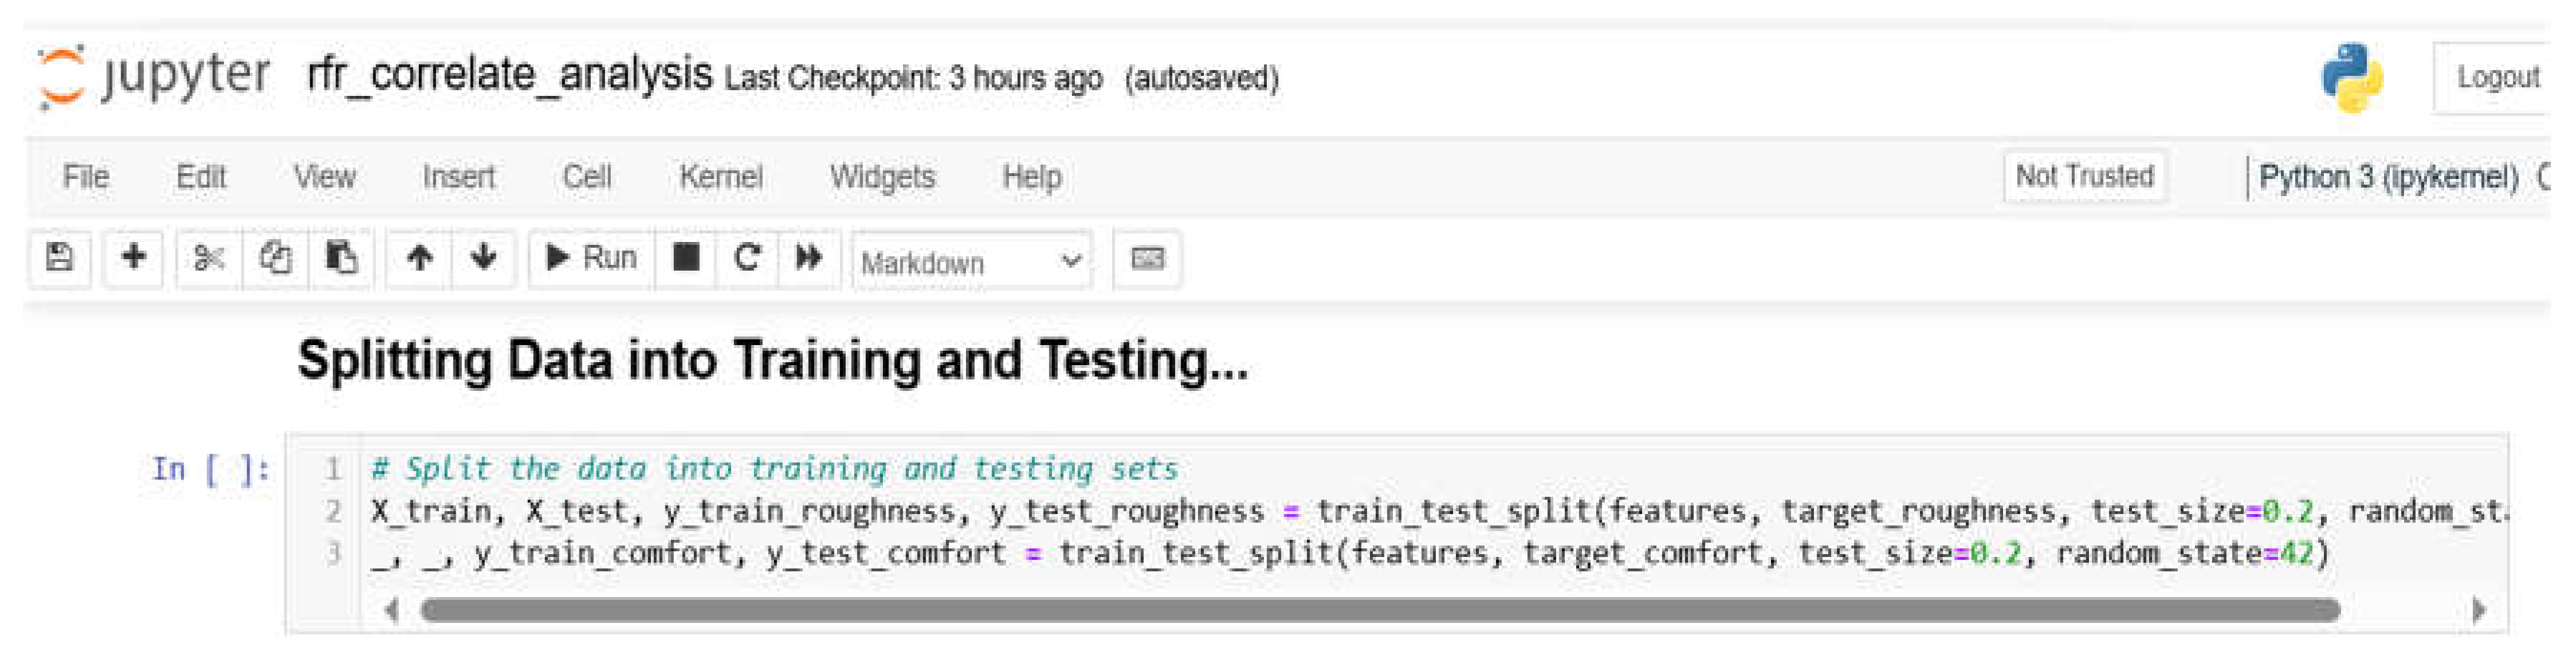
Figure 7.
Model initialization and training.
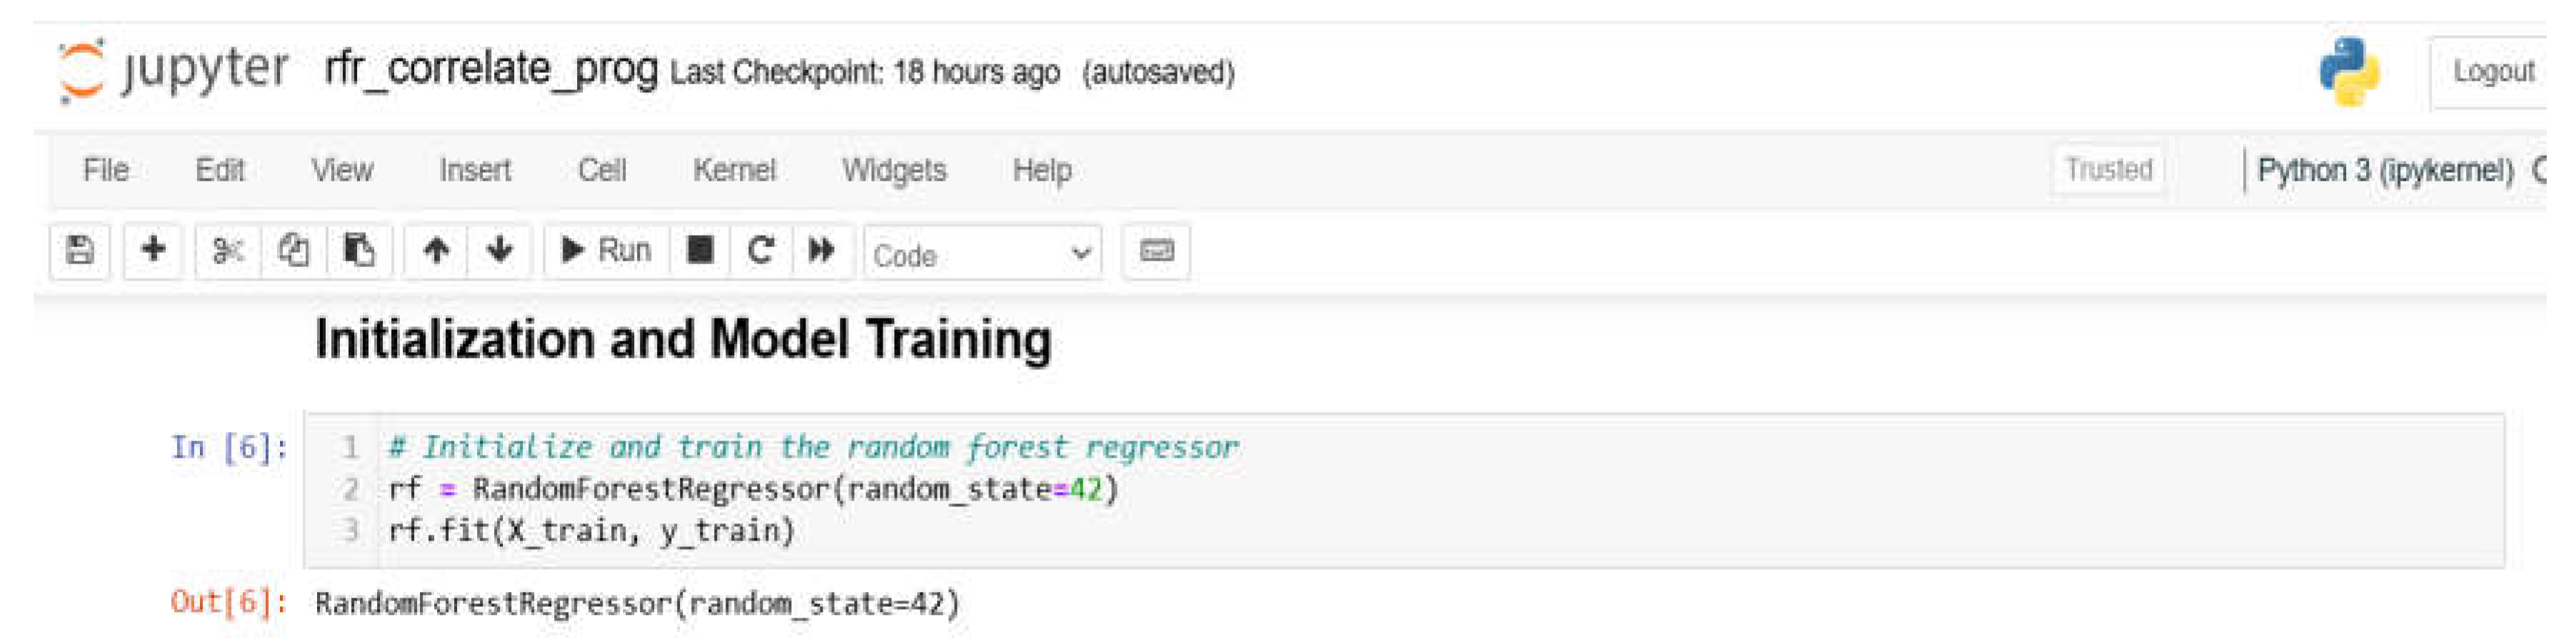
Figure 8.
Model prediction and evaluation.
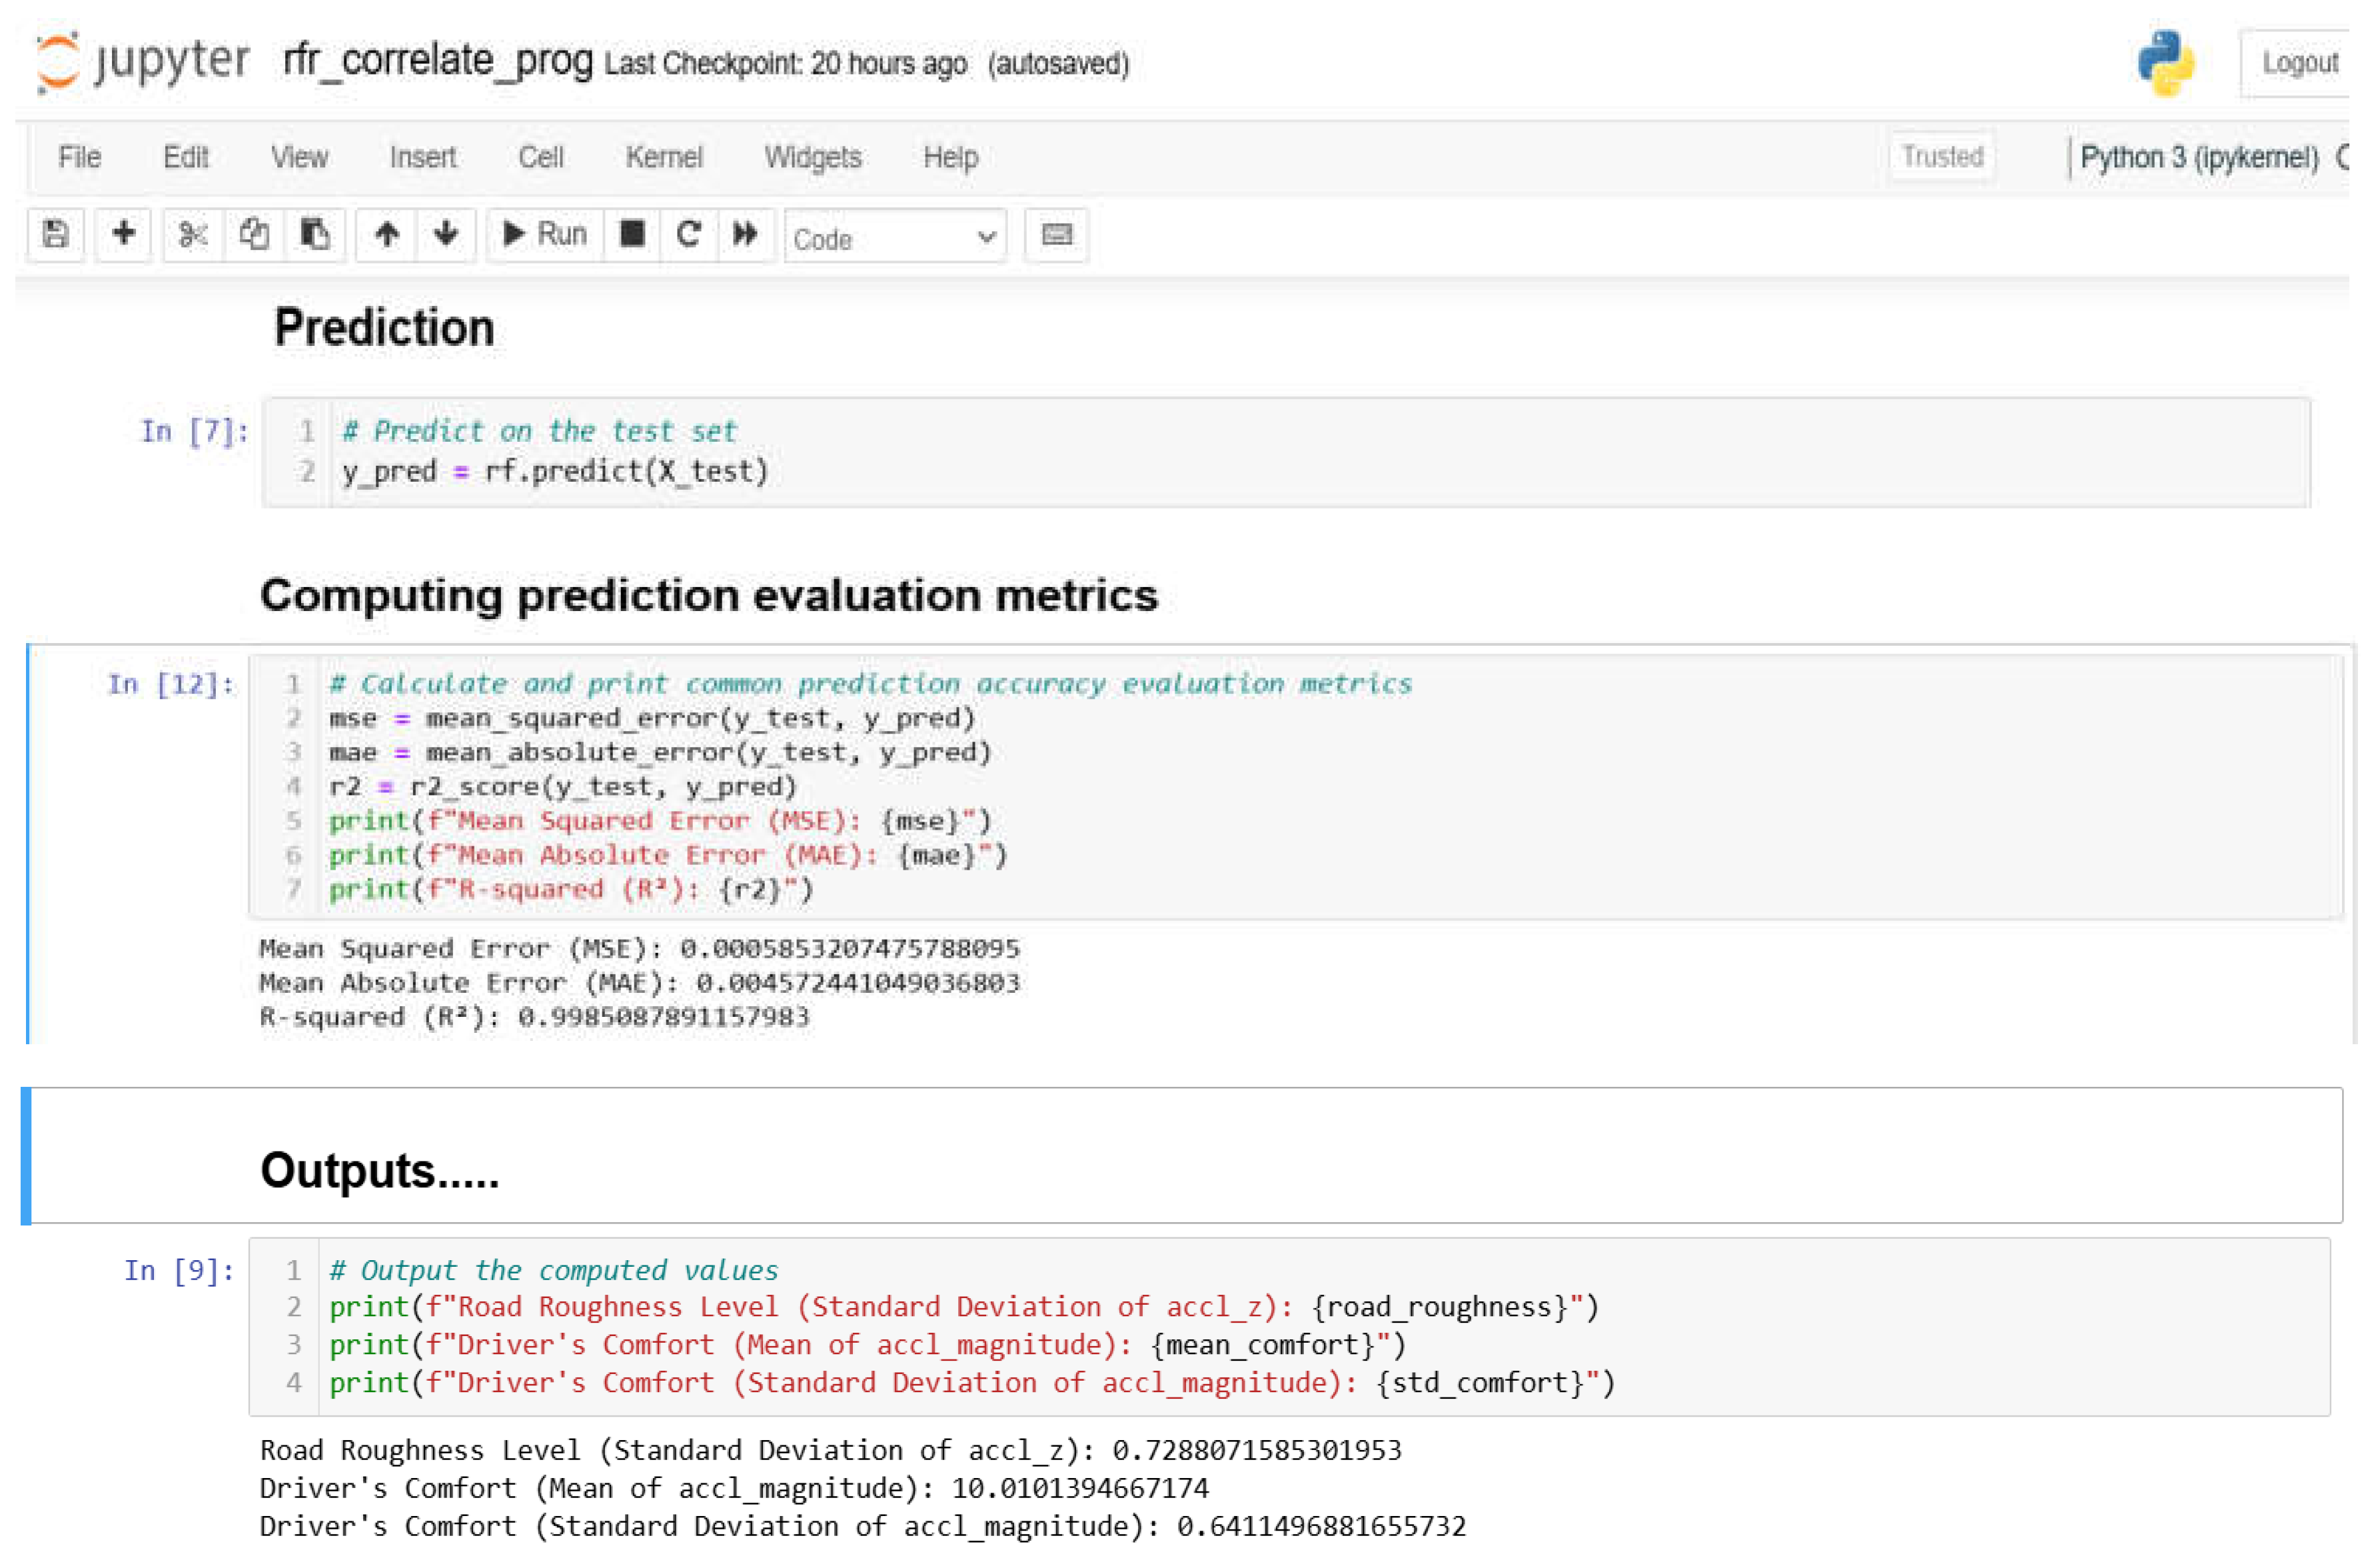
Figure 9.
Correlation analysis.
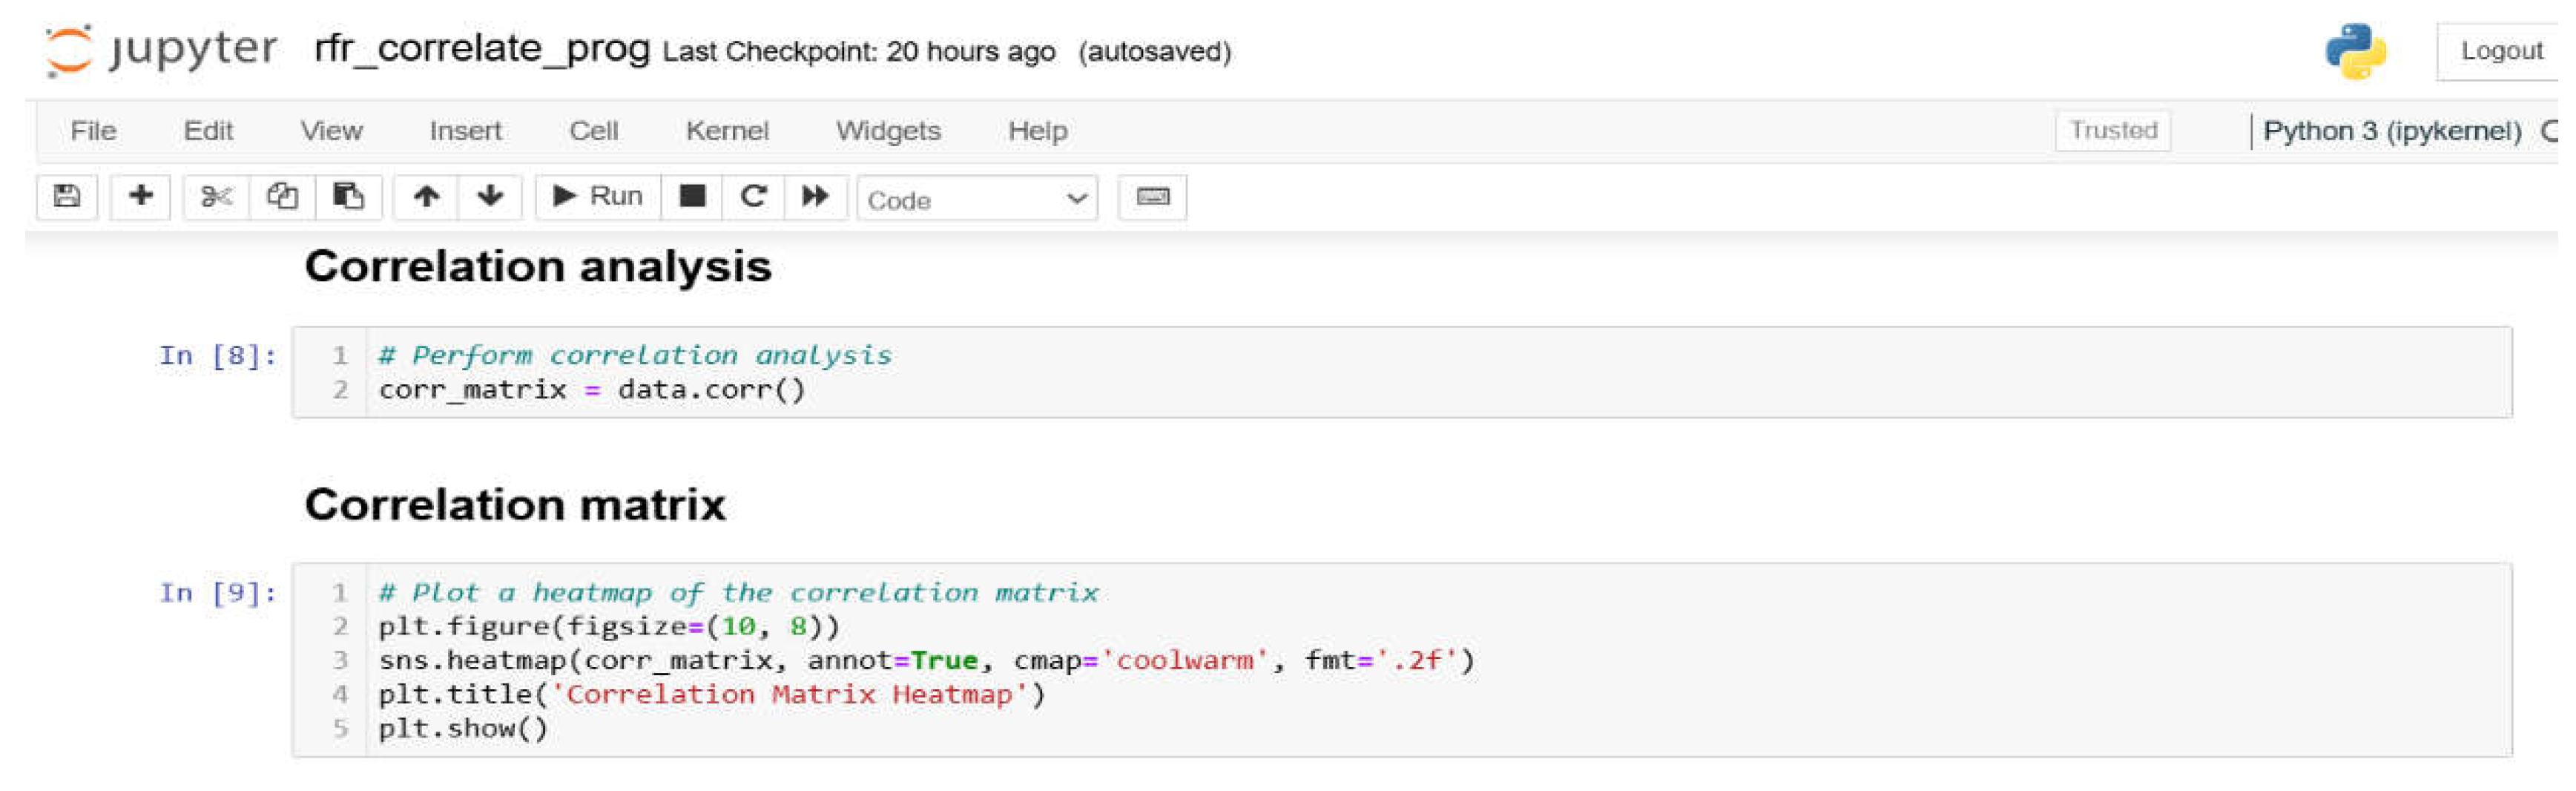
Figure 10.
(a): Correlation Matrix. (b): Bar Chart.
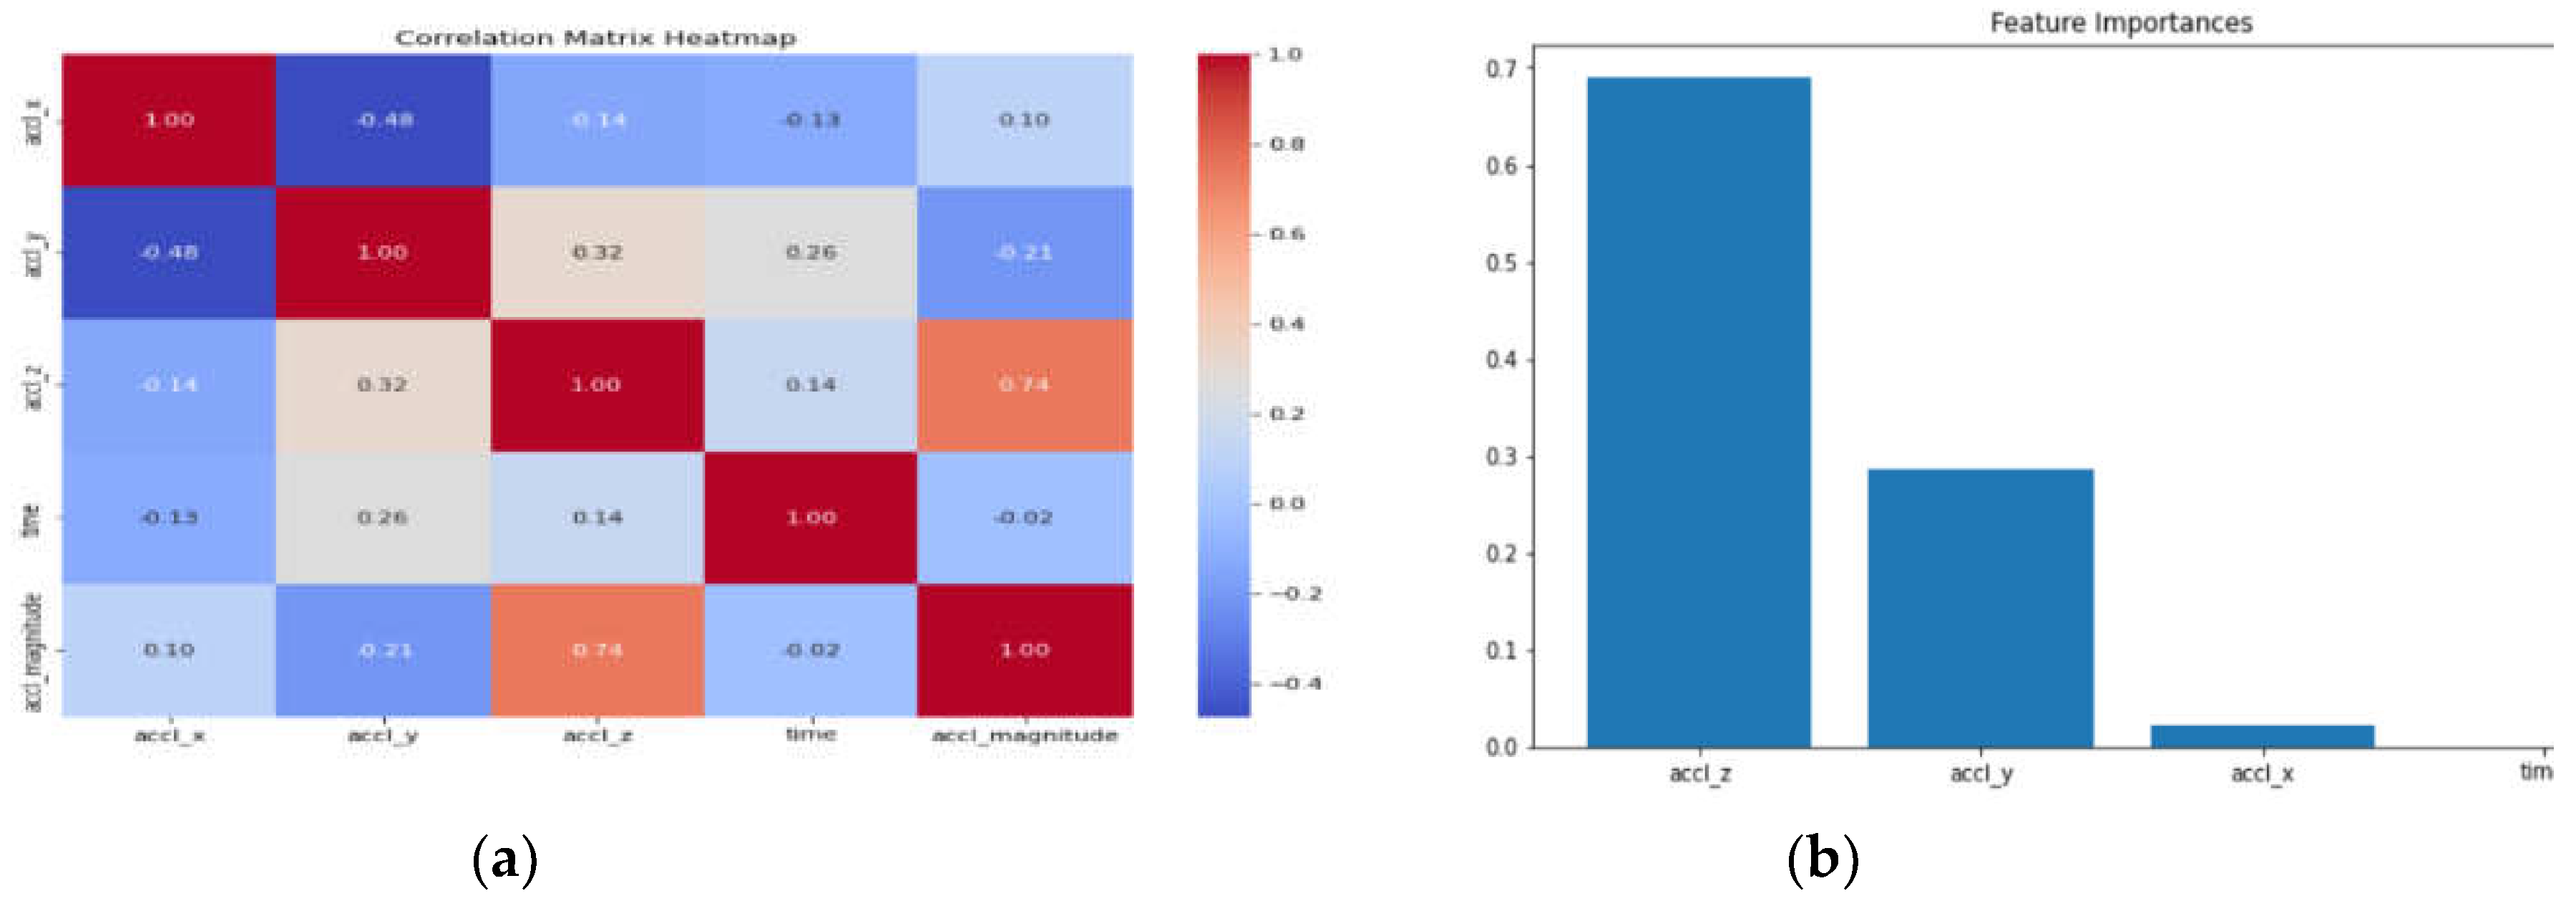
Table 1.
IRI vs Road Roughness Level.
| IRI Classification | IRI Value (m/km) | Standard Deviation of Vertical Acceleration (accl_z) | Road Condition Description |
| Very Smooth | 0–1 | < 0.3 | Excellent road condition, minimal vertical movement. |
| Smooth | 1–2 | 0.3–0.5 | Good road condition, slight vertical movement. |
| Moderately Rough | 2–4 | 0.5–0.8 | Average road condition, noticeable vertical movement. |
| Rough | 4–6 | 0.8–1.2 | Poor road condition, significant vertical movement. |
| Very Rough | > 6 | > 1.2 | Very poor road condition, severe vertical movement. |
Table 2.
IRI vs Driver’s Comfort Level.
| Comfort Level | IRI Value (m/km) | Mean Acceleration Magnitude (accl_magnitude) (m/s²) | Standard Deviation of Acceleration Magnitude (accl_magnitude) (m/s²) | Comfort Description |
| Very Comfortable | 0–1 | < 0.2 | < 0.1 | Extremely smooth, minimal vibrations. |
| Comfortable | 1–2 | 0.2–0.5 | 0.1–0.3 | Generally smooth, low vibrations. |
| Acceptable | 2–4 | 0.5–1.0 | 0.3–0.6 | Slightly rough, moderate vibrations. |
| Uncomfortable | 4–6 | 1.0–1.5 | 0.6–1.0 | Rough, noticeable vibrations. |
| Very Uncomfortable | > 6 | > 1.5 | > 1.0 | Very rough, strong vibrations. |
Disclaimer/Publisher’s Note: The statements, opinions and data contained in all publications are solely those of the individual author(s) and contributor(s) and not of MDPI and/or the editor(s). MDPI and/or the editor(s) disclaim responsibility for any injury to people or property resulting from any ideas, methods, instructions or products referred to in the content. |
© 2024 by the authors. Licensee MDPI, Basel, Switzerland. This article is an open access article distributed under the terms and conditions of the Creative Commons Attribution (CC BY) license (http://creativecommons.org/licenses/by/4.0/).
Copyright: This open access article is published under a Creative Commons CC BY 4.0 license, which permit the free download, distribution, and reuse, provided that the author and preprint are cited in any reuse.


