Submitted:
05 August 2024
Posted:
06 August 2024
You are already at the latest version
Abstract
This review is focused on the current status of quantitative MR (qMR) of skeletal muscle. The first section covers the techniques of qMR in muscle with the focus on each quantitative parameter, the corresponding imaging sequence, discussion of the relation of the measured parameter to underlying physiology/ pathophysiology, the image processing and analysis approaches, and studies on normal subjects. We cover the more established parametric mapping from T1 weighted imaging for morphometrics including image segmentation, proton density fat fraction, T2 mapping, diffusion tensor imaging to emerging qMR features such as magnetization transfer including ultralow TE imaging for macromolecular fraction, and strain mapping. The second section is a summary of current clinical applications of qMR of muscle; the intent is to demonstrate the utility qMR in different disease states of the muscle rather than a complete comprehensive survey.
Keywords:
quantitative muscle MRI
; fat fraction
; T2 mapping
; diffusion tensor imaging
; neuromuscular disease biomarker
1. Introduction
Quantitative MRI (qMRI) differs from conventional MRI in its ability to provide objective quantitative metrics of the underlying tissue [1]. Conventional MRI is a map of the signal intensities in different tissue where the signal intensities are a complicated function of the acquisition pulse sequence and the underlying tissue parameters. qMRI can capture non-visual metrics related to underlying tissue properties including the chemical structure and biological microstructure. Measurement of each metric, also referred to as parametric mapping (images of the parameter are computed on a voxel basis), requires a specially designed imaging pulse sequence coupled to an underlying biophysical model that provides the link between the observed parameter and underlying tissue properties. qMRI yields numerical values with a unit (e.g., distance, volume, relaxation times) or as a percent (e.g., proton density fat fraction). The qMRI approach provides the basis for developing imaging biomarkers; the latter can have significant clinical impact on diagnostics including earlier detection of disease, in the assessment of disease severity and therapeutic response, and on accurate prognosis. It has the potential to replace or complement biopsies enabling non-invasive assessment of the disease, increasing patient comfort while introducing minimal to no disturbance to the pathology of interest1. However, despite the compelling advantages of qMRI based biomarkers, it has yet to be adopted widely in the clinical setting [2]. The slow adoption to clinical practice is due to several reasons: (i) longer duration protocols arising from the need for performing different acquisitions for multi-parametric mapping and (ii) the lack of standards for qMRI including the large number of parametric image acquisition protocols as well as post-processing techniques [3]. The National Institute of Standards and Technology (NIST) hosted workshops in 2014 and 2017 with participants from over 16 organizations working towards standards in quantitative MRI [3]. The recommendations of the workshops included a call for efforts directed at standardizing the imaging and analysis protocols, as well as on developing phantoms with material composition and shape/size appropriate to the particular anatomy and method [3]. The clinical realization of qMRI is anticipated to occur once the standardized acquisition and analysis protocols along with reference phantoms are transferred to the clinic [3]. Toward this, the Radiological Society of North America (RSNA) organized the Quantitative Imaging BioMarkers Alliance (QIBA) [4]. QIBA’s mission is “to improve the value and practicality of quantitative imaging biomarkers by reducing variability across devices, sites, patients and time” [4]. Of the 22 imaging biomarker committees that span different modalities, there are 9 committees on qMRI techniques including a qMRI group devoted to musculoskeletal (qMRI-MSK) and another group to quantifying proton density weighted fat fraction (QIBA-MRI-PDFF) [4].
qMRI has been implemented extensively in the brain characterizing a wide range of neurological diseases, including conditions with inflammatory, cerebrovascular and neurodegenerative pathology [5]. A number of recent studies have explored qMRI in oncological applications to characterize malignancies in breast, lung, prostate and brain cancer, and to either monitor or for early prediction of response to anti-cancer therapies [6]. In the area of musculoskeletal applications of qMRI, there is a Musculoskeletal Biomarkers Committee of the QIBA with a focus on cartilage compositional and morphological characterization [7]. MRI-based cartilage compositional analysis is clinically significant as parametric changes can be identified in the early phases of osteoarthritis before morphological changes are seen in structural MRI [7]. Spin-spin relaxation time (T2) and spin-lattice relaxation time in the rotating frame (T1ρ) have emerged as the most viable approaches for characterizing cartilage composition; T2 reflects changes in water, collagen content, and orientation of collagen fibers, whereas T1ρ is more sensitive to proteoglycan content [7].
There are also several studies exploring qMRI in skeletal muscle and several metrics have been extracted and explored for their sensitivity to biochemical and microstructural changes in tissue in normal and in diseased states [8,9,10,11]. It has been applied to characterizing muscle in normal subjects including exploring differences based on age and sex, trained vs untrained and the effect of exercise [8]. The utility of qMRI in characterizing several disease conditions including dystrophy, late onset POMPE, and sarcopenia has been reported [12,13,14].
This review is devoted to the current status of quantitative MR (qMR) of skeletal muscle. The first section covers the techniques of qMR in muscle with the focus on each quantitative parameter, the corresponding imaging sequence, discussion of the relation of the measured parameter to underlying physiology/ pathophysiology, the image processing and analysis approaches, and studies on normal subjects. We cover the more established parametric mapping fromT1 weighted imaging for morphometrics including image segmentation, proton density fat fraction, T2 mapping, diffusion tensor imaging to more exploratory/less applied qMR features such as magnetization transfer including ultralow TE imaging for macromolecular fraction and MR strain mapping. The second section is a summary of current clinical applications of qMR of muscle; the intent is to provide the user a flavor for qMR in different disease states of the muscle rather than a complete comprehensive survey. We have not included spectroscopy in this review. We refer the interested reader to recent references of experts' consensus recommendations for proton and for phosphorous magnetic resonance spectroscopy [15,16].
2. Quantitative Magnetic Resonance Imaging
2.1. Muscle Morphology
Muscle volume, anatomical cross-sectional areas (CSA) and physiological cross-sectional areas (PCSA) are predictors of muscle strength [17]. Further, these morphological measures are clinically important in characterizing and tracking the progression of many diseases including muscular dystrophies, myopathies and sarcopenia [18,19]. While earlier studies extracted fiber lengths from ultrasound to compute PCSA, fiber lengths can now be conveniently determined by combining muscle volume from MR morphological imaging with fiber length from MR diffusion tensor imaging [20]. MR imaging has been successfully used to accurately quantify skeletal muscle volume and cross-sectional area (CSA) with <5% intra- and inter-observer reproducibility in several muscles including thigh and lower leg muscles [21]. However, quantification of muscle volume requires segmentation of the muscle over a stack of slices which is a tedious and time-consuming task if performed manually. In order to obtain a metric that is more readily extracted, Bamman et. al. have shown that it is possible to substitute the volume metric by cross sectional area measurements [17]. Lanza et. al. also compared muscle volume to anatomical cross-sectional area metrics and established that the different assessments do not affect the muscle size-strength relationship [22].
The T1 weighted fast spin echo (FSE) sequence is optimal for morphological imaging in terms of image quality and due to its reduced sensitivity to magnetic field inhomogeneities and has thus been used extensively in earlier studies for extracting muscle volume and or CSA [8]. However, volume acquisitions with gradient echo fat-water Dixon sequences provide speed, excellent SNR, and contrast for segmenting muscles [23]. Susceptibility artifacts are minimized in these sequences by acquiring at low TEs. Another advantage is that the Dixon methods also provide a fat fraction map which can be subtracted from the muscle volume (or CSA) to obtain the muscle volume (or CSA) of contractile tissue corrected for fat [10].
2.1.1. Image Processing (Segmentation)
It should be noted that segmentation still remains largely manual in most clinical settings [21]. Manual segmentation cannot be performed readily for 3D datasets for many muscles given that the process is both time intensive and operator dependent [21]. However, widespread use of qMRI for biomarkers depends critically on the ability to segment muscle volumes in an automated fashion [21]. An excellent recent review of the segmentation approaches developed for muscle tissue type and for muscle segmentation is given in Ref. [24].
An important segmentation task in muscle diseases is the identification of tissue composition (muscle, adipose, and connective tissue). Fuzzy c-means (FCM) clustering has been proposed that considers partial volume effects at muscle/fat boundaries as well as intramuscular fat infiltration; an extension of the FCM used dual echo images from an Ultralow TE acquisition to segment adipose and connective tissue from muscle tissue in calf muscle [25]. Figure 1 shows the results of the non-contractile vs contractile tissue volumes in a young (23 year) and a senior (83 year) participant; the higher amount of adipose and connective (non-contractile) tissue in the senior subject is clearly visualized.
The identification of the different compartments of fat has clinical implications and includes subcutaneous adipose tissue (SAT) which is separated from the internal adipose tissue (IAT) by fascia (e.g., fascia lata for the thigh). The fat regions within the fascia are further classified into intramuscular fat within each muscle region as well as perimuscular fat between the muscles. To identify the separate deposits of fat, it is important to identify SAT from IAT; the methods to achieve this are detailed in Reference [24]. Various methods have been proposed to identify the inner border of the SAT based on active contours and extensions such as gradient vector flow snakes [26]. Most of these algorithms perform accurately for healthy subjects but not as well in patients with high fat infiltration [24]. The next step is the identification of individual muscle volumes—this is important as fat infiltration occurs differently across muscles and further, there could also be a proximo-distal pattern of infiltration [24]. Segmentation of individual muscles is challenging as muscles have similar intensity and the boundaries between different muscles are thin and often not seen due to partial volume effects. Segmentation strategies based on pre-labeled atlases (manual labeling) use non-linear registration of the new data to the labeled atlas to identify individual muscles. Most atlas-based approaches have been developed for thigh and hip muscles [27] and extending to other muscles would involve developing new atlases and further, the applicability of atlases to identify muscles with high fat filtration has not yet been established. Semi-automated segmentation methods show promise; Ogier et. al. used a semi-quantitative method incorporating shape information and non-linear registration to propagate the contour from prior slices for fat quantification in the thighs and lower legs of healthy subjects and patients with myotonic dystrophy type 1 and obtained very good agreement with manual segmentations [28].
Deep Neural Networks (DNN) have recently made a huge impact in image segmentation including in medical image segmentation [24]. For image segmentation applications, DNN are supervised learning systems trained on manually segmented images. One of the requirements for robust segmentation is that the DNN be trained with a large number of images. A recent report compared several deep convolutional neural network (CNN) architectures (U-Net 2D, U-Net 3D, TransUNet, and HRNet) for segmenting ten thigh and calf muscles from control and subjects with neuromuscular disease (NMD) [29]. All CNNs performed well with high geometric accuracy for healthy subjects as well as those with NMD; however, the HRNet correctly identified all muscles. A recent publication using DNNs for segmentation focus on lower extremities and established that these systems are not only applicable for control healthy subjects but also subjects with pathology [30]. Agosti et al used MRI data from controls and subjects with facioscapulohumeral dystrophy (FSHD) and amyotrophic lateral sclerosis (ALS) to train CNNs with multi-echo spin echo and a multi-echo gradient echo [31]. The proposed network accurately segmented thigh and calf muscles even in the presence high fat infiltration. Further, the authors have released the automatic segmentation tool resulting as an open-source repository, available at the link in Reference [32].
Deep neural networks hold promise for automated muscle segmentation even in the presence of a high percentage of fat infiltration. While still in a relatively initial phase of development for muscle segmentation it continues to be an area of intense research activity. The applicability of the systems to images from different protocols, scanners, and institutions has to be demonstrated before widespread adoption. The availability of the systems as an open-source repository will clearly be a great start for a larger group of researchers to train and test the DNN systems.
2.2. Quantification of Fatty Infiltration in Muscle
Myosteatosis refers to fatty infiltration of skeletal muscle which occurs in a variety of conditions or combination of conditions including aging, disuse, injury, diabetes and neuromuscular disease [11]. Myosteatosis is associated with loss of muscle mass and strength and increased mortality among the elderly [33]. Adipose tissue is considered an endocrine organ that influences numerous physiological and pathological processes. During weight gain and with aging, adipocytes can reach their capacity to store fat, which increases ectopic storage of fat around and within the non-adipose tissue organs, such as skeletal muscle, liver, and pancreas. In the past decade, myosteatosis has emerged as an important fat depot associated with insulin resistance and Type 2 Diabetes [34]. There are two fat depots within skeletal muscle: fat infiltration within myocytes (intramyocellular fat) and visible fat within the fascia surrounding skeletal muscle (intermuscular fat) [11]. The quantification of both skeletal muscle fat depots can be determined by using invasive analyses such as skeletal muscle biopsy samples, or, by using noninvasive radiological techniques such as computed tomography (CT), magnetic resonance imaging (MRI) and magnetic resonance spectroscopy (MRS).
2.2.1. Fat quantification Based on Chemical-Shift Encoded (CSE) Imaging
The original two-point Dixon method relies on the differences in resonant frequencies between water and the main fat peak to generate images where fat and water signal are in-phase or out-of-phase at specific echo times [35]. These in- and out- phase images are then combined to yield a magnitude-based fat fraction image. However, the simple two-point Dixon method is prone to errors in fat quantification that arise from various sources: including main magnetic field inhomogeneities, and other confounding factors such as T1, T2, noise bias, T2* correction, spectral complexity of fat, eddy currents, and J-coupling [35]. While the extended Dixon methods address main magnetic field inhomogeneities, they do not address the multiple spectral peaks of fat which leads to fat and water being incompletely separated [35]. The state of art sequences offer correction for inhomogeneities and confounders and are based on multi-echo SPGR volume acquisitions that model the multiple resonant frequencies of fat, estimate and correct for T2* in the presence of fat, and use a special reconstruction called Iterative Decomposition of Water and Fat with Echo Asymmetry and Least Squares Estimation (IDEAL) to extract the MR-Proton density weighted fat fraction (MR-PDFF) [36]. This fat quantification sequence or a close variant is available on commercial scanners (IDEAL-IQ on GE, qDIXON on Siemens and mDIXONQuant on Philips scanners) [37]. The QIBA MRI-PDFF committee reported a large-scale study using a commercial PDFF phantom (12 vials with fat fraction from 0 to 100 %) that confirmed the accuracy of MRI in determining fat fraction obtained for multiple vendors, at both 1.5 T and 3.0 T, and for multiple pulse sequences [38]. The results from this study provide a measure of confidence to physicians who are using or planning to integrate PDFF as a biomarker for skeletal muscle disease.
Given the clinical importance of fat infiltration in skeletal muscle, a number of studies have investigated fat quantification in skeletal muscle. These studies are detailed later in clinical applications of quantitative biomarkers for pathological muscle while studies on normal subjects are summarized here. PDFF of the paraspinal musculature in normal subjects has been shown to be significantly lower in men compared to women and further, significantly correlated with age [39]. Significant age-related differences in calf muscle composition (adipose from PDFF and fibrosis from ultra-low TE imaging) has been reported in a cross-sectional study of young and senior subjects [40]. In another study, PDFF measurements correlated significantly with paraspinal isometric strength and was a better predictor of paraspinal muscle strength beyond CSA [41].
2.2.1.1. Analysis of Fat Fraction Maps
The output of the IDEAL and its variants are separated fat and separated water signal images. In-phase images are then calculated by taking the sum of the separated water and fat images while out-of-phase images are calculated by taking the absolute value of the difference of the separated water and fat images. Fat fraction images are generated from the ratio of the separated fat signal over the sum of the separated water and fat signals [11]. There are several different approaches to analyzing the fat fraction maps. A threshold can be applied to the fat fractions map to identify fat dominant regions; however, the selection of the threshold is arbitrary and measured adipose tissue volumes will vary with the threshold. Karampinos et al reported PDFF for calf muscles in subjects with diabetes and provide a comprehensive assessment of PDFF in different compartments including the subcutaneous adipose tissue (SAT), individual muscle ROIs (defined as intramuscle fat, intraMF), and intermuscular fat (denoted interMF) which is the region between individual muscles (Figure 2) [42]. It should be noted that in the latter work, the segmentations of the individual muscles were eroded to exclude edge pixels (the latter are included in the interMF). The sum of intraMF and interMF is the intramuscular adipose tissue (IMAT). This latter study showed that significant differences between normal and Type 2 Diabetes Mellitus subjects were seen only in interMF and not in IMAT [42]; this finding emphasizes the importance of determining fat fraction separately in different compartments. A note of caution is the decreased ability to obtain accurate fat fraction in the presence of significant fibrosis (e.g., in Duchenne Muscular dystrophy). The low signal in voxels with fibrotic tissue in both water and fat images can bias the estimation of PDFF.
2.3. T2 Mapping
The spin-lattice relaxation time, T2 is sensitive water mobility in tissue and since water mobility is very different in the intracellular and extracellular regions, it is reflective of the relative amounts of water in the intracellular and extracellular muscle compartments. In its simplest form, T2 can be measured by the signal decay in two images acquired at two TEs. It is routinely measured by a multi-spin echo (MSE) sequence with a single excitation RF pulse followed by multiple refocusing 1800 pulses to acquire images at different TEs; typical number of acquired echoes is ~15-18 echoes with the first echo acquired at TE time of ~8 ms (min TE) and an echo spacing of ~8 ms [10].
Earlier studies on ex-vivo tissue identified multi-exponential T2 decay which modeled the decay as arising from multiple compartments [10]. However, Saab et al showed, using a novel technique with the first echo acquired at TE of 0.6 ms and 2000 echoes that acquired data in a single large voxel, that multi-exponential decay is also present in in-vivo muscle tissue [43]. They compared this latter technique with a standard imaging sequence with 6 echoes and min TE of 18ms. The former technique revealed multi-exponential relaxation with lowest T2 component (< 5ms) arising from the hydration shell of macromolecules such as proteins while the longest T2 at 283ms was a very small fraction and was potentially assigned to either ‘free water’ or vascular blood. Of interest are the three intermediate peaks, the longest T2 component (~100ms) of these corresponds to water in the interstitial (extracellular) compartment (10% fraction) while the T2 components in the range of 25-45ms were of intracellular origin (85% fraction). However, the standard imaging sequence yielded 31ms when the data was fit to a mono-exponential decay. It is important to understand that from a clinical perspective, an increase in the interstitial space and consequently, the extracellular water will result in an increase in the measured T2. It should be noted that elevated T2 values occur in a variety of tissue conditions: inflammation, tumor, necrosis, and denervation, and also in response to the acute changes that occur after exercise of moderate to high intensity. However, though changes in T2 are non-specific, it can still be clinically effective as a tool for monitoring ‘disease activity’- i.e., as a sensitive indicator of disease severity that shows immediate responsive to underlying pathological processes [10].
The above background provides the basis for understanding the relationship of T2 to pathology. Skeletal muscle edema can be caused by a number of pathologies including from trauma, early myositis ossificans and inflammatory myopathies. Edema results in an increase in the interstitial space which results in the increase in T2. This T2 elevation is seen with many pathological conditions (e.g., idiopathic inflammatory myopathies [44], and Duchenne Muscular Dystrophy [12]). It should be noted that the earliest studies employed T2 mapping in order to localize muscle activation as well as to identify patterns of muscle activation with exercise [45].
Another aspect of muscle T2 imaging is the infiltration of fat that occurs with age and in most pathological muscle conditions [10]. Since T2 of fat is longer than that of muscle, increases in fat infiltration will lead to elevated T2 values [46]. Fat suppressed sequences can be used to extract the T2 of muscle [44] but these can suffer from inadequate fat suppression. A different approach taken in other studies is to use the T2 values as a metric of fat infiltration [47]. But this precludes the identification of other intrinsic changes in muscle like inflammation that can also result in T2 elevation. The T2 of water and the T2 of fat can be extracted from a multiexponential fit to the experimental data enabling one to disambiguate the effects of inflammation from that of fat infiltration [8].
There has been a long-standing research effort at implementing T2 mapping that demonstrate spatial patterns and intensity of muscle activation; this approach has also been called muscle functional imaging [45]. It has been well established that muscle T2 increases with exercise [48]. While earlier studies hypothesized that the exercise induced T2 increases were primarily from an increase in extracellular fluid volume, it is now accepted that the increase in T2 arises from an increase in muscle volume as a consequence of an accumulation of intracellular water driven by osmotically and/or hydrostatically driven fluid shifts [45].
2.3.1. T2 Analysis
The experimental data can be fit to a mono- or multi-exponential fits using nonlinear curve-fitting methods. In order to avoid making assumptions about the number of exponential decays that are required to model the experimental data, nonnegative least squares (NNLS) fitting can be used where the algorithm produces a spectrum of T2 values [10]. When the data is fit to a mono-exponential decay, it yields an average T2 from both the water and fat compartments of muscle and is referred to as the ’global T2 relaxation time’ [45]. As discussed above, the global T2 will be influenced significantly by the extent of fat infiltration and will shift to longer T2s with higher intramuscular fat. The bias to longer T2s can be understood by comparing the T2 of muscle (33ms @3T) to that of fat (150ms @3T); as fat fractions increase (e.g., in patients with muscular dystrophy), ‘global T2 values’ will shift to longer T2s. In order to identify the intrinsic T2 changes in water (muscle) with pathology, one can selectively excite water or suppress fat. Another approach is to fit the data to bi-exponential or tri-exponential fit where the unknowns of the fit are the fat fraction, the T2s of water and fat. This approach requires a fairly large number of echoes for a robust fit as there are many fit parameters. Azzabou et. al. reported that a tri-exponential fit to multi-echo data with a 17 echo multi-echo spin-echo sequence [49]. This latter study extracted muscle water T2 which was independent of fat over a large range of fat fraction in muscle. Recently, an Open-Source toolkit for water T2 mapping that implements fast reconstruction enabled by extended phase graphs (EPG) simulations and dictionary matching implemented on a general-purpose graphic processing unit has been reported [50], further enabling T2 mapping to be implemented by the clinical community.
2.4. Diffusion Tensor Imaging (DTI)
Diffusion arises from random motion of particles suspended in a liquid or gas and results in a displacement of particles and the square of the average displacement, <x2>, is governed by Einstein’s diffusion equation, which in 1D is given by: <x2>=, where D is the diffusion coefficient that quantifies the extent of diffusion and is characteristic of a given tissue and t is the diffusion time [51]. The diffusion coefficient in tissue differs from bulk diffusion coefficient in water as the former is hindered by a number of factors including macromolecules and restricted by cells, membrane walls and permeability. Diffusion in tissue is described by the apparent diffusion coefficient (ADC) to distinguish it from the bulk free diffusion coefficient.
The measurement of ADC in a diffusion weighted MRI sequence is accomplished by the addition of strong magnetic field gradients that sensitize the signal to the small displacements arising from diffusion [52]. However, this simultaneously sensitizes the image to physiological and other gross motions that would cause severe artifacts in conventional diffusion weighted spin echo sequence. To circumvent these artifacts, a single shot acquisition called echo planar imaging (EPI) is used which acquires all the data with a single excitation RF pulse [52]. However, this ultrafast technique suffers from low SNR, as well as eddy current, and susceptibility related artifacts; these latter two effects result in geometric mis-mapping and local deformations as well as signal loss/signal bunching [53]. Post-processing pipelines usually employ different algorithms to denoise as well as to correct for artifacts prior to extraction of diffusion metrics [54].
Muscle is a highly organized tissue in which connective tissues (endo-, peri- and epimysium) create a complex network to enclose fibers, fascicles and total muscles leading to human skeletal muscles being anisotropic media. An extension of diffusion weighted imaging is diffusion tensor imaging (DTI) in which diffusion gradients are applied in different directions to extract direction dependent diffusion [55]. Thus, DTI is ideally suited to explore the anisotropic tissue microstructure as in muscle. The tensor computation process yields the largest diffusion value also denoted as the primary eigenvalue and two smaller diffusion values in two orthogonal directions that are ranked by magnitude as the secondary and tertiary diffusion eigenvalues [55]. Other diffusion metrics include the mean diffusivity (MD) which is the average of the diffusion eigenvalues while the anisotropy of diffusion is captured by the fractional anisotropy (FA) metric (a measure of the difference in eigenvalues).
DTI also provides the basis of fiber tracking: the direction of the primary eigenvalue is extracted from the computed tensor so that the ‘fiber’ direction is available at each voxel [55]. Fiber tracking algorithms use the primary eigenvector direction for 3D muscle fiber tractography. The tracking starts from either a manually or automatically identified region of interest and terminated when stopping criteria based on FA range, max angular change per tracking step, and/or anatomical boundary are met. There are several freeware programs that were developed originally for brain imaging that can be adapted for muscle DTI and fiber tractography as well [56]. Recently, a DTI Matlab toolbox was released that allows users to perform tractography as well as to obtain muscle architectural parameters including fiber length, pennation angle, and curvature [57]. Figure 3 is an example of fiber tracking in the medial gastrocnemius using this toolbox customized to the acquisition in the authors’ lab.
In order to understand the changes in DTI indices with conditions such as disease, exercise, or disuse, it is important to know the factors that affect diffusion. While the resolution of DT-MRI precludes direct observations at the tissue microscopic scale, the DTI indices may allow for indirect inferences about the microarchitecture of skeletal muscles. The measured diffusion indices reflects both intracellular and extracellular water volumes and a change in either (cell swelling and/or extracellular edema) will result in changes in the diffusion eigenvalues [55]. Other potential influences on the diffusion properties of muscle include changes in cell diameter and membrane permeability changes [58]. While there is general consensus that the direction of the lead eigenvector corresponds to the muscle fiber direction, there is less certainty about the two eigenvectors corresponding to the secondary and tertiary eigenvalues respectively. Galban et al. proposed that the second eigenvalue, λ2, corresponds to diffusion in the endomysium while the third eigenvalue, λ3, reflects intracellular diffusion and is thus sensitive muscle fiber diameter [59]. Karampinos, et al. proposed an interesting diffusion tensor model that considers the cross-sectional asymmetry of muscle fiber geometry [60]. In the latter model, diffusion occurs within the muscle fiber and the extracellular space and λ2 and λ3 reflect the principal diameters of the elliptical cross-sectional area of the myofibrils. Recent diffusion modeling studies support the model by Karampinos et al where reductions in asymmetry of fiber morphology is seen in the case of disuse simulated by unilateral limb suspension and in a cross-sectional study of aging effects [61,62]. It is potentially likely that changes in fiber diameter would be reflected in changes of one or both of λ2 and λ3 and in FA. In summary, diffusion indices are related in a complex manner to free water in the different compartments, cell wall permeability, as well as muscle fiber diameter and cross-sectional asymmetry.
The application of DTI to characterize disease conditions is detailed later while a brief summary of studies on normal subjects is provided here. DTI derived indices have been shown to be sensitive to age [59,63], and environmental factors (disuse, exercise) [61,64,65]. Age related effects of DTI changes in the calf plantarflexors have been attributed to muscle atrophy or to the combined effects of an increase in extracellular volume and a decrease in muscle fiber diameter (from muscle atrophy) [59,63]. Froeling et al reported that eigenvalues and FA were increased in thigh muscles of amateur long-distance runners up to 2 days after running a marathon [64]. The combined application of DTI and T2 mapping allowed the differentiation of microstructural changes caused by active exercise or endurance training [65]. Sinha et al found that all eigenvalues decreased with disuse simulated by unilateral limb suspension and diffusion modeling yielded smaller diameter and more symmetric fibers post-suspension [61].
In addition to the information provided by the DTI derived indices, DTI also enables the study of tissue architecture through the ability to perform fiber tractography [66]. Fiber tracking in calf, thigh and forearm muscles, reproducibility and validation of the architectural parameters have been reported [66]. Further, a multi-center trial including six MRI 3T sites and five travelling subjects reported excellent reproducibility of DTI and architecture measures in calf muscle with semi-automated segmentation of the calf muscles [67]. DTI fiber tractography has also been performed outside of the extremity muscles; in the masseter muscle fiber tracking confirmed regional differences in the fiber orientation change between different mandibular positions [68]. Fiber tractography has also enabled 3D visualization of the three major levator ani subdivisions, which can inform in-vivo functional anatomy [69]. Interest in DTI of pelvic floor muscles was triggered by initial results that showed fiber tractography might be able to reveal microstructural abnormalities in the pelvic support that are not noticeable using conventional MRI techniques [70]. DTI based fiber tracking also identified age-related significant differences in fiber length and pennation angle of the gastrocnemius muscles between young and senior subjects; these results agreed with ultrasound measurements [63].
While indices derived from DTI are sensitive to tissue microstructure, they are not direct measures of tissue microstructure. Models of diffusion in muscle have been proposed that are customized to the geometry and tissue subtypes in skeletal muscle. The Random Permeable Barrier Model (RPBM) has been applied to normal muscle, to monitor the effect of exercise on muscle tissue microstructure in normal and diseased conditions as well as to tracking induced atrophy and recovery (Reference [71] and references within). The RPBM model treats muscle as a volume with randomly oriented infinite flat semipermeable membranes and the time dependence of the transverse diffusion coefficient is fit to the model to extract parameters of the tissue microstructure. The RPBM study of atrophy found that the myofiber diameter was a stronger predictor of atrophy than either anatomical measurements such as cross-sectional area or empirical diffusion parameters [71]. The RPBM applied to a cross-sectional study of young and senior subjects revealed that fiber diameter from RPBM fits compared to that from histology had the highest correlation for the fit to λ2(t); these fits also predicted a decrease in fiber diameter and an increase in cell permeability with age (Figure 4) [62]. The age-related patterns in λ2(t) and λ3(t) could tentatively be explained from RPBM fits; these patterns may potentially arise from a decrease in fiber asymmetry and an increase in permeability with age [62]. DT-MRI RPBM metrics has recently been shown to agree with histology in Becker’s dystrophy including muscle fiber size and variability indicating that the modeling approach shows promise as imaging biomarkers for muscular dystrophies [72].
2.5. Fibrosis Quantification
Most of the MRI quantification methods to document compositional changes with pathology have focused on quantification of fat fraction. However, it should be recognized that another major change that occurs in skeletal muscle is fibrosis, i.e., the replacement of contractile tissue by connective tissue that has a high percentage of collagen [73]. The replacement of contractile tissue in fibrosis has a greater negative impact than fat infiltration since the latter only affects the amount of muscle tissue while the former affects both the contractile tissue volume as well as the ability to transmit force [74]. In aging muscle, the loss of muscle mass is disproportionately smaller than the loss of muscle force [75]. Some of the force loss has been predicted from computational modeling to arise from impairment in lateral transmission of force caused by an increase in the connective tissue (increase in width of the extracellular matrix) [76]; this was also indirectly inferred from dynamic studies of muscle function [77,78]. Fibrosis is also present in muscular dystrophies such as Duchenne muscular dystrophy (DMD) and importantly, an increase in endomysial tissue occurs before any degeneration in skeletal muscles can be detected [73]. Recognizing the contribution of fibrosis to DMD, anti-fibrotic therapies have been developed [73]. MRI techniques to characterize fibrosis and monitor response to therapy will be a very useful tool for evaluation of neuromuscular diseases. Unfortunately, there are no established MRI approaches to directly image fibrosis as there are for quantification of fatty infiltration [8,9]. Here, we discuss two techniques (Magnetization transfer contrast and ultralow TEs) that have not yet been fully established but show promise as imaging markers of fibrosis. Collagen and other macromolecules of the extracellular matrix as well as their hydration water molecules have very short T2s such that they are not ‘visible’ on conventional images acquired with a TE of 5-10ms. However, these very short T2 species can be imaged indirectly via magnetization transfer contrast or by imaging at extremely low TEs to capture the signal from even the very fast decaying protons.
2.5.1. Magnetization Transfer Contrast
Magnetization Transfer (MT) describes the interaction of tissue water protons that reside in different environments, encompassing the “free” water proton pool responsible for the conventional MR imaging signal intensity and the “restricted” proton pool where protons are bound to macromolecules [79]. Protons in the bound pool, such as those bound to myelin, collagen and proteoglycan, have a very short T2, making it difficult to image them directly [79]. However, a selective off-resonance radio frequency (RF) pulse can be applied such that the free pool remains unperturbed, while protons in the bound pool are saturated. The exchange between the excited (saturated) bound pool and the free pool effectively reduces the free pool net magnetization. Skeletal muscle exhibits a strong magnetization transfer contrast (MTC) though the origin of this contrast is still not definitively established. The primary contribution is hypothesized to come from the collagenous proteins of the extracellular matrix [80,81], but there is increasing evidence that there are contributions from the large abundance of contractile proteins [82].
The simplest imaging technique to obtain an estimate of the MT effect is the magnetization transfer ratio (MTR) calculated from the signal intensity with and without the off-resonance RF pulse. Since it requires only two measurements, it is fast and clinically practical [79]. However, MTR values are pulse sequence, T1, and RF field homogeneity dependent [79]. On the other end of the spectrum, the quantitative magnetization transfer (qMT) techniques fit appropriately acquired MRI data to a two-pool model of magnetization exchange between protons bound to macromolecules and free protons, providing estimates of the relaxation and exchange rates as well as the ratio of the sizes of these two pools [80,81]. A faster, computationally simple, semi-quantitative index of Magnetization Transfer that does not fit to a two-pool model but derives an index of Magnetization Transfer denoted as MTsat has also been implemented [83]. This index, unlike MTR, is independent of pulse sequence, T1 and RF field homogeneity. MTR, qMT, and MTsat mapping has been reported for skeletal muscle [80,81,84,85,86].
Age- and gender-based differences in MTR (corrected for B1 inhomogeneities) and MTsat have been reported [84,85,86]. MTR and MTsat were both correlated negatively with age. It should be noted that of three quantitative markers (T2, fat fraction and MTR), T2 and Fat fraction were significantly positively corelated while MTR (adjusted for fat fraction as a covariate) was significantly negatively correlated with age [87]. However, in terms of effect size, MTR was the largest indicating that this metric may be a clinically useful biomarker. MTsat (with fat suppression), like MTR, was also significantly negatively correlated with age and was higher in males than females [85,86]. These results are contradictory to the hypothesis that the MT effect in muscle is a measure of the collagen macromolecule. If that hypothesis is correct, then a positive correlation of MT indices with age is anticipated since fibrosis (and thus, collagen) increases with age. Morrow et al concluded that age related decrease in MTR may arise from myofiber quality and density changes with age [84]. Support for the contribution of contractile proteins to MTR also comes from a rat model study of MTR to track muscle fiber formation after injection of human muscle progenitor cells for development of muscle tissue [82]. In the latter study, MTR increased with myogenesis and correlated well with muscle contractility measurements. These studies suggest that biopsy studies are critical to show the correlations of MT indices to macromolecules in muscle.
2.5.2. Ultralow TE (UTE) Imaging
Ultralow TE imaging, as the name implies, acquires the signal at TE values as low as 8μs; typically sequences with TEs in the range of 8μs to 200μs is classified as UTE imaging. Imaging at 8μs -200 μs will render many short T2 species visible. Figure 5 shows fibrotic and adipose voxels (after thresholding) extracted from the calf plantarflexors using a combination of UTE (for low T2 tisues) and IDEAL (for fat) imaging in a cross-sectional study of young and elderly subjects [40]. The latter study showed significant increase of fat and connective tissue fraction in the older cohort.
One of the big challenges in extracting the short T2 species is that signal from the long T2 species is overwhelming. One of the methods suggested is to subtract a longer TE image from a UTE image (there is no contribution from short T2 species in the longer TE image); however, the image subtraction is very sensitive to magnetic susceptibility effects resulting from the long T2* weighting of the images and the initial fast dephasing of the multiple fat resonances mimics short T2 tissue and thus their signal is not subtracted. To overcome this, Araujo et al [87] suggested an extension of the dual-echo method that considers the T2* decay of long T2 components and also corrects for the oscillating behavior of the signal from the different lipid resonances in fat. This idea was also implemented in another study that integrated the fat fraction and T2 information from an IDEAL sequence with a dual echo UTEs sequence to extract macromolecular fractions (MMF) [88]. The latter study extracted MMF from UTE images acquired at 30μs and at 200μs illustrating the potential to identify different macromolecules in muscle (e.g., collagen, contractile proteins) by selection of the appropriate TE for the UTE echo.
2.6. Strain and Strain Rate Imaging
Strain and strain rate are kinematic properties that can be derived from the displacement (strain)- and velocity (strain and strain rate)-encoded magnetic resonance (MR) images and have been used to characterize deformation in skeletal muscle [74,77,78]. Strain describes how the tissue is deformed with respect to a reference state and requires tissue tracking. Strain rate describes the rate of regional deformation and does not require tracking or a reference state since it is an instantaneous measure. A positive strain or strain rate indicates a local expansion whereas a negative strain or strain rate indicates a local contraction. A number of dynamic studies have used velocity-encoded phase-contrast (VE-PC) sequences to extract muscle tissue velocities during a contraction paradigm. Other sequences like DENSE encode displacement while MR tagging is an alternate sequence where the tagged lines/grid are tracked to quantify strain [89,90].
Strain ad strain rate tensor imaging of the lower leg was used to study age-related differences between younger and older subjects [78,91]. Maximum shear strain was shown to correlate with force in this cohort of young and old subjects [91]. Figure 6 shows images of different indices extracted from the strain and strain rate tensor data of the lower leg during isometric contraction at different %MVCs of a young subject from Reference [91]. Strain rate tensor imaging of disuse atrophy also identified maximum shear strain as a significant predictor of force loss with disuse [77]. The authors of the latter paper speculated that the dependence of force on shear strain may be related to the mechanical properties of the extracellular matrix that may get stiffer with age [77,91]. Recent developments in accelerated VE-PC imaging using compressed sensing have enabled multi-slice imaging and extraction of the 3-D strain tensors [91].
3. In Vivo Clinical Applications
3.1. Duchenne Muscular Dystrophy (DMD)
DMD is an X-linked recessive genetic disease caused by mutation of the dystrophin gene and is characterized by severe, progressive muscle wasting. The dystrophin protein connects the muscle cytoskeleton with the extracellular matrix and prevents the muscle membrane from being damaged during muscle contraction [92]. Therefore, loss of the dystrophin protein leads to degeneration of muscle fibers, chronic inflammation, progressive fibrosis and muscle replacement by fat. While currently there is no cure for DMD, there are many new treatments that show promise, some of these treatments are now in clinical trials [93]. Further, there are rehabilitation training programs to improve muscle function [94]; this training has been shown to be most effective in affected muscles in the early stages of the disease [92]. Baseline and longitudinal assessment of subjects with DMD can be realized by sensitive non-invasive biomarkers. These biomarkers should be able to objectively characterize disease severity and progression in muscles as well as the response to pharmacological and/or rehabilitation treatment. MRI enables non-invasive, repeatable, and objective assessment of individual muscles. It is also evident from Section 2 on the techniques, that the consequences of the loss of dystrophin protein listed above can be tracked using MRI. A recent meta-analysis of publications of MRI in DMD till 2019 concluded that additional larger clinical trials, more validation studies to histology standards, and multiparametric MRI mapping are needed to establish MRI as a biomarker in DMD [95].
There are many clinical studies that have established qMRI as being able to successfully characterize and to monitor DMD. Conforming earlier work, Yin et al showed the T2 of thigh muscles of DMD subjects was significantly longer than control subjects and that functional outcomes were significantly correlated with the overall mean T2 relaxation time [96]. The earlier papers focused on quantifying fat infiltration and used T2 as a surrogate marker of fat and confirmed that fat fraction was highly positively correlated with fat fraction from MR spectroscopy [97]. Kim et al explored fat suppressed T2 mapping for edema quantification and concluded that fat fraction rather than edema was more highly correlated with clinical evaluations [98] The calf muscles have also been studied as there is slower progression in the distal muscles allowing extended longitudinal monitoring [99]. This latter study found significant correlations between the change in all soleus T2 (nonfat suppressed T2) and change in functional measures over two years. Mankodi et al implemented IDEAL-CPMG to extract fat fraction and T2,w in the thigh muscles of subjects with DMD and healthy controls and concluded that fat fraction and T2,w may be useful as independent biomarkers of fat infiltration and inflammation respectively [100]. Figure 7 shows that IDEAL-CPMG can disambiguate fat infiltration from inflammation in the fat fraction and water T2 maps. A longitudinal study of DMD subjects over a one-year time period used quantitative MRI (3-point Dixon for F/W, T2 and T1 mapping) to identify the most responsive muscle and predict subclinical disease progression in functionally stable patients. The latter study concluded that qMRI biomarkers are responsive to disease progression, can also detect subclinical disease progression and that the Gluteus maximus is the most responsive to disease progression [101].
The majority of quantitative MR studies on subjects with DMD have focused on fat fraction and T2 mapping. However, DTI has also been used to identify differences in fiber organization in diseased and healthy muscle tissue. Hoojimans et al combined DTI with quantitative in-vivo measures of mean water T2, %fat and SNR to evaluate their effect on DTI parameter estimation in DMD subjects and healthy controls [102]. Analyzing voxels with a baseline SNR above a certain threshold (to exclude voxels with high fat fraction), the latter study reported significantly greater values for MD and for the third eigenvalue in the anterior tibialis and in the lateral gastrocnemius muscles and no significant change is fractional anisotropy in DMD subjects compared to controls. This study underlines the need to account for the effect of confounders on diffusion indices to detect true between-group differences between controls and subjects with DMD [102]. Another study of DTI of thigh muscles of DMD subjects and health controls showed that, for all the thigh muscles, the MD was higher and FA values lower compared to healthy controls and correlated with grade of fatty infiltration; these findings indicate that DTI can be used to characterize DMD induced muscle damage and extent of disease severity [103]. More DTI studies with particular attention to effective fat suppression and the baseline SNR of analyzed voxels are required to obtain consistent and reliable measurements independent of the degree of fat infiltration.
3.2. Idiopathic Inflammatory Myopathies (IIM)
The idiopathic inflammatory myopathies (IIMs) are a group of autoimmune conditions characterized by inflammation of muscle (myositis) that present with weakness, elevated muscle enzymes, inflammatory infiltrates on biopsy, and can be accompanied by other systemic manifestations [104]. It results in inflammation in other organ systems, resulting in widespread organ dysfunction, increased morbidity and early mortality. The IIMs include dermatomyositis (DM), necrotizing autoimmune myopathy (NAM), sporadic inclusion body myositis (sIBM), overlap myositis and antisynthetase syndrome (ASyS), and polymyositis (PM) [104]. Qualitative and quantitative MRI play an important role in IIM not only as a diagnostic tool but also in monitoring progression and response to therapy [105].
Myositis is accompanied by both fatty infiltration and inflammatory changes [104]. Qualitatively, fatty infiltration is seen as hyperintensity on T1-weighted images while the fat fraction can be quantified by a 3-point Dixon or more accurately by sequences such as IDEAL or its equivalents [35,36]. Qualitative detection of inflammatory changes is performed on T2-weighted sequences where they appear as hyperintensities. It is important to note that fat should be suppressed on T2-weighted sequences since it also presents as an hyperintense signal [104]. T2 mapping is used for quantification of inflammation and as in T2 weighted imaging, it is important to suppress fat to exclude the contributions from fat infiltration that accompanies chronic muscle damage. Yao et al showed the feasibility of generating fat corrected T2 maps by incorporating information from fat fraction maps; they show that T2 was as responsive as fat corrected T2 when either is used for qualitative scoring [106]. A note of caution is that qualitative T2,w imaging may fail to detect diffuse inflammation as shown in Figure 8. It should also be noted that T2,w can be as high as 50ms (15ms above normal condition) in untreated IIM, values that are rarely seen in other muscle conditions [104]. Another important aspect is that in the IBM type of IIM, T2,w showed early changes before significant intramuscular fat accumulation, providing potential measures of early disease before irreversible changes occur [105]. The anatomy covered in IIM is the lower extremity and sometimes restricted to only the thighs but whole-body imaging can be useful to detect patterns of muscle involvement and fatty infiltration specific to each IIM [104,105].
Diffusion tensor imaging has been applied to study muscles of subjects with myositis (specifically PM and DM) [107,108]. Both studies found that ADC and the three eigenvalues of edematous muscle was significantly increased compared to normal control subjects as well as to non- edematous muscle [107,108]. This is not surprising since inflammation increases free water (seen as an increase in T2,w) and DTI indices maybe tracking the changes in free water. In the second study, which was a faster DTI acquisition, they also found lower FA values in edematous muscle [108]. The role of diffusion tensor imaging in myositis awaits further studies.
3.3. Pompe Disease
Pompe disease is characterized by a deficiency of acid alpha-glucosidase (AAG) that results in muscle weakness and a variable degree of disability [109]. AAG deficiency leads to accumulation of glycogen within the lysosomes of the cells in multiple tissues, including skeletal, cardiac, and smooth muscle. There is an approved therapy based on enzymatic replacement (ERT) alglucosidase alfa that has modified disease progression [110]. qMRI can potentially detect subtle changes with treatment in Pompe disease in muscle structure, fat and glycogen content even before the effects are seen clinically in muscle function tests [109]. An excellent review of MRI in Pompe disease is available in Reference [109]. Figure 9 shows whole body T1 weighted MRI revealing typical patterns of muscle involvement in Late-onset Pompe disease (LOPD).
Rehmann et al used qMRI including quantitative Dixon for fat fraction and diffusion tensor imaging to image the thigh muscles of subjects with LOPD and compared to healthy controls. The DTI metrics included mean diffusivity (MD), eigenvalues (λ1-3), radial diffusivity (RD) and fractional anisotropy (FA) [111]. They found that even thigh muscles with <10% fat-fraction showed significant differences in all the diffusion parameters except for FA; all the diffusion values were significantly lower and this has been hypothesized to arise from the accumulation of glycogen in muscle fibers that restricts water mobility and therefore, DTI could potentially reveal important structural changes early in the progression of the disease even prior to fatty degeneration [111]. The EMBASSY study followed 16 LOPD subjects on ERT and assessed the changes from baseline to 6 months using histology based (% tissue area of glycogen), MR imaging (T1w, T2, fat fraction) and muscle function biomarkers. The glycogen area decreased and function improved but there were no changes in the MR assessment over the 6-month period [112].
Long term follow-up of LOPD subjects treated by ERT for fat infiltration in psoas and paraspinal muscles based on conventional MRI revealed significant increase between baseline and at 39 months which also correlated with a decrease in performance [113]. However, both fat fraction and performance did not change in the long-term follow-up (63 months) showing promise for ERT [113]. A follow-up of LOPD subjects with qMRI showed that fat fraction increased significantly in every thigh muscle by an average of 1.9% per year in ERT treated patients, compared with 0.8% in pre-symptomatic patients [114]. The authors of the latter study also observed a significant correlation between changes in fat fraction and changes in muscle function tests; this potentially indicates that fat fraction and muscle function tests can be considered good outcome measures for clinical trials in LOPD patients [114]. These studies show that future research with larger cohort size and long-term follow-up of LOPD subjects with ERT are required to determine the efficacy of the treatment. qMRI will be clearly very important as newer treatments are introduced and long term follow up is needed to assess disease status.
3.4. Sarcopenia
Sarcopenia is the progressive loss of muscle mass and strength that occurs with advancing age as well as with a number of long-term conditions [115]. It was originally defined by a loss of muscle mass but has been extended to skeletal muscle function with the latest definition from the European Group on Sarcopenia in Older People (EWGSOP): "a muscle disease rooted in adverse muscle changes that accrue across a lifetime" [116].
A recent review performs a comprehensive survey of all studies that reported MRI-derived biomarkers related to sarcopenia [116]. This review reveals that the primary anatomical regions imaged was the thigh followed by the trunk. Currently, MRI allows the assessment of muscle quantity and quality (MQQ) using T1w, T2w for cross-sectional area measurements, inflammation/ edema from T2w mapping, proton density fat fraction and fat free muscle mass from Dixon or variant sequences, extramyocellular and intramyocellular lipid fractions from Magnetic Resonance Spectroscopy, ADC, FA, fiber architecture (length and pennation angle) from DTI [40,63,117,118,119,120]. Yang et al have shown using a modified Dixon sequence that muscle CSA and intermuscular fat area at the 50% femur length highly correlated with muscle and intermuscular fat volumes estimated from the middle third of the thigh in a cohort of older subjects classified as normal, obese, sarcopenia, and sarcopenia-obese [118].
A MR compositional study established that aging causes significant changes in skeletal muscle composition, with marked increases in non-contractile tissues (adipose and fibrosis infiltration) [40]. Such quantification of the remodeling process is likely to be of functional and clinical importance in elucidating the causes of the disproportionate age-associated decrease of force compared to that of muscle volume. Melville et. al. imaged the quadriceps musculature of young healthy females and compared them to non-frail and pre-frail/frail older females [119]. MR imaging assessment included diffusion tensor imaging, T2 mapping, and quantitative fat fraction using MRS. The latter study found that pre-frail/frail adults demonstrated increased FA compared to young controls and non-frail adults with increasing T2 and intramuscular fat among the control, non-frail and pre-frail/frail categories [119]. Another cross-sectional DTI study of young and senior (non-frail) subjects showed significantly higher eigenvalues and trend to a higher FA and significantly shorter fiber lengths and smaller pennation angles in the gastrocnemius muscles of the senior cohort compared to the young cohort [63]. Cameron et. al. extracted DTI indices (fractional anisotropy and mean diffusivity) and architecture (fiber length, pennation angle, PCSA) in thigh muscles in a cohort of 94 subjects with an age range 22-89 years [120]. The latter study showed skeletal muscle architectural changes with aging and intermuscular differences in the microstructure.
Though, MRI has a number of quantitative assessments of muscle quality and quantity, these remain in the realm of research in sarcopenia due to the lack of imaging and analysis standardization, complex post-processing, and long scan times. More studies focused on validation as well on the identification of simpler MR metrics (acquisition and/or processing) will serve to expedite establishment of MRI as an imaging biomarker of sarcopenia. Large scale multi-parametric MR imaging studies on cohorts comparing heathy young, active older, pre-frail and frail older subjects will be required to determine thresholds for each MR metric for the three sub-groups of older subjects to establish MRI based biomarkers of sarcopenia.
3.5. Muscle Injury
MRI is routinely used to assess the severity in sports related muscle injuries and combined with clinical evaluation, used to predict ‘return to play (RTP)’ [121,122]. It is considered the reference standard for the evaluation of muscle injuries [122]. MRI aids in evaluating and in the management of sports-related muscle injuries. Further, MRI can also evaluate the long-term changes following injury such as scarring and focus or diffuse fatty muscle atrophy [122].
The integration of quantitative multiparametric MRI will increase the diagnostic efficiency and predictive power of MRI [122]. Most of the quantitative MRI studies thus far have focused on DTI and T2 metrics while some have evaluated the loss of muscle volume after injuries and in the rehabilitation period. Muhlenfeld et al reported significant muscle volume loss (between 2% and 7%) in the upper thigh occurs in recreational soccer players assessed at three and at six weeks following a hamstring injury [123]. Diffusion tensor imaging (DTI) and T2 mapping has recently been applied to monitor recovery after an acute hamstring injury [124]. All DTI indices except FA were elevated compared to control muscles immediately after the injury and normalized during the recovery period. Mean T2 relaxation times in injured muscles were not significantly elevated compared with control muscles at any time point [124]. Figure 10 shows the baseline, mean diffusion and T2 maps in three subjects at three time points after an acute hamstring injury. Future work should explore the potential of DTI indices to predict ‘return to play (RTP)’ and recovery times in athletes after an acute strain injury [121,122]. Biglands et al also assessed the ability of T2 mapping, diffusion tensor imaging (DTI) and radiologist's scores to detect muscle changes following acute muscle tear in athletes and to predict RTP [125]. While T2 and DTI measurements in muscle could detect changes due to healing following muscle tear, they were inferior predictors of RTP compared with the radiologists’ visual scoring. Bye et al investigated mechanisms by which short-term resistance training (6 weeks) increases strength of partially paralyzed muscles in people with spinal cord injury (SCI) using DTI including fiber architecture and physiological cross-sectional area (PCSA) [126]. The lack of any change in muscle architecture post-training in this study suggests that short-term strength gains are due to increased neural drive or an increase in specific muscle tension [126].
While muscle biomarkers have been entirely devoted to markers of structure, composition, and fiber architecture, a few dynamic imaging studies have also been reported [89,90,91]. Slider et. al. used velocity encoded phase contrast imaging to map thigh muscle strains under active lengthening paradigms in subjects with prior hamstring injuries [127]. They found relatively larger localized tissue strains during active lengthening contractions near the proximal musculotendon junction from which they concluded that these large strains may predispose the proximal biceps femoris to injury. With faster and 3D imaging capabilities of the 4D Compressed sensing flow sequences, it is possible now to cover the entire thigh in the dynamic scan in 4-5 minutes [128]. This opens up exciting possibilities to establish imaging biomarkers of muscle function.
4. Conclusions
Quantitative MRI and imaging biomarkers are an active area of research and the multiparametric nature of MRI allows one to probe the muscle with different metrics. Some of these metrics have reached a stage of maturity to be granted the status of imaging biomarkers10. These mature biomarkers are morphological (volumes, cross-sectional areas), compositional (fat infiltration) and T2 mapping (inflammatory process, disease activity marker). The advent of deep learning methods is poised to make automated muscle segmentation a reality and with it, brings the ability to extract biomarker values in a consistent and accurate manner. These imaging biomarkers now need to be evaluated in large scale clinical trials to determine their utility as outcome measures. Besides the mature muscle imaging biomarkers, there are other techniques that hold great promise and are in different stages of development: diffusion tensor imaging has already shown to provide characterization of muscle that is distinct from the established biomarkers in normal and diseased states and fibrosis quantification which is still in its infancy. In addition, muscle proton and phosphorous MR spectroscopy also show considerable promise; these latter two topics are not covered here. Phosphorous spectroscopy of muscle was the subject of some of the earliest studies in biological samples and is a well -researched area that provides insight into energy metabolism, a metric not available through other MRI approaches. Proton spectroscopy is unique in its ability to quantify intramyocellular fat and also serves as a reference standard for quantifying adipose content. Other biomarkers of interest but not discussed here are MR elastography for muscle mechanical properties and MR perfusion for assessing blood supply to the skeletal muscle. As mentioned in the prior section, dynamic imaging of muscle opens up an unprecedented opportunity to identify a novel set of imaging biomarkers of muscle function. Along with technical advances in imaging sequences, image processing, and standardization, large scale multi-institutional studies with well-defined outcomes measures in different disease states are required to advance and firmly establish qMR in the arsenal of tools for the management of MSK disease conditions.
Author Contributions
Conceptualization, U.S and S.S.; writing—original draft preparation, U.S.; writing—review and editing, U.S., S.S.; funding acquisition, S.S. All authors have read and agreed to the published version of the manuscript.
Funding
Please add: This research was funded by National Institute of Health/National Institute of Aging, grant number R01AG056999.
Institutional Review Board Statement
This is a review, the studies reported in the original articles were performed with IRB review.
Informed Consent Statement
This is a review, the studies reported in the original articles were performed with IRB review.
Data Availability Statement
No new data were created or analyzed in this study. Data sharing is not applicable to this article.
Conflicts of Interest
The authors declare no conflict of interest.
References
- Quantitative MRI of the brain: principles of physical measurement. Cercignani, M. Quantitative MRI of the brain: principles of physical measurement. Cercignani, M., Dowell, N., Tofts, P. Eds.; CRC press, Florida, USA, 2018.
- Manfrini, E.; Smits, M.; Thust, S.; Geiger, S.; Bendella, Z.; Petr, J.; Solymosi, L.; Keil, V.C. From research to clinical practice: a European neuroradiological survey on quantitative advanced MRI implementation. Eur Radiol 2021, 31, 6334–6341. [Google Scholar] [CrossRef]
- Keenan, K.E.; Biller, J.R.; Delfino, J.G.; Boss, M.A.; Does, M.D.; Evelhoch, J.L.; Griswold, M.A.; Gunter, J.L.; Hinks, R.S.; Hoffman, S.W.; Kim, G.; Lattanzi, R.; Li, X.; Marinelli, L.; Metzger, G.J.; Mukherjee, P.; Nordstrom, R.J.; Peskin, A.P.; Perez, E.; Russek, S.E.; Sahiner, B.; Serkova, N.; Shukla-Dave, A.; Steckner, M.; Stupic, K.F.; Wilmes, L.J.; Wu, H.H.; Zhang, H.; Jackson, E.F.; Sullivan, D.C. Recommendations towards standards for quantitative MRI (qMRI) and outstanding needs. J Magn Reson Imaging. 2019, 49, e26–e39. [Google Scholar] [CrossRef] [PubMed]
- https://www.rsna.org/research/quantitative-imaging-biomarkers-alliance [accessed on Sept 12, 2023].
- Jara, H.; Sakai, O.; Farrher, E.; Oros-Peusquens, A.M.; Shah, N.J.; Alsop, D.C.; Keenan, K.E. Primary Multiparametric Quantitative Brain MRI: State-of-the-Art Relaxometric and Proton Density Mapping Techniques. Radiology 2022, 305, 5–18. [Google Scholar] [CrossRef] [PubMed]
- Deng, J.; Wang, Y. Quantitative magnetic resonance imaging biomarkers in oncological clinical trials: Current techniques and standardization challenges. Chronic Dis Transl Med 2017, 3, 8–20. [Google Scholar] [CrossRef]
- Chalian, M.; Li, X.; Guermazi, A.; Obuchowski, N.A.; Carrino, J.A.; Oei, E.H.; Link, T.M. RSNA QIBA MSK Biomarker Committee; SNA QIBA MSK Biomarker Committee Members. The QIBA Profile for MRI-based Compositional Imaging of Knee Cartilage. Radiology 2021, 301, 423–432. [Google Scholar] [CrossRef] [PubMed]
- Engelke, K.; Chaudry, O.; Gast, L.; Eldib, M.A.; Wang, L.; Laredo, J.D.; Schett, G.; Nagel, A.M. Magnetic resonance imaging techniques for the quantitative analysis of skeletal muscle: State of the art. J Orthop Translat 2023, 42, 57–72. [Google Scholar] [CrossRef] [PubMed]
- Damon, B.M.; Li, K.; Dortch, R.D.; Welch, E.B.; Park, J.H.; Buck, A.K.; Towse, T.F.; Does, M.D. ; Gochberg DF, Bryant ND Quantitative Magnetic Resonance Imaging of Skeletal Muscle Disease. J Vis Exp 2016, 118, 52352. [Google Scholar]
- Damon, B.M.; Li, K.; Bryant, N.D. Magnetic resonance imaging of skeletal muscle disease. Handb Clin Neurol 2016, 136, 827–842. [Google Scholar]
- Idilman, I.S.; Yildiz, A.E.; Karaosmanoglu, A.D.; Ozmen, M.N.; Akata, D.; Karcaaltincaba, M. Proton density fat fraction: magnetic resonance imaging applications beyond the liver. Diagn Interv Radiol 2022, 28, 83–91. [Google Scholar] [CrossRef]
- Sherlock, S.P.; Zhang, Y.; Binks, M.; Marraffino, S. Quantitative muscle MRI biomarkers in Duchenne muscular dystrophy: cross-sectional correlations with age and functional tests. Biomark Med 2021, 15, 761–773. [Google Scholar] [CrossRef]
- Figueroa-Bonaparte, S.; Llauger, J.; Segovia, S.; Belmonte, I.; Pedrosa, I.; Montiel, E.; Montesinos, P.; Sánchez-González, J.; Alonso-Jiménez, A.; Gallardo, E.; Illa, I.; Spanish Pompe group; Díaz-Manera. Quantitative muscle MRI to follow up late onset Pompe patients: a prospective study. J Sci Rep 2018, 8, 10898. [Google Scholar] [CrossRef]
- Farrow, M.; Biglands, J.; Tanner, S.F.; Clegg, A.; Brown, L.; Hensor, E.M.A.; O'Connor, P.; Emery, P.; Tan, A.L. The effect of ageing on skeletal muscle as assessed by quantitative MR imaging: an association with frailty and muscle strength. Aging Clin Exp Res 2021, 33, 291–301. [Google Scholar] [CrossRef]
- Krššák, M.; Lindeboom, L.; Schrauwen-Hinderling, V.; Szczepaniak, L.S.; Derave, W.; Lundbom, J.; Befroy, D.; Schick, F.; Machann, J.; Kreis, R.; Boesch, C. Proton magnetic resonance spectroscopy in skeletal muscle: Experts' consensus recommendations. NMR Biomed 2021, 34, e4266. [Google Scholar] [CrossRef]
- Meyerspeer, M.; Boesch, C.; Cameron, D.; Dezortová, M.; Forbes, S.C.; Heerschap, A.; Jeneson, J.A.L.; Kan, H.E.; Kent, J.; Layec, G.; Prompers, J.J.; Reyngoudt, H.; Sleigh, A.; Valkovič, L.; Kemp, G.J. ; Experts' Working Group on 31P MR Spectroscopy of Skeletal Muscle. 31 P magnetic resonance spectroscopy in skeletal muscle: Experts' consensus recommendations. NMR Biomed 2020, 34, e4246. [Google Scholar]
- Bamman, M.M.; Newcomer, B.R.; Larson-Meyer, D.E.; Weinsier, R.L.; Hunter, G.R. Evaluation of the strength-size relationship in vivo using various muscle size indices. Med Sci Sports Exerc 2000, 32, 1307–1313. [Google Scholar] [CrossRef]
- Hiba, B.; Richard, N.; Hébert, L.J.; Coté, C.; Nejjari, M.; Vial, C.; Bouhour, F.; Puymirat, J.; Janier, M. Quantitative assessment of skeletal muscle degeneration in patients with myotonic dystrophy type 1 using MRI. J Magn Reson Imaging 2012, 35, 678–685. [Google Scholar] [CrossRef]
- Cruz-Jentoft, A.J.; Sayer, A.A. Sarcopenia. Lancet 2019, 393, 2636–2646. [Google Scholar] [CrossRef]
- Noehren, B.; Andersen, A.; Hardy, P.; Johnson, D.L.; Ireland, M.L.; Thompson, K.L.; Damon, B. Cellular and Morphological Alterations in the Vastus Lateralis Muscle as the Result of ACL Injury and Reconstruction. J Bone Joint Surg Am 2016, 98, 1541–1547. [Google Scholar] [CrossRef]
- Barnouin, Y.; Butler-Browne, G.; Voit, T.; Reversat, D.; Azzabou, N.; Leroux, G.; Behin, A.; McPhee, J.S.; Carlier, P.G. Hogrel, J.Y. Manual segmentation of individual muscles of the quadriceps femoris using MRI: a reappraisal. J Magn Reson Imaging 2014, 40, 239–247. [Google Scholar] [CrossRef]
- Lanza, M.B.; Martins-Costa, H.C.; De Souza, C.C.; Lima, F.V.; Diniz, R.C.R.; Chagas, M.H. Muscle volume vs. anatomical cross-sectional area: Different muscle assessment does not affect the muscle size-strength relationship. J Biomech 2022, 132, 110956. [Google Scholar] [CrossRef]
- Huysmans, L.; De Wel, B.; Claeys, K.G.; Maes, F. Automated MRI quantification of volumetric per-muscle fat fractions in the proximal leg of patients with muscular dystrophies. Front Neurol 2023, 14, 1200727. [Google Scholar] [CrossRef]
- Ogier, A.C.; Hostin, M.A.; Bellemare, M.E.; Bendahan, D. Overview of MR Image Segmentation Strategies in Neuromuscular Disorders. Front Neurol 2021, 12, 625308. [Google Scholar] [CrossRef]
- Ugarte, V.; Sinha, U.; Malis, V.; Csapo, R.; Sinha, S. 3D multimodal spatial fuzzy segmentation of intramuscular connective and adipose tissue from ultrashort TE MR images of calf muscle. Magn Reson Med 2017, 77, 870–883. [Google Scholar] [CrossRef]
- Chaudry, O.; Friedberger, A.; Grimm, A.; Uder, M.; Nagel, A.M.; Kemmler, W.; Engelke, K. Segmentation of the fascia lata and reproducible quantification of intermuscular adipose tissue (IMAT) of the thigh. MAGMA 2021, 34, 367–376. [Google Scholar] [CrossRef]
- Belzunce, M.A.; Henckel, J.; Fotiadou, A.; Di Laura, A.; Hart, A. Automated multi-atlas segmentation of gluteus maximus from Dixon and T1-weighted magnetic resonance images. Magn Reson Mater Phys Biol Med 2020, 33, 677–688. [Google Scholar] [CrossRef]
- Ogier, A.C.; Heskamp, L.; Michel, C.P.; Fouré, A.; Bellemare, M.E.; Le Troter, A. A novel segmentation framework dedicated to the follow-up of fat infiltration in individual muscles of patients with neuromuscular disorders. Magn Reson Med 2020, 83, 1825–1836. [Google Scholar] [CrossRef]
- Hostin, M.A.; Ogier, A.C.; Michel, C.P.; Le Fur, Y.; Guye, M.; Attarian, S.; Fortanier, E.; Bellemare, M.E.; Bendahan, D. The Impact of Fatty Infiltration on MRI Segmentation of Lower Limb Muscles in Neuromuscular Diseases: A Comparative Study of Deep Learning Approaches. J Magn Reson Imaging 2023, 58, 1826–1835. [Google Scholar] [CrossRef]
- Gaj, S.; Eck, B.L.; Xie, D.; Lartey, R.; Lo, C.; Zaylor, W.; Yang, M.; Nakamura, K.; Winalski, C.S.; Spindler, K.P.; Li, X. Deep learning-based automatic pipeline for quantitative assessment of thigh muscle morphology and fatty infiltration. Magn Reson Med 2023, 89, 2441–2455. [Google Scholar] [CrossRef]
- Agosti, A.; Shaqiri, E.; Paoletti, M.; Solazzo, F.; Bergsland, N.; Colelli, G.; Savini, G.; Muzic, S.I.; Santini, F.; Deligianni, X.; Diamanti, L.; Monforte, M.; Tasca, G.; Ricci, E.; Bastianello, *!!! REPLACE !!!*; Pichiecchio, A. Deep learning for automatic segmentation of thigh and leg muscles. MAGMA 2022, 35, 467–483. [Google Scholar] [CrossRef] [PubMed]
- Agosti, A. (2021) DNN muscle segmentation: release 1.0.1 (version v1.0.1). Zenodo. [CrossRef]
- Wannamethee, S.G.; Atkins, J.L. Muscle loss and obesity: the health implications of sarcopenia and sarcopenic obesity. Proc Nutr Soc 2015, 74, 405–412. [Google Scholar] [CrossRef]
- Miljkovic, I.; Zmuda, J.M. Epidemiology of myosteatosis. Curr Opin Clin Nutr Metab Care 2010, 13, 260–264. [Google Scholar] [CrossRef]
- Ma, J. Dixon techniques for water and fat imaging. J Magn Reson Imaging 2008, 28, 543–558. [Google Scholar] [CrossRef]
- Reeder, S.B.; McKenzie, C.A.; Pineda, A.R.; Yu, H.; Shimakawa, A.; Brau, A.C.; Hargreaves, B.A.; Gold, G.E.; Brittain, J.H. Water-fat separation with IDEAL gradient-echo imaging. J Magn Reson Imaging 2007, 25, 644–652. [Google Scholar] [CrossRef] [PubMed]
- Dyke, J.P. Quantitative MRI Proton Density Fat Fraction: A Coming of Age. Radiology 2021, 298, 652–653. [Google Scholar] [CrossRef]
- Hu, H.H.; Yokoo, T.; Bashir, M.R.; et al. Linearity and Bias of Proton Density Fat Fraction as a Quantitative Imaging Biomarker: A Multicenter, Multiplatform, Multivendor Phantom Study. Radiology 2021, 298, 640–651. [Google Scholar] [CrossRef] [PubMed]
- Burian, E.; Franz, D.; Greve, T.; Dieckmeyer, M. .; Holzapfel, C.; Drabsch, T.; Sollmann,.; Probst, M.; Kirschke, J.S.; Rummen, E.J.; Zimmer, C.; Hauner,H.; Karampinos, D.C.; Baum, T. Age- and gender-related variations of cervical muscle composition using chemical shift encoding-based water-fat MRI. Eur J Radiol 2020, 125, 108904. [Google Scholar] [CrossRef] [PubMed]
- Csapo, R.; Malis, V.; Sinha, U.; Du, J.; Sinha, S. Age-associated differences in triceps surae muscle composition and strength - an MRI-based cross-sectional comparison of contractile, adipose and connective tissue. BMC Musculoskelet Disord 2014, 15, 209. [Google Scholar] [CrossRef] [PubMed]
- Schlaeger, S.; Inhuber, S.; Rohrmeier, A.; Dieckmeyer, M.; Freitag, F.; Klupp, E.; Weidlich, D.; Feuerriegel, G.; Kreuzpointner, F.; Schwirtz, A.; Rummeny, E.J.; Zimmer, C.; Kirschke, J.S.; Karampinos, D.C.; Baum, T. Association of paraspinal muscle water-fat MRI-based measurements with isometric strength measurements. Eur Radiol 2019, 29, 599–608. [Google Scholar] [CrossRef]
- Karampinos, D.C.; Baum, T.; Nardo, L.; Alizai, H.; Yu, H.; Carballido-Gamio, J.; Yap, S.P.; Shimakawa, A.; Link, T.M.; Majumdar, S. Characterization of the regional distribution of skeletal muscle adipose tissue in type 2 diabetes using chemical shift-based water/fat separation. J Magn Reson Imaging 2012, 35, 899–907. [Google Scholar] [CrossRef] [PubMed]
- Saab, G. .; Thompson, R.T.; Marsh, G.D. Multicomponent T2 relaxation of in vivo skeletal muscle. Magn Reson Med 1999, 42, 150–157. [Google Scholar] [CrossRef]
- Yao, L.; Yip, A.L.; Shrader, J.A.; Mesdaghinia, S.; Volochayev, R.; Jansen, A.V.; Miller, F.W.; Rider, L.G. Magnetic resonance measurement of muscle T2, fat-corrected T2 and fat fraction in the assessment of idiopathic inflammatory myopathies. Rheumatology (Oxford) 2016, 55, 441–449. [Google Scholar] [CrossRef]
- Patten, C.; Meyer, R.A.; Fleckenstein, J.L. T2 mapping of muscle. Semin Musculoskelet Radiol 2003, 7, 297–305. [Google Scholar]
- Fischmann, A.; Hafner, P.; Fasler, S.; et al. (2012a). Quantitative MRI can detect subclinical disease progression in muscular dystrophy. J Neurol 2012, 259, 1648–1654. [Google Scholar] [CrossRef]
- Yin, L.; Xie, Z.Y.; Xu, H.Y.; Zheng, S.S.; Wang, Z.X.; Xiao, J.X.; Yuan, Y. T2 Mapping and Fat Quantification of Thigh Muscles in Children with Duchenne Muscular Dystrophy. Curr Med Sci 2019, 39, 138–145. [Google Scholar] [CrossRef]
- Ploutz, L.L.; Tesch, P.A.; Biro, R.L.; Dudley, G.A. Effect of resistance training on muscle use during exercise. J Appl Physiol 1994, 76, 1675–1681. [Google Scholar] [CrossRef]
- Azzabou, N.; Loureiro de Sousa, P.; Caldas, E.; Carlier, P.G. Validation of a generic approach to muscle water T2 determination at 3T in fat-infiltrated skeletal muscle. J Magn Reson Imag 2015, 41, 645–653. [Google Scholar] [CrossRef]
- Santini, F.; Deligianni, X.; Paoletti, M.; Solazzo, F.; Weigel, M.; de Sousa, P.L.; Bieri, O.; Monforte, M.; Ricci, E.; Tasca, G.; Pichiecchio, A.; Bergsland, N. Fast Open-Source Toolkit for Water T2 Mapping in the Presence of Fat From Multi-Echo Spin-Echo Acquisitions for Muscle MRI. Front Neurol. 2021, 12, 630387. [Google Scholar] [CrossRef]
- Spiechowicz, J.; Marchenko, I.G.; Hänggi, P.; Łuczka, J. Diffusion Coefficient of a Brownian Particle in Equilibrium and Nonequilibrium: Einstein Model and Beyond. Entropy (Basel) 2023, 25, 42. [Google Scholar] [CrossRef]
- Le Bihan, D.; Breton, E.; Lallemand, D.; et al. MR imaging of intravoxel incoherent motions: application to diffusion and perfusion in neurologic disorders. Radiology 1986, 161, 401–407. [Google Scholar] [CrossRef]
- Jones, D.K.; Cercignani, M. Twenty-five pitfalls in the analysis of diffusion MRI data. NMR Biomed 2010, 23, 803–820. [Google Scholar] [CrossRef]
- Haddad, S.M.H.; Scott, C.J.M.; Ozzoude, M. .; Holmes, M.F.; Arnott, S.R.; Nanayakkara, N.D.; Ramirez, J.; Black, S.E.; Dowlatshahi, D.; Strother, S.C.; Swartz, R.H.; Symons, S.; Montero-Odasso, M.; ONDRI Investigators; Bartha, R. Comparison of quality control methods for automated diffusion tensor imaging analysis pipelines. PLoS One 2019, 14, e0226715. [Google Scholar]
- Oudeman, J.; Nederveen, A.J.; Strijkers, G.J.; Maas, M.; Luijten, P.R. .; Froeling, M. Techniques and applications of skeletal muscle diffusion tensor imaging: A review. J Magn Reson Imaging 2016, 43, 773–788. [Google Scholar] [CrossRef]
- Khader, M.; Hasan, I. S.; Walimuni, H. A.; Hahn, K.R. A Review of Diffusion Tensor Magnetic Resonance Imaging Computational Methods and Software Tools. Comput Biol Med 2011, 41, 1062–1072. [Google Scholar]
- Damon, B.; Ding, Z.; Hooijmans, M.; Anderson, A.; Zhou, X.; Coolbaugh, C.; George, M.K.; Landman, B. A MATLAB Toolbox for Muscle Diffusion-Tensor MRI Tractography. J Biomech 2021, 124, 110540. [Google Scholar] [CrossRef]
- Hall, M.G.; Clark, C.A. Diffusion in hierarchical systems: A simulation study in models of healthy and diseased muscle tissue. Magn Reson Med 2017, 78, 1187–1198. [Google Scholar] [CrossRef]
- Galban, C.J.; Maderwald, S. ; Stock, F.; Ladd, M.E.; Galban, C.J. Age-related changes in skeletal muscle as detected by diffusion tensor magnetic resonance imaging. J Gerontol A Biol Sci Med Sci 2007, 62, 453–458.
- Karampinos, D.C.; King, K.F.; Sutton, B.P.; Georgiadis, J.G. Myofiber ellipticity as an explanation for transverse asymmetry of skeletal muscle diffusion MRI in vivo signal. Ann Biomed Eng 2009, 37, 2532–2546. [Google Scholar] [CrossRef]
- Malis, V.; Sinha, U.; Csapo, R.; Narici, M.; Smitaman, E.; Sinha, S. Diffusion tensor imaging and diffusion modeling: Application to monitoring changes in the medial gastrocnemius in disuse atrophy induced by unilateral limb suspension. J Magn Reson Imaging 2019, 49, 1655–1664. [Google Scholar] [CrossRef]
- Malis, V.; Sinha, U.; Smitaman, E.; Obra, J.K.L.; Langer, H.T.; Mossakowski, A.A.; Baar, K.; Sinha, S. Time-dependent diffusion tensor imaging and diffusion modeling of age-related differences in the medial gastrocnemius and feasibility study of correlations to histopathology. NMR Biomed 2023, e4996. [Google Scholar] [CrossRef]
- Sinha, U.; Csapo, R.; Malis, V.; Xue, Y.; Sinha, S. Age-related differences in diffusion tensor indices and fiber architecture in the medial and lateral gastrocnemius. J Magn Reson Imaging 2015, 41, 941–953. [Google Scholar] [CrossRef]
- Froeling, M.; Oudeman, J.; Strijkers, G.J.; Maas, M.; Drost, M.R.; Nicolay, K.; Nederveen, A.J. Muscle changes detected with diffusion-tensor imaging after long-distance running. Radiology 2015, 274, 548–562. [Google Scholar] [CrossRef]
- Keller, S.; Yamamura, J.; Sedlacik, J.; Wang, Z.J.; Gebert, P.; Starekova, J.; Tahir, E. Diffusion tensor imaging combined with T2 mapping to quantify changes in the skeletal muscle associated with training and endurance exercise in competitive triathletes. Eur Radiol 2020, 30, 2830–2842. [Google Scholar] [CrossRef]
- Damon, B.M.; Froeling, M.; Buck, A.K.; Oudeman, J.; Ding, Z.; Nederveen, A.J.; Bush, E.C.; Strijkers, G.J. Skeletal muscle diffusion tensor-MRI fiber tracking: rationale, data acquisition and analysis methods, applications and future directions. NMR Biomed 2017, 30, 10–1002. [Google Scholar] [CrossRef]
- Forsting, J.; Rehmann, R.; Rohm, M.; Güttsches, A.K.; Froeling, M.; Kan, H.E.; Tegenthoff, M.; Vorgerd, M.; Schlaffke, L. Robustness and stability of volume-based tractography in a multicenter setting. NMR Biomed 2022, 35, e4707. [Google Scholar] [CrossRef]
- Sugano, T.; Ogawa, T.; Yoda, N.; Hashimoto, T.; Shobara, K.; Niizuma, K.; Kawashima, R.; Sasaki, K.J. Morphological comparison of masseter muscle fibres in the mandibular rest and open positions using diffusion tensor imaging. Oral Rehabil 2022, 49, 608–615. [Google Scholar] [CrossRef]
- Rousset, P.; Delmas, V.; Buy, J.N.; Rahmouni, A.; Vadrot, D.; Deux, J.F. In vivo visualization of the levator ani muscle subdivisions using MR fiber tractography with diffusion tensor imaging. J Anat 2012, 221, 221–228. [Google Scholar] [CrossRef]
- Zijta, F.M.; Froeling, M.; Nederveen, A.J.; Stoker, J. Diffusion tensor imaging and fiber tractography for the visualization of the female pelvic floor. Clin Anat 2013, 26, 110–114. [Google Scholar] [CrossRef]
- Lemberskiy, G.; Feiweier, T.; Gyftopoulos, S.; Axel, L.; Novikov, D.S.; Fieremans, E. Assessment of myofiber microstructure changes due to atrophy and recovery with time-dependent diffusion MRI. NMR Biomed 2021, 34, e4534. [Google Scholar] [CrossRef]
- Cameron, D.; Abbassi-Daloii, T.; Heezen, L.G.M.; van de Velde, N.M.; Koeks, Z.; Veeger, T.T.J.; Hooijmans, M.T.; El Abdellaoui, S.; van Duinen, S.G.; Verschuuren, J.J.G.M.; van Putten, M.; Aartsma-Rus, A.; Raz, V.; Spitali, P.; Niks, E.H.; Kan, H.E. Diffusion-tensor magnetic resonance imaging captures increased skeletal muscle fibre diameters in Becker muscular dystrophy. J Cachexia Sarcopenia Muscle 2023, 14, 1546–1557. [Google Scholar] [CrossRef]
- Klingler, W.; Jurkat-Rott, K.; Lehmann-Horn, F.; Schleip, R. The role of fibrosis in Duchenne muscular dystrophy. Acta Myol 2012, 31, 184–195. [Google Scholar]
- Sinha, U.; Malis, V.; Chen, J.S.; Csapo, R.; Kinugasa, R.; Narici, M.V.; Sinha, S. Role of the Extracellular Matrix in Loss of Muscle Force With Age and Unloading Using Magnetic Resonance Imaging, Biochemical Analysis, and Computational Models. Front Physiol 2020, 11, 626. [Google Scholar] [CrossRef] [PubMed]
- Goodpaster, B.H.; Park, S.W.; Harris, T.B.; Kritchevsky, S.B.; Nevitt, M.; Schwartz, A.V.; Simonsick, E.M.; Tylavsky, F.A.; Visser, M.; Newman, A.B. The loss of skeletal muscle strength, mass, and quality in older adults: the health, aging and body composition study. J Gerontol A Biol Sci Med Sci 2006, 61, 1059–1064. [Google Scholar] [CrossRef] [PubMed]
- Sharafi, B.; Blemker, S.S. A mathematical model of force transmission from intrafascicularly terminating muscle fibers. J Biomech 2011, 44, 2031–2039. [Google Scholar] [CrossRef] [PubMed]
- Malis, V.; Sinha, U.; Csapo, R.; Narici, M.; Sinha, S. Relationship of changes in strain rate indices estimated from velocity-encoded MR imaging to loss of muscle force following disuse atrophy. Magn Reson Med 2018, 79, 912–922. [Google Scholar] [CrossRef] [PubMed]
- Sinha, U.; Malis, V.; Csapo, R.; Moghadasi, A.; Kinugasa, R.; Sinha, S. Age-related differences in strain rate tensor of the medial gastrocnemius muscle during passive plantarflexion and active isometric contraction using velocity encoded MR imaging: potential index of lateral force transmission. Magn Reson Med 2015, 73, 1852–1863. [Google Scholar] [CrossRef] [PubMed]
- Henkelman, R.M.; Stanisz, G.J.; Graham, S.J. Magnetization transfer in MRI: a review. NMR Biomed 2001, 14, 57–64. [Google Scholar] [CrossRef] [PubMed]
- Sinclair, C.D.J.; Samson, R.S.; Thomas, D.L.; et al. Quantitative magnetization transfer in in vivo healthy human skeletal muscle at 3T. Magn Reson Med 2010, 64, 1739–1748. [Google Scholar] [CrossRef] [PubMed]
- Li, K.; Dortch, R.D.; Kroop, S.F.; et al. A rapid approach for quantitative magnetization transfer imaging in thigh muscles using the pulsed saturation method. Magn Reson Imaging 2015, 33, 709–717. [Google Scholar] [CrossRef] [PubMed]
- Rottmar, M.; Haralampieva, D.; Salemi, S.; et al. Magnetization Transfer MR Imaging to Monitor Muscle Tissue Formation during Myogenic in Vivo Differentiation of Muscle Precursor Cells. Radiology. 2016, 281, 436–443. [Google Scholar] [CrossRef]
- Helms, G.; Dathe, H.; Kallenberg, K.; Dechent, P. High-resolution maps of magnetization transfer with inherent correction for RF inhomogeneity and T1 relaxation obtained from 3D FLASH MRI. Magn Reson Med 2008, 60, 1396–1407. [Google Scholar] [CrossRef]
- Morrow, J.M.; Sinclair, C.D.; Fischmann, A.; Reilly, M.M.; Hanna, M.G.; Yousry, T.A.; Thornton, J.S. Reproducibility, and age, body-weight and gender dependency of candidate skeletal muscle MRI outcome measures in healthy volunteers. Eur Radiol 2014, 24, 1610–1620. [Google Scholar] [CrossRef] [PubMed]
- Romero, I.O.; Sinha, U. Magnetization transfer saturation imaging of human calf muscle: Reproducibility and sensitivity to regional and sex differences. J Magn Reson Imaging 2019, 50, 1227–1237. [Google Scholar] [CrossRef] [PubMed]
- White, J.C.; Sinha, S.; Sinha, U. ; Spin Lattice (T1) and Magnetization Transfer Saturation (MTsat) Imaging to Monitor Age-Related Differences in Skeletal Muscle Tissue. Diagnostics (Basel) 2022, 12, 584. [Google Scholar] [CrossRef] [PubMed]
- C A Araujo, E.; Azzabou, N.; Vignaud, A.; Guillot, G.; Carlier, P.G. Quantitative ultrashort TE imaging of the short-T2 components in skeletal muscle using an extended echo-subtraction method. Magn Reson Med 2017, 78, 997–1008. [Google Scholar] [CrossRef] [PubMed]
- Felix, J. Quantification of short T2* fraction and fat fraction in skeletal muscle. Master’ in Medical Physics Thesis, . San Diego State University. San Diego, CA.
- Zhong, X.; Epstein, F.H.; Spottiswoode, B.S.; Helm, P.A.; Blemker, S.S. Imaging two-dimensional displacements and strains in skeletal muscle during joint motion by cine DENSE MR. J Biomech 2008, 41, 532–540. [Google Scholar] [CrossRef] [PubMed]
- Englund, E.K.; Elder, C.P.; Xu, Q.; Ding, Z.; Damon, B.M. Combined diffusion and strain tensor MRI reveals a heterogeneous, planar pattern of strain development during isometric muscle contraction. Am J Physiol Regul Integr Comp Physiol 2011, 300, R1079–R1090. [Google Scholar] [CrossRef] [PubMed]
- Malis, V.; Sinha, U.; Sinha, S. 3D Muscle Deformation Mapping at Submaximal Isometric Contractions: Applications to Aging Muscle. Front Physiol 2020, 11, 600590. [Google Scholar] [CrossRef] [PubMed]
- Song, Y.; Xu, H.Y.; Xu, K.; Guo, Y.K.; Xie, L.J.; Peng, F.; Xu, R.; Fu, H.; Yuan, W.F.; Zhou, Z.Q.; Cheng, B.C.; Fu, C.; Zhou, H.; Cai, X.T.; Li, X.S. Clinical utilisation of multimodal quantitative magnetic resonance imaging in investigating muscular damage in Duchenne muscular dystrophy: a study on the association between gluteal muscle groups and motor function. Pediatr Radiol 2023, 53, 1648–1658. [Google Scholar] [CrossRef] [PubMed]
- Sun, C.; Shen, L.; Zhang, Z.; et al. Therapeutic strategies for Duchenne muscular dystrophy: an update. Genes (Basel) 2020, 11, 837. [Google Scholar] [CrossRef]
- Lott, D.J.; Taivassalo, T.; Cooke, K.D.; Park, H.; Moslemi, Z.; Batra, A.; Forbes, S.C.; Byrne, B.J.; Walter, G.A.; Vandenborne, K. Safety, feasibility, and efficacy of strengthening exercise in Duchenne muscular dystrophy. Muscle Nerve 2021, 63, 320–326. [Google Scholar] [CrossRef]
- Alic, L.; Griffin, J. F 4th.; Eresen, A.; Kornegay, J.N.; Ji, J.X. Using MRI to quantify skeletal muscle pathology in Duchenne muscular dystrophy: A systematic mapping review. Muscle Nerve 2021, 64, 8–22. [Google Scholar] [CrossRef] [PubMed]
- Yin, L.; Xie, Z.Y.; Xu, H.Y.; Zheng, S.S.; Wang, Z.X.; Xiao, J.X.; Yuan, Y. T2 Mapping and Fat Quantification of Thigh Muscles in Children with Duchenne Muscular Dystrophy. Curr Med Sci 2019, 39, 138–145. [Google Scholar] [CrossRef] [PubMed]
- Kim, H.K.; Serai, S.; Lindquist, D.; Merrow, A.C.; Horn, P.S.; Kim, D.H.; Wong, B.L. Quantitative Skeletal Muscle MRI: Part 2, MR Spectroscopy and T2 Relaxation Time Mapping-Comparison Between Boys With Duchenne Muscular Dystrophy and Healthy Boys. Am J Roentgenol 2015, 205, W216–W223. [Google Scholar] [CrossRef] [PubMed]
- Kim, H.K.; Merrow, A.C.; Shiraj, S.; Wong, B.L.; Horn, P.S.; Laor, T. Analysis of fatty infiltration and inflammation of the pelvic and thigh muscles in boys with Duchenne muscular dystrophy (DMD): grading of disease involvement on MR imaging and correlation with clinical assessments. Pediatr Radiol 2013, 43, 1327–1335. [Google Scholar] [CrossRef] [PubMed]
- Morrow, J.M.; Sinclair, C.D.; Fischmann, A.; Machado, P.M.; Reilly, M.M.; Yousry, T.A.; Thornton, J.S.; Hanna, M.G. MRI biomarker assessment of neuromuscular disease progression: a prospective observational cohort study. Lancet Neurol 2016, 15, 65–77. [Google Scholar] [CrossRef] [PubMed]
- Mankodi, A.; Bishop, C.A.; Auh, S.; Newbould, R.D.; Fischbeck, K.H.; Janiczek, R.L. Quantifying disease activity in fatty-infiltrated skeletal muscle by IDEAL-CPMG in Duchenne muscular dystrophy. Neuromuscul Disord 2016, 26, 650–658. [Google Scholar] [CrossRef] [PubMed]
- Peng, F.; Xu, H.; Song, Y.; Xu, K.; Li, S.; Cai, X.; Guo, Y.; Gong, L. Longitudinal study of multi-parameter quantitative magnetic resonance imaging in Duchenne muscular dystrophy: hyperresponsiveness of gluteus maximus and detection of subclinical disease progression in functionally stable patients. J Neurol 2023, 270, 1439–1451. [Google Scholar] [CrossRef] [PubMed]
- Hooijmans, M.T.; Damon, B.M.; Froeling, M.; Versluis, M.J.; Burakiewicz, J.; Verschuuren, J.J.; Niks, E.H.; Webb, A.G.; Kan, H.E. Evaluation of skeletal muscle DTI in patients with duchenne muscular dystrophy. NMR Biomed 2015, 28, 1589–1597. [Google Scholar] [CrossRef] [PubMed]
- Li, G.D.; Liang, Y.Y.; Xu, P.; Ling, J.; Chen, Y.M. Diffusion-Tensor Imaging of Thigh Muscles in Duchenne Muscular Dystrophy: Correlation of Apparent Diffusion Coefficient and Fractional Anisotropy Values With Fatty Infiltration. Am J Roentgenol 2016, 206, 867–870. [Google Scholar] [CrossRef]
- Albayda, J.; Demonceau, G.; Carlier, P.G. Muscle imaging in myositis: MRI, US, and PET. Best Pract Res Clin Rheumatol 2022, 36, 101765. [Google Scholar] [CrossRef]
- Zubair, A.S.; Salam, S.; Dimachkie, M.M.; Machado, P.M.; Roy, B. Imaging biomarkers in the idiopathic inflammatory myopathies. Front Neurol 2023, 14, 1146015. [Google Scholar] [CrossRef]
- Yao, L.; Yip, A.L.; Shrader, J.A.; Mesdaghinia, S.; Volochayev, R.; Jansen, A.V.; Miller, F.W.; Rider, L.G. Magnetic resonance measurement of muscle T2, fat-corrected T2 and fat fraction in the assessment of idiopathic inflammatory myopathies. Rheumatology (Oxford) 2016, 55, 441–449. [Google Scholar] [CrossRef]
- Ai, T.; Yu, K.; Gao, L.; Zhang, P.; Goerner, F.; Runge, V.M.; Li, X. Diffusion tensor imaging in evaluation of thigh muscles in patients with polymyositis and dermatomyositis. Br J Radiol 2014, 87, 20140261. [Google Scholar] [CrossRef]
- Wang, F.; Wu, C.; Sun, C.; Liu, D.; Sun, Y.; Wang, Q.; Jin, Z. Simultaneous Multislice Accelerated Diffusion Tensor Imaging of Thigh Muscles in Myositis. Am J Roentgenol 2018, 211, 861–866. [Google Scholar] [CrossRef] [PubMed]
- Díaz-Manera, J.; Walter, G.; Straub, V. Skeletal muscle magnetic resonance imaging in Pompe disease. Muscle Nerve 2021, 63, 640–650. [Google Scholar] [CrossRef] [PubMed]
- Kuperus, E.; Kruijshaar, M.E.; Wens, S.C.A.; et al. Long-term benefit of enzyme replacement therapy in Pompe disease: a 5-year prospective study. Neurology 2017, 89, 2365–2373. [Google Scholar] [CrossRef]
- Rehmann, R.; Froeling, M.; Rohm, M.; Forsting, J.; Kley, R.A.; Schmidt-Wilcke, T.; Karabul, N.; Meyer-Frießem, C.H.; Vollert, J.; Tegenthoff, M.; Vorgerd, M.; Schlaffke, L. Diffusion tensor imaging reveals changes in non-fat infiltrated muscles in late onset Pompe disease. Muscle Nerve 2020, 62, 541–549. [Google Scholar] [CrossRef] [PubMed]
- van der Ploeg, A.; Carlier, P.G.; Carlier, R.Y.; Kissel, J.T.; Schoser, B.; Wenninger, S.; Pestronk, A.; Barohn, R.J.; Dimachkie, M.M.; Goker-Alpan, O.; Mozaffar, T.; Pena, L.D.; Simmons, Z.; Straub, V.; Guglieri, M.; Young, P.; Boentert, M.; Baudin, P.Y.; Wens, S.; Shafi, R.; Bjartmar, C.; Thurberg, B.L. Prospective exploratory muscle biopsy, imaging, and functional assessment in patients with late-onset Pompe disease treated with alglucosidase alfa: The EMBASSY Study. Mol Genet Metab 2016, 119, 115–123. [Google Scholar] [CrossRef] [PubMed]
- Lollert, A.; Stihl, C.; Hötker, A.M.; Mengel, E.; König, J.; Laudemann, K.; Gökce, S.; Düber, C.; Staatz, G. Quantification of intramuscular fat in patients with late-onset Pompe disease by conventional magnetic resonance imaging for the long-term follow-up of enzyme replacement therapy. PLoS One 2018, 13, e0190784. [Google Scholar] [CrossRef]
- Nuñez-Peralta, C.; Alonso-Pérez, J. .; Llauger, J.; Segovia, S.; Montesinos, P.; Belmonte, I.; Pedrosa, I.; Montiel, E.; Alonso-Jiménez, A.; Sánchez-González, J.; Martínez-Noguera, A.; IIlla, I.; Díaz-Manera, J. Follow-up of late-onset Pompe disease patients with muscle magnetic resonance imaging reveals increase in fat replacement in skeletal muscles. J Cachexia Sarcopenia Muscle 2020, 11, 1032–1046. [Google Scholar]
- Sayer, A.A. Cruz-Jentoft A. Sarcopenia definition, diagnosis and treatment: consensus is growing. Age Ageing 2022, 51, afac220. [Google Scholar] [CrossRef] [PubMed]
- Codari, M.; Zanardo, M.; di Sabato, M.E.; Nocerino, E.; Messina, C.; Sconfienza, L.M.; Sardanelli, F.J. MRI-Derived Biomarkers Related to Sarcopenia: A Systematic Review. Magn Reson Imaging 2020, 51, 1117–1127. [Google Scholar] [CrossRef]
- Chianca, V.; Albano, D.; Messina, C.; Gitto, S.; Ruffo, G.; Guarino, S.; Del Grande, F.; Sconfienza, L.M. Sarcopenia: imaging assessment and clinical application. Abdom Radiol (NY) 2022, 47, 3205–3216. [Google Scholar] [CrossRef] [PubMed]
- Yang, Y.X.; Chong, M.S.; Lim, W.S.; Tay, L.; Yew, S.; Yeo, A.; Tan, C.H. Validity of estimating muscle and fat volume from a single MRI section in older adults with sarcopenia and sarcopenic obesity. Clin Radiol 2017, 72, 427–e9. [Google Scholar] [CrossRef]
- Melville, D.M.; Mohler, J.; Fain, M.; et al. Multi-parametric MR imaging of quadriceps musculature in the setting of clinical frailty syndrome. Skeletal Radiol 2016, 45, 583–589. [Google Scholar] [CrossRef]
- Cameron, D.; Reiter, D.A.; Adelnia, F.; Ubaida-Mohien, C.; Bergeron, C.M.; Choi, S.; Fishbein, K.W.; Spencer, R.G.; Ferrucci, L. Age-related changes in human skeletal muscle microstructure and architecture assessed by diffusion-tensor magnetic resonance imaging and their association with muscle strength. Aging Cell 2023, 22, e13851. [Google Scholar] [CrossRef]
- Crema, M.D.; Yamada, A.F.; Guermazi, A.; Roemer, F.W.; Skaf, A.Y. Imaging techniques for muscle injury in sports medicine and clinical relevance. Current reviews in musculoskeletal medicine 2015, 8, 154–161. [Google Scholar] [CrossRef] [PubMed]
- Kumaravel, M.; Bawa, P.; Murai, N. Magnetic resonance imaging of muscle injury in elite American football players: Predictors for return to play and performance. Eur J Radiol 2018, 108, 155–164. [Google Scholar] [CrossRef]
- Mühlenfeld, N.; Steendahl, I.B.; Berthold, D.P.; Meyer, T.; Hauser, T.; Wagner, N.; Sander, A.L.; Marzi, I.; Kaltenbach, B.; Yel, I.; Vogl, T.; Eichler, K. Assessment of muscle volume using magnetic resonance imaging (MRI) in football players after hamstring injuries. Eur J Sport Sci 1436. [Google Scholar] [CrossRef]
- Monte, J.R.; Hooijmans, M.T.; Froeling, M.; Oudeman, J.; Tol, J.L.; Strijkers, G.J.; Nederveen, A.J.; Maas, M. Diffusion tensor imaging and quantitative T2 mapping to monitor muscle recovery following hamstring injury. NMR Biomed 2023, 36, e4902. [Google Scholar] [CrossRef]
- Biglands, J.D.; Grainger, A.J.; Robinson, P.; Tanner, S.F.; Tan, A.L.; Feiweier, T.; Evans, R.; Emery, P.; O'Connor, P. RI in acute muscle tears in athletes: can quantitative T2 and DTI predict return to play better than visual assessment? Eur Radiol 2020, 30, 6603–6613. [Google Scholar] [CrossRef]
- Bye, E.A.; Harvey, L.A.; Glinsky, J.V.; Bolsterlee, B.; Herbert, R.D. A preliminary investigation of mechanisms by which short-term resistance training increases strength of partially paralysed muscles in people with spinal cord injury. Spinal Cord 2019, 57, 770–777. [Google Scholar] [CrossRef]
- Silder, A.; Reeder, S.B.; Thelen, D.G. The influence of prior hamstring injury on lengthening muscle tissue mechanics. J Biomech 2010, 43, 2254–2260. [Google Scholar] [CrossRef]
- Sinha, S.; Malis, M.; Cunnane, B.; Hernandez, R.; Sinha, U. Isometric Contractions of the Quadriceps muscle: Strain and Strain Tensor Mapping using Velocity Encoded Phase Contrast Imaging. Presented at the Annual Meeting of the ISMRM 2022, May6-11,2022, London.
Figure 1.
3D rendering of the hard thresholded (52%) volumes of IMCT/IMAT tissue in the triceps surae muscles; young subject (a) and older subject (b). It should be noted that the aponeurosis surrounding each muscle was selectively eroded in order to provide a better view of the IMCT/IMAT. The top and bottom views are given as 3D volume projections. Reproduced with permission from the authors in Ref [25].
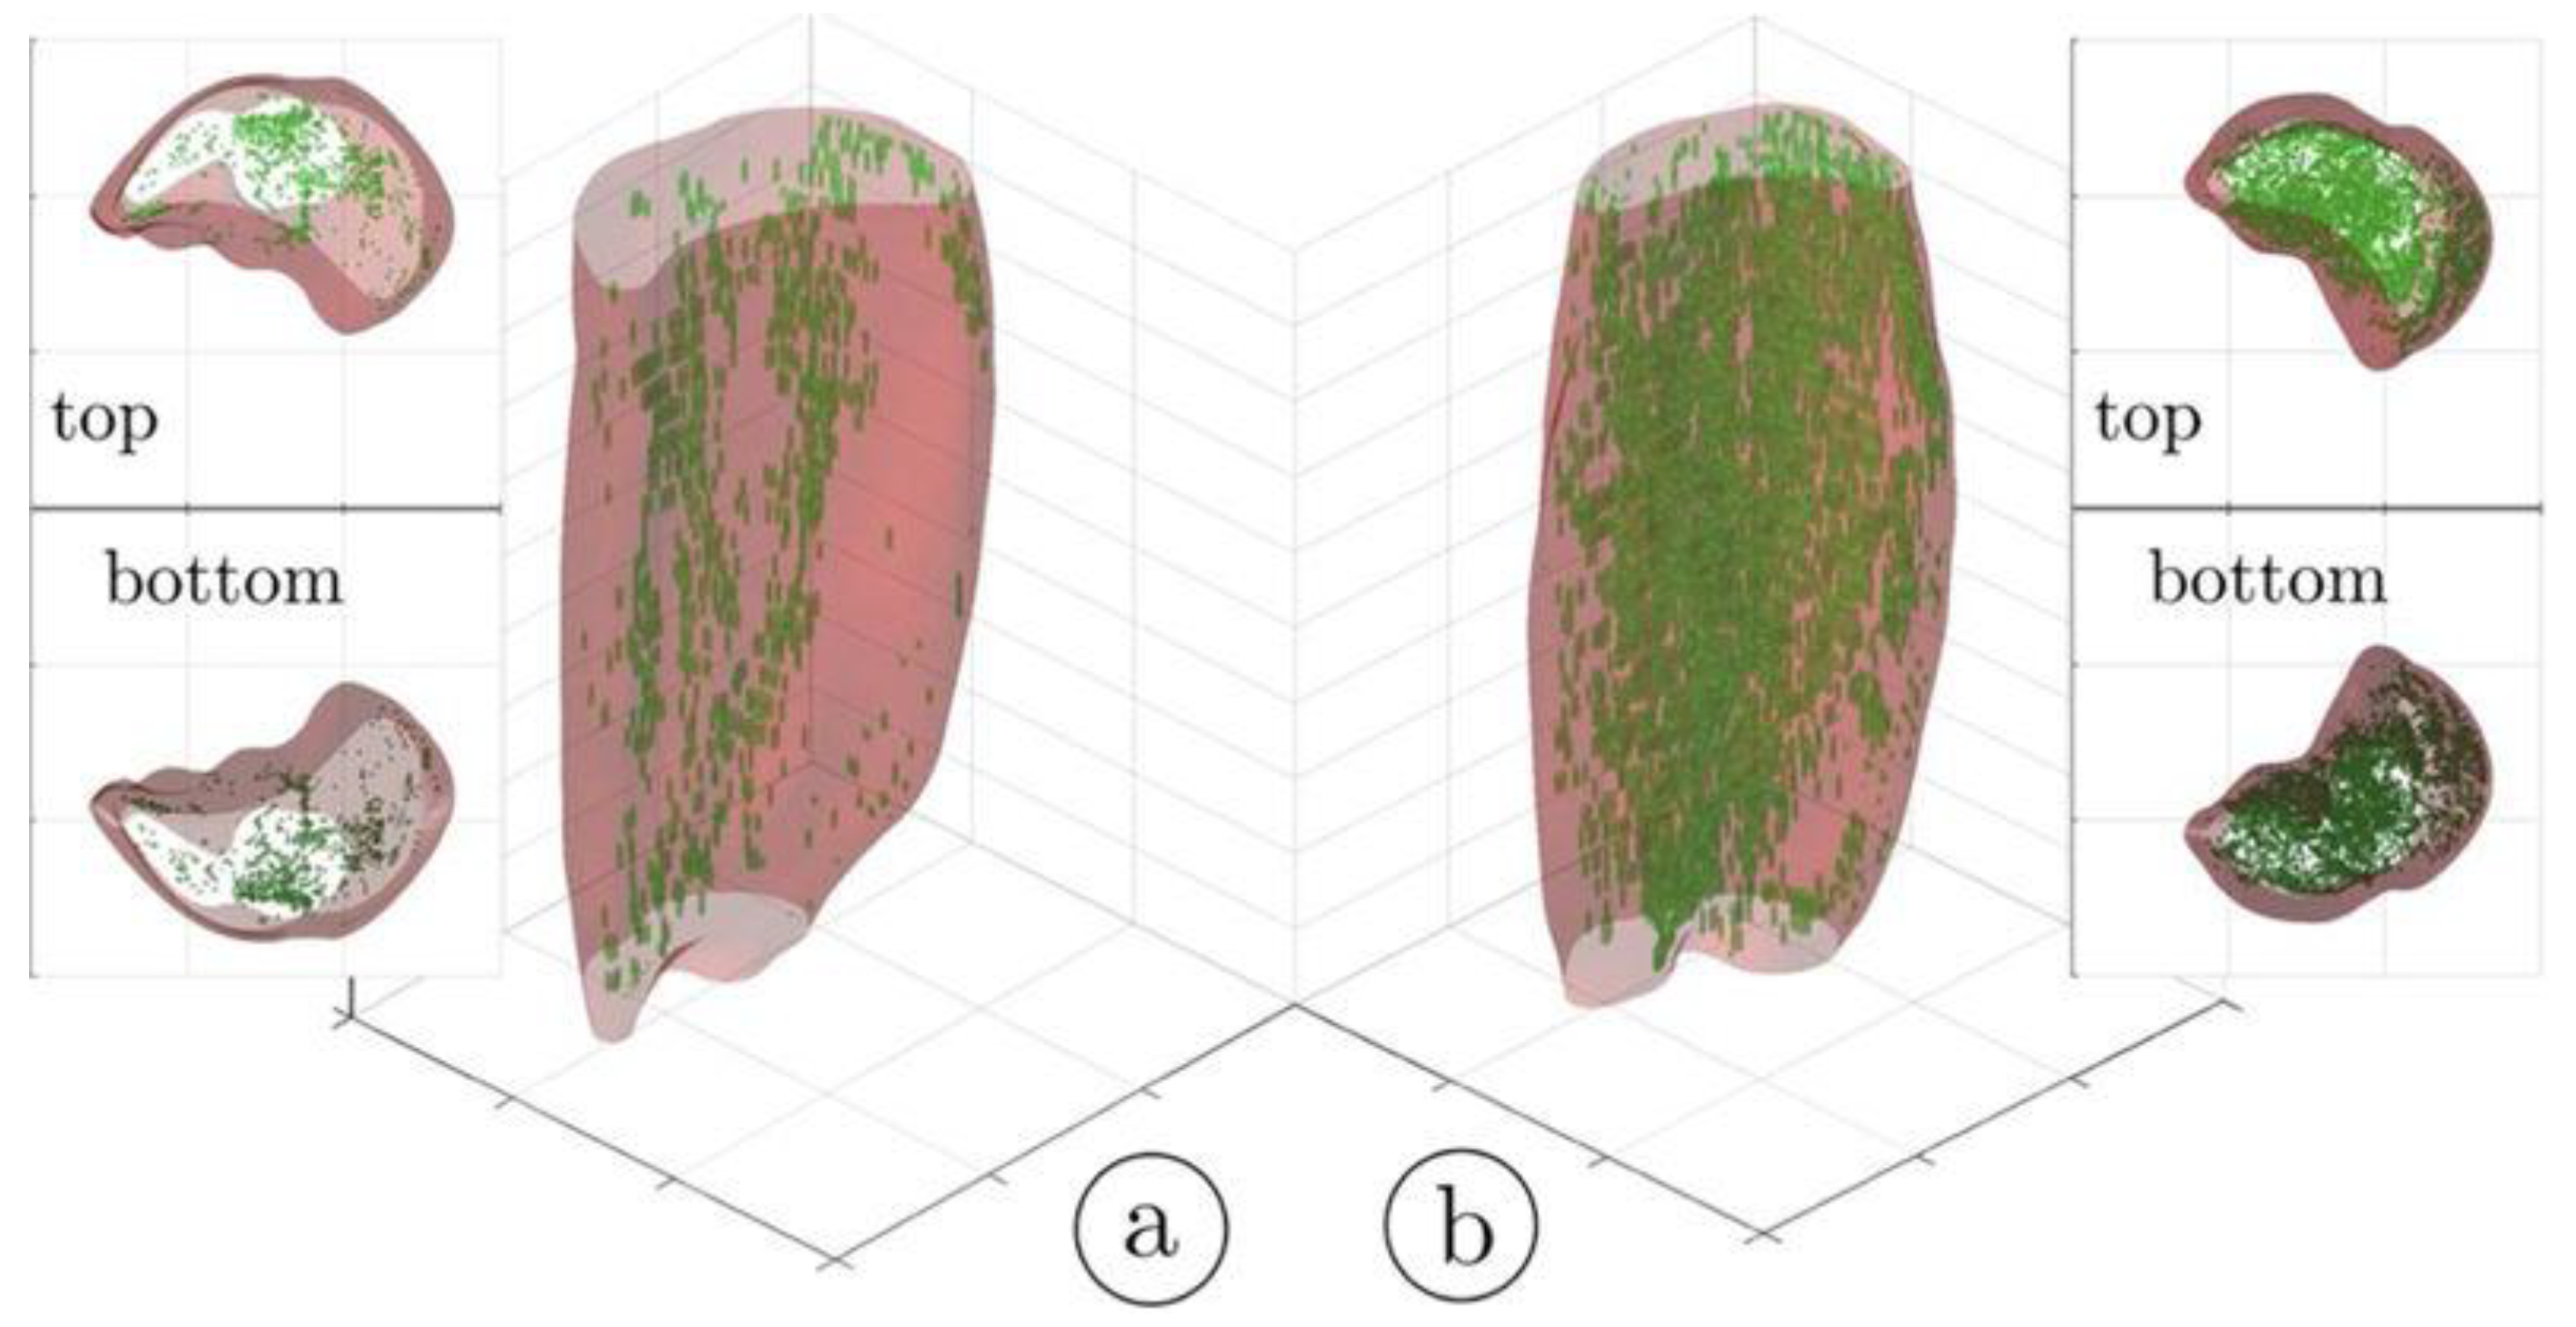
Figure 2.
Segmentation of muscle and fat compartments: (a) typical in-phase IDEAL image and superimposed ROIs for subcutaneous fat and bone and bone marrow regions, (b) subcutaneous adipose tissue (SAT) mask, (c) mask including all the muscle regions and excluding the bone and bone marrow regions in the tibia and fibula, (d) typical T2-weighted FSE image and superimposed muscular ROIs used for the evaluation of fat distribution, (e) masks of 6 muscular ROIs, and (f) mask of soft tissue excluding subcutaneous fat and 6 muscular ROIs. Three muscles (medial gastrocnemius-MG, lateral gastrocnemius-LG, soleus-SOL) and three muscle compartments (anterior compartment-AC, lateral compartment-LC, deep posterior compartment-DP) were used to define muscular regions. Fat within the mask of (c) corresponds to IMAT, fat within the mask of (e) corresponds to intraMF, and the fat within the mask of (f) corresponds to interMF. Reproduced with permission from the authors in Ref [42].
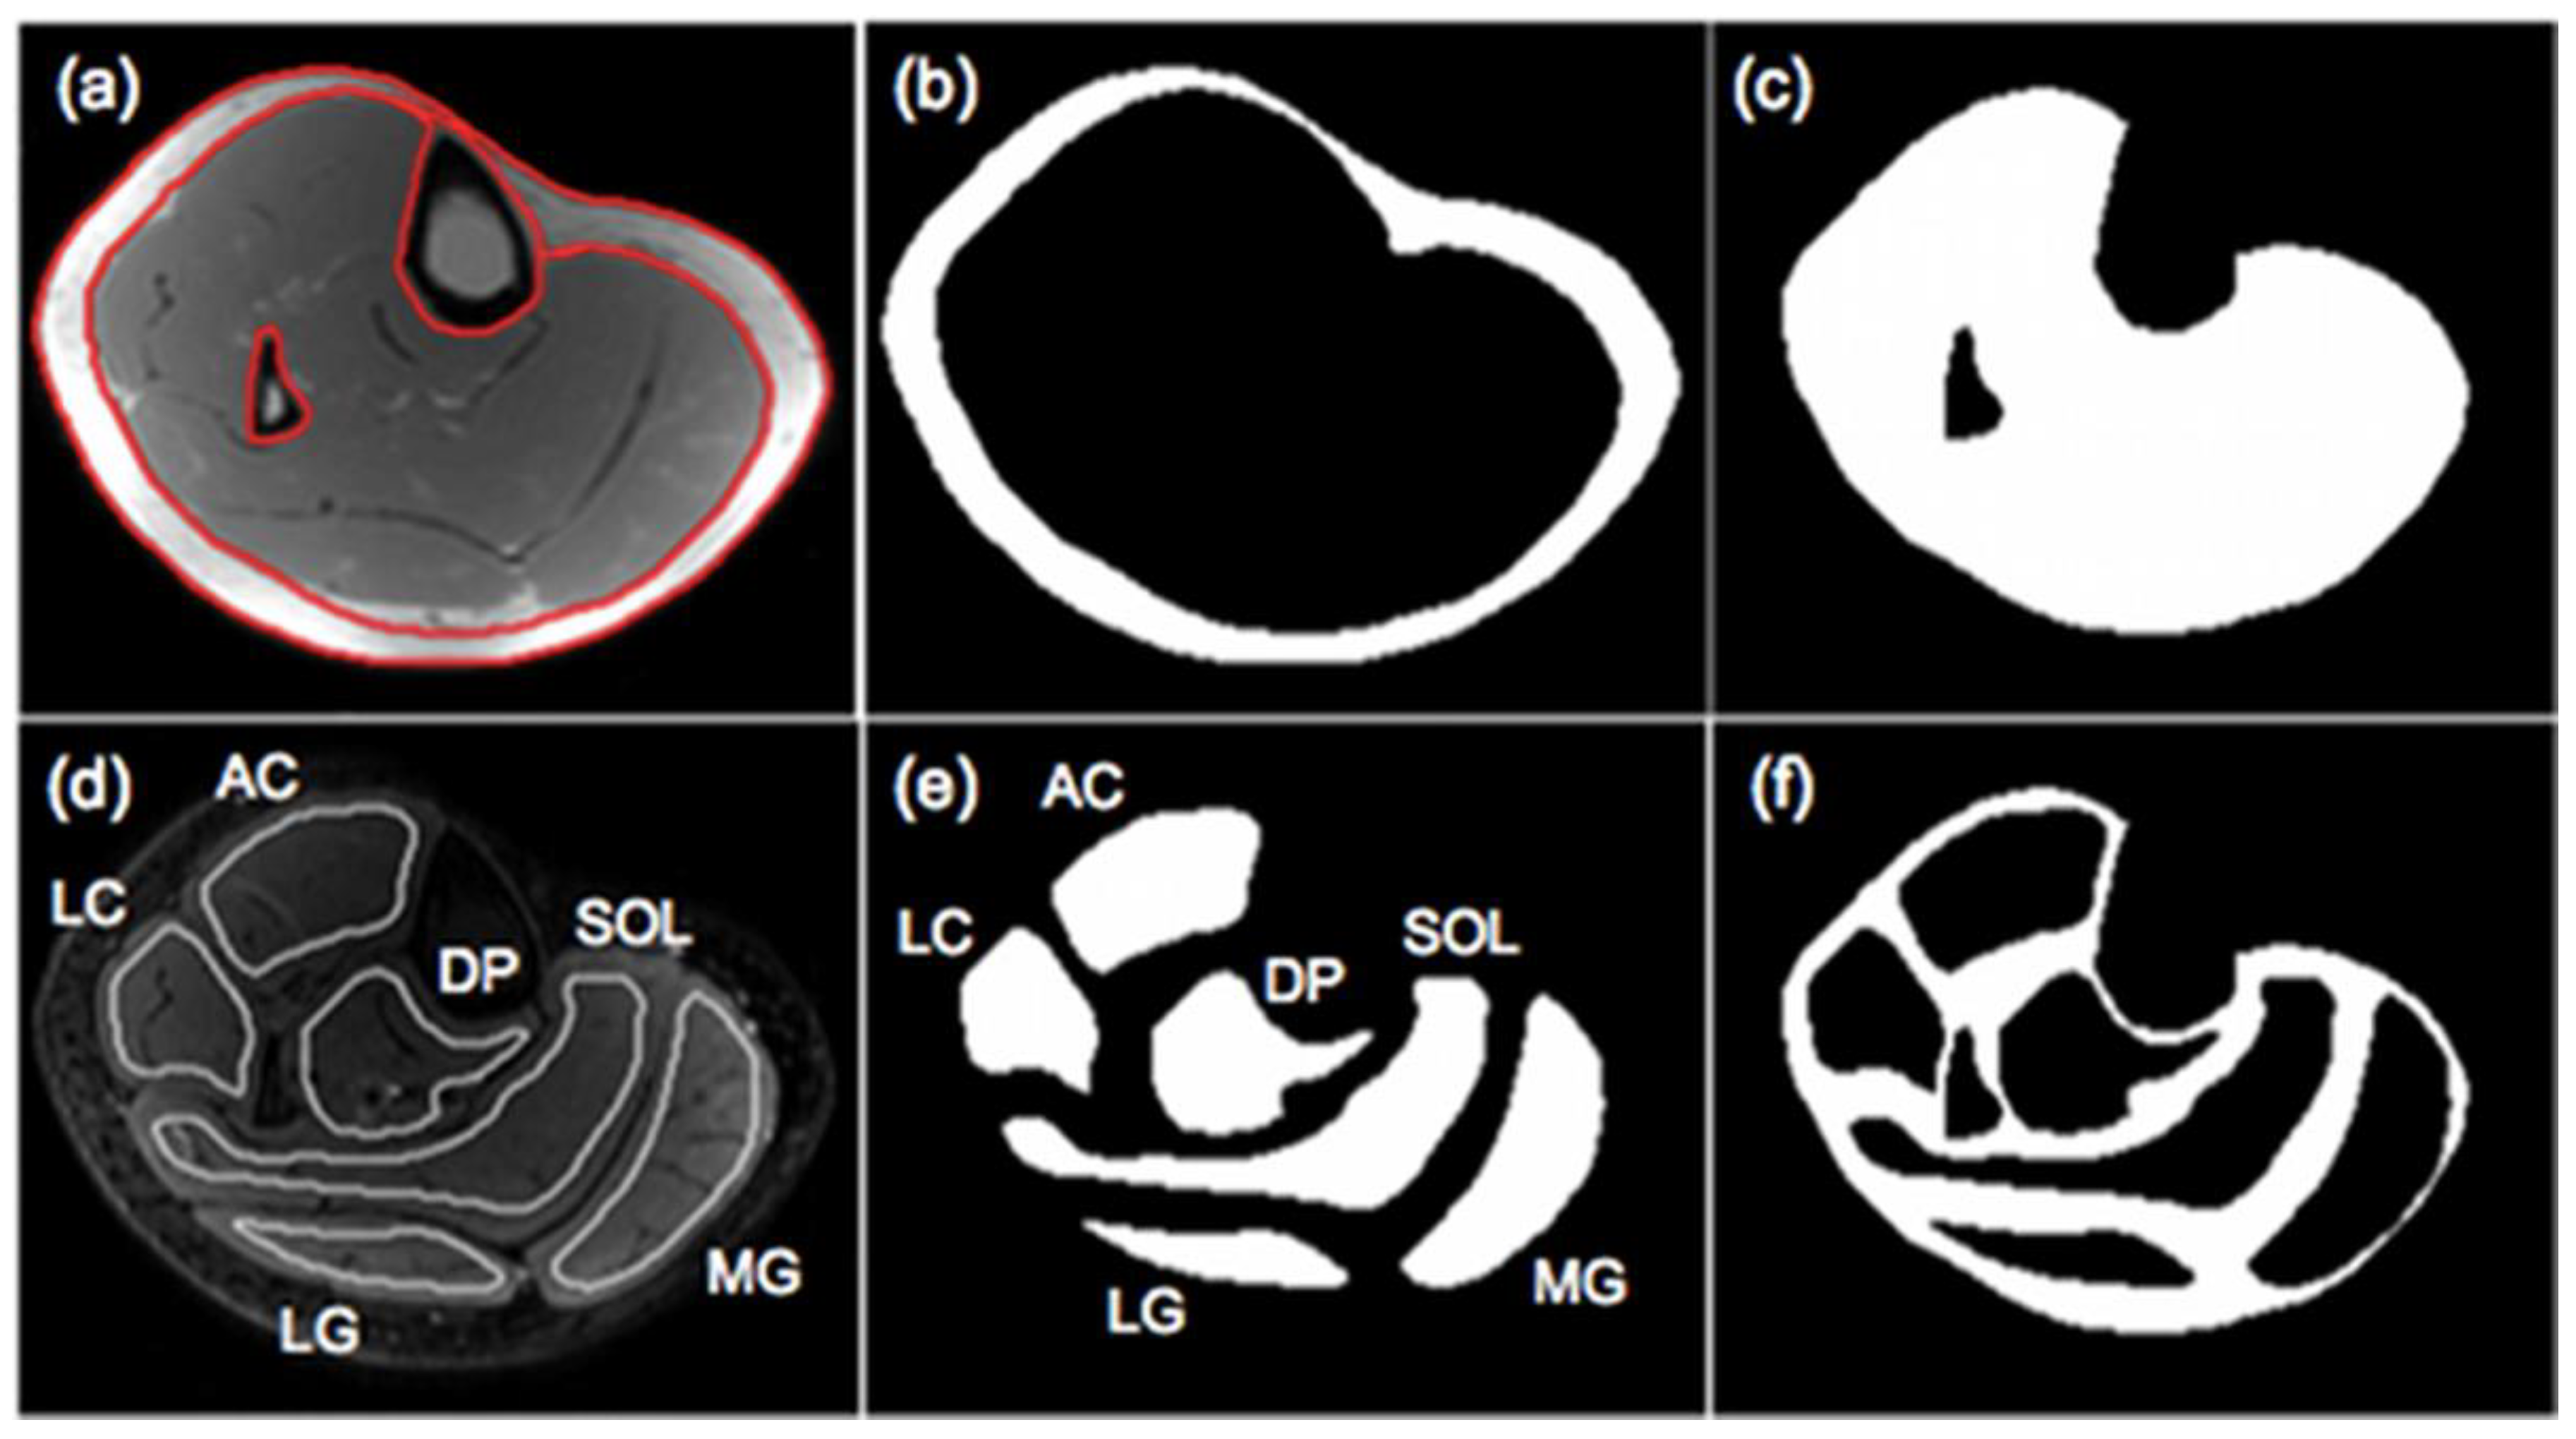
Figure 3.
Fibers tracked from the deep aponeurosis (aponeurosis surface shown in deep purple mesh seen behind the muscle fibers in green) of the medial gastrocnemius using the MATLAB toolbox in Ref. 57. (unpublished work).
Figure 3.
Fibers tracked from the deep aponeurosis (aponeurosis surface shown in deep purple mesh seen behind the muscle fibers in green) of the medial gastrocnemius using the MATLAB toolbox in Ref. 57. (unpublished work).
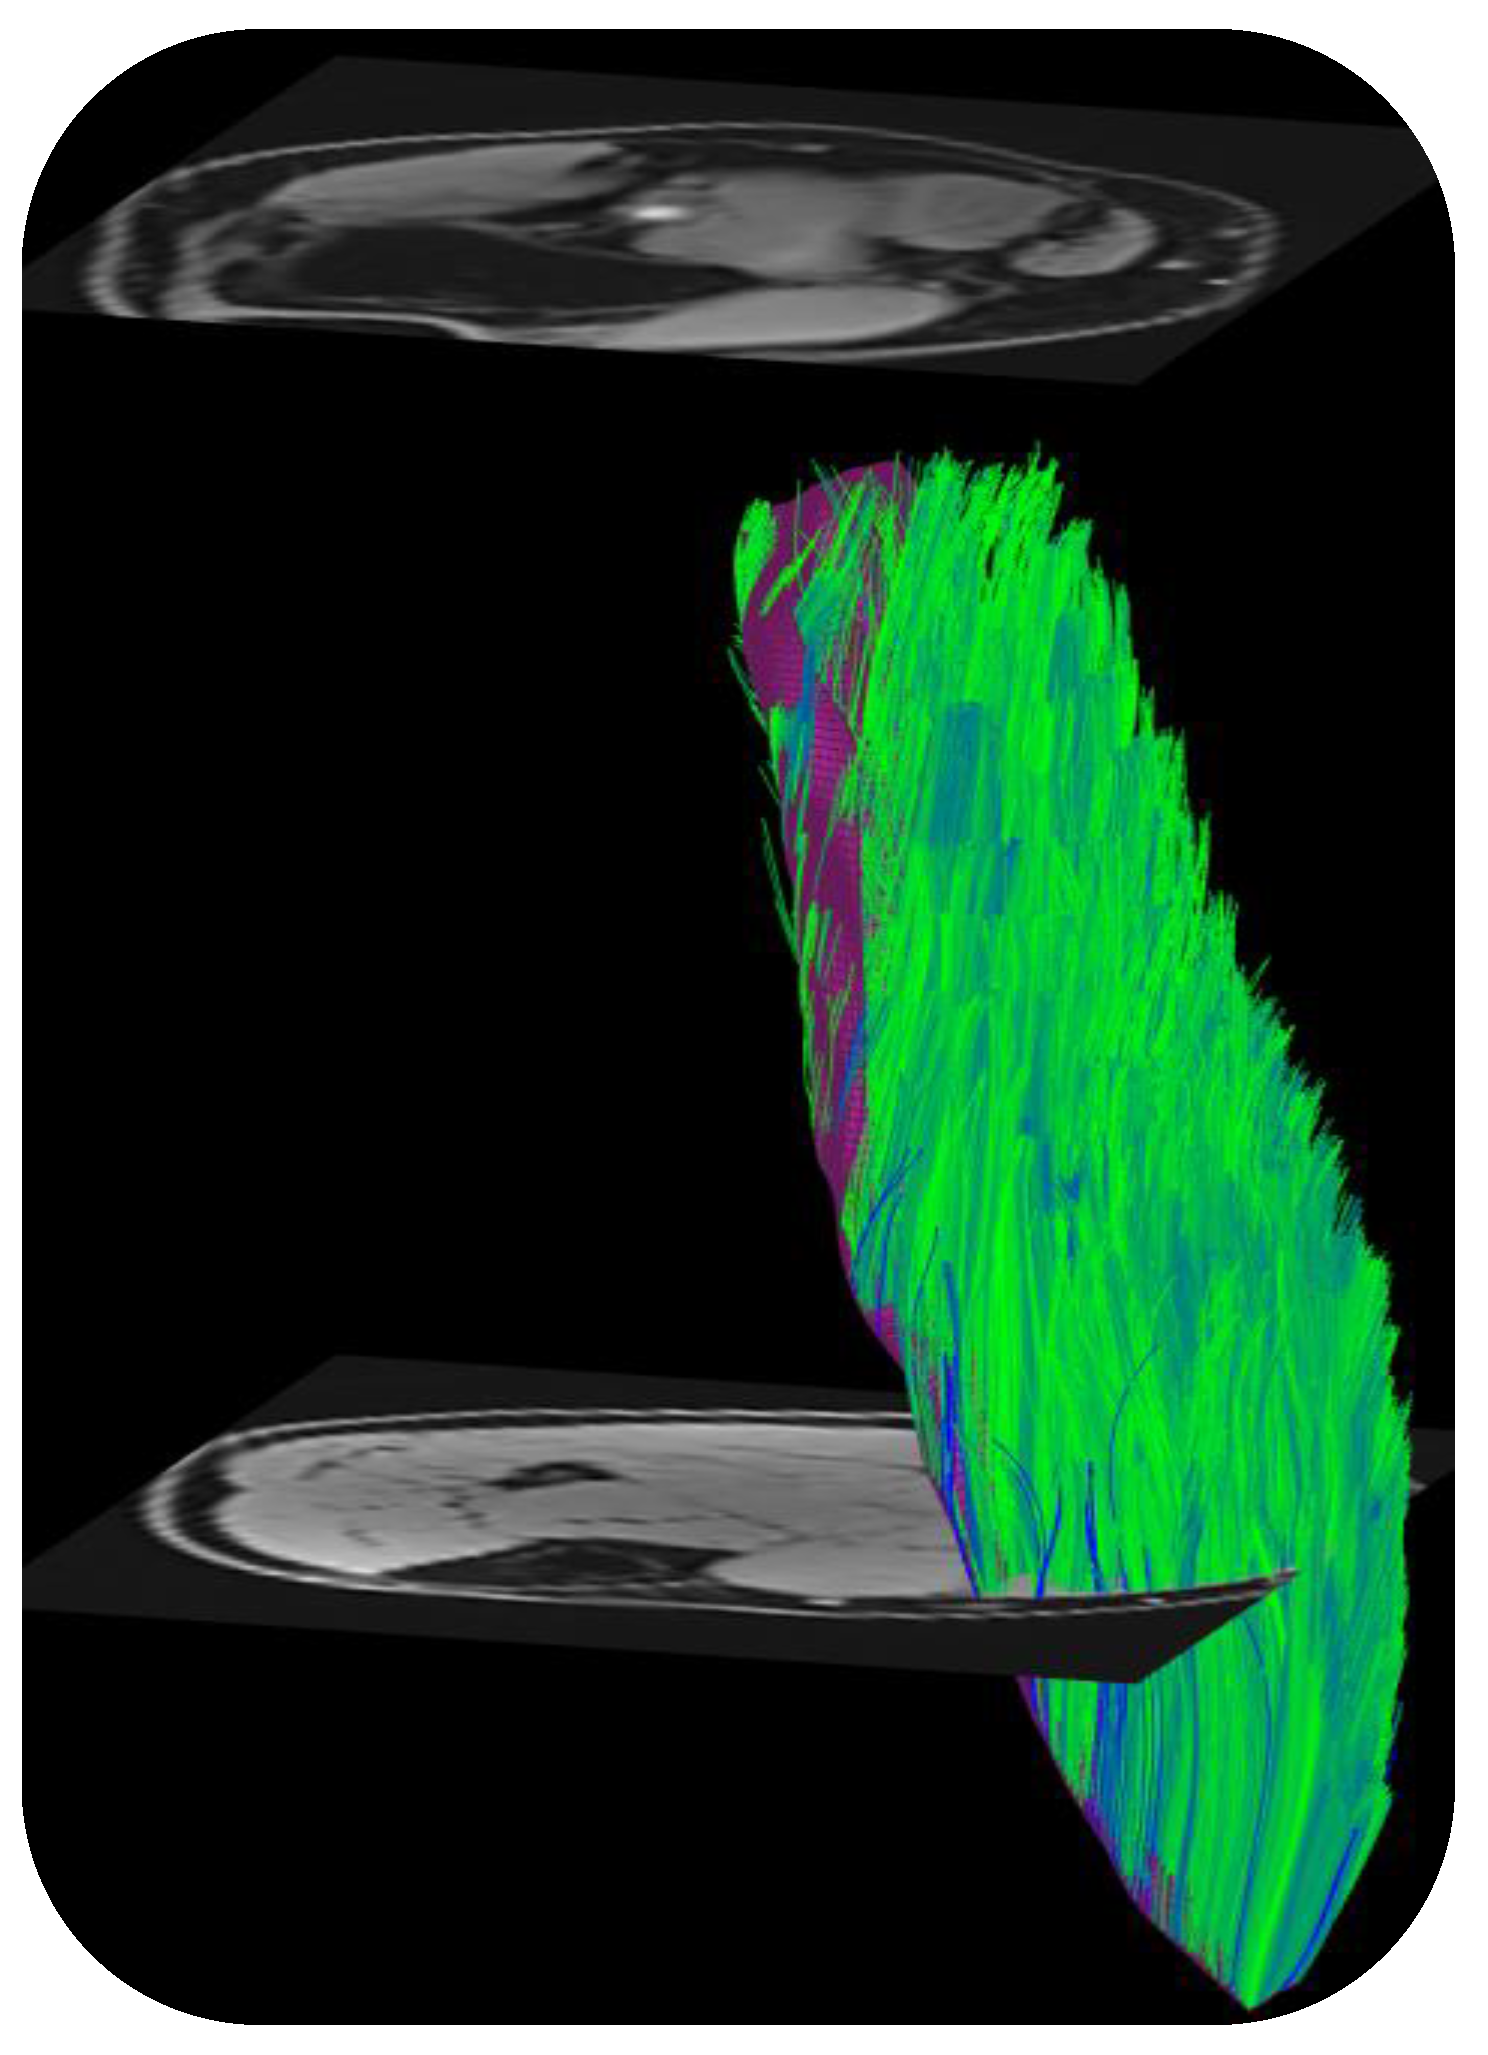
Figure 4.
Average RPBM model fits of λ2(t) for the groups of young (left) and senior (right) participants respectively. The points are experimentally determined while the dashed line is the model-derived fit to the eigenvalue. Reproduced with permission from the authors in Ref. [62].
Figure 4.
Average RPBM model fits of λ2(t) for the groups of young (left) and senior (right) participants respectively. The points are experimentally determined while the dashed line is the model-derived fit to the eigenvalue. Reproduced with permission from the authors in Ref. [62].
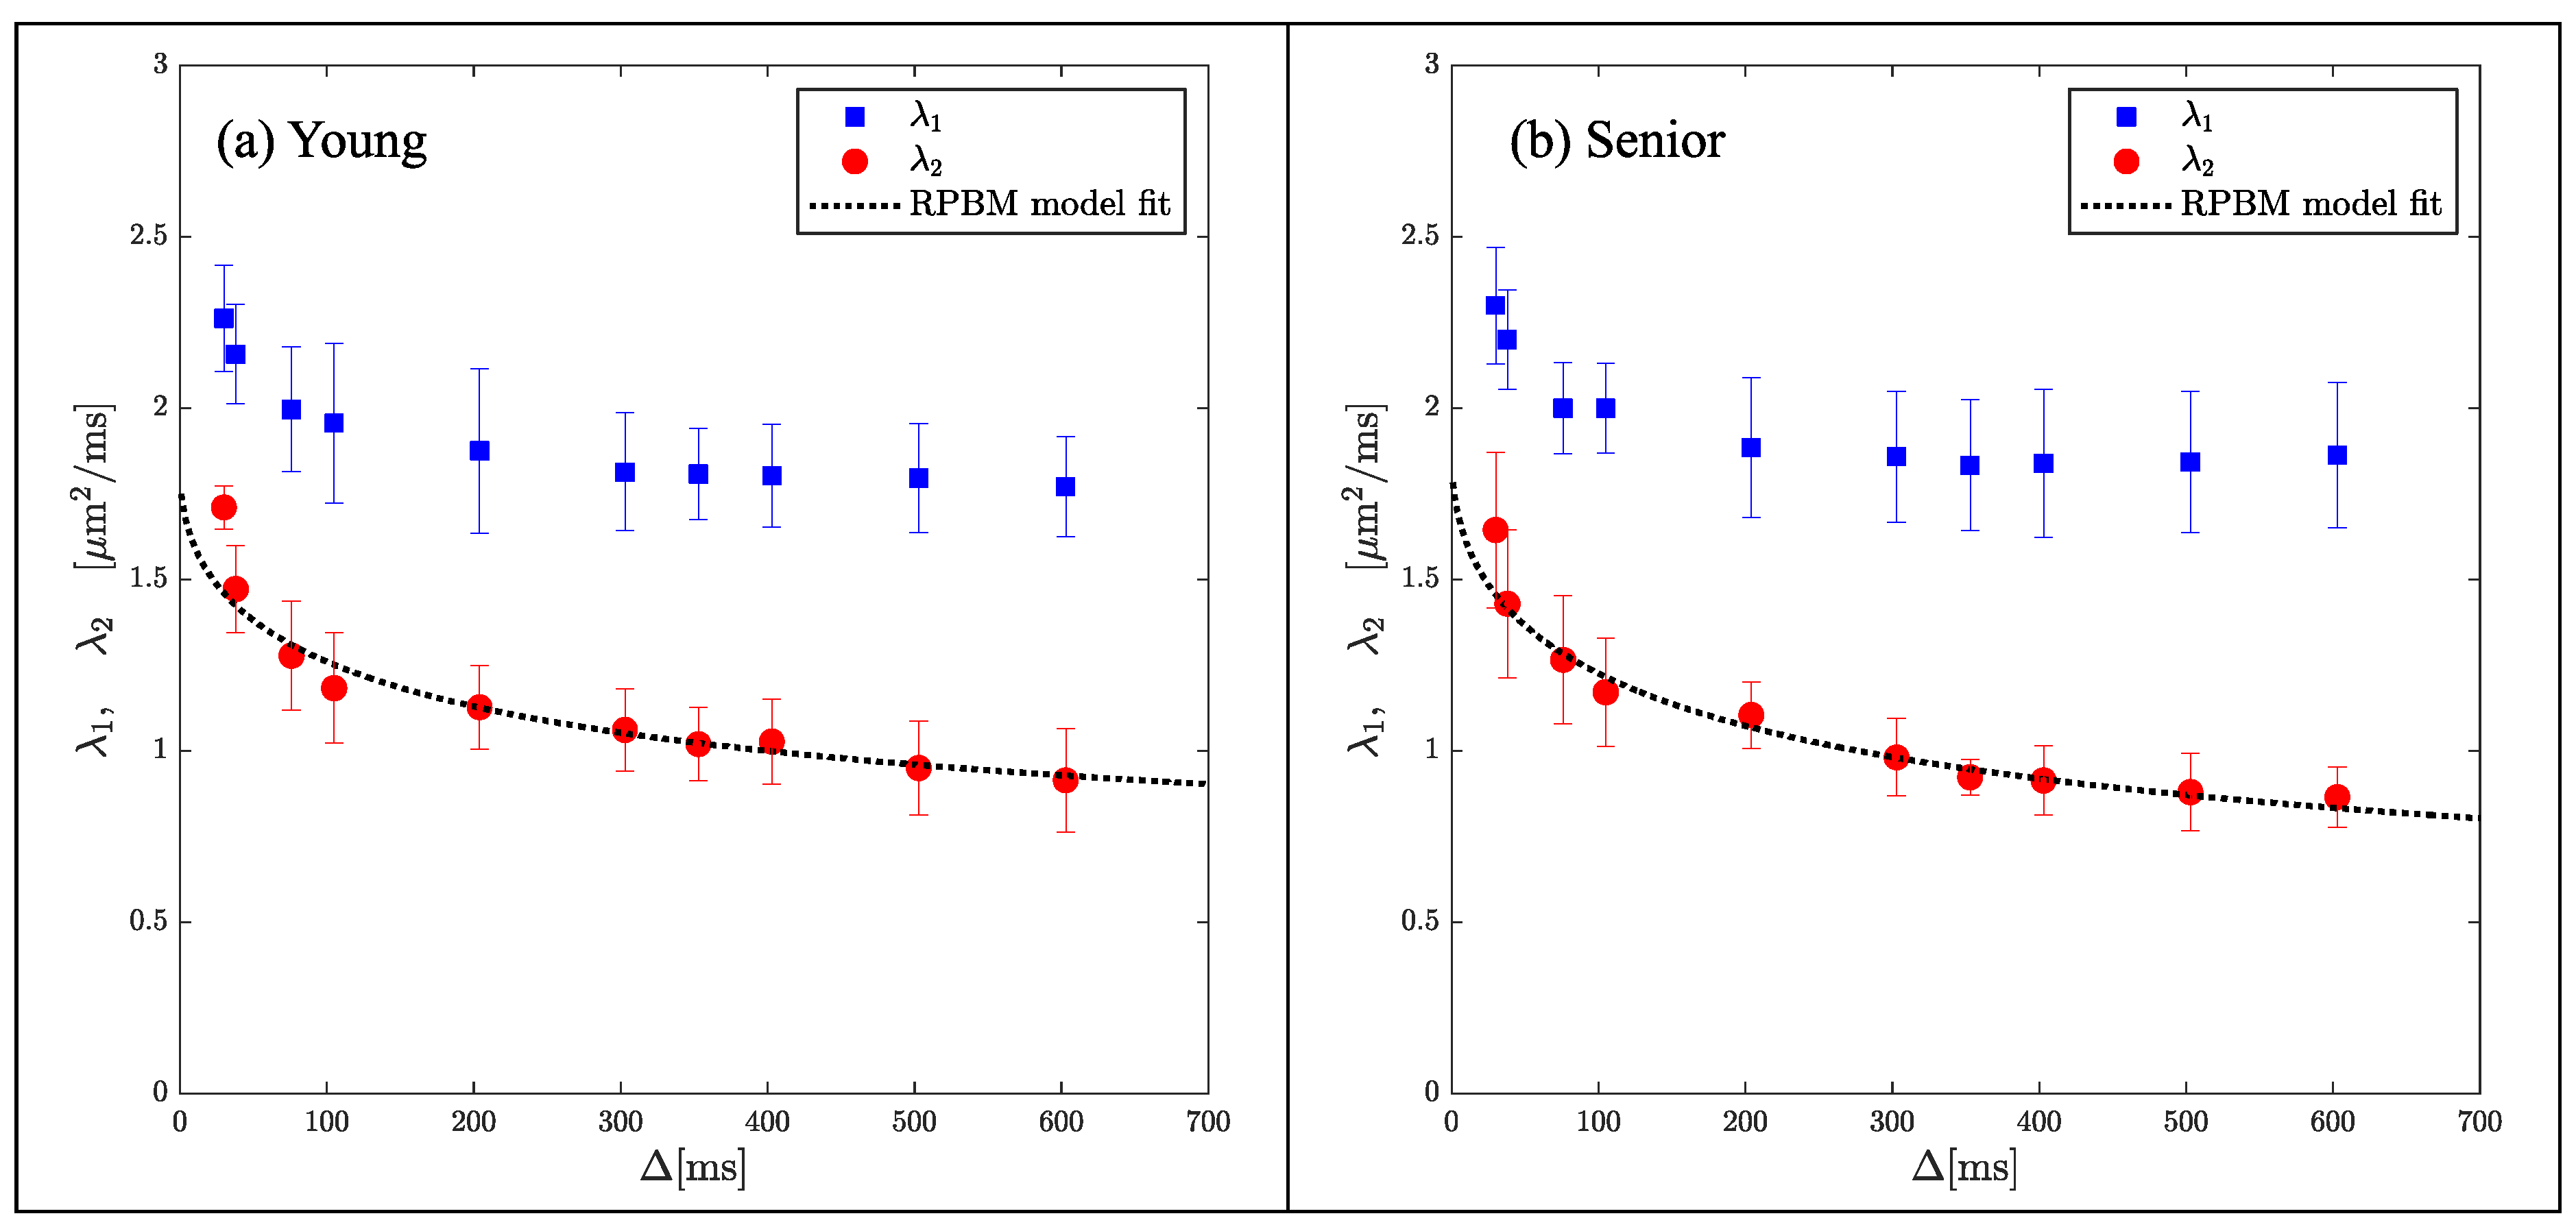
Figure 5.
Typical examples of MR images and resulting tissue segmentation in young and older women. Left: Water saturated FGRE (showing IMAT), Middle: UTE (showing IMCT), Right: Standard morphological images with superimposed outer contours of muscles and the result of the automated tissue segmentation. Images in top and bottom row represent one young and old subject, respectively. Reproduced with permission from the authors in Ref [40].
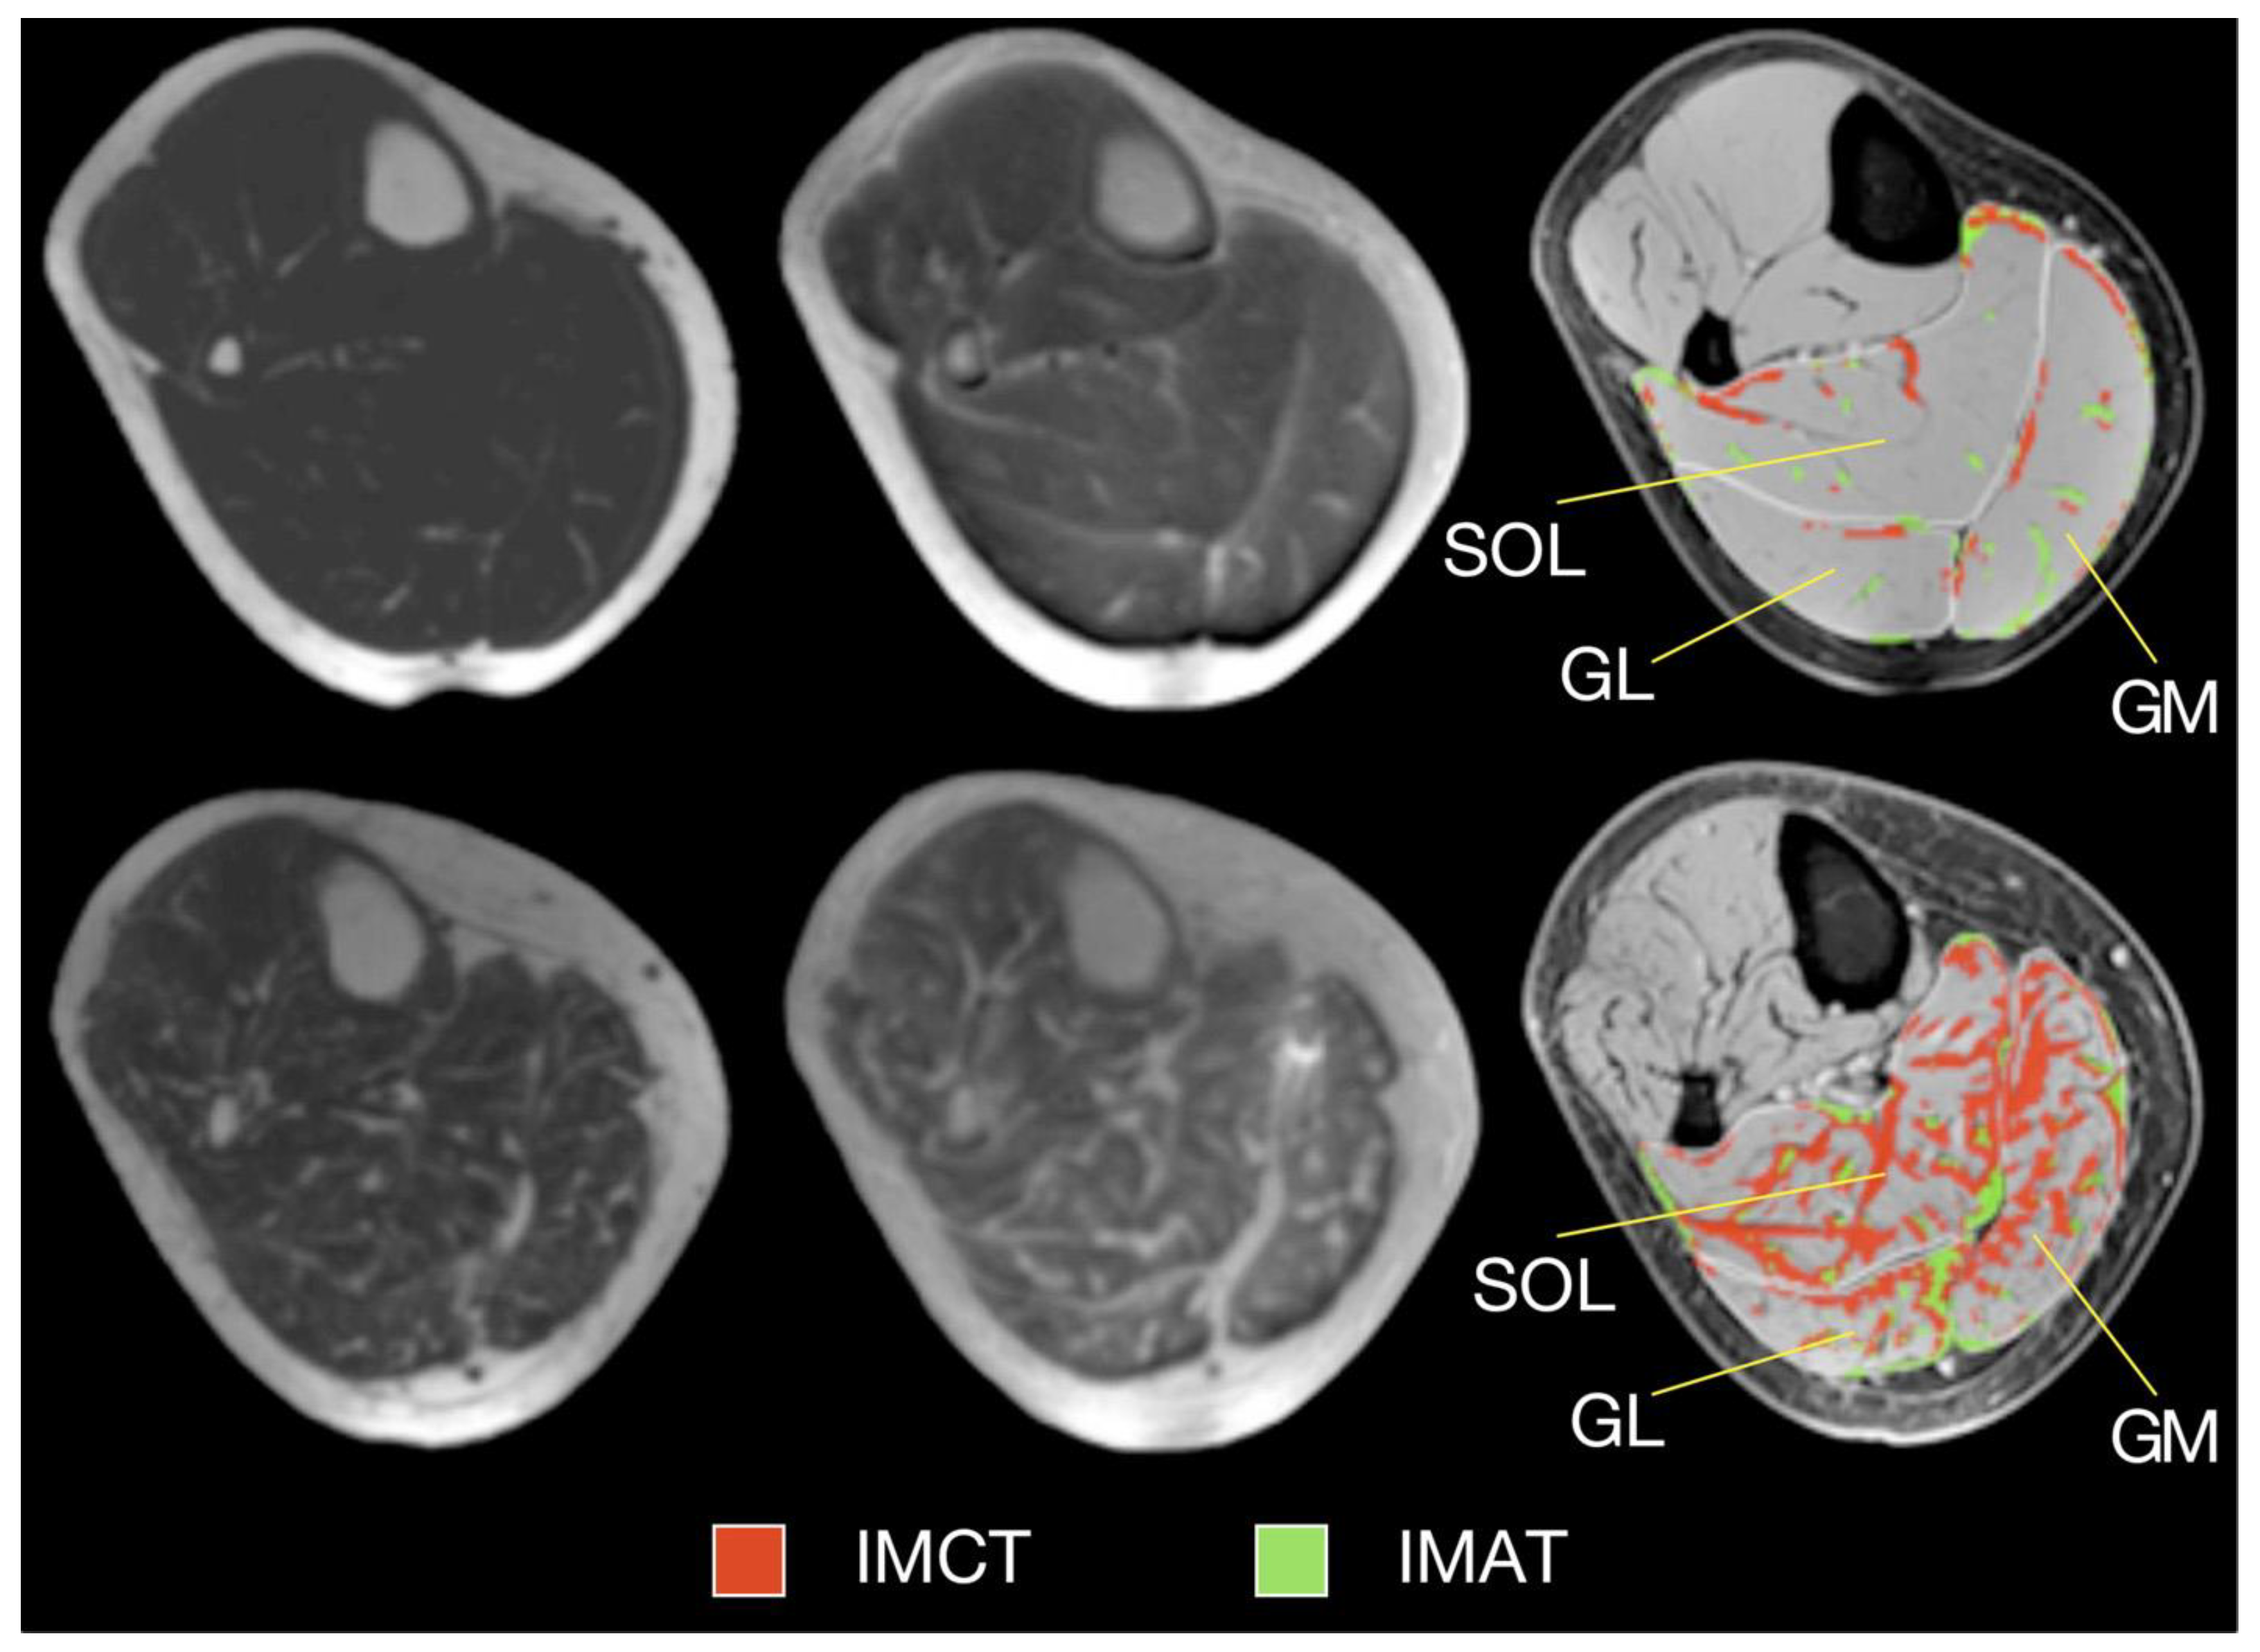
Figure 6.
Temporal variation of forces exerted by a young subject averaged during the MR data acquisition for different force levels (center panel) along with corresponding strain (right panel) and strain rate (left panel) colormaps at the peak values of (strain or strain rate along the fiber) during the contraction phase of the dynamic cycle for 60% (left column), 40% (middle column), and 30% MVC (right column). The colormap bars are shown in each panel. The temporal frames at which the peaks during contraction occurred for strain and strain rate are marked on the force curves. While the peak in strains occur at the maximum force reached, peak in strain rates occur earlier and roughly correspond to the maximum slope of the force-time curve in the contraction cycle. Reproduced with permission from the authors in Ref [91].
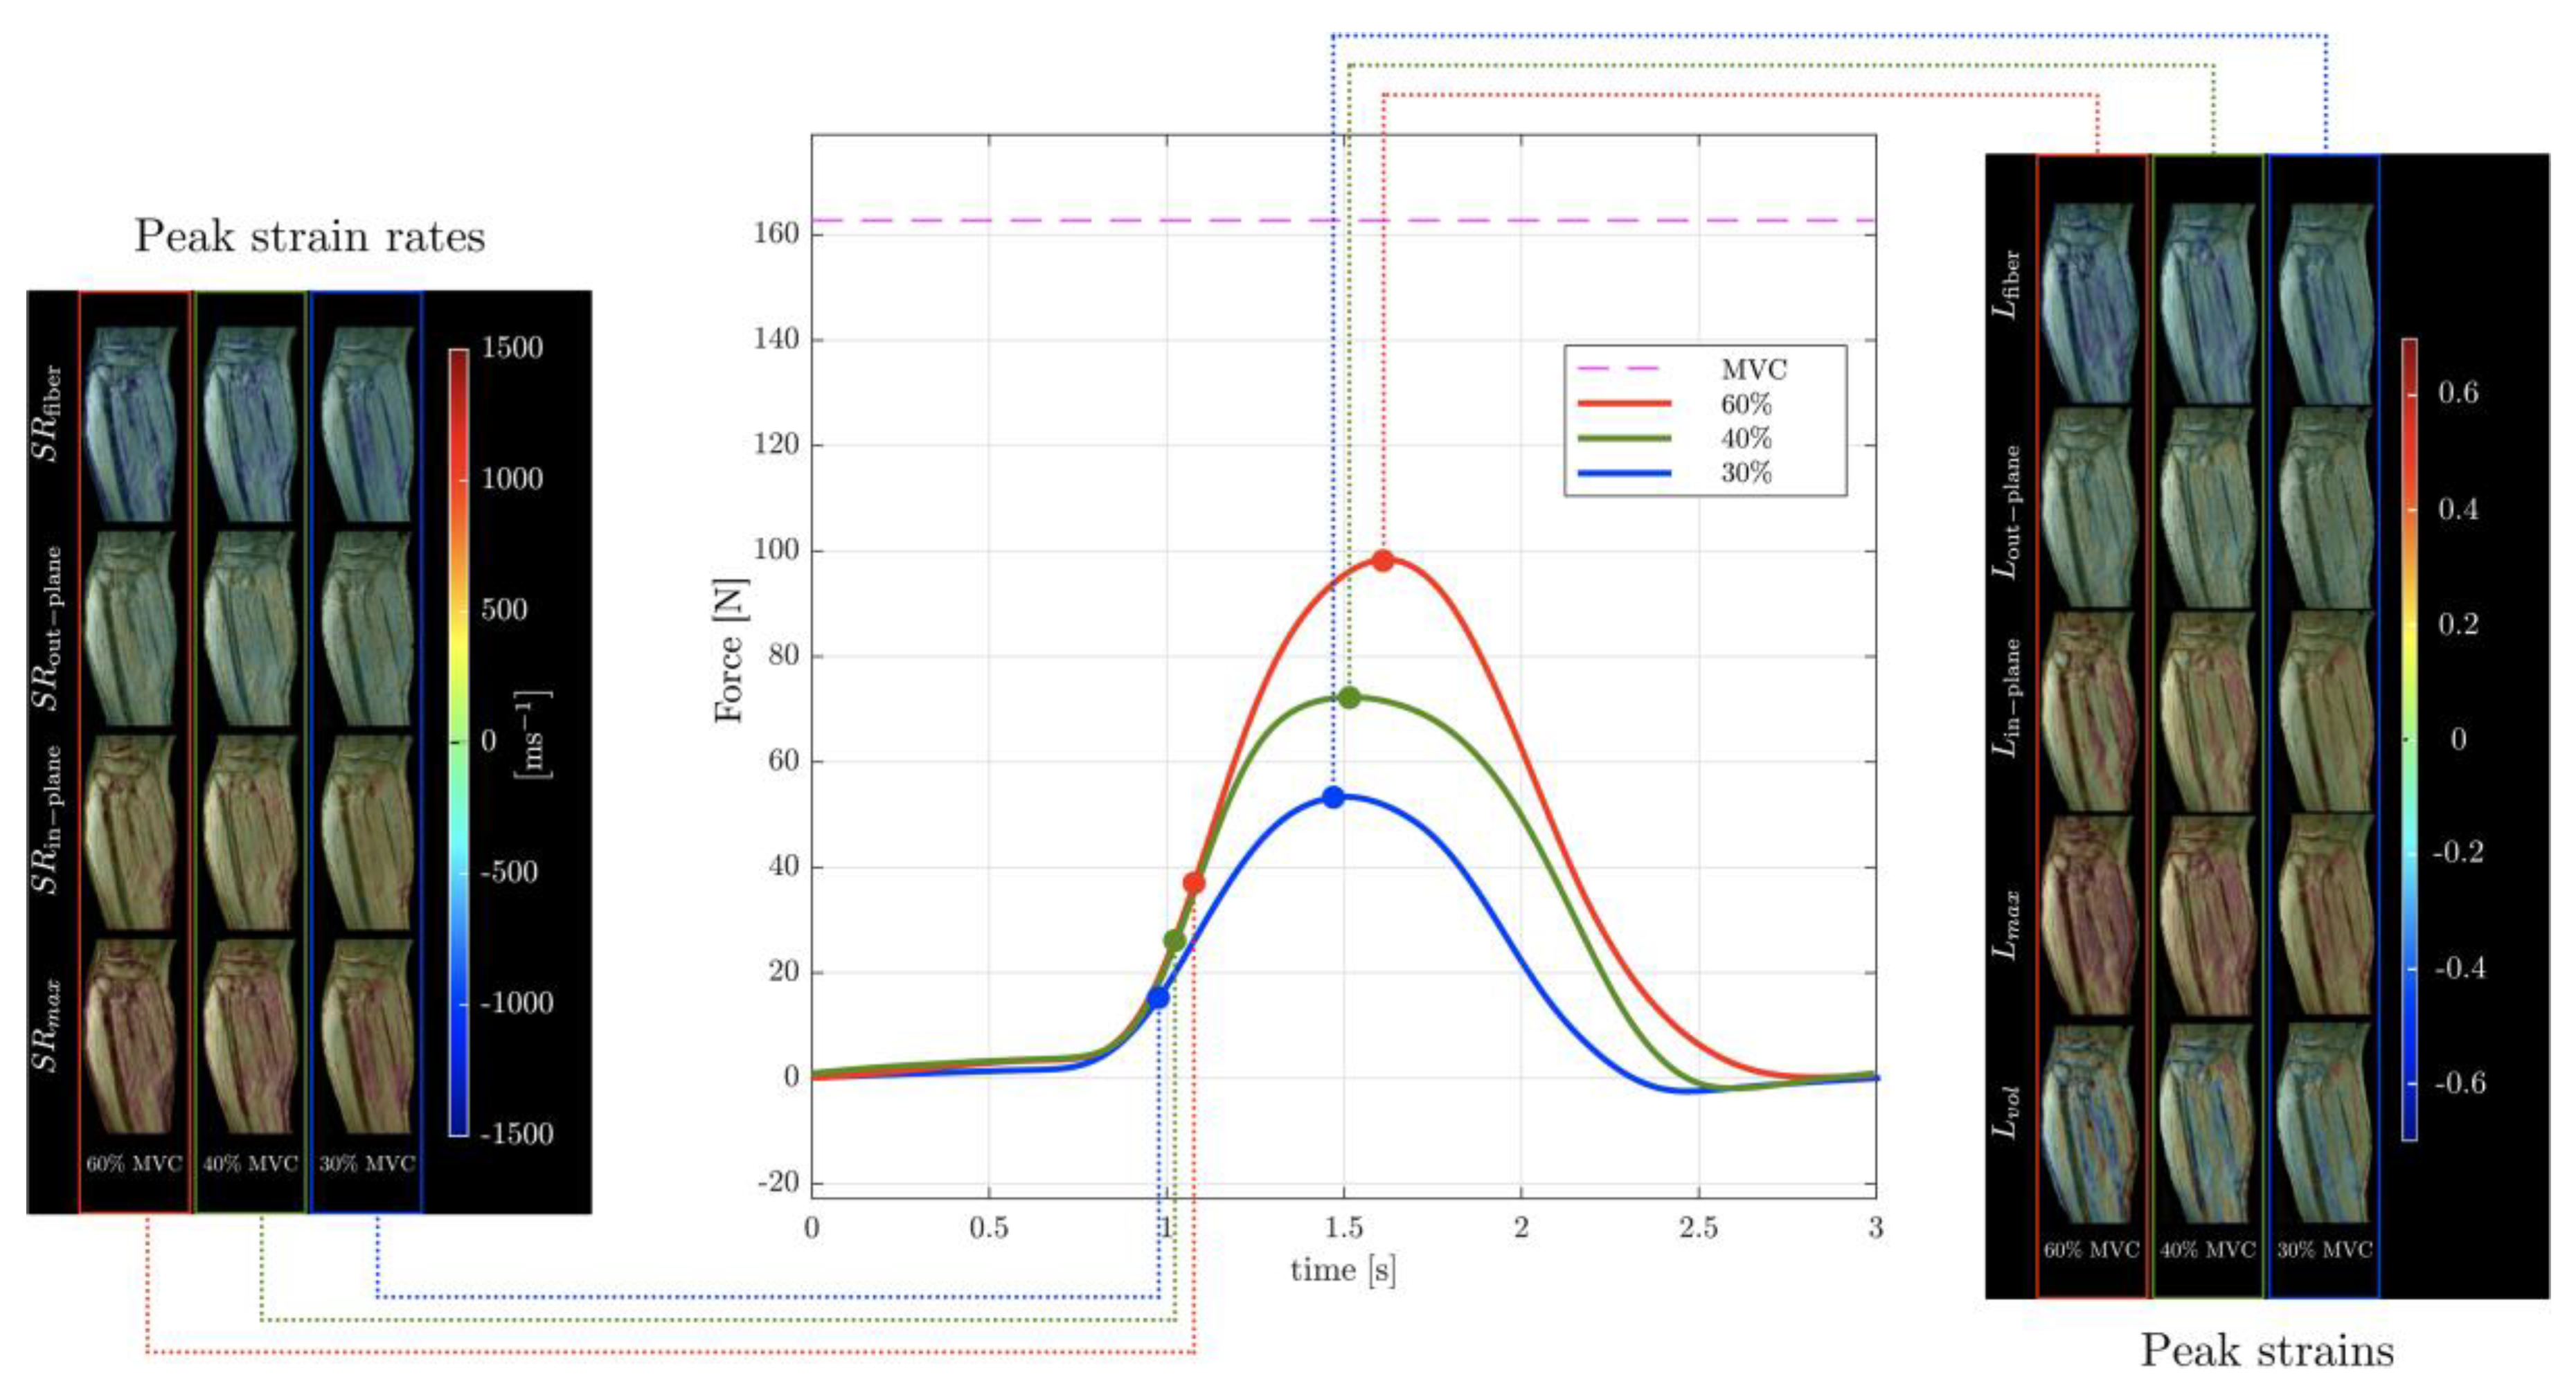
Figure 7.
Representative T1-weighted and IDEAL-CPMG images of the thigh muscles in three subjects with DMD. A T1-weighted image (A), T2-corrected fat fraction map (B), and water-T2 map (C) are shown representing subject anatomy, changes in muscle apparent fat fraction (AFFIDEAL-CPMG) and muscle water T2 (T2,w IDEAL-CPMG) respectively in the thigh muscles of subjects with DMD. Different severity of fatty degeneration is present in the thigh muscles of each subject, whereas inflammatory activity is sparse and seen in only few muscles (arrow). Reproduced with permission from the authors in Ref [100].
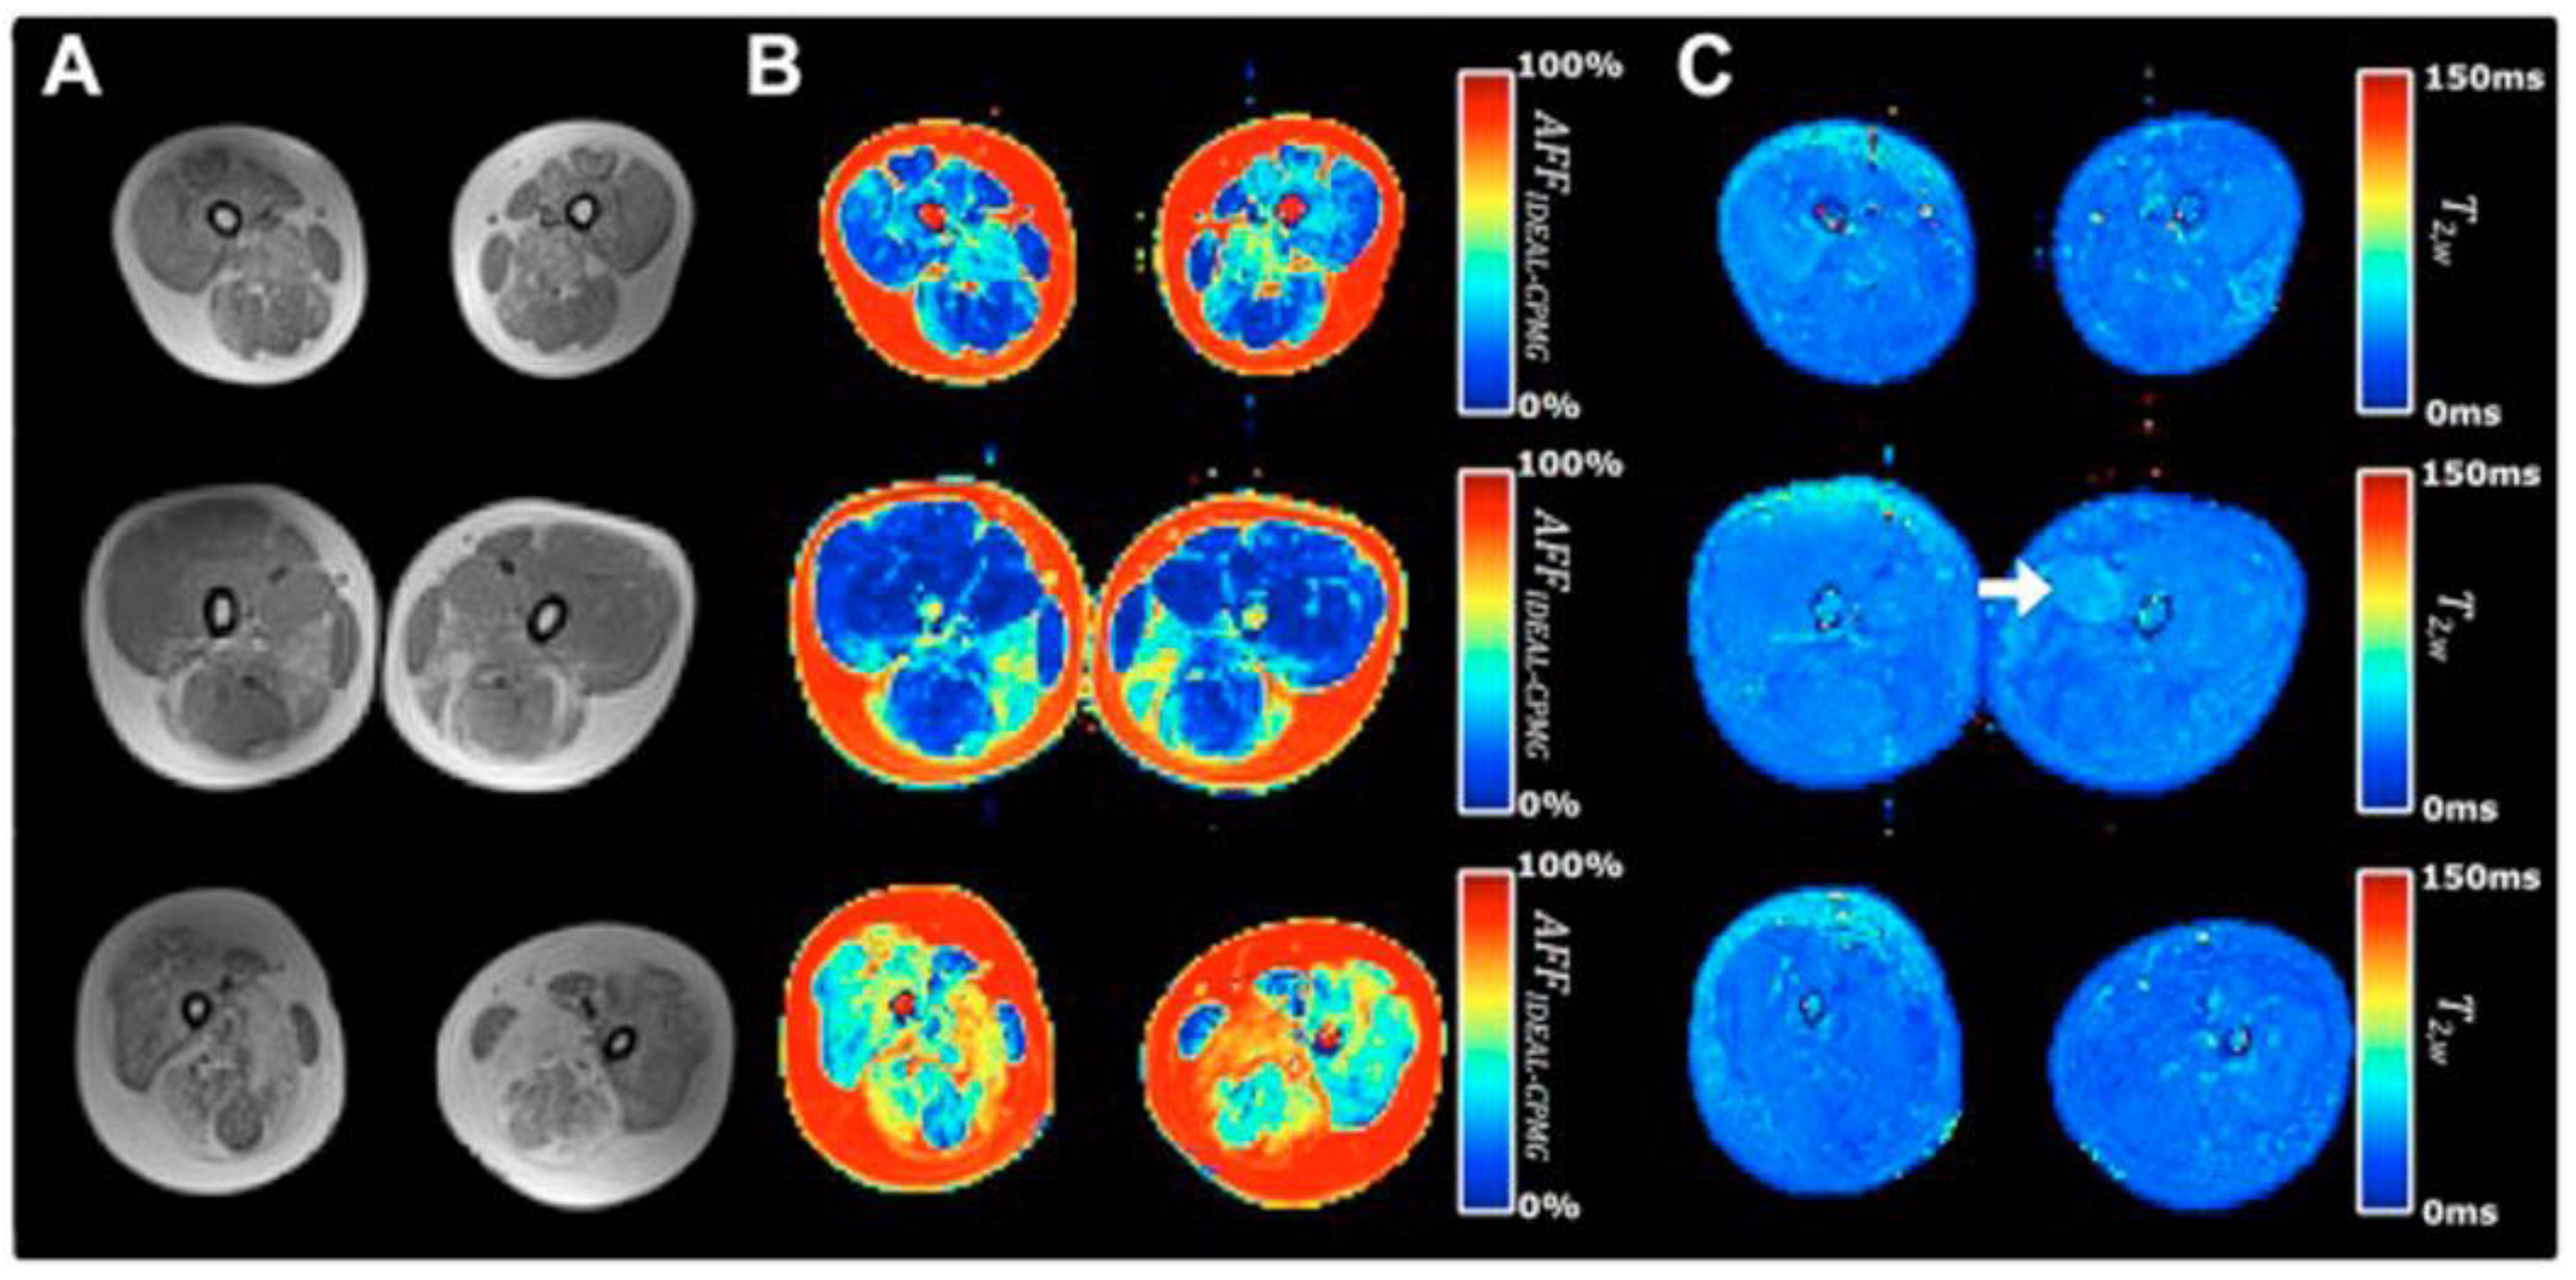
Figure 8.
Illustration of the possible failure of qualitative imaging to detect diffuse muscle edema/inflammation. The left panel is pre-treatment while the right panel is post-treatment. This patient with juvenile dermatomyositis had diffuse involvement of the thigh muscles. The muscle signal of T2w images appeared quasi-normal, with perhaps a somewhat waxy texture (upper left panel). By contrast, the water T2 maps unambiguously measured very high and abnormal T2 values, revealing the intense disease activity (lower left panel). It also confirmed the post-treatment normalization, with muscle water T2 returning to normal values (lower right panel). Reproduced with permission from the authors in Ref [104].
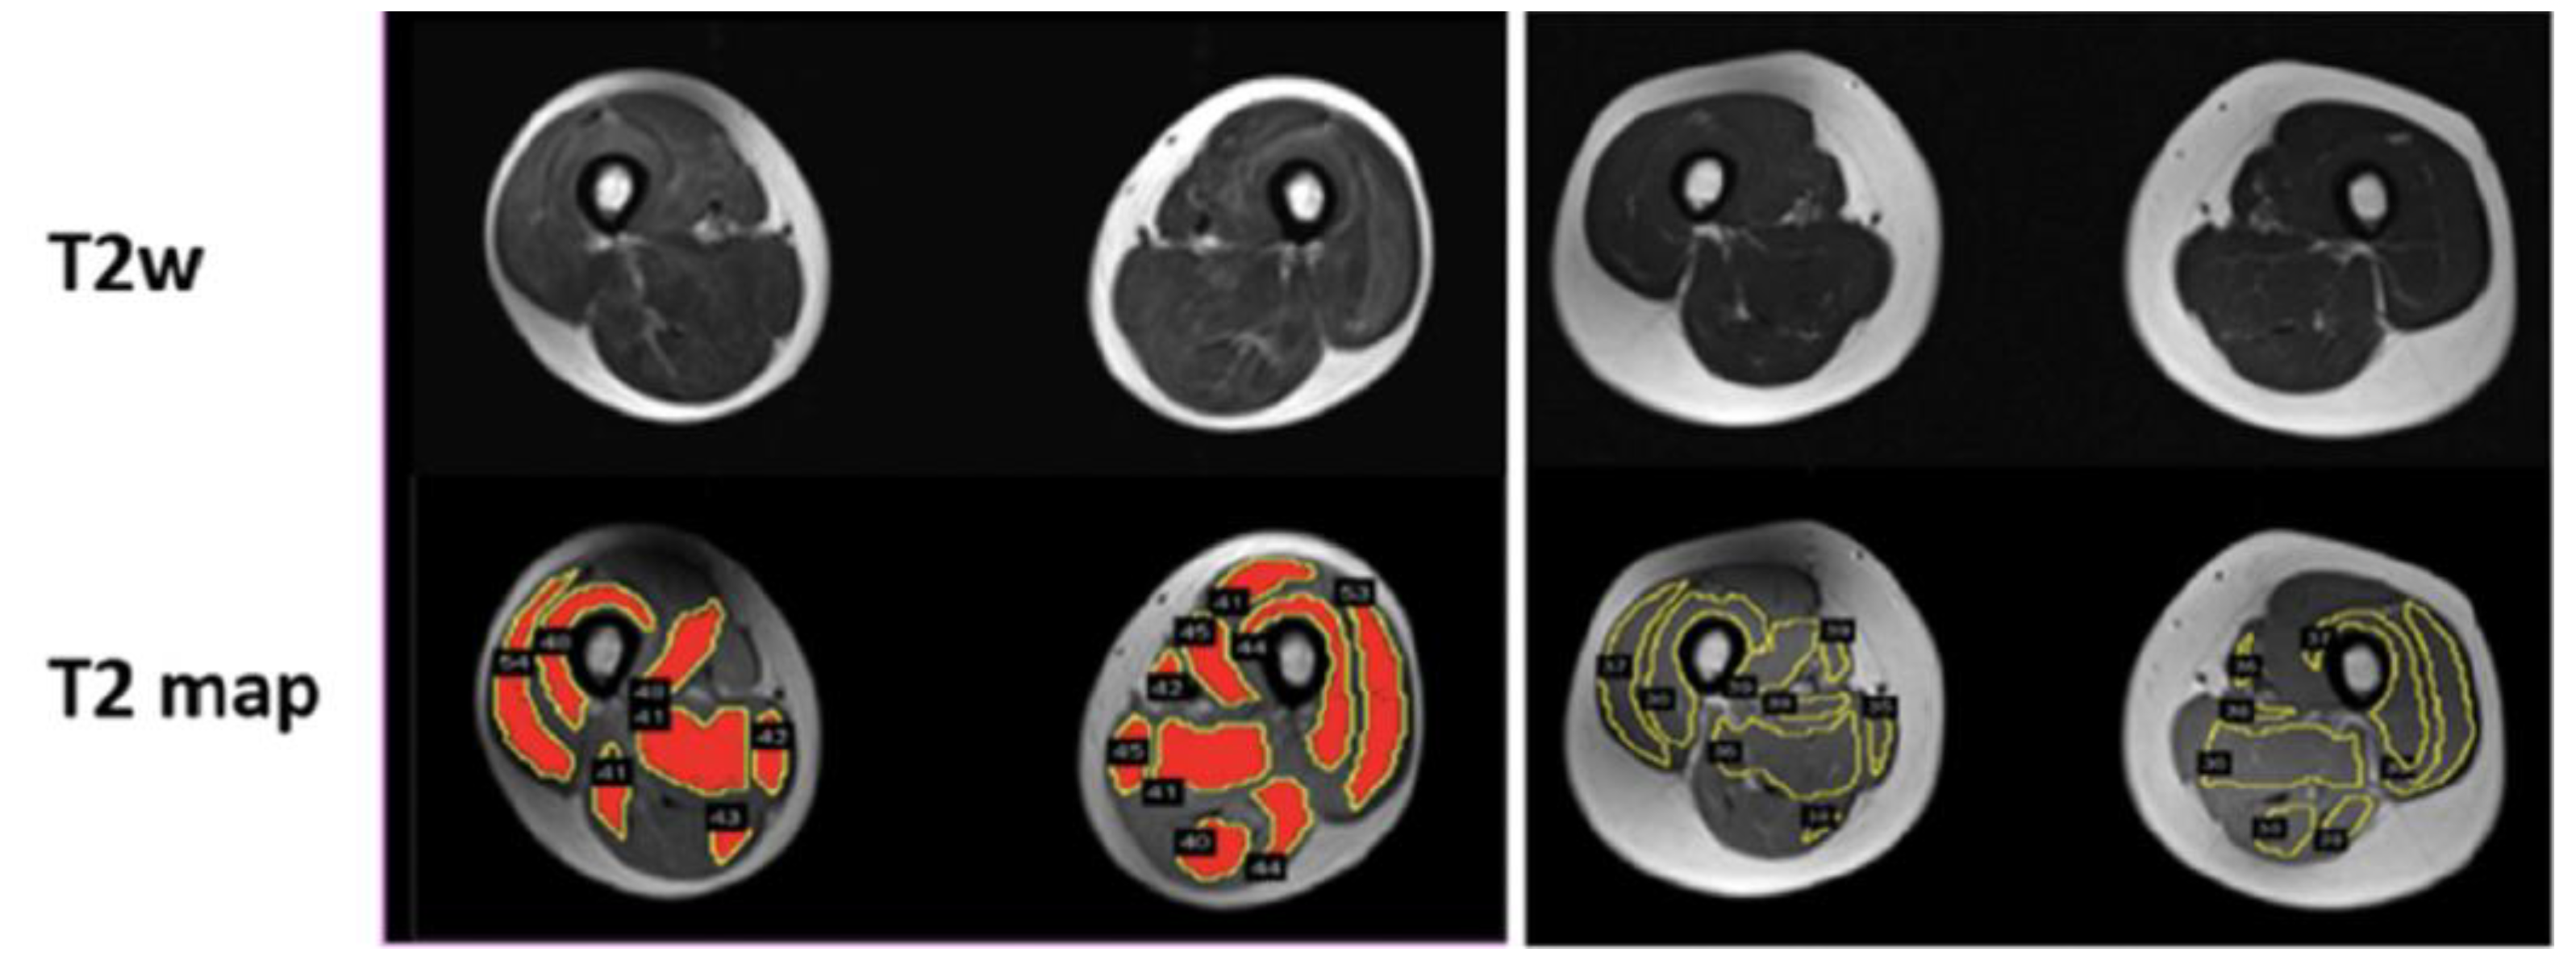
Figure 9.
Whole-body T1w imaging of patients with late-onset Pompe disease. A, Involvement of tongue is observed. In the scapular girdle, the subscapularis (arrow in B and C) and latissimus dorsi (arrow in D) are affected, yet the deltoid, biceps, and triceps are not typically involved. Paraspinal and abdominal muscles are typically affected (E and F). The gluteus minimus and medius (arrow in H) are affected earlier than the gluteus maximus (arrow in I). Patients in the early stages of disease may have no glutei involvement (G). In the thigh, the adductor magnus and long head of biceps are involved earlier (J and M), whereas posterior muscles and the vasti are affected later in th progression (K and N). Eventually, all muscles of the thigh are affected (L and O). A proximal-to-distal gradient in the vasti is usually identified (J-M and K-N), although it is lost in advanced stages (L-O). Lower legs are usually spared (P), although mild replacement of the soleus (arrow in Q) and media gastrocnemius (arrow in R) can be observed. The images shown are from seven patients. T1w, T1weighted. Reproduced with permission from the authors in Ref [109].
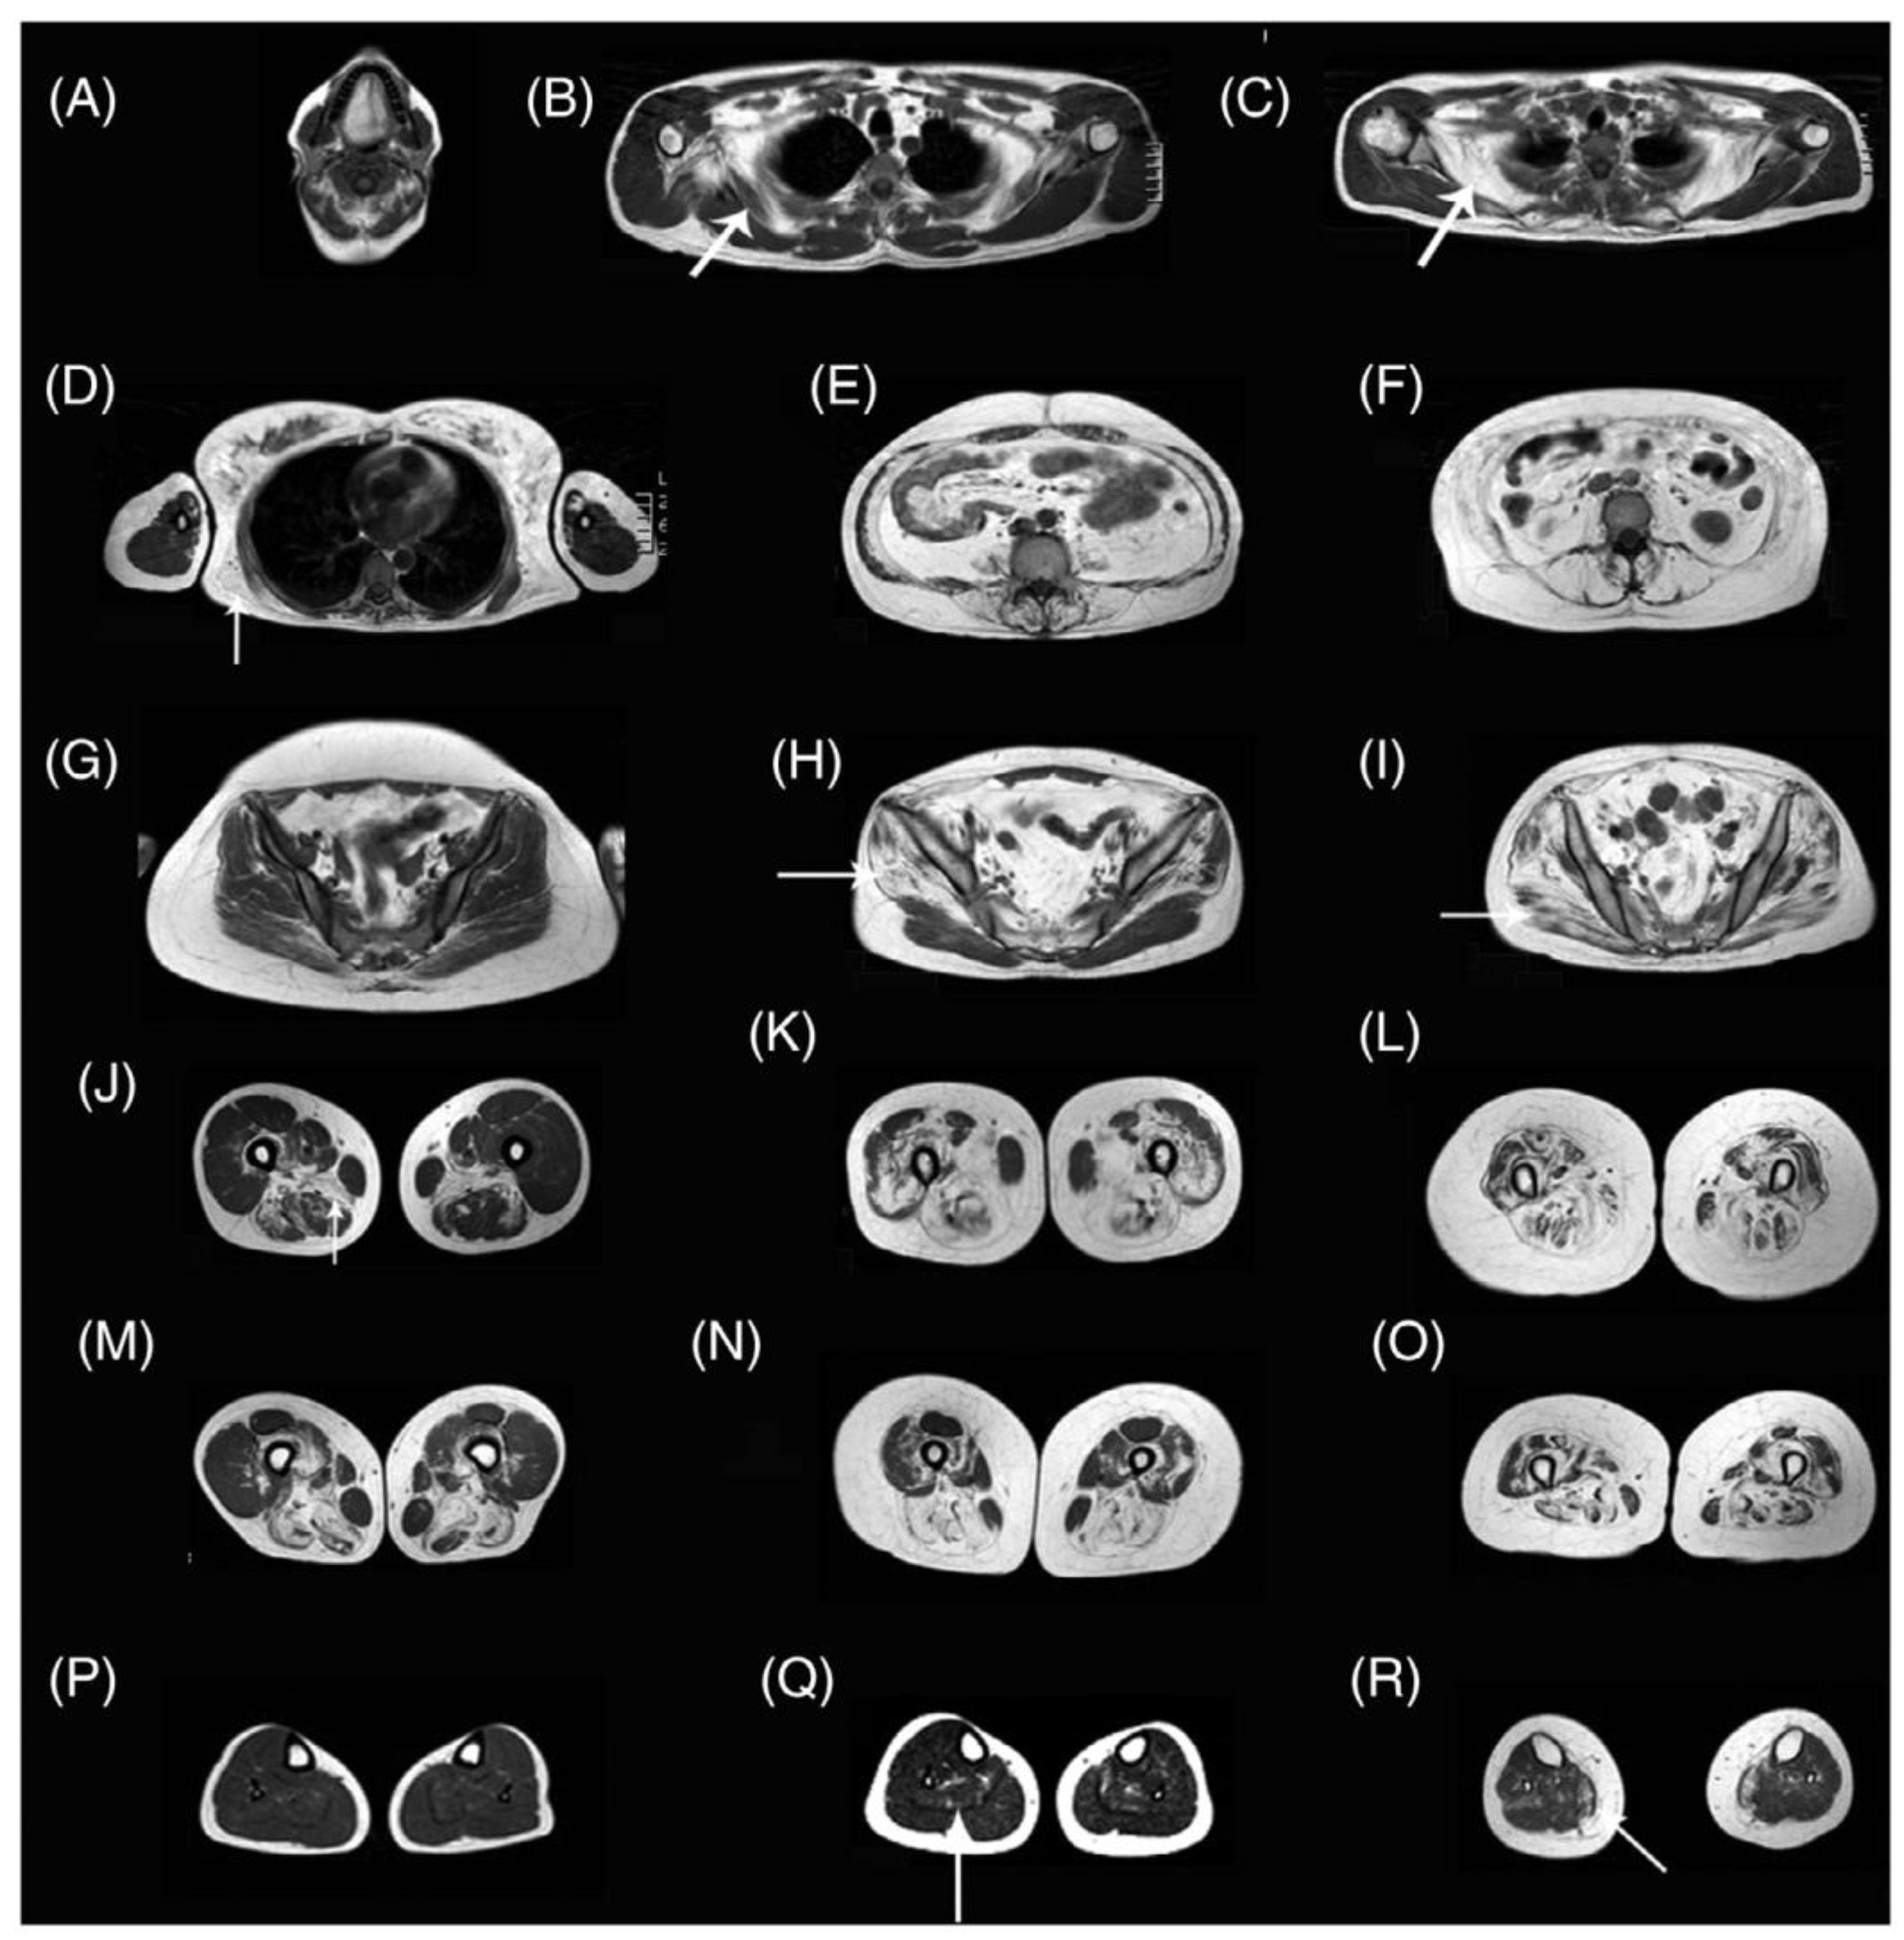
Figure 10.
Representative images of three athletes showing coronal fat-suppressed T2-weighted images of the hamstring injury depicted by the red oval (first column) together with axial spin echo EPI images (b-value = 0 s/mm2) (second column), reconstructed mean diffusivity(MD) maps (third column) and reconstructed qT2 maps (fourth column) at the three time points (time point 1: within 1 week postinjury; time point 2: 2 weeks after visit 1, and time point 3: at clinical return to play). DTI, diffusion tensor imaging; qT2, quantitative T2. Reproduced with permission from the authors in Ref [124].
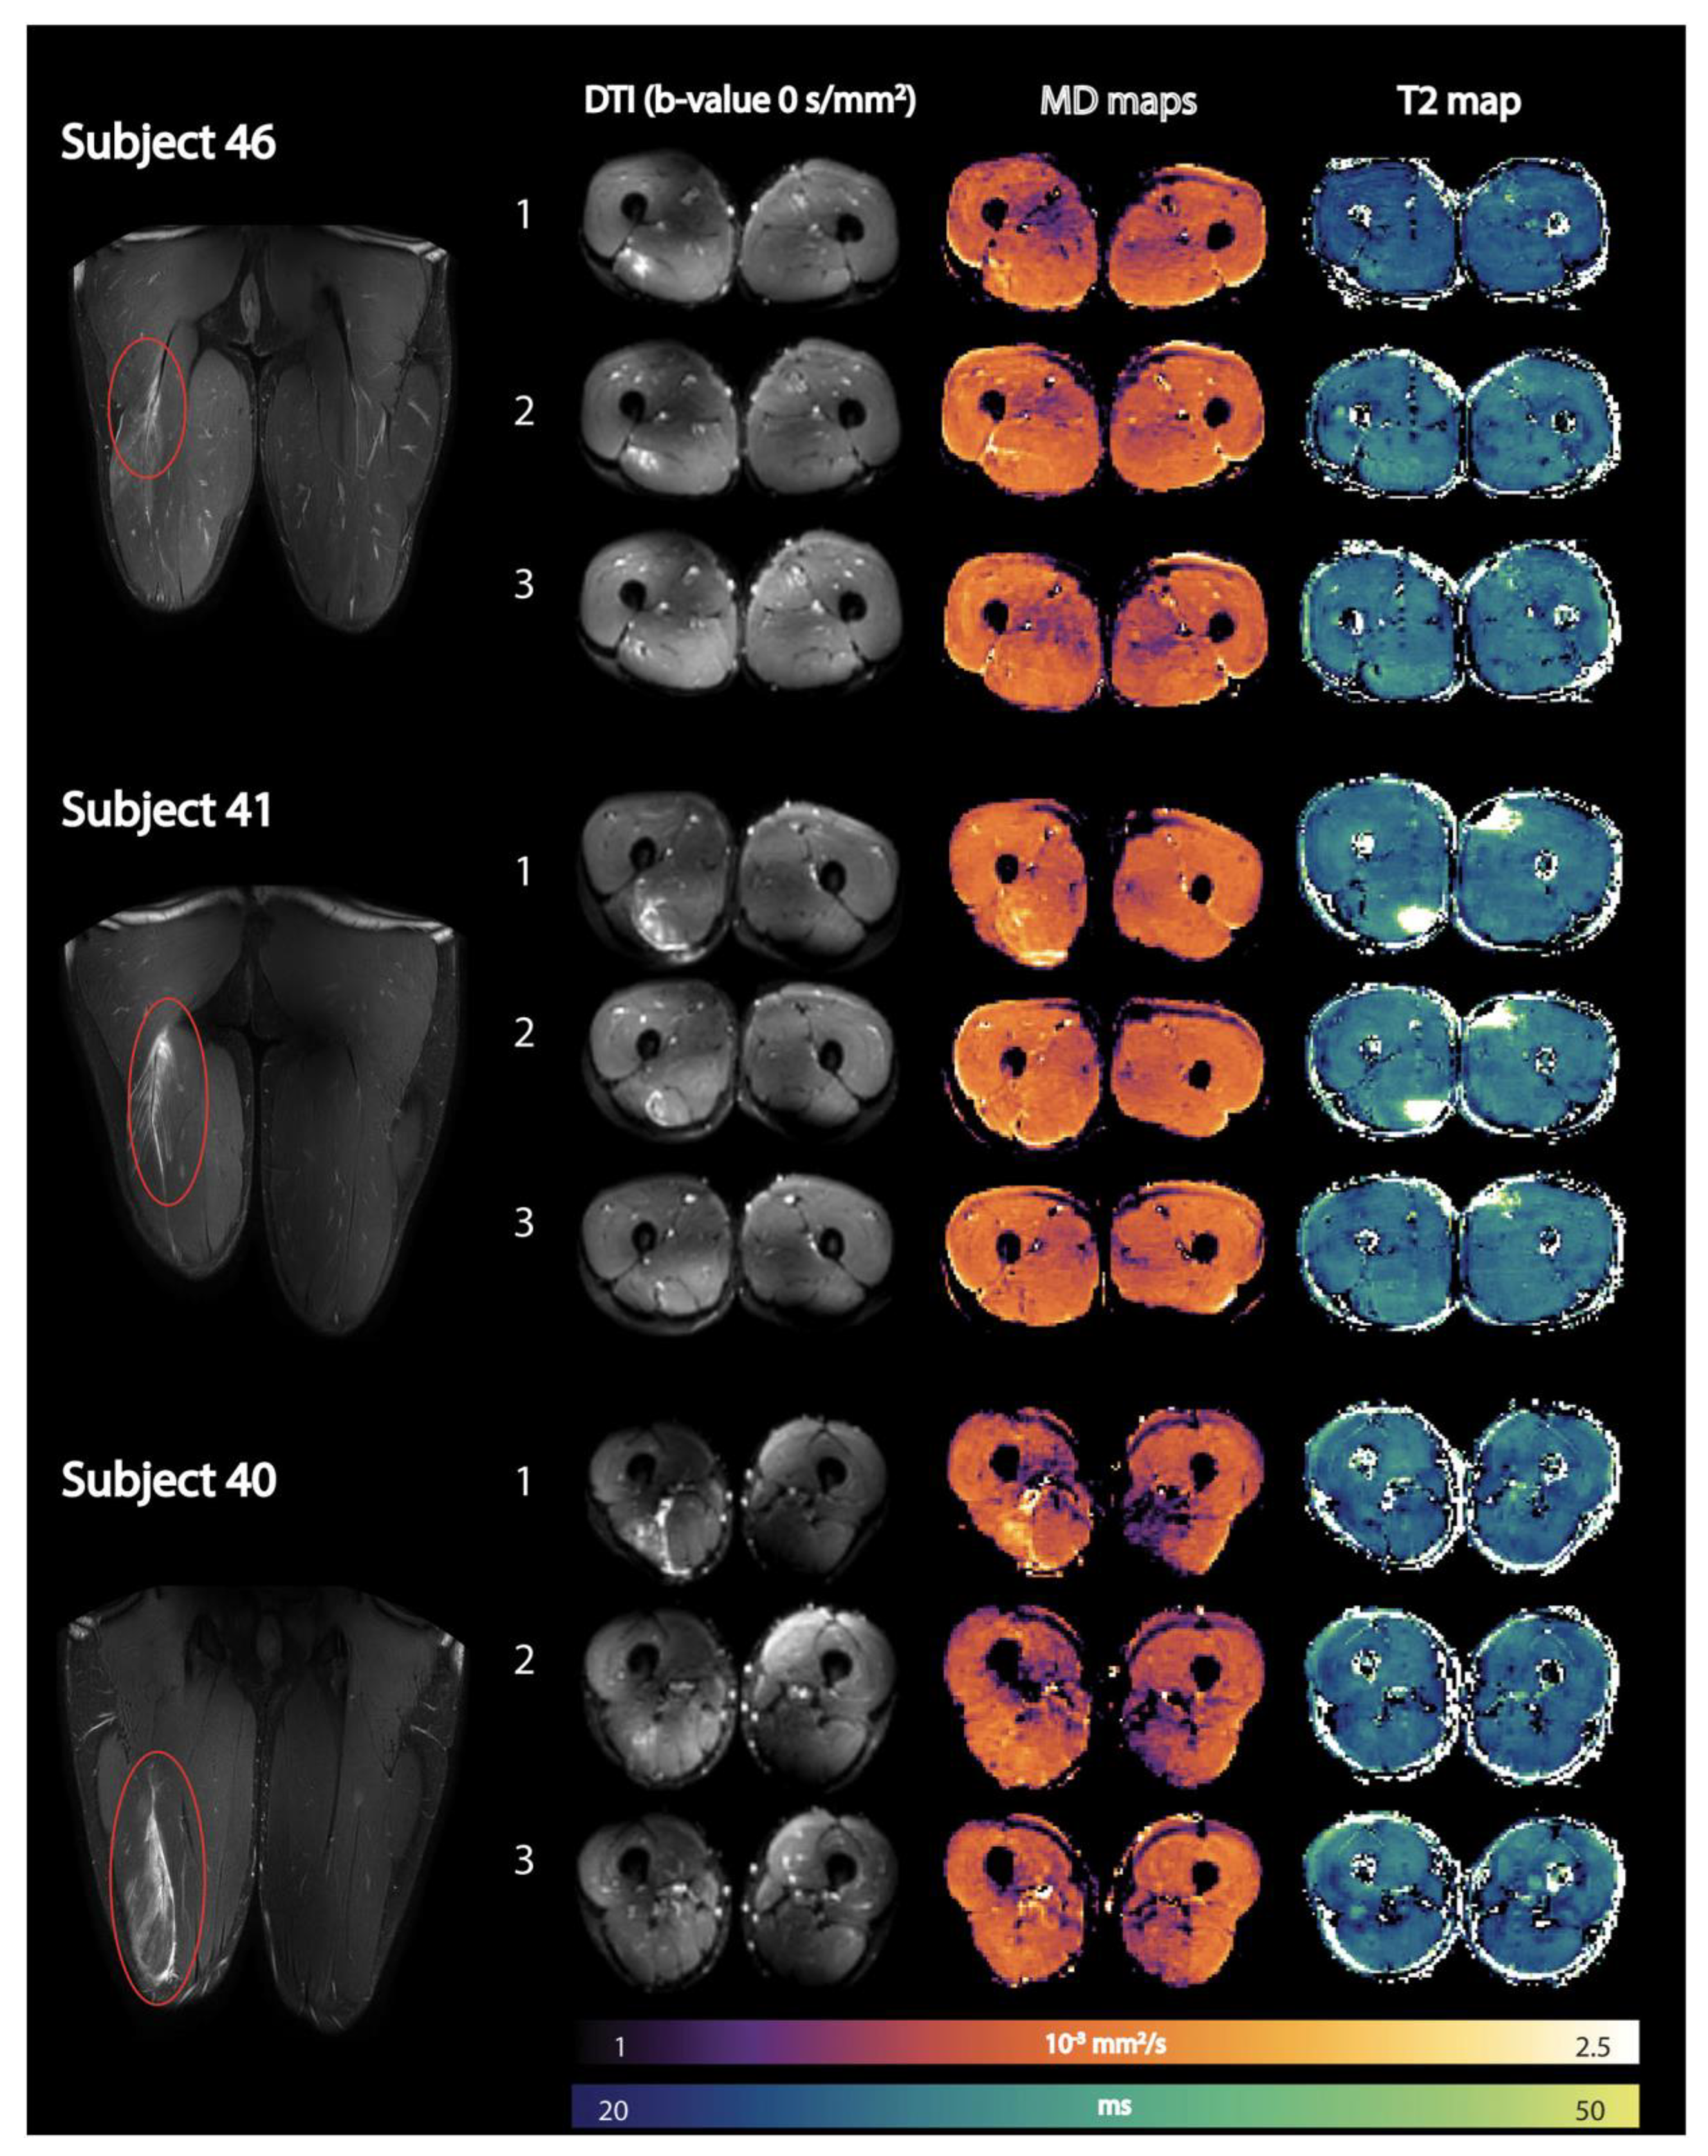
Disclaimer/Publisher’s Note: The statements, opinions and data contained in all publications are solely those of the individual author(s) and contributor(s) and not of MDPI and/or the editor(s). MDPI and/or the editor(s) disclaim responsibility for any injury to people or property resulting from any ideas, methods, instructions or products referred to in the content. |
© 2024 by the authors. Licensee MDPI, Basel, Switzerland. This article is an open access article distributed under the terms and conditions of the Creative Commons Attribution (CC BY) license (http://creativecommons.org/licenses/by/4.0/).
Copyright: This open access article is published under a Creative Commons CC BY 4.0 license, which permit the free download, distribution, and reuse, provided that the author and preprint are cited in any reuse.


