Submitted:
05 August 2024
Posted:
06 August 2024
You are already at the latest version
Abstract
This study evaluates the use of remote sensing to improve real-time adaptive management of grasslands. By quantifying grassland biomass through changes in sward height from pre- and post-grazing events using unmanned aerial systems (UAS), we derived accurate biomass estimates. Additionally, we aimed to enhance the biomass estimation with spectral data from Sentinel-2 imagery, which is often hindered by cloud contamination, by combining it with a random forest algorithm. The calibration of UAS biomass using field measurements from sward height changes through 3D photogrammetry produced strong regression metrics (R2= 0.75, RMSE= 1240 kg DM/ha and MAE=980 kg DM/ha). Integrating this UAS-derived data with Sentinel-2 imagery, the satellite based biomass model (R2= 0.56, RMSE=2140 kg DM/ha and MAE=1585 kg DM/ha) compared to using the Sentinel-2 random forest-enabled model alone (R2= 0.56, RMSE=2140 kg DM/ha and MAE=1585 kg DM/ha). This study emphasise the importance of timely and accurate biomass estimation for adaptive gazing management at the field level, highlighting the balance between utilising advanced remote sensing technologies and addressing operational complexities. By optimising the integration of UAS and satellite data, we aim to enhance grassland utilisation, ecosystem functions, nutrient cycling, and sustainability in land use.
Keywords:
Machine learning
; artificial intelligence
; drone
; photogrammetry
; pasture
; grassland
; monitoring
; agricultural sustainability
; adoption
; management
1. Introduction
Grassland ecosystems play a significant role in supporting plant and animal diversity [1], providing ground cover to prevent erosion [2], supporting vital ecosystem and agricultural production while contributing to global carbon sequestration [3,4] Regular information about grassland structure, canopy height, and volume is crucial to maintaining ecological health [5,6] and preventing overgrazing, understocking, or natural adverse events [7] that threaten habitat loss [8]. Sustainable grazing management that minimises the risk of bare ground exposure by fastidious monitoring of grassland components such as biomass quantum and quality, litter, and residual [9] at the farm level to control the carrying capacity index (ecological, economic, environmental, and social) [10] is more likely to increase enterprise profitability while maximising environmental stewardship [11].
However, site-specific monitoring at the farm scale (< 1 ha) requires a high level of precision and detail to provide specific management interventions on-demand in real-time, such as accounting for cell grazing (high intensity short rotation grazing) as advocated in regenerative trials [12,13]. Pre- and post-grazing monitoring provides information about biomass utilisation and whether the reduction in pasture heights has exceeded the targeted threshold to avoid degradation [14]. An unmanned aerial system (UAS) equipped with 3D point cloud photogrammetry data at a very high spatial resolution (1-5 mm) could provide comprehensive details of biomass and small-scale variation between and across the paddocks [15]. Although satellites offer wider coverage, they have a lower spatial resolution and are often constrained by clouds [15]. Similarly, traditional methods of taking physical cuts in the field are labour-intensive and time-consuming [12].
Previous studies used various point cloud techniques i.e., digital stereo aerial photographs or visible camera (5 cm) [5,16,17], multispectral cameras [16], Light Detection and Ranging (LIDAR) [18,19] and combination of visible camera and LIDAR [20,21,22] to create vegetation heights of grasslands from digital surface model (DSM). Normalised Difference Vegetation Index (NDVI) from a multispectral UAS camera with random forest algorithm has been used to assess grassland biomass from a 1 ha plot [23]. However, these studies were based on woodland, arid or semiarid ecosystems where the assessment of grassland considered inter-canopy gaps [24] instead of vegetation density typical of intensively managed pastures [2]. Consequently, the methods presented did not consider biomass utilisation but estimated vegetation heights from shrubs, which are characteristic of rangeland systems [17]. In advancing timely assessment of the grassland ecosystem, Gillan et al. [17] argued that most studies that used remote sensing with UAS and satellites often compare coregistered spectral imagery with ground biomass sampling methods without multitemporal seasonality of images. Comparing satellite estimates with the most accurately known ground sampling (i.e., destructively sampling) method [25] from multitemporal spectral imagery to show the seasonality and phenology of grassland ecosystems will likely provide a better assessment [2]. However, the spectral changes in vegetation canopy between pre- and post-grazing events planned for ~ 24 hours in a livestock rotation around multiple small paddocks needed for adaptive management may pose a critical challenge for satellite data. This is because clouds and other logistics could hinder the alignment of datasets between space-borne and ground sampling [2,26]. Instead, UAS may provide an understanding of biomass used from pre-grazing and post-grazing events using 3D photogrammetry modelling [16].
In the present study, historical management of the study site, Okehampton, south-eastern Tasmania, Australia, shows that the rangeland has been exposed to poor agricultural practices including overgrazing during periods of low production (i.e., summer and drought), causing loss of native species and increasing bare ground exposure [27,28]. The dominance of sown species, together with historical land degradation of existing pasture species, including Phalaris (Phalaris aquatic) and cocksfoot (Dactylis glomerata) [27] over perennial ryegrass (Lolium perenne), wallaby grass (Austrodanthonia species), kangaroo grass (Themeda triandra), was the rationale to investigate possible sustainable grazing management avenues to recover native species and land degradation and erosion.
Earlier studies suggested that intensively grown pastures through a multi-paddock system can rejuvenate grassland conditions through soil aggregation and porosity and litter conversion, thus enhancing soil and pasture productivity through high stock density [12,29,30]. Therefore, this study introduced multiple paddocks to enable grassland monitoring through high stocking density and intensive grazing management. Consequently, Site one consists of seasonal rotational grazing across small twelve paddocks. The other sites consisted historical degraded grassland mainly dominated by Phalaris and cocksfoot spear grass interspersed by native vegetation.
The aim of this study was to investigate whether remote sensing can enable accurate real-time grazing management, focusing on the integration of UAS and Sentinel-2 imagery for biomass quantification and the impact of different grazing intensities on pasture productivity. To achieve this, we addressed the following objectives:
Objective 1: To assess whether high resolution drone data could improve the accuracy and temporal resolution of biomass estimates derived from Sentinel-2 imagery, particularly in regions prone to cloud cover. The goal was to calibrate drone sward height changes (pre- and post-grazing) from the 3D model into field biomass, and then use this to improve the Sentinel-2 random forest-enabled model, which is susceptible to cloud cover. Grassland biomass was sampled within 24 hours of sheep grazing, with pre-grazing biomass cut data used for calibration. We regressed the change in height from UAS data (captured pre-grazing and post-grazing) against pre-grazing biomass cut data to convert height changes into biomass (kg DM/ha). This UAS-derived biomass data, captured at a 5 mm ground resolution, was then compared with biomass estimates from Sentinel-2 imagery, which utilised random forest-enabled spectral retrieval. Sentinel-2, with its five-day revisit cycle and 10 m spatial resolution, provided complementary monitoring data at the farm level.
Objective 2: To evaluate the effect of different sheep grazing intensities on the productivity and selective grazing of sown species (Phalaris and Cocksfoot). One paddock was used as a business-as-as-usual control, while another paddock included a mixture of sheep and pregnant ewes. We compared the sampled data height data of Phalaris and Cocksfoot species in both paddocks with NDVI values derived from Sentinel-2 imagery to determine the impact of grazing intensity on pasture productivity.
2. Material and Methods
2.1. Study Area and Field Data Collection
The study was conducted on a sheep enterprise near Triabunna, Tasmania, Australia (42°30′ S, 147°59′ E), with an annual rainfall of 648 mm and temperature ranges of 7 °C (minimum) and 17 °C (maximum) [31]. The farm management aimed to maintain native and newly sown perennial vegetation communities by implementing more sustainable grazing practices [27].
Site 1 comprised the Vault and Bougainville paddocks, each divided into six small paddocks of 0.25 ha size (Figure 1). These paddocks featured diverse native and sown ground cover species that were not degraded by past agricultural practices. The pasture species included Cocksfoot, Phalaris, Ryegrass, Tall Fescue (Festuca arundinacea), Strawberry Clover (Trifolium fragiferum), Sub Clover (Trifolium subterraneum), Soft Brome (Bromus hordeaceus), Vulpia (Vulpia bromoides), Thistle (Cirsium) and Flatweed (Hypochaaris radicata). The Vault and Bougainville paddocks underwent 1-day intensive grazing (7 am to 7 pm) with a high stock density of 2000 DSE/ha (DSE= dry sheep equivalent) to improve pasture and soil productivity through trampling effects associated with regenerative grazing (see [12,12]. This high stocking density is assumed to flatten the biomass, stimulate soil microbial and aggregation, and reduce bare ground exposure [12,29,30]. The experiment was conducted from December 2021 to January 2023.
Site 2 included the “Cottage Paddock” (118 ha) and the “Old Bougainville paddock” (80 ha) (Figure 1). During the experiment in spring 2019 (September to November), these paddocks were predominantly composed of sown species with Phalaris (Phalaris aquatic) and Cocksfoot (Dactylis glomerata) being dominant (Figure 2). They also contained fragmented native grasses, including wallaby and kangaroo grass. To restore native species, both Cottage and Old Bougainville paddocks were treated with 2 litre/ha of Glyphosate herbicide and 200 ml/ha of Ecopar herbicide to control weeds, and they were irrigated.
2.1.1. Bougainville and Vault Ground Sampling Protocol
Standing biomass (aboveground biomass) was destructively sampled using five quadrants across each of the twelve paddocks between December 2021 and January 2023. Biomass harvest was performed using a battery-operated shearing handpiece at each 0.5 x 0.5 m quadrant. The average of the five readings was computed as the standing biomass per paddock to minimise sampling error. For each sampling date, only pre-grazing ground sampling was conducted due to one experienced operator available. We scaled up this measurement to the paddock level to conform to the 10 m resolution of Sentinel-2 imagery using Equation 1. The 0.5 x 0.5 m quadrant measurement was compared with 5 mm drone resolution.
For each destructive sampling, a non-destructive visual assessment of the estimated % species contribution to the standing biomass was made. Species assessment was based on ranking within the quadrant of each paddock [32]. The assumption was that the species composition would enhance pasture productivity due to the regenerative grazing management adopted [12].
2.1.2. Cottage and Old Bougainville Ground Sampling Protocol
The two paddocks were stocked with mixed-age Merino ewes. The Cottage paddock was stocked at 700 DSE/ha and opened to adjoining paddocks to enable the sheep to move freely across them. This business-as-usual treatment paddock served as the control. The Old Bougainville paddock was stocked with a mixture of sheep and pregnant ewes at 350 DSE/ha and closed to the adjoining paddocks. Both paddocks were grazed for five days. The height of the dominant Phalaris and Cocksfoot species was randomly measured along the quadrants across both paddocks before and after grazing in October and November 2019. Measurement (in cm) was made using a handheld ruler/sward stick from the ground surface to the tip arch of the grass [17]. The geographic location of the sampling points was recorded.
We observed whether the sheep preferred selective grazing of Phalaris or Cocksfoot species in the two paddocks. Additionally, we examined the treatment effect of pregnant ewes and during the lambing period, considering the increase in DSE and subsequent increase on feed requirements [33,34]. The assumption was that increased DSE would impact grazing intensity and pasture productivity in Old Bougainville paddock, while Cottage paddock, used as a business-as-usual control, would experience moderate grazing due to the adjoining paddock being opened. Using the pasture height measurements, we correlated grazing intensity with satellite data.
To examine rainfall variability in the Cottage and Old Bougainville paddocks, gridded daily rainfall data at a 5 km resolution were obtained from the Australian Government of Bureau Meteorology as archived for November and December 2019 [35]. The daily rainfall data was formatted into a weekly event to correlate with grazing period (5 days), and referenced to pasture performance [12].
2.5. UAS Data and Processing for Bougainville and Vault
Drone flights were undertaken by a DJI Matrice 300 remotely piloted aircraft system with a Zenmuse P1 camera, flying 40 m above ground level, yielding a ground resolution of 5 mm. The UAS is equipped with real-time-kinematics (RTK) for improved georectification. A GNSS survey of ground control point (GCP) tiles (Figure 3a) was completed on 4 January 2022, wherein paddock corners and sample plots (bricks and pins) were surveyed as recommended by James et al. [36]. On 11 January 2022, trial flights were conducted over the Vault plots to test the bricks and control points' visibility while refining data processing quality assurance.
The survey campaign included Site 1 for Bougainville and Vault tiles and paddock corners. These plots were monitored with UAS from each successive flight, with 690 GNSS (RTK) survey points collected. Drone survey marks were sampled along diagonal transects within each grazing paddock (Figure 3, plates c and d); in all cases, transects were positioned at least 10 m from paddock boundaries to avoid edge effects. Smaller tiles (0.1 m x 0.1 m) were installed to identify ground control points where repeated drone measurements were taken. The collected UAS imagery was processed to generate digital elevation models (DEM) and orthophotos.
2.6. Calibration of UAS Pasture Height Changes into Biomass Using Sample Field Biomass
Although post-grazing biomass was not directly measured (as explained in Section 2.1.1), changes in sward height pre- and post-grazing events were monitored using drone campaign. UAS pre-grazing data dates correlated with the destructively sampled biomass for all events. Ground quadrants were located using differential GPS (DGPS), allowing imagery to be overlaid and subsequent extraction of image metrics for comparison with ground surveys. Datasets were georeferenced using GCPs (tiles) at the corner of each trial paddock. UAS imagery was processed with high-performance computing (HPC) infrastructure, resulting in digital elevation models (DEMs) and orthophotos at 5 mm resolution. Using filtering by classes, all trees and artifacts were removed [38].
Pasture height differential pre- and post-grazing was calculated using flights before and after grazing. This delta height was correlated with concurrent measurements of pasture biomass to determine the relationship between delta sward height and biomass. To ensure higher accuracy compared with a previous study [16], average pasture heights were estimated from five quadrants along the same transects. Hence, the pasture height differential was based on averaging five quadrants each of pre- and post-grazing flights.
The sward height changes derived from the 3D models were calibrated using pre-grazing biomass, which was destructively sampled from 0.5 x 0.5 m quadrants (Section 2.1.1). We developed a linear relationship between these changes in sward height and the pre-grazing biomass data. The regression Equation (2) was determined by correlating the height changes with the corresponding pre-grazing biomass measurements:
where is the change in sward height, and a and b are regression coefficients.
The assumption here is that the change in sward height is directly proportional to the change in biomass, which allows us to infer biomass reduction due to regenerative grazing. The linear relationship was used to create biomass maps for the Bougainville and Vault paddocks. To compare the drone biomass data with satellite estimates, zonal statistics were performed to derive the mean biomass for each paddock. This ensured that the drone scale corresponded to the satellite scale. The calibrated UAS-derived biomass data were then used to improve the Sentinel-2 random forest-enabled model (Section 2.7). The association between UAS and the sampled biomass was compared using the following regression statistics R2, root mean square error (RMSE), and median absolute error (MAE).
2.7. Sentinel-2 Data for Modelling Bougainville and Vault Biomass Using Random Forest Algorithm
We downloaded 56 cloud-free Sentinel-2 images that have been corrected for atmospheric and topographic effects from Digital Earth Australia (https://www.dea.ga.gov.au/products/dea-surface-reflectance, accessed on 24 February 2023) for all dates that matched up (i.e., 5 December 2021 to 24 January 2023) with the destructively sampled data. The images were checked for quality assurance. Cloudy pixels were removed using a cloud detection algorithm [39]. The study used ten bands of Sentinel-2, namely, b2, b3, b4, b5, b6, b7, b8, b8A, b11 and b12 to extract their reflectance values.
We created a random forest algorithm from the ten spectral bands of Sentinel-2, which were used as input features. Using 56 datasets, we partitioned into 75% training and 25% test sets. By carefully using parameters to achieve maximum depth without using grid search to reduce model complexity and overfitting, we reached the optimum parameter, n=50. The Model performance was evaluated using the test set and compared with the linear regression of UAS calibrated from the sampled biomass using R2, RMSE and MAE.
2.8. Sentinel-2 Derived NDVI for Cottage and Old Bougainville
Cottage and Old Bougainville paddocks were masked to remove trees and shrubs. We obtained cloud-free Sentinel-2 imagery from Digital Earth Australia [12] for Cottage and Old Bougainville paddocks. Images correspond to the dates of pasture height measurements during the spring season (September to November). We extracted the reflectance value per pixel based on visible bands 2 (blue), 3 (Green), 4 (Red), and 8 (NIR-1) bands. A cloud detection algorithm was applied to remove all pixels affected by clouds [39]. NDVI for all GPS points representing Phalaris and Cocksfoot species height measurements was computed from red and NIR-1 bands. NDVI values were compared to the sampled heights of Phalarisand Cocksfoot using the correlation coefficient R2.
3. Results
3.1. Assessment of Biomass Calibration Using Sward Height Changes and Sentinel-2 Random Forest Models
Our result (Figure 4, Figure 5 and Figure 6) shows that the high-resolution drone data can be calibrated from the field biomass measurement, and at the same time be used to calibrate and validate Sentinel-2 models, thereby, addressing the challenge of cloud contamination and enhancing biomass monitoring capabilities.
The linear modelling of the change in grassland heights for pre- and post-grazing flights of UAS into biomass when calibrated with deststructively sampled data, yielded a strong relationship with a coefficient of determination (R2) of 0.75, RMSE= 1240 kg DM/ha and MAE=980 kg DM/ha (Figure 4). Equation (2) shows the mean biomass computed for each of the twelve paddocks.
The relatively large coefficient (10119 kg DM/ha) indicates that small changes in grass height can lead to significant changes in biomass. It implies a strong response and high sensitivity of biomass to the variations in grass height. It also represents the baseline for the residual biomass for which the post-grazing (i.e., grass height change =0) event is 914 kg DM/ha.
As shown in Figure 5, the evaluation of the random forest modelling using Sentinel-2’s ten bands as the retrieval produced the following regression statistics, R2= 0.56, RMSE=2140 kg DM/ha and MAE=1585 kg DM/ha. Comparing Figure 4 and Figure 5, the modelled biomass from 3D photogrammetry signifcantly outperformed the Sentinel-2 random forest-enabled model (S2-RF). The UAS demonstrated a stronger linear relationship with substantially lower error, highlighting its superiority over the S2-RF model, which exhibited higher error margins.
However, the integration of UAS data, available on demand for pre- and post-grazing events, can enhance the performance of Sentinel-2 imagery, as illustrated in Figure 6. Despite the lower R2 of 0.46 compared to the S2-R2 R2 of 0.56, the UAS model exhibited lower error metrics (RMSE= 1370 kg DM/ha and MAE=1135 kg DM/ha). This indicates that while the S2-RF is better suited to explain the variance in actual biomass, the UAS model tends to make accurate estimates on average biomass. Insights into the larger proportion of the variance in biomass provide a clue to the broader trend and understanding of underlying patterns. This justifies the training of the field biomass input dataset alongside the spectral features using a random forest algorithm. The UAS 3D photogrammetry model is more accurate in predicting biomass from pre- and post-grazing events, even though it may not account for all variations in biomass.
Although Figure 4 and Figure 5 show that both models tend to overestimate biomass, more than half of the calibrated data points from the UAS model show a higher overestimation of biomass relative to the S2-RF model. In contrast, about half of the data points derived from the S2-RF model tend to underestimate biomass. The seasonal plot of the representative paddocks (Figure 7) confirms this pattern of overestimation by the UAS and underestimation by the S2-RF model.
The S2-RF model demonstrates greater accuracy when imagery acquisition is closer to the date of field sampling. For instance, Sentinel-2 imagery acquired on 24 April 2022, compared with sampled biomass on 26 April 2022 in Vault-2 (Figure 7), estimated biomass at 2339 kg DM/ha, closely matching the sampled biomass of 2506 kg DM/ha. On the same date, the UAS modelled biomass estimated a higher value of 3530 kg DM/ha, further illustrating its tendency to overestimate biomass. The performance of UAS data is based on the finer details the spatial resolution can provide (Figure 8).
The non-destructive visual assessment of the estimated % of species shows variability in species composition and biomass productivity across the seasons in all the paddocks (Figure 9). Biomass productivity is influenced by the collective contribution of all species rather than by any single species. While the visual assessment of species by % ranking help to understand the variability of grassland biomass across paddocks, this ranking process is unsuitable for training satellite or drone mapping algorithms.
3.2. Sentinel-2 Derived NDVI for Modelling Grazing Intensity
NDVI responded positively to weekly rainfall and management interventions, such as weeds control in both paddocks, with a peak rainfall observed on October 21, 2019 (Figure 10). This indicates that NDVI can effectively detect changes in vegetation cover resulting from varying environmental factors and grazing intensity treatment. The productivity of Phalaris species in the Cottage paddock was notably higher compared to the Old Bougainville paddock, demonstrating more vigour and recovery from spring grazing (Figure 10).
Despite higher stocking density in the Cottage paddock, selective grazing on Phalaris and Cocksfoot species was not evident, likely due to the paddock being open to adjoining areas, allowing sheep graze more freely. This result in minimal impact from high stocking density on the Cottage paddock. A decrease in NDVI and selective grazing on Cocksfoot was observed compared to Phalaris when sheep was moved to adjoining paddocks. In contrast, the Old Bougainville paddock exhibited selective grazing, particularly on Cocksfoot species, as shown by the reduction in pasture height from 5 cm to 2 cm (Figure 10). The arrival of lambs and subsequent in stocking rate intensified grazing intensity, leading to a decrease in NDVI values on November 4, 2019, indicating potential overgrazing in the paddock.
Weekly rainfall showed a strongly correlation with NDVI changes in the Cottage paddock (R2=0.73) (Figure 11), indicating that rainfall significantly influence pasture productivity, particularly for Phalaris species. However, in the Old Bougainville paddock, the correlation between rainfall and NDVI was weaker (R2=0.27), primarily due to intensity grazing on Cocksfoot species, which did not correspond to the rainfall pattern and NDVI values (Figure 12). The strong correlation between rainfall and NDVI in the Cottage paddock is likely influenced by its topography. The Cottage paddock, situated on flat terrain, experience more uniform water distribution and retention compared to the Bougainville paddock, which is located on a hilltop. The elevation position of Old Bougainville could lead to faster runoff and less water retention, thereby reducing the effectiveness of rainfall on NDVI in this paddock. Our view is that the topographical difference supports the observed variation in the correlation between rainfall and NDVI in the two paddocks.
4. Discussion
4.1. Grassland Biomass Modelling from a Change in Grass Heights Using 3D Photogrammetry and Sentinel-2 imagery with Random Forest Algorithm
Results presented in this study demonstrate the capability of remote sensing from Sentinel-2 and UAS imagery for adaptive real-time management of grasslands. This contributes to conservation, improved utilisation, and potentially sustainable management at the farm level [5,12,17,40]. We combined the strengths of imagery from both satellite and UAS instruments to quantify grassland biomass; this combination yielded a more robust result than the application of either method alone. We applied cell grazing approaches in the field, where very high livestock stocking densities were used to flatten pasture biomass, with the aim of improving grassland productivity [12,41] and carbon and nutrient recycling [30,42], before moving sheep to the adjacent paddock in rotational grazing management. However, monitoring singular, intense grazing regimes with the five-day revisit of Sentinel-2 imagery is challenging, particularly when frequent cloud cover obscures the time between clear satellite imagery [2,43]. Even in places with fewer clouds, grassland growth responds dynamically to environmental variables (particularly rainfall and nutrient addition) [44,45], suggesting that Sentinel-2 with 5-day pass rates may be too sparse [26]. To determine whether more timely monitoring would close this gap, we used higher-resolution UAS data to calibrate and validate Sentinel-2 models, thereby, addressing the challenge of cloud contamination and enhancing biomass monitoring capabilities.
The calibration of UAS biomass using field measurements from sward height changes through 3D photogrammetry, and the validation of Sentinel-2, produced stronger regression metrics (R2= 0.75, RMSE= 1240 kg DM/ha and MAE=980 kg DM/ha) (Figure 4) and (RMSE= 1370 kg DM/ha and MAE=1135 kg DM/ha) compared to using Sentinel-2 random forest-enabled model alone, (R2= 0.56, RMSE=2140 kg DM/ha and MAE=1585 kg DM/ha). However, a concern lies in the lower of R2 0.46 when UAS was used with Sentinel-2 compared to an of R2 0.56 when used alone. This analysis shows that a moderate spatial resolution of multispectral satellites like Sentinel-2 imagery provide more insightful information about biomass variation, including broader trends and underlying patterns using machine learning, than UAS photogrammetry alone. This suggests that factors such as field heterogeneity and seasonal and environmental variables contribute to biomass variability, which the resolution and scale of UAS cameras alone may not capture [2,16]. This phenonmenon is particularly evident when Sentinel-2 imagery aligns with the temporal window of the grazing event. For instance, Sentinel-2 imagery on 24 April 2022, compared with sampled biomass on 26 April 2022, in Vault-2 (Figure 7), estimated biomass at 2339 kg DM/ha, closely matching the sampled biomass of 2506 kg DM/ha. On the same date, the UAS modelled biomass estimated a higher value of 3530 kg DM/ha. The only known study that used similar approaches (changes in sward heights to estimate biomass) with a UAS spatial resolution of 10 mm obatianed an R2 of 0.78 when compared with the traditional method. Therefore, the utility of UAS photogrammetry models with satellites like Sentinel-2 represent a balance of trade-offs in remote monitoring and management of agricultural sustainability [2].
The current study faced limitations in capturing post-grazing events due to logistical challenges inherent in the traditional field sampling method. In contrast, the drone campaigns considered pre- and post-grazing data, and the Sentinel-2 method helped determine the implications of any given grazing event for biomass availability, including biomass trampled through high stocking density, and left standing, and utilised in relation to livestock productivity [2,41,46,47]. The feed utilisation in regenerative grazing provides a generic application to livestock grazing and land management beyond the scope of one day as presented in this study. Ideally, feed utilisation represents feed intake by the livestock through pre- and post-grazing. Our approach considers feed utilisation by subtracting trampled (flattened) biomass after grazing from the standing biomass before grazing [12]. This process ensures liveweight gain and animal welfare through efficient feed intake, while promoting environmental stewardship by pushing unconsumed biomass down to the soil through high stocking density. This practice facilitates carbon storage, soil microbial stimulation and aggregation and bare-ground prevention [12,30,48].
4.2. Modelling Grazing Intensity and Ground Cover Productivity Using Sentinel-2 derived NDVI
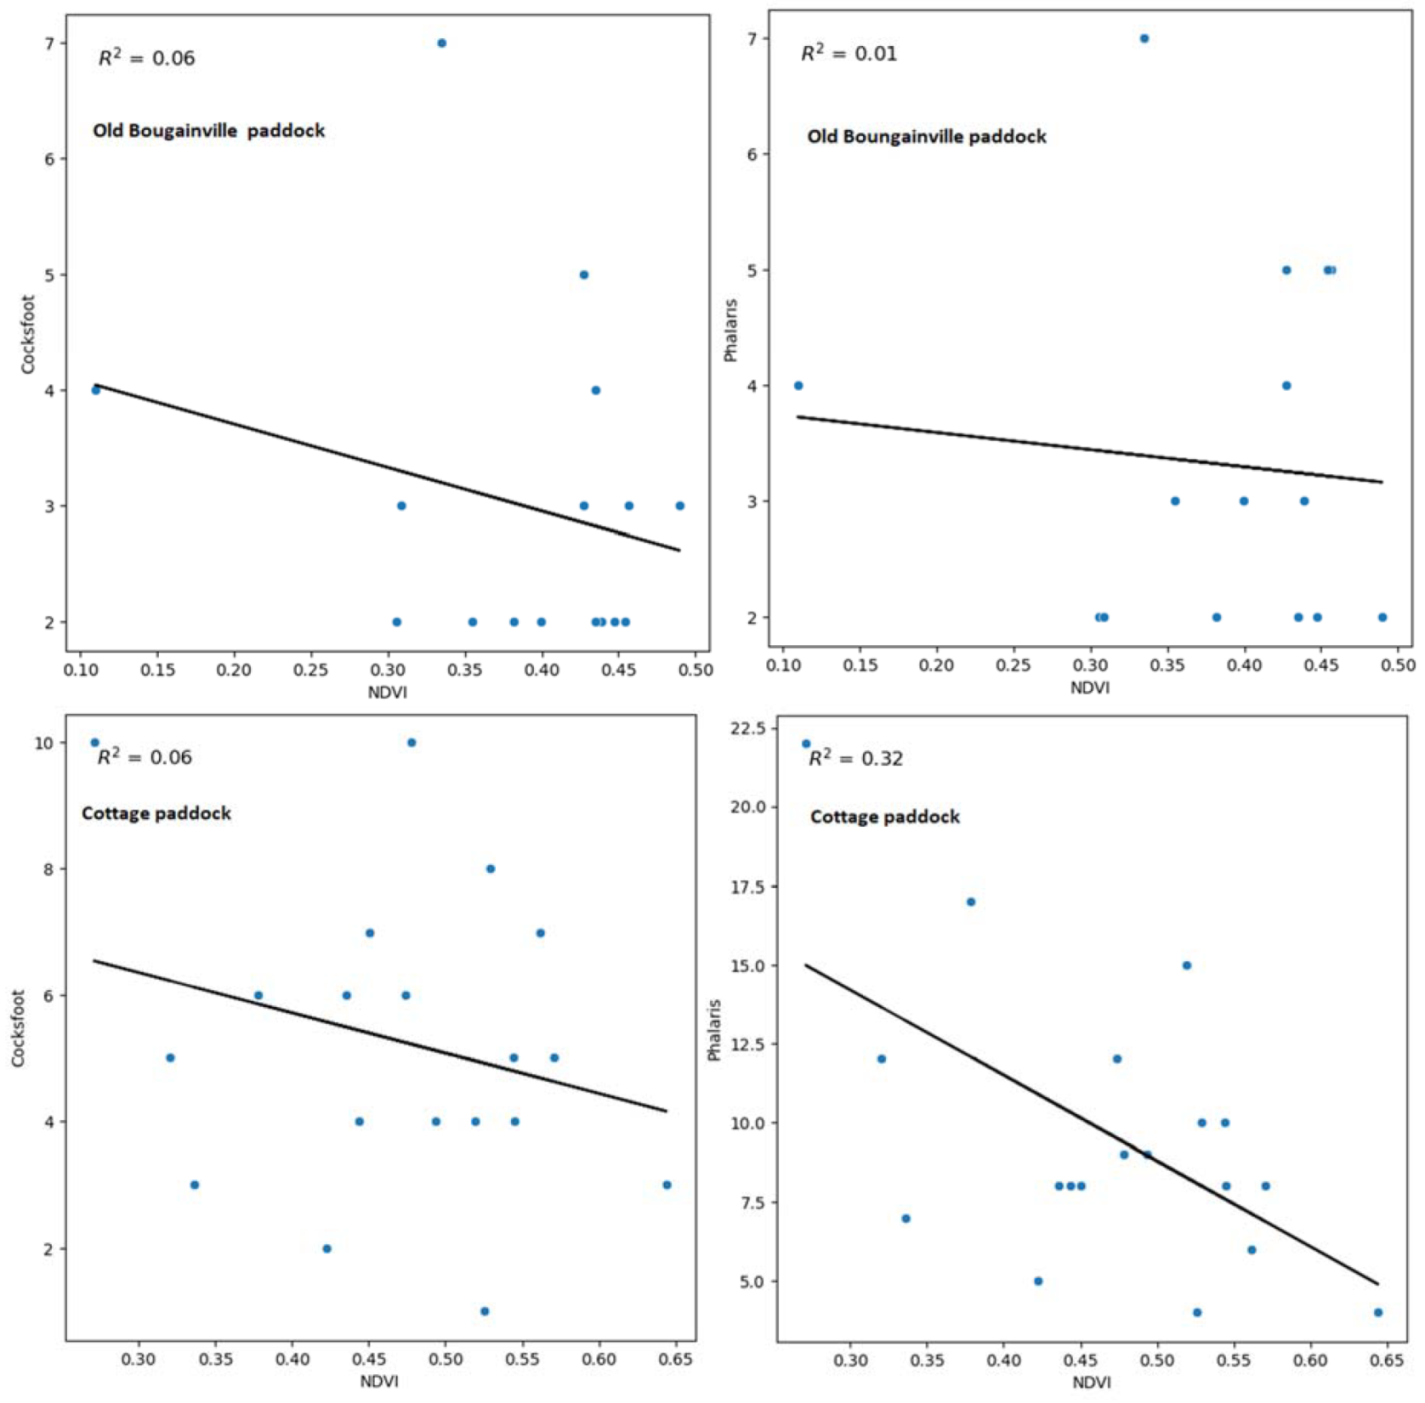
In this study, we demonstrate that NDVI effectively detects vegetation dynamics and variability due to different grazing management practices in two paddocks “Cottage and Old Bougainville” on the same farm experiencing similar environmental conditions. Different grazing intensity strategies were applied to promote uniform or non-selective grazing, preventing the dominance of either Phalaris or Cocksfoot, while also stimulating native species. Known grazing management techniques, such as grazing down during late spring or summer (October to December) to manage soil fertility decline and weed encroachment [49,50,51], were employed with varying stocking densities. Based on the optimal season for lambing [52,53], the stocking density was increased in the Old Bougainville paddock to intensify grazing, while the Cottage paddock was left open to the adjoining areas as a business-as-usual control. Selective grazing was observed on Phalaris species in the Old Bougainville paddock. In contrast, the low pasture cover species (Phalaris and Cocksfoot) in the Cottage as seen in Figure 10, caused livestock to move to adjoining paddocks with more abundant pasture cover [28]. NDVI did not correlate well with Phalaris and Cocksfoot species in the two paddocks, likely due to ground cover variability (mix of bare ground and vegetation), or the presence of more dominant pasture species within the GPS quadrant location. We found that NDVI correlated more closely with the productivity of grassland (multi-species) within each quadrant than with individual species (Figure 10).
Pasture productivity correlates with rainfall weekly data, as seen in Figure 11. NDVI correlation produced an R2 of 0.73 for the Cottage paddock and an R2 of 0.27 for the Old Bougainville paddock, indicating the productivity of ground cover as a contribution of collective pasture species (i.e. canopy cover). The higher correlation in the Cottage paddock compared to Old Bougainville is due to the influence of topographical characteristics [54]. Situated on flat terrain, the Cottage paddock, benefitted from more uniform water distribution and retention, which enhanced the effectiveness of rainfall on pasture growth [54]. Thus, NDVI has proven to be an effective model for monitoring the health of vegetation cover to support animal behaviour and grazing management [55,56,57]. Including vegetation indices such as enhanced vegetation index (EVI) and soil adjusted vegetation index (SAVI) has highlighted ways to enhanced NDVI’s effectiveness in sparse vegetation [2]. We speculate that this relationship could be further improved by linking biophysical models of plant production that account for climate (temperature, rainfall, solar radiation), soil conditions and management, particularly if integrated with livestock grazing behaviours [58,59,60].
5. Conclusions
This study aimed to utilise remote sensing technology to improve the real-time adaptive management of grasslands. By measuring feed intake through changes in grass heights from UAS data over one day of pre- and post-grazing events, we model grassland biomass, calibrating this data with traditionally obtained method. We also employed a multispectral (Sentinel-2) dataset using a random forest-enabled model to quantify biomass.
Integrating high-resolution (5 mm) drone model with Sentinel-2 satellite data, which is known to be susceptible to cloud contamination, improved the latter’s accuracy and reduced uncertainty. However, the newly improved Sentinel-2 biomass model still faced challenges in detecting biomass variance due to the limitation of 3D photogrammetry. The Sentinel-2 random forest-enabled model is better suited to detect biomass variations by training on neighbouring pixels, providing insights into information about the broader trend and understanding of underlying patterns. We conclude that incorporating both technologies will provide more timely and precise data, enhancing pasture management and agricultural sustainability at the agronomic level.
The visual ranking of pasture species within each quadrant only provided qualitative information about pasture productivity within each paddock and could not be integrated into the drone or Sentinel-2 systems. Future studies should consider methods that provide quantitative training data for mapping. Upscaling the 3D photogrammetry into hyperspectral imaging can enhance mapping efficiency through spectral analysis, offering better accuracy and understanding of underlying variability.
Author Contributions
Conceptualization, Methodology, Formal Analysis, Investigation, Writing-Original Draft Preparation, Review and Visualisation, M.G.O.; UAS flight campaign and processing, D.T.; Conceptualisation, Review and Editing, M.T.H.; Review and Editing.; A.M.F.; Review and Editing, C.M.; and Resources, J.W. All authors have read and agreed to the published version of the manuscript.
Funding
This work was funded from the Australian Government’s Future Drought Fund and the University of Tasmania (Project Number 4-G37I1PA).
Acknowledgment
The authors acknowledge project delivery and infrastructure from the Cape Herbert Pty Ltd, Australia. Special acknowledgment to Peter Ball, who collected the measured data and made it available.
Conflict of Interest
The authors declare no conflict of interest.
References
- Luscier, J.D.; Thompson, W.L.; Wilson, J.M.; Gorham, B.E.; Dragut, L.D. Using digital photographs and object-based image analysis to estimate percent ground cover in vegetation plots. Front. Ecol. Environ. 2006, 4, 408–413. [Google Scholar] [CrossRef]
- Ogungbuyi, M.G.; Mohammed, C.; Ara, I.; Fischer, A.M.; Harrison, M.T. Advancing Skyborne Technologies and High-Resolution Satellites for Pasture Monitoring and Improved Management: A Review. Remote Sens. 2023, 15. [Google Scholar] [CrossRef]
- Harrison, M.T.; Cullen, B.R.; Mayberry, D.E.; Cowie, A.L.; Bilotto, F.; Badgery, W.B.; Liu, K.; Davison, T.; Christie, K.M.; Muleke, A.; et al. Carbon myopia: The urgent need for integrated social, economic and environmental action in the livestock sector. Glob. Chang. Biol. 2021, 27, 5726–5761. [Google Scholar] [CrossRef]
- Meier, E.A.; Thorburn, P.J.; Bell, L.W.; Harrison, M.T.; Biggs, J.S. Greenhouse Gas Emissions From Cropping and Grazed Pastures Are Similar: A Simulation Analysis in Australia. Front. Sustain. Food Syst. 2020, 3. [Google Scholar] [CrossRef]
- Gillan, J.K.; Karl, J.W.; Duniway, M.; Elaksher, A. Modeling vegetation heights from high resolution stereo aerial photography: An application for broad-scale rangeland monitoring. J. Environ. Manage. 2014, 144, 226–235. [Google Scholar] [CrossRef] [PubMed]
- Cunliffe, A.M.; Brazier, R.E.; Anderson, K. Ultra-fine grain landscape-scale quantification of dryland vegetation structure with drone-acquired structure-from-motion photogrammetry. Remote Sens. Environ. 2016, 183, 129–143. [Google Scholar] [CrossRef]
- Harrison, M.T. Climate change benefits negated by extreme heat. Nat. Food 2021, 2, 855–856. [Google Scholar] [CrossRef]
- Fleming, A.; O’Grady, A.P.; Stitzlein, C.; Ogilvy, S.; Mendham, D.; Harrison, M.T. Improving acceptance of natural capital accounting in land use decision making: Barriers and opportunities. Ecol. Econ. 2022, 200, 107510. [Google Scholar] [CrossRef]
- Chang-Fung-Martel, J.; Harrison, M.T.; Brown, J.N.; Rawnsley, R.; Smith, A.P.; Meinke, H. Negative relationship between dry matter intake and the temperature-humidity index with increasing heat stress in cattle: a global meta-analysis. Int. J. Biometeorol. 2021, 65, 2099–2109. [Google Scholar] [CrossRef]
- Wei, C.; Guo, Z.Y.; Wu, J.P.; Ye, S.F. Constructing an assessment indices system to analyze integrated regional carrying capacity in the coastal zones - A case in Nantong. Ocean Coast. Manag. 2014, 93, 51–59. [Google Scholar] [CrossRef]
- Bell, L.W.; Harrison, M.T.; Kirkegaard, J.A. Dual-purpose cropping – capitalising on potential grain crop grazing to enhance mixed-farming profitability. Crop Pasture Sci. 2015, 66. [Google Scholar] [CrossRef]
- Ogungbuyi, M.G.; Guerschman, J.P.; Fischer, A.M.; Crabbe, R.A.; Mohammed, C.; Scarth, P.; Tickle, P.; Whitehead, J.; Harrison, M.T. Enabling Regenerative Agriculture Using Remote Sensing and Machine Learning. Land 2023, 12. [Google Scholar] [CrossRef]
- Shahpari, S.; Allison, J.; Harrison, M.T.; Stanley, R. An Integrated Economic, Environmental and Social Approach to Agricultural Land-Use Planning. Land 2021, 10. [Google Scholar] [CrossRef]
- Bai, Z.G.; Dent, D.L.; Olsson, L.; Schaepman, M.E. Global Assessment of Land Degradation and Improvement 1 . Identification by remote sensing; Wageningen. 2008. [Google Scholar]
- Zhang, C.; Kovacs, J.M. The application of small unmanned aerial systems for precision agriculture: a review. Precis. Agric. 2012, 13, 693–712. [Google Scholar] [CrossRef]
- Gillan, J.K.; McClaran, M.P.; Swetnam, T.L.; Heilman, P. Estimating forage utilization with drone-based photogrammetric point clouds. Rangel. Ecol. Manag. 2019, 72, 575–585. [Google Scholar] [CrossRef]
- Gillan, J.K.; Karl, J.W.; van Leeuwen, W.J.D. Integrating drone imagery with existing rangeland monitoring programs. Environ. Monit. Assess. 2020, 192. [Google Scholar] [CrossRef] [PubMed]
- Zlinszky, A.; Schroiff, A.; Kania, A.; Deák, B.; Mücke, W.; Vári, Á.; Székely, B.; Pfeifer, N. Categorizing grassland vegetation with full-waveform airborne laser scanning: A feasibility study for detecting natura 2000 habitat types. Remote Sens. 2014, 6, 8056–8087. [Google Scholar] [CrossRef]
- Madsen, B.; Treier, U.A.; Zlinszky, A.; Lucieer, A.; Normand, S. Detecting shrub encroachment in seminatural grasslands using UAS LiDAR. Ecol. Evol. 2020, 10, 4876–4902. [Google Scholar] [CrossRef]
- Jensen, J.L.R.; Mathews, A.J. Assessment of Image-Based Point Cloud Products to Generate a Bare Earth Surface and Estimate Canopy Heights in a Woodland Ecosystem. Remote Sens. 2016, 8. [Google Scholar] [CrossRef]
- Olsoy, P.J.; Shipley, L.A.; Rachlow, J.L.; Forbey, J.S.; Glenn, N.F.; Burgess, M.A.; Thornton, D.H. Unmanned aerial systems measure structural habitat features for wildlife across multiple scales. Methods Ecol. Evol. 2018, 9, 594–604. [Google Scholar] [CrossRef]
- Swetnam, T.L.; Gillan, J.K.; Sankey, T.T.; McClaran, M.P.; Nichols, M.H.; Heilman, P.; McVay, J. Considerations for Achieving Cross-Platform Point Cloud Data Fusion across Different Dryland Ecosystem Structural States. Front. Plant Sci. 2018, 8. [Google Scholar] [CrossRef] [PubMed]
- De Rosa, D.; Basso, B.; Fasiolo, M.; Friedl, J.; Fulkerson, B.; Grace, P.R.; Rowlings, D.W. Predicting pasture biomass using a statistical model and machine learning algorithm implemented with remotely sensed imagery. Comput. Electron. Agric. 2021, 180. [Google Scholar] [CrossRef]
- Li, F.; Zhao, Y.; Zheng, J.; Luo, J.; Zhang, X. Monitoring grazing intensity: An experiment with canopy spectra applied to satellite remote sensing. J. Appl. Remote Sens. 2016, 10. [Google Scholar] [CrossRef]
- Alvarez-Hess, P.S.; Thomson, A.L.; Karunaratne, S.B.; Douglas, M.L.; Wright, M.M.; Heard, J.W.; Jacobs, J.L.; Morse-McNabb, E.M.; Wales, W.J.; Auldist, M.J. Using multispectral data from an unmanned aerial system to estimate pasture depletion during grazing. Anim. Feed Sci. Technol. 2021, 275, 114880. [Google Scholar] [CrossRef]
- Chen, Y.; Guerschman, J.; Shendryk, Y.; Henry, D.; Harrison, M.T. Estimating pasture biomass using sentinel-2 imagery and machine learning. Remote Sens. 2021, 13, 1–20. [Google Scholar] [CrossRef]
- Macquarie Franklin Okehampton-optimising management of production and biodiversity assets, Devonport TAS. 2019.
- Ara, I.; Harrison, M.T.; Whitehead, J.; Waldner, F.; Bridle, K.; Gilfedder, L.; Marques Da Silva, J.; Marques, F.; Rawnsley, R. Modelling seasonal pasture growth and botanical composition at the paddock scale with satellite imagery. In Silico Plants 2021, 3, 1–15. [Google Scholar] [CrossRef]
- Teague, R.; Barnes, M. Grazing management that regenerates ecosystem function and grazingland livelihoods. African J. Range \& Forage Sci. 2017, 34, 77–86. [Google Scholar] [CrossRef]
- Teague, R.; Kreuter, U. Managing Grazing to Restore Soil Health, Ecosystem Function, and Ecosystem Services. Front. Sustain. Food Syst. 2020, 4. [Google Scholar] [CrossRef]
- Bureau of Meteorology Climate statistics for Australian locations. Available online: http://www.bom.gov.au/climate/averages/tables/cw_092027.shtml (accessed on Oct 25, 2022).
- Whalley, R.D.B.; Hardy, M.B. Measuring botanical composition of grasslands. In Field and laboratory methods for grassland and animal production research; CABI Publishing Wallingford UK, 2000; pp. 67–102.
- White, D.H.; Bowman, P.J. Dry sheep equivalents for comparing different classes of stock. Paper 1981. [Google Scholar]
- Young, J.M.; Thompson, A.N.; Curnow, M.; Oldham, C.M. Whole-farm profit and the optimum maternal liveweight profile of Merino ewe flocks lambing in winter and spring are influenced by the effects of ewe nutrition on the progeny’s survival and lifetime wool production. Anim. Prod. Sci. 2011, 51, 821–833. [Google Scholar] [CrossRef]
- Jones, D.A.; Wang, W.; Fawcett, R. High-quality spatial climate data-sets for Australia. Aust. Meteorol. Oceanogr. J. 58 2009, 58, 233–248. [Google Scholar] [CrossRef]
- James, M.R.; Robson, S.; d’Oleire-Oltmanns, S.; Niethammer, U. Optimising UAV topographic surveys processed with structure-from-motion: Ground control quality, quantity and bundle adjustment. Geomorphology 2017, 280, 51–66. [Google Scholar] [CrossRef]
- Harrison, M.T. Whitehead, J. Ogungbuyi, M.G. Ball, P. Guerschman, J, P. Tickle, P. Leverton, C. Turner, D. Operationalising satellite and drone imagery to improve decision-making: a case study with regenerative grazing 2023, 218.
- Gillan, J.K.; Karl, J.W.; Elaksher, A.; Duniway, M.C. Fine-resolution repeat topographic surveying of dryland landscapes using UAS-based structure-from-motion photogrammetry: Assessing accuracy and precision against traditional ground-based erosion measurements. Remote Sens. 2017, 9. [Google Scholar] [CrossRef]
- Foga, S.C.; Scaramuzza, P.; Guo, S.; Zhu, Z.; Dilley, R.; Beckmann, T.; Schmidt, G.L.; Dwyer, J.L.; Hughes, M.J.; Laue, B. Cloud detection algorithm comparison and validation for operational Landsat data products. Remote Sens. Environ. 2017, 194, 379–390. [Google Scholar] [CrossRef]
- Langworthy, A.D.; Rawnsley, R.P.; Freeman, M.J.; Pembleton, K.G.; Corkrey, R.; Harrison, M.T.; Lane, P.A.; Henry, D.A. Potential of summer-active temperate (C3) perennial forages to mitigate the detrimental effects of supraoptimal temperatures on summer home-grown feed production in south-eastern Australian dairying regions. Crop Pasture Sci. 2018, 69, 808–820. [Google Scholar] [CrossRef]
- Harrison, M.T.; Christie, K.M.; Rawnsley, R.P.; Eckard, R.J. Modelling pasture management and livestock genotype interventions to improve whole-farm productivity and reduce greenhouse gas emissions intensities. Anim. Prod. Sci. 2014, 54, 2018–2028. [Google Scholar] [CrossRef]
- Díaz de Otálora, X.; Epelde, L.; Arranz, J.; Garbisu, C.; Ruiz, R.; Mandaluniz, N. Regenerative rotational grazing management of dairy sheep increases springtime grass production and topsoil carbon storage. Ecol. Indic. 2021, 125, 107484. [Google Scholar] [CrossRef]
- Punalekar, S.M.; Verhoef, A.; Quaife, T.L.; Humphries, D.; Bermingham, L.; Reynolds, C.K. Application of Sentinel-2A data for pasture biomass monitoring using a physically based radiative transfer model. Remote Sens. Environ. 2018, 218, 207–220. [Google Scholar] [CrossRef]
- Phelan, D.C.; Harrison, M.T.; Kemmerer, E.P.; Parsons, D. Management opportunities for boosting productivity of cool-temperate dairy farms under climate change. Agric. Syst. 2015, 138, 46–54. [Google Scholar] [CrossRef]
- Rawnsley, R.P.; Smith, A.P.; Christie, K.M.; Harrison, M.T.; Eckard, R.J. Current and future direction of nitrogen fertiliser use in Australian grazing systems. Crop Pasture Sci. 2019, 70, 1034–1043. [Google Scholar] [CrossRef]
- Ibrahim, A.; Harrison, M.T.; Meinke, H.; Zhou, M. Examining the yield potential of barley near-isogenic lines using a genotype by environment by management analysis. Eur. J. Agron. 2019, 105, 41–51. [Google Scholar] [CrossRef]
- Taylor, C.A.; Harrison, M.T.; Telfer, M.; Eckard, R. Modelled greenhouse gas emissions from beef cattle grazing irrigated leucaena in northern Australia. Anim. Prod. Sci. 2016, 56, 594–604. [Google Scholar] [CrossRef]
- Henry, B.; Dalal, R.; Harrison, M.T.; Keating, B. Creating frameworks to foster soil carbon sequestration. 2022.
- Dorrough, J.; Ash, J.; McIntyre, S. Plant responses to livestock grazing frequency in an Australian temperate grassland. Ecography (Cop.). 2004, 27, 798–810. [Google Scholar] [CrossRef]
- Akhmadov, K.M.; Breckle, S.W.; Breckle, U. Effects of grazing on biodiversity, productivity, and soil erosion of alpine pastures in Tajik Mountains. In Land use change and mountain biodiversity; CRC Press, 2006; pp. 239–248.
- Blackburn, W.H. Impacts of grazing intensity and specialized grazing systems on watershed characteristics and responses. In Developing strategies for rangeland management; CRC Press, 2021; pp. 927–984.
- Allworth, M.B.; Wrigley, H.A.; Cowling, A. Fetal and lamb losses from pregnancy scanning to lamb marking in commercial sheep flocks in southern New South Wales. Anim. Prod. Sci. 2016, 57, 2060–2065. [Google Scholar] [CrossRef]
- Hopkins, D.L.; Gilbert, K.D.; Saunders, K.L. The performance of short scrotum and wether lambs born in winter or spring and run at pasture in Northern Tasmania. Aust. J. Exp. Agric. 1990, 30, 165–170. [Google Scholar] [CrossRef]
- Kumhálová, J.; Kumhála, F.; Kroulík, M.; Matějková, Š. The impact of topography on soil properties and yield and the effects of weather conditions. Precis. Agric. 2011, 12, 813–830. [Google Scholar] [CrossRef]
- Hill, M.J.; Donald, G.E.; Hyder, M.W.; Smith, R.C.G. Estimation of pasture growth rate in the south west of Western Australia from AVHRR NDVI and climate data. Remote Sens. Environ. 2004, 93, 528–545. [Google Scholar] [CrossRef]
- Weber, D.; Schaepman-Strub, G.; Ecker, K. Predicting habitat quality of protected dry grasslands using Landsat NDVI phenology. Ecol. Indic. 2018, 91, 447–460. [Google Scholar] [CrossRef]
- Ara, I.; Turner, L.; Harrison, M.T.; Monjardino, M.; deVoil, P.; Rodriguez, D. Application, adoption and opportunities for improving decision support systems in irrigated agriculture: A review. Agric. Water Manag. 2021, 257, 107161. [Google Scholar] [CrossRef]
- Bilotto, F.; Harrison, M.T.; Migliorati, M.D.A.; Christie, K.M.; Rowlings, D.W.; Grace, P.R.; Smith, A.P.; Rawnsley, R.P.; Thorburn, P.J.; Eckard, R.J. Can seasonal soil N mineralisation trends be leveraged to enhance pasture growth? Sci. Total Environ. 2021, 772, 145031. [Google Scholar] [CrossRef]
- Ho, C.K.M.; Jackson, T.; Harrison, M.T.; Eckard, R.J. Increasing ewe genetic fecundity improves whole-farm production and reduces greenhouse gas emissions intensities: 2. Economic performance. Anim. Prod. Sci. 2014, 54, 1248–1253. [Google Scholar] [CrossRef]
- Phelan, D.C.; Harrison, M.T.; McLean, G.; Cox, H.; Pembleton, K.G.; Dean, G.J.; Parsons, D.; do Amaral Richter, M.E.; Pengilley, G.; Hinton, S.J.; et al. Advancing a farmer decision support tool for agronomic decisions on rainfed and irrigated wheat cropping in Tasmania. Agric. Syst. 2018, 167, 113–124. [Google Scholar] [CrossRef]
Figure 1.
Location of commercial sheep farm “Okehampton” (42°30′ S, 147°59′ E) near Triabunna, southeastern Tasmania, Australia. The yellow panel represents Site 1 (12 paddocks each of 0.25 ha), the red panel represents Cottage paddock, and the blue panel represents Old Bougainville (located on hilltop). The red dots in the panels represent the sampling points. Study site was mapped using 2020/21 global land cover from the European Space Agency (ESA), developed and validated with 10 m resolution of Sentinel-2 and Sentinel-1 (https://doi.org/10.5281/zenodo.5571936).
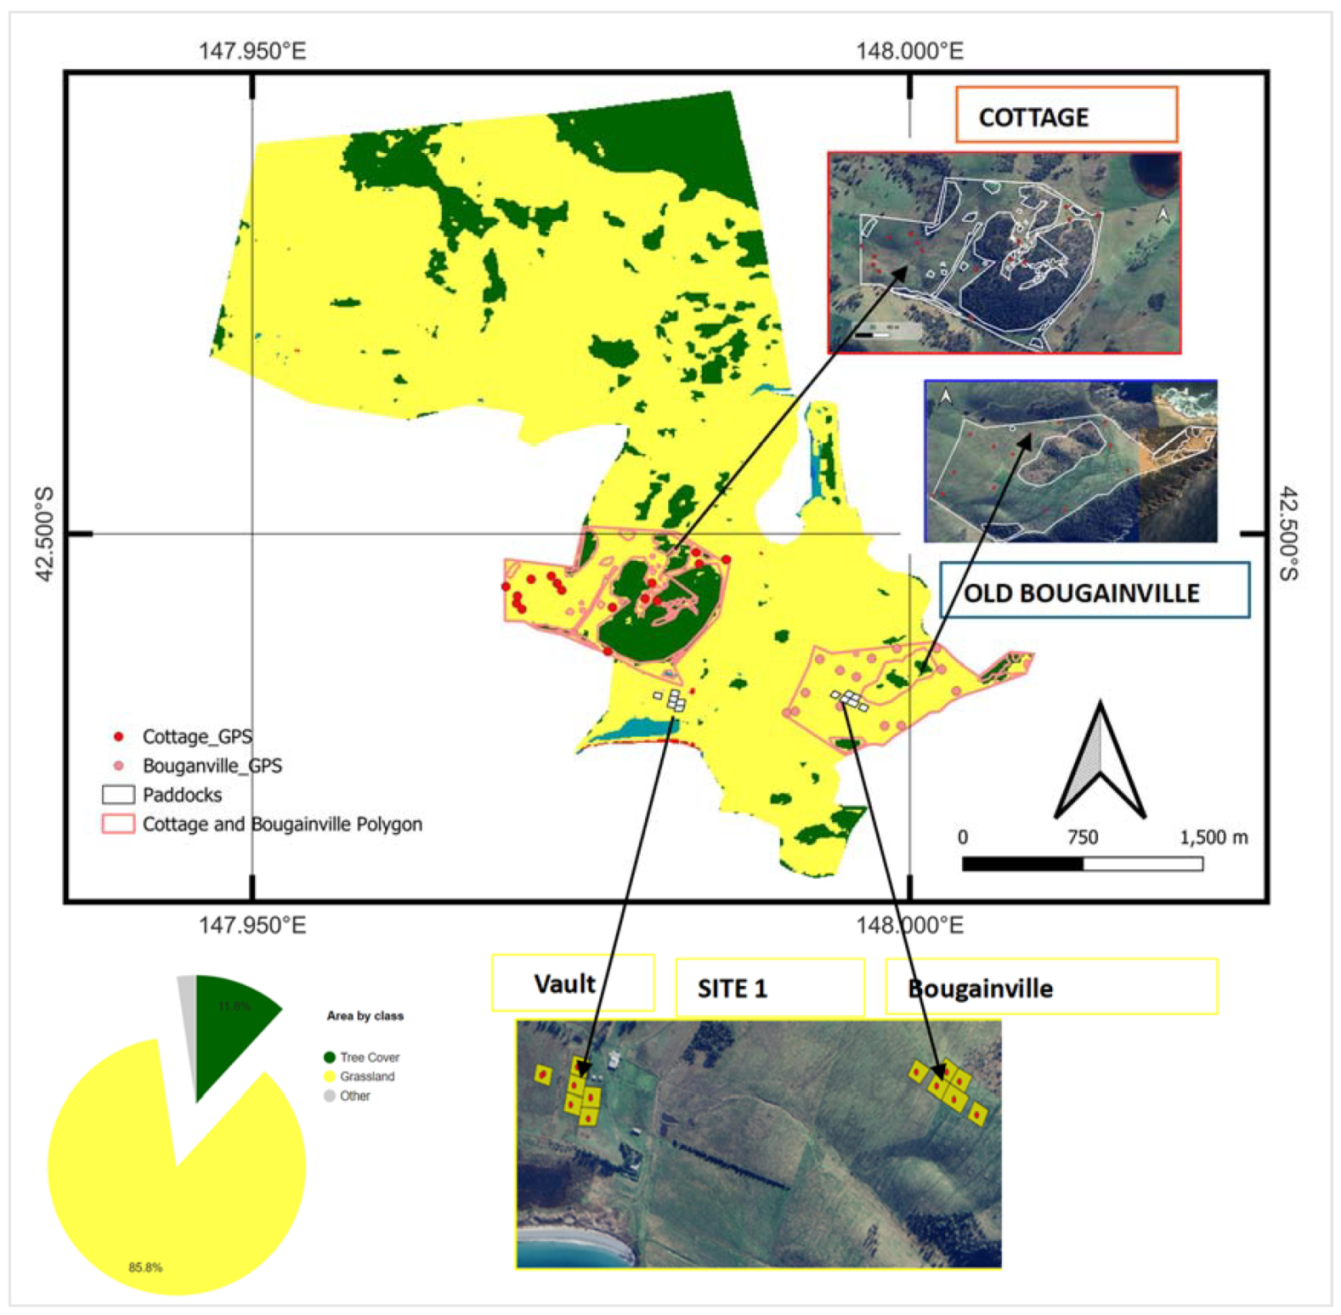
Figure 2.
Representative ground cover conditions for Cottage and Old Bougainville at Okehampton, Triabunna, Australia, as of January 2019. (a) The typical ground cover of Phalaris shows a high proportion of bare ground and flatweed (Hypochaeris radicata), (b) sheep track beside the heavily browsed ground from historical management. (c) Significant flatweed in Phalaris “tongues” and (d) Healthy Phalaris.
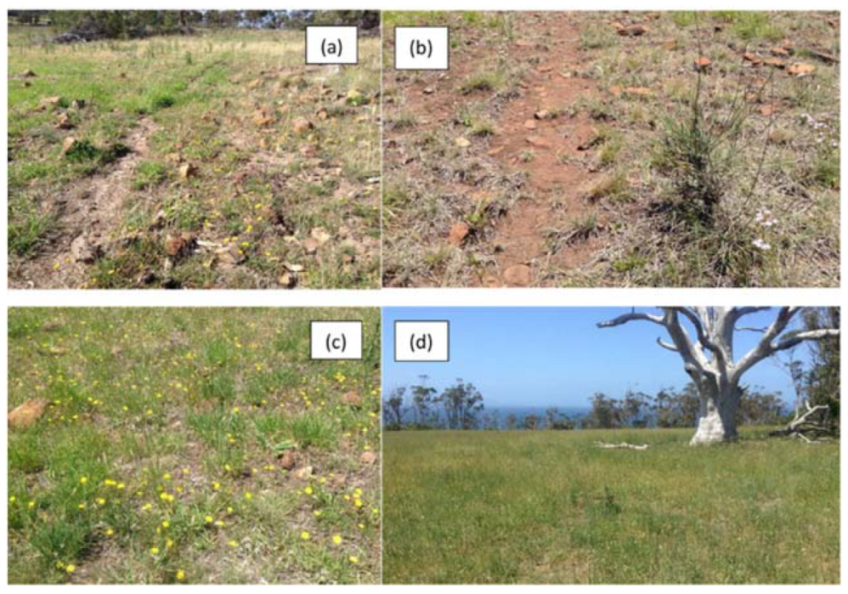
Figure 3.
UAS campaign with survey protocol installations to compare UAS grass height measurements and destructively sampled biomass at the Okehampton farm, Triabunna, Tasmania, Australia. (a) ground control point at the boundary of Vault paddocks, (b) bricks and pins installation to identify the ground control points, (c) and (d) the diagonal transects along each paddock where sampled biomass data was collected, and (e) example of 3D point cloud photo of one of the processed UAS images captured for a pre-grazing event at Okehampton sheep grazing farm, Triabunna (photo taken in the pre-trial flight on 2 December 2021). Images b, d and e were taken from [37].
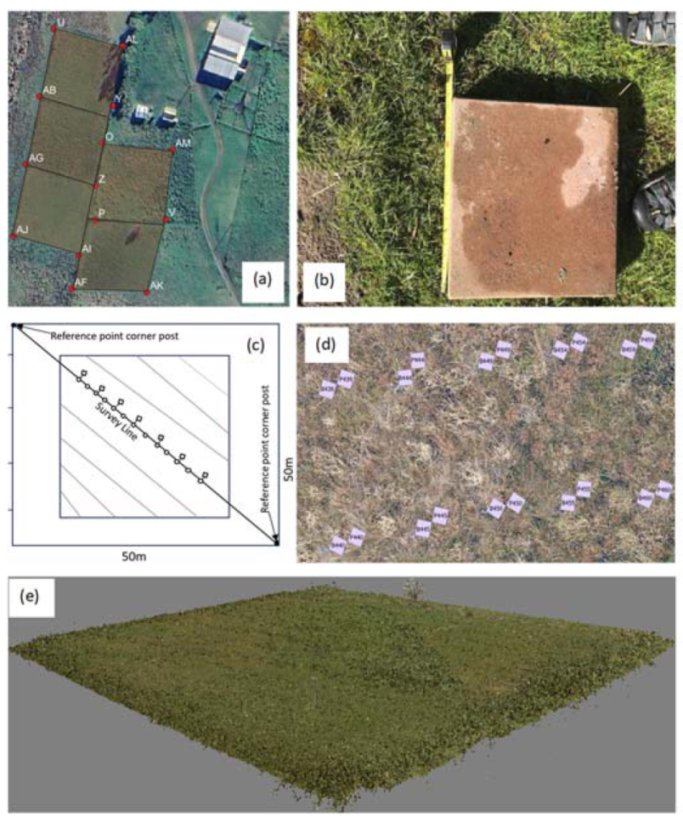
Figure 4.
A linear relationship between the mean grass height from UAS and actual sampled biomass. The relationship modelled change in grass heights into biomass for pre- and post-grazing.
Figure 4.
A linear relationship between the mean grass height from UAS and actual sampled biomass. The relationship modelled change in grass heights into biomass for pre- and post-grazing.
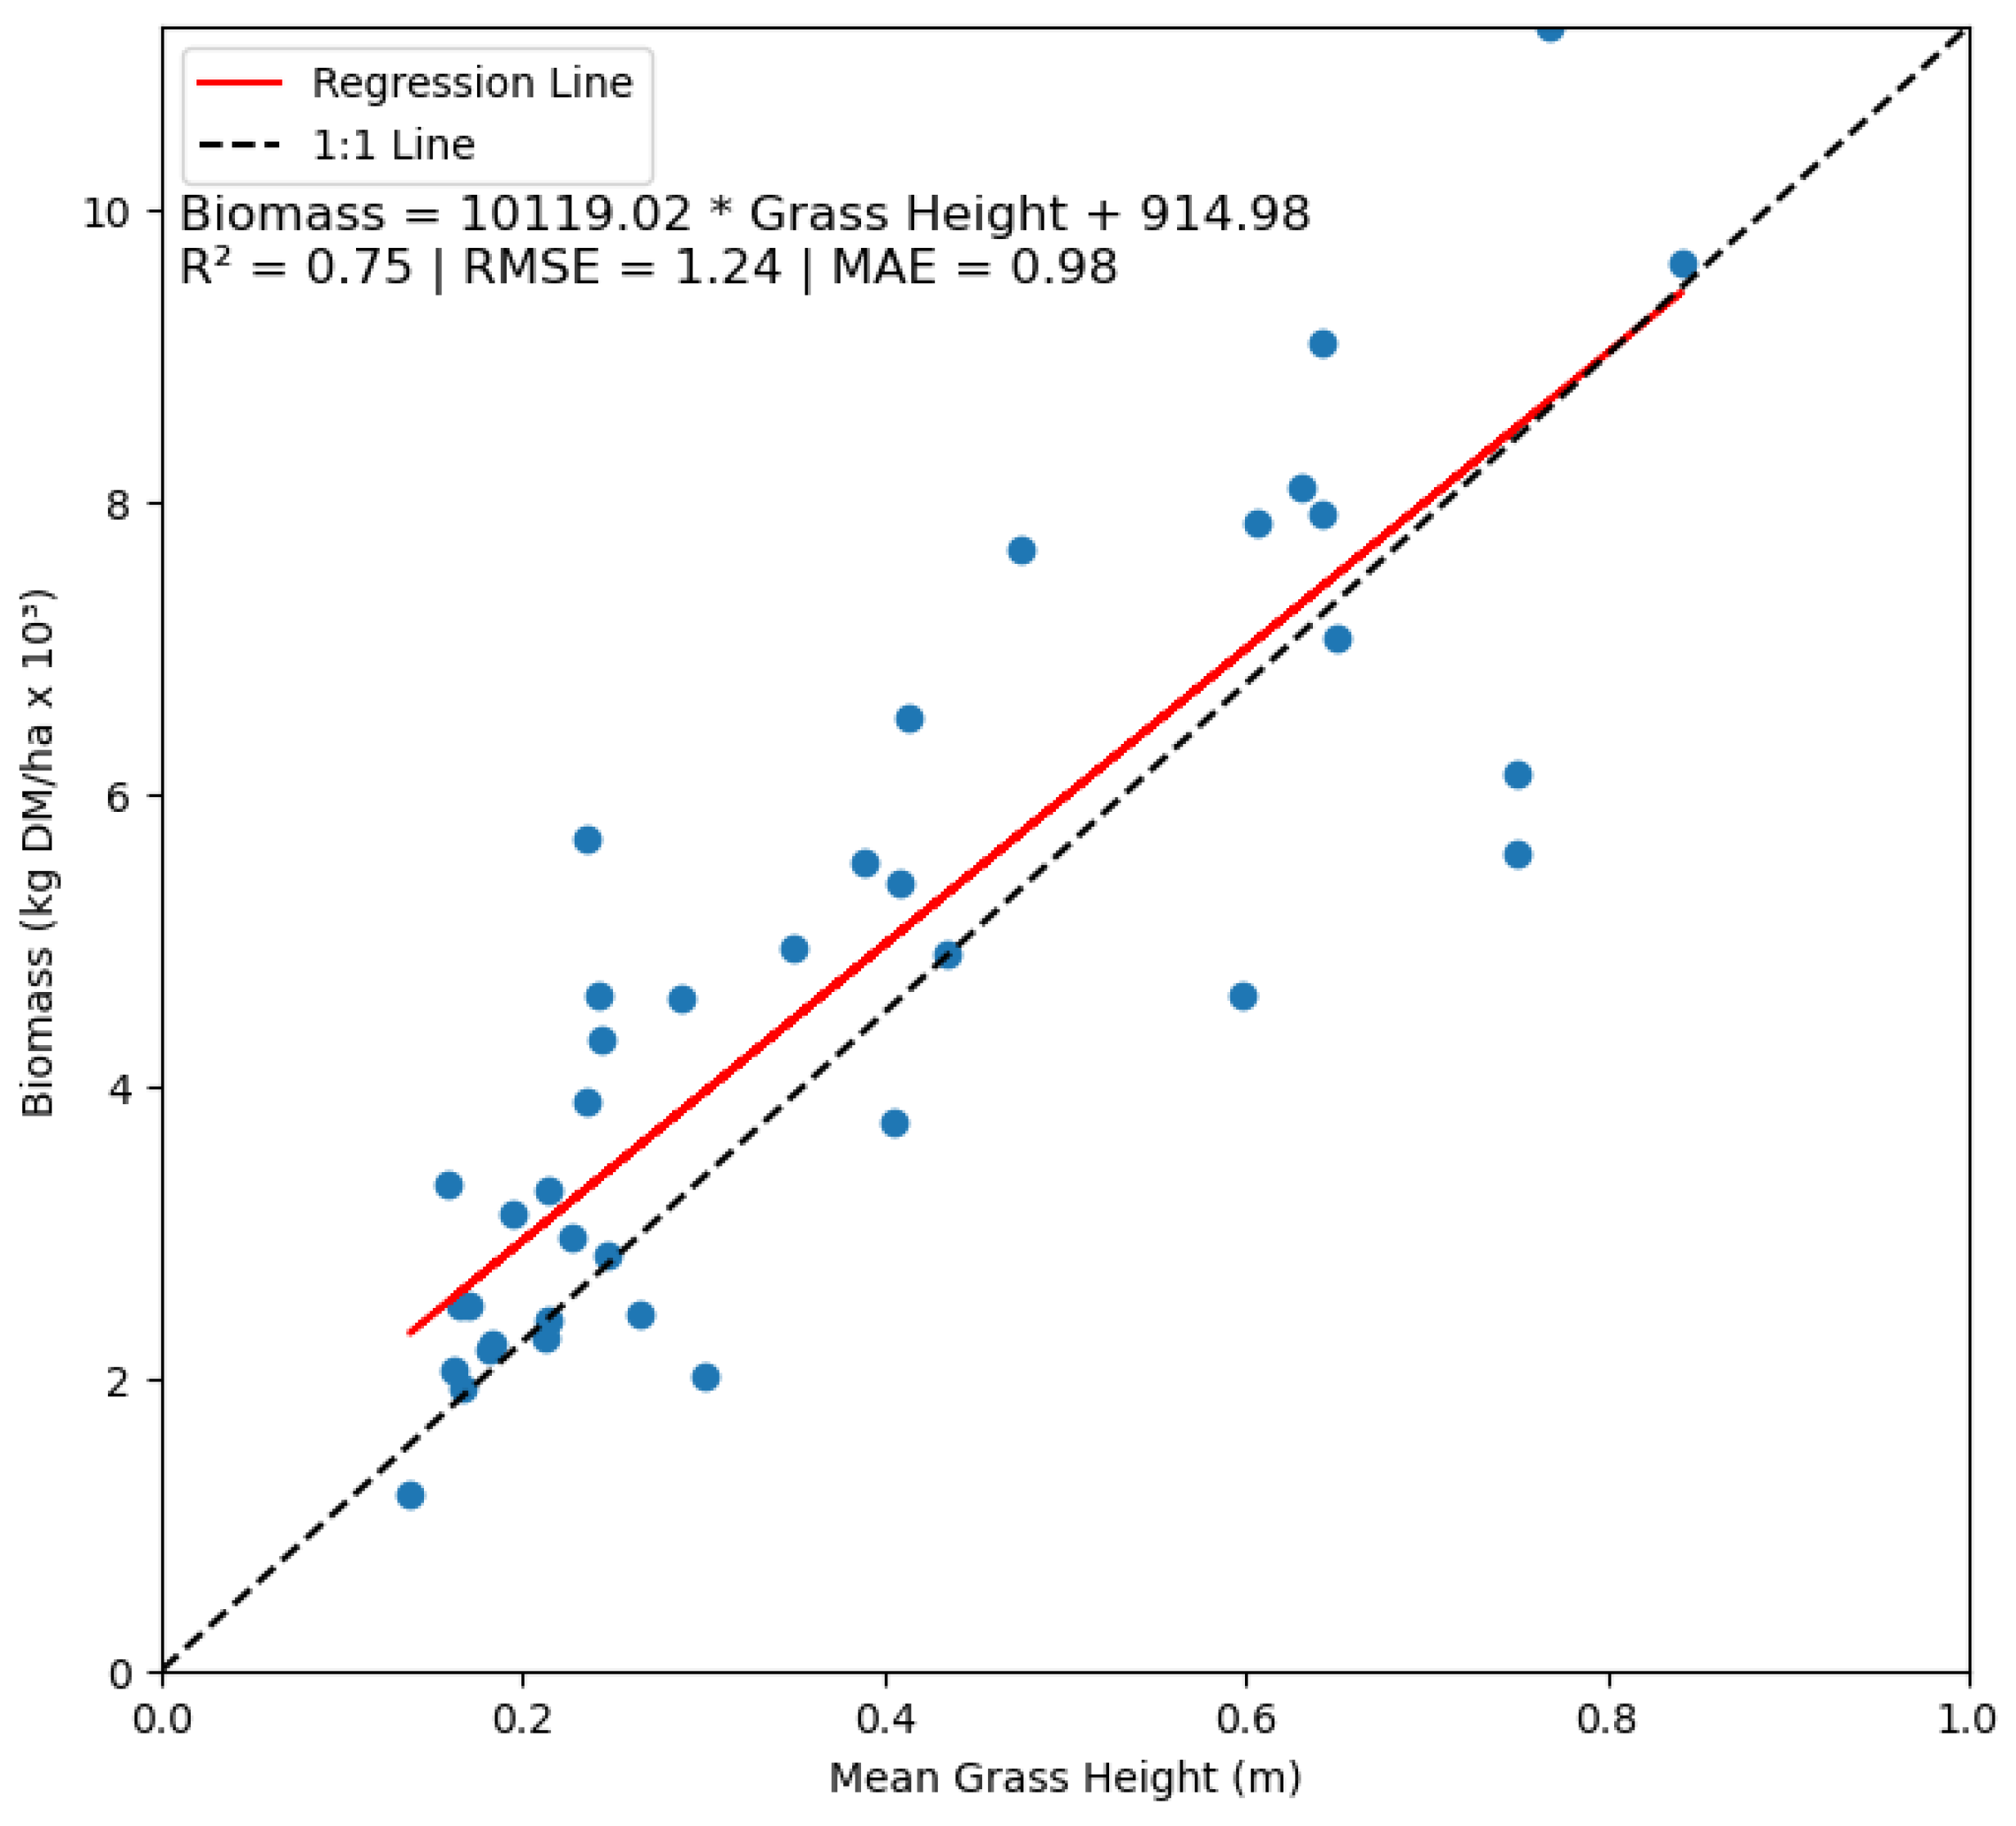
Figure 5.
Sentinel-2 data assimilated using random forest modelling of grassland biomass with the actual sampled biomass for Vault and Bougainville (Site 1) in the study location. .
Figure 5.
Sentinel-2 data assimilated using random forest modelling of grassland biomass with the actual sampled biomass for Vault and Bougainville (Site 1) in the study location. .
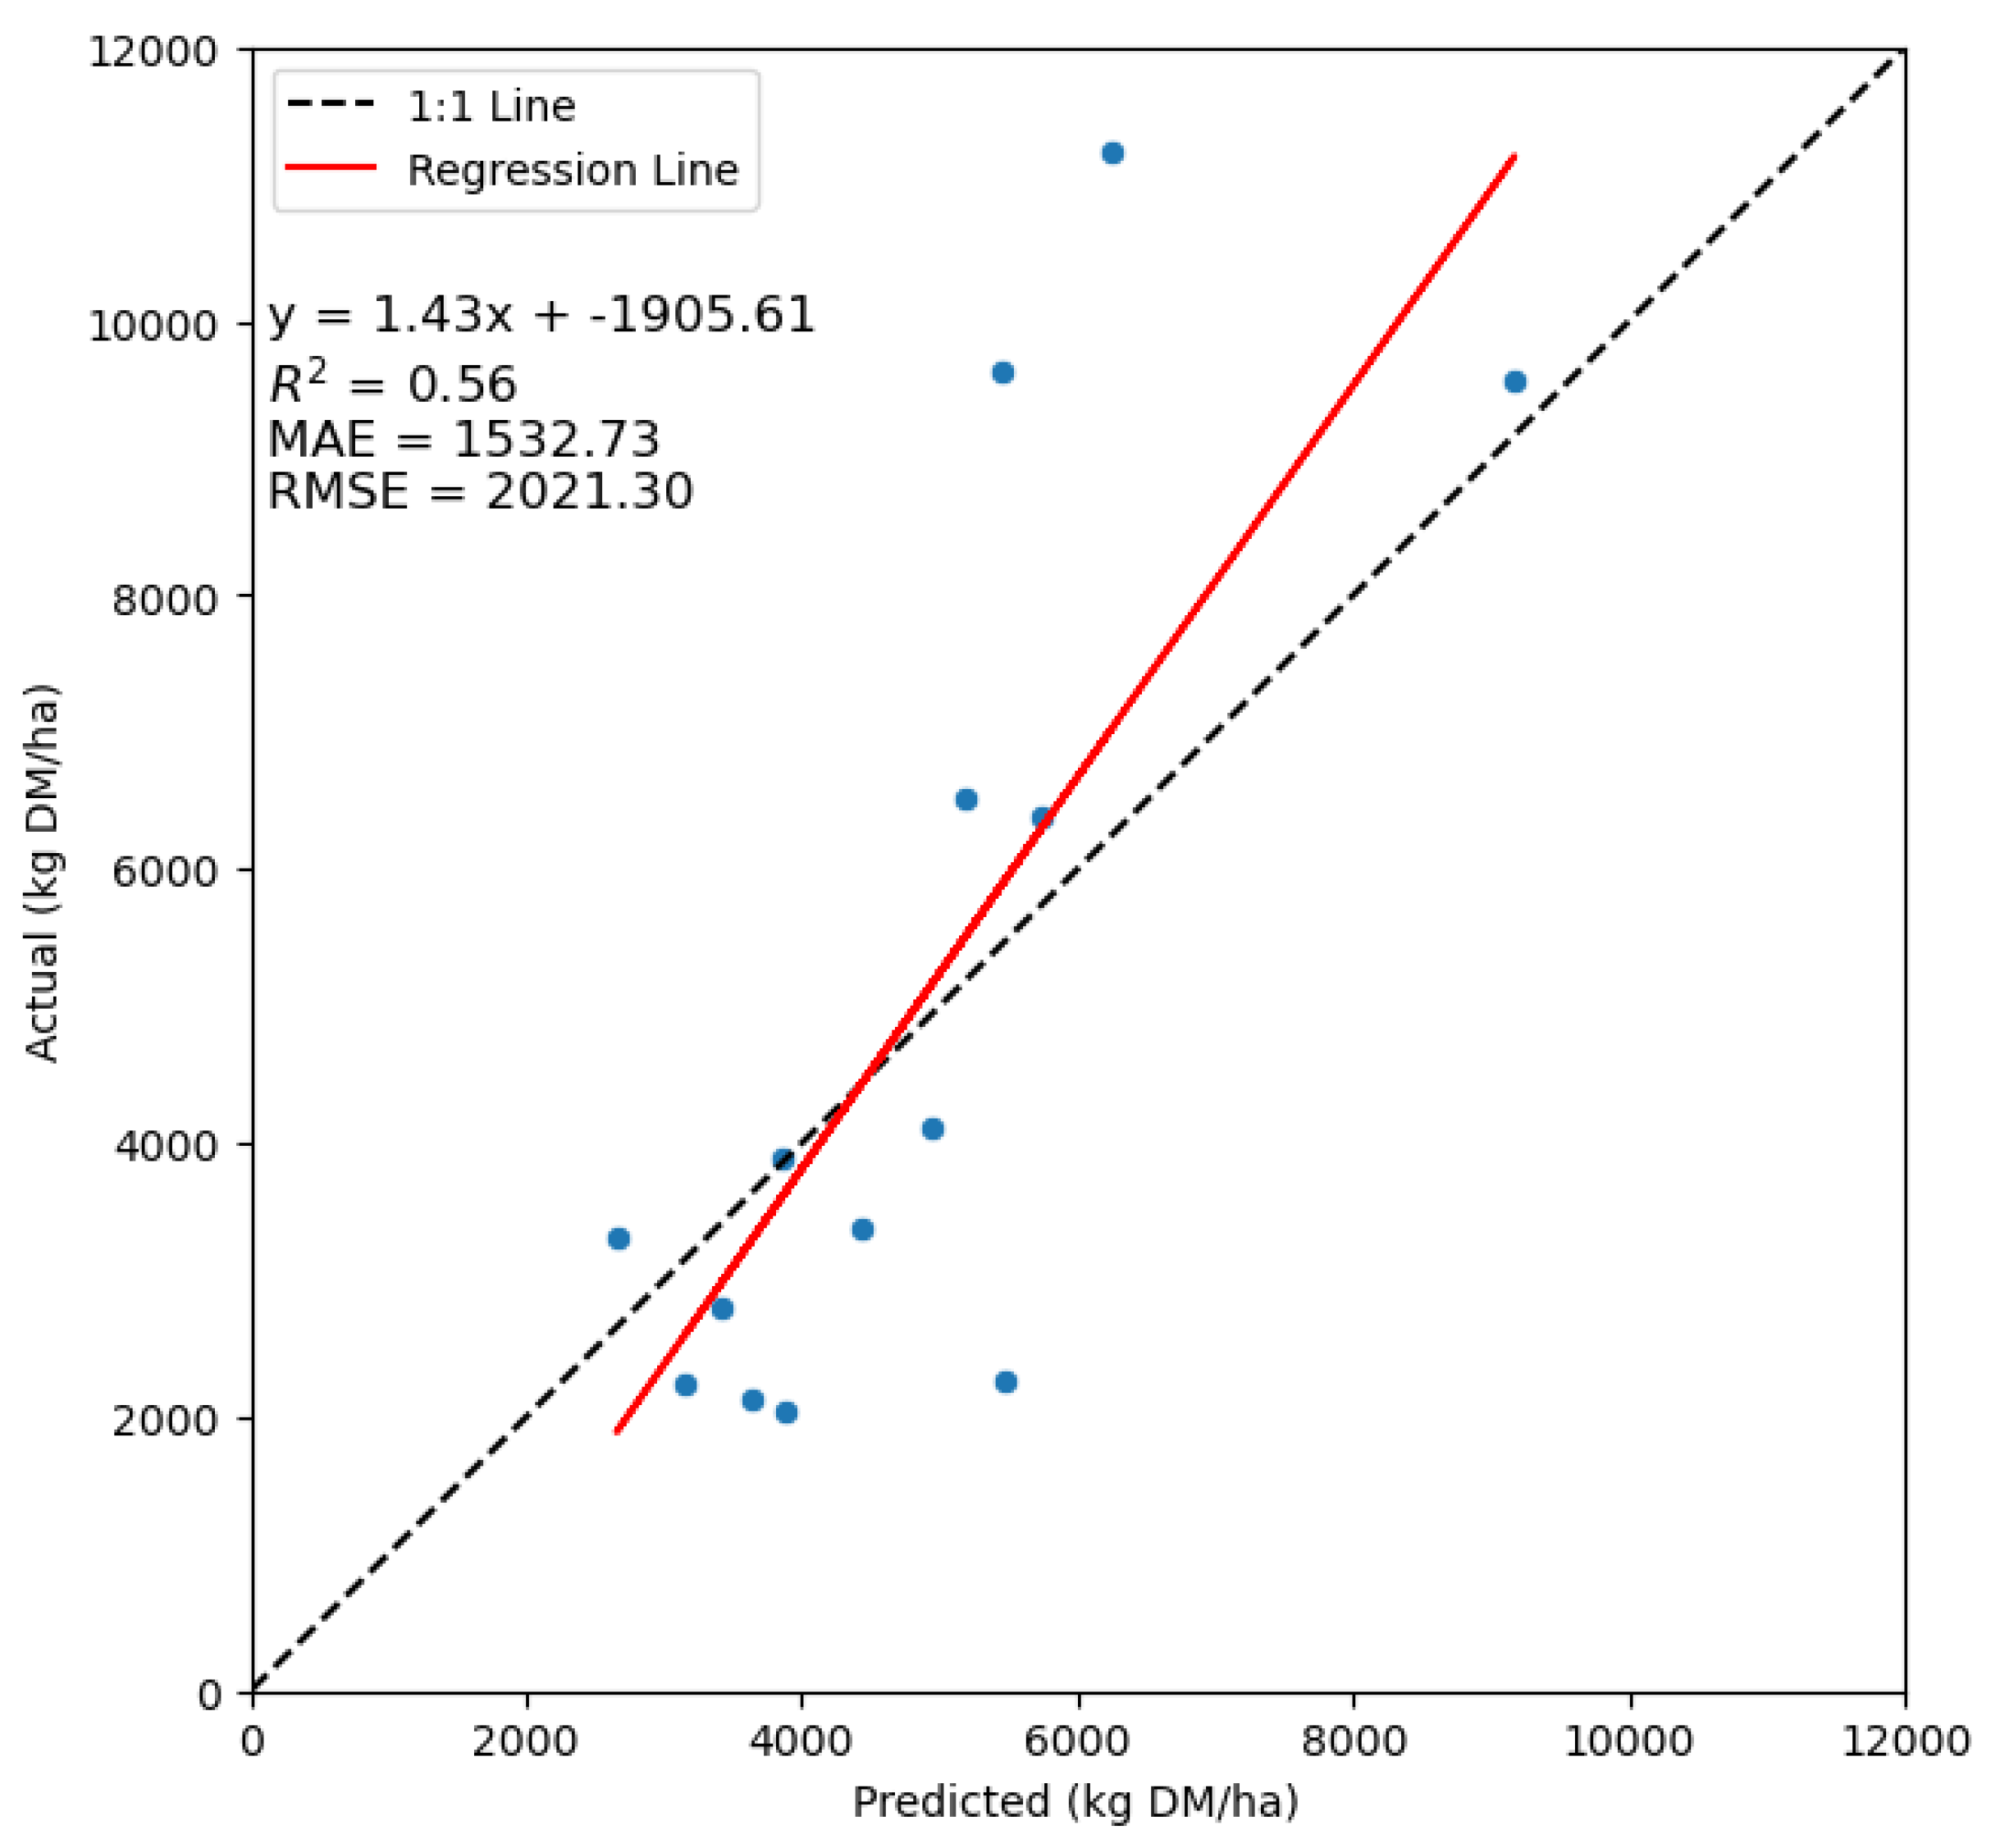
Figure 6.
Sentinel-2 biomass calibration using UAS-derived biomass change data. Each point represents the average biomass at the paddock level for both the drone and satellite. This calibration aims to enhance the temporal frequency and accuracy of biomass estimates from Sentinel-2 imagery, addressing the challenges of cloud in Tasmania, Australia.
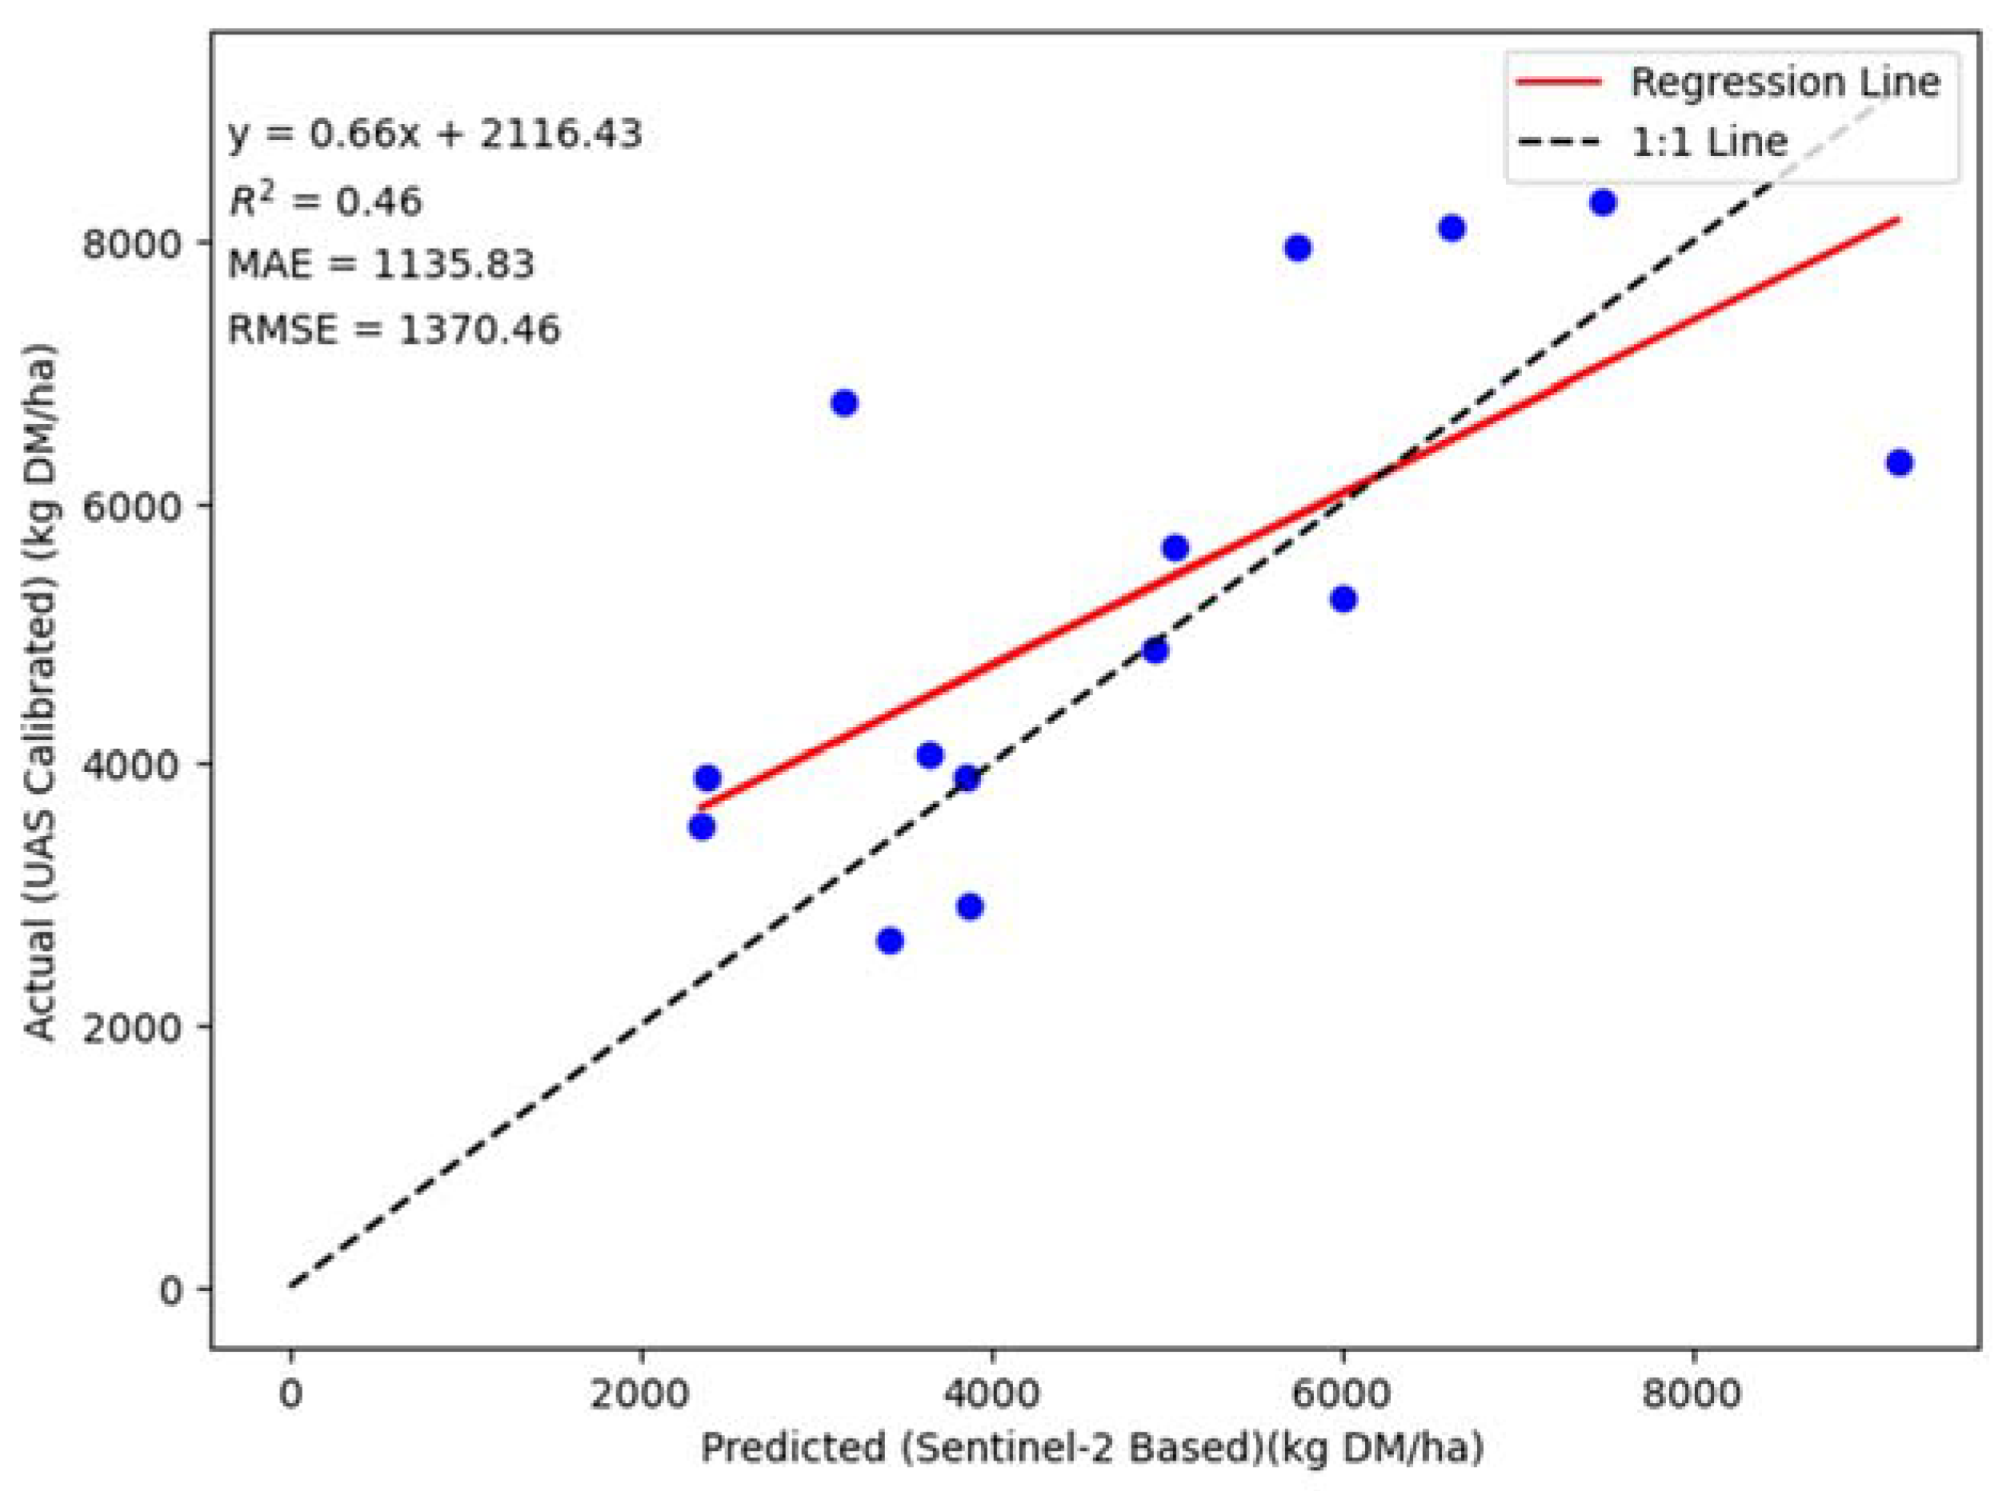
Figure 7.
Comparison of the seasonality of UAS biomass in two representative paddocks against Sentinel-2 modelling. The UAS model estimates biomass change based on changes in grass heights between pre- and post-grazing events, while the Sentinel-2 estimates biomass using the nearest temporal imagery and a random forest algorithm. Each point represents the average biomass at the paddock level for both the drone and satellite.
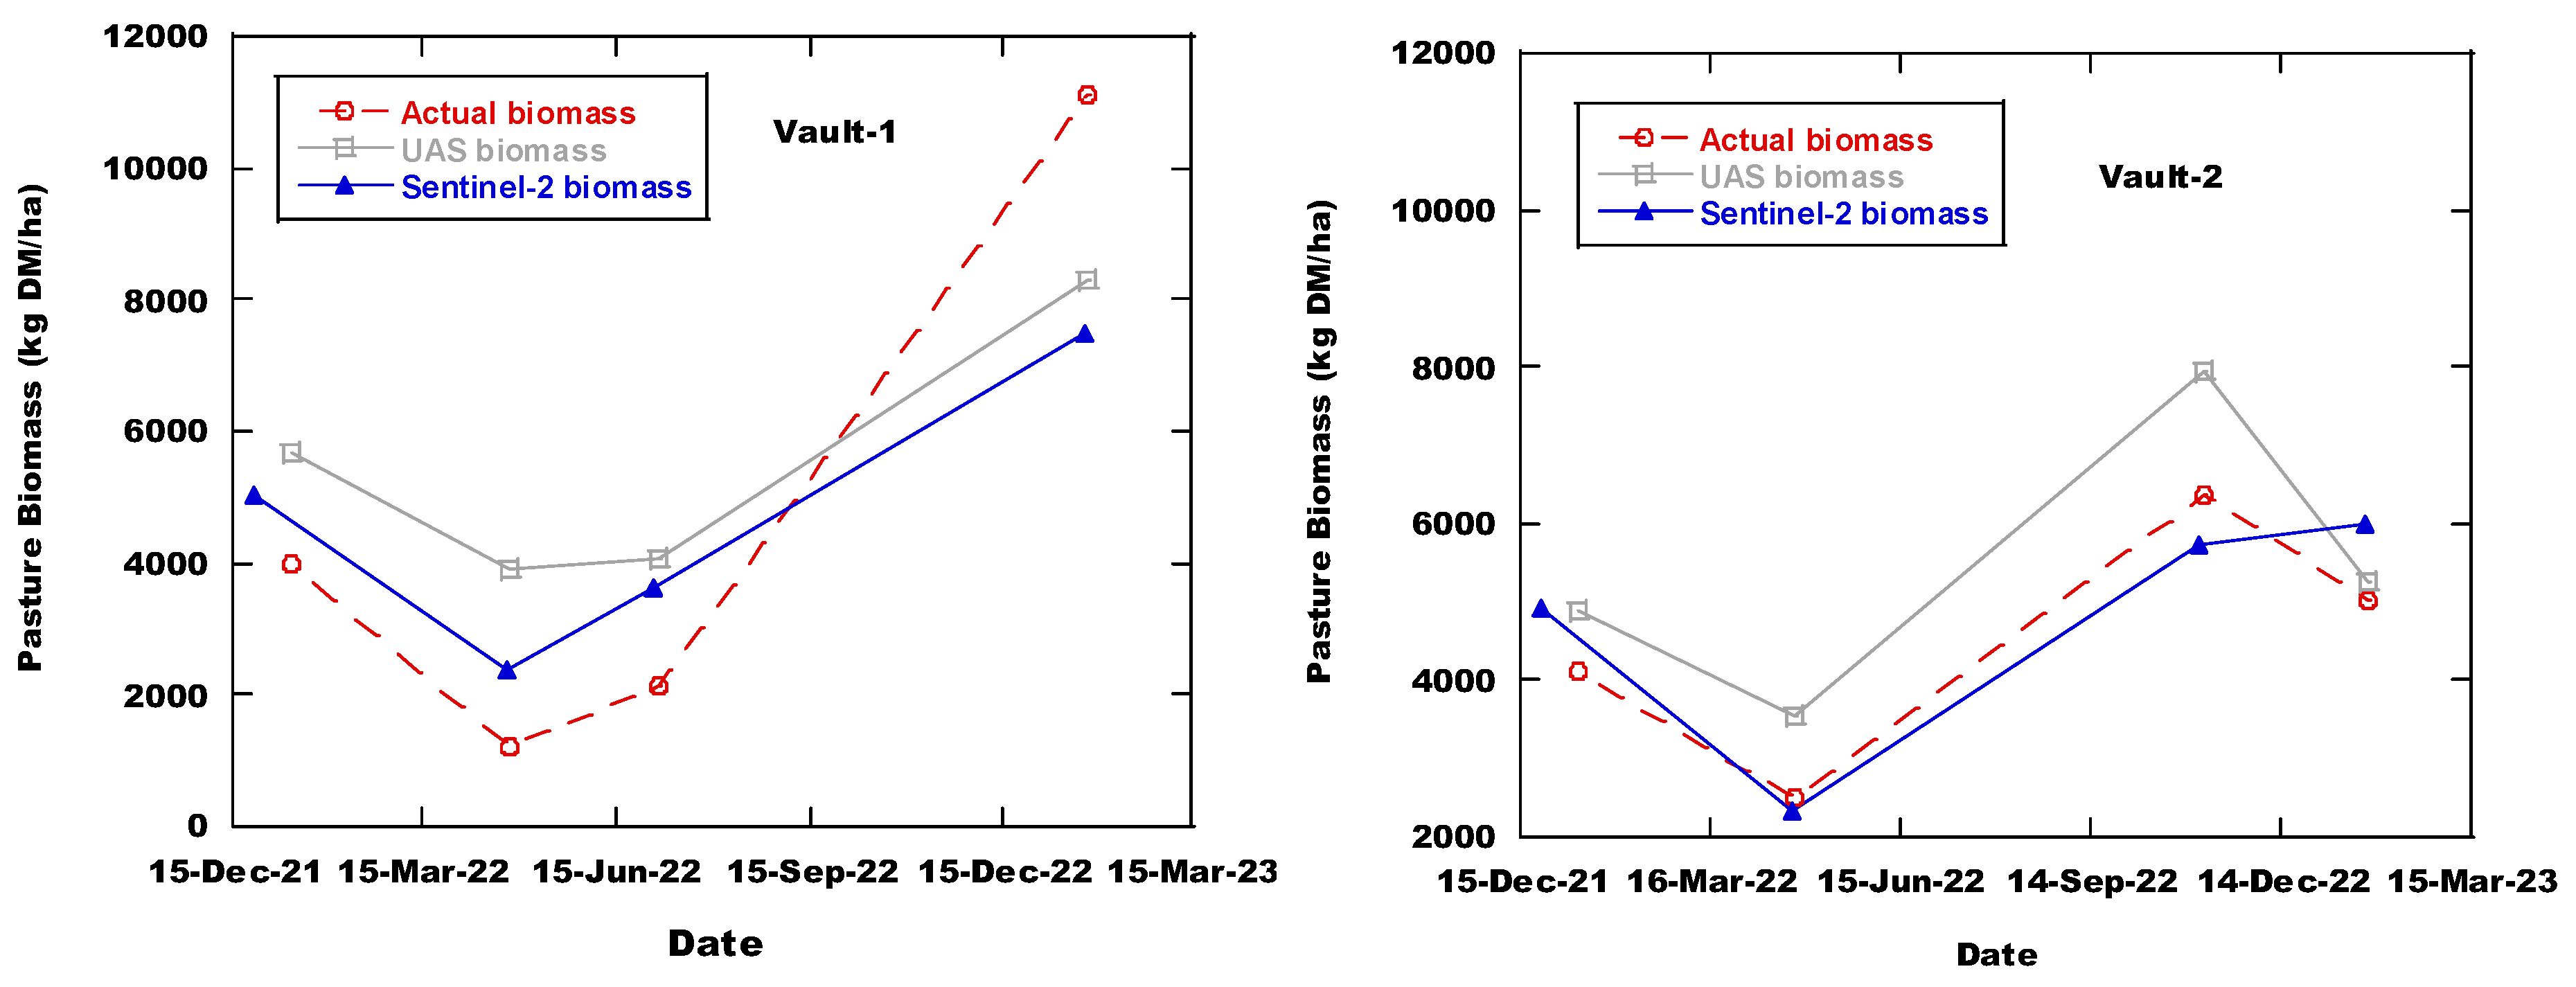
Figure 8.
Pixel-based comparison and spatial resolution between the UAS point cloud and Sentinel-2 instruments deployed for investigating grassland biomass at Okehampton in Triabunna, Australia. (a) RGB (red, green, and blue) image for pre-graze on 25 January 2023 for the Vault paddocks, (b) post-grazing event on 27 January 2023, and (c) Sentinel-2 image available on 24 January 2023. Field biomass was sampled on 25 January 2023. The UAS could capture more detailed observations compared to Sentinel-2 larger pixel-size imagery. Units of each legend are shown in kg DM/ha.

Figure 9.
Species composition as a contribution toward grassland biomass in each paddock. Note: scaling is unique to each paddock as species distribution differs across plots.
Figure 9.
Species composition as a contribution toward grassland biomass in each paddock. Note: scaling is unique to each paddock as species distribution differs across plots.
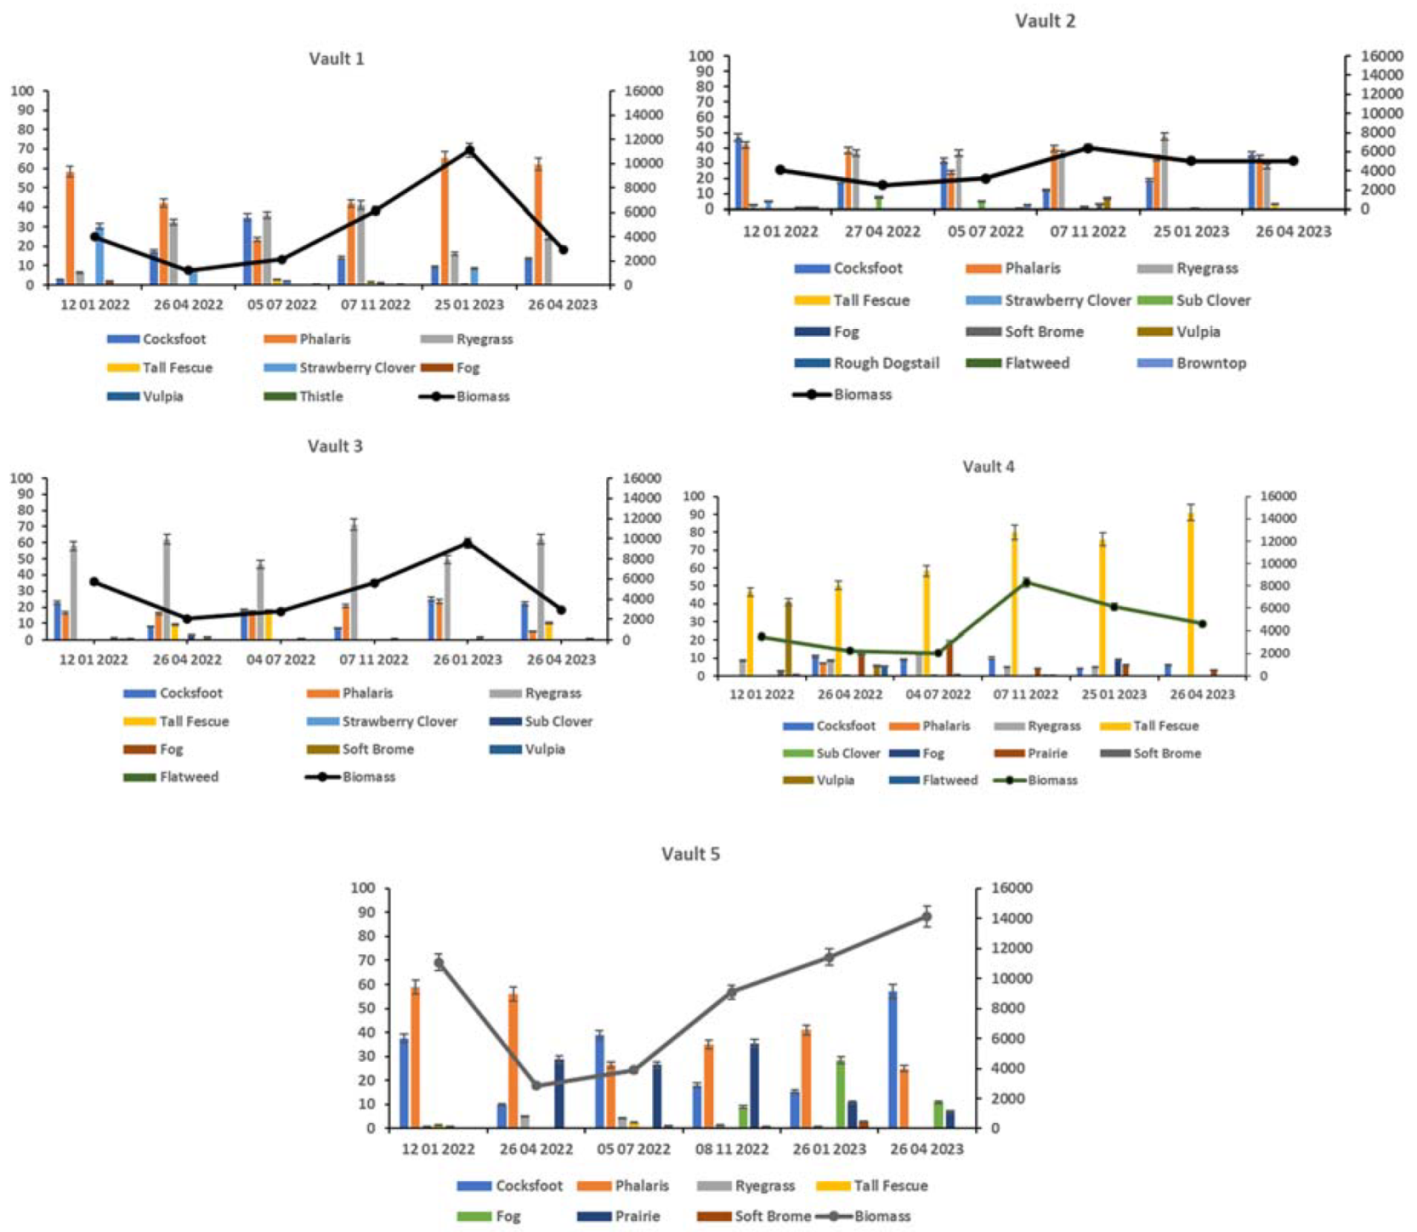
Figure 10.
NDVI response to weekly rainfall and grazing management in Cottage and Old Bougainville paddocks, highlighting specie-specific productivity and grazing patterns. Cottage paddock (a) was used as business-as-usual by opening its gate to adjoining paddocks. Pasture species show peak heights when sheep moved to adjoining paddocks. Old Bougainville paddock (b) shows non-selective grazing from increased lambing.
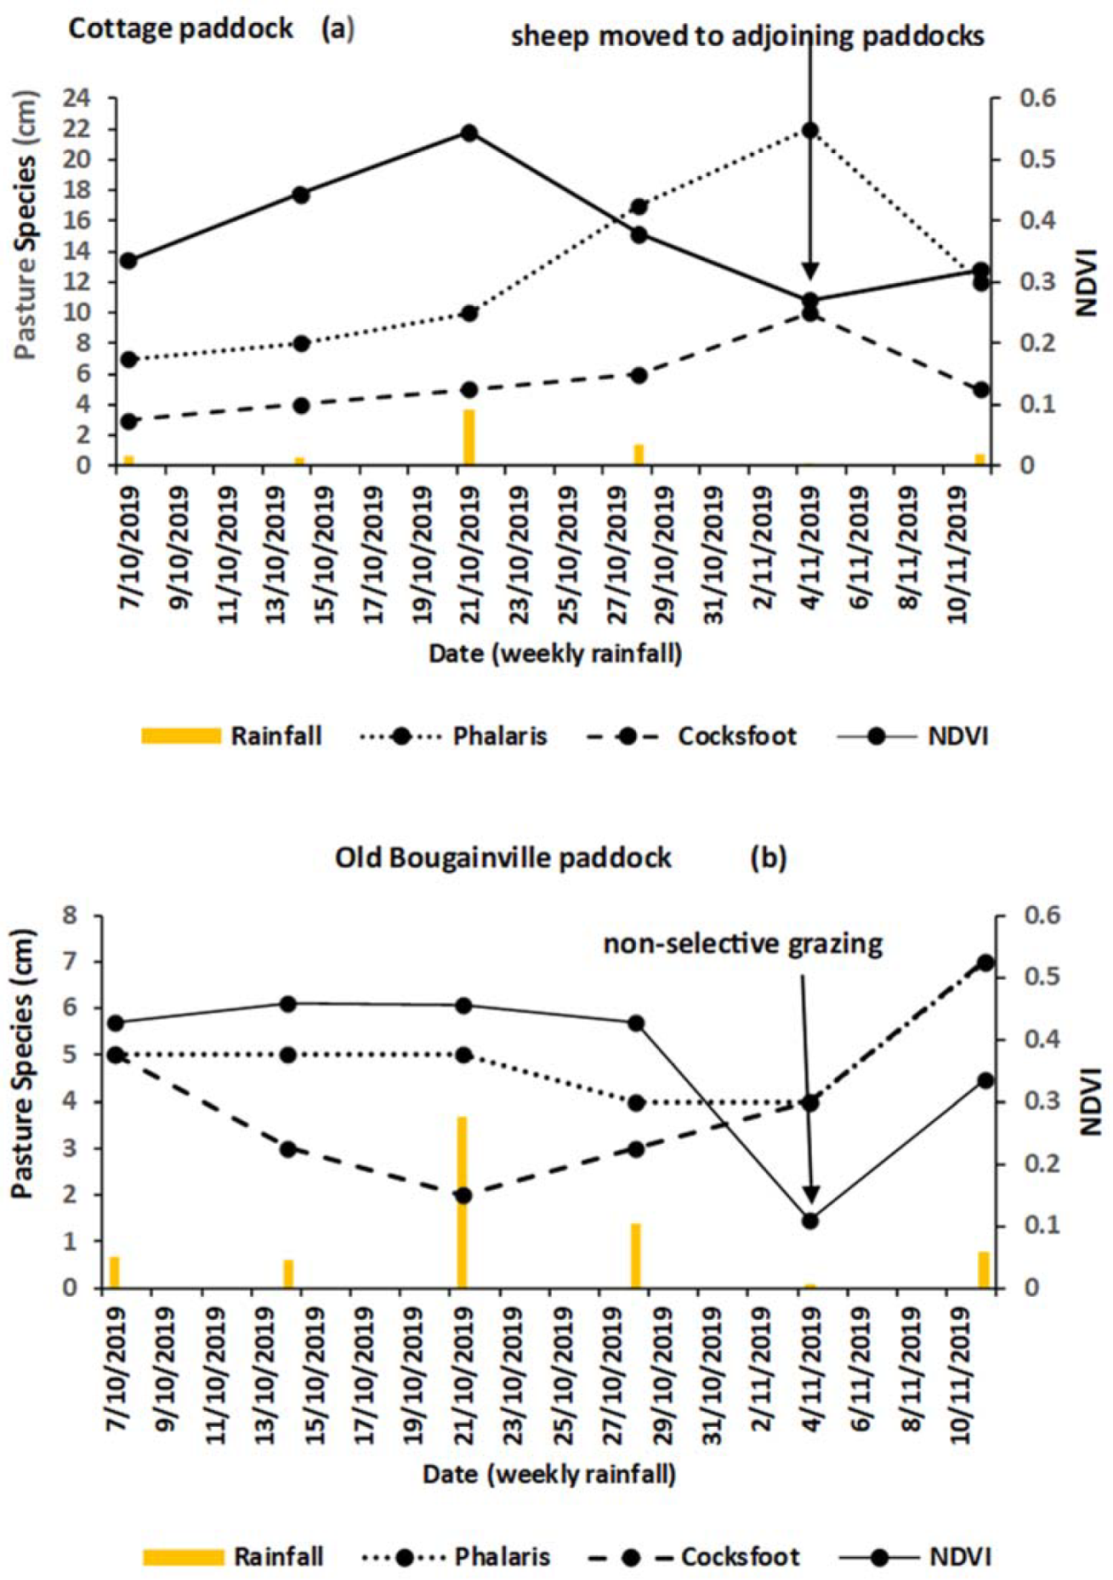
Figure 11.
Correlation between weekly rainfall and NDVI response, emphasising the significant in Cottage and Old Bougainville paddocks in the spring of 2019 in Okehampton, Triabunna, Australia. Each data point represents the average NDVI and cumulative rainfall for that week.
Figure 11.
Correlation between weekly rainfall and NDVI response, emphasising the significant in Cottage and Old Bougainville paddocks in the spring of 2019 in Okehampton, Triabunna, Australia. Each data point represents the average NDVI and cumulative rainfall for that week.
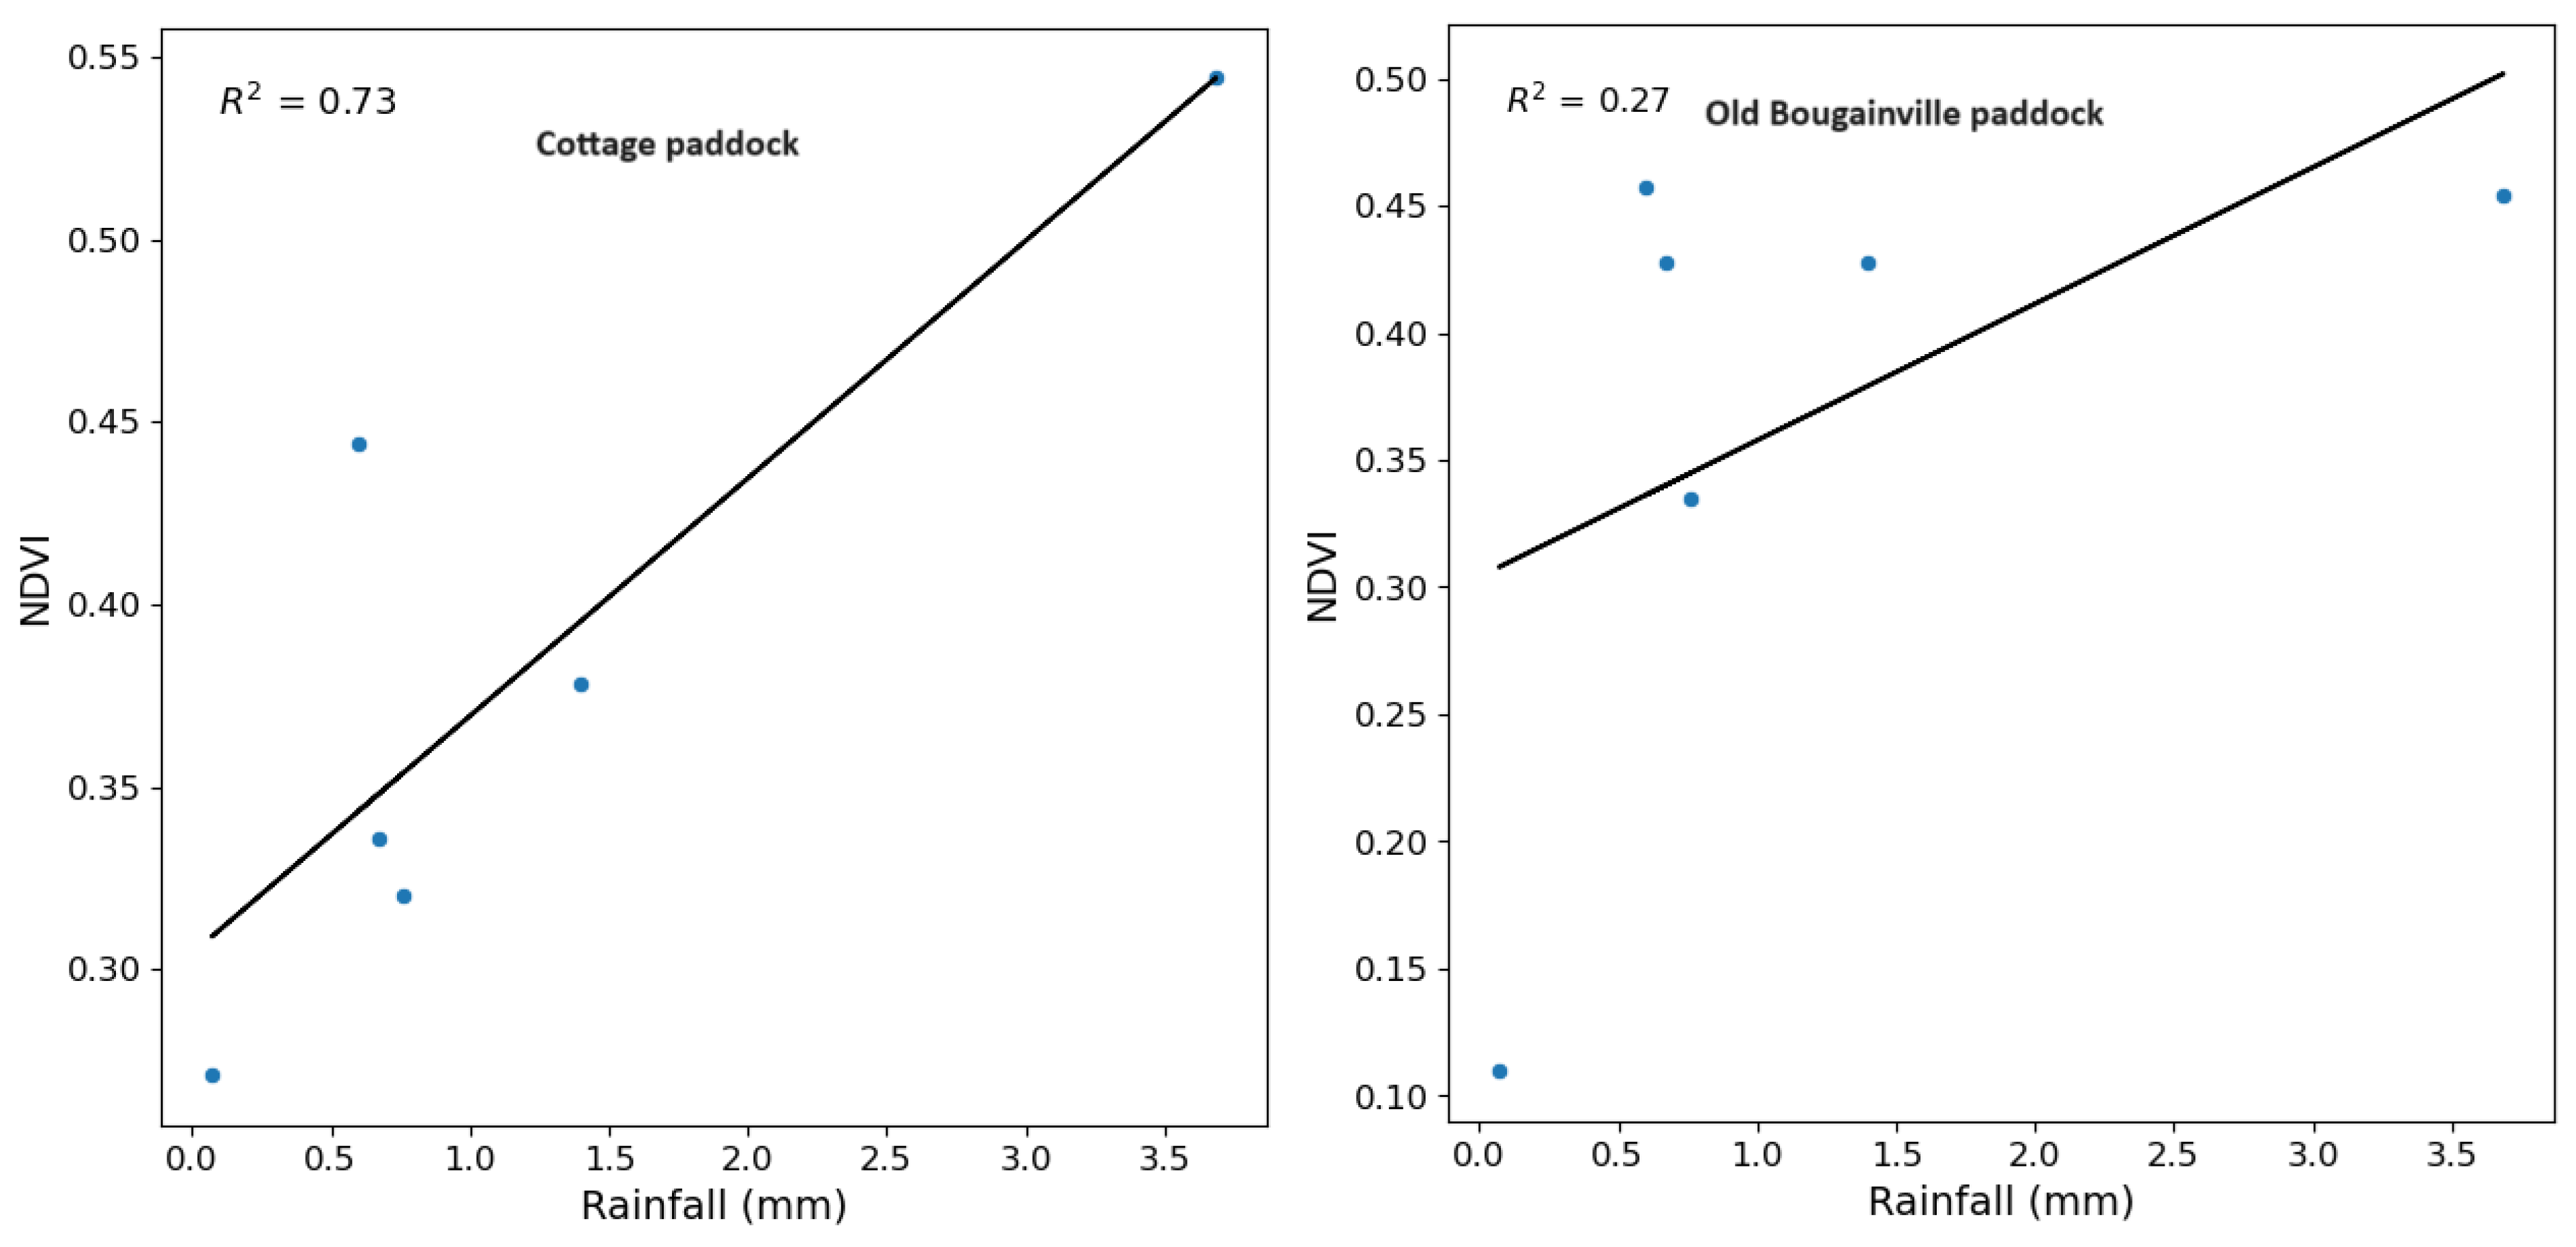
Figure 12.
Correlation between NDVI and pasture species (Phalaris and Cocksfoot) indicating varying degrees of relationship influenced by grazing intensity and management practices. No statistical correlation was observed between NDVI and the species. The moderate correlation between Phalaris species and NDVI indicates it dominance in the Cottage paddock.
Disclaimer/Publisher’s Note: The statements, opinions and data contained in all publications are solely those of the individual author(s) and contributor(s) and not of MDPI and/or the editor(s). MDPI and/or the editor(s) disclaim responsibility for any injury to people or property resulting from any ideas, methods, instructions or products referred to in the content. |
© 2024 by the authors. Licensee MDPI, Basel, Switzerland. This article is an open access article distributed under the terms and conditions of the Creative Commons Attribution (CC BY) license (https://creativecommons.org/licenses/by/4.0/).
Copyright: This open access article is published under a Creative Commons CC BY 4.0 license, which permit the free download, distribution, and reuse, provided that the author and preprint are cited in any reuse.


