
Submitted:
05 August 2024
Posted:
05 August 2024
You are already at the latest version
Abstract
Insulin resistance is a condition characterized by a reduced biological response to insulin. It is one of the most common metabolic diseases of modern civilization. Numerous naturally occurring substances have shown to have a positive effect in restoring the proper sensitivity to insulin. Mature 3T3-L1 adipocytes with artificially induced insulin resistance by palmitic acid (16:0) were used for the study. Cinnamic acid and 1,2-dicinnamoyl-sn-glycero-3-phosphocholin (1,2-diCA-PC) were tested at three concentrations: 25 μM, 50 μM, and 125 μM. The number of mitochondria and the expression of genes encoded by mtDNA were elucidated in control and experimental cells. In experimental cells treated with 1,2-diCA-PC, we displayed increased insulin-stimulated glucose uptake in a dose-dependent manner, accompanied by an increase in mtDNA copy number. Moreover, in experimental cells treated with 1,2-diCA-PC at the concentration of 125 μM, we observed a significant increase in the expression level of all analyzed genes encoded by mtDNA compared to control cells. Our study showed a relationship between improved cellular sensitivity to insulin by 1,2-diCA-PC and an increase in the number of mitochondria and expression levels of genes encoded by mtDNA. Summarizing, the results suggest a therapeutic potential of cinnamic acid derivative 1,2-diCA-PC in enhancing the insulin sensitivity of adipocytes.
Keywords:
insulin resistance
; cinnamic acid
; phospholipid derivative
; phenolic acid
; 1
; 2-di-CA-PC
1. Introduction
Insulin is a key hormone regulating energy homeostasis and metabolic processes within the human body, primarily affecting adipose tissue, skeletal muscle, and the liver [1]. Insulin resistance (IR), often accompanied by obesity, is a major public health problem worldwide. IR is a condition characterized by a reduced biological response of peripheral tissues to insulin. The mechanism of insulin signaling is multistep and precisely regulated at various levels. IR occurs in conjunction with numerous metabolic disorders as well as hormonal disorders such as Polycystic Ovary Syndrome (PCOS) and thyroid dysfunction [2]. A common pathological feature in various forms of IR is the disruption of cellular insulin signal transmission at the molecular level, which is responsible for the development of IR. The main mechanism of insulin resistance induction is connected with impairments in insulin signal transduction, primarily through Akt and phosphatidylinositol 3 (PI3) kinases, which mediate the appropriate effects in the aforementioned tissues. Furthermore, IR induces hepatic gluconeogenesis, which further increases glycemia [3].
Numerous mechanisms have been shown to lead to the development of insulin resistance (IR). Disruption in lipid metabolism is the most common cause of IR development. However, other conditions such as obesity, chronic low-grade inflammation in various tissues, hormonal dysregulation, and other factors also impair proper signal transduction, ultimately leading to disturbances in the mechanisms of insulin action [3].
Mitochondria play a crucial role in cell metabolism and are responsible for controlling numerous cellular processes that require ATP. It has also been shown that in humans and other organisms, IR is strongly connected with reduced mitochondrial function, manifested by a reduced mitochondrial copy number, reduced mitochondrial biogenesis, and disruption in oxidative phosphorylation. Moreover, IR leads to impaired energy production in the form of ATP, caused by reduced mitochondrial respiratory capacity observed in insulin-resistant patients, type 2 diabetic patients, and obese individuals [4,5]. The main consequence of reduced mitochondrial capacity is an increase in reactive oxygen species (ROS) production, which is believed to be the root cause of IR development [6].
Cinnamic acid belongs to the class of aromatic acids and is a member of the phenylpropanoid family of natural compounds. It occurs naturally in various plants and essential oils and is an important intermediate in the biosynthesis of many secondary metabolites. Cinnamic acid exhibits various biological activities, including antioxidant and anti-inflammatory properties, and modulates glycogenesis and gluconeogenesis [7,8]. It has been observed that cinnamic acid exhibits antidiabetic effects by improving glucose tolerance and stimulating insulin secretion in rat islets and insulin action in mouse hepatocytes [9,10]. Moreover, our recent study evaluating the therapeutic effects of phenolic acids on insulin-resistant adipocytes (3T3-L1) showed that cinnamic acid (CA) and its derivative, 1,2-dicinnamoyl-sn-glycero-3-phosphocholine (1,2-diCA-PC), restored proper insulin sensitivity in insulin-resistant adipocytes. We also noted that both CA and 1,2-diCA-PC increased the metabolic activity of mitochondria, as assessed by the MTT test [11]. As described above, mitochondrial functionality directly translates into the functionality of the entire cell, including insulin signal transduction and thus insulin sensitivity. With the excessive supply of free fatty acids seen in obesity, there is an increase in the rate of mitochondrial metabolism, and prolonged exposure of cells to excess nutrients leads to mitochondrial overload. This mitochondrial dysfunction can contribute to chronic oxidative stress, which plays a significant role in the pathogenesis of insulin resistance in adipocytes [12,13,14]. Restoring normal mitochondrial function can have a therapeutic effect.
In our previous paper, we reported the therapeutic effect of cinnamic acid and its derivatives on insulin-stimulated glucose uptake (ISGU) in insulin-resistant 3T3-L1 adipocytes [11]. However, we were unable to demonstrate the possible mechanism of action through which these compounds increase insulin sensitivity, as assessed by insulin-stimulated glucose uptake. We did not observe any changes in the expression of insulin pathway genes in treated cells compared to untreated cells, suggesting that the mechanism of action does not involve the insulin pathway itself. For this reason, we further examined the possible mechanisms through which these compounds overcome insulin resistance. Considering the significant role of mitochondria in overall cell metabolism, we hypothesized that the mechanism might directly involve mitochondria. To verify this assumption, we investigated the number of mitochondria and the expression of genes encoded by mtDNA in insulin-resistant adipocytes treated with the examined substances to identify a potential mechanism underlying increased cellular sensitivity to insulin.
2. Results
2.1. Glucose Uptake Test
The experiment was conducted in four repetitions. As a reference control, insulin-resistant cells incubated with the appropriate solvent (ethanol for CA, DMSO for 1,2-diCA-PC) were used. In our previous study, we did not detect any influence of ethanol or DMSO on insulin-stimulated glucose uptake by insulin-resistant adipocytes.
The experiments confirmed the successful development of insulin resistance in 3T3-L1 adipocytes treated with palmitic acid (16:0). Ethanol and DMSO were added to the medium, as they were used as solvents for CA and 1,2-diCA-PC, respectively. Cells with developed insulin resistance (IR + Ethanol, IR + DMSO) showed a slight increase in insulin-stimulated glucose uptake in insulin-treated cells (INS +) compared to non-stimulated cells (INS -). On the other hand, adipocytes with proper insulin sensitivity (IR - Ethanol, IR - DMSO) displayed significantly increased insulin-stimulated glucose uptake compared to non-stimulated cells (IR - Ethanol, p = 0.024; IR - DMSO, p = 0.043; Figure 1).
Cinnamic acid significantly increased insulin-stimulated glucose uptake at all studied concentrations compared to basal glucose uptake. The increase was 2.3-fold for 25 μM, 2-fold for 50 μM, and 1.6-fold for 125 μM (25 μM: p = 0.062; 50 μM: p = 0.093; 125 μM: p = 0.009, Figure 1). When compared to the insulin-stimulated insulin-resistant adipocytes (IR+), we did not observe any significant changes in glucose uptake in IR adipocytes treated or not treated with CA, and the difference was not noticeable at any of the analyzed concentrations.
The 1,2-diCA-PC significantly increased ISGU at all studied concentrations in cells stimulated by insulin compared to non-stimulated cells. For the concentrations of 50 μM and 125 μM, the increase was 2.9-fold and 3.5-fold, respectively (50 μM: p = 0.047; 125 μM: p = 0.013, Figure 2), showing a dose-dependent effect. When comparing the ISGU in adipocytes treated with 1,2-diCA-PC to insulin-resistant adipocytes (IR+), we observed a significant increase in glucose uptake at the highest concentration, which was almost three times higher (p = 0.034). The medium concentration increased ISGU by about two times, with the significance being close to statistical (p = 0.108). The lower concentration of 1,2-diCA-PC did not increase ISGU in insulin-resistant adipocytes when compared to IR adipocytes not treated with this compound.
2.2. mtDNA Copy Number Quantification
The mtDNA copy number was analyzed using a Real-Time PCR-based technique. The experiment was conducted in duplicate. The results obtained from cells treated with the analyzed compounds (CA and 1,2-diCA-PC) at appropriate concentrations were compared to results from control insulin-resistant adipocytes (IR+) incubated with solvents used for each studied compound (ethanol for CA, DMSO for 1,2-diCA-PC), as well as to adipocytes with proper insulin sensitivity (IR-) cultured in the presence of the appropriate solvent.
First, we focused on the evaluation of mtDNA copy number between insulin-resistant and insulin-sensitive adipocytes. In cells where ethanol was used as the solvent, we observed a slightly higher number of mtDNA in control cells with induced insulin resistance (IR+ Ethanol) compared to cells with normal insulin sensitivity (IR- Ethanol); however, the increase was not statistically significant. On the other hand, we noticed a statistically significant reduction in the number of mtDNA in insulin-resistant adipocytes (IR+ DMSO) compared to cells with normal insulin sensitivity (IR- DMSO) (p = 0.013) (Figure 2A and 2B).
No substantial effect of CA on the mtDNA copy number was observed in experimental cells at any of the tested concentrations. We noticed a minor increase in the mtDNA amount only at a concentration of 50 μM of CA (Figure 2A). However, none of the obtained results showed statistical significance.
In adipocytes treated with 1,2-diCA-PC, we observed a significant increase in the number of mtDNA at all tested concentrations in a dose-dependent manner. The largest increase, up to 73%, compared to the control adipocytes (IR+), was observed at a concentration of 125 μM (p = 0.000), a 57% increase at 50 μM (no statistical significance), and a 29% increase at 25 μM (p = 0.081, Figure 2B).
We also searched for any correlation between the glucose uptake rate after insulin stimulation (ISGU) and the mtDNA copy number. We noticed a strong correlation between mtDNA copy number and ISGU in insulin-resistant adipocytes treated with 1,2-diCA-PC, which was obtained at the highest tested concentration (125 µM, R = 0.72, p = 0.011; Figure 2C).
2.3. The Expression of mtDNA Encoded Genes
The experiment was conducted in triplicate. For the analysis, as a reference control, cells with induced insulin resistance were used, not incubated with the compounds (CA and 1,2-diCA-PC) but with the solvents used for each compound (ethanol for CA, DMSO for 1,2-diCA-PC). Control adipocytes with proper insulin sensitivity, cultured with the appropriate solvent, were also included to evaluate the differences between insulin-sensitive and insulin-resistant cells.
First, we aimed to determine if insulin resistance caused any changes in the expression of mitochondrial genes. We compared mitochondrial gene expression between insulin-resistant adipocytes and adipocytes with proper insulin sensitivity. The expression levels of all analyzed genes were markedly reduced in IR adipocytes compared to insulin-sensitive control cells. Surprisingly, the downregulation of mitochondrial-encoded genes was observed only in cells cultured with DMSO (used as the solvent). In control cells treated with ethanol, we did not observe a reduction in expression rates; in fact, some genes were slightly overexpressed in insulin-resistant cells (Figure 3A). This might suggest an influence of ethanol on mitochondrial function in adipocytes. It should also be noted that the reduction in expression rates in cells cultured with DMSO was not statistically significant, although the downregulation of several genes approached significance (Nd3 p = 0.063; Cytb p = 0.118; Atp6 p = 0.063; Atp8 p = 0.197; Cox1 p = 0.110; Cox2 p = 0.158, Figure 3B).
Cinnamic acid did not influence the expression of genes encoded by mtDNA in experimental cells compared to insulin-resistant adipocytes (IR+). Cells incubated with CA at three tested concentrations (25 μM, 50 μM, 125 μM) did not exhibit any significant changes in the expression levels of almost all analyzed genes (Figure 4).
Insulin-resistant adipocytes treated with 1,2-diCA-PC exhibited a significant increase in the expression of all analyzed genes compared to insulin-resistant control cells (IR+). However, the increase was notable only at the highest tested concentration, which is 125 μM. We observed the following increases in expression: 4.3-fold for Nd3 (p = 0.017), 3.8-fold for Atp6 (p = 0.022), approximately 2-fold for Nd4 (p = 0.106), Nd5 (no statistical significance), Cytb (p = 0.021), Atp8 (p = 0.134), Cox1 (p = 0.050), and Cox2 (p = 0.022) (Figure 5). Cells treated with lower concentrations of 1,2-diCA-PC (25 and 50 μM) displayed a slight increase in expression for Nd3, Cytb, and Atp6 only, but these changes were not statistically significant (Figure 5).
3. Discussion
In the present study, we evaluated the influence of cinnamic acid and its phospholipid derivative, 1,2-dicinnamoyl-sn-glycero-3-phosphocholine, on mitochondrial function in insulin-resistant 3T3-L1 adipocytes by investigating the number of mitochondria and the expression of genes encoded by mtDNA.
Firstly, we confirmed the successful development of insulin resistance in mature adipocytes using palmitic acid (16:0), as evidenced by measurements of insulin-stimulated glucose uptake. We observed a lower glucose uptake rate in cells treated with palmitic acid in both types of insulin-resistant controls: those incubated with ethanol or DMSO, the solvents used for resuspending CA and 1,2-diCA-PC, respectively, compared to cells where insulin resistance was not induced.
Next, after incubation with the examined compounds, we performed insulin-stimulated glucose uptake measurements in insulin-resistant adipocytes. For both analyzed compounds, CA and 1,2-diCA-PC, we confirmed previous observations that CA and 1,2-diCA-PC increase insulin-stimulated glucose uptake in adipocytes with previously developed insulin resistance [11]. It was previously reported that CA moderately increased glucose uptake in insulin-resistant adipocytes, while 1,2-diCA-PC significantly increased the glucose uptake rate, effectively doubling the level of glucose uptake in insulin-sensitive adipocytes [11]. However, the possible mechanisms of action had not been previously revealed.
The number and size of mitochondria are crucial for the proper functioning of these organelles, and they are correlated with mitochondrial oxidative capacity and energy efficiency [15]. A reduced content of mtDNA has been observed in blood cells of obese subjects. Studies have demonstrated a strong negative correlation between mtDNA content and BMI, as well as between mtDNA content and the amount of visceral fat [16]. Furthermore, a reduced amount of mtDNA has also been observed in obese subjects with concomitant insulin resistance. The mtDNA/nDNA (nuclear DNA) ratio was inversely correlated with HOMA, glucose, and uric acid levels [17,18]. Additionally, in obese subjects with diagnosed T2D, a negative correlation was observed between mtDNA levels and BMI, fasting plasma glucose, fasting plasma insulin, LDL, and TG values in the blood [19]. A reduction in electron transport chain activity, which correlated with a reduced number of mitochondria, was observed in the skeletal muscle of obese individuals [20,21].
All these reports highlight the significant role of mitochondria not only in the pathogenesis of metabolic diseases but also in their interrelation. In our study, we observed a reduced number of mitochondria in insulin-resistant adipocytes compared to cells with proper insulin sensitivity. However, this decrease was observed only in cells cultured with DMSO and palmitic acid (used as the control for 1,2-diCA-PC). Slightly different results were obtained for adipocytes treated with palmitic acid and ethanol. In these cells, the number of mtDNA copies was even slightly higher in insulin-resistant adipocytes compared to adipocytes with proper insulin sensitivity.
Similarly, when comparing the expression of mitochondrial-encoding genes between insulin-resistant adipocytes and adipocytes with proper insulin sensitivity, we noticed downregulation in insulin-resistant adipocytes treated with palmitic acid and DMSO. However, no changes in expression or even slightly increased expression of mitochondrial-encoding genes were observed in adipocytes co-treated with palmitic acid and ethanol, suggesting some influence of ethanol on mitochondrial biogenesis. Further research is needed to elucidate the effects of ethanol on mitochondrial biogenesis, especially given that some literature provides evidence of ethanol's negative impact on mitochondrial metabolism [22]. It may be a matter of time, as most studies refer to chronic alcohol intake, whereas our ethanol stimulation lasted only 48 hours; thus, the early effects of ethanol might even promote mitochondrial metabolism.
Despite these observations, we can strongly conclude that our results support previous findings reported by others, confirming that mitochondrial numbers are decreased in insulin resistance, specifically in adipocytes treated with DMSO. The influence of ethanol on mitochondrial biogenesis and metabolism certainly requires more in-depth research.
We observed a positive effect of the examined compounds on insulin-stimulated glucose uptake in insulin-resistant adipocytes. However, similar to previous reports, the glucose uptake stimulated by cinnamic acid (CA) was moderate across all studied concentrations [9]. In contrast, the results obtained for the derivative 1,2-dicinnamoyl-sn-glycero-3-phosphocholine (1,2-diCA-PC) demonstrated a dose-dependent increase in insulin-stimulated glucose uptake. At the highest tested concentration, 1,2-diCA-PC doubled the glucose uptake rate measured in adipocytes with proper insulin sensitivity. Similarly, we observed a dose-dependent increase in the number of mitochondria in insulin-resistant cells treated with 1,2-diCA-PC at all analyzed concentrations (25 μM, 50 μM, 125 μM) compared to control cells without 1,2-diCA-PC. Moreover, we observed a positive correlation between the number of mtDNA copies and insulin-stimulated glucose uptake in adipocytes treated with 1,2-diCA-PC at the concentration of 125 μM, which supports the effect of increased mitochondrial copy number on enhancing cellular sensitivity to insulin.
To further study the relationship between mitochondria and insulin sensitivity, we measured the expression rate of genes encoded by mtDNA in experimental cells. The mtDNA genes encode proteins that are crucial for the enzymatic activity of the electron transport chain; thus, the regulation of these genes is vital for the proper functioning of cellular metabolism. A decreased expression of Nd1 and Cox2 has been observed in cells from Zucker Diabetic Fatty (ZDF) rats, an animal model of type 2 diabetes, compared to lean animals. Moreover, the expression levels of these genes are inversely correlated with plasma glucose levels [23]. A 50% decrease in the expression of Cox1, a subunit of mitochondrial complex IV, has been observed in insulin-resistant offspring of T2D parents [24]. In our study, we observed a significant increase in the expression levels of all analyzed mtDNA-encoded genes in cells treated with 1,2-diCA-PC at a concentration of 125 μM, compared to control cells.
The results described above provide evidence for a potential mechanism by which 1,2-diCA-PC, at a concentration of 125 μM, reverses insulin resistance in adipocytes by enhancing mitochondrial biogenesis, as indicated by increased mtDNA copy numbers. A comprehensive understanding of 1,2-diCA-PC’s effect on reversing insulin resistance can be gained by considering the expression results, where the highest tested concentration significantly increased the expression of numerous mtDNA-encoded genes.
In 3T3-L1 adipocytes with developed insulin resistance, treatment with 1,2-diCA-PC at 125 μM led to increased glucose uptake, indicating improved cellular sensitivity to insulin. This effect was accompanied by a significant increase in the number of mitochondria and the expression levels of all analyzed mtDNA-encoded genes compared to control cells. Our studies demonstrate a strong relationship between improved cellular insulin sensitivity and an increase in both mitochondrial numbers and mtDNA gene expression. All analyzed mtDNA genes encode proteins that are components of the electron transport chain and are essential for oxidative phosphorylation. Furthermore, these results highlight the significant therapeutic potential of the cinnamic acid derivative 1,2-diCA-PC in enhancing the insulin sensitivity of adipocytes.
The results presented also have some limitations. The most significant limitation of this study is the lack of a detailed molecular mechanism explaining how 1,2-diCA-PC enhances mitochondrial biogenesis, improves insulin response, and reverses insulin resistance. Further research is needed to fully elucidate this mechanism. Additionally, it would be valuable to investigate whether similar effects are observed in other insulin-dependent cells, such as skeletal muscle or hepatocytes, and to explore if higher concentrations of 1,2-diCA-PC might produce stronger effects. Moreover, the expression of mtDNA-encoded genes could be further validated by quantifying protein levels using Western blot analysis. Despite these limitations, this study is the first to report that 1,2-diCA-PC can reverse insulin resistance by increasing mtDNA copy number and upregulating key genes involved in the enzymatic complexes of oxidative phosphorylation.
4. Materials and Methods
4.1. Study Reagetns
Cinnamic acid (CA) was purchased from Sigma Aldrich (Saint Louis, MI, USA). The stock solution was prepared by dissolving it in ethanol and then diluting it in cell culture media.
1,2-Dicinnamoyl-sn-glycero-3-phosphocholine (1,2-diCA-PC) was synthesized in the Department of Food Chemistry and Biocatalysis at Wrocław University of Environmental and Life Sciences, following the previously reported procedure [25,26]. CA was esterified with the cadmium complex of sn-glycero-3-phosphocholine in the presence of 4-(N,N-dimethylamino)pyridine (DMAP) as a catalyst and N,N'-dicyclohexylcarbodiimide (DCC) as a coupling agent. After purification, the pure product stock solution was prepared by dissolving it in DMSO and then diluting it in cell culture media. Figure 6 illustrates the chemical structures of the analyzed compounds.
4.2. The 3T3-L1 Cell Line Culturing and Differentiation
Mouse fibroblasts 3T3-L1 were purchased from ATCC (Manassas, VA, USA, CL-173™). Cells were cultured in DMEM (Dulbecco’s Modified Eagle’s Medium, Corning Incorporated, New York, NY, USA) supplemented with 10% fetal calf serum (FCS, Sigma-Aldrich, Saint Louis, MI, USA) and antibiotics (penicillin, 50 U/mL; streptomycin, 50 µg/mL, Corning Incorporated, New York, NY, USA) in a humidified incubator at 37°C and 5% CO₂.
After achieving 100% confluence, differentiation into mature adipocytes was induced by changing the medium to DMEM supplemented with 10% fetal bovine serum (FBS, Corning Incorporated, New York, NY, USA), antibiotics (penicillin, 50 U/mL; streptomycin, 50 µg/mL), 3-isobutyl-1-methylxanthine (115 µg/mL), dexamethasone (390 ng/mL), and insulin (10 µg/mL). After three days, the medium was changed to DMEM with antibiotics, 10% FBS, and insulin (10 µg/mL). After an additional three days, the medium was changed to DMEM with antibiotics and 10% FBS, and the cells were further cultured for an additional two days. The cells reached maturity 8 days after the initiation of differentiation.
4.3. Insulin Resistance Induction and the Effect of Phospholipid Derivatives
Insulin resistance was induced in mature adipocytes by culturing the cells in DMEM supplemented with 10% FBS, antibiotics (penicillin, 50 U/mL; streptomycin, 50 µg/mL), and palmitic acid 16:0 (Sigma-Aldrich, Saint Louis, MI, USA) at a concentration of 0.5 mM for 48 hours [9].
After inducing insulin resistance, cinnamic acid (CA) and 1,2-dicinnamoyl-sn-glycero-3-phosphocholine (1,2-diCA-PC) at examined concentrations (25 μM, 50 μM, 125 μM) were added to DMEM supplemented with 10% FBS, antibiotics (penicillin, 50 U/mL; streptomycin, 50 µg/mL), and palmitic acid (0.5 mM). The adipocytes were then further cultured for an additional 48 hours. Palmitic acid was included in the medium to maintain insulin resistance in the adipocytes. After incubation with the specific compounds, the cells were evaluated for insulin responses using a glucose uptake test, measuring both basal glucose uptake and insulin-stimulated glucose uptake. Insulin resistance in the adipocytes was assessed using the Glucose Uptake Test.
4.4. Glucose Uptake Test
The Glucose Uptake-Glo Assay (Promega Corporation, Madison, WI, USA) was performed after two and three days of incubation with cinnamic acid (CA) and 1,2-dicinnamoyl-sn-glycero-3-phosphocholine (1,2-diCA-PC). The day before the glucose uptake test, cells were starved in serum-free culture medium overnight. Just before starting the experiment, the culture medium was discarded, and the cells were washed twice with PBS to remove any residual glucose. Next, a portion of the experimental cells was stimulated with 1 µM insulin in PBS for 10 minutes (INS+), while the remaining adipocytes were left unstimulated (INS-). After insulin stimulation, 10 mM of 2-deoxyglucose (2DG6P) was added to all cells, and they were further incubated for an additional 10 minutes to assess both basal glucose uptake (BGU) and insulin-stimulated glucose uptake (ISGU). The cells were then processed according to the manufacturer’s protocol. Luminescence was measured using the Victor3, 1420 Multilabel Plate Reader from PerkinElmer.
4.5. DNA and RNA Extraction from Experimental and Control Cells
DNA from the cells was isolated using the phenol:chloroform method (Sigma-Aldrich, St. Louis, MO, USA). Total RNA from the cells was isolated using the trizol method (Sigma-Aldrich, St. Louis, MO, USA). DNA and RNA concentration was measured using a NanoDrop 2000 spectrophotometer (Thermo Scientific™, Waltham, MA, USA).
RNA samples were treated with DNase before Reverse Transcription Reaction using RNase-Free DNase (Promega Corporation, Madison, WI, USA) according to the manufacturer’s protocol.
4.6. Mitochindrial DNA Copy Number Quantification
Mitochondrial DNA copy number was measured using the Absolute Mouse Mitochondrial DNA Copy Number Quantification qPCR Assay Kit (ScienCell™ Research Laboratories, Carlsbad, CA, USA). Procedures and calculations were performed according to the manufacturer's protocol. Real-Time PCR was used to quantify mtDNA and gDNA. The mtDNA copy number was calculated using the ∆∆Cq formula in reference to gDNA based on the Cq values.
4.7. cDNA Synthesis and Quantification of Gene Expression
Reverse transcription was performed using the High-Capacity cDNA Reverse Transcription Kit (Applied Biosystems, Waltham, MA, USA). A total of 200 ng of isolated RNA was used for cDNA synthesis. Gene expression analysis was conducted by Real-Time PCR using a SYBR Green assay (Applied Biosystems, Waltham, MA, USA). Primers for mtDNA-encoded genes—Nd3 (NADH dehydrogenase subunit 3), Nd4 (NADH dehydrogenase subunit 4), Nd5 (NADH dehydrogenase subunit 5), Cytb (cytochrome b), Atp6 (ATP synthase 6), Atp8 (ATP synthase 8), Cox1 (cytochrome c oxidase 1), and Cox2 (cytochrome c oxidase 2)—as well as for the nuclear DNA (nDNA)-encoded reference gene Actb (beta-actin) were manually designed (Table 1).
The specificity of the primers was checked using Primer-BLAST (NCBI), and secondary structures were analyzed using OligoAnalyzer (Integrated DNA Technology). Prior to Real-Time PCR, the efficiency of the primers was assessed using the standard curve method. Specificity was further confirmed based on the melting curve. Only primers with efficiency values higher than R² ≥ 0.95 and confirmed specificity through the melting curve were used for gene expression studies. Relative gene expression levels, normalized to the housekeeping gene β-actin, were calculated using the delta-delta Ct (ΔΔCt) method. The fold change was determined using the 2^(-ΔΔCt) algorithm.
4.8. Statistical Analysis
Statistical analyses were performed using Microsoft Office Excel 2007 and Statistica 13.1 (StatSoft). The normality of the distribution was assessed using the Shapiro-Wilk test. Based on the results, parametric tests (Student’s t-test) were used for statistical calculations and analysis of differences between the studied groups. To assess the correlation between numerical characteristics, the correlation coefficient was used. Statistical significance was set at p < 0.05.
5. Conclusions
In the present study, we demonstrated changes in both mtDNA copy number and the expression of mitochondrial genes in adipocytes as possible mechanisms through which 1,2-diCA-PC enhances the insulin response. We concluded that 1,2-diCA-PC reverses insulin resistance by promoting mitochondrial biogenesis and upregulating mitochondrial gene expression, but this effect is observed at concentrations above 125 μM.
Author Contributions
Conceptualization, M.M-M. and A.G.; methodology, M.M-M. and A.G.; formal analysis, M.M-M. and A.C.; investigation, M.M-M. and A.C.; resources, M.M-M. and A.G.; data curation, X.X.; writing—original draft preparation, A.C.; writing—review and editing, M.M-M. and A.G.; visualization, A.C.; supervision, M.M-M.; project administration, M.M-M.; funding acquisition, A.G. and A.C. All authors have read and agreed to the published version of the manuscript.
Funding
This work was supported by Wroclaw Medical University as part of the Subside Funds for Scientific Projects. No. SUBK.A120.22.072. This work was supported by the Wrocław University of Environmental and Life Sciences (Poland) as part of the Ph.D. research program “MISTRZ”, No. N090/0017/22.
Institutional Review Board Statement
Not applicable.
Informed Consent Statement
Not applicable.
Data Availability Statement
Data are available on request from the corresponding author.
Conflicts of Interest
The authors declare no conflicts of interest.
References
- Lebovitz, H.E. Insulin Resistance: Definition and Consequences. Exp Clin Endocrinol Diabetes 2001, 109 Suppl 2, S135-148. [CrossRef]
- Lankarani, M.; Valizadeh, N.; Heshmat, R.; Peimani, M.; Sohrabvand, F. Evaluation of Insulin Resistance and Metabolic Syndrome in Patients with Polycystic Ovary Syndrome. Gynecol Endocrinol 2009, 25, 504–507. [CrossRef]
- Petersen, M.C.; Shulman, G.I. Mechanisms of Insulin Action and Insulin Resistance. Physiol Rev 2018, 98, 2133–2223. [CrossRef]
- Asmann, Y.W.; Stump, C.S.; Short, K.R.; Coenen-Schimke, J.M.; Guo, Z.; Bigelow, M.L.; Nair, K.S. Skeletal Muscle Mitochondrial Functions, Mitochondrial DNA Copy Numbers, and Gene Transcript Profiles in Type 2 Diabetic and Nondiabetic Subjects at Equal Levels of Low or High Insulin and Euglycemia. Diabetes 2006, 55, 3309–3319. [CrossRef]
- Stump, C.S.; Short, K.R.; Bigelow, M.L.; Schimke, J.M.; Nair, K.S. Effect of Insulin on Human Skeletal Muscle Mitochondrial ATP Production, Protein Synthesis, and mRNA Transcripts. Proc Natl Acad Sci U S A 2003, 100, 7996–8001. [CrossRef]
- Tirosh, A.; Potashnik, R.; Bashan, N.; Rudich, A. Oxidative Stress Disrupts Insulin-Induced Cellular Redistribution of Insulin Receptor Substrate-1 and Phosphatidylinositol 3-Kinase in 3T3-L1 Adipocytes. A Putative Cellular Mechanism for Impaired Protein Kinase B Activation and GLUT4 Translocation. J Biol Chem 1999, 274, 10595–10602. [CrossRef]
- Huang, D.-W.; Shen, S.-C. Caffeic Acid and Cinnamic Acid Ameliorate Glucose Metabolism via Modulating Glycogenesis and Gluconeogenesis in Insulin-Resistant Mouse Hepatocytes. Journal of Functional Foods 2012, 4, 358–366. [CrossRef]
- Nair, A.; Preetha Rani, M.R.; Salin Raj, P.; Ranjit, S.; Rajankutty, K.; Raghu, K.G. Cinnamic Acid Is Beneficial to Diabetic Cardiomyopathy via Its Cardioprotective, Anti-Inflammatory, Anti-Dyslipidemia, and Antidiabetic Properties. J Biochem Mol Toxicol 2022, 36, e23215. [CrossRef]
- Hafizur, R.M.; Hameed, A.; Shukrana, M.; Raza, S.A.; Chishti, S.; Kabir, N.; Siddiqui, R.A. Cinnamic Acid Exerts Anti-Diabetic Activity by Improving Glucose Tolerance in Vivo and by Stimulating Insulin Secretion in Vitro. Phytomedicine 2015, 22, 297–300. [CrossRef]
- Huang, D.-W.; Shen, S.-C.; Wu, J.S.-B. Effects of Caffeic Acid and Cinnamic Acid on Glucose Uptake in Insulin-Resistant Mouse Hepatocytes. J Agric Food Chem 2009, 57, 7687–7692. [CrossRef]
- Małodobra-Mazur, M.; Lewoń, D.; Cierzniak, A.; Okulus, M.; Gliszczyńska, A. Phospholipid Derivatives of Cinnamic Acid Restore Insulin Sensitivity in Insulin Resistance in 3T3-L1 Adipocytes. Nutrients 2021, 13, 3619. [CrossRef]
- Furukawa, S.; Fujita, T.; Shimabukuro, M.; Iwaki, M.; Yamada, Y.; Nakajima, Y.; Nakayama, O.; Makishima, M.; Matsuda, M.; Shimomura, I. Increased Oxidative Stress in Obesity and Its Impact on Metabolic Syndrome. J Clin Invest 2004, 114, 1752–1761. [CrossRef]
- Henriksen, E.J.; Diamond-Stanic, M.K.; Marchionne, E.M. Oxidative Stress and the Etiology of Insulin Resistance and Type 2 Diabetes. Free Radic Biol Med 2011, 51, 993–999. [CrossRef]
- Bhatti, J.S.; Bhatti, G.K.; Reddy, P.H. Mitochondrial Dysfunction and Oxidative Stress in Metabolic Disorders - A Step towards Mitochondria Based Therapeutic Strategies. Biochim Biophys Acta Mol Basis Dis 2017, 1863, 1066–1077. [CrossRef]
- Ritz, P.; Berrut, G. Mitochondrial Function, Energy Expenditure, Aging and Insulin Resistance. Diabetes Metab 2005, 31 Spec No 2, 5S67-65S73. [CrossRef]
- Lee, J.-Y.; Lee, D.-C.; Im, J.-A.; Lee, J.-W. Mitochondrial DNA Copy Number in Peripheral Blood Is Independently Associated with Visceral Fat Accumulation in Healthy Young Adults. Int J Endocrinol 2014, 2014, 586017. [CrossRef]
- Zheng, L.D.; Linarelli, L.E.; Liu, L.; Wall, S.S.; Greenawald, M.H.; Seidel, R.W.; Estabrooks, P.A.; Almeida, F.A.; Cheng, Z. Insulin Resistance Is Associated with Epigenetic and Genetic Regulation of Mitochondrial DNA in Obese Humans. Clin Epigenetics 2015, 7, 60. [CrossRef]
- Gianotti, T.F.; Sookoian, S.; Dieuzeide, G.; García, S.I.; Gemma, C.; González, C.D.; Pirola, C.J. A Decreased Mitochondrial DNA Content Is Related to Insulin Resistance in Adolescents. Obesity (Silver Spring) 2008, 16, 1591–1595. [CrossRef]
- Xu, F.X.; Zhou, X.; Shen, F.; Pang, R.; Liu, S.M. Decreased Peripheral Blood Mitochondrial DNA Content Is Related to HbA1c, Fasting Plasma Glucose Level and Age of Onset in Type 2 Diabetes Mellitus. Diabet Med 2012, 29, e47-54. [CrossRef]
- Kelley, D.E.; He, J.; Menshikova, E.V.; Ritov, V.B. Dysfunction of Mitochondria in Human Skeletal Muscle in Type 2 Diabetes. Diabetes 2002, 51, 2944–2950. [CrossRef]
- Ritov, V.B.; Menshikova, E.V.; He, J.; Ferrell, R.E.; Goodpaster, B.H.; Kelley, D.E. Deficiency of Subsarcolemmal Mitochondria in Obesity and Type 2 Diabetes. Diabetes 2005, 54, 8–14. [CrossRef]
- Hoek, J.B.; Cahill, A.; Pastorino, J.G. Alcohol and Mitochondria: A Dysfunctional Relationship. Gastroenterology 2002, 122, 2049–2063. [CrossRef]
- Jové, M.; Salla, J.; Planavila, A.; Cabrero, A.; Michalik, L.; Wahli, W.; Laguna, J.C.; Vázquez-Carrera, M. Impaired Expression of NADH Dehydrogenase Subunit 1 and PPARgamma Coactivator-1 in Skeletal Muscle of ZDF Rats: Restoration by Troglitazone. J Lipid Res 2004, 45, 113–123. [CrossRef]
- Morino, K.; Petersen, K.F.; Dufour, S.; Befroy, D.; Frattini, J.; Shatzkes, N.; Neschen, S.; White, M.F.; Bilz, S.; Sono, S.; et al. Reduced Mitochondrial Density and Increased IRS-1 Serine Phosphorylation in Muscle of Insulin-Resistant Offspring of Type 2 Diabetic Parents. J Clin Invest 2005, 115, 3587–3593. [CrossRef]
- Czarnecka, M.; Świtalska, M.; Wietrzyk, J.; Maciejewska, G.; Gliszczyńska, A. Synthesis and Biological Evaluation of Phosphatidylcholines with Cinnamic and 3-Methoxycinnamic Acids with Potent Antiproliferative Activity. RSC Adv. 2018, 8, 35744–35752. [CrossRef]
- Czarnecka, M.; Świtalska, M.; Wietrzyk, J.; Maciejewska, G.; Gliszczyńska, A. Synthesis, Characterization, and In Vitro Cancer Cell Growth Inhibition Evaluation of Novel Phosphatidylcholines with Anisic and Veratric Acids. Molecules 2018, 23, E2022. [CrossRef]
Figure 1.
Glucose uptake in insulin-resistant 3T3-L1 adipocytes treated with the analyzed compounds CA (cinnamic acid) and 1,2-diCA-PC (1,2-Dicinnamoyl-sn-glycero-3-phosphocholine) at concentrations of 25 µM, 50 µM, and 125 µM. INS- represents basal glucose uptake, INS+ represents insulin-stimulated glucose uptake. * p < 0.05 indicates a statistical difference between experimental cells and IR adipocytes, # p < 0.05 indicates a statistical difference between basal glucose uptake and ISGU.
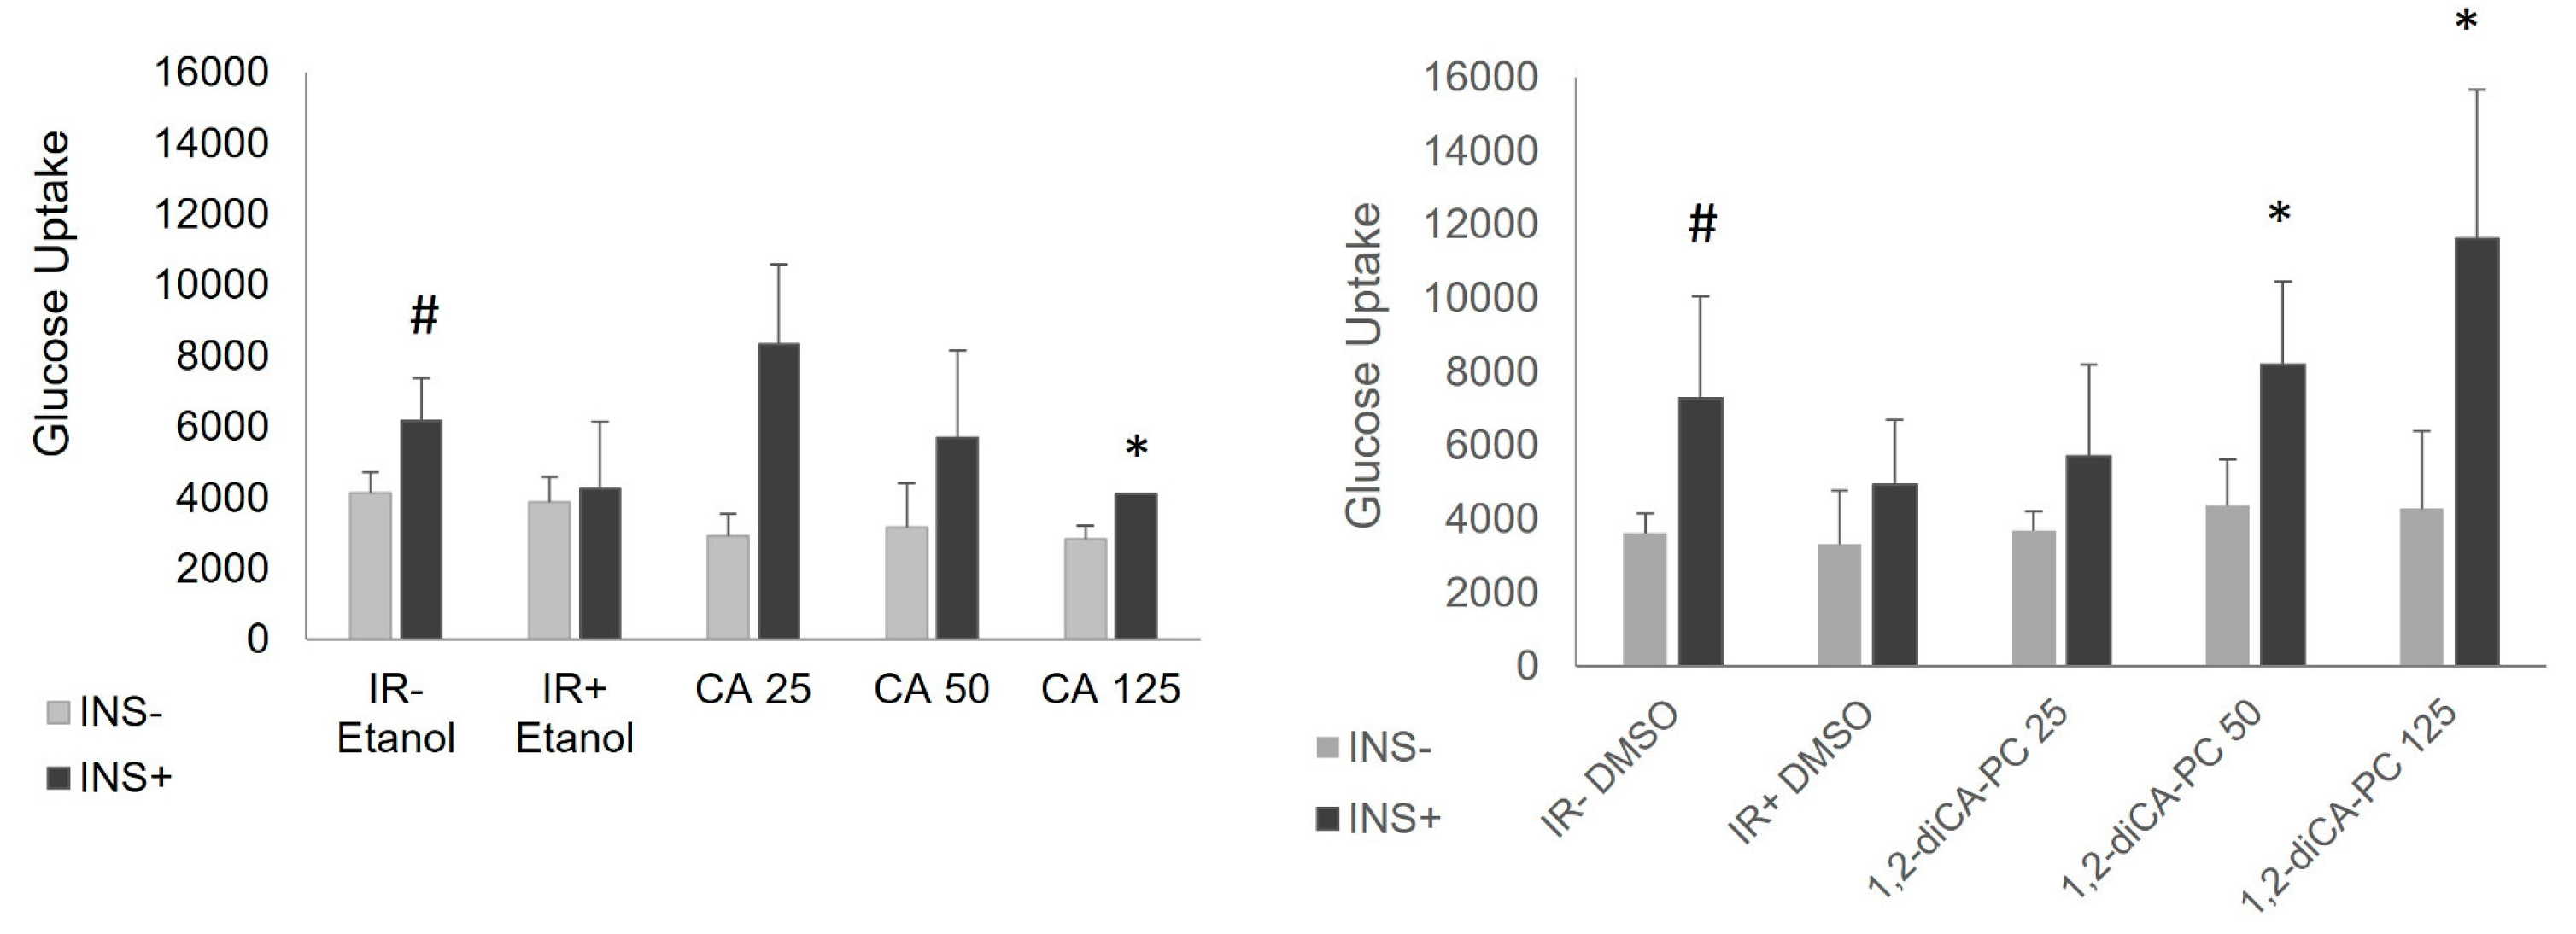
Figure 2.
mtDNA copy number assessed by Real-Time PCR in insulin-resistant adipocytes with proper insulin sensitivity (IR-) and with induced insulin resistance (IR+), as well as in adipocytes treated with (A) cinnamic acid (CA) and (B) 1,2-diCA-PC at appropriate concentrations (25 µM, 50 µM, and 125 µM). (C) Correlation between mtDNA copy number and ISGU observed for 1,2-diCA-PC (125 µM). * p < 0.05.
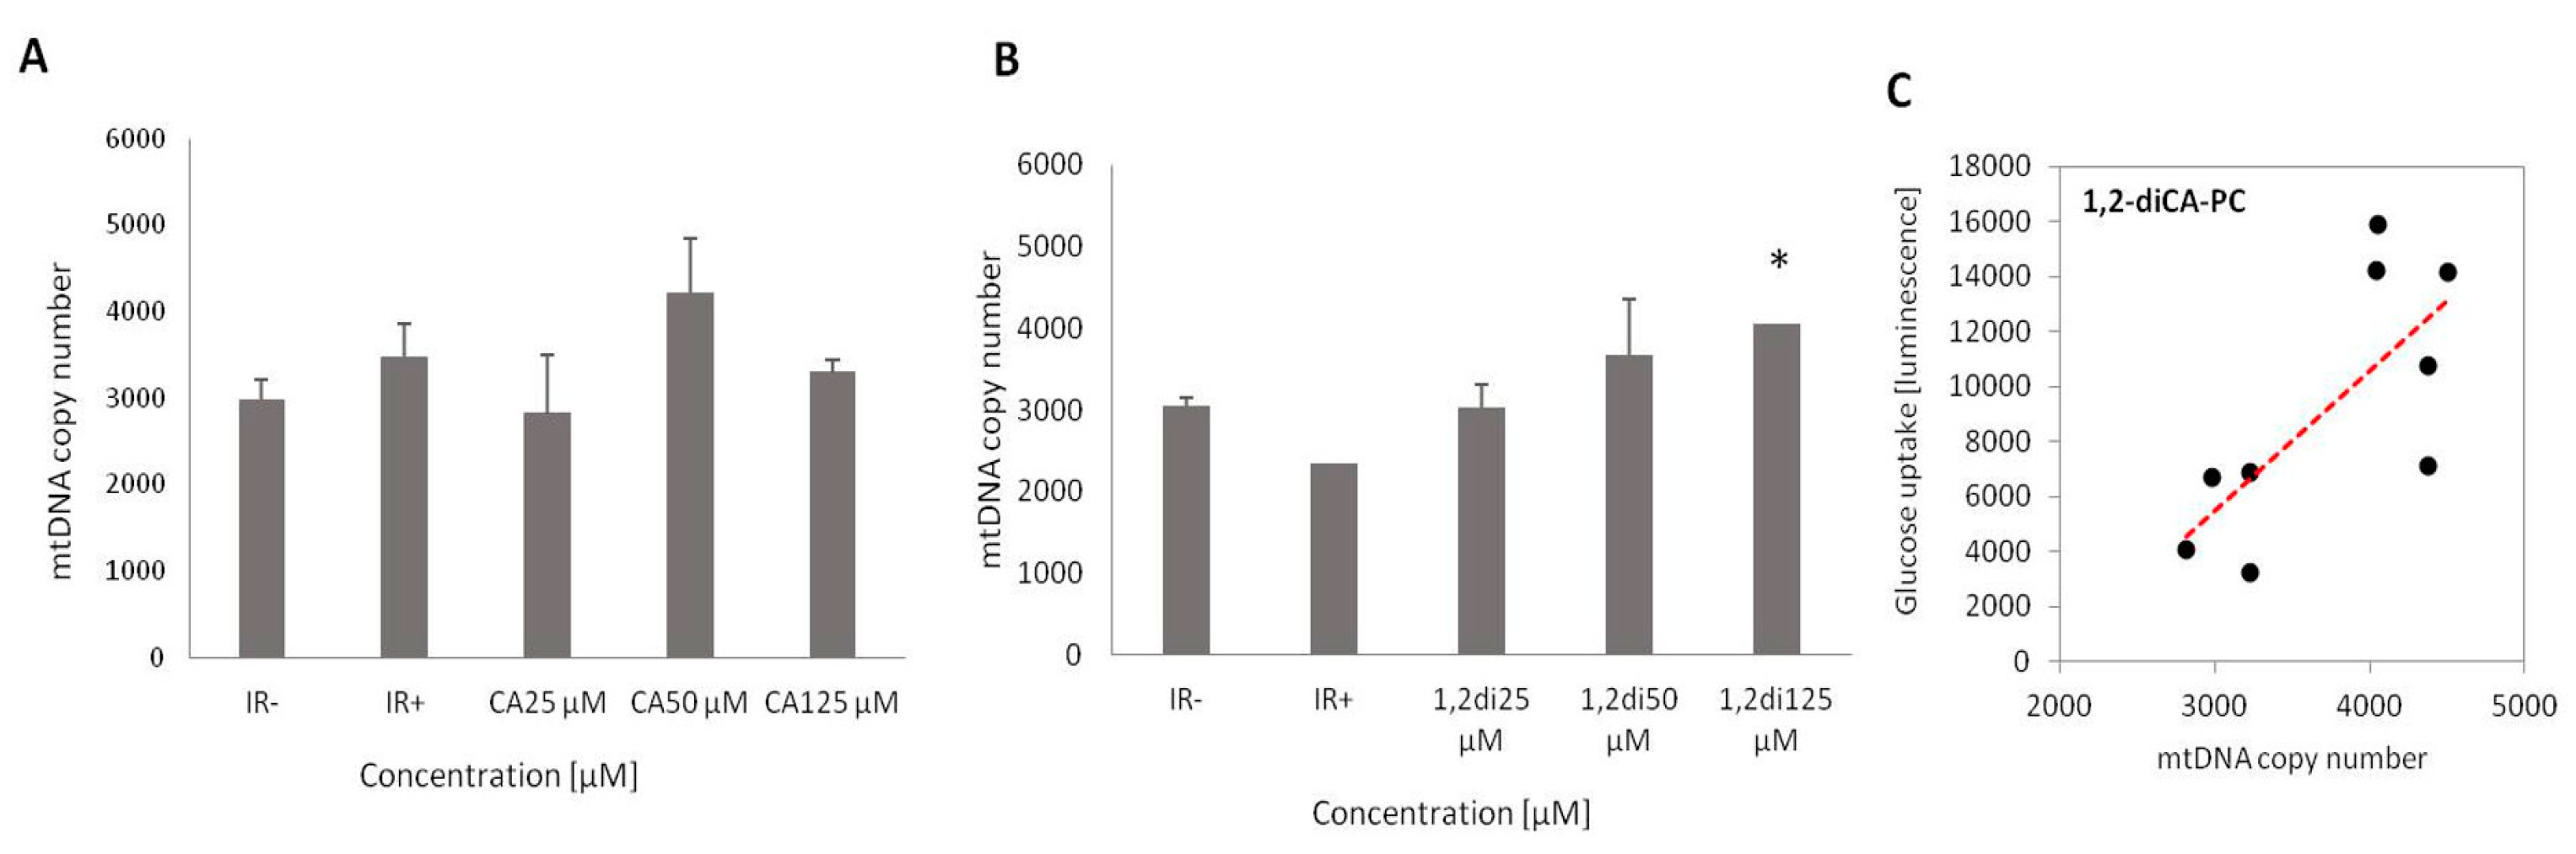
Figure 3.
The expression of genes encoded by mtDNA in control adipocytes. Two types of control cells are compared: those treated with ethanol (A) and those treated with DMSO (B).
Figure 3.
The expression of genes encoded by mtDNA in control adipocytes. Two types of control cells are compared: those treated with ethanol (A) and those treated with DMSO (B).
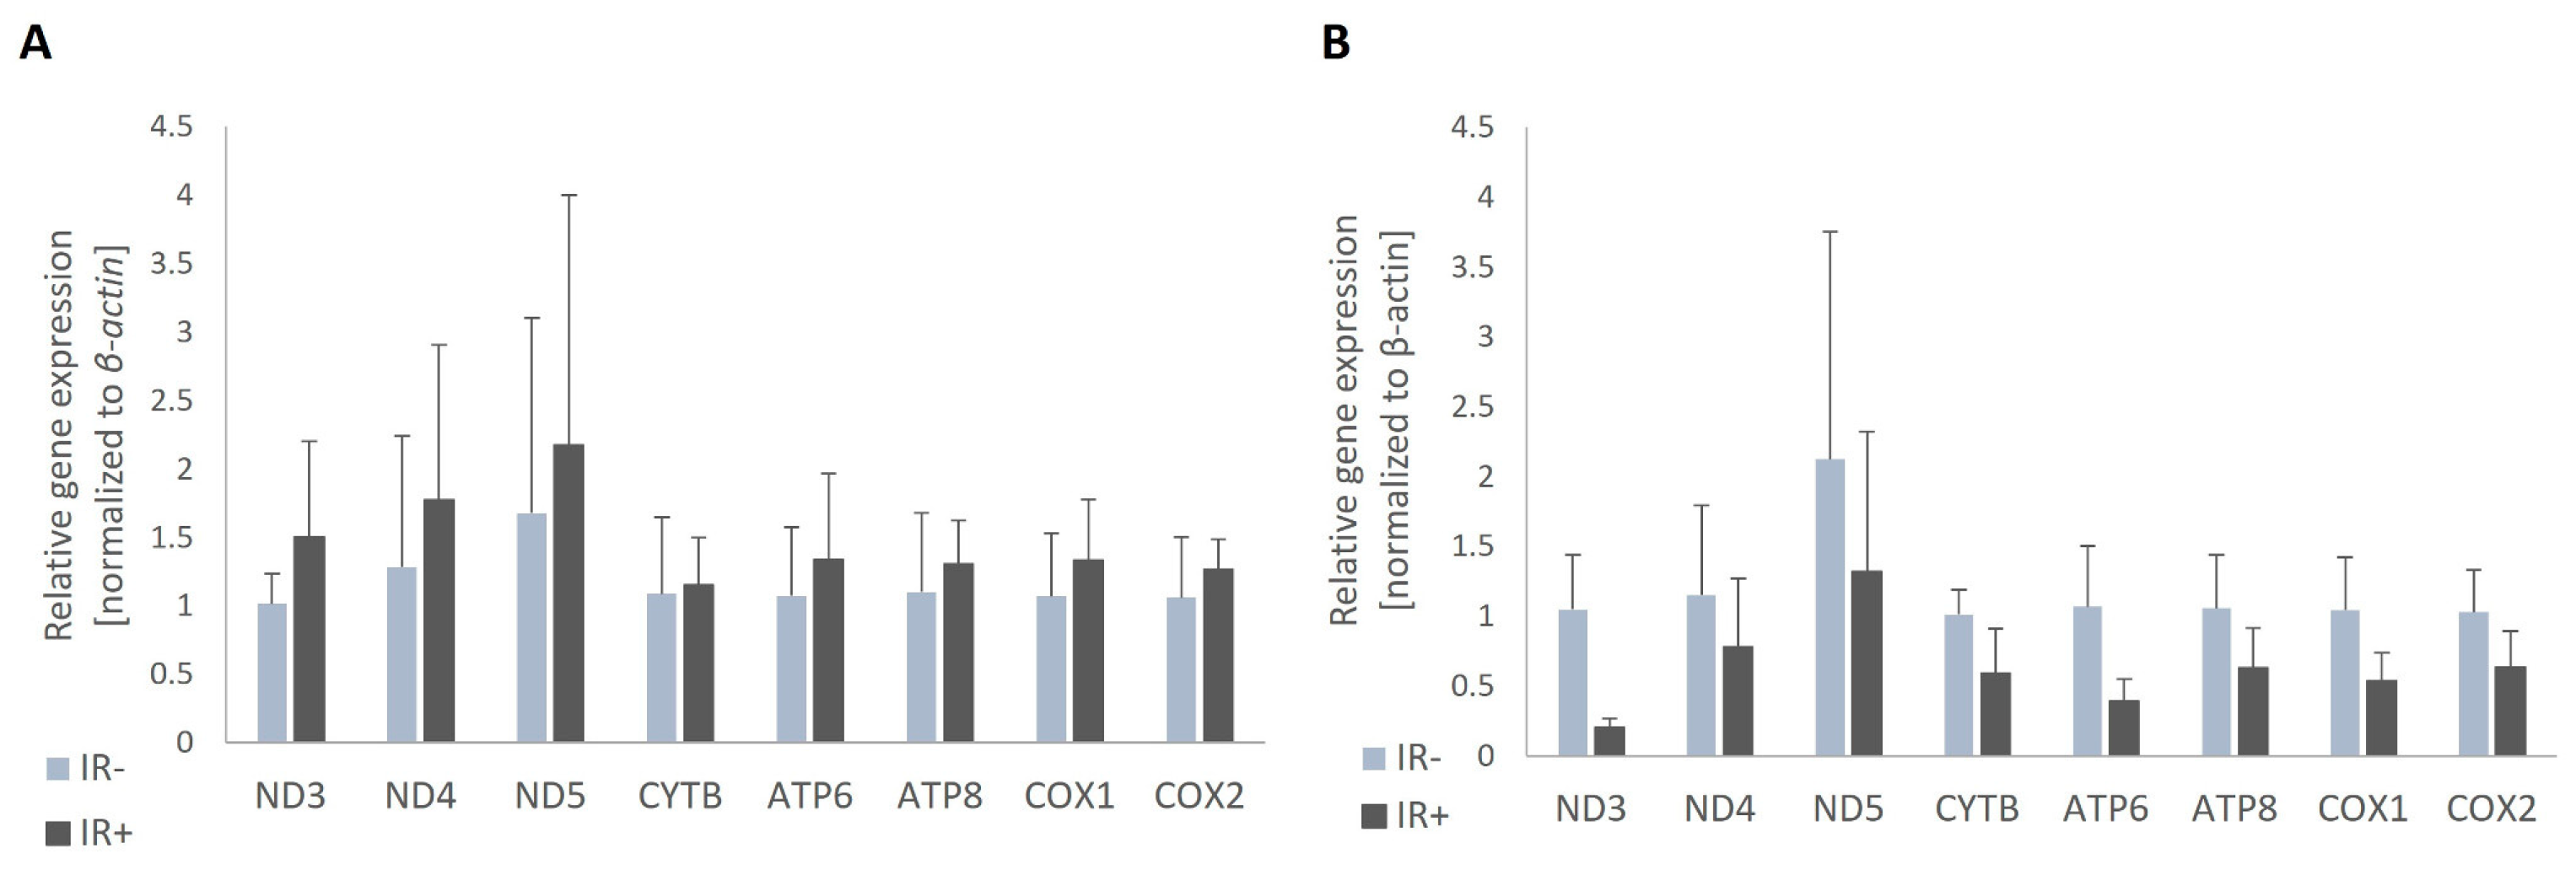
Figure 4.
The expression of mitochondrial genes in insulin-resistant adipocytes treated with cinnamic acid at three concentrations (25 µM, 50 µM, and 125 µM) compared to insulin-resistant control adipocytes (IR+).
Figure 4.
The expression of mitochondrial genes in insulin-resistant adipocytes treated with cinnamic acid at three concentrations (25 µM, 50 µM, and 125 µM) compared to insulin-resistant control adipocytes (IR+).
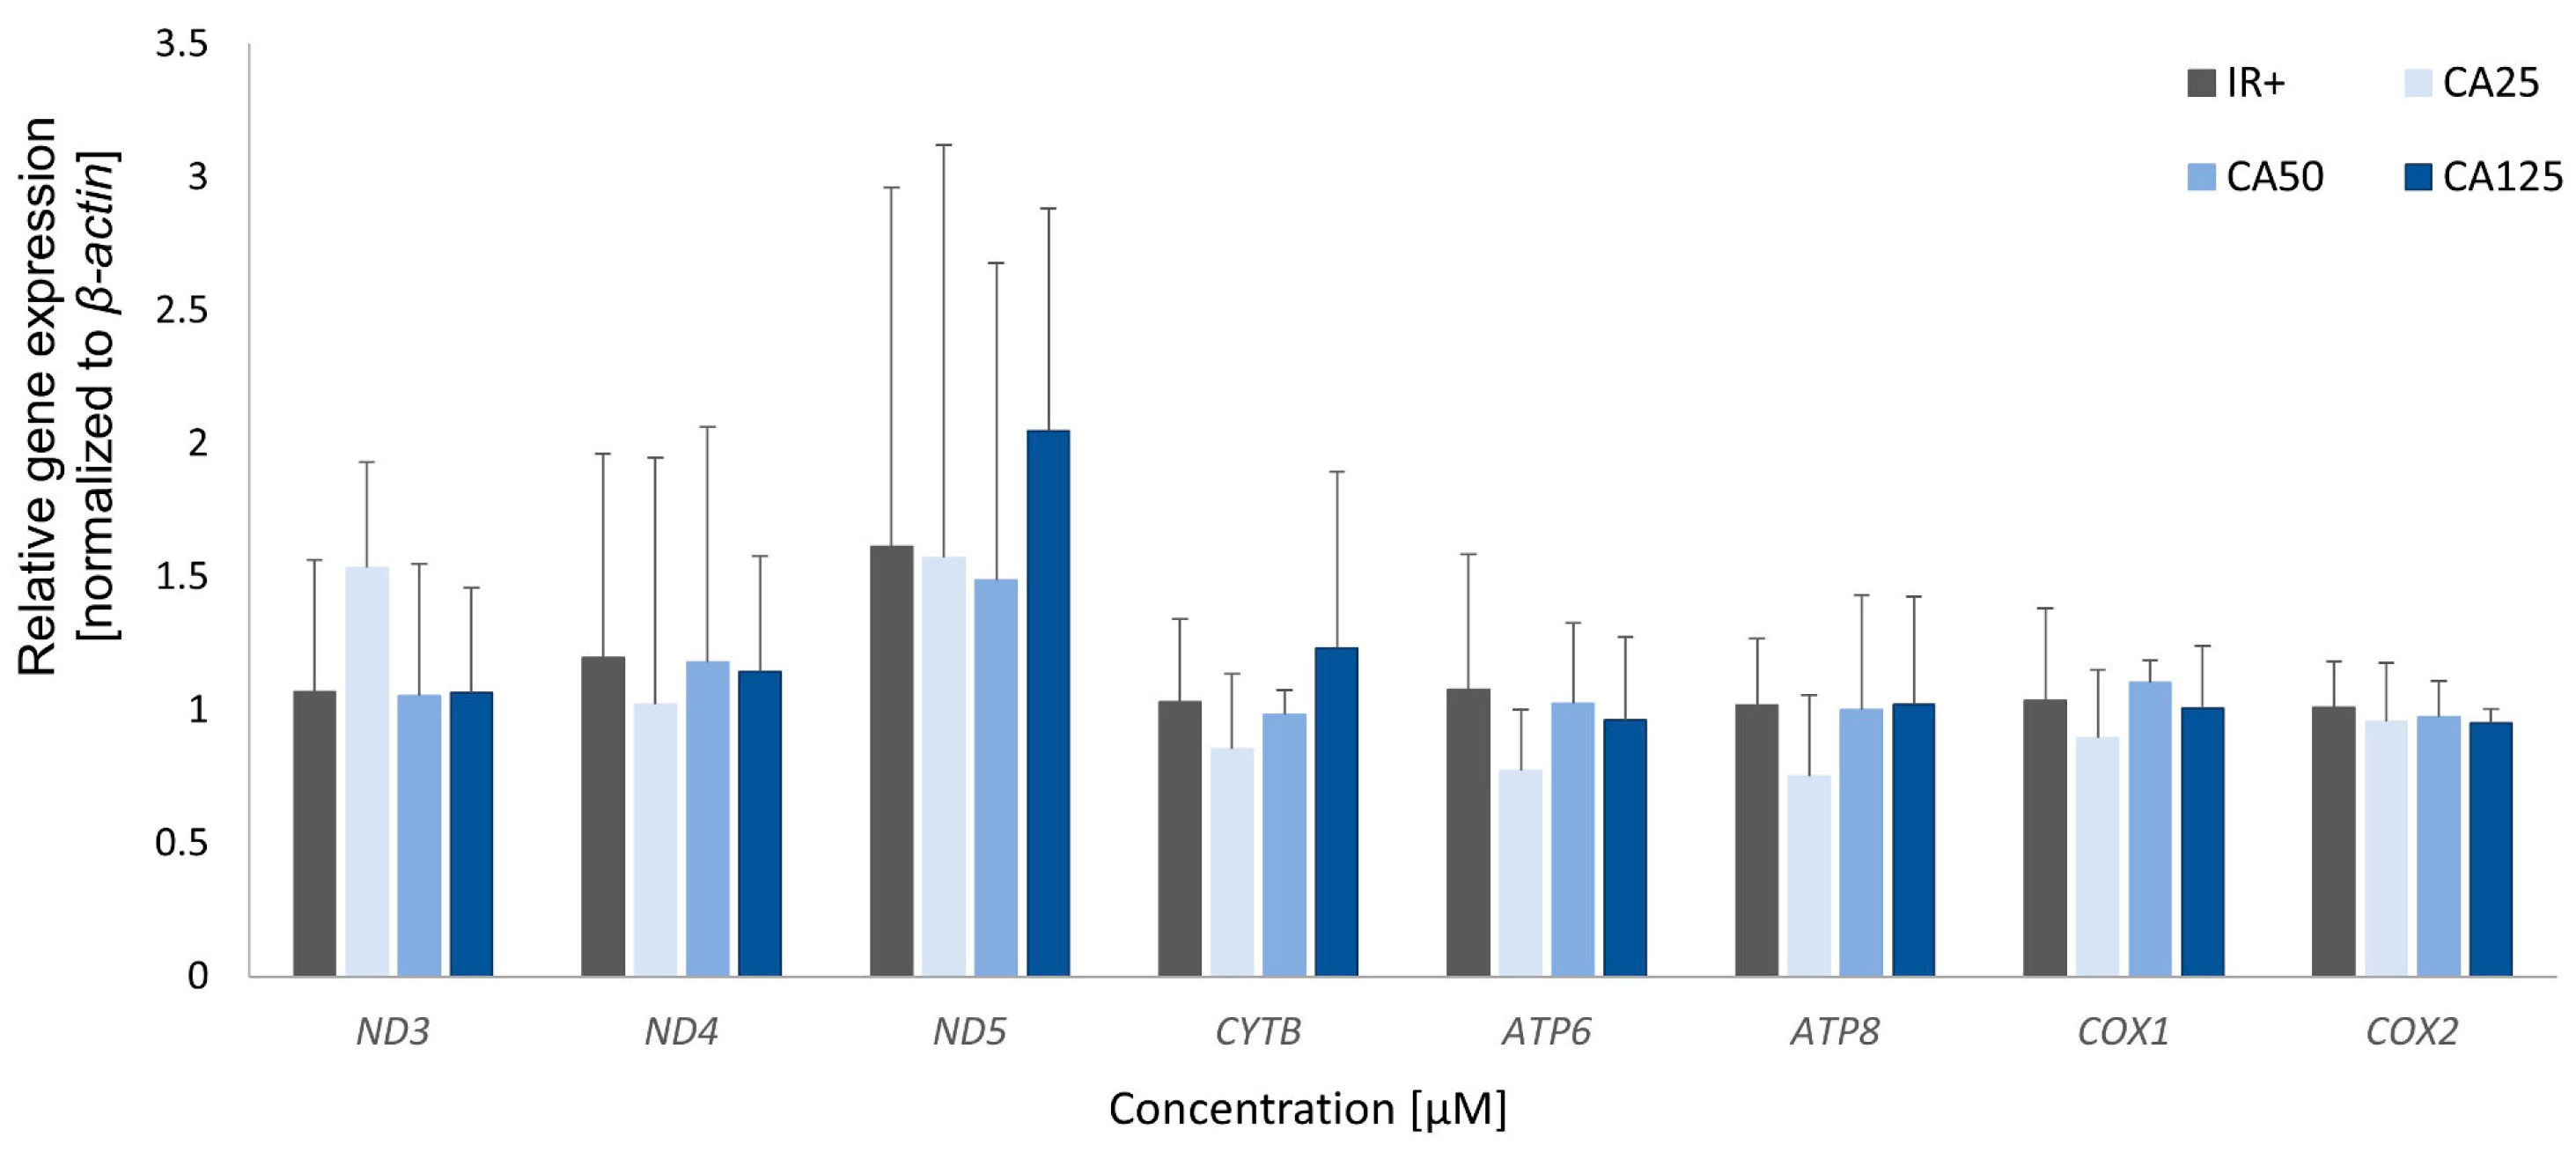
Figure 5.
The expression of mitochondrial genes in insulin-resistant adipocytes treated with 1,2-diCA-PC at three concentrations (25 µM, 50 µM, and 125 µM) compared to insulin-resistant control adipocytes (IR+). * p < 0.05.
Figure 5.
The expression of mitochondrial genes in insulin-resistant adipocytes treated with 1,2-diCA-PC at three concentrations (25 µM, 50 µM, and 125 µM) compared to insulin-resistant control adipocytes (IR+). * p < 0.05.
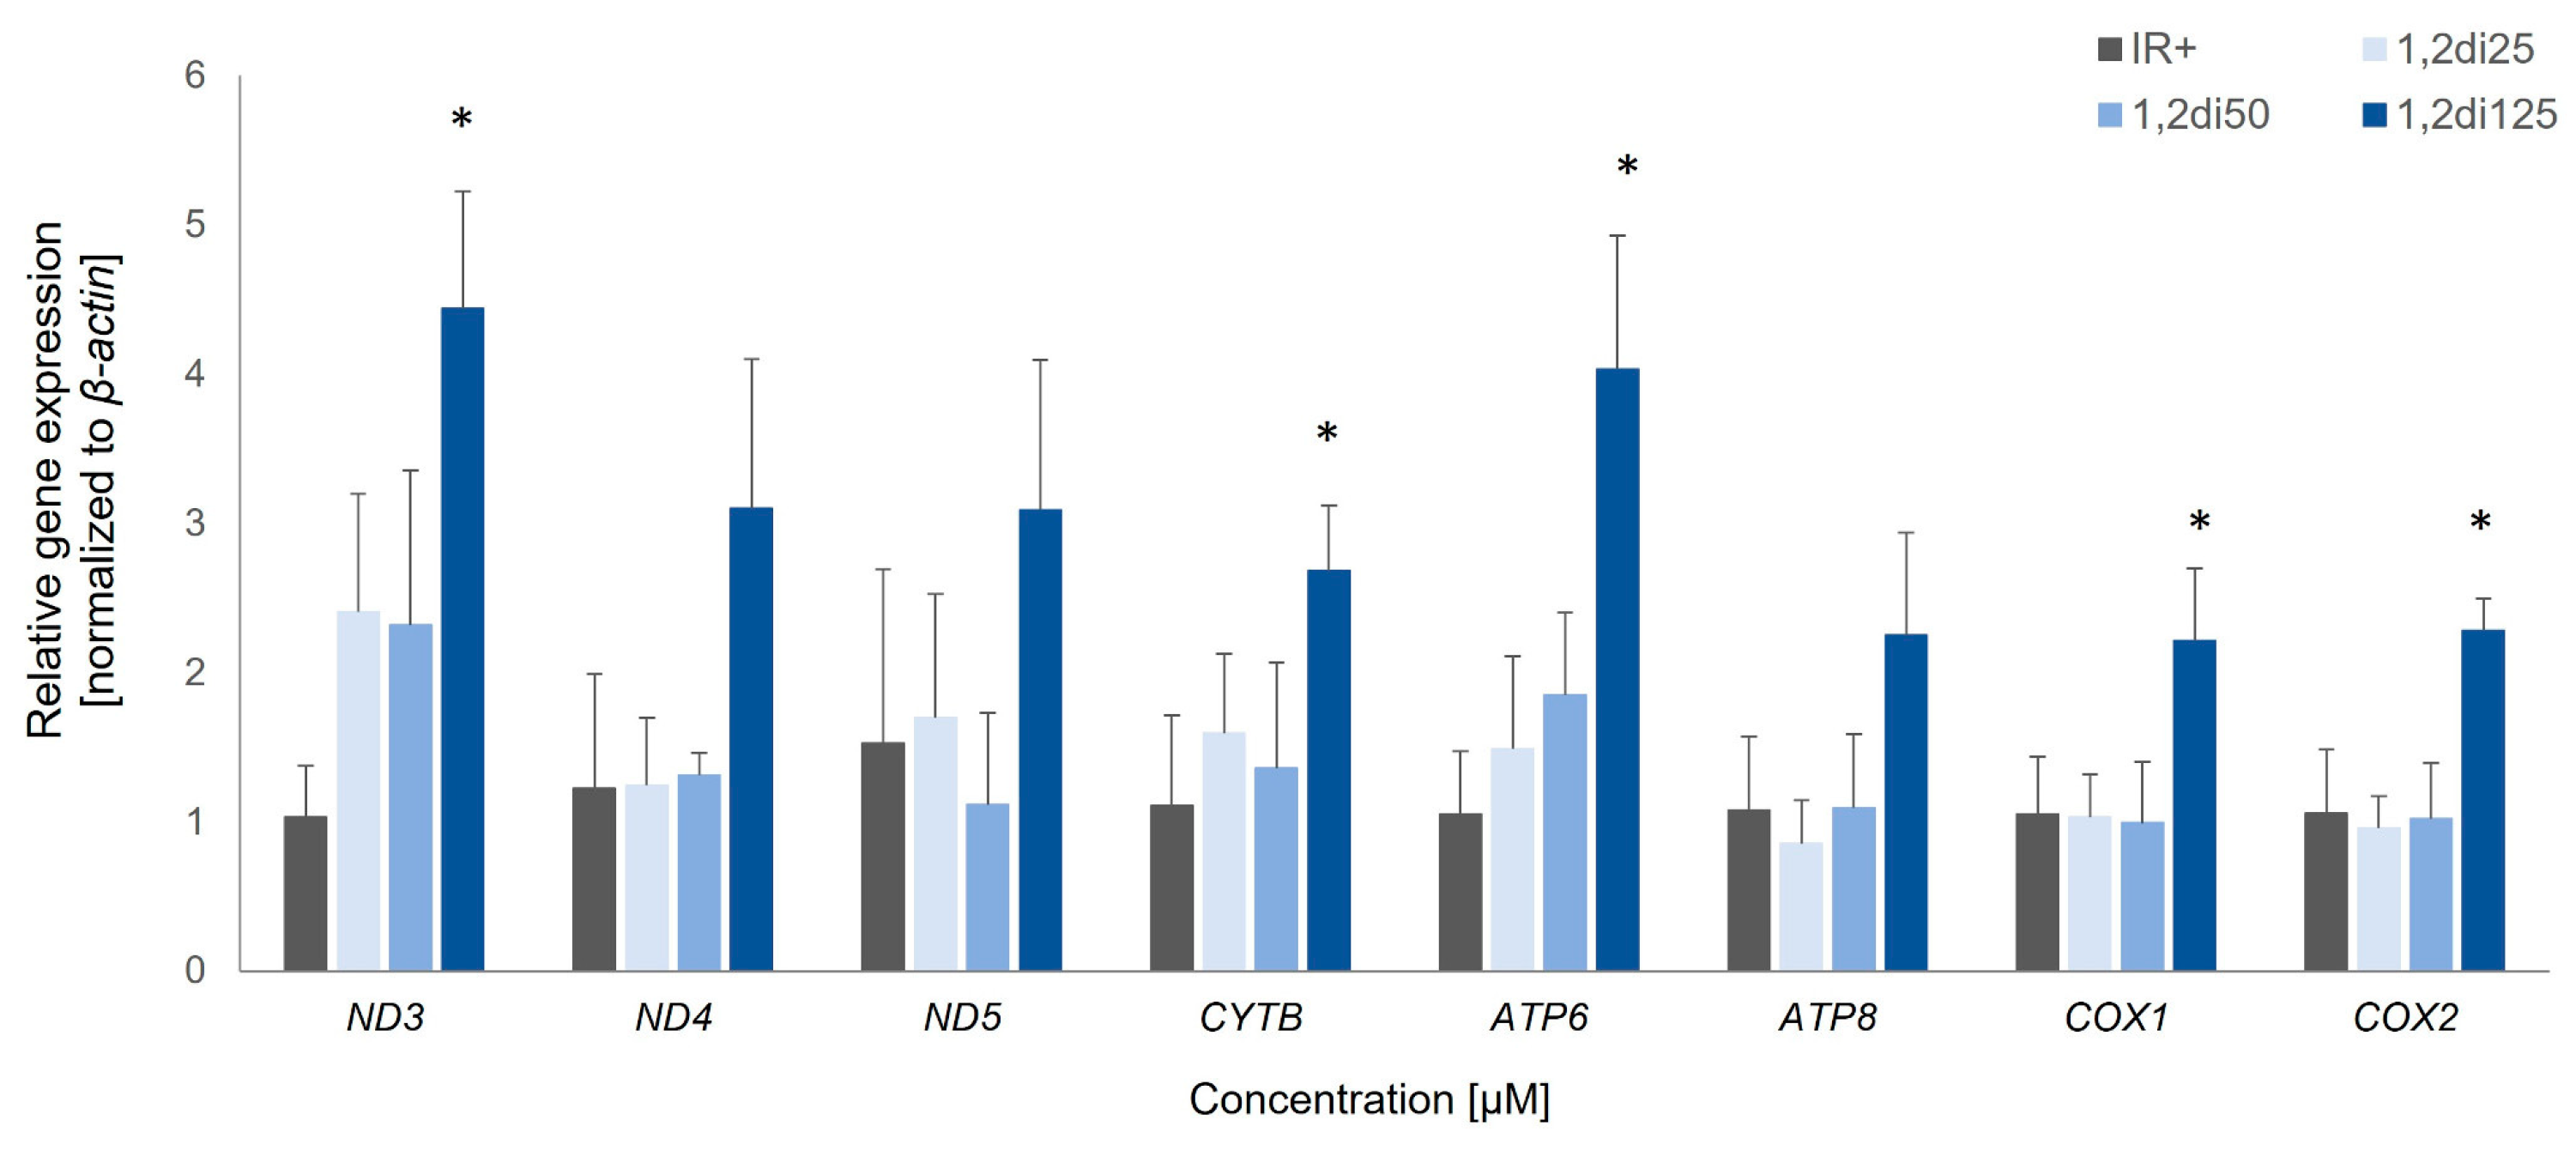
Figure 6.
Chemical structure of tested compounds. CA – cinnamic acid, 1,2-diCA-PC – 1,2-Dicinnamoyl-sn-glycero-3-phosphocholine.
Figure 6.
Chemical structure of tested compounds. CA – cinnamic acid, 1,2-diCA-PC – 1,2-Dicinnamoyl-sn-glycero-3-phosphocholine.
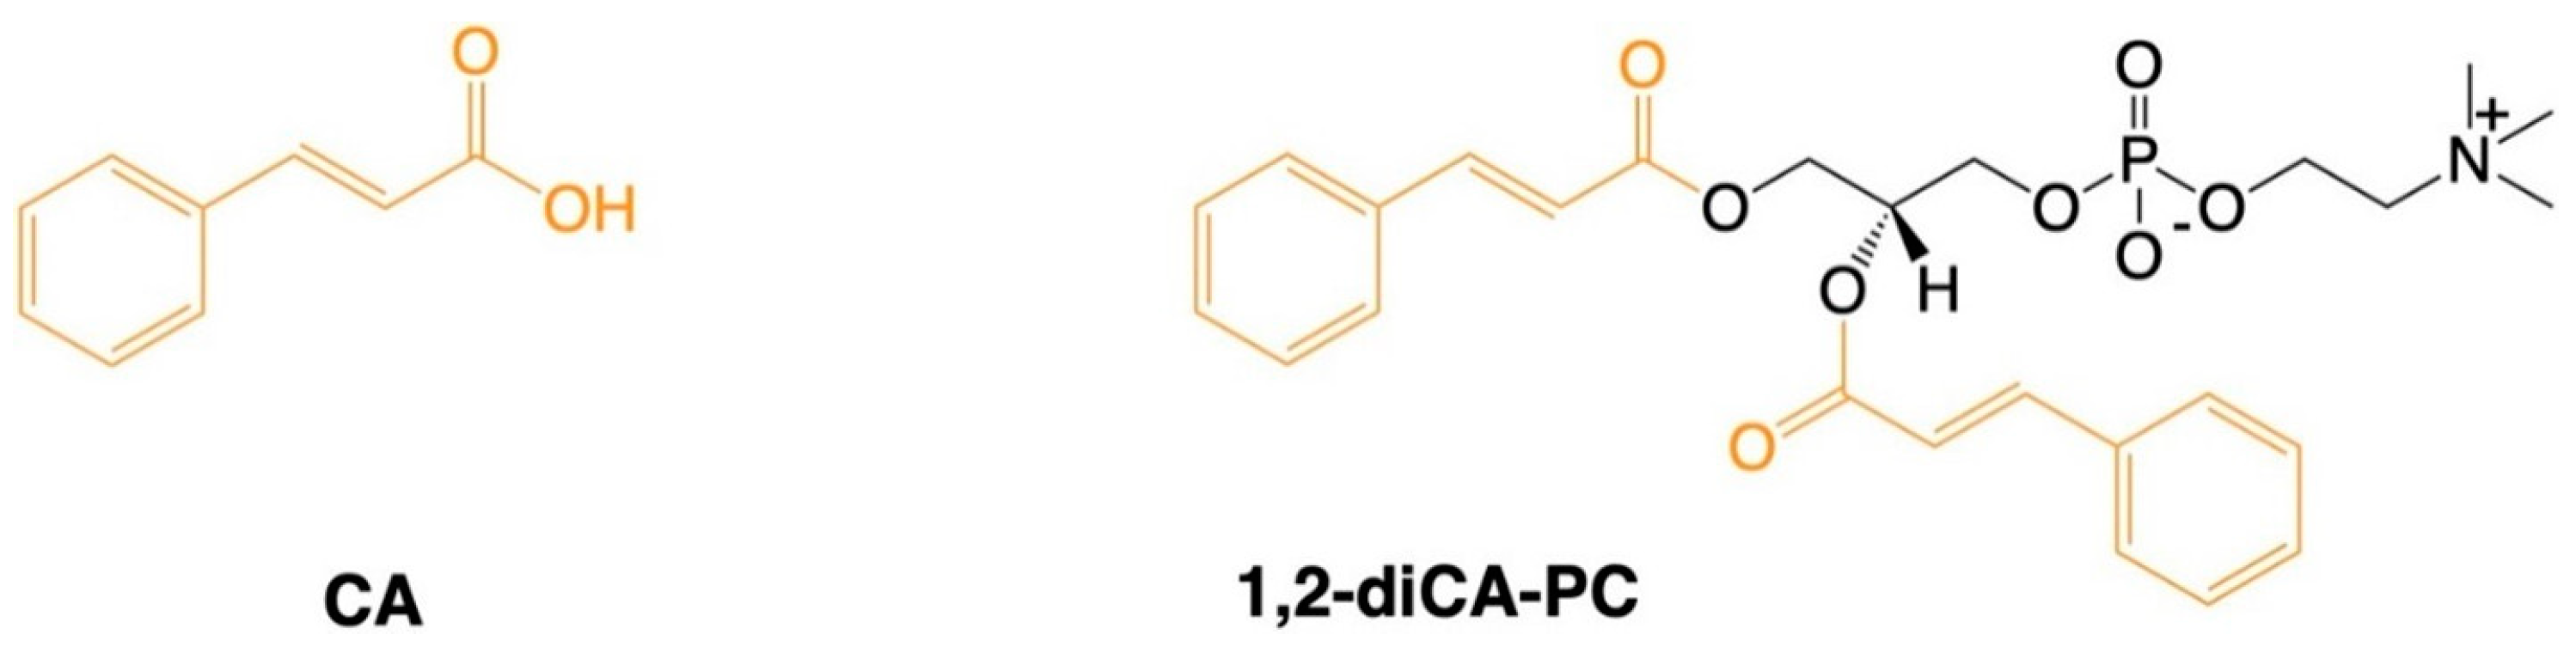

Table 1.
The sequences of primers used for mitochondrial gene expression analysis.
| Gene | Official full name of gene | Primer’s sequence (5’→3’) | R2 value |
|---|---|---|---|
| Nd3 | NADH dehydrogenase subunit 3 | F*: TAACCTGTACACTGTTATCTTC | 0,99 |
| R*: GAGTACAGATTTATTTGGGGG | |||
| Nd4 | NADH dehydrogenase subunit 4 | F: TCCTCAGTTAGCCACATAGC | 0,99 |
| R: ATAAGTGGGAAGACCATTTGAA | |||
| Nd5 | NADH dehydrogenase subunit 5 | F: CCCATGACTACCATCAGCAA | 0,99 |
| R: ATAATGTGGTTAGGGCTCCG | |||
| Cytb | Cytochrome b | F: CATACGAAAAACACACCCATTA | 0,99 |
| R: GTAGTGTATGGCTAAGAAAAGA | |||
| Atp6 | ATP synthase 6 | F: TTTACACCTACTACCCAACTAT | 0,99 |
| R: GGAATTAGTGAAATTGGAGTTC | |||
| Atp8 | ATP synthase 8 | F: GCCACAACTAGATACATCAAC | 0,98 |
| R: GAAGGTGCCAGTGGGAATG | |||
| Cox1 | Cytochrome c oxidase 1 | F: TATCTACTATTCGGAGCCTGA | 0,99 |
| R: GCATGGGCAGTTACGATAAC | |||
| Cox2 | Cytochrome c oxidase 2 | F: GAAGACCTATGCTTTGATTCAT | 0,99 |
| R: GGATTGGAAGTTCTATTGGCA | |||
| Actb | Beta-actin | F: CGTTGACATCCGTAAAGACC | 0,99 |
| R: CTAGGAGCCAGAGCAGTAAT |
* F: Forward primer; R: Reverse primer.
Disclaimer/Publisher’s Note: The statements, opinions and data contained in all publications are solely those of the individual author(s) and contributor(s) and not of MDPI and/or the editor(s). MDPI and/or the editor(s) disclaim responsibility for any injury to people or property resulting from any ideas, methods, instructions or products referred to in the content. |
© 2024 by the authors. Licensee MDPI, Basel, Switzerland. This article is an open access article distributed under the terms and conditions of the Creative Commons Attribution (CC BY) license (http://creativecommons.org/licenses/by/4.0/).
Copyright: This open access article is published under a Creative Commons CC BY 4.0 license, which permit the free download, distribution, and reuse, provided that the author and preprint are cited in any reuse.


