Submitted:
01 August 2024
Posted:
02 August 2024
You are already at the latest version
Abstract
Type 2 diabetes mellitus (T2DM) is a global health concern driven by factors such as obesity, sedentary behavior, and poor diet. This study uses data from the 2017-18 Bangladesh Demographic and Health Survey (BDHS) to analyze regional and individual predictors of diabetes and predi-abetes. Employing a Bayesian multinomial mixed-effects model, we account for regional varia-bility and individual factors like age, gender, BMI, residence, wealth, education, employment, and hypertension. Our results indicate significant regional differences and associations between de-mographic and health-related factors with diabetes risk. Younger individuals and those with higher BMI are more likely to be diabetic, while hypertension significantly increases diabetes risk. We applied machine learning (ML) models, including logistic regression, decision trees, k-nearest neighbor, linear discriminant analysis, and random forest, to classify diabetic status using these predictors, assessing their accuracy through 10-fold cross-validation. Logistic regression and linear discriminant analysis demonstrated robust performance across various response distributions. Simulation studies further examined the impact of different response distributions on model performance, revealing significant differences in classification accuracies. This approach of esti-mating parameters with a Bayesian model, applying ML for prediction, and conducting simulation studies to explore various scenarios highlights the importance of integrating these methodologies for effective diabetes prediction, providing insights for public health strategies to mitigate T2DM's impact.
Keywords:
Bayesian statistics
; machine learning
; mixed effect model
; simulation
; diabetes prediction
1. Introduction
Type 2 diabetes mellitus (T2DM) is a chronic metabolic disorder marked by insulin resistance and relative insulin deficiency. It has emerged as a global epidemic, significantly affecting public health and economic systems worldwide. The prevalence of T2DM has been rising steadily, with factors such as obesity, sedentary lifestyles, and poor dietary habits being major contributors. These factors contribute to metabolic disorders and insulin resistance, which are key elements in the development of T2DM. A study highlights the relationship between lifestyle factors and diabetes, emphasizing the importance of managing body weight and increasing physical activity to mitigate the risk of T2DM [1]. T2DM is associated with severe complications including cardiovascular diseases, neuropathy, nephropathy, and retinopathy, leading to increased morbidity and mortality rates [2,3]. The economic burden of T2DM is substantial due to direct medical costs and indirect costs related to loss of productivity and disability [4,5]. Effective management strategies, including lifestyle interventions, pharmacotherapy, and regular monitoring, are crucial to mitigate its impact. Recent advances in medical research emphasize the importance of early detection and personalized treatment approaches to improve patient outcomes and reduce the healthcare burden associated with T2DM [6].
Recent advancements in diabetes research and management have increasingly focused on the application of machine learning (ML) and artificial intelligence to improve predictive accuracy and patient outcomes. Several studies have explored various methodologies and their impacts, providing a comprehensive understanding of the potential benefits and limitations of these technologies. Islam et al. developed a Clinical Decision Support System (CDSS) aimed at predicting T2DM using ML algorithms [7]. They employed algorithms such as decision trees (DT), random forest (RF), and support vector machines (SVM) to enhance predictive accuracy. Their findings underscore the potential of ML in early diabetes detection, thereby improving patient outcomes through timely intervention and personalized treatment plans. Conversely, Tasin et al. focused on the application of ML and explainable AI for diabetes prediction, emphasizing the importance of interpretability in AI models to ensure that healthcare professionals can understand and trust the predictions [8]. By utilizing algorithms like logistic regression (LR), DT, and gradient boosting machines (GBM), they developed robust predictive models, balancing accuracy and explainability essential for practical deployment in clinical settings.
The prevalence of T2DM has been rapidly increasing over the past few decades in Bangladesh. The lifestyle of the population, including urbanization, dietary shifts, and reduced physical activity, has contributed to this rise [9]. A recent systematic review reveals that approximately 7.1 million people in Bangladesh are suffering from this disease [10]. Other studies have indicated that the prevalence of T2DM in Bangladesh has reached concerning levels, affecting both urban and rural populations [11].
Numerous studies have been conducted on Bangladesh Demographic and Health Survey (BDHS) dataset [12,13] and Pima Indian diabetes dataset [7,8,14] to predict diabetes in Bangladesh using ensemble and ML approaches. A recent study indicated a significant variation in T2DM prevalence among different divisions in Bangladesh, using a quantile regression approach to identify risk factors for it [13]. Islam et al. used the Bagged CART algorithm to analyze and predict diabetes with the help of the Pima Indian Diabetes Dataset [12]. This study employed SVM, RF, LR, linear discriminant analysis (LDA), k-nearest neighbor (KNN), bagged classification, and regression tree (Bagged CART) to predict diabetes in the ML framework, achieving the highest accuracy of 94.3% from the Bagged CART model. However, the binary response variables in this study exhibited an imbalanced distribution, with approximately 0.92 and 0.8 for the non-diabetic and diabetic classes, respectively.
In this paper, we employed a Bayesian multinomial mixed-effects model to capture both fixed and random effects, accounting for the hierarchical structure of the data and regional variations. This approach allows for a more nuanced understanding of regional variability by treating it as a random effect, which contrasts with the fixed effects commonly used in previous literature. To obtain reliable and accurate parameter estimates, we utilized weakly informative priors, which provide a balance between data-driven insights and prior knowledge without imposing overly restrictive assumptions. For classifying and predicting diabetic status, we employed several ML models, including LR, DT, KNN, LDA, and RF. To evaluate the robustness and predictive accuracy of our models, we conducted comprehensive simulation studies with different distributions of the response variable. These simulations revealed how prediction accuracy varies across different models, highlighting the strengths and limitations of each approach under varying conditions. This integrated methodology underscores the importance of combining Bayesian and ML techniques to enhance diabetes prediction and provides valuable insights for developing effective public health strategies.
2. Materials and Methods
2.1. Study Design
In this study, we considered the data from the 2017-18 BDHS dataset, carried out in collaboration with the Ministry of Health and Welfare, Mitra and Associates, NIPORT, and USAID [15]. This nationwide survey utilized a two-stage stratified sampling design. Initially, 672 primary sampling units (PSUs) were selected, comprising 423 clusters from rural areas and 249 from urban areas. In the second stage, 30 households were systematically chosen from each PSU, leading to a total of 4864 households eligible for biomarker measurements from the initially selected 20,160 families. The study included 14,704 individuals (6691 men and 8013 women) aged 18 years or older. Due to the incompleteness of the responses, we selected a dataset containing information on 12,278 individual members (83.5%) that are clustered within the Divisions (Dhaka, Khulna, Chattogram, Rangpur, Sylhet, Barisal, Mymensingh, Rajshahi) of Bangladesh. The rationale of excluding the incomplete cases is to ensure that the analysis is based on high-quality data, which can lead to more reliable and valid results. Incomplete responses can introduce noise and uncertainty, potentially compromising the integrity of the findings. Modeling with complete cases is a common practice in epidemiological and health research when dealing with large datasets. This approach is consistent with previous studies that aim to maintain the quality and reliability of the data analysis. Schafer and Graham indicated that complete case analysis remains a standard practice in many fields, provided the assumptions about missingness are carefully considered [16]. The variable selection for the independent variables was carried out based on their availability in the survey. In the list of predictor variables, demographics such as age, sex, educational status, and residential status are selected. We also considered socioeconomic status (economic and employment status), and health status (BMI and hypertension) of individual household members. The response variable Diabetic status is trinary that indicates whether an individual is classified as diabetic or not as well as prediabetic, based on their plasma blood glucose level. If the plasma blood glucose level is 5.6 to 6 mmol/dl, the individual is labeled "non-diabetic" and if the plasma blood glucose level is 6.1 to 6.9 mmol/dl then the individual is labeled as "prediabetic", again if the plasma blood glucose level is greater than 7 mmol/dl, the individual is labeled "diabetic" [17]. The predictor variables and categories are Divisions (Dhaka, Khulna, Chattogram, Rangpur, Sylhet, Barisal, Mymensingh, Rajshahi), Residence (Urban, Rural), Wealth (Richest, Rich, Middle, Poor, Poorest), Gender (Male, Female), Age (24 or Less : Adult group, 25-44: Young group, 45-64: Middle Age group, 65 or More: Old group [18]), Education (No Education, Primary, Secondary, Higher), Employment (Yes: who has formal job, No: otherwise), BMI (Underweight: less than 18.5 kg/m2, Normal: 18.5–24.9 kg/m2, Overweight: 25–29 kg/m2, Obese: more than 30 kg/m2), Hypertension (Yes: systolic blood pressure ≥140 mmHg or diastolic blood pressure ≥ 90 mmHg, No: otherwise).
Table 1 provides the univariate distribution of demographic, socioeconomic, and health profile of 12,278 individuals from the 2017-18 BDHS. The data are distributed across eight divisions: Barisal (10.4%), Chittagong (13.5%), Dhaka (13.6%), Khulna (13.6%), Mymensingh (11.5%), Rajshahi (13%), Rangpur (12.6%), and Sylhet (11.9%). The population is predominantly rural (63.8%) compared to urban (36.2%). Socioeconomic status, as indicated by wealth quintiles, shows a relatively even distribution, with the richest (22.5%) slightly outnumbering other categories. Gender distribution reveals more males (56.5%) than females (43.5%). Age distribution highlights that the majority of the population falls into the middle age group (44.5%), followed by old people (25.4%), young (20.5%), and adults (9.6%). Educational attainment varies, with secondary education (30.3%) being the most common, followed by higher education (28.7%), no education (24.5%), and primary education (16.5%). Employment status shows that a significant portion of the population is not working (60.7%). Health indicators reveal that the majority have normal BMI (59.3%), with fewer individuals classified as underweight (4.4%), overweight (18.8%), and obese (17.4%). A significant proportion of the population suffers from hypertension (75.8%). Diabetic status indicates that most individuals are non-diabetic (75.2%), while diabetic and prediabetic statuses are equally distributed (12.4% each). The proportion test p-values (<0.001) for each variable confirm that the distributions across these categories are significantly unequal.
Table 2 reveals the bivariate relationship of the predictors among different levels of the response variable. The detailed examination of the dataset provides insightful revelations into the distribution of diabetic and prediabetic statuses across various demographic, socioeconomic, and health-related factors. Within the divisions, Dhaka exhibits the highest proportion of diabetic individuals (21.7%) and prediabetic individuals (19.7%), indicating a significant regional disparity when compared to other divisions like Rangpur, which has the lowest proportion of diabetic (6.5%) and prediabetic (8.7%) individuals. This result motivates to consider the division as cluster in further analysis. The residence data highlights a notable difference between urban and rural areas, with urban residents showing a higher prevalence of diabetes (16.3%) compared to their rural counterparts (10.3%). Socioeconomic status, as reflected by wealth quintiles, reveals that the richest individuals have the highest rates of diabetes (21.9%) and prediabetes (16.6%), while the poorest groups exhibit the lowest diabetic rates (7.5%). Gender distribution shows similar rates of diabetes and prediabetes between males and females. Age-wise, the middle age group has the highest prevalence of diabetes (16.6%), while the adult group has the lowest (8.2%). Educational attainment presents an interesting pattern where individuals with higher education levels have slightly higher diabetic rates (13.5%) compared to those with no education (11.7%). Employment status indicates that those not working have a higher prevalence of diabetes (14.9%) compared to those who are employed (10.8%). BMI and hypertension status are significant predictors, with obese individuals and those with hypertension showing markedly higher rates of diabetes (22.5% and 17.7%, respectively) compared to their normal-weight and non-hypertensive counterparts. These findings are statistically significant with p-values < 0.001 across all variables, underscoring the critical associations between these factors and the diabetic and prediabetic statuses in the Bangladeshi population.
2.2. Bayesian Multinomial Mixed Effect Model
We applied Bayesian multinomial mixed-effects model considering the division as random effect and the other predictors as fixed effect to identify their effect (odds ratio) on the diabetic status. This is crucial in capturing the intrinsic variability within and between clusters, leading to more accurate and robust inference. Bayesian methods offer significant advantages in this context, including the ability to incorporate prior knowledge into the analysis and to provide full probabilistic interpretations of model parameters. These methods are increasingly recommended in epidemiological and public health research for their flexibility and comprehensiveness [19,20]. The multinomial logistic component of the model is appropriate for the trinary response variable (diabetic, prediabetic, and non-diabetic) in our dataset. This allows us to simultaneously model the probabilities of multiple outcome categories, addressing the complexity of diabetes status classification in the population. The mixed-effects component, on the other hand, accounts for the hierarchical structure of the data, such as individuals nested within divisions, thus capturing both within-division and between-division variability effectively. For the predictor variables, we considered weakly informative prior from the literature [21]. For the diabetic response, we used prior distributions for BMI [22], age, gender, and employment status [23] from the literature, where the researchers elucidate the differential impacts of these factors on diabetes prevalence. For socioeconomic factors such as residence and wealth, we used findings from a study by Hossain et al. (2019) that highlights the association between these variables and diabetes risk in a population-based study in Bangladesh [24]. Educational status priors were guided by the work of Reiner et al. (2019), which examines the influence of education on health outcomes, including diabetes [25]. Finally, hypertension, a significant comorbidity with diabetes, was informed by the study conducted by Whelton et al. (2017), which provides detailed insights into the relationship between hypertension and diabetes [26]. For the prediabetic response, we employed prior distributions from studies that specifically examine the predictors of prediabetes. Age, residence, employment, and wealth were informed by a study on the socioeconomic and demographic determinants of prediabetes by Shaikh et al. (2023), which provides detailed statistical associations for these factors [27]. For BMI, education, gender, and hypertension, we referred to a study by Akter et al. (2021), which comprehensively examines these variables in the context of prediabetes and provides robust prior estimates [10].
The use of Bayesian multinomial mixed-effects models with weakly informative priors helps us to mitigate the impact of selection bias that has been arise due to the exclusion of missing responses. Gelman et al. highlighted that Bayesian approaches can improve model estimates and predictions, particularly in the presence of complex data structures and potential biases [19]. Because the models can incorporate prior knowledge and use hierarchical structures to account for unobserved heterogeneity, leading to robust parameter estimates even with incomplete data. Gelman and Hill also emphasized the importance of diagnostic checks in confirming the validity of Bayesian hierarchical models [28]. These checks validate that the model captures the underlying data structure accurately. We conducted diagnostic checks, such as prior predictive checks, posterior predictive checks and examining model convergence, to ensure that the model performs well despite the exclusion of incomplete cases.
2.3. Classification Using Machine Learning Model
Considering the need for precise classification of diabetic status, the application of ML models offers a promising approach to enhance predictive accuracy and model robustness. ML techniques have been increasingly recognized for their ability to handle complex, non-linear relationships among variables, which is particularly beneficial in the context of predicting health outcomes like diabetes and prediabetes [29]. These models can process large datasets with numerous predictors, capturing subtle interactions that traditional statistical methods might overlook [30]. For instance, LR, while being a robust method for binary classification, can be extended to multinomial LR to handle our trinary outcome of diabetic status [31]. DT and RF, which are based on the principle of recursive partitioning, provide intuitive models that can easily accommodate interaction terms and non-linear effects [32]. On the other side, KNN and LDA are also valuable for their simplicity and effectiveness in classification tasks [33]. KNN is particularly useful when the decision boundary is irregular, while LDA performs well when the predictor variables are approximately normally distributed within each class [34]. The integration of these ML models not only improves the classification performance but also allows for more flexible handling of diverse data types and distributions.
Given the complex interplay of demographic, socioeconomic, and health-related factors in predicting diabetic status, we applied these ML models to provide a more nuanced understanding and better predictive performance compared to traditional methods. We considered 80% data on training set and 20% on test set and also did 10-fold cross validation in each case to identify the test accuracy. This rationale aligns with contemporary research emphasizing the utility of ML in public health and epidemiology, as highlighted in studies like those by Beam and Kohane [35]. In this study, we explored two distinct scenarios for the response variable: binomial and trinomial classifications. In the trinomial scenario, we included all three categories of the response variable: non-diabetic, prediabetic, and diabetic. Conversely, in the binomial scenario, we combined the non-diabetic and prediabetic groups into a single category. The rationale for considering these two scenarios is that this approach stems from the distribution of data within the categories: diabetic, prediabetic, and non-diabetic. Given that the percentages of data (in Table 1) in the diabetic and prediabetic categories are similar and smaller compared to the non-diabetic category, merging the diabetic and prediabetic groups to form a binomial response allows us to explore whether this aggregation improves the prediction accuracy of the models. This is particularly important because the imbalanced nature of the dataset, with a dominant non-diabetic category, can pose challenges for classification algorithms, potentially leading to biased or less accurate predictions. By evaluating the models using both binomial and trinomial responses, we can assess how well they handle class imbalance and whether combining categories provides a more stable and accurate prediction framework. This dual approach allows us to identify the optimal model configuration that balances accuracy and robustness in predicting diabetic status. Additionally, this methodology aligns with practices in medical research where different classification schemes are tested to ensure comprehensive evaluation of predictive performance. This approach has been supported in literature, where researchers have demonstrated that handling class imbalance and testing different response aggregations can significantly impact model performance [36,37].
2.4. Simulation Study
To thoroughly evaluate the classification models, we simulated various scenarios for the response variable that is generated using coefficients from the Bayesian multinomial mixed-effects model. This simulation was crucial for understanding how different distributions of the response variable impact prediction accuracy. Initially, we utilized the posterior distributions of the model coefficients to generate synthetic response data. Specifically, we derived two sets of coefficients: one for the binomial response and another for the trinomial response. Using these coefficients, we created linear predictors for each category by incorporating relevant predictors such as age, gender, BMI, residence, wealth, education, employment, and hypertension. These linear predictors were then transformed using the logit function to obtain probabilities for each category. The response variable was simulated by assigning each observation to a category based on these probabilities, ensuring predefined distributions for non-diabetic, prediabetic, and diabetic categories, respectively. This approach allowed us to generate realistic synthetic data of the response variable, reflecting the complex interplay of various predictors as modelled by the Bayesian multinomial mixed-effects model.
The simulation scenarios differ only in the distribution of the data across different levels of the response variable. This methodology enabled us to robustly evaluate the performance of different ML classifiers in predicting diabetic status under varied response distributions. By doing so, our evaluation accounts for the inherent variability and distribution patterns observed in real-world data, leading to more robust and reliable model performance assessments.
3. Results
3.1. Bayesian Multinomial Mixed Effect Model Result
The results of the Bayesian multinomial mixed effect model provide a detailed understanding of the variability in diabetic and prediabetic responses across different divisions of Bangladesh. The model includes random intercepts for 8 different divisions, allowing for the baseline odds of diabetes and prediabetes to vary regionally. The standard deviation (sd) of the intercept for the diabetic response is estimated at 2.81, with a 95% credible interval (CI) ranging from 0.13 to 10.47, indicating substantial variability across divisions. Similarly, the standard deviation of the intercept for the prediabetic response is 2.70, with a 95% CI of 0.10 to 10.10, again suggesting substantial regional differences. These results underscore the importance of considering regional variability when designing and implementing public health interventions aimed at managing diabetes and prediabetes. The wide credible intervals highlight the uncertainty in these estimates. This suggests that certain divisions may have higher or lower baseline odds of diabetes and prediabetes, potentially due to regional factors that were not directly measured in the study. In this study, we followed Gellman’s Bayesian workflow (34) that involves an iterative cycle of model creation, inference, checking, evaluation, and refinement. In a simplified version, the process begins by defining a model informed by exploratory data analysis, often utilizing visualizations for better data comprehension. Weakly informative priors are selected to regularize the estimates without imposing excessive constraints. Prior predictive checks are then conducted to verify the reasonableness of the model's assumptions before examining the actual data. Once the priors are deemed appropriate, we proceed to estimate the posterior distribution of the model parameters through Markov Chain Monte Carlo (MCMC) simulation. Following model fitting, we perform diagnostic checks to validate the computations, which includes analyzing trace plots and ensuring convergence criteria, such as the Gelman-Rubin statistic, are met. Next, the model is evaluated using posterior predictive checks, where the observed data is compared to data simulated from the model to identify any discrepancies. A well-fitting model will produce simulated data that closely resembles the observed data.
3.1.1. Prior Predictive Check
It is important in Bayesian to understand whether the specified priors are reasonable for the data and the model. Prior predictive checks help here to ensure that the priors are reasonable and do not lead to unrealistic predictions before fitting the model to the actual data. It involves generating data from the model using only the priors and comparing these simulated data to the observed data.
Figure 1 presets the prior predictive checks for this study. The x axis represents the range of the predicted values, while the y axis represents the density of the predicted values. The dark blue line (y) represents the observed data, where the light blue lines () represents the predicted data based on the priors alone. The light blue lines broadly cover the range of the dark blue line, indicating that the priors are not too restrictive and can generate a wide range of plausible data. Ideally, the distribution of the predicted data () encompass the observed data (y). This indicates that the priors are able to produce values similar to what is observed in the actual data. The peaks and valleys of the lines align with those of the y line.
3.1.2. Posterior Distribution
The analysis in Table 3, which includes various demographic, socioeconomic, and health-related factors, reveals significant associations with both diabetic and prediabetic outcomes. For instance, gender, age, residence, wealth, education, employment, BMI, and hypertension status are all examined to understand their impact on diabetes and prediabetes. The odds ratios (OR), SE and 95% CI offer insights into the relative likelihood of these conditions across different subgroups. We also added the figures of the posterior distribution in Supplement (Table B) to illustrate the uncertainty and variability in our estimates.
The model was applied to BDHS dataset containing 12,278 observations. In terms of fixed effects, Table 3 provides the ORs, SE and 95% CIs for various predictors of diabetic and prediabetic response. For gender, males have an OR of 0.97 (95% CI: 0.9, 1.05) compared to females, indicating no significant difference in the likelihood of being diabetic. Age-wise, younger individuals (referred to as "Young") show significantly higher odds of being diabetic with an OR of 1.26 (95% CI: 1.19, 1.34), while middle-aged individuals also have increased odds with an OR of 1.2 (95% CI: 1.06, 1.35) compared to the adult reference group. Conversely, older individuals have lower odds of being diabetic with an OR of 0.73 (95% CI: 0.64, 0.84). Rural residents show no significant difference from urban residents with an OR of 0.95 (95% CI: 0.9, 1.01). Regarding wealth, all categories show higher odds compared to the poorest, with the richest having the highest OR of 1.22 (95% CI: 1.11, 1.35). Education levels, on the other hand, do not show a consistent pattern of association with diabetes. Employment status indicates that those who are employed have a slightly higher odds of being diabetic (OR: 1.14, 95% CI: 1.02, 1.28). In terms of BMI, overweight and obese individuals have significantly higher odds of being diabetic with ORs of 1.36 (95% CI: 1.2, 1.51) and 1.26 (95% CI: 1.19, 1.34), respectively. Lastly, individuals with hypertension have markedly significantly higher odds of being diabetic with an OR of 3.13 (95% CI: 1.75, 5.64).
For the prediabetic response, the model indicates that younger individuals have significantly higher odds of being prediabetic, with an OR of 1.95 and a 95% CI of 1.48 to 2.59. Middle-aged individuals also have significantly higher odds with an OR of 1.95 (95% CI: 1.49, 2.56). Rural residence is associated with increased odds of prediabetes compared to urban areas, with an OR of 1.22 (95% CI: 0.87, 1.72). Wealth categories except poorer group show increased odds of being prediabetic compared to the poorest group, with the highest wealth quintile having an OR of 1.79 (95% CI: 1.13, 2.80). For BMI, obese individuals have higher odds of being prediabetic (OR: 1.31, 95% CI: 0.95, 1.84). The results also indicate that hypertension is not significantly associated with prediabetes, with an OR of 0.98 (95% CI: 0.72, 1.21).
3.1.3. Model Diagnostics Checks
The histograms for the predictors in Supplement (Table A) provide a comprehensive overview of the posterior distributions and trace plots for various predictors in the Bayesian multinomial mixed-effects model, which includes diabetic, prediabetic, and non-diabetic categories. The histograms on the left show the posterior distributions for the coefficients of the model, while the trace plots on the right depict the convergence of the MCMC chains. The posterior distributions reveal the estimated effect sizes for each predictor, with the distribution's spread indicating the uncertainty around these estimates. For instance, the posterior distributions for the intercepts of both diabetic and prediabetic responses appear centered around zero, suggesting no substantial baseline difference in odds. The trace plots for these intercepts, as well as other predictors, demonstrate that the MCMC chains have mixed well and converged, as evidenced by their consistent patterns across iterations and between chains. Predictors like residence, wealth, gender, age, education, employment, BMI, and hypertension status exhibit varying degrees of influence on diabetic and prediabetic outcomes. Notably, the posterior distributions for BMI categories such as obese and overweight show higher values, indicating a strong positive association with diabetic status. Similarly, the wealth categories like richest show significant positive effects, suggesting higher odds of diabetes in wealthier individuals. In contrast, predictors like education (higher) show negative associations with diabetic status. For random effects, the standard deviations for the intercepts across different divisions are also shown, indicating variability in baseline diabetic and prediabetic probabilities across these regions. The histograms for these random effects suggest a wide range of variation, while the trace plots confirm that the MCMC chains for these random effects have converged satisfactorily. The variability observed here seems to be consistent with typical MCMC behavior when exploring a posterior with a certain degree of uncertainty. The coefficient for all the predictors displays tight clustering around a particular value, demonstrating precision in the posterior estimate. The chain exhibits no apparent trends, supporting the conclusion that it has reached a stable distribution.
The metrics (potential scale reduction factor) and Effective Sample Size (ESS) are also crucial diagnostics for MCMC convergence. values close to 1 (typically ≤ 1.1) indicate convergence, while ESS quantifies the number of independent-like draws from the posterior distribution. Both metrics can often be visualized as part of summary tables or alongside other plots to provide a quick diagnostic overview.
Figure 2 appears to be a visualization of the statistic for the MCMC chains from our model. values in the plot for all sampled parameters are below 1.05, which suggests that the chains have converged sufficiently for reliable parameter estimation. There are no points to the right of the ≤ 1.05 threshold, which is a positive sign that the MCMC algorithm has done a good job in estimating the posterior distributions of the parameters.
Figure 3 represents the ESS for the MCMC chains from our model, normalized by the total number of post-warmup iterations . The plot visualizes the effective sample size ratios for various model parameters. On the x-axis, we have the effective sample size ratios, and on the y-axis, the model parameters are listed. This plot reveals that the majority of the parameters have a high effective sample size ratio, indicating that the MCMC chains have mixed well and provide reliable estimates. Parameters such as the intercepts and division-specific random effects have particularly high ESS values, suggesting that these estimates are very robust. Conversely, parameters with lower ESS values could potentially benefit from more iterations to ensure reliable estimates. This visualization helps diagnose the efficiency and reliability of the parameter estimates from the MCMC simulation, ensuring that the model's inferences are based on well-mixed chains with sufficient effective sample sizes.
Posterior predictive checks are powerful tools for validating Bayesian models that ensure the inferences drawn from the model are robust and reflective of the observed data. Posterior predictive checks are motivated by the need to verify that the model fits the data well. The central idea is to compare the observed data to data simulated from the model's posterior predictive distribution. If the model is a good fit, the simulated data should look like the observed data across various aspects. In particular, posterior predictive checks allow us to assess whether the model's assumptions are justified and whether the model captures the data structure effectively. By visualizing discrepancies between observed and simulated data, posterior predictive checks can highlight specific areas where the model may be lacking.
Figure 4 (Posterior predictive checks of our model) shows both the observed data (likely represented by the darker line labelled y) and a set of simulated data sets from the posterior predictive distribution (the lighter lines labelled ). The observed data's pattern is mirrored closely by the simulated data sets, which suggests that the model is doing well in capturing the underlying structure of the data. The overlap between y and the various lines indicate good model fit. The tight clustering of the lines around the observed data y suggests relatively low uncertainty in the model's predictions. If the lines were more dispersed, it would indicate greater uncertainty in the predictions.
3.2. Classification of Diabetic Status
The results of the 10-fold cross-validation for test accuracy across different ML models using BDHS data are summarized in Table 4. The models evaluated include LR, DT, KNN, LDA, and RF, each tested on both trinomial (model 1) and binomial (model 2) classification tasks. For trinomial classification, KNN slightly outperformed other models with an accuracy of 0.753, while LR, DT, and LDA each achieved an accuracy of 0.752. The RF model had a slightly lower accuracy at 0.743. In the binomial classification task, LR, DT, KNN, and LDA all achieved an accuracy of 0.875, whereas RF had a marginally lower accuracy of 0.869.
We applied here the Friedman test [38] to check for differences in the classification accuracies across the different models and classifications (trinomial vs. binomial). A chi-squared value of 5 and a p-value of 0.025 suggested that there is a statistically significant difference in accuracies between the models and/or classifications since the p-value is less than the significance level of 0.05. Then we did a post-hoc Nemenyi test [39] to determine which specific pairs of models and classifications are significantly different. The result indicates that the accuracy difference between the model 1 and model 2 classifications is significant with a p-value of 0.025. This indicates that the binomial classification accuracy is significantly higher than the trinomial classification accuracy for the models tested.
3.3. Simulation Results
The results in section 3.2 reveal that the test accuracy of the classifications are robust on the models but differ on the data and its distribution. From this motivation we perform simulation study by changing the distribution of the response variable to understand how the test accuracy differs in different models.
Table 5 presents the 10-fold cross-validation test accuracy for various ML models across different distributions of the response variable, both trinomial and binomial. When examining the row-wise comparison, it is evident that the accuracy fluctuates based on the distribution of the response variable. For instance, LR and LDA exhibit similar patterns, achieving their highest accuracy (0.799) for the 80-10-10 distribution (80%, 10% and 10% of the data in each three categories of the response variable) in the trinomial case, indicating that these models perform well with highly imbalanced data. KNN and RF also follow a similar trend, though RF generally shows slightly lower accuracy than KNN across different distributions. Column-wise comparison highlights the impact of different response variable distributions on model performance. For the trinomial classification, as the distribution becomes more imbalanced (e.g., moving from 40-30-30 to 80-10-10), most models' accuracy improves, particularly LR and DT, suggesting that these models handle imbalanced classes effectively. Conversely, for binomial classification, the highest accuracy is consistently observed in the 90-10 distribution for most models, emphasizing that extreme imbalance favors these models. Overall, LR and LDA are notably robust across both trinomial and binomial classifications, showing high accuracy in imbalanced scenarios. In contrast, RF and KNN display variable performance, with KNN generally outperforming RF. This analysis underscores the importance of considering class distribution when selecting and tuning models for classification tasks.
We performed Friedman test and subsequent post-hoc Nemenyi test to provide valuable insights into the comparative performance of different classification models under various response variable distributions. The Friedman test yielded a chi-squared value of 49.119 with 10 degrees of freedom and a highly significant p-value of <0.001. This indicates a statistically significant difference in the performance of the classification models across the different response variable distributions. The low p-value suggests that the null hypothesis, which states that all models perform equally, can be rejected.
Following the Friedman Test, the post-hoc Nemenyi Test was conducted to identify specific pairs of response variable distributions where significant differences in model performance exist. Table 6 presents the Nemenyi Test results, where comparisons between the response distributions 40-30-30(%) and 80-10-10(%), as well as 40-30-30(%) and 90-10(%), are found to be statistically significant with p-values of 0.003 and <0.001, respectively. Additionally, significant differences are found between other pairs such as 40-40-20(%) and 90-10(%), 50-30-20(%) and 90-10(%), and so on, with p-values less than 0.05. These findings indicate that the performance of classification models varies considerably between certain response distributions, emphasizing the impact of the distribution of the response variable on model accuracy.
4. Discussion
The Bayesian multinomial mixed effect model results reveal substantial regional variability in the diabetic and prediabetic responses across the divisions of Bangladesh. The model incorporates random intercepts for eight divisions, allowing baseline odds of diabetes and prediabetes to vary regionally. The standard deviations of the intercepts for both diabetic and prediabetic responses with wide credible intervals underscore the importance of considering regional variability when designing public health interventions. These wide intervals reflect the uncertainty in these estimates but confirm substantial regional differences, suggesting that factors not directly measured in the study may influence diabetes prevalence in different divisions.
The prior predictive checks, illustrated in Figure 1, indicate that our specified priors are reasonable for the model and data. The alignment of the predicted data with the observed data suggests that the priors are not overly restrictive and can generate a wide range of plausible data. This ensures that the model's assumptions are reasonable before fitting the actual data, a crucial step in Bayesian analysis to avoid unrealistic predictions and enhance the model’s reliability. The analysis in Table 3 examines various demographic, socioeconomic, and health-related factors to understand their impact on diabetes and prediabetes. The significant associations identified, such as higher odds of diabetes among younger and middle-aged individuals, those with higher BMI, and those with hypertension, highlight key risk factors. Conversely, older individuals and rural residents have lower odds of diabetes. Wealthier individuals also show higher odds, emphasizing the role of socioeconomic status. For prediabetes, similar patterns are observed, with younger and middle-aged individuals and those from higher wealth quintiles showing increased odds. These results provide valuable insights into the relative likelihood of these conditions across different subgroups, informing targeted interventions.
The model diagnostics, including histograms and trace plots, confirm the convergence and reliability of the MCMC chains. The posterior distributions reveal the estimated effect sizes for each predictor, with the trace plots demonstrating well-mixed and converged chains. The high values and ESS for most parameters indicate robust and reliable estimates. Parameters with lower ESS values could benefit from more iterations, but overall, the diagnostics suggest that the model’s inferences are based on well-mixed chains with sufficient effective sample sizes. The values below 1.05 and the high ESS ratios confirm the stability and reliability of the parameter estimates. The posterior predictive checks, depicted in Figure 4, validate the model's fit by comparing the observed data to simulated data from the model's posterior predictive distribution. The close mirroring of the observed data by the simulated datasets indicates that the model effectively captures the underlying structure of the data. This alignment suggests a good model fit, with low uncertainty in the model’s predictions, ensuring robust inferences and highlighting areas where the model performs well.
The 10-fold cross-validation results for various ML models, summarized in Table 4, demonstrate the accuracy of these models in classifying diabetic status using BDHS data. KNN slightly outperformed other models in trinomial classification, while LR, DT, and LDA performed similarly. RF showed slightly lower accuracy. For binomial classification, all models except RF achieved similar high accuracy. These results indicate that LR and LDA are notably robust across both classification tasks, while RF and KNN show more variable performance.
The simulation study, presented in Table 5, examines how different distributions of the response variable affect model performance. LR and LDA show high accuracy in highly imbalanced distributions, while KNN and random forest exhibit more variable performance. The study highlights the importance of considering class distribution when selecting and tuning models for classification tasks, as model accuracy can significantly vary with the distribution of the response variable. The Friedman test and subsequent Nemenyi test results, shown in Table 6, provide insights into the comparative performance of different classification models under various response variable distributions. Significant differences were identified between certain response distributions, emphasizing the impact of the distribution of the response variable on model accuracy. These findings highlight the necessity of accounting for response distribution when evaluating model performance and selecting appropriate classification techniques.
The results of this study provide a comprehensive analysis of the factors influencing diabetes and prediabetes in Bangladesh, but there are several avenues for further research and improvement. Firstly, this study excluded incomplete responses, which could introduce selection bias into the results. Future work could address this by employing imputation techniques such as multiple imputation by chained equation (MICE) [40] to estimate missing values and applying the Bayesian multinomial mixed-effects model to the full dataset, potentially enhancing the robustness and accuracy of the findings. Secondly, while this study utilized five ML models to predict diabetic status, there is scope for exploring a broader range of models, including advanced techniques like gradient boosting machines, neural networks, and ensemble methods. The application of automated ML [41] tools could also streamline model selection and hyperparameter tuning, thereby improving predictive performance. Lastly, the current analysis was limited by the availability of variables in the BDHS dataset. Incorporating additional clinical, lifestyle, and environmental variables could provide a more holistic understanding of diabetes risk factors and improve model accuracy. Future studies should aim to include a wider range of relevant variables to capture the multifaceted nature of diabetes, ultimately contributing to more effective public health strategies and interventions. This comprehensive approach will not only enhance predictive accuracy but also provide deeper insights into the underlying determinants of diabetes, thereby informing more targeted and effective public health initiatives.
5. Conclusions
This study provides an in-depth analysis of T2DM in Bangladesh by leveraging Bayesian multinomial mixed-effect models alongside various ML techniques to understand and predict diabetic and prediabetic status. Our approach underscores the importance of integrating these methodologies for effective diabetes prediction, offering valuable insights for public health strategies aimed at mitigating the impact of T2DM. The Bayesian multinomial mixed-effect model revealed substantial regional differences in diabetes and prediabetes responses across Bangladesh's divisions. The significant variability in baseline odds highlights the necessity of considering regional factors when designing public health interventions.
Our classification models, evaluated through 10-fold cross-validation, demonstrated that LR and LDA were notably robust across both trinomial and binomial classifications. The performance of KNN and RF models varied, with KNN generally outperforming RF. The simulation study further emphasized the importance of considering class distribution when selecting and tuning models, as model accuracy significantly varied with different response variable distributions. The Friedman test and post-hoc Nemenyi test provided insights into the comparative performance of different classification models under various response distributions, emphasizing the impact of response variable distribution on model accuracy.
In conclusion, this comprehensive approach of estimating parameters using a Bayesian model, applying ML for prediction, and conducting simulation studies to explore various scenarios, highlights the importance of integrating these methodologies for effective diabetes prediction. The significant regional variability and the influence of demographic, socioeconomic, and health-related factors underscore the complexity of managing diabetes. These findings support the development of targeted interventions and improved predictive models, ultimately enhancing public health outcomes and informing policy decisions. Future research should continue to explore the interplay of various predictors and refine these models to further improve the accuracy and reliability of diabetes predictions.
Supplementary Materials
The following supporting information can be downloaded at the website of this paper posted on Preprints.org, Figure S1: Plots for the convergence checking of Bayesian Multinomial Mixed Effect Model; S2: Posterior Distribution of the parameters.
Author Contributions
Conceptualization, Mashfiqul Chowdhury, Mizanoor Rahman and Noor Muhammad Khan; methodology, Noor Muhammad Khan and Mizanoor Rahman; software, Noor Muhammad Khan and Mizanoor Rahman; validation, Mashfiqul Chowdhury, Mizanoor Rahman and Noor Muhammad Khan; formal analysis, Noor Muhammad Khan; investigation, Mashfiqul Chowdhury; data curation, Mizanoor Rahman; writing—original draft preparation, Noor Muhammad Khan; writing—review and editing, Mashfiqul Chowdhury, Mizanoor Rahman and Noor Muhammad Khan; visualization, Mizanoor Rahman; supervision, Mashfiqul Chowdhury. All authors have read and agreed to the published version of the manuscript.
Funding
This research received no external funding.
Institutional Review Board Statement
The study does not require ethical approval as the BDHS 2017−18 survey was approved by the local Ethics Committee of Bangladesh and the ICF Macro at Calverton, New York, USA. Permission to use and analyze the data set was obtained by registering for the study on the DHS website. Patients and the public were not involved in the design, conduct, reporting, or dissemination plans of this research.
Informed Consent Statement
Not Applicable.
Data Availability Statement
Data are available at https://dhsprogram.com/.
Conflicts of Interest
The authors declare no conflicts of interest.
References
- Castro-Barquero, S.; Lamuela-Raventós, R.M.; Doménech, M.; Estruch, R. Relationship between Mediterranean Dietary Polyphenol Intake and Obesity. Nutrients 2018, 10, 1523. [CrossRef]
- Bloomgarden, Z.T. Cardiovascular Disease, Neuropathy, and Retinopathy. Diabetes Care 2009, 32, e64–e68. [CrossRef]
- Section 12: Retinopathy, Neuropathy, and Foot Care. Clinical Diabetes 2024, 42, 214–215. [CrossRef]
- American Diabetes Association Economic Costs of Diabetes in the U.S. in 2017. Diabetes Care 2018, 41, 917–928. [CrossRef]
- Zhang, P.; Zhang, X.; Brown, J.; Vistisen, D.; Sicree, R.; Shaw, J.; Nichols, G. Global Healthcare Expenditure on Diabetes for 2010 and 2030. Diabetes Research and Clinical Practice 2010, 87, 293–301. [CrossRef]
- Gootjes, C.; Zwaginga, J.J.; Roep, B.O.; Nikolic, T. Functional Impact of Risk Gene Variants on the Autoimmune Responses in Type 1 Diabetes. Front. Immunol. 2022, 13, 886736. [CrossRef]
- Islam, R.; Sultana, A.; Tuhin, Md.N.; Saikat, Md.S.H.; Islam, M.R. Clinical Decision Support System for Diabetic Patients by Predicting Type 2 Diabetes Using Machine Learning Algorithms. Journal of Healthcare Engineering 2023, 2023, 1–11. [CrossRef]
- Tasin, I.; Nabil, T.U.; Islam, S.; Khan, R. Diabetes Prediction Using Machine Learning and Explainable AI Techniques. Healthcare Tech Letters 2023, 10, 1–10. [CrossRef]
- Hossain, M.B.; Khan, Md.N.; Oldroyd, J.C.; Rana, J.; Magliago, D.J.; Chowdhury, E.K.; Karim, M.N.; Islam, R.M. Prevalence of, and Risk Factors for, Diabetes and Prediabetes in Bangladesh: Evidence from the National Survey Using a Multilevel Poisson Regression Model with a Robust Variance. PLOS Glob Public Health 2022, 2, e0000461. [CrossRef]
- Akhtar, S.; Nasir, J.A.; Sarwar, A.; Nasr, N.; Javed, A.; Majeed, R.; Salam, M.A.; Billah, B. Prevalence of Diabetes and Pre-Diabetes in Bangladesh: A Systematic Review and Meta-Analysis. BMJ Open 2020, 10, e036086. [CrossRef]
- Talukder, A.; Hossain, Md.Z. Prevalence of Diabetes Mellitus and Its Associated Factors in Bangladesh: Application of Two-Level Logistic Regression Model. Sci Rep 2020, 10, 10237. [CrossRef]
- Islam, Md.M.; Rahman, Md.J.; Chandra Roy, D.; Maniruzzaman, Md. Automated Detection and Classification of Diabetes Disease Based on Bangladesh Demographic and Health Survey Data, 2011 Using Machine Learning Approach. Diabetes & Metabolic Syndrome: Clinical Research & Reviews 2020, 14, 217–219. [CrossRef]
- Aktar, Mst.F.; Chowdhury, M.H.; Rahman, Md.S. A Quantile Regression Approach to Identify Risk Factors for High Blood Glucose Levels among Bangladeshi Individuals. Health Science Reports 2023, 6, e1772. [CrossRef]
- Howlader, K.C.; Satu, Md.S.; Awal, Md.A.; Islam, Md.R.; Islam, S.M.S.; Quinn, J.M.W.; Moni, M.A. Machine Learning Models for Classification and Identification of Significant Attributes to Detect Type 2 Diabetes. Health Inf Sci Syst 2022, 10, 2. [CrossRef]
- National Institute of Population Research and Training - NIPORT; Ministry of Health and Family Welfare; ICF Bangladesh Demographic and Health Survey 2017-18; NIPORT/ICF: Dhaka, Bangladesh, 2020.
- Schafer, J.L.; Graham, J.W. Missing Data: Our View of the State of the Art. Psychol Methods 2002, 7, 147–177.
- Definition and Diagnosis of Diabetes Mellitus and Intermediate Hyperglycaemia: Report of a WHO/IDF Consultation; World Health Organization: Geneva, Switzerland, 2006; ISBN 978-92-4-159493-6.
- Geifman, N.; Cohen, R.; Rubin, E. Redefining Meaningful Age Groups in the Context of Disease. AGE 2013, 35, 2357–2366. [CrossRef]
- Gelman, A.; Carlin, J.B.; Stern, H.S.; Dunson, D.B.; Vehtari, A.; Rubin, D.B. Bayesian Data Analysis; 0 ed.; Chapman and Hall/CRC, 2013; ISBN 978-0-429-11307-9.
- Carpenter, B.; Gelman, A.; Hoffman, M.D.; Lee, D.; Goodrich, B.; Betancourt, M.; Brubaker, M.; Guo, J.; Li, P.; Riddell, A. Stan : A Probabilistic Programming Language. J. Stat. Soft. 2017, 76. [CrossRef]
- Lemoine, N.P. Moving beyond Noninformative Priors: Why and How to Choose Weakly Informative Priors in Bayesian Analyses. Oikos 2019, 128, 912–928. [CrossRef]
- Wainberg, M.; Mahajan, A.; Kundaje, A.; McCarthy, M.I.; Ingelsson, E.; Sinnott-Armstrong, N.; Rivas, M.A. Homogeneity in the Association of Body Mass Index with Type 2 Diabetes across the UK Biobank: A Mendelian Randomization Study. PLoS Med 2019, 16, e1002982. [CrossRef]
- Ganz, M.L.; Wintfeld, N.; Li, Q.; Alas, V.; Langer, J.; Hammer, M. The Association of Body Mass Index with the Risk of Type 2 Diabetes: A Case–Control Study Nested in an Electronic Health Records System in the United States. Diabetol Metab Syndr 2014, 6, 50. [CrossRef]
- Tran, P.; Tran, L.; Tran, L. Impact of Rurality on Diabetes Screening in the US. BMC Public Health 2019, 19, 1190. [CrossRef]
- Maniruzzaman, Md.; Rahman, Md.J.; Ahammed, B.; Abedin, Md.M. Classification and Prediction of Diabetes Disease Using Machine Learning Paradigm. Health Inf Sci Syst 2020, 8, 7. [CrossRef]
- Tsimihodimos, V.; Gonzalez-Villalpando, C.; Meigs, J.B.; Ferrannini, E. Hypertension and Diabetes Mellitus: Coprediction and Time Trajectories. Hypertension 2018, 71, 422–428. [CrossRef]
- Yesmin, M.; Ali, M.; Saha, S. The Prevalence and Influencing Factors of Coexisting Prediabetes and Prehypertension among Bangladeshi Adults. BMC Public Health 2023, 23, 1184. [CrossRef]
- Gelman, A.; Hill, J. Data Analysis Using Regression and Multilevel/Hierarchical Models; 1st ed.; Cambridge University Press, 2006; ISBN 978-0-521-86706-1.
- Rajkomar, A.; Dean, J.; Kohane, I. Machine Learning in Medicine. N Engl J Med 2019, 380, 1347–1358. [CrossRef]
- Deo, R.C. Machine Learning in Medicine. Circulation 2015, 132, 1920–1930. [CrossRef]
- Boulesteix, A.-L.; Strimmer, K. Partial Least Squares: A Versatile Tool for the Analysis of High-Dimensional Genomic Data. Briefings in Bioinformatics 2006, 8, 32–44. [CrossRef]
- Breiman, L. Random Forests. Machine Learning 2001, 45, 5–32. [CrossRef]
- Cover, T.; Hart, P. Nearest Neighbor Pattern Classification. IEEE Trans. Inform. Theory 1967, 13, 21–27. [CrossRef]
- Fisher, R.A. THE USE OF MULTIPLE MEASUREMENTS IN TAXONOMIC PROBLEMS. Annals of Eugenics 1936, 7, 179–188. [CrossRef]
- Beam, A.L.; Kohane, I.S. Big Data and Machine Learning in Health Care. JAMA 2018, 319, 1317. [CrossRef]
- Haibo He; Garcia, E.A. Learning from Imbalanced Data. IEEE Trans. Knowl. Data Eng. 2009, 21, 1263–1284. [CrossRef]
- Kotsiantis, S.B.; Zaharakis, I.D.; Pintelas, P.E. Machine Learning: A Review of Classification and Combining Techniques. Artif Intell Rev 2006, 26, 159–190. [CrossRef]
- Friedman, M. A Comparison of Alternative Tests of Significance for the Problem of $m$ Rankings. Ann. Math. Statist. 1940, 11, 86–92. [CrossRef]
- Nemenyi, P. Distribution-Free Multiple Comparisons; Princeton University, 1963.
- Azur, M.J.; Stuart, E.A.; Frangakis, C.; Leaf, P.J. Multiple Imputation by Chained Equations: What Is It and How Does It Work? Int J Methods Psych Res 2011, 20, 40–49. [CrossRef]
- Automated Machine Learning: Methods, Systems, Challenges; Hutter, F., Kotthoff, L., Vanschoren, J., Eds.; The Springer Series on Challenges in Machine Learning; Springer International Publishing: Cham, 2019; ISBN 978-3-030-05317-8.
Figure 1.
Prior predictive check.
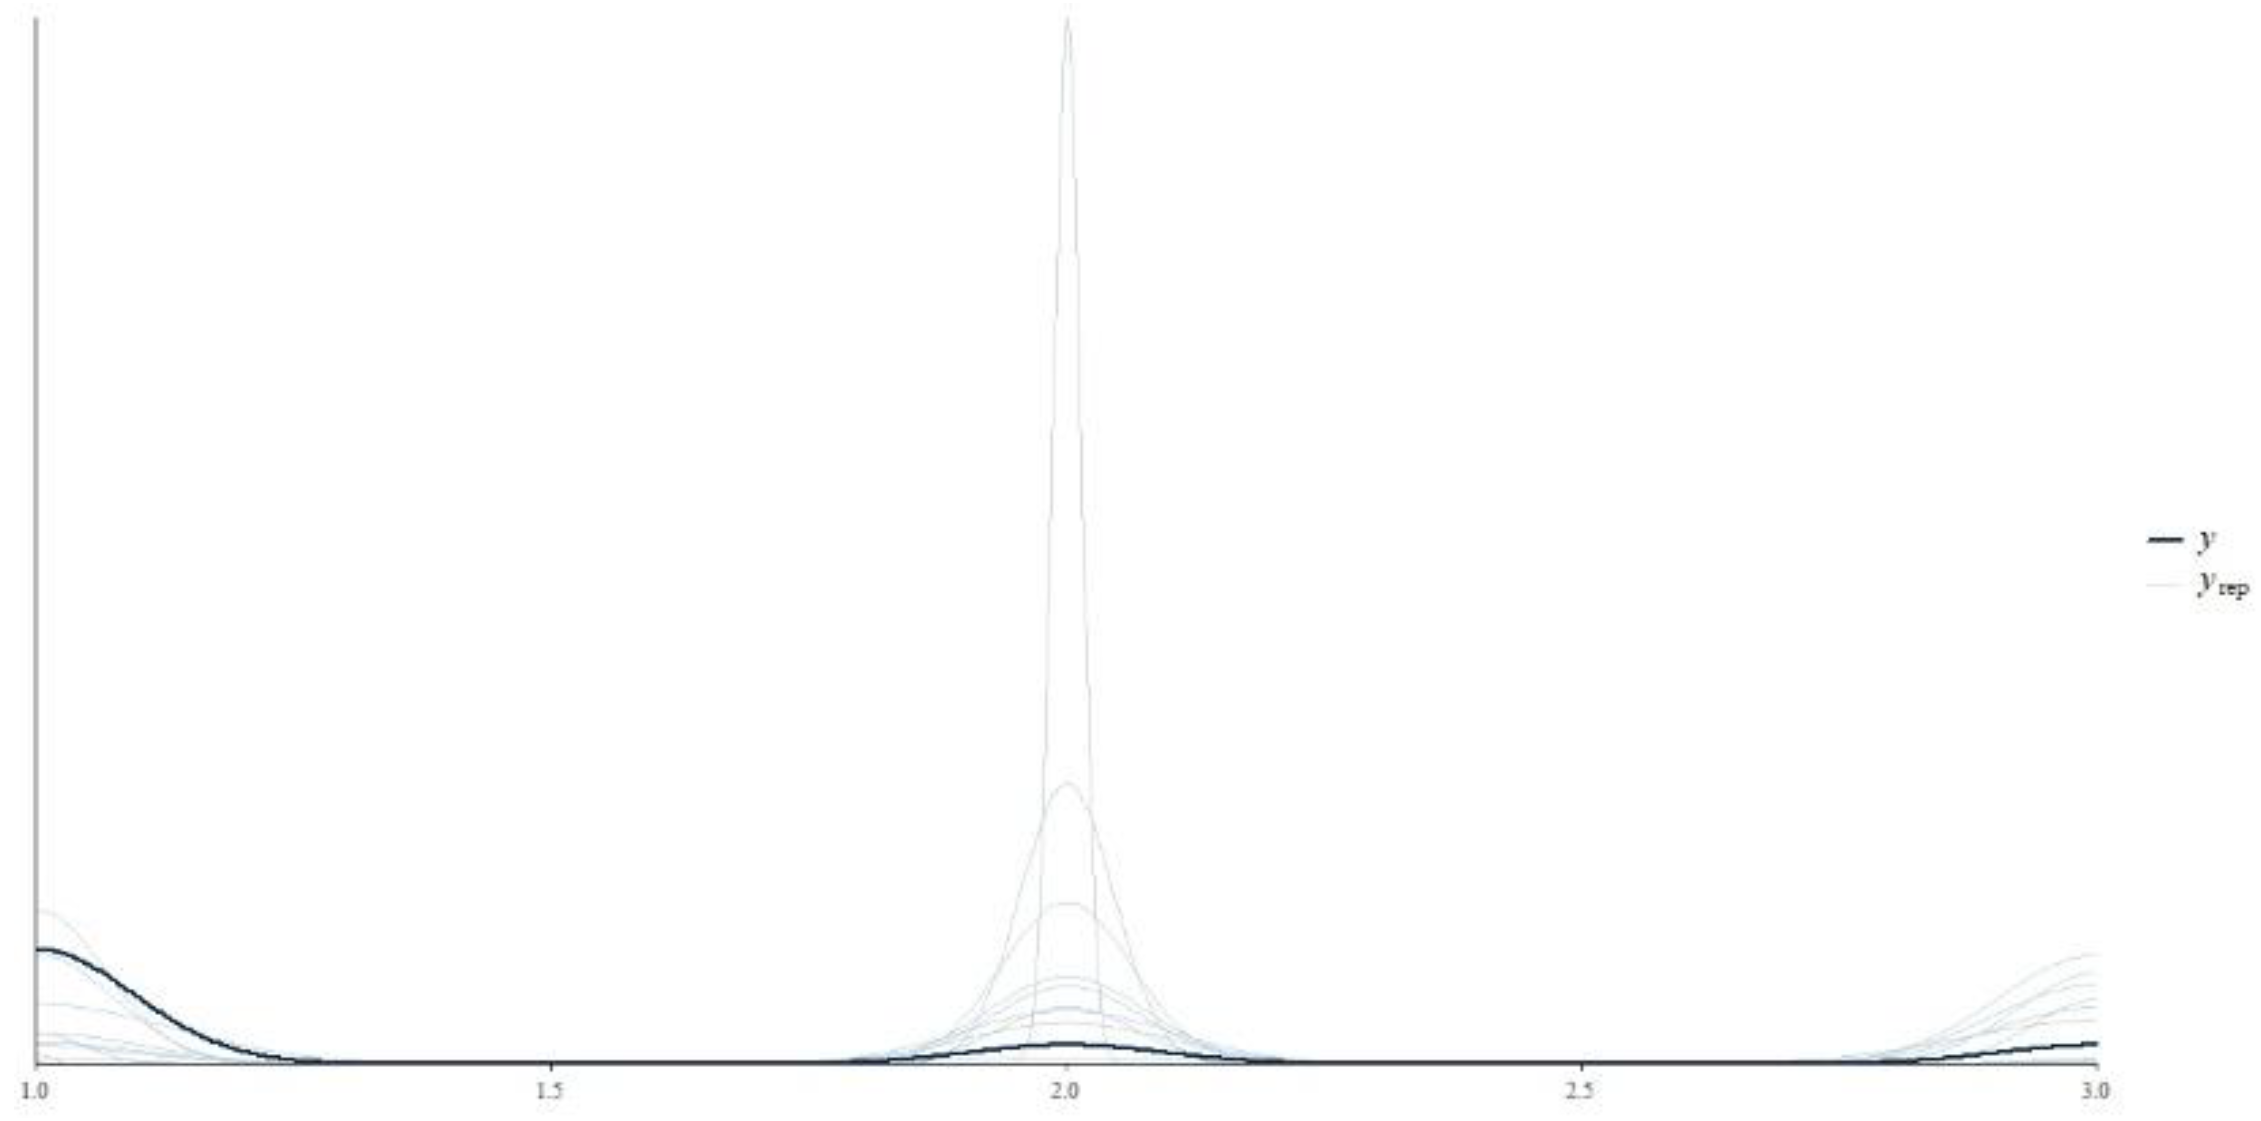
Figure 2.
R-hat for model convergence evaluation.
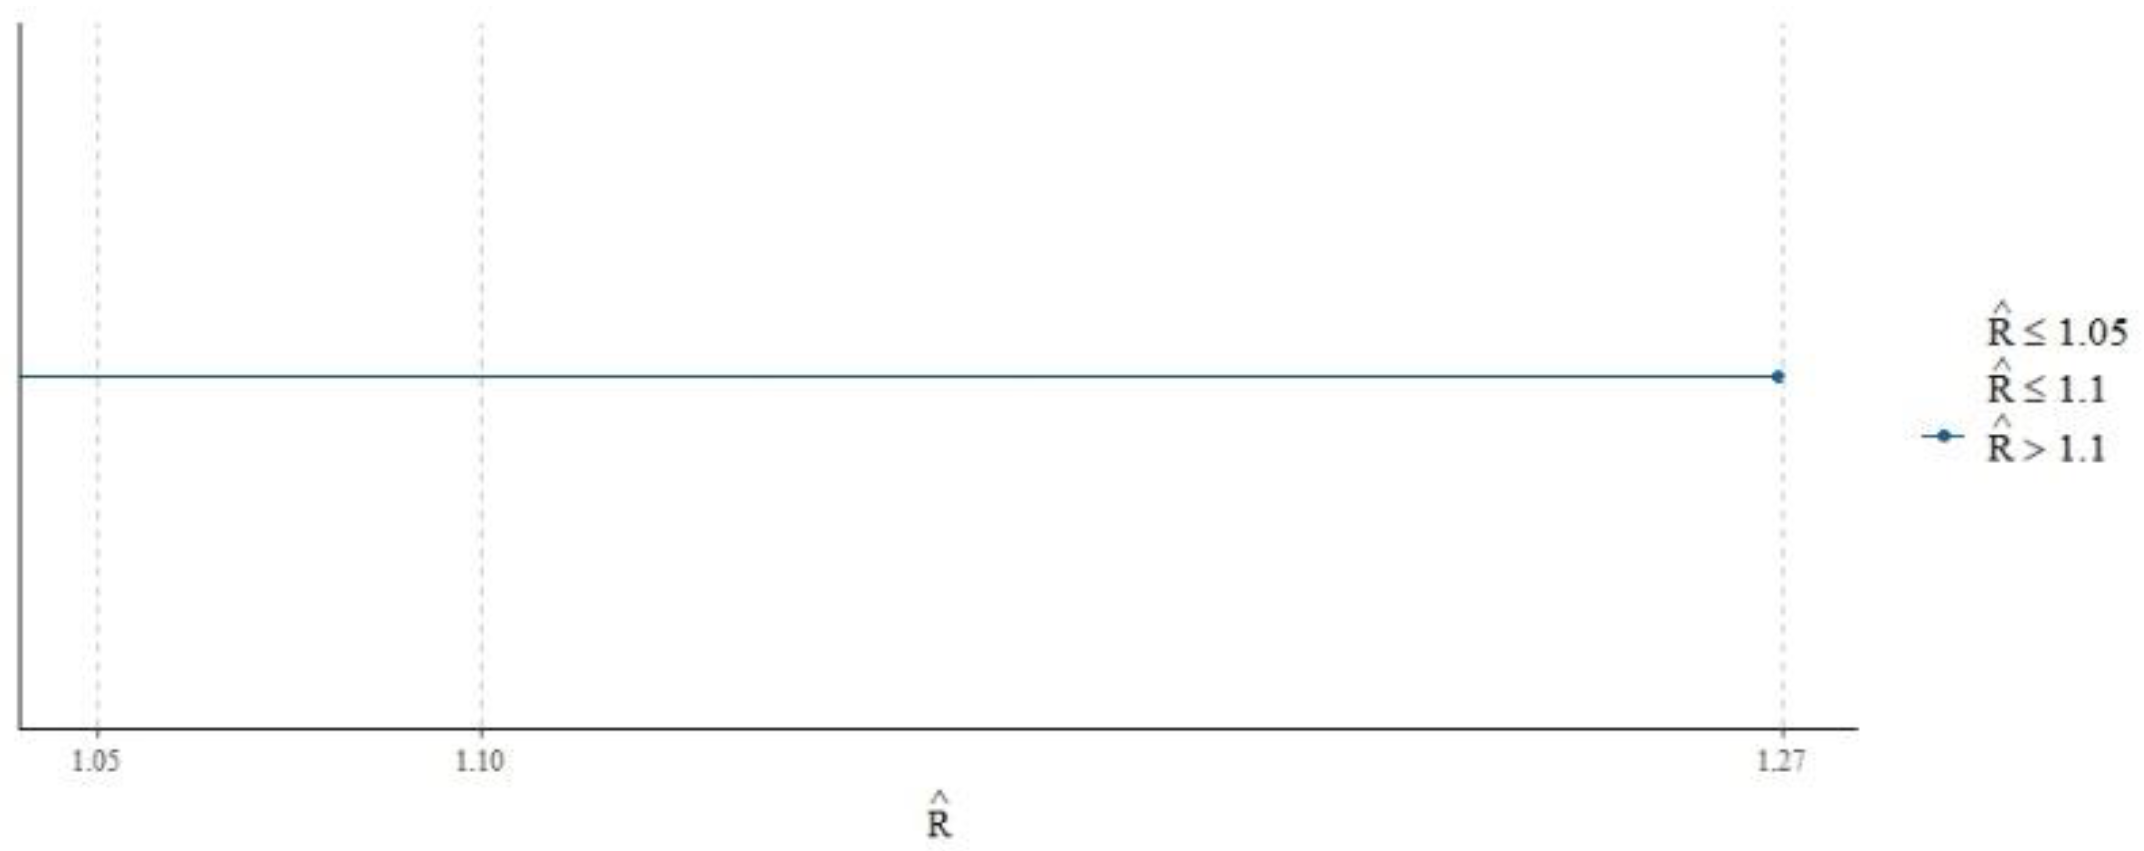
Figure 3.
ESS check for model convergence evaluation.
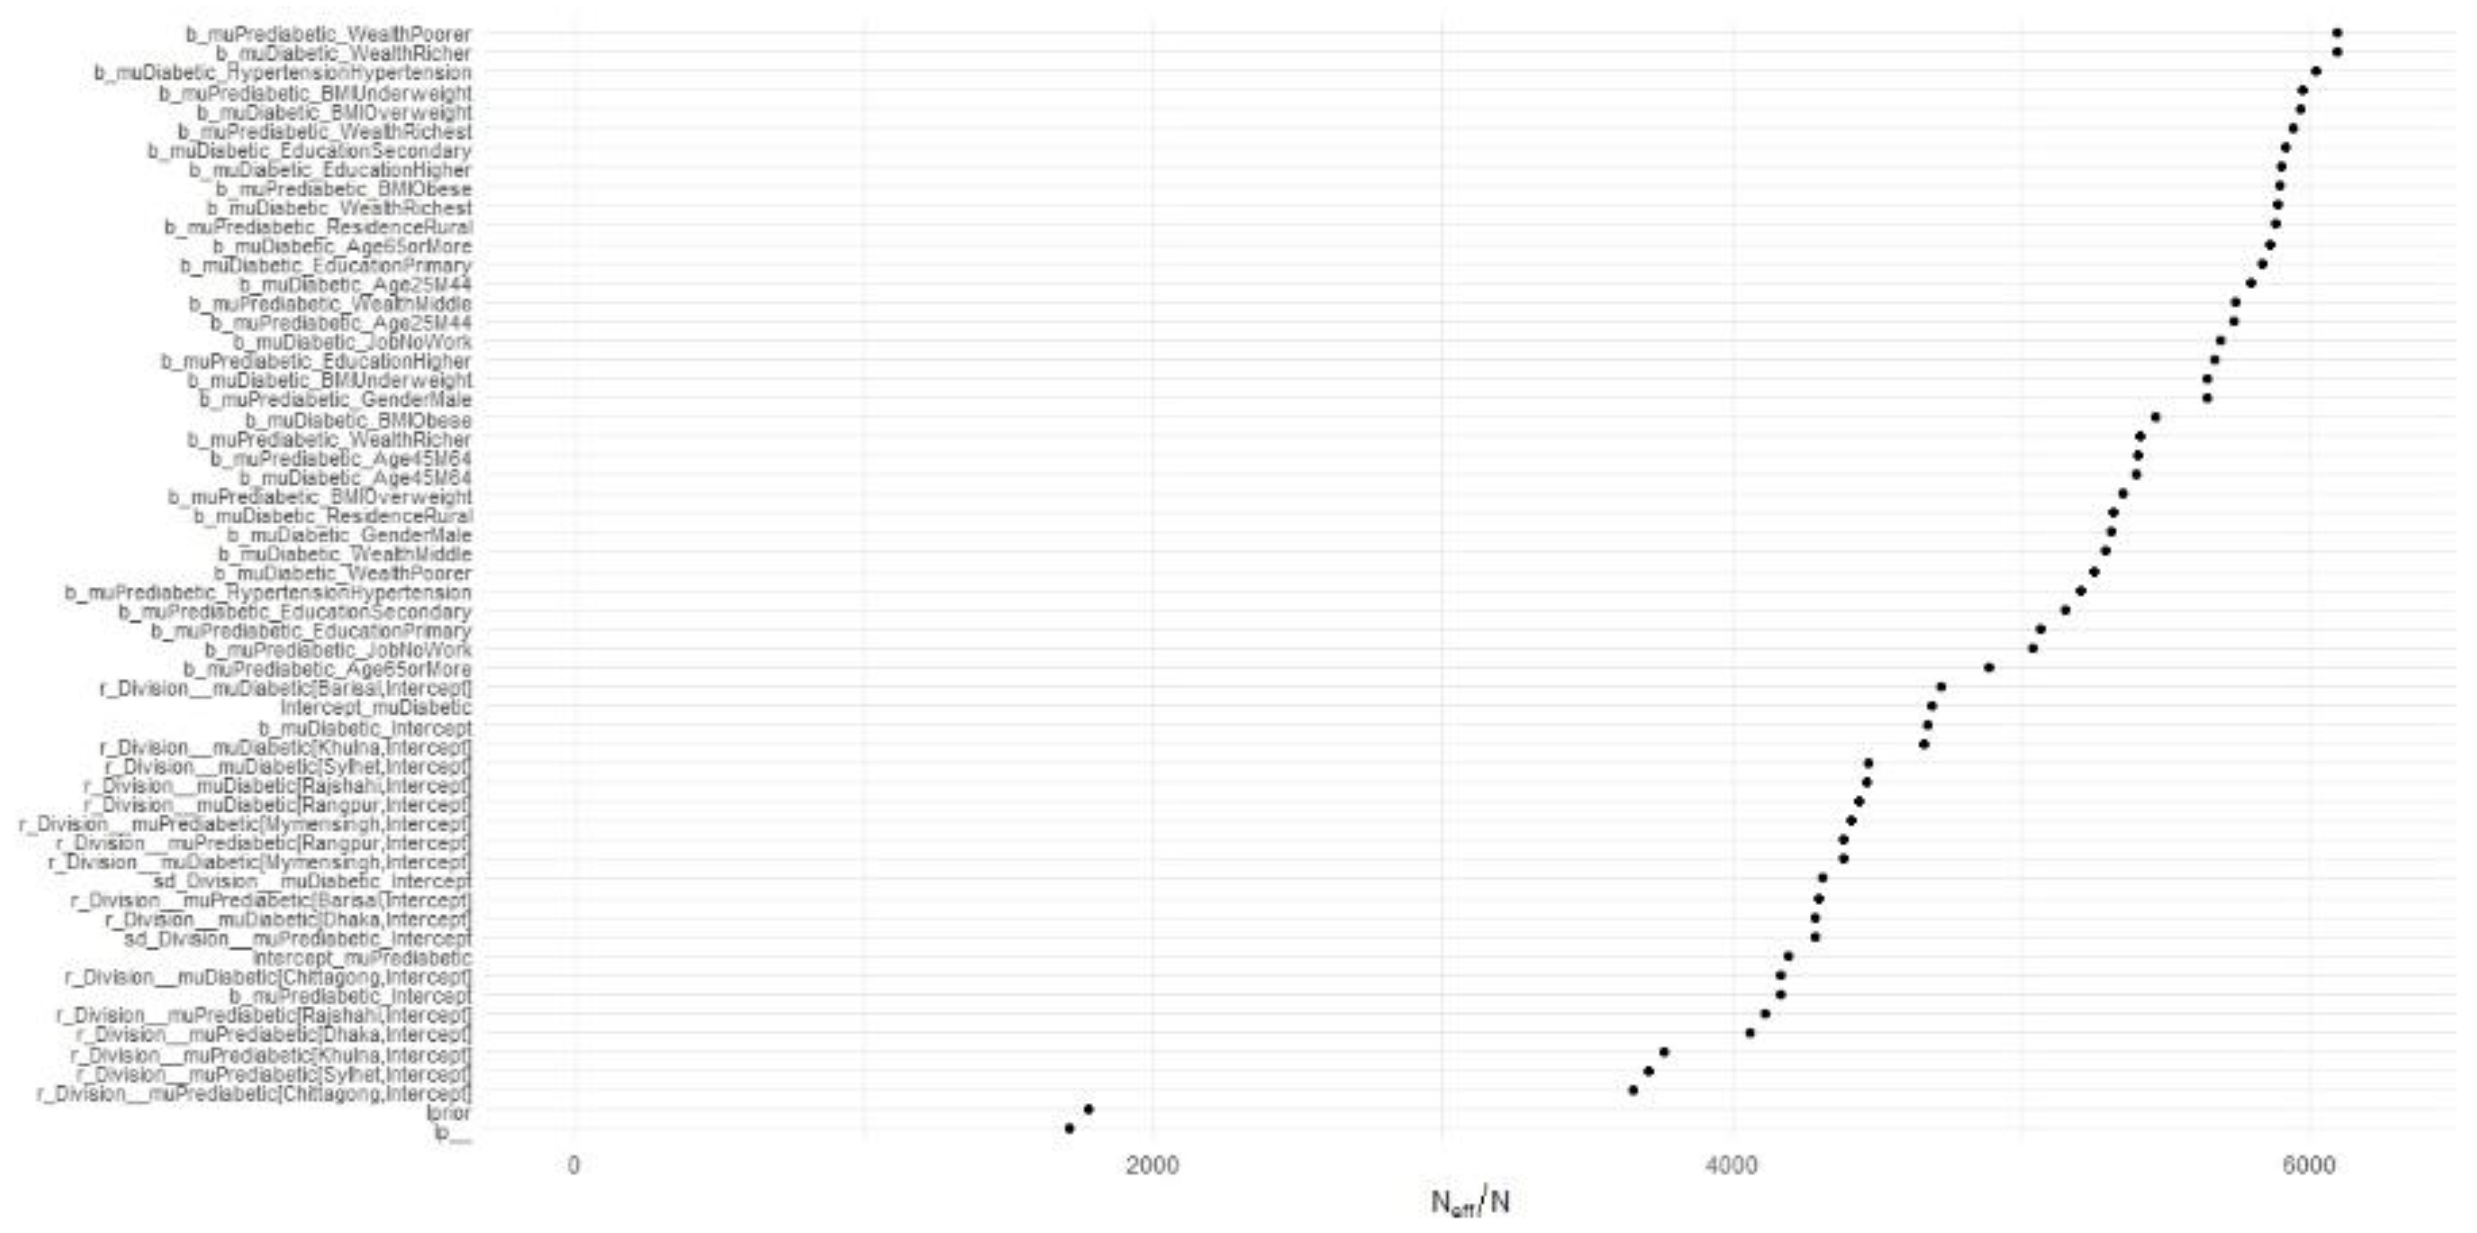
Figure 4.
Posterior predictive checks for model performance evaluation.
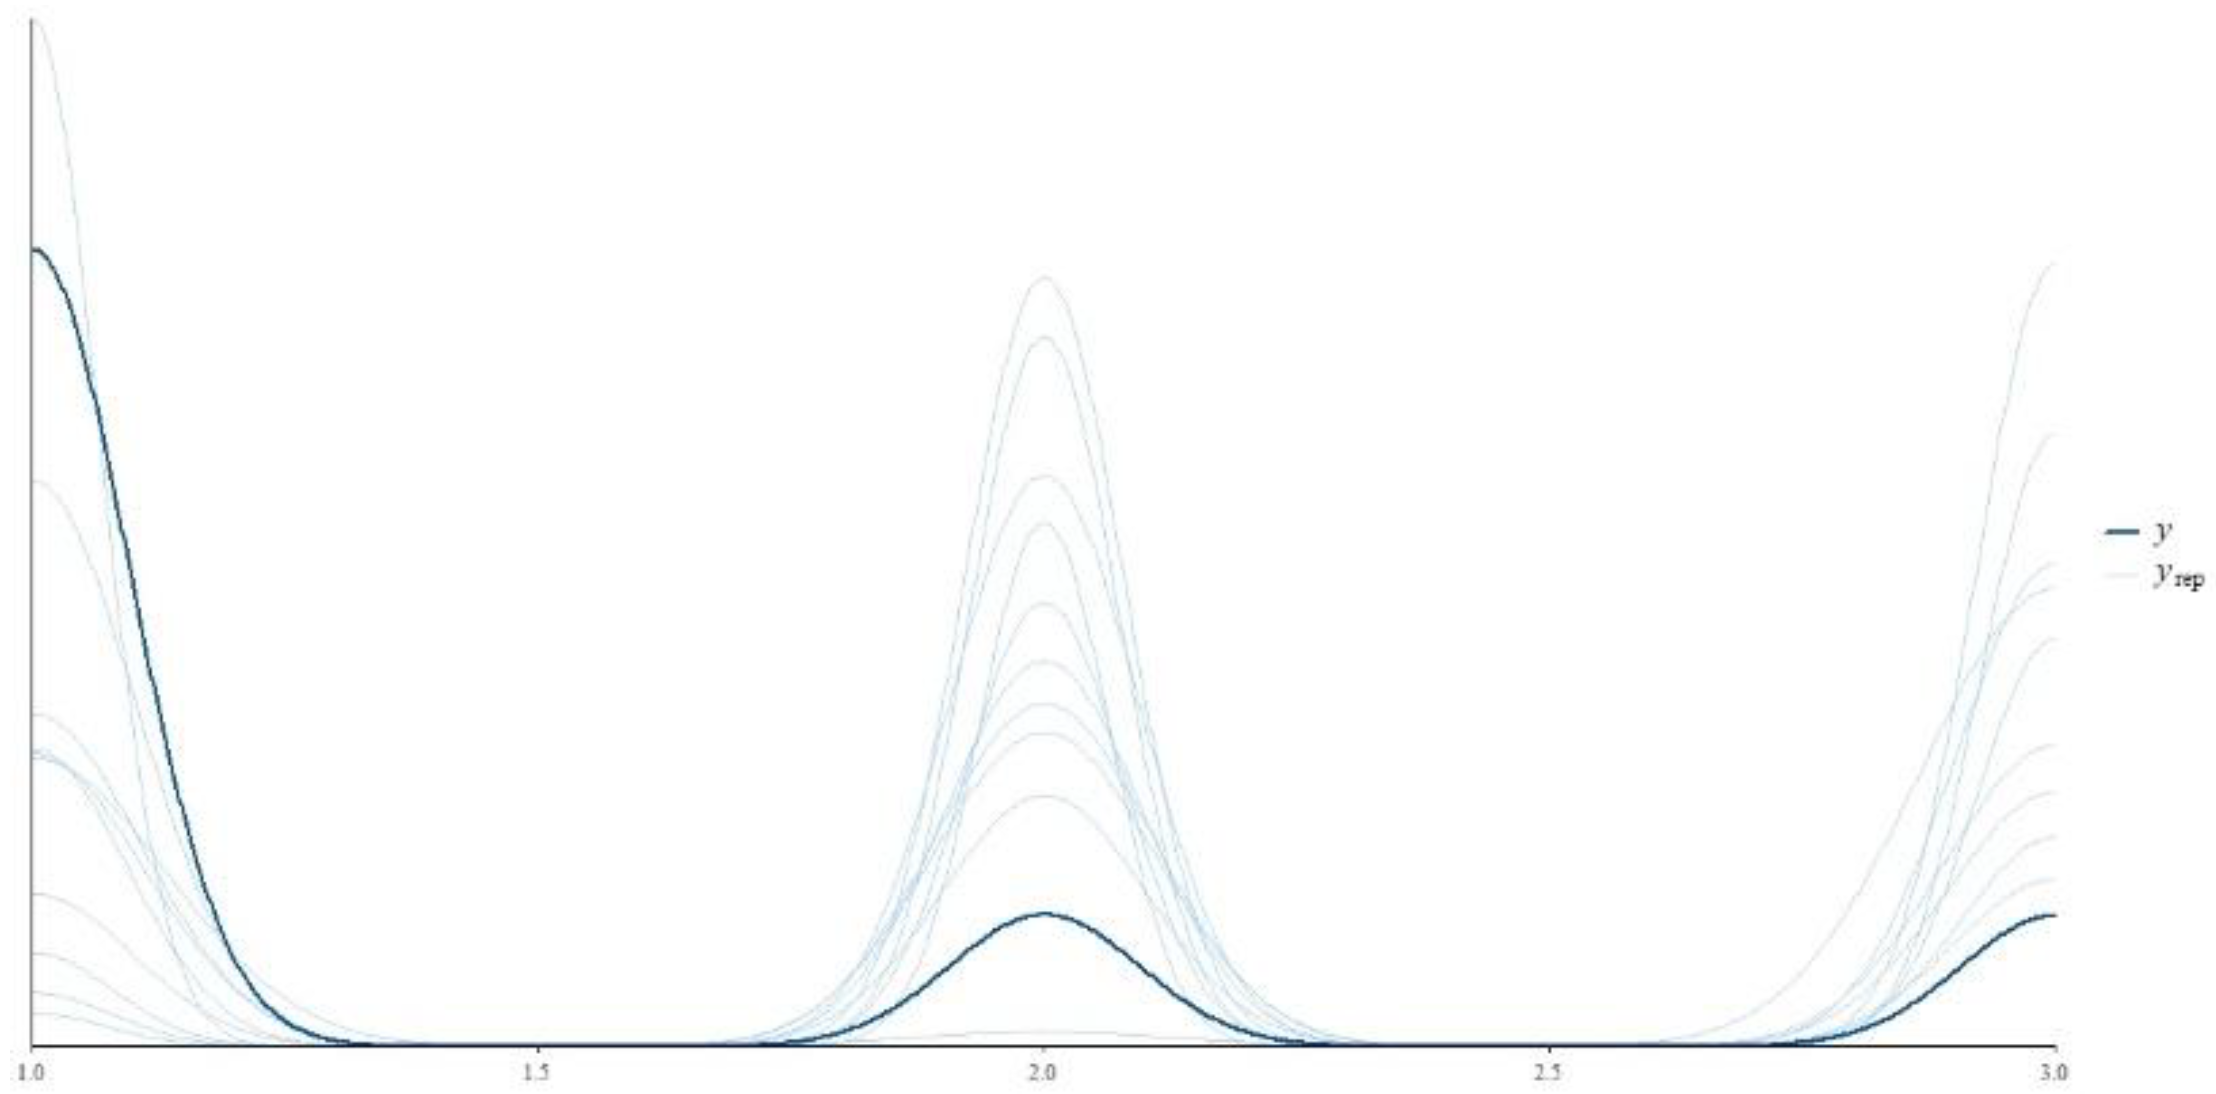

Table 1.
Distribution of the variables in the dataset.
| Variables | Categories | Frequency | Percentages | Proportion Test (p value) |
|---|---|---|---|---|
| Division | Barisal | 1272 | 10.4 | <0.001 |
| Chittagong | 1661 | 13.5 | ||
| Dhaka | 1675 | 13.6 | ||
| Khulna | 1665 | 13.6 | ||
| Mymensingh | 1408 | 11.5 | ||
| Rajshahi | 1591 | 13 | ||
| Rangpur | 1545 | 12.6 | ||
| Sylhet | 1461 | 11.9 | ||
| Residence | Rural | 7837 | 63.8 | <0.001 |
| Urban | 4441 | 36.2 | ||
| Wealth | Poorest | 2419 | 19.7 | <0.001 |
| Middle | 2315 | 18.9 | ||
| Poorer | 2389 | 19.5 | ||
| Richest | 2389 | 19.5 | ||
| Richer | 2766 | 22.5 | ||
| Gender | Male | 6943 | 56.5 | <0.001 |
| Female | 5335 | 43.5 | ||
| Age | Adult | 1174 | 9.6 | <0.001 |
| Young | 2518 | 20.5 | ||
| Middle | 5465 | 44.5 | ||
| Old | 3121 | 25.4 | ||
| Education | Primary | 2025 | 16.5 | <0.001 |
| No Education | 3009 | 24.5 | ||
| Secondary | 3715 | 30.3 | ||
| Higher | 3529 | 28.7 | ||
| Employment | No | 7458 | 60.7 | <0.001 |
| Yes | 4820 | 39.3 | ||
| BMI | Normal Weight | 7285 | 59.3 | <0.001 |
| Underweight | 537 | 4.4 | ||
| Overweight | 2314 | 18.8 | ||
| Obese | 2142 | 17.4 | ||
| Hypertension | No | 2971 | 24.2 | <0.001 |
| Yes | 9307 | 75.8 | ||
| Diabetic Status |
Diabetic | 1527 | 12.4 | <0.001 |
| Normal | 9232 | 75.2 | ||
| Prediabetic | 1519 | 12.4 |
Table 2.
Distribution of the variables among different levels of the response variable.
| Variables | Categories |
Diabetic N (%) |
Non-Diabetic N (%) |
Prediabetic N (%) |
Chi Square (p value) |
| Division | Barisal | 152(11.9%) | 925(72.7%) | 195 (15.3%) | <0.001 |
| Chittagong | 237(14.3%) | 1199(72.2%) | 225(13.5%) | ||
| Dhaka | 363(21.7%) | 982(58.6%) | 330 (19.7%) | ||
| Khulna | 180(10.8%) | 1322(79.4%) | 163(9.8%) | ||
| Mymensingh | 158(11.2%) | 1093(77.6%) | 157(11.2%) | ||
| Rajshahi | 159(10.0%) | 1288(81.0%) | 144(9.1%) | ||
| Rangpur | 100(6.5%) | 1311(84.9%) | 134(8.7%) | ||
| Sylhet | 178(12.2%) | 1112(76.1%) | 171(11.7%) | ||
| Residence | Rural | 805(10.3%) | 6105(77.9%) | 927(11.8%) | <0.001 |
| Urban | 722(16.3%) | 3127(70.4%) | 592(13.3%) | ||
| Wealth | Poorest | 178(7.5%) | 1949(81.6%) | 262(11.0%) | <0.001 |
| Middle | 244(10.1%) | 1923(79.5%) | 252(10.4%) | ||
| Poorer | 186(8.0%) | 1904(82.2%) | 225(9.7%) | ||
| Richest | 606(21.9%) | 1701(61.5%) | 459(16.6%) | ||
| Richer | 313(13.1%) | 1755(73.5%) | 321(13.4%) | ||
| Gender | Male | 671(12.6%) | 4010(75.2%) | 654(12.3%) | <0.001 |
| Female | 856(12.3%) | 5222(75.2%) | 865(12.5%) | ||
| Age | Adult | 207(8.2%) | 2070(82.2%) | 241(9.6%) | <0.001 |
| Young | 627(11.5%) | 4150(75.9%) | 688(12.6%) | ||
| Middle | 519(16.6%) | 2163(69.3%) | 439(14.1%) | ||
| Old | 174(14.8%) | 849(72.3%) | 151(12.9%) | ||
| Education | Primary | 459(12.4%) | 2816(75.8%) | 440(11.8%) | <0.001 |
| No Education | 351(11.7%) | 2270(75.4%) | 388(12.9%) | ||
| Secondary | 444(12.6%) | 2653(75.2%) | 432(12.2%) | ||
| Higher | 273(13.5%) | 1493(73.7%) | 259(12.8%) | ||
| Employment | Work | 719(14.9%) | 3477(72.1%) | 624(12.9%) | <0.001 |
| No Work | 808(10.8%) | 5755(77.2%) | 895(12.0%) | ||
| BMI | Normal Weight | 818(11.2%) | 5617(77.1%) | 850(11.7%) | <0.001 |
| Underweight | 175(8.2%) | 1734(81.0%) | 233(10.9%) | ||
| Overweight | 413(17.8%) | 1566(67.7%) | 335(14.5%) | ||
| Obese | 121(22.5%) | 315(58.7%) | 101(18.8%) | ||
| Hypertension | No | 1000(10.7%) | 7176(77.1%) | 1131(12.2%) | <0.001 |
| Yes | 527(17.7%) | 2056(69.2%) | 388(13.1%) |
Table 3.
Result of Bayesian multinomial mixed effect models.
| Predictor | Levels | Diabetic Response | Prediabetic Response | ||||
| OR | SE | 95% CI | OR | SE | 95% CI | ||
| Intercept | 0.65 | 48.91 | (0.00, 1702.75) | 0.35 | 42.1 | (0.00, 544.57) | |
| Gender | Female | (Ref1) | |||||
| Male | 0.97 | 1.04 | (0.90, 1.05) | 0.98 | 1.12 | (0.79, 1.22) | |
| Age | Adult | (Ref1) | |||||
| Young | 1.26 | 1.03 | (1.19, 1.34) | 1.95 | 1.15 | (1.48, 2.59) | |
| Middle | 1.20 | 1.06 | (1.06, 1.35) | 1.95 | 1.15 | (1.49, 2.56) | |
| Old | 0.73 | 1.07 | (0.64, 0.84) | 1.95 | 1.31 | (1.15, 3.39) | |
| Residence | Urban | (Ref1) | |||||
| Rural | 0.95 | 1.03 | (0.90, 1.01) | 1.22 | 1.19 | (0.87, 1.72) | |
| Wealth | Poor | (Ref1) | |||||
| Poorer | 1.09 | 1.05 | (0.99, 1.21) | 0.94 | 1.23 | (0.63, 1.43) | |
| Middle | 1.13 | 1.06 | (1.00, 1.26) | 1.22 | 1.23 | (0.81, 1.86) | |
| Richer | 1.17 | 1.05 | (1.06, 1.30) | 1.38 | 1.23 | (0.92, 2.08) | |
| Richest | 1.22 | 1.05 | (1.11, 1.35) | 1.79 | 1.27 | (1.13, 2.80) | |
| Education | No | (Ref1) | |||||
| Primary | 0.57 | 1.34 | (0.32, 1.01) | 1.20 | 1.21 | (0.83, 1.73) | |
| Secondary | 0.73 | 1.35 | (0.40, 1.34) | 1.06 | 1.16 | (0.79, 1.42) | |
| Higher | 0.67 | 1.35 | (0.38, 1.20) | 1.06 | 1.17 | (0.77, 1.45) | |
| Employment | No | (Ref1) | |||||
| Yes | 1.14 | 1.06 | (1.02, 1.28) | 0.95 | 1.13 | (0.75, 1.21) | |
| BMI | Normal | (Ref1) | |||||
| Underweight | 1.30 | 1.14 | (1.00, 1.67) | 0.97 | 1.15 | (0.74, 1.27) | |
| Overweight | 1.36 | 1.05 | (1.25, 1.51) | 1.08 | 1.12 | (0.87, 1.34) | |
| Obese | 1.26 | 1.03 | (1.19, 1.34) | 1.31 | 1.19 | (0.95, 1.84) | |
| Hypertension | No | (Ref1) | |||||
| Yes | 3.13 | 1.35 | (1.75, 5.64) | 0.98 | 1.12 | (0.79, 1.21) | |
1 Reference Category
Table 4.
Result of Classification using different ML models with empirical data.
| Models | Accuracy on Classification | |
| Model 1 | Model 2 | |
| Logistic Regression | 0.752 | 0.875 |
| Decision Tree | 0.752 | 0.875 |
| KNN | 0.753 | 0.875 |
| Linear Discriminant Analysis | 0.752 | 0.875 |
| Random Forest | 0.743 | 0.869 |
Table 5.
Simulation results on test accuracy.
| Models | Accuracy on Classification | ||||||||||
| Trinomial | Binomial | ||||||||||
| 40 - 30 - 30 (%) | 40 - 40 - 20 (%) | 50 - 30 - 20 (%) | 60 - 30 -10 (%) | 70 - 20 - 10 (%) | 80 - 10 - 10 (%) | 50 - 50 (%) | 60 - 40 (%) | 70 - 30 (%) | 80 - 20 (%) | 90 - 10 (%) | |
| LR | 0.389 | 0.39 | 0.503 | 0.608 | 0.705 | 0.799 | 0.499 | 0.608 | 0.705 | 0.799 | 0.900 |
| KNN | 0.363 | 0.364 | 0.394 | 0.493 | 0.588 | 0.729 | 0.500 | 0.532 | 0.606 | 0.737 | 0.881 |
| RF | 0.356 | 0.393 | 0.463 | 0.580 | 0.695 | 0.796 | 0.506 | 0.568 | 0.684 | 0.792 | 0.898 |
| DT | 0.394 | 0.406 | 0.507 | 0.608 | 0.705 | 0.799 | 0.493 | 0.608 | 0.705 | 0.799 | 0.900 |
| LDA | 0.389 | 0.389 | 0.507 | 0.608 | 0.705 | 0.799 | 0.499 | 0.608 | 0.705 | 0.799 | 0.900 |
Table 6.
Result of post-hoc Nemenyi test.
| 40-30-30(%) | 40-40-20(%) | 50-30-20(%) | 60-30-10(%) | 70-20-10(%) | 80-10-10(%) | 50-50(%) | 60-40(%) | 70-30(%) | 80-20(%) | |
| 40-40-20(%) | 1.000 | - | - | - | - | - | - | - | - | - |
| 50-30-20(%) | 0.984 | 0.999 | - | - | - | - | - | - | - | - |
| 60-30-10(%) | 0.647 | 0.874 | 0.999 | - | - | - | - | - | - | - |
| 70-20-10(%) | 0.082 | 0.214 | 0.744 | 0.994 | - | - | - | - | - | - |
| 80-10-10(%) | 0.003 | 0.013 | 0.153 | 0.647 | 0.997 | - | - | - | - | - |
| 50-50(%) | 0.984 | 0.999 | 1.000 | 0.999 | 0.744 | 0.153 | - | - | - | - |
| 60-40(%) | 0.579 | 0.828 | 0.998 | 1.000 | 0.997 | 0.713 | 0.998 | - | - | - |
| 70-30(%) | 0.082 | 0.214 | 0.744 | 0.994 | 1.000 | 0.997 | 0.744 | 0.997 | - | - |
| 80-20(%) | 0.003 | 0.013 | 0.153 | 0.647 | 0.997 | 1.000 | 0.153 | 0.713 | 0.997 | - |
| 90-10(%) | 0.000 | 0.001 | 0.018 | 0.192 | 0.852 | 1.000 | 0.018 | 0.237 | 0.852 | 1.000 |
Disclaimer/Publisher’s Note: The statements, opinions and data contained in all publications are solely those of the individual author(s) and contributor(s) and not of MDPI and/or the editor(s). MDPI and/or the editor(s) disclaim responsibility for any injury to people or property resulting from any ideas, methods, instructions or products referred to in the content. |
© 2024 by the authors. Licensee MDPI, Basel, Switzerland. This article is an open access article distributed under the terms and conditions of the Creative Commons Attribution (CC BY) license (http://creativecommons.org/licenses/by/4.0/).
Copyright: This open access article is published under a Creative Commons CC BY 4.0 license, which permit the free download, distribution, and reuse, provided that the author and preprint are cited in any reuse.


