Submitted:
01 August 2024
Posted:
01 August 2024
You are already at the latest version
Abstract
There is paucity of data in the available medical literature regarding the parameters of volumetric perfusion of pancreas grafts.
Materials and methods
From February 5, 2016 to December 23, 2021, we performed perfusion computed tomography in 41 patients at different times after simultaneous pancreas and kidney transplantation. The study group consisted of 18 men (44%) and 23 women (56%) with a long history of type 1 diabetes complicated by terminal chronic renal failure. The results of perfusion computed tomography of the pancreas graft were studied, and the effects of post-transplantation timing and graft revascularization peculiarities on volumetric perfusion parameters were evaluated.
Results
The median arterial blood flow, arterial blood volume, and permeability of the pancreas graft were 115.1 [99.7;130.3] mL/100 mL/min, 46.7 [37.4;56.9] mL/min and 8.6 [4.1;11.4] mL/100 mL/min, respectively. No statistically significant differences in the averaged perfusion values were found in the head, body, and tail of the pancreas graft. The post-transplantation timing and the number of arteries involved in graft revascularization did not have a significant effect on the volumetric perfusion of the graft.
Conclusion
The volumetric perfusion results of the pancreas graft correspond to those obtained in the study of pancreatic perfusion in healthy participants.
Keywords:
Perfusion computed tomography
; pancreas transplantation
1. Introduction
At the current stage of clinical transplantation, the average half-life of pancreas grafts (PGs) is 16.7 years, which corresponds to the half-life of kidney grafts from deceased donors and is the longest among extrarenal organs [1]. PG dysfunction in the long-term post-transplantation period is often due to graft sclerosing processes and microcirculation pathology, both immunologic and non-immunologic [2,3]. Hence, assessment of the PG volumetric intra-organ perfusion is of fundamental importance in pancreas transplantation. The arterial anatomy of the pancreas is usually assessed using various X-ray diagnostics: ultrasonic color Doppler imaging, computed tomography (CT), magnetic resonance imaging (MRI), and selective angiography. The resolution of the images obtained using these methods allows visualization of vessels with a diameter of 1 mm and larger; therefore, they are not useful for assessment of the capillary bed. The problem of pancreatic capillary perfusion assessment can be solved through perfusion computed tomography (PCT): a method of bolus contrast enhancement of the organ enabling subsequent assessment of contrasted blood flow through all the branches of its arteries and veins and its capillary beds.
In 1995, Miles et al described the methodology and evaluated pancreas PCT parameters in patients with different physiological and pathological conditions [4]. In addition, the article presented the parameters of native pancreas perfusion and post-transplantation PG perfusion in one patient with diabetes mellitus. In the following years, reviews [5,6] and original articles were published on native pancreatic perfusion in healthy participants [7,8,9,10,11,12], in participants with inflammatory [8,9,12,13,14] and oncologic lesions of the pancreas [14,15,16,17,18], and in participants with several other diseases [19,20]. Despite the high potential of PCT for objective assessment of PG volumetric perfusion with high spatial and temporal resolution, there is limited application of this method owing to differences in the technical parameters of data acquisition and post-processing, including the use of multivendor devices, as well as the lack of unified reference values for volumetric perfusion of pancreas grafts.
2. Materials and Methods
During the period from February 5, 2016 to December 23, 2021, we performed PCT in 41 patients with adequately functioning kidney and pancreas transplants at different times after simultaneous pancreas and kidney transplantation (SPKT).
2.1. Recipients
The pool of recipients consisted of 18 men (44 %) and 23 women (56 %) with a median age of 34 [31–39] years and a median body mass index of 20.7 [19.4-23.4] kg/m2. The patients had an early onset, and prolonged course, of diabetes mellitus (DM); the median age of DM manifestation was 11 [7,8,9,10,11,12,13,14] years, and the duration of DM at the time of transplantation was 24 [20–29] years. Thirty-eight recipients had received renal replacement therapy: 29 (71 %) through hemodialysis and nine (22 %) through peritoneal dialysis. The median duration of renal replacement therapy was 2 [1,2,3] years. Only three patients underwent pre-dialysis transplantation.
2.2. Donors
Organ explanation, prior to grafting, was performed as part of a multiorgan harvesting procedure in patients with confirmed brain death. In most cases this was due to craniocerebral trauma (n=25, 61 %). In a smaller number of cases it was due to acute cerebrovascular accidents (n=16, 39 %). Most donors were men (n=34, 83 %), and the median age of the donors was 28 [25–32] years.
2.3. Pancreas Transplantation Technique
The majority of patients underwent SPKT with retroperitoneal localization of the PG (n=37, 90 %). Only four patients (10 %) had intraperitoneal localization of the PG. Thirty-four patients (83 %) underwent PG transplantation after preliminary arterial reconstruction using Y-grafts, and seven patients (17 %) had isolated perfusion via the splenic artery system only. In most cases (n=39, 95 %) venous drainage was directed into the inferior vena cava system (systemic venous drainage), while in two cases (5 %) it was directed into the portal vein system. Exocrine drainage of the PG was ensured by duodeno-duodenal (30 recipients / 73 %) or duodeno-jejunal anastomosis (11 recipients / 27 %). The median durations of kidney graft and PG preservation were 8 [6.5-9] and 9 [8-10.5] hours, respectively.
2.4. Immunosuppression
Patients received triple immunosuppressive therapy (IST) including calcineurin inhibitors (tacrolimus, cyclosporine), antimetabolites (mycophenolate mofetil, mycophenolic acid), and glucocorticoids (prednisolone). Tacrolimus was the most commonly used calcineurin inhibitor in basic IST (n = 39, 95.1%). As an induction IST, monoclonal antibodies (basiliximab) were used in 28 patients (68.3%), and polyclonal antibodies (rabbit antithymocyte globulin or equine antithymocyte globulin) were applied in 13 recipients (31.7%).
2.5. PCT Methodology
Selected parameters of the PG intra-organ hemodynamics were evaluated by PCT on a 640-slice Aquilion One CT scanner (Toshiba, Japan). A low-dose protocol with intermittent Abdominal Tumor Perfusion scanning was used. The data acquisition period was 100 seconds. The data acquisition specifications were: tube voltage – 100 kV, tube current – 60 mA, slice thickness – 0.5 mm, rotation time – 0.5 sec, scan area width – 160 mm, and matrix – 512 x 512 pixels. Dynamic studies were performed without breath holding after a short pre-briefing of patients to prevent forced inhalation. Yopromide (Ultravist, Bayer Pharma AG, D-13342, Berlin, Germany), with an iodine concentration of 370 mg/ml, was used as a contrast medium. Contrast medium was injected in an amount of 0.5 ml per kilogram of the patient's body weight at a rate of 6–7 ml/sec. The median volume of the injected contrast medium was 30 [26.5;33.5] ml. Post-processing and analysis of the data array obtained were performed by the Maximum Slope method on the Vitrea workstation (Vital inc., USA). The PCT data of all the patients were analyzed by two radiologists independently of each other. The study was observer-blinded: the radiologists did not have information on the postoperative period, results of other clinical investigations, and treatment outcomes. A reference arterial and parenchymal input curve was obtained by placing regions of interest (ROIs) in the aorta and pancreatic tissue, followed by blood vessel segmentation and calculation of perfusion maps. ROIs were placed in the normal parenchyma of the head, body, and tail of the pancreas. Vascular structures were avoided when placing ROIs. The area of the ROIs was standardized for both radiologists at 15 mm2. Perfusion parameters, such as arterial blood flow (ABF), arterial blood volume (ABV), and permeability, were analyzed on these maps (Figure 1).
First, the volumetric perfusion parameters in the head, body, and tail of the PG were compared. Thereafter, the patients were divided into three groups to ensure reliable assessment of the effects of post-transplantation timing on PG volumetric perfusion parameters. Group I included patients with the study timing up to 1-year post-transplantation (n=15, 37 %), Group II was 1 to 3 years (n=14, 34 %), and Group III was more than 3 years (n=12, 29 %). These groups showed no statistically significant differences (P<0.05) in parameters related to the recipients, donors, and surgical techniques used.
To reliably assess the possible effect of the number of PG perfusion-critical arteries (isolated blood flow via the splenic artery system or arterial reconstruction using a Y-graft) on the volumetric perfusion parameters, the patients were divided into two groups: IISABS and IIY-graft. The IISABS group comprised seven patients, and the IIY-graft group consisted of 34 patients. These groups also showed no statistically significant differences (P<0.05) in recipient-related and donor-related factors and surgical technique parameters.
2.6. Estimation of Effective Radiation Dose (Radiation Exposure)
The effective radiation dose E was calculated by the formula: E = DLP*Edlp, where DLP (Dose Length Product) was the dose absorbed during the whole CT study with the scan length considered. Edlp was the normalized effective dose for a specific study area. According to the “European Guidelines on Quality Criteria for Computed Tomography”, Edlp for the abdominal cavity is 0.015.
2.7. Statistical Analysis
Statistical analysis of the data was performed using Statistica for Windows v. 10.0, (StatSoft Inc. USA) software package. The normality of distribution was checked with the Shapiro–Wilk test. The following tests were used to compare the quantitative characteristics of different groups: the Mann–Whitney test for two independent groups, the Wilcoxon test for two related groups, the Kruskal–Wallis test for three independent groups, and the Friedman test for three related groups. Differences were considered statistically significant at P<0.05 for single comparisons and P<0.017 for pairwise comparisons, with Bonferroni adjustment considered.
3. Results
3.1. The Volumetric Perfusion Results of the Pancreas Graft
The medians of the patients' PCT results, obtained by both radiologists, are presented in Table 1.
No statistically significant differences were found between the PCT results obtained by both radiologists: ABF 114 [98.8;130.3] vs 116.3 [103.8;128.1], p=0,18, ABV 47 [37.2;56.9] vs 46.1 [38.2;56.9], p=0,24 and Perm 8.5 [4.1;11.4] vs 8.6 [4.2;11.4], p=0,12.
The medians of the PCT results in different parts of the PG are presented in Table 2.
Statistically significant differences were noted in the ABF values obtained by Radiologist 1: when comparing the ABF values in the body and tail (118.2 [101.9;134.3] mL/100 mL/min vs 110.7 [96.5;129.8] mL/100 mL/min, P=0.016) with those in the head and tail (116.9 [97.9;127.8] mL/100 mL/min vs 110.7 [96.5;129.8] mL/100 mL/min, P=0.01), the tail value was smaller. No statistically significant differences were noted in the volumetric perfusion values obtained by Radiologist 2 (PABF(h-b-t) =0.84, PABV(h-b-t) =0.39, PPerm(h-b-t) =0.67). Comparison of the values obtained by the two radiologists showed that the ABF and ABV tail measurements were poorly reproduced: the values obtained by Radiologist 2 were significantly larger than those obtained by Radiologist 1(ABF(t)R1 110.7 [96.5;129.8] mL/100 mL/min vs ABF(t)R2 118.4 [101.2;131.2] mL/100 mL/min, P=0.003 and ABV(t)R1 42.4 [35.5;54] mL/min vs ABV(t)R2 44.7 [38.9;59.3] mL/min, P=0.036). However, no other statistically significant differences were noted, including no differences in the averaged values in the parts of the PG.
3.2. The Impact of the Timing of Pancreas Transplantation on the Volumetric Perfusion of Pancreas Graft
The comparative analysis of the PCT data obtained by each radiologist for the three groups of patients, based on post-SPKT timing, is presented in Table 3 and Table 4 and Figure 2.
No statistically significant differences were found when comparing the values obtained by both radiologists for each group (Group 1: PABF R1-ABF R2 =0,21, PABV R1-ABV R2 =0,23, PPerm R1- Perm R2 =0,29; Group 2: PABF R1-ABF R2 =0,38, PABV R1-ABV R2 =0,67, PPerm R1- Perm R2 =0,81; Group 3: PABF R1-ABF R2 =0,67, PABV R1-ABV R2 =0,32, PPerm R1- Perm R2 =0,12) (Table 4).
3.3. The Impact of the Revascularization Peculiarities on the Volumetric Perfusion of Pancreas Graft
The data presented in Table 5 and Table 6 and Figure 3 were obtained during the assessment of the possible effect of revascularization peculiarities.
Surprisingly, the ABF values for the IISABS group were higher than those of the IIY-graft group (Radiologist 1: ABF IISABS 128.1 [110.7;154] mL/100 mL/min vs ABF IIY-graft 113 [97.8;127.6] mL/100 mL/min; Radiologist 2: ABF IISABS 126.7 [112.3;146.4] mL/100 mL/min vs ABF IIY-graft 115 [101.8;127.8] mL/100 mL/min) however, no statistically significant differences were noted between the PG volumetric perfusion parameter results in cases with isolated revascularization through the splenic artery compared to those with revascularization through the superior mesenteric and splenic arteries using a Y-graft (Radiologist 1: PABF I ISABS-II Y-graft = 0.15, PABV I ISABS-II Y-graft=0.82, PPerm I ISABS-II Y-graft=0.89; Radiologist 2: PABF I ISABS-II Y-graft = 0.28, PABV I ISABS-II Y-graft=0.59, PPerm I ISABS-II Y-graft=0.94) (Table 5) and (Group IISABS: PABF R1-ABF R2 =0,6, PABV R1-ABV R2 =0,46, PPerm R1- Perm R2 =0,69; Group IIY-graft: PABF R1-ABF R2 =0,06, PABV R1-ABV R2 =0,31, PPerm R1- Perm R2 =0,07) (Table 6).
3.4. The Impact of Donor-Related, Recipient-Related and Surgical Factors on the ABF Values of the Pancreas Graft
The analysis showed significant differences in the PG ABF values of the studied recipients. These values were used as a basis to divide the patients into three groups: Group Iperf consisted of patients with ABF values above 120 mL/100 mL/min, Group IIperf from 100 to 120 mL/100 mL/min, and Group IIIperf below 100 mL/100 mL/min. Analysis and comparison of recipient-related, donor-related, and surgical factors in groups Iperf, IIperf, and IIIperf showed that none of them had a statistically significant effect on the degree of pancreas graft perfusion.
3.5. Effective Radiation Dose (Radiation Exposure)
The mean effective dose during the perfusion study was 12.6 mEv.
4. Conclusion
Single-stage assessment of the entire pancreas graft has become possible with the advent of advanced equipment with a wide detector, which allows the performance of volumetric studies up to 16 cm in length. Despite the potential of PCT for objective assessment of volumetric perfusion of PGs with high spatial and temporal resolution, there is limited application of this method because of the differences in the technical parameters of data acquisition and post-processing, including the use of multivendor devices. In addition, the lack of unified reference values of pancreatic volumetric perfusion for various pancreas-related diseases, and for healthy participants, hinders wide and routine use of the method.
We conducted a pilot study of PG perfusion using the PCT method in 41 patients after SPKT, as there is still a dearth of data on this problem in the publicly available medical literature. According to D. T. Doherty et al., PCT is a promising method of PG imaging, which may improve the quality of PG volumetric perfusion assessment and assist in the diagnosis of early vascular and later immunologic complications, as well as the degree of total fibrosis in the PG [23].
This study of the volumetric perfusion of the PG parenchyma using PCT in 41 patients with functioning kidney and pancreas grafts at different times after SPKT showed the following averaged results: ABF 115.1 [99.7;130.3] mL/100 mL/min, ABV 46.7 [37.4;56.9] mL/min, and permeability 8.6 [4.1;11.4] mL/100 mL/min. The results from our study (Figure 4) correspond to the data obtained in the study of perfusion in healthy participants who formed the control group in some studies [7,8,9,10,11,12].
No statistically significant differences were noted when comparing the average values of the volumetric perfusion parameters for the head, body, and tail of the PG, as obtained by the two radiologists. Occasional statistically significant differences between the intra-organ volumetric perfusion parameter values obtained by these radiologists were probably caused by the different levels of value determination, which confirms the necessity of analyzing the values averaged from 3–5 sites.
No statistically significant differences between PCT results were noted in patients divided into groups based on post-SPKT timing. This may indicate that the perfusion of the organ does not change significantly with time, but depends on the initial parameters; however, this warrants further study.
Patients with isolated PG perfusion via the splenic artery system, who underwent technically successful SPKT, showed a richer graft perfusion; however, statistically significant differences were not noted when compared with the results of the patients with PG perfusion via the superior mesenteric and splenic arteries.
Limitations of the Study
The retrospective nature of the study inherently limits the ability to establish causality. Such designs are more prone to biases and confounding factors that cannot be controlled as effectively as in prospective studies. Given the study’s retrospective design and the specific patient population from a single geographic location, the results may not be generalizable to all simultaneous pancreas-kidney recipients. The study may not have controlled for all potential confounding factors, such as variations in immunosuppressive therapy regimens, patient comorbidities, and lifestyle factors that could influence the pancreas graft volume blood supply. Pancreas graft volumetric perfusion parameters in recipients with isolated revascularization through the splenic artery only were conducted on a limited subset of patients (7 out of 41), which may not provide a comprehensive view of the microcirculatory bed of the pancreas graft with isolated splenic artery blood supply. This small sample size limits the generalizability of the findings regarding the volume blood supply in these recipients. Volumetric perfusion parameters of the pancreas graft were evaluated exclusively in patients with functioning grafts, and were not evaluated in patients with lost pancreas graft function, in patients with active pancreas graft rejection and with histologically verified toxicity of calcineurin inhibitors. These limitations restrict the ability to generalize these results to all pancreas grafts. Among other things, the authors did not assess the correlation between pancreas graft volume blood supply parameters and markers of pancreatic endocrine function.
Author Contributions
(I) Conception and design: Dmitriev Ilya Victorovich, Anisimov Yuriy Andreevich, Ternovoy Sergey Konstantinovich, Serova Natalya Sergeevna (II) Administrative support: Dmitriev Ilya Victorovich, Anisimov Yuriy Andreevich, Ternovoy Sergey Konstantinovich, Serova Natalya Sergeevna (III) Provision of study materials or patients: Dmitriev Ilya Victorovich, Anisimov Yuriy Andreevich, Muslimov Rustam Shakhismailovich, Shchekoturov Igor Olegovich (IV) Collection and assembly of data: Dmitriev Ilya Victorovich, Anisimov Yuriy Andreevich, Muslimov Rustam Shakhismailovich, Shchekoturov Igor Olegovich (V) Data analysis and interpretation: Dmitriev Ilya Victorovich, Anisimov Yuriy Andreevich, Muslimov Rustam Shakhismailovich, Shchekoturov Igor Olegovich, Shchelykalina Svetlana Pavlovna, (VI) Manuscript writing: All authors (VII) Final approval of manuscript: All authors.
Funding
This study was sponsored by the Moscow Center for Innovative Technologies in Healthcare.
Institutional Review Board Statement
The authors are accountable for all aspects of the work in ensuring that questions related to the accuracy or integrity of any part of the work are appropriately investigated and resolved. The trial was conducted in accordance with the Declaration of Helsinki (as revised in 2013). The study was approved by institutional ethics committee of 22.07.2013 № 3-13 & of 26.04.2022 № 4-22.
Informed Consent Statement
Informed consent was taken from all individual participants.
Data Availability Statement
The raw data supporting the conclusions of this article will be made available by the authors on request.
Acknowledgments
The study was sponsored by the Moscow Center for Innovative Technologies in Healthcare. The authors gratefully acknowledge the informational support provided by RP CANON MEDICAL SYSTEMS, LLC for the preparing of this article.
Conflicts of Interest
All authors have completed the ICMJE uniform disclosure form. The authors have no conflicts of interest to declare.
Abbreviations
| ABF | arterial blood flow. |
| ABV | arterial blood volume. |
| CT | computed tomography. |
| DLP | dose length product. |
| DM | diabetes mellitus. |
| ISABS | isolated splenic artery blood supply. |
| MRI | magnetic resonance imaging. |
| PCT | perfusion computed tomography. |
| PERM | permeability. |
| PG | pancreas graft. |
| ROI | regions of interest. |
| SPKT | simultaneous pancreas and kidney transplantation. |
References
- Boggi U, Vistoli F, Egidi FM, Marchetti P, De Lio N, Perrone V, Caniglia F, Signori S, Barsotti M, Bernini M, Occhipinti M, Focosi D, Amorese G. Transplantation of the pancreas. Curr Diab Rep 2012;12(5):568-79. [CrossRef]
- Papadimitriou JC, Drachenberg CB, Klassen DK, Gaber L, Racusen LC, Voska L, Cangro CB, Ramos E, Wali R, Weir MR, Bartlett ST. Histological grading of chronic pancreas allograft rejection/graft sclerosis. Am J Transplant 2003;3(5):599-605. [CrossRef]
- Patil DT, Yerian LM. Pancreas transplant: recent advances and spectrum of features in pancreas allograft pathology. Adv Anat Pathol 2010;17(3):202-8. [CrossRef]
- Miles KA, Hayball MP, Dixon AK. Measurement of human pancreatic perfusion using dynamic computed tomography with perfusion imaging. Br J Radiol 1995;68(809):471-5. [CrossRef]
- Tsushima Y, Miyazaki M, Taketomi-Takahashi A, Endo K. Feasibility of measuring human pancreatic perfusion in vivo using imaging techniques. Pancreas 2011;40(5):747-52. [CrossRef]
- Grözinger G, Grözinger A, Horger M. The role of volume perfusion CT in the diagnosis of pathologies of the pancreas. Rofo 2014;186(12):1082-93. [CrossRef]
- Tsuji Y, Yamamoto H, Yazumi S, Watanabe Y, Matsueda K, Yamamoto H, Chiba T. Perfusion computerized tomography can predict pancreatic necrosis in early stages of severe acute pancreatitis. Clin Gastroenterol Hepatol 2007;5(12):1484-92. [CrossRef]
- Lu N, Feng XY, Hao SJ, Liang ZH, Jin C, Qiang JW, Guo QY. 64-slice CT perfusion imaging of pancreatic adenocarcinoma and mass-forming chronic pancreatitis. Acad Radiol 2011;18(1):81-8. [CrossRef]
- Delrue L, Blanckaert P, Mertens D, Van Meerbeeck S, Ceelen W, Duyck P. Tissue perfusion in pathologies of the pancreas: assessment using 128-slice computed tomography. Abdom Imaging 2012;37(4):595-601. [CrossRef]
- Kanda T, Yoshikawa T, Ohno Y, Fujisawa Y, Kanata N, Yamaguchi M, Seo Y, Yano Y, Koyama H, Kitajima K, Takenaka D, Sugimura K. Perfusion measurement of the whole upper abdomen of patients with and without liver diseases: initial experience with 320-detector row CT. Eur J Radiol 2012;81(10):2470-5. [CrossRef]
- Xie Q, Wu J, Tang Y, Dou Y, Hao S, Xu F, Feng X, Liang Z. Whole-organ CT perfusion of the pancreas: impact of iterative reconstruction on image quality, perfusion parameters and radiation dose in 256-slice CT-preliminary findings. PLoS One 2013;8(11):e80468. [CrossRef]
- Yadav AK, Sharma R, Kandasamy D, Bhalla AS, Gamanagatti S, Srivastava DN, Upadhyay AD, Garg PK. Perfusion CT: can it predict the development of pancreatic necrosis in early stage of severe acute pancreatitis? Abdom Imaging 2015;40(3):488-99. [CrossRef]
- Pieńkowska J, Gwoździewicz K, Skrobisz-Balandowska K, Marek I, Kostro J, Szurowska E, Studniarek M. Perfusion-CT--Can We Predict Acute Pancreatitis Outcome within the First 24 Hours from the Onset of Symptoms? PLoS One 2016;11(1):e0146965. [CrossRef]
- Aslan S, Nural MS, Camlidag I, Danaci M. Efficacy of perfusion CT in differentiating of pancreatic ductal adenocarcinoma from mass-forming chronic pancreatitis and characterization of isoattenuating pancreatic lesions. Abdom Radiol (NY) 2019;44(2):593-603. [CrossRef]
- Li HO, Guo J, Sun C, Li X, Qi YD, Wang XM, Xu ZD, Chen JH, Liu C. Assessment of pancreatic adenocarcinoma: Use of low-dose whole pancreatic CT perfusion and individualized dual-energy CT scanning. J Med Imaging Radiat Oncol 2015;59(5):590-8. [CrossRef]
- Yadav AK, Sharma R, Kandasamy D, Pradhan RK, Garg PK, Bhalla AS, Gamanagatti S, Srivastava DN, Sahni P, Upadhyay AD. Perfusion CT - Can it resolve the pancreatic carcinoma versus mass forming chronic pancreatitis conundrum? Pancreatology 2016;16(6):979-987. [CrossRef]
- Kovač JD, Đurić-Stefanović A, Dugalić V, Lazić L, Stanisavljević D, Galun D, Mašulović D. CT perfusion and diffusion-weighted MR imaging of pancreatic adenocarcinoma: can we predict tumor grade using functional parameters? Acta Radiol 2019;60(9):1065-1073. [CrossRef]
- Bao J, Liu A, Zhao C, Hao F, Su X, Bao L, Zhao L. Correlation Between Dual-Energy Computed Tomography Single Scan and Computed Tomography Perfusion for Pancreatic Cancer Patients: Initial Experience. J Comput Assist Tomogr 2019;43(4):599-604. [CrossRef]
- Bize PE, Platon A, Becker CD, Poletti PA. Perfusion measurement in acute pancreatitis using dynamic perfusion MDCT. AJR Am J Roentgenol 2006;186(1):114-8. [CrossRef]
- Yin Y, Jiang J. JOG Technique Versus Nonspiral Axial Scan in Pancreatic Perfusion Computed Tomography Imaging and Their Preliminary Application. J Comput Assist Tomogr 2016;40(6):880-885. [CrossRef]
- Pinchuk AV, Dmitriev IV, Anisimov YA, Storozhev RV, Balkarov AG, Kondrashkin AS, Khodilina IV, Muslimov RS. Pancreas transplantation with isolated splenic artery blood supply - Single center experience. Asian J Surg 2020;43(1):315-321. [CrossRef]
- Muslimov RSH, Ternovoy SK, Serova NS, Anisimov YuA, Storozhev RV, Pinchuk AV. A technique of evaluating of pancreas graft perfusion using dynamic volume computed tomography. REJR 2017;7(4):74-82. Russian. [CrossRef]
- Doherty DT, Khambalia HA, Summers A, Moinuddin Z, Yiannoullou P, Krishnan A, Augustine T, Naish JH, van Dellen D. Future imaging modalities for the assessment of pancreas allografts a scan of the horizon. Transplant Rev (Orlando) 2022;36(2):100692. [CrossRef]
Figure 1.
Volumetric blood flow indicators in the tail of the pancreas graft. A – Conventional CT. The ROI is highlighted with a contour – pancreas graft; B – arterial blood flow (ABF); C – arterial blood volume (ABV); D – Permeability (Perm).
Figure 1.
Volumetric blood flow indicators in the tail of the pancreas graft. A – Conventional CT. The ROI is highlighted with a contour – pancreas graft; B – arterial blood flow (ABF); C – arterial blood volume (ABV); D – Permeability (Perm).
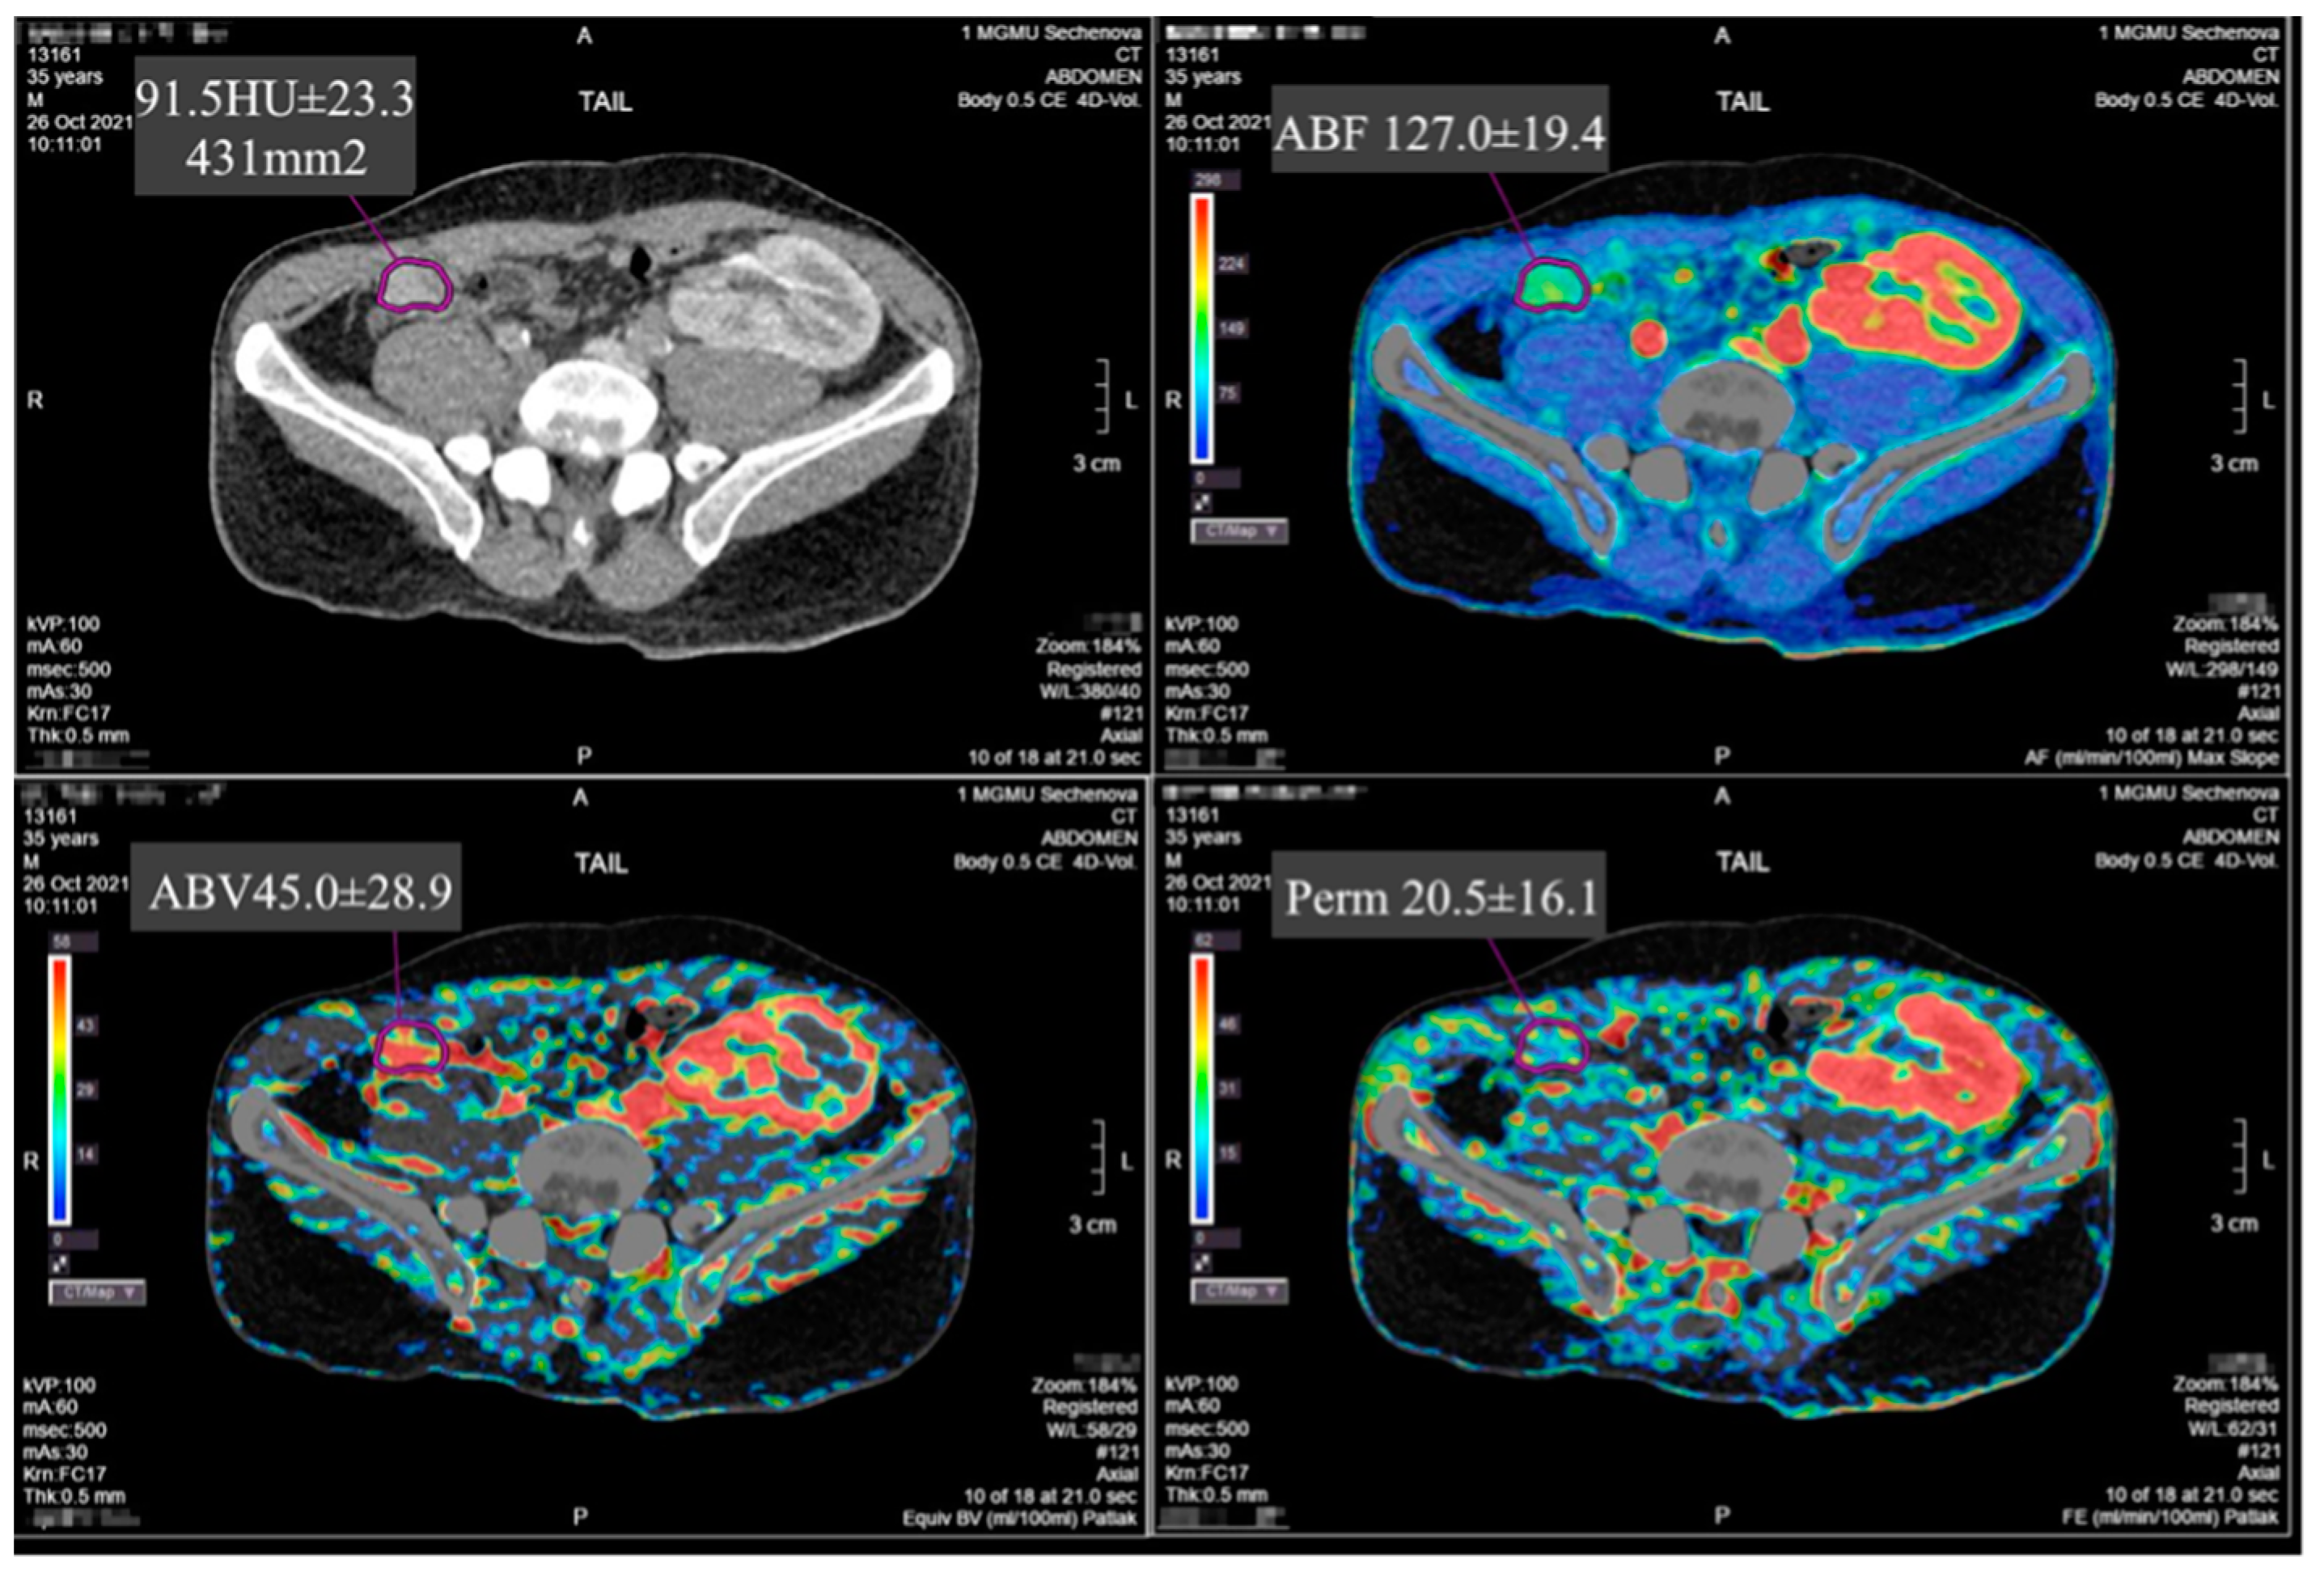
Figure 2.
ABF values obtained by both radiologists for the groups based on post-SPKT timing.  Radiologist 1,
  Radiologist 2, ☐ median, rectangle – 25–75 %, segment – min–max, ○ outliers, * extreme points.
Radiologist 1, Radiologist 2, ☐ median, rectangle – 25–75 %, segment – min–max, ○ outliers, * extreme points.
Figure 2.
ABF values obtained by both radiologists for the groups based on post-SPKT timing. Radiologist 1, Radiologist 2, ☐ median, rectangle – 25–75 %, segment – min–max, ○ outliers, * extreme points.
Radiologist 1, Radiologist 2, ☐ median, rectangle – 25–75 %, segment – min–max, ○ outliers, * extreme points.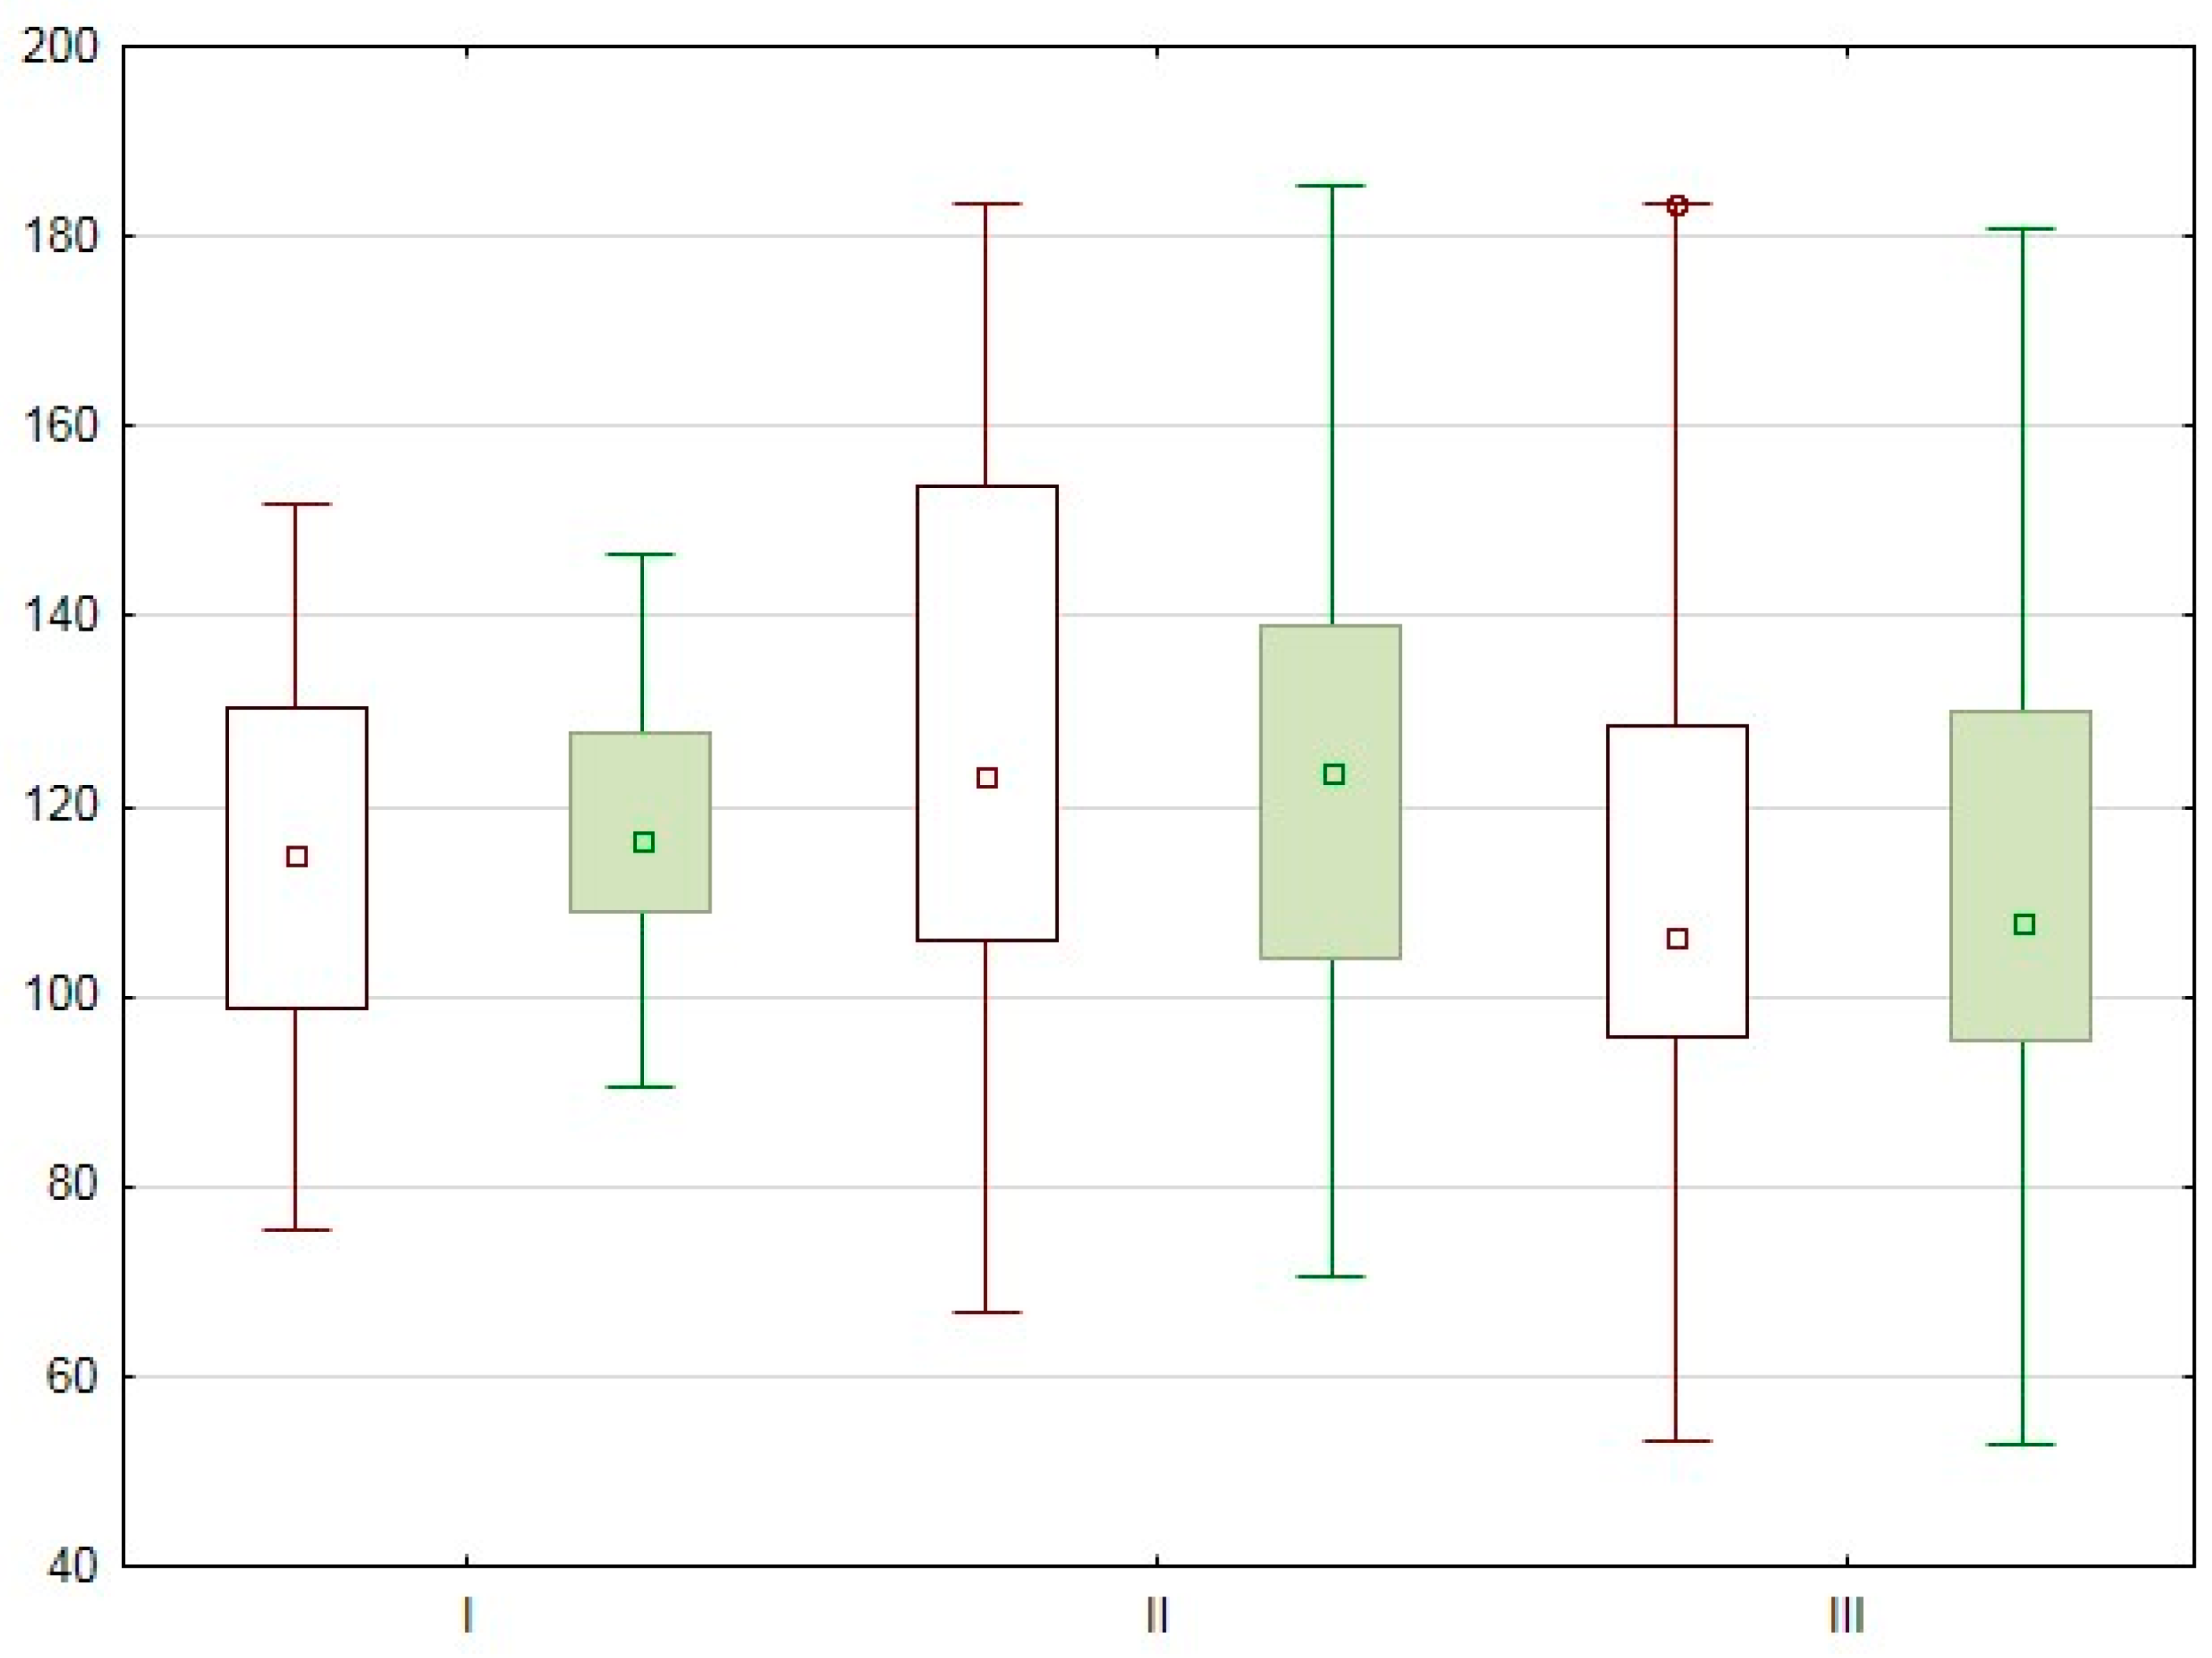
Figure 3.
ABF values obtained by both radiologists for the IISABS and IIY-graft groups. Radiologist 1, Radiologist 2,.☐ median, rectangle – 25–75 %, segment – min–max, ○ outliers, * extreme points.
Radiologist 1, Radiologist 2,.☐ median, rectangle – 25–75 %, segment – min–max, ○ outliers, * extreme points.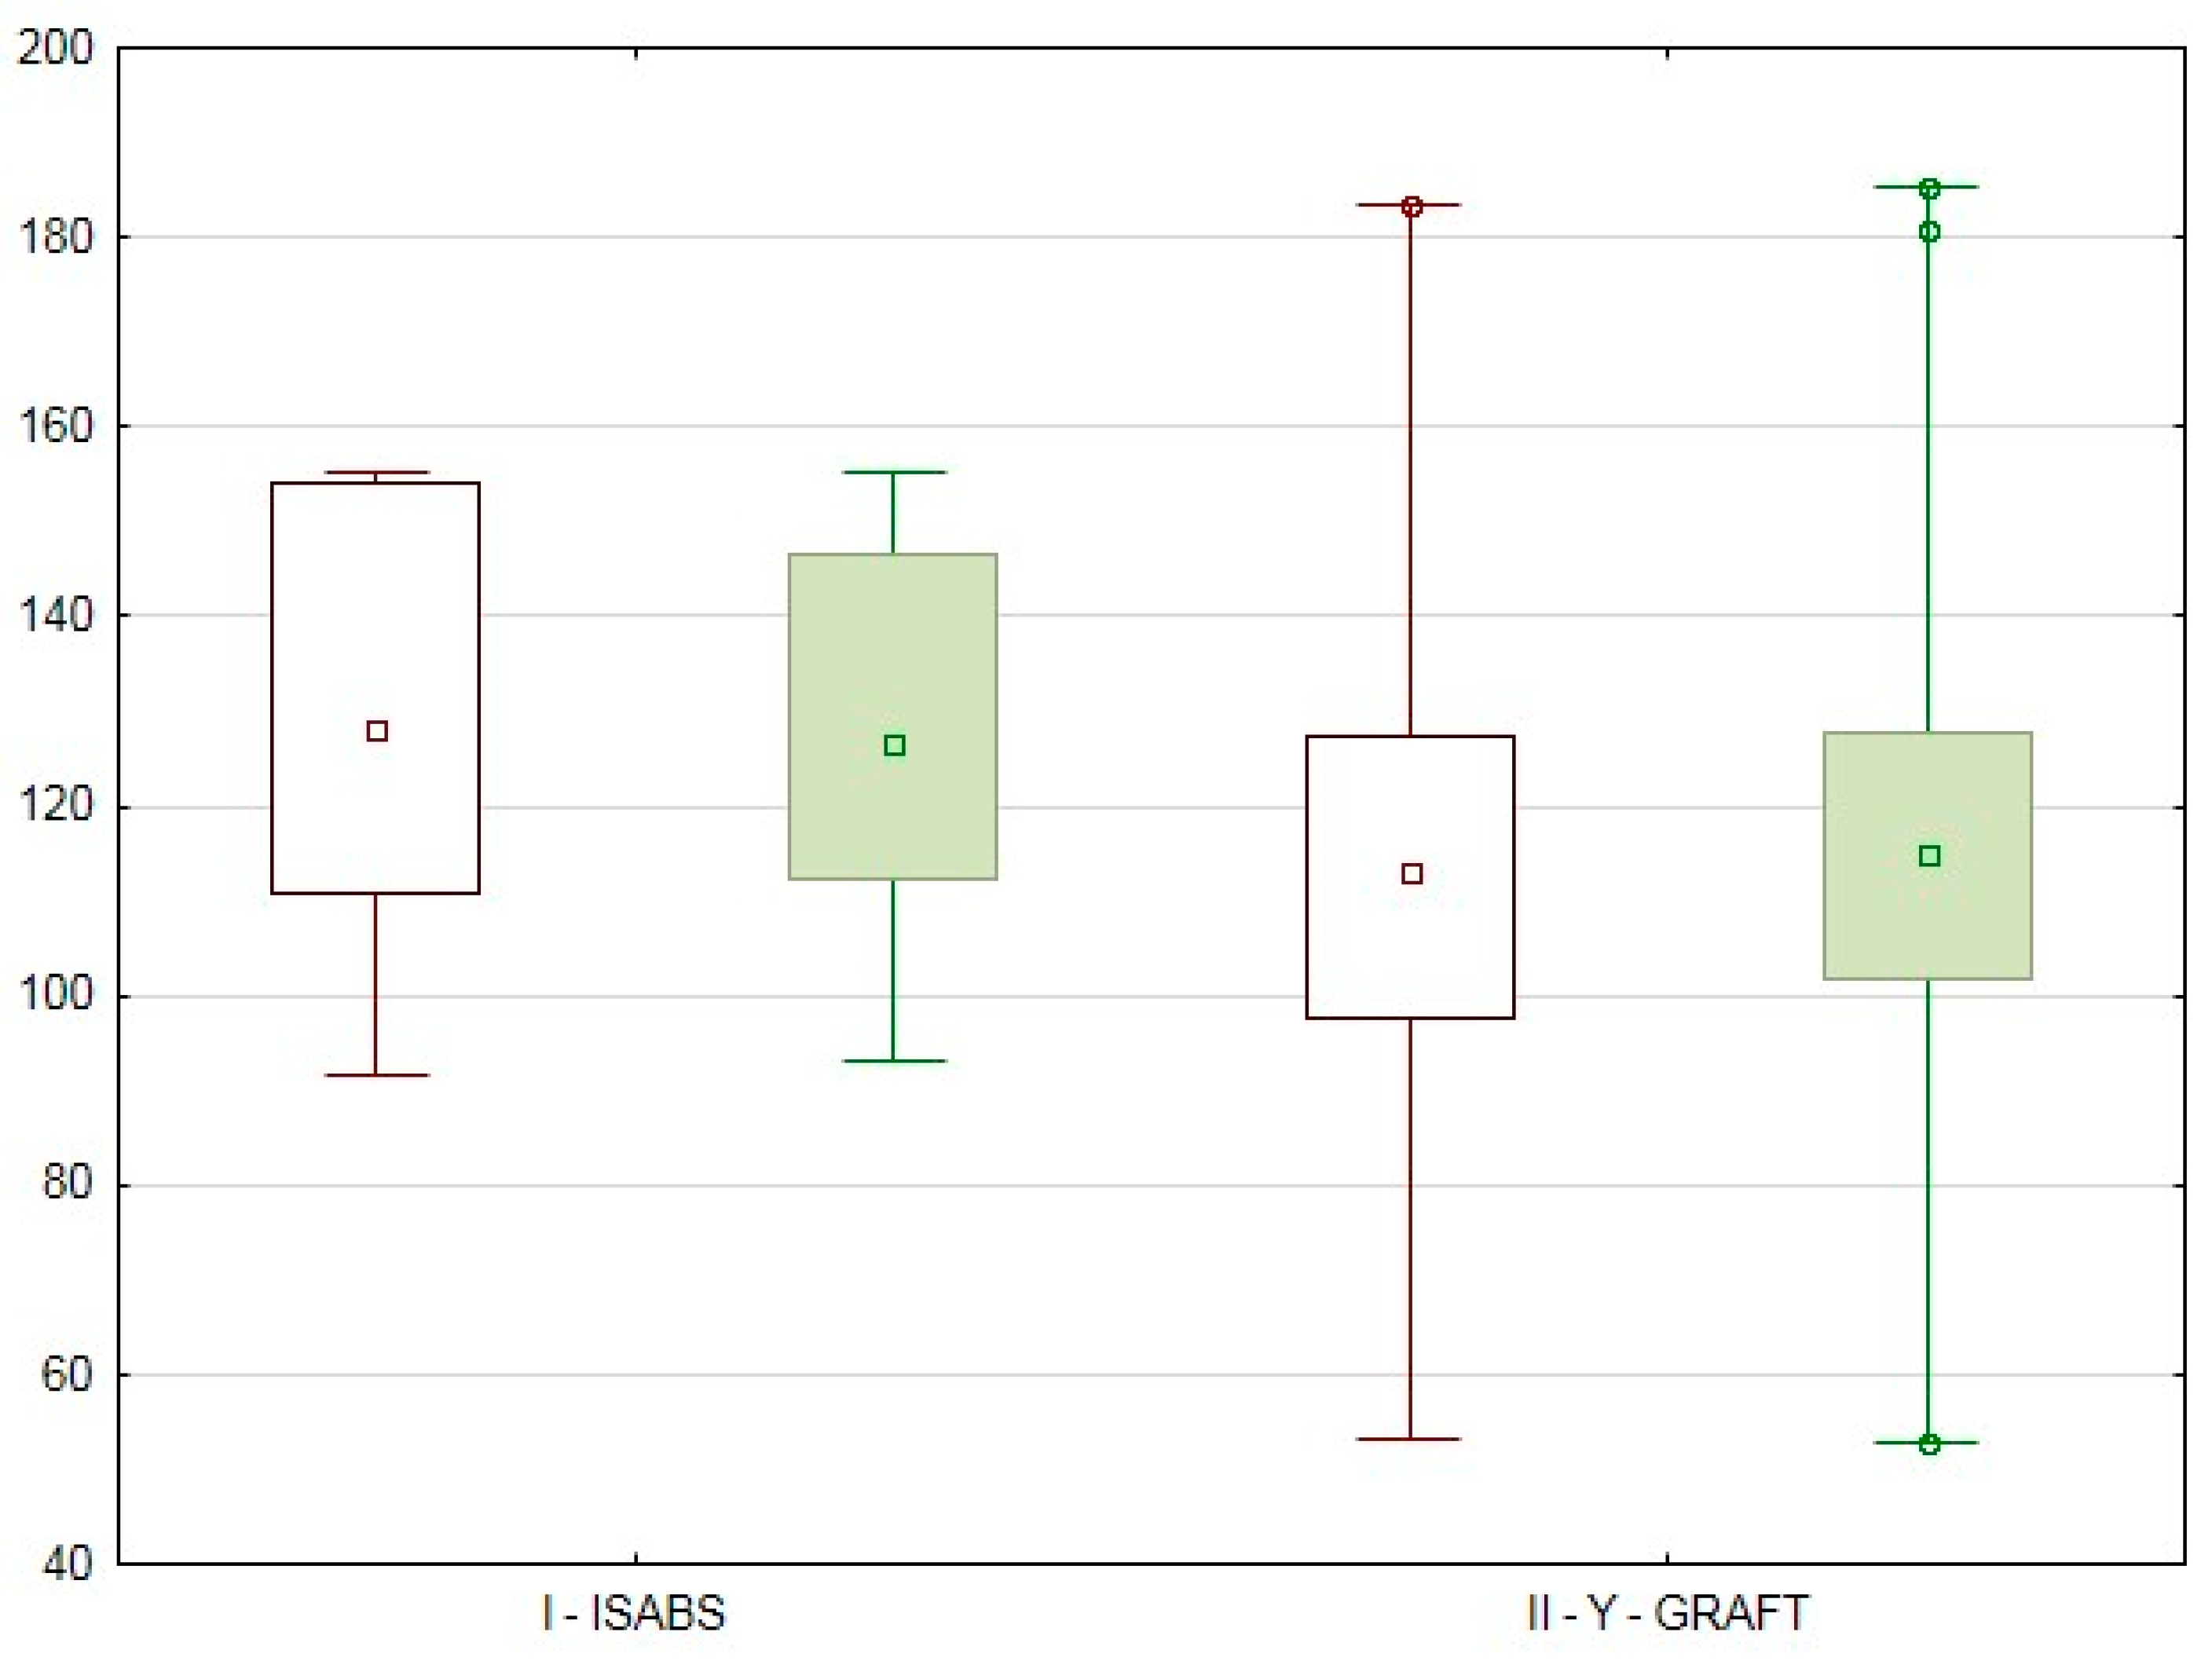
Figure 4.
Pancreatic volumetric perfusion parameters (ABF, ABV, and permeability) in healthy participants who formed the control groups in the respective studies (highlighted in green) and the PG results obtained in the present study (highlighted in blue) (М and SD).
Figure 4.
Pancreatic volumetric perfusion parameters (ABF, ABV, and permeability) in healthy participants who formed the control groups in the respective studies (highlighted in green) and the PG results obtained in the present study (highlighted in blue) (М and SD).


Table 1.
Pancreas graft perfusion computed tomography data.
| Radiologist 1 | Radiologist 2 | P* | |
|---|---|---|---|
| ABF, mL/100 mL/min | 114 [98.8;130.3] | 116.3 [103.8;128.1] | 0.18 |
| ABV, mL/min | 47 [37.2;56.9] | 46.1 [38.2;56.9] | 0.24 |
| Perm, mL/100 mL/min | 8.5 [4.1;11.4] | 8.6 [4.2;11.4] | 0.12 |
ABF – arterial blood flow, ABV – arterial blood volume, Perm – permeability, * – Wilcoxon test.
Table 2.
PCT data in parts of the PG.
| Parameter | Value | P*(h-b-t) | P*(h-b) | P*(b-t) | P*(h-t) | Р**(r1-r2) |
|---|---|---|---|---|---|---|
| Radiologist 1 | ||||||
| ABF (h), mL/100 mL/min | 116.9 [97.9;127.8] | 0.026 | 0.4 | 0.016+ | 0.01+ | 0.96 |
| ABF (b), mL/100 mL/min | 118.2 [101.9;134.3] | 0.81 | ||||
| ABF(t), mL/100 mL/min | 110.7 [96.5;129.8] | 0.003+ | ||||
| ABV(h), mL/min | 49.6 [36.7;57] | 0.16 | 0.064 | 0.38 | 0.046 | 0.64 |
| ABV(b), mL/min | 47.2 [33.9;55.2] | 0.52 | ||||
| ABV(t), mL/min | 42.4 [35.5;54] | 0.036+ | ||||
| Perm (h), mL/100 mL/min | 8.4 [4.1;11.3] | 0.8 | 0.92 | 0.12 | 0.37 | 0.55 |
| Perm (b), mL/100 mL/min | 8.3 [4.1;12] | 0.99 | ||||
| Perm (t), mL/100 mL/min | 8.5 [3.6;11.4] | 0.11 | ||||
| Radiologist 2 | ||||||
| ABF (h), mL/100 mL/min | 116.5 [101.1;131.2] | 0.84 | 0.25 | 0.61 | 0.24 | 0.96 |
| ABF (b), mL/100 mL/min | 117 [99.9;139] | 0.81 | ||||
| ABF(t), mL/100 mL/min | 118.4 [101.2;131.2] | 0.003+ | ||||
| ABV(h), mL/min | 47.2 [39.3;55] | 0.39 | 0.18 | 0.94 | 0.35 | 0.64 |
| ABV(b), mL/min | 45.1 [37.7;57.8] | 0.52 | ||||
| ABV(t), mL/min | 44.7 [38.9;59.3] | 0.036+ | ||||
| Perm (h), mL/100 mL/min | 9 [4.1;11.2] | 0.67 | 0.77 | 0.21 | 0.32 | 0.55 |
| Perm (b), mL/100 mL/min | 8.6 [4.4;12.1] | 0.99 | ||||
| Perm (t), mL/100 mL/min | 8.1 [3.8;11.4] | 0.11 | ||||
ABF – arterial blood flow, ABV – arterial blood volume, Perm – permeability, h – head, b – body, t – tail; r1 – radiologist 1, r2 – radiologist 2; * Friedman test, ** Wilcoxon test, + – statistically significant differences.
Table 3.
PCT data for the three groups of patients based on post-SPKT timing.
| Group I (n=15) |
Group II (n=14) |
Group III (n=12) |
P* | |
|---|---|---|---|---|
| Radiologist 1 | ||||
| ABF, mL/100 mL/min | 114.9 [98.8;130.3] |
123.1 [105.9;153.7] |
106.3 [95.6;128.5] |
0.37 |
| ABV, mL/min | 47 [33.6;56.9] |
45.3 [37.4;52.1] |
48.4 [33.7;61.9] |
0.92 |
| Perm, mL/100 mL/min | 5.1 [3.7;10.6] |
10.4 [8.4;11.3] |
9 [2.7;11.9] |
0.3 |
| Radiologist 2 | ||||
| ABF, mL/100 mL/min | 116.3 [108.9;127.8] |
123.6 [104.2;139.2] |
107.9 [95.6;129.9] |
0.32 |
| ABV, mL/min | 46.1 [38;61] |
44.7 [38.2;52.1] |
48.1 [36.3;60.2] |
0.85 |
| Perm, mL/100 mL/min | 7.4 [3.9;11.2] |
10.1 [8.4;11.4] |
9.3 [3.2;12.9] |
0.48 |
ABF – arterial blood flow, ABV – arterial blood volume, Perm – permeability, * – Kruskal–Wallis test.
Table 4.
PCT data for the groups based on post-SPKT timing.
| Group | Radiologist | ABF, mL/100 mL/min | P* | ABV, mL/min | P* | Perm, mL/100 mL/min | P* |
|---|---|---|---|---|---|---|---|
| I (n=15) | 1 | 114.9 [98.8;130.3] | 0.21 | 47 [33.6;56.9] | 0.23 | 5.1 [3.7;10.6] | 0.29 |
| 2 | 116.3 [108.9;127.8] | 46.1 [38;61] | 7.4 [3.9;11.2] | ||||
| II (n=14) | 1 | 123.1 [105.9;153.7] | 0.38 | 45.3 [37.4;52.1] | 0.67 | 10.4 [8.4;11.3] | 0.81 |
| 2 | 123.6 [104.2;139.2] | 44.7 [38.2;52.1] | 10.1 [8.4;11.4] | ||||
| III (n=12) | 1 | 106.3 [95.6;128.5] | 0.67 | 48.4 [33.7;61.9] | 0.32 | 9 [2.7;11.9] | 0.12 |
| 2 | 107.9 [95.6;129.9] | 48.1 [36.3;60.2] | 9.3 [3.2;12.9] |
* – Wilcoxon test, + – statistically significant differences.
Table 5.
Comparative analysis of PG volumetric perfusion parameter values in the groups based on the number of revascularization-critical arteries.
Table 5.
Comparative analysis of PG volumetric perfusion parameter values in the groups based on the number of revascularization-critical arteries.
| Group IISABS, n=7 | Group IIY-graft, n=34 | P* | |
|---|---|---|---|
| Radiologist 1 | |||
| ABF, mL/100 mL/min | 128.1 [110.7;154] | 113 [97.8;127.6] | 0.15 |
| ABV, mL/min | 40.6 [33.6;65.6] | 47.1 [37.2;56.9] | 0.82 |
| Perm, mL/100 mL/min | 10.6 [3.7;11.8] | 8.5 [4.1;11.4] | 0.89 |
| Radiologist 2 | |||
| ABF, mL/100 mL/min | 126.7 [112.3;146.4] | 115 [101.8;127.8] | 0.28 |
| ABV, mL/min | 40.6 [32.8;67.1] | 46.1 [40.9;56.9] | 0.59 |
| Perm, mL/100 mL/min | 10.8 [3.7;11.7] | 8.6 [4.2;11.4] | 0.94 |
* – Mann–Whitney test.
Table 6.
Comparative analysis of pancreas graft volumetric perfusion parameter values obtained by both radiologists for the IISABS and IIY-graft groups.
Table 6.
Comparative analysis of pancreas graft volumetric perfusion parameter values obtained by both radiologists for the IISABS and IIY-graft groups.
| Group | Radiologist | ABF, mL/100, mL/min | P* | ABV, mL/min | P* | Perm, mL/100 mL/min | P* |
|---|---|---|---|---|---|---|---|
| IISABS (n=7) | 1 | 128.1 [110.7;154] | 0.60 | 40.6 [33.6;65.6] | 0.46 | 10.6 [3.7;11.8] | 0.69 |
| 2 | 126.7 [112.3;146.4] | 40.6 [32.8;67.1] | 10.8 [3.7;11.7] | ||||
| IIY-graft (n=34) | 1 | 113 [97.8;127.6] | 0.06 | 47.1 [37.2;56.9] | 0.31 | 8.5 [4.1;11.4] | 0.07 |
| 2 | 115 [101.8;127.8] | 46.1 [40.9;56.9] | 8.6 [4.2;11.4] |
* – Wilcoxon test.
Disclaimer/Publisher’s Note: The statements, opinions and data contained in all publications are solely those of the individual author(s) and contributor(s) and not of MDPI and/or the editor(s). MDPI and/or the editor(s) disclaim responsibility for any injury to people or property resulting from any ideas, methods, instructions or products referred to in the content. |
© 2024 by the authors. Licensee MDPI, Basel, Switzerland. This article is an open access article distributed under the terms and conditions of the Creative Commons Attribution (CC BY) license (http://creativecommons.org/licenses/by/4.0/).
Copyright: This open access article is published under a Creative Commons CC BY 4.0 license, which permit the free download, distribution, and reuse, provided that the author and preprint are cited in any reuse.


