
Submitted:
30 July 2024
Posted:
31 July 2024
You are already at the latest version
Abstract
Percutaneous coronary intervention (PCI) to chronic total occlusion (CTO) is still a subject of debate. The primary goal of revascularization is to provide symptomatic relief and enhancing left ventricular (LV) functions. Global longitudinal strain (GLS) is proven to be more sensitive than ejection fraction (EF), especially for subtle ischemic changes. The purpose of this study was to investigate the improvement in LV GLS after revascularization of symptomatic stable coronary patients with single-vessel CTO, categorized according to their collateral supply grades. 69 patients with successful CTO PCI were grouped according to their collateral supply grades, as well-developed (WD) and poor collateral groups and followed-up for 3 months. Basal characteristics were similar for both groups, except for lower EF (p=0.04) and impaired GLS (p<0.0001) in the poor collateral group. At the end of 3 months follow-up symptomatic relief was similar in both groups (p=0.101). GLS improvement reached statistical significance only for the poor collateral, not for the WD group (p<0.0001 and p=0.054, respectively). EF did not change significantly in both groups. Poorly collateralized CTO lesion may not only result in baseline LV dysfunction, but also appear to carry potential for recovery after revascularization. This may not be the case for WD collaterals.
Keywords:
Chronic total occlusion
; global longitudinal strain
; coronary collateral supply
; coronary artery disease
Introduction
A chronic total occlusion (CTO) refers to a completely occluded coronary artery with TIMI 0 flow with duration of ≥3 months [1]. In series of patients undergoing invasive coronary angiography, the prevalence of at least one CTO was reported to be as 15-20% [2]. Despite the high frequency of CTO, percutaneous recanalization has traditionally been considered as a technical challenge. As a result of recent technological advances, such as recanalization techniques and equipments coupled with advancing operators’ expertise, the success rate of CTO recanalisation has risen to 80-90% at specialized CTO referral centres [3].
The benefits of CTO revascularization in percutaneous coronary intervention (PCI) is still controversial. Today, the primary objective of CTO-PCI on top of the medical treatment, is to achieve symptom improvement. Uncertainties regarding the reduction of major adverse cardiovascular events (MACE) persist due to the existing trials being underpowered and yielding conflicting results [4]. Also, several studies did not show any functional improvement in left ventricle (LV) functions after revascularization [5,6]. However, they assessed the systolic function by using the LV ejection fraction (LVEF) and LV diameters by conventional echocardiography. In speckle-tracking echocardiography (STE), image processing algorithms are applied to routine two-dimensional echocardiographic images to identify small, stable myocardial speckles within a defined region of interest. By tracking these speckles frame-by-frame over the cardiac cycle, the distances between them or their spatiotemporal displacement (regional strain velocity vectors) provide valuable information about global and segmental myocardial deformation, so called as myocardial strain analysis [7].The LV global longitudinal strain (GLS) is the novel parameter to evaluate LV systolic function with superior reproducibility compared to LVEF and has been validated for its efficacy in detecting myocardial ischemia [8]. In patients with cardiovascular disease, myocardial dysfunction can manifest even when the EF is preserved, potentially correlating with impaired LV longitudinal deformation [9]. Ischemic cascade begins with impaired in the watershed subendocardial layer, where there is a predominance of longitudinally oriented fibers, so it is not surprising that GLS abnormalities have been reported even in patients with subclinical ischemia [7]. Furthermore several studies have shown that the LV GLS improves after the recanalization of the CTO [10,11].
In the presence of a CTO, the development of collateral vessels can mitigate myocardial necrosis and sustain contractile function within the region distal to the occlusion. The presence of a well-developed (WD) coronary collateral circulation (Rentrop 2-3 classification) has been demonstrated to be able to preserve LV systolic functions in CTO patients [12,13]. Moreover, improved coronary collateral circulation can diminish infarct size, thereby lowering the likelihood of ventricular aneurysm formation, reducing future cardiovascular events, and enhancing survival rates [14]. Although a WD collateral circulation system may adequately perfuse the myocardium at rest, it could potentially be insufficient during periods of increased demand, leading to ischemia [15].
In the literature, LV functions after recanalization of CTO have been investigated irrespective of the coronary collateral circulation. We hypothesized that among patients with CTO and WD coronary collateralization, there may be no significant improvement in LV functions following revascularization. This could be attributed to the presence of sufficient blood supply at rest, potentially limiting the enhancing effects of recanalization on LV function. Thus, we employed LV GLS analysis in our study to assess whether CTO recanalization provided benefits in restoring LV function. We compared the outcomes between patients with WD and poor coronary collateralization.
Materials and Methods
Patient data: In this multicenter observational study, a cohort of 90 symptomatic patients who underwent planned revascularization of a single major epicardial coronary artery CTO between January 2021 and February 2023, were prospectively screened. 69 patients were enrolled in our study. Symptomatic patients with typical angina pectoris according to Canadian Cardiovascular Society (CCS) under optimum medical therapy (OMT) were included in the study. Patients with atypical symptoms such as exercise dyspnea or intolerance were included if there was stress induced ischemia of ≥10% of global myocardial region in myocardial perfusion scintigraphy (MPS). Patients with recent revascularization for non-CTO lesions, including acute coronary syndromes, could be enrolled if 6 weeks have passed after successful revascularization. Patients with acute coronary syndrome, unstable angina, ≥50% stenosis in a non-CTO artery, unsuccessful CTO-PCI, arrhythmia, moderate to severe valvular disease, cardiomyopathies, akinesia or aneurysm of the target artery area and patients with reduced EF (EF≤40%) were excluded from the study.
CTO of major epicardial artery was defined as complete occlusion with TIMI 0 flow for at least 3 months duration in major coronary artery with a vessel diameter of ≥2.5 mm. The operator judged the suitability and the method of the planned revascularization of the CTO lesion after diagnostic coronary angiography. The procedural approach for CTO included antegrade or retrograde approach adhering to contemporary technical guidelines [3]. In cases where initial PCI failed, treatment with medical or surgical therapy pursued based on clinical requirements. Five patients who had no suitable image for LV GLS measurements were excluded from the study. Recanalization of CTO failed in 12 patients during coronary angiography, and 4 patients discontinued the echocardiographic follow-up. As a result, 69 patients were enrolled in our study. Medical histories, encompassing all clinical and demographic data including cardiovascular risk factors such as hypertension (HT), diabetes mellitus (DM), dyslipidemia, and smoking, were extracted from electronic medical records and patient interviews. Laboratory results obtained within 24 hours prior to coronary angiography were recorded. Patients were followed up at the first and third month after CTO recanalization, they underwent clinical and echocardiographic evaluations, and were also interviewed about their anginal symptoms. All subjects gave their informed consent for inclusion before they participated in the study. The study was conducted in accordance with the Declaration of Helsinki and the study protocol was reviewed and approved by the local ethical committee.
Canadian Cardiovascular Society grading of angina pectoris: In accordance with the CCS grading system, angina pectoris is graded as follows: Grade I: Ordinary physical activity does not cause angina, such as walking and climbing stairs. Angina with strenuous or rapid or prolonged exertion at work or recreation. Grade II: Slight limitation of ordinary activity. Walking or climbing stairs rapidly, walking uphill, walking or stair climbing after meals, or in cold, or in wind, under emotional stress, or only during the few hours after awakening. Walking more than two blocks on the level and climbing more than one flight of ordinary stairs at a normal pace and in normal conditions. Grade III: Marked limitation of ordinary physical activity. Walking one or two blocks on the level and climbing one flight of stairs in normal conditions and at normal pace. Grade IV: Inability to carry on any physical activity without discomfort [16].
Grading of the anginal score of the patient was performed at initial visit, also questionned and recorded on the consecutive visits by the attending physician.
Transthoracic echocardiography: Screened patients who met the clinical criteria for study inclusion underwent two-dimensional echocardiographic imaging 24 hours prior to the CTO-PCI. Sequential echocardiographic measurements were conducted in the first and third months following recanalization. Two experienced cardiologists (TST, NO) performed the transthoracic echocardiography (TTE) using the Vivid E9 imaging system (GE Medical Systems, Chicago, USA) and measurements were obtained following the recommendations of the American Society of Echocardiography [17]. LV dimensions were measured in the parasternal long-axis view at end-systole and end-diastole. LV EF was calculated using the modified Simpson method from four-chamber views.
Left Ventricular Global Longitudinal Strain: An automated function imaging (AFI) method was used in the Echo Pack imaging workstation (GE, Echo Pack imaging systems) to obtain 4-chamber, 2-chamber, and APLAX images with frame rate of 50-70 fps. 2D STE measurements of LV strain were obtained according to the recommendations of the 2015 EACVI/ASE consensus document [17]. LV strain measurements were omitted from analysis if left ventricular image quality was deemed inadequate or if adjusting the region of interest (ROI) did not enhance tracking quality. LV GLS of >-20% was defined as impaired LV GLS (Negative values in GLS are consigned to longitudinal shortening in systole. Greater degrees of deformation in fact translates to numerically lower strain values and practically higher absolute values of GLS, specifically above 20, suggest normal strain values).
Coronary Angiography: An interventional cardiologist performed coronary angiography according to standard procedures. Following diagnostic coronary angiography, all patients underwent heart team discussion. Patients with typical anginal symptoms under OMT were enrolled directly if they had no exclusion critera. For other symptomatic patients, MPS was ordered to detect ischemia in the target area, since these patients presented with atypical angina or symptoms of effort intolerance, further clarification was required. Patients who were indicated for revascularization by the heart team underwent PCI, performed by experienced interventional cardiologists using femoral access. In accordance with their expertise, the medical team recanalized the CTO, using specialized wires, balloons, and microcatheters. All patients were revascularized with drug eluting stents. Preoperative, perioperative and follow-up medical management, including the antiplatelet regimen, adhered the current guidelines [18]. Angiographic success was defined as achieving a final angiographic residual stenosis of less than 20% by visual estimate and TIMI III flow following the implantation of stents [19]. Two blinded interventional cardiologists classified coronary collaterals according to Cohen-Rentrop classification, which was graded as follows: grade 0= no visible collaterals, grade 1= the filling of the side branch via collateral vessels without visualization of the epicardial segment, grade 2= the partial filling of the epicardial coronary artery, and grade 3= the complete filling of the epicardial coronary artery [20]. Enrolled patients were classified as WD (grades 2 and 3) and poor (grades 0 and 1) coronary collateral groups [21]. Figure 1 presents an example study patient who had WD collaterals and had successful CTO recanalization, followed-up with consecutive LV GLS measurements recorded at baseline and at the third month.
Figure 1.
An example of a study patients’ LV GLS strain and coronary angiography views. (A) Chronic total occlusion of RCA. (B-C) Dual injection demonstrated the presence of grade 3 collateral circulation from the left coronary arteries to the RCA. (D) The RCA was successfully wired, two drug-eluting stents were implanted, and TIMI 3 flow was demonstrated.(E) Pre-PCI average LV GLS was measured to be -15,6%. (F) Post-PCI third month LV GLS was measured to be -15,7%.LV GLS: left ventricular global longitudinal strain.
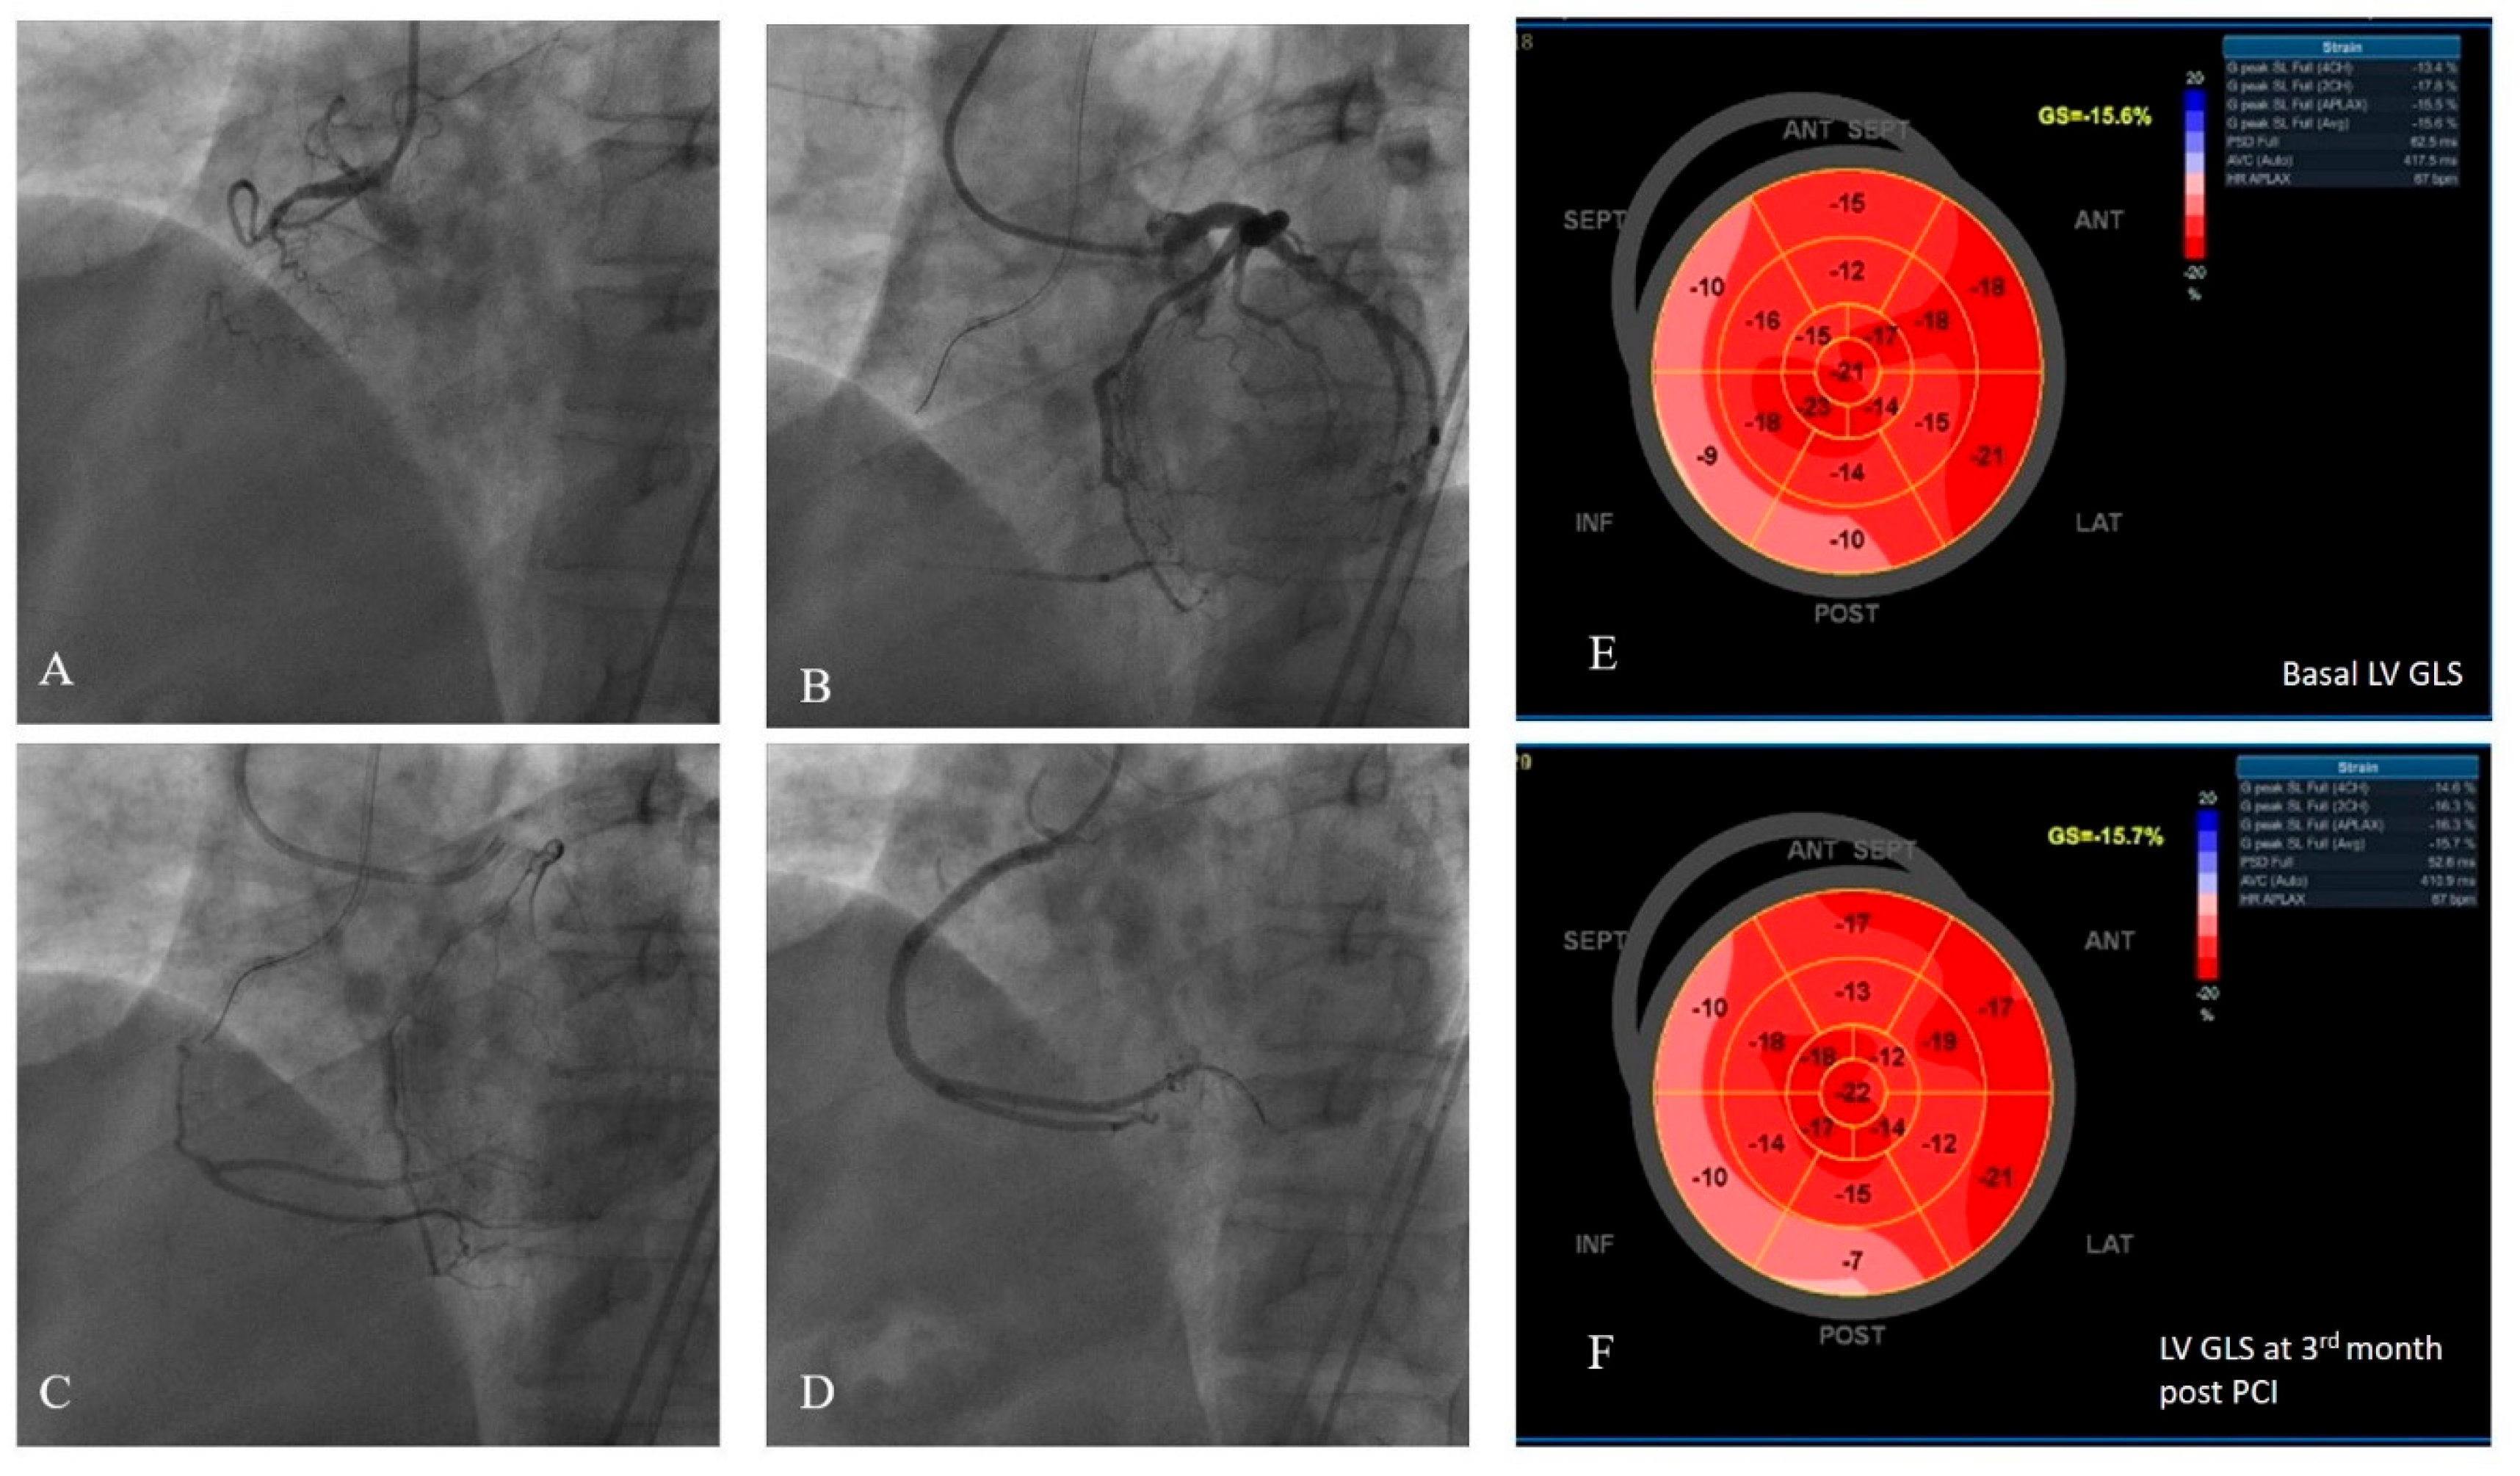
LV GLS: left ventricular global longitudinal strain, RCA: right coronary artery, PCI: percutaneous coronary intervention
Statistical Analysis
Baseline characteristics were presented as the mean ± SD for continuous variables or percentages for categorical variables. Changes in LV end-diastolic diameter (LVEDD), LV end systolic diameter (LVESD), LVEF and LV GLS data from baseline to the first and third months post-procedure were evaluated using one-way repeated measures analysis of variance (ANOVA). Additionally, a mixed-design ANOVA test was used to compare the repeated measures in two collateral groups (between subjects and within subjects). A value of p<0.05 were considered statistically significant. All data were analyzed using IBM SPSS Statistics version 26 (SPSS Inc., Chicago, Illinois).
Interobserver and intraobserver variability: Images from 20 randomly selected patients were independently measured by a second blinded observer to evaluate interobserver variability. Subsequently, the first observer re-measured the same 20 patients’ images at least four weeks after the initial measurements were taken. Interobserver and intraobserver variability were analyzed using the intraclass correlation coefficient (ICC).
Results
Baseline characteristics: The study enrolled 69 patients (mean age 64.9±9.4 , 81% male) who underwent CTO-PCI of single epicardial coronary artery. According to the coronary collateral supply to the CTO, patients were classified as having WD (36 patients, 52%) and poor (33 patient, 48%) collaterals. All patients enrolled in the study had typical angina pectoris or significant ischemia was demonstrated in the case of patients with angina equivalent symptoms. According to CCS angina grading system; 28 (41%) patients experienced grade 2 angina, 34 (49%) patients had grade 3 angina, and 7 (10%) patients reported grade 4 angina pectoris. Grade 1 angina pectoris was not observed in the study population. Patients in the poor coronary collateral group demonstrated significantly more severe angina level when compared to the WD collateral group (p=0.02). Demographic and clinical characteristics, laboratory results, and cardiovascular risk factors for the two groups according to the collateral supply is demonstrated in Table 1. All patients were on appropriate doses of statin, beta blocker, angiotensin receptor blocker (ARBs) or angiotensin converting enzyme inhibitor (ACEi) therapy, and other physician recommended therapies in accordance to the clinical guidelines during the course of the study [18].

Table 1.
Baseline Characteristics According to Coronary Collateral supply.
| Characteristics | Well-developed Collateral (N=36) | Poor Collateral (N=33) | P value |
|---|---|---|---|
| Age | 64.7 ± 9.7 | 65.1± 9.3 | 0.9 |
| Male n, (%) | 28 (78) | 28 (85) | 0.5 |
| BSA m² # | 1.87± 0.1 | 1.86± 0.2 | 0.9 |
| HT n, (%) | 27(75) | 23 (70) | 0.8 |
| DM n,(%) | 22(61) | 19 (58) | 0.8 |
| HL n, (%) | 12(33) | 16 (49) | 0.22 |
| Smoking n, % | 18(50) | 19 (58) | 0.63 |
| Family history n,% | 9(25) | 13 (40) | 0.3 |
| CCS Angina Grading (I/II/III/IV) | 0/24/18/1 | 0/14/16/6 | 0.02 |
| Laboratory Results | |||
| Fasting glucose mg/dl | 104 ± 8.9 | 98.1± 11.2 | 0.05 |
| Hemoglobin g/dl | 14,05 ±2.1 | 14.1±2.2 | 0.93 |
| Platelet | 259.4± 85.8 | 246.7±57.8 | 0.5 |
| Creatinine (mg/dl) | 0,92±0.18 | 0.86±0.21 | 0.3 |
| TC mg/dl | 191.3±51,4 | 193.5 ±48.8 | 0.9 |
| LDL-C mg/dl | 120.5±40.2 | 129.9±46.4 | 0.4 |
| HDL-C (mg/dl) | 43,6±14.8 | 43.1± 11.01 | 0.9 |
| Echocardiography | |||
| LVEDD (mm) | 50.8±5.6 | 50.9 ±6.4 | 0.94 |
| LVESD (mm) | 28.9±4.2 | 29.2±4.2 | 0.73 |
| EF% | 54.2±3.4 | 52.2 ±4.1 | 0.04 |
| LV GLS % | -14.8±1.16 | -12.8±1.47 | 0.0001 |
| Coronary Angiography | |||
| CTO artery (LAD/CX/RCA) | 13/6/17 | 14/5/14 | 0.9 |
| Prior CABG n, (%) | 0 | 0 | - |
| Prior PCI to Target coronary artery n, (%) | 18(50) | 15(46) | 0.81 |
| Prior PCI (all) n, (%) | 18 (49) | 19 (51) | 0.4 |
| Prior MI in CTO area | 9 (25) | 4 (12) | 0.22 |
| Prior MI (all) n, (%) | 9 (25) | 8 (24) | 1 |
Data are expressed as means±SD, as n (%).BSA: # Calculation of left atrial volume ratio body surface area. BSA; body surface area; index HT: hypertension; DM: Diabetes Mellitus; HL: Hyperlipidemia; inhibitor TC: total cholesterol; HDL-C: high-density cholesterol level; LDL-C: low-density cholesterol level; LVEDD: left ventricular end-diastolic diameter: LVESD: left ventricular end-systolic diameter: EF: ejection fraction; MAPSE: Mitral annular plane systolic excursion; LV GLS: left ventricular global longitudinal strain; CCSAngina Grading: Canadian Cardiovascular Society Grading of Angina Pectoris CABG: coronary artery bypass grafting; CTO chronic total occlusion; MI myocardial infarction; PCI percutaneous coronary intervention; LAD left anterior descending artery; LCX left circumflex artery; RCA right coronary artery.
Coronary Angiography: All patients were symptomatic and had a CTO at one of the major coronary arteries. None of the patients exhibited secondary arterial stenosis of ≥50%, and all underwent intervention for their single-vessel CTO lesion. Table 1 summarizes the angiographic characteristics of the patients, encompassing details such as coronary lesions with CTO, history of myocardial infarction, prior PCI, and coronary artery bypass surgery (CABG). Both WD and poor developed collateral groups were statistically similar according to their angiographic characteristics. All revascularization procedures were considered as successful by the attending interventionists, according to criteria defined at the methods section. No complications, such as pericardial tamponade, coronary rupture, MI, or death were observed perioperatively. After revascularization, symptomatic relief of angina or equivalents was reported by 54 patients at the end third month visits (75% of patients in WD group, 81% of patients in poor collateral group, p=0.101). Fifteen patients reported no improvement in their symptoms, with 9 belonging to the WD collateral group and 6 to the poor collateral group. None of the patients reported exacerbation of their complaints.
Echocardiographic Measurements: All patients underwent baseline TTE within 24 hours prior to the PCI. Mean basal LVEDD and LVESD were 51.03±6.04 mm and 29,02±4,19 mm, respectively and there were no statistically significant difference between the collateral groups. None of the patients had EF<40% and mean basal EF of the study group was 53.2±3.86. Although the difference was slight, the basal EF of the WD collateral group was statistically higher than that of the poor collateral group (54.2±3,4 vs 52.2±4.1 respectively, p=0.04). The basal LV GLS values of the study population were impaired with a mean value of -13,8±1,66. The basal LV GLS of the WD collateral group was significantly lower (meaning less impaired as the absolute value is higher) than that of the poor collateral group (-14.8±1,16 vs -12.8±1.47, respectively, p<0.0001) (Table 1).
All echocardiographic parameters were remonitored at the first and third months following the PCI. One-way ANOVA was used to analyse repeated measures of LVEDD, EF, and LV GLS. Basal, first and third month measurements of GLS were all found to be improved significantly (-13.8±1.66 vs.-15.3±1.29 vs. -15.5±1.26, respectively, p= 0.0001). However, there was no improvement in EF (53.2±3,86 vs. 53.3±3.8 vs. 53.4±3.7, respectively, p= 0.7) and in LVEDD values ( 51.03±6.04 mm vs. 50.9±5.9 mm vs. 50.8±5.9 mm, respectively, p=0.06) (Table 2).
Table 2.
Repeated Measures of Echocardiographic Parameters (n=69).
| Echocardiographic parameters | Pre-PCI | Post-PCI M1 | Post-PCI M3 | P value (all) | P value- Pre-PCI vs. Post-PCI M1 |
P value- Pre-PCI vs. Post-PCI M3 |
P value- Post-PCI M1 vs. Post-PCI M3 |
|---|---|---|---|---|---|---|---|
| LVEDD mm | 51.03±6.04 | 50.9±5.9 | 50.8±5.9 | 0.06 | 0.2 | 0.2 | 0.3 |
| EF% | 53.2±3.86 | 53.3±3.8 | 53.4±3.7 | 0.7 | 0.10 | 0.30 | 0.08 |
| LV GLS% | -13.8±1.66 | -15.3±1.29 | -15.5±1.26 | 0.0001 | 0.0001 | 0.0001 | 0.001 |
PCI: percutaneous coronary intervention, Pre-PCI: parameters were obtained within 24hrs prior to PCI, M1: first month, M3: third month. LVEDD: left ventricular end-diastolic diameter: EF: ejection fraction; LV GLS: left ventricular global longitudinal strain.
A mixed-ANOVA method was employed to assess differences between the WD and poor collateral groups across repeated measures, as well as within the repeated measures of each group. There was no significant difference in EF between the WD and poor collateral groups (p=0.56). Furthermore, no significant difference was observed within the repeated measures of EF in WD and poor collateral groups individually (Table 3). LV GLS values differed significantly between the WD and poor collateral groups at baseline, first and third month follow-ups, with poor collateral group revealing significant improvement when compared to WD group (WD collateral GLS: -14.8±1.16 ; -15.2±1.13; -15.2±1.1, respectively vs. poor collateral GLS: -12.8±1.47; -15.5±1.45; -15.9±1.33, respectively, p<0.0001). LV GLS was found to improve significantly from baseline to the first month, significance preserved also at the third month, in the poor collateral group. However, there were no significant differences between the baseline, first month, and third month measures in the WD collateral group. Table 3 and Figure 2 represents the mixed ANOVA measurements in details.
The intraobserver (ICC: 0.97, 95% CI: 0.93–0.98) and interobserver (ICC: 0.94, 95% CI: 0.88–0.96) agreement of the LV strain measurements was excellent.
Table 3.
Comparison of Echocardiographic Parameters According to Coroner Collateral Classification (Well-developed collateral, n=36, poor collateral, n=33).
Table 3.
Comparison of Echocardiographic Parameters According to Coroner Collateral Classification (Well-developed collateral, n=36, poor collateral, n=33).
| Parameters divided by Collateral Classification | Pre-PCI | Post-PCI 1st month | Post-PCI 3rd month | P value (all) | P value Pre-PCI vs. Post-PCI 1st month |
P value Pre-PCI vs. Post-PCI 3rd month |
P value Post-PCI 1st month vs. Post-PCI 3rd month |
|
|---|---|---|---|---|---|---|---|---|
| WD Collateral |
EF% |
54.1±3.37 | 54.2±3.3 | 54.3±3.2 |
0.56 |
1.0 | 0.5 | 0.3 |
| Poor Collateral | 52.2±4.14 | 52.4±4.1 | 52.4±4.09 | 0.09 | 0.24 | 1.0 | ||
| WD Collateral |
LV GLS% |
-14.8±1.16 | -15.2±1.13 | -15.2±1.1 |
0.0001 |
0.07 | 0.054 | 1.0 |
| Poor Collateral | -12.8±1.47 | -15.5±1.45 | -15.9±1.33 | 0.0001 | 0.0001 | 0.0001 | ||
PCI: percutaneous coronary intervention, Pre-PCI: parameters were obtained within 24hrs prior to PCI, M1: first month, M3: third month. WD: well-developed: EF: ejection fraction; LV GLS: left ventricular global longitudinal strain;.
Figure 2.
Mixed- design ANOVA analysis of repeated measures of EF and LV GLS in WD and poor collateral groups. (Please note that absolute values of LV GLS measurement were used in the chart and p-values in the figure were provided for the pre-PCI and third month post-PCI periods; detailed p-values were presented in Table 3). A: Repeated measures of EF did not show any differences between collateral groups and also within the groups. B: LV GLS improvement in poor collateral group was significantly higher than the WD group. All LV GLS values of consecutive follow-ups showed improvement in the poor collateral group, but not in the WD group, when examined separately.
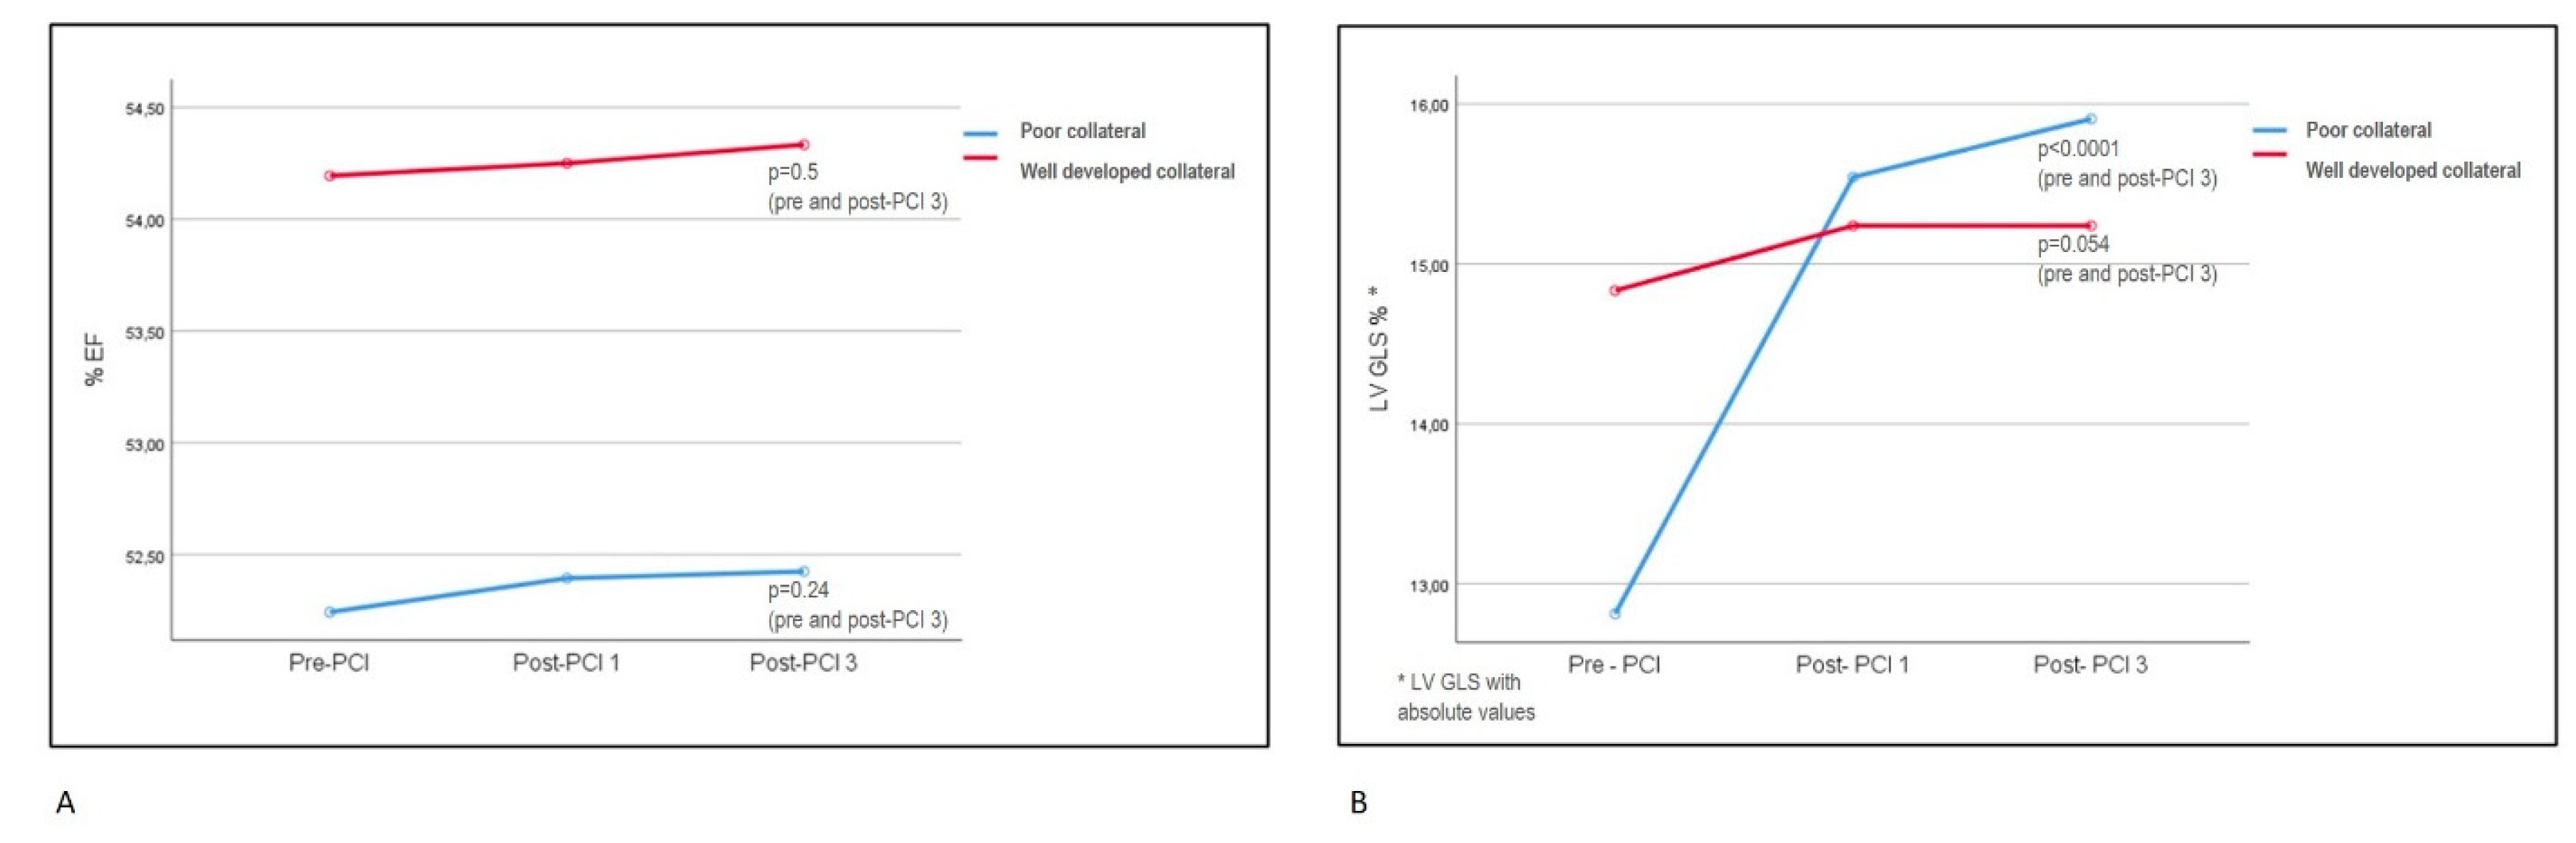
EF: ejection fraction; LV GLS: left ventricular global longitudinal strain; PCI: percutaneous coronary intervention, Post-PCI1: first month after PCI. Post-PCI3: third month after PCI.
Discussion
In this trial of patients with symptomatic stable coronary artery disease and single-vessel CTO, successful PCI procedure resulted in progressively improved LV function measured by LV GLS in the poor collateral supply group. However, no such improvement was observed in the WD collateral supply group. There was no significant improvement in EF for both collateral groups. The study cohort consisted of a highly selective group of patients with a single vessel CTO and no significant lesions in non-CTO vessels. Additionally, these patients exhibited either typical anginal symptoms or significant ischemia in the CTO territory, without akinesia or dyskinesia indicative of non-viable myocardium. Consequently, our study demonstrated the impact of CTO revascularization on LV strain values based on collateral supply levels. To the best of our knowledge, no prior articles have explored this specific topic.
The decision whether or not to recanalize a CTO presents a significant dilemma for the cardiologists. A recent systematic review and meta-analysis including 17 cohort studies with a total of 11493 patients, compared the use of OMT and PCI in patients with known CTO [22]. The randomized studies in the meta-analysis indicated a potential improvement with PCI in overall mortality, cardiac death, repeat revascularization, and MACE; however, these improvements did not reach statistical significance [22]. More randomized controlled trials (RCTs) are needed for a definitive answer. Despite this, there is currently no evidence to advise against PCI in CTO, and there may potentially be some benefits. Today, angina or angina equivalent symptoms resistant to OMT remain to be the main indication for the CTO recanalization, as MACE reduction at follow-up remains uncertain based on the currently available data [4]. Evidence supporting CTO-PCI as an effective tool for symptom relief and improvement in quality of life was primarily based on three randomized controlled trials [23,24,25]. In the design of our trial, we enrolled the symptomatic patients on OMT and verified the significant ischemia for the ones with atypical or possible angina equivalent symptoms, consistent with the recent guidelines [18]. Symptomatic improvement after revascularization was achieved in 78% of the study population, with statistically similar outcomes observed between the subgroups of collateral supply. In the literature, anginal improvement after CTO PCI was reported to be around 70% with Seattle angina questionnare (SAQ) in EURO-CTO trial at the end of first year of revascularization. Miyashita et al. reported the symptomatic recovery rate after CTO PCI as 75% at the end of 1 year and improvement in symptoms were questionned by patient interviews at visits [26]. The recovery rate in our trial was slightly higher (78%). We employed patient interviews to determine symptoms, which may have resulted in a higher reported rate of well-being. Additionally, the final visit in our trial was conducted at the third month post-revascularization, which may be too early to capture potential restenotic events that could provoke anginal symptoms in the future. However, demonstrating the high anginal recovery rate following single vessel CTO revascularization in patients with clear PCI indications may underscore the importance of appropriate patient selection.
The possibility of functional recovery of the LV is another consideration for CTO revascularization; however, its role remains subject to debate [4,27]. In a meta-analysis of 34 studies including symptomatic patients with large ischemic burden or LV dysfunction, it was found that CTO-PCI induces an improvement of 4.44% in EF (p < 0.01) [28]. CTO-PCI may show benefit especially for patients with more severe LV dysfunction, significant myocardial inducible perfusion defects and viability, as shown by previous trials [29,30,31]. Although, these findings were not confirmed in the randomized REVASC trial. In this study, the mean baseline LVEF was only mildly to moderately reduced in both the OMT and CTO-PCI groups. LV functions, such as EF and segmental wall thickening (SWT), were assessed using magnetic resonance imaging (MRI). The functional recovery in the CTO territory revealed no differences between the invasive and non-invasive treatment groups (change in EF: 0.9 vs 0.7, p=0.79, change in SWT: 4.1 vs 6.0, p=0.57) [6]. Schumacher et al, consistent with the findings of ISCHEMIA trial, had suggested that patients with stable coronary disease and impaired contractility constituted a subgroup where extensive ischemia relief via coronary revascularization may provide a protective effect, which is less pronounced in patients with preserved LV function [32,33,34]. In the TOSCA study, basal LV dysfunction was shown to be an independent predictor of improvement in EF after CTO-PCI [35]. In our trial, the study population had preserved EF and were symptomatic under OMT or had significant ischemia. No significant changes in EF were observed at the 3 month follow-up after revascularization, either in the entire group or between the groups based on their CTO collateral supply. However, the poor collateral supply group had a slightly, but significantly lower EF when compared to the WD group at the pre-PCI echocardiography (52.2% vs 54.2%, p=0.04). Poor collateral supply possibly leading to myocardial hibernation may be the cause of this slight difference in basal LV functions.
Conventional echocardiography method allows us to identify significant LV dysfunction, but not subclinical dysfunction and recovery. The two-dimensional (2D) speckle tracking of LV strain is an established technique used in the evaluation of detailed LV systolic functions. GLS represents the overall change in myocardial length during a cardiac cycle. It has been shown to sensitively reflect damage to the subendocardial myocardium, the region most prone to ischemic changes [36]. Regarding the LV contractile functions, LV GLS can provide more accurate and early information than the classical EF measurements, with demonstrated feasibility and reproducibility [17]. Subtle changes in contractility, whether decreases due to damage or increases due to recovery, can be effectively detected through strain analysis [37,38]. As a result, GLS assessed by 2D speckle tracking analysis appears to be a highly suitable method for evaluating changes in myocardial ischemic burden. In the literature, successful CTO-PCI was shown to improve LV function measured by strain echocardiography, especially if viability and ischemia was evident [39,40]. In a cohort of 70 CTO patients attempted for revascularization, LV GLS values showed significant improvement at the ninth month following successful PCI, whereas the failed PCI group exhibited no change [5]. Wang et al. demonstrated that LV EF values tended to improve after the third month of CTO PCI; however, GLS values began to recover as early as the first day after successful revascularization [11]. Sotomi et al. demonstrated the significant improvement in GLS, but not in EF, among patients undergoing single vessel CTO PCI, significance beginning from the first day post-procedure and persisting at three months (GLS pre-PCI, 1 day post-PCI and 3 months post-PCI were given respectively: -12.8±4.2, -14.3±4.1, -14.3±4.4, p=0.023). They also searched for the regional longitudinal strain change in the CTO area and CTO collateral donor vessel area, both showing significant improvement after CTO-PCI (p=0.044 and p=0.034, respectively) [10]. They hypothesized that not only collateral recipient CTO area, but also collateral donor vessel area could be under ischemic risk. This may be the case especially in diseased donor vessels, where collateral supply to the CTO area may lead to reduction of blood flow of the donor vessel itself, known as the “steal phenomenon” [41]. Our study investigated the potential impact of collateral supply grade on GLS, a sensitive tool for subtle ischemic changes, in patients undergoing single vessel CTO-PCI. We found that GLS values improved in the poor collateral group, but not in the WD collateral group. Our study patients had only one CTO lesion, and the remaining coronaries were free from significant stenosis (≥50% stenosis in non-CTO arteries were excluded). Therefore, it was anticipated that collateral donor vessel flow would not fall below ischemic thresholds, and regional strain in the donor vessel territory would remain unchanged after revascularization. This could explain the lack of improvement in GLS in the WD collateral group, as both the collateral donor and recipient coronary territory were expected to receive adequate blood flow to maintain contractile function. However, inefficient coronary supply under increased demand appeared evident, given that all patients were either symptomatic or had significant provoked ischemia.
Patients with CTO typically develop collateralization of the distal vessel at varying degrees. It can contribute to the relief of ischemia and anginal symptoms, as well as to the preservation of ventricular function [12,13]. In a meta-analysis of 12 studies and 6529 patients, the WD collateralization in coronary artery disease was associated with a higher survival rate and yielded a 36% reduction in mortality risk compared to poor collateralization [42]. Numerous studies had demonstrated that a WD collateral circulation improved survival and LV function by maintaining adequate blood supply, thereby preserving metabolic function and preventing necrosis [43,44]. A strong correlation was observed between the degree of coronary collateral circulation and significantly smaller myocardial infarctions, along with preserved LV EF [14,45]. Many physicians may view robust coronary collateral circulation as indicative of a favorable prognosis in patients with CTO, and consequently, they may often recommend medical therapy over revascularization. Nevertheless, during exercise, the functional reserve of these collaterals is known to be limited, leading to ischemia in more than 90% of patients with well-collateralized occlusions [43]. Li et al. assessed 1124 CTO patients based on their treatment strategies within subgroups according to collateral degree. WD collateral circulation was not associated with a lower risk of cardiac death or MACE among patients with CTO, regardless of whether they received revascularization or not (for WD and poor collateral groups; cardiac death: 4.2% vs 4.1%; adjusted hazard ratio [HR], 1.01; p= 0.97 and MACEs: 23.6% vs 23.2%; adjusted HR, 1.07; p= 0.59) [46]. In a large cohort of 954 CTO patients undergoing revascularization or OMT, the degree of collateral supply did not correlate with long-term mortality. However, patients who underwent revascularization through CABG or PCI exhibited significantly lower mortality rates compared to those managed with medical therapy alone (p < 0.0001) [47]. In the context of CTO revascularization, there does not seem to be a corresponding improvement in prognosis according to the degree of collateral supply [48]. A plausible explanation for these results may stem from the grading technique typically employed for collateral assessment. The classical angiographic grading system, described by Rentrop et al., evaluates the effectiveness of collaterals in filling the occluded arterial segment rather than assessing the function and quality directly [20]. Although these anatomic methods are practical, they do not correlate with functional perfusion necessarily [41]. A study by Werner et al had revealed that there was no relationship between Rentrop collateral grade classification and collateral function assessment in CTO patients [49]. However, these functional assessments determining flow and pressure indices, are technically challenging and operator dependent. Today, physiological assessment of collateral supply is not used in clinical practice and remain to be a research tool. In our study, Rentrop collateral grading was used and patients were grouped according to the supply grade. Our clinical and LV functional outcomes across groups at pre-PCI and post-PCI follow-ups appeared to align with the collateral grading scores. Patients with WD collateral supply had significantly higher EF and GLS values when compared to poor supply group at the initial visit (EF: 54.2±3.4 vs 52.2±4.1, p=0.04, GLS: -14.8±1.6 vs -12.8±1.47, p=0.0001). This difference observed during the baseline examination may be attributed to the potentially larger area of hibernating myocardium in the poor collateral group. This mechanism can also explain the significant improvement of GLS observed at post-PCI follow-ups, which was evident again only in the poor collateral group.
Limitations
Our study has several limitations that must be considered. The patient volume was limited and included only those with successful PCI, which might overestimate the benefits of the procedure. Our follow-up period was relatively short and might have been insufficient to detect the effects of long-term PCI complications. While the follow-up time was ideal for detecting functional changes via GLS, EF analysis might have shown significant changes with a longer follow-up period. Additionally, we did not use a validated angina questionnaire for assessing anginal symptoms, which could have led to overestimation or underestimation of symptoms. However, we believe that personal interviews with the attending physician have the potential to yield non-inferior, and possibly superior results, as this method has been employed in many studies. Lastly, Rentrop coronary collateral grading classification was used for grading of the collaterals. Subjectivity can not be completely avoided in the assessment, though it was performed by 2 blinded interventional cardiologists.
Conclusions
Recanalization of the CTO lesions still remains a controversial topic. In carefully selected group of CTO patients, successful revascularization may lead to an improvement in LV function detected by strain analysis, in addition to the high incidence of symptomatic relief. We concluded that revascularization of CTO lesions with WD collaterals may result in no LV functional recovery, if the collateral donor vessel is free of significant lesion that is capable of causing a steal phenomenon. However, significant symptomatic relief was revealed for both collateral groups. Poorly collateralized CTO lesion territories not only resulted in baseline LV dysfunction, but also appeared to carry the potential for recovery after revascularization. We believe our results implied the importance of carefull patient selection for CTO revascularization and the value of GLS analysis for detection of subtle LV functional changes. Our results may prompt further research on CTO revascularization based on the collateral supply grade and the use of strain analysis for functional evaluation.
Institutional Review Board Statement
The study was conducted in accordance with the Declaration of Helsinki and the study protocol was reviewed and approved by the local ethical committee
Conflicts of Interest
The authors declare no conflicts of interest
References
- Di Mario, C.; Werner, G.S.; Sianos, G.; et al. European perspective in the recanalisation of Chronic Total Occlusions (CTO): consensus document from the EuroCTO Club. EuroIntervention 2007, 3, 30–43. [Google Scholar] [PubMed]
- Azzalini, L.; Jolicoeur, E.M.; Pighi, M.; et al. Epidemiology, Management Strategies, and Outcomes of Patients With Chronic Total Coronary Occlusion. The American Journal of Cardiology 2016, 118, 1128–1135. [Google Scholar] [CrossRef] [PubMed]
- Wu, E.B.; Brilakis, E.S.; Mashayekhi, K.; et al. Global Chronic Total Occlusion Crossing Algorithm: JACC State-of-the-Art Review. J Am Coll Cardiol 2021, 78, 840–853. [Google Scholar] [CrossRef]
- Galassi, A.R.; Vadala, G.; Werner, G.S.; et al. Evaluation and management of patients with coronary chronic total occlusions considered for revascularisation. A clinical consensus statement of the European Association of Percutaneous Cardiovascular Interventions (EAPCI) of the ESC, the European Association of Cardiovascular Imaging (EACVI) of the ESC, and the ESC Working Group on Cardiovascular Surgery. EuroIntervention 2024, 20, e174–e184. [Google Scholar]
- Chimura, M.; Yamada, S.; Yasaka, Y.; et al. Improvement of left ventricular function assessment by global longitudinal strain after successful percutaneous coronary intervention for chronic total occlusion. PLoS One 2019, 14, e0217092. [Google Scholar] [CrossRef] [PubMed]
- Mashayekhi, K.; Nührenberg, T.G.; Toma, A.; et al. A Randomized Trial to Assess Regional Left Ventricular Function After Stent Implantation in Chronic Total Occlusion: The REVASC Trial. JACC Cardiovasc Interv 2018, 11, 1982–1991. [Google Scholar] [CrossRef]
- Collier, P.; Phelan, D.; Klein, A. A Test in Context: Myocardial Strain Measured by Speckle-Tracking Echocardiography. J Am Coll Cardiol 2017, 69, 1043–1056. [Google Scholar] [CrossRef]
- Lang, R.M.; Badano, L.P.; Mor-Avi, V.; et al. Recommendations for cardiac chamber quantification by echocardiography in adults: an update from the American Society of Echocardiography and the European Association of Cardiovascular Imaging. J Am Soc Echocardiogr 2015, 28, 1–39. [Google Scholar] [CrossRef] [PubMed]
- Shah, A.M.; Solomon, S.D. Phenotypic and pathophysiological heterogeneity in heart failure with preserved ejection fraction. European Heart Journal 2012, 33, 1716–1717. [Google Scholar] [CrossRef]
- Sotomi, Y.; Okamura, A.; Iwakura, K.; et al. Impact of revascularization of coronary chronic total occlusion on left ventricular function and electrical stability: analysis by speckle tracking echocardiography and signal-averaged electrocardiogram. Int J Cardiovasc Imaging 2017, 33, 815–823. [Google Scholar] [CrossRef]
- Wang, P.; Liu, Y.; Ren, L. Evaluation of left ventricular function after percutaneous recanalization of chronic coronary occlusions : The role of two-dimensional speckle tracking echocardiography. Herz 2019, 44, 170–174. [Google Scholar] [CrossRef]
- Seiler, C.; Stoller, M.; Pitt, B.; et al. The human coronary collateral circulation: development and clinical importance. Eur Heart J 2013, 34, 2674–82. [Google Scholar] [CrossRef] [PubMed]
- Seiler, C.; Meier, P. Historical aspects and relevance of the human coronary collateral circulation. Curr Cardiol Rev 2014, 10, 2–16. [Google Scholar] [CrossRef] [PubMed]
- Dai, Y.; Chang, S.; Wang, S.; et al. The preservation effect of coronary collateral circulation on left ventricular function in chronic total occlusion its association with the expression of vascular endothelial growth factor, A. Adv Clin Exp Med 2020, 29, 493–497. [Google Scholar] [CrossRef] [PubMed]
- Stuijfzand, W.J.; Driessen, R.S.; Raijmakers, P.G.; et al. Prevalence of ischaemia in patients with a chronic total occlusion and preserved left ventricular ejection fraction. European Heart Journal - Cardiovascular Imaging 2016, 18, 1025–1033. [Google Scholar] [CrossRef]
- Campeau, L. Letter: Grading of angina pectoris. Circulation 1976, 54, 522–3. [Google Scholar] [CrossRef] [PubMed]
- Lang, R.M.; Badano, L.P.; Mor-Avi, V.; et al. Recommendations for cardiac chamber quantification by echocardiography in adults: an update from the American Society of Echocardiography and the European Association of Cardiovascular Imaging. J Am Soc Echocardiogr 2015, 28, 1–39. [Google Scholar] [CrossRef]
- Neumann, F.J.; Sousa-Uva, M.; Ahlsson, A.; et al. 2018 ESC/EACTS Guidelines on myocardial revascularization. EuroIntervention 2019, 14, 1435–1534. [Google Scholar] [CrossRef]
- Stefanini, G.G.; Kalesan, B.; Serruys, P.W.; et al. Long-term clinical outcomes of biodegradable polymer biolimus-eluting stents versus durable polymer sirolimus-eluting stents in patients with coronary artery disease (LEADERS): 4 year follow-up of a randomised non-inferiority trial. Lancet 2011, 378, 1940–8. [Google Scholar] [CrossRef]
- Peter Rentrop, K.; Cohen, M.; Blanke, H.; et al. Changes in collateral channel filling immediately after controlled coronary artery occlusion by an angioplasty balloon in human subjects. Journal of the American College of Cardiology 1985, 5, 587–592. [Google Scholar] [CrossRef]
- Cohen, M.; Rentrop, K.P. Limitation of myocardial ischemia by collateral circulation during sudden controlled coronary artery occlusion in human subjects: a prospective study. Circulation 1986, 74, 469–476. [Google Scholar] [CrossRef] [PubMed]
- Li, K.H.C.; Wong, K.H.G.; Gong, M.; et al. Percutaneous Coronary Intervention Versus Medical Therapy for Chronic Total Occlusion of Coronary Arteries: A Systematic Review and Meta-Analysis. Curr Atheroscler Rep 2019, 21, 42. [Google Scholar] [CrossRef] [PubMed]
- Werner, G.S.; Martin-Yuste, V.; Hildick-Smith, D.; et al. A randomized multicentre trial to compare revascularization with optimal medical therapy for the treatment of chronic total coronary occlusions. Eur Heart J 2018, 39, 2484–2493. [Google Scholar] [CrossRef]
- Juricic, S.A.; Tesic, M.B.; Galassi, A.R.; et al. Randomized Controlled Comparison of Optimal Medical Therapy with Percutaneous Recanalization of Chronic Total Occlusion (COMET-CTO). Int Heart J 2021, 62, 16–22. [Google Scholar] [CrossRef] [PubMed]
- Obedinskiy, A.A.; Kretov, E.I.; Boukhris, M.; et al. The IMPACTOR-CTO Trial. JACC Cardiovasc Interv 2018, 11, 1309–1311. [Google Scholar] [CrossRef]
- Miyashita, H.; Mansikkaniemi, L.; Sinisalo, J.; et al. Long-term improvement of symptoms of angina pectoris after successful revascularization of coronary artery chronic total occlusions. Scandinavian Cardiovascular Journal 2023, 57, 2161621. [Google Scholar] [CrossRef] [PubMed]
- Stazi, F. Dilemmas in cardiology: when to recanalize a chronic total occlusion. Eur Heart J Suppl 2023, 25, B149–B154. [Google Scholar] [CrossRef] [PubMed]
- Agrawal, H.; Lange, R.A.; Montanez, R.; et al. The Role of Percutaneous Coronary Intervention in the Treatment of Chronic Total Occlusions: Rationale and Review of the Literature. Curr Vasc Pharmacol 2019, 17, 278–290. [Google Scholar] [CrossRef]
- Megaly, M.; Saad, M.; Tajti, P.; et al. Meta-analysis of the impact of successful chronic total occlusion percutaneous coronary intervention on left ventricular systolic function and reverse remodeling. J Interv Cardiol 2018, 31, 562–571. [Google Scholar] [CrossRef]
- Galassi, A.R.; Boukhris, M.; Toma, A.; et al. Percutaneous Coronary Intervention of Chronic Total Occlusions in Patients With Low Left Ventricular Ejection Fraction. JACC Cardiovasc Interv 2017, 10, 2158–2170. [Google Scholar] [CrossRef] [PubMed]
- Bucciarelli-Ducci, C.; Auger, D.; Di Mario, C.; et al. CMR Guidance for Recanalization of Coronary Chronic Total Occlusion. JACC Cardiovasc Imaging 2016, 9, 547–56. [Google Scholar] [CrossRef] [PubMed]
- Lopes, R.D.; Alexander, K.P.; Stevens, S.R.; et al. Initial Invasive Versus Conservative Management of Stable Ischemic Heart Disease in Patients With a History of Heart Failure or Left Ventricular Dysfunction: Insights From the ISCHEMIA Trial. Circulation 2020, 142, 1725–1735. [Google Scholar] [CrossRef] [PubMed]
- Schumacher, S.P.; Stuijfzand, W.J.; de Winter, R.W.; et al. Ischemic Burden Reduction and Long-Term Clinical Outcomes After Chronic Total Occlusion Percutaneous Coronary Intervention. JACC: Cardiovascular Interventions 2021, 14, 1407–1418. [Google Scholar] [CrossRef] [PubMed]
- Schumacher, S.P.; Nap, A.; Knaapen, P. Prognostic Impact of Left Ventricular Dysfunction and Ischemia Reduction After Chronic Total Occlusion Percutaneous Revascularization. JACC: Cardiovascular Interventions 2022, 15, 1096–1098. [Google Scholar] [CrossRef]
- Dzavik, V.; Carere, R.G.; Mancini, G.B.; et al. Predictors of improvement in left ventricular function after percutaneous revascularization of occluded coronary arteries: a report from the Total Occlusion Study of Canada (TOSCA). Am Heart J 2001, 142, 301–8. [Google Scholar] [CrossRef] [PubMed]
- Radwan, H.; Hussein, E. Value of global longitudinal strain by two dimensional speckle tracking echocardiography in predicting coronary artery disease severity. Egypt Heart J 2017, 69, 95–101. [Google Scholar] [CrossRef]
- Stanton, T.; Leano, R.; Marwick, T.H. Prediction of all-cause mortality from global longitudinal speckle strain: comparison with ejection fraction and wall motion scoring. Circ Cardiovasc Imaging 2009, 2, 356–364. [Google Scholar] [CrossRef] [PubMed]
- Geyer, H.; Caracciolo, G.; Abe, H.; et al. Assessment of myocardial mechanics using speckle tracking echocardiography: fundamentals and clinical applications. J Am Soc Echocardiogr 2010, 23, 351–69. [Google Scholar] [CrossRef]
- Erdogan, E.; Akkaya, M.; Bacaksiz, A.; et al. Early assessment of percutaneous coronary interventions for chronic total occlusions analyzed by novel echocardiographic techniques. Clinics (Sao Paulo) 2013, 68, 1333–7. [Google Scholar] [CrossRef]
- Kholeif, A.E.; El Sharkawy, E.; Loutfi, M.; et al. Evaluation of the impact of percutaneous coronary intervention of chronic total occlusion on regional myocardial function using strain echocardiography. Egypt Heart J 2019, 71, 8. [Google Scholar] [CrossRef]
- Allahwala, U.K.; Brilakis, E.S.; Byrne, J.; et al. Applicability and Interpretation of Coronary Physiology in the Setting of a Chronic Total Occlusion. Circ Cardiovasc Interv 2019, 12, e007813. [Google Scholar] [CrossRef] [PubMed]
- Meier, P.; Hemingway, H.; Lansky, A.J.; et al. The impact of the coronary collateral circulation on mortality: a meta-analysis. Eur Heart J 2012, 33, 614–21. [Google Scholar] [CrossRef]
- Werner, G.S. The role of coronary collaterals in chronic total occlusions. Curr Cardiol Rev 2014, 10, 57–64. [Google Scholar] [CrossRef] [PubMed]
- Teunissen, P.F.; Horrevoets, A.J.; van Royen, N. The coronary collateral circulation: genetic and environmental determinants in experimental models and humans. J Mol Cell Cardiol 2012, 52, 897–904. [Google Scholar] [CrossRef] [PubMed]
- McEntegart, M.B.; Badar, A.A.; Ahmad, F.A.; et al. The collateral circulation of coronary chronic total occlusions. EuroIntervention 2016, 11, e1596–e1603. [Google Scholar] [CrossRef]
- Li, Z.; Wang, Y.; Wu, S.; et al. Good coronary collateral circulation is not associated with better prognosis in patients with chronic total occlusion, regardless of treatment strategy. Hellenic J Cardiol 2023, 69, 9–15. [Google Scholar] [CrossRef]
- Allahwala, U.K.; Kiat, H.; Ekmejian, A.; et al. Both surgical and percutaneous revascularization improve prognosis in patients with a coronary chronic total occlusion (CTO) irrespective of collateral robustness. Heart Vessels 2021, 36, 1653–1660. [Google Scholar] [CrossRef] [PubMed]
- Allahwala, U.K.; Kott, K.; Bland, A.; et al. Predictors and Prognostic Implications of Well-Matured Coronary Collateral Circulation in Patients with a Chronic Total Occlusion (CTO). Int Heart J 2020, 61, 223–230. [Google Scholar] [CrossRef]
- Werner, G.S.; Ferrari, M.; Heinke, S.; et al. Angiographic assessment of collateral connections in comparison with invasively determined collateral function in chronic coronary occlusions. Circulation 2003, 107, 1972–7. [Google Scholar] [CrossRef]
Disclaimer/Publisher’s Note: The statements, opinions and data contained in all publications are solely those of the individual author(s) and contributor(s) and not of MDPI and/or the editor(s). MDPI and/or the editor(s) disclaim responsibility for any injury to people or property resulting from any ideas, methods, instructions or products referred to in the content. |
© 2024 by the authors. Licensee MDPI, Basel, Switzerland. This article is an open access article distributed under the terms and conditions of the Creative Commons Attribution (CC BY) license (http://creativecommons.org/licenses/by/4.0/).
Copyright: This open access article is published under a Creative Commons CC BY 4.0 license, which permit the free download, distribution, and reuse, provided that the author and preprint are cited in any reuse.


