Submitted:
23 July 2024
Posted:
24 July 2024
You are already at the latest version
Abstract
Brewers’ spent grain (BSG) is the major by-product of beer production (70-80% moisture) and the feasibility of its application in foodstuffs depends primarily on its drying. Our objective was to evaluate the effect of physical separation with or without ultrasound application on color, total phenolic content (TPC), antioxidant activity, proximate composition, total dietary fibers, and particles size distribution of BSG powders. From wet BSG (W), two processes, without (A) or with (B) ultrasound, encompassing pressing, convective air-drying, sieving, fraction separation, and milling were evaluated. Powders A1, A2, B1 and B2 were generated. The total color difference compared with W increased throughout both processes, ranging from 1.1 (B1 x A1) to 5.7 (B1 x A2). No significant difference was observed for TPC, while lower antioxidant activity (ABTS+) was observed for process B powders, especially for B2, likely due to the release of antioxidant compounds to the liquid during pressing after ultrasound application. Nevertheless, process B powders showed higher content of total dietary fiber (p < 0.05). In conclusion, process B, with ultrasound application, may be interesting for further extraction of soluble fibers. However, the developed process A may be feasible for industrial and craft brewers, and further studies regarding the effect of their application in foods should be encouraged.
Keywords:
Brewers’ spent grain
; sonication
; convective air-drying
; sieving
; flour
Introduction
Brewers’ spent grain (BSG) is an abundant by-product of beer production composed of husks of barley malt grain. Still, its application in foods is limited due to its high susceptibility to microbial spoilage [1]. The estimated global production of BSG is greater than 180 million tons per year, corresponding to 85% of the breweries’ residues, and most of it is discarded or used as low-value animal feed [2]. BSG has a high nutritional content on a dry basis, including dietary fiber (50 to 70%) such as arabinoxylans along with cellulose, hemicellulose, and lignin, protein (15 to 25%), lipids (7 to 10%), starch (1 to 12%), vitamins and minerals [3]. BSG is also a source of phenolic compounds, such as phenolic acids, flavonoids, tannins, proanthocyanidins, and aminophenolic compounds [4]. BSG contains 70% to 80% moisture and therefore requires a considerable amount of energy for microbial stabilization by drying to reach a moisture level of around 6% or lower [3,5,6]. However, a pre-pressing step makes preservation by drying more efficient energetically [7].
Traditionally, the methods to separate the components of commercial interest from BSG is by chemical methods, but the use of aggressive solvents can generate residues and contaminants, which represents an environmental disadvantage in the valorization process [8]. In this context, a limited number of studies have used physical methods, such as ultrasound [9], pressing [10], grinding and centrifugation [11], and sieving [12] on BSG treatment. The application of ultrasound technology for pretreatment of lignocellulosic biomass has some potential for large-scale processes, and high-power ultrasound can help breaking down the cellular structures present in the BSG, facilitating the release of compounds and nutrients contained in the grains [9].
Hassan et al. [9] evaluated ultrasound pretreatment as a technique to increase saccharification of BSG. In the study by Tang et al. [13], ultrasound protein extraction was optimized from 1 g of BSG sample and 100 mL of extractant. The optimal conditions included an extraction time of 82.4 min, an ultrasonic power of 88.2 W/100 mL, and a solid-to-liquid (S/L) ratio of 2.0 g/100 mL, which resulted in a drastic improvement in yield.
On the other hand, ultrasound has also been used in combination with convective drying to improve moisture migration and quality of dried products. Its application is done prior to drying [14,15,16].
Milling, as a relevant unit operation, contributes to improved digestibility by opening cell structures and reducing cellulose crystallinity [17]. Ibbett et al. [11], proposed a novel process using a hydro-mechanical method with a colloid mill, which breaks down residual aleurone and BSG endosperm tissues, resulting in a protein-rich material with particle size of 1 to 10 μm. The resulting protein fraction is separated by centrifugation, obtaining a material with high protein content in small particles.
Obtaining different fractions with specific sizes adjustable according to the desired purpose makes it possible to facilitate the use of BSG in various applications. This is where sieving becomes the key operation, as it allows obtaining different fractions with specific and homogeneous sizes. Shih et al. [12] used sieving to obtain a homogeneous 800 μm fraction of BSG flour that was incorporated into food products, specifically muffins, seeking to improve their nutritional content without significantly altering the muffin’s sensory appearance.
BSG can be valorized like a powder for use as food ingredient for human feeding. Therefore, it is interesting to explore BSG based powders obtained with the application of ultrasound in the wet by-product combined with the physical separation of the BSG stabilized by drying. Then, the objective of this study was to evaluate the effect of physical separation with or without ultrasound application on instrumental color, total phenolic content, antioxidant activity, proximate composition, total dietary, soluble and insoluble fibers, and particles size distribution of powders obtained from brewers’ spent grain (BSG) for potential application in foodstuffs.
3. Material and Methods
3.1. Raw Material
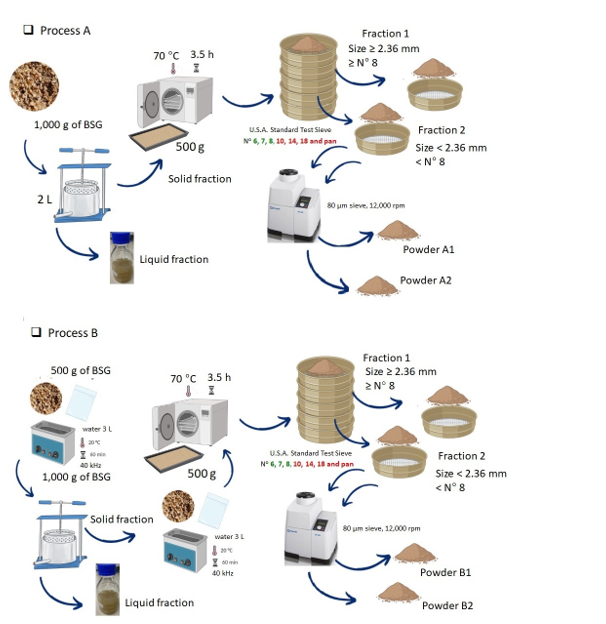
The BSG was kindly provided by a craft brewery (Birrell Ltda., Villarrica, Chile) in the Araucanía Region. It was distributed (1,010 g) in Ziploc® bags (26,8 x 27,3 cm, USA), and immediately frozen at -18 °C. The thawing of each bag was carried out in a refrigerator for 24 h at a temperature of 4-5 °C. Once thawed, it was subjected to the sequences of operations shown in Figure 1. This thawed BSG is referred to as the wet original BSG.
3.2. Process on BSG Solid Fraction
Two sequences of operations (Processes A and B) were evaluated (Figure 1). Each process was repeated six times (sextuplicate), generating powders identified as A1, A2, B1 and B2.
During each process, moisture and color of BSG were determined by sampling in points identified in the Figure 1 as wet original (W), pressed (P), dried (D), first ultrasound (U1), second ultrasound (U2) and powder (A1, A2, B1, B2). Moisture content and instrumental color were determined following the procedure described in 3.3.1. and 3.3.2., respectively.
3.2.1. Ultrasound
For the ultrasound operation, an ultrasonic equipment (NHF-2010, HumanLab Instrument Co, Korea) was used at its maximum frequency (40 kHz) for 60 min [9]. Each sample of 500 g of BSG was arranged in a Ziploc® bag (26,8 x 27,3 cm, USA) and introduced into the ultrasonic equipment in process B (U1 and U2 at Figure 1). The bags with BSG were maintained immersed into distilled water (3 L) placed in the ultrasonic bath, avoiding flotation during the ultrasound treatment. The water temperature monitored in the equipment screen was recorded every 5 min.
3.2.2. Pressing
Pressing was carried out using a manual press with a 2 liter-recipient of stainless steel and a mechanical screw (equipment without manufacturer's brand). In each repetition, 1,000 g of BSG were pressed from W (Process A) or U1 (Process B). From this operation, two fractions were obtained: liquid and solid (Figure 1). The liquid fraction was preserved by freezing at -18 °C, while the solid fraction was subjected to the operation sequences to obtain de powders. The yields of pressing for obtaining the liquid fraction in processes A and B were determined.
3.2.3. Convective Air-Drying
Drying was carried out in a universal oven (UFB-500, Memmert, Germany) at 70 °C for 3.5 h. BSG mass (500 g) was loaded and uniformly distributed in an area of 32 x 48 cm of the plastic mesh with a 2 mm perforation, to prevent sample loss, and placed over the owner tray equipment, that has 10 mm diameter holes. A layer of approximately 1 cm of thickness was achieved with 500 g of BSG disposed over the tray.
3.2.4. Sieving
In processes A and B, for sieving, there were used U.S.A. Standard Test Sieve No 6, 7, 8, 10, 14 and 18 (Gilson Company Inc., USA), with specific openings of 3.35, 3, 2.36, 2, 1.41 and 1 mm, respectively. The collection container was installed below sieve No 18. The sieving was carried out by shaking and vibration using the Ro-Tap equipment (RX-29, W.S. Tyler, Canada) for 15 min.
3.2.5. Fraction Separation
Two fractions were obtained by separation of BSG mass retained in each sieve mentioned above, as shown in Figure 1. Fractions A1 and B1 (coarse) included particles with a size equal to or larger than 2.36 mm, while fractions A2 and B2 (fine) comprised particles with sizes smaller than 2.36 mm. The division into two fractions was made on sieve No 8, 2.36 mm, since above that size the brewers’ spent grain (BSG) were whole and agglomerated, while below that size these grains were split.
3.2.6. Milling
To obtain the powders from fractions 1 and 2 (Figure 1), an ultracentrifugal mill (ZM 200, Retsch, Germany) with an 80 µm sieve was used at 12,000 rpm. The obtained powder samples (A1, A2, B1 and B2) were packed in hermetically sealed, vapor-tight aluminum bags. They were stored at room temperature (20-25 °C) until characterization.
3.3. Characterization of the Powders Obtained from the BSG
The characterization of the powders obtained was carried out by determining the moisture content, instrumental color, total phenolic content, antioxidant activity of powders’ extracts against the 2,2′-azinobis-(3-ethylbenzothiazoline-6-sulfonic acid) radical (ABTS+), proximate analysis, total dietary, soluble and insoluble fibers, and particle size distribution.
3.3.1. Moisture Content
3.3.2. Instrumental Color
The instrumental color of BSG was quantified with a Minolta Chromameter CR-200b colorimeter (Japan) with the CIE L*a*b* system as described by Ihl et al. [20]. The instrument was firstly calibrated with a white standard tile (Y = 93 1, x = 0 3140, and y = 0 3212) under illuminant condition C (6774 K). The L* variable lightness index ranges in the scale from 0 for black to 100 for white. The a∗ scale measures the degree of red (+a*) or green (−a*) colors, and the b∗ scale measures the degree of yellow (+b*) or blue (−b*) colors.
For color measurement, each BSG sample was homogeneously distributed in Petri dish with a diameter of 9 cm. Readings were taken by placing the instrument on the surface at 12 different points of each sample.
The ΔE, which quantifies total color differences [21], was determined by Equation (1), following the analytical classification of Adekunte et al. [22], where values indicate very different colors (ΔE > 3), different colors (1.5 < ΔE < 3) and small colors difference (ΔE < 1.5).
The Chroma (C*) was calculated using Equation (2). This quantitative attribute (colorfulness) is used to determine the degree of difference of a hue in comparison to a grey color with the same lightness, with higher values being indicative of higher perceived intensity [21].
Hue angle (h*) was determined by Equation (3). It is used to define the difference of a certain color with reference to grey color with the same lightness. A higher hue angle represents a lesser yellow character in the assays [21].
3.3.3. Hydroalcoholic Extraction
The hydroethanolic extracts of BSG samples designated as A1, A2, B1, and B2 were prepared according to the method reported by Meneses et al. [23], with some modifications. First, 10 mL of ethanol-water 60:40 v/v were added to 0.5 g of dried samples. The extraction procedure took place through ultrasound (UltraCleaner 1400A, Unique, Indaiatuba, SP, Brazil) for 15 min at 45°C; subsequently, the samples were centrifuged (Eppendorf 5810R, Eppendorf AG, Hamburg, Germany) at 5000 x g for 15 min, and the supernatant was collected.
3.3.4. Total Phenolic Content
Total phenolic compounds were determined using the spectrophotometric technique outlined by Al-Duais et al. [24], with some modifications. Aliquots of 20 µL of the standard solution (gallic acid) or the BSG extracts were combined with 100 µL of the Folin– Ciocalteau solution (10% concentration in water) in each microplate well. Subsequently, 75 µL of a 7.5% sodium carbonate aqueous solution was added to each well after a 5-minute incubation period. A control was prepared by replacing the sample with distilled water. After 40 min of reaction, the absorbance was read at 740 nm using a microplate reader (Multiskan EX, Thermo Fisher Scientific, Waltham, USA). The calibration curve was constructed with gallic acid as standard at concentrations ranging from 20 to 120 µg/mL.
3.3.5. Antioxidant Activity against ABTS Radical
The determination of antioxidant capacity was carried out using the ABTS free radical method as described by Al-Duais et al. [24], with some modifications. To prepare the ABTS+ stock solution, a 7 mM solution of ABTS+ was mixed with 2.45 mM potassium persulphate, and the resulting mixture was left to stand in darkness at room temperature for 16 h. The ABTS radical solution was prepared by diluting it with 75 mM potassium phosphate buffer (pH 7.4) until reaching an absorbance of 0.700 ± 0.01 at 734 nm. Aliquots of 20 µl of Trolox or BSG extracts were combined with 220 µL of ABTS radical solution into microplate wells and incubated at room temperature in the absence of light. After 6 min, the absorbance was measured at 734 nm, with the potassium phosphate buffer serving as a blank. Trolox was employed as a standard at concentrations ranging from 12.5 to 200 µM and the outcomes were expressed as µmol Trolox equivalents per gram of BSG powders.
3.3.6. Proximate Composition
The proximate composition was performed according to the AOAC [25]. Total lipids (fat) was evaluated by Soxhlet extraction followed by evaporation, protein was determined by the Kjeldahl method, using the 5.83 as a factor to conversion the percentage of nitrogen, and ash was quantified by gravimetry by calcination at 550 ± 25 °C. Total dietary fibers were obtained by enzymatic method according to protocol described by Asp et al. [26], with some modification. It includes both the soluble and insoluble fractions of the fibers present in the sample. Available carbohydrate was calculated by difference of 100% and the sum of total lipid, protein, total dietary fiber and ash. The results were expressed in dry matter (% w/w) to adequate comparison among powders.
3.3.7. Particle Size Distribution
The particle size of powders obtaining by processes A and B were determined using U.S.A. Standard Test Sieve No 40, 80, 120, 170, 200 and 325 (Gilson Company Inc., USA), with specific openings of 425, 180, 125, 90, 75 and 45 µm, respectively. The collection container was installed below the sieve No 325. The sieving was carried out by shaking and vibration using Ro-Tap equipment (RX-29, W.S. Tyler, Canada) for 15 minutes.
3.4. Statistical Analysis
The data were subject to analysis of variance (ANOVA) with a significance level of p < 0.05, using Minitab® Statistical Software 21.0.3.1.0 (Chicago, USA). For significant differences, Tukey’s honestly and t-Student post-hoc tests were applied. Data corresponding of each two processes were collecting in sextuplicate. The powders color was carried out in sextuplicate. Total phenolic content, antioxidant activity against ABTS radical, total dietary, soluble and insoluble fiber and particle size distribution were obtained in triplicate, while proximate composition in duplicate.
4. Results and Discussion
4.1. Process Effects on BSG Solid Fraction
4.1.1. Monitoring of Moisture Content and Instrumental Color
The wet original BSG (W) used for both processes A and B show similar moisture levels, with 72.4 and 71.2%, respectively, that do not differ significantly (p > 0.05). Table 1 show the monitoring of moisture content (% wet basis, w.b.) during processes A and B (Figure 1) at the sampling points. These values agree with other studies that reported a moisture content ranging from 70 to 80% for fresh BSG [1,6,12,27] obtained immediately after the brewing process.
Process B include ultrasound operation before (U1) and after (U2) pressing. Ultrasound treatment has been used for assisted extraction of phenolic compounds and protein, enhancing saccharification, and structural modification of BSG and several biological materials [9,13,16,22,28,29,30,31].
The pressing (P) and drying (D) operations are common in both processes and the moisture contents achieved do not differ (p > 0.05) between A and B after these operations. In terms of yields, 47.2 ± 1.8 mL of liquid fraction /100g of original wet BSG (W) was obtained by pressing in process A and 53.7 ± 2.5 mL of liquid fraction /100g ultrasound BSG (U1) in process B. El-Shafey et al. [32] proposed dewatering of brewer's spent grain using a membrane filter press, but they inform that there are processing plants for eliminate BSG water through a two-step process: pressing (to get a material with < 65% moisture) and drying (to get a material with < 10% moisture). Pressing produced a decrease of 12.6 (Process A) and 12.1 (Process B) percentage points in the moisture content of the wet original BSG (W). Drying carried out at 70 °C for 3.5 h (D) allowed BSG to be stabilized at a level of moisture content of 5.2 and 5.4% (Table 1) similar or slightly higher than values reported by Fărcaş et al. [3], Naibaho et al. [5] and Thai et al. [6]. A moisture content of 13% (wet basis) for BSG has been reported in order to avoid microbial proliferation, especially Bacillus cereus [33]. These levels of moisture content prevent the deterioration of BSG, which is one of the main problems for the use of this by-product of the brewing industry [1].
For process B, ultrasonic applications U1 and U2, performed to the wet original (W) and pressed (P) BSG, respectively, produced no significant differences in moisture content (p > 0.05) between W and U1 as well as between P and U2. However, the slight increase in moisture content due to treatment with ultrasound could be attributed to some structural modification of BSG or water permeability of Ziploc bags which was non-visible. It was not possible to reach a lower moisture content of the BSG by drying (D) in process B (5.4%), due to the effect of using the second application of ultrasound (U2), compared to process A (5.2%). Possibly, its effect could have been observed on the drying curve, showing a decrease in the time to reach the moisture content for BSG stabilization in the process B compared to A, as it has been reported for other plant materials when ultrasound was used [14,15,16]. Since the drying was carried out in a universal oven in this study, without the possibility of introducing a balance, data could not be obtained to construct the drying curve. This effect should be investigated in the future.
The moisture contents of powders did not differ significantly (p > 0.05) concerning the values of dried BSG (D) in each processes A and B (Table 1). However, a slight increase is observed concerning D for the moisture contents of powders A1 and B1 (obtained from dried BSG with particles size equal or larger than 2.36 mm) and A2 and B2 (obtained from died BSG with particles sizes smaller than 2.36 mm). As shown at Figure 1, the operation of sieving, fraction separation, and milling may have exposed dried BSG to the environmental air that could have contributed to a slight increasing in the moisture content of the powder. The moisture contents of powders (Table 1) obtained from fractions 1 (Powders A1 and B1) are slightly higher than those obtained from fraction 2 (Powders A2 and B2) but did not differ statistically (p > 0.05) among them. This behavior agrees with the fact that larger particles have a greater water holding capacity compared to finer particles reported for leaves of white cabbage to produce dietary fiber powder, which could be attributed to the damage of the fiber matrix and the collapse of the pore during grinding [34].
The moisture content of BSG powders (Table 1) ranged from 5.9% to 6.6% (w.b.). They are within those reported by Shih et al. [12], Okpala and Ofoedu [35] and Baiano et al. [36] for BSG flour: 12.2, 5.4-5.6 and 2.9-3.5%, respectively.
Table 2 and Table 3 present the instrumental color parameters concerning wet original BSG (W) of processes A and B, respectively. Processes A and B present a significant increase (p < 0.05) in lightness (L*) from wet original BSG (W) to the powder BSG (A1, A2, B1 and B2). These results agree with Ahmed et al. [37], Hejna et al. [38] and Hejna et al. [39], who informed that the lightness is the color parameter most significantly affected by particle size for water chestnut flour and extruded and ground BSG obtained by thermo-mechanical operation in a twin-screw extruder. Hejna et al. [38] and Hejna et al. [39] have been reported instrumental color ranges with general values of L* from 48.17 to 58.32, a* from 4.32 to 5.88, and b* from 12.14 to 14.82 for the BSG, different to L* and b* values of wet original (W) showed at Table 2 and Table 3. This could be attributed to differences in barley malts and beer type.
Process A (Table 2), which includes the wet original BSG (W), pressing (P), drying (D), and powder (A1 and A2), shows significant differences (p < 0.05) in L*, a*, ΔE and h*color parameters. Lightness (L*) shows a significant increase throughout the process, with higher values for A1 and A2, which can be attributed to changes in the surface area of the material after milling. Smaller particles show higher lightness, which could be associated with an increase in the specific surface area that allows more light reflection [38,40,41].
The a* values (Table 2) decrease from P to D, indicating an alteration in the intensity of red or an increase in green, but remains stable after sieving and milling (Figure 1) to obtain A1 and A2. The change in a* of BSG by drying (D) could be attributed to chemical reactions such as Maillard reaction and caramelization of reducing sugars present in this by-product [12].
The total color difference (ΔE), respect to W, increases progressively, with greater changes after drying, sieving and milling to obtain the powders. According to the classification of Adekunte et al. [22], the observed changes concerning wet original BSG color range from very different colors (ΔE > 3) for D, A1, and A2 to a small colors difference (ΔE < 1.5) for P.
Respect to h* (Table 2), the BSG as wet original (W), pressed (P) and powder A2 showed a significant lesser (p < 0.05) yellow character in the assays [21] than BSG after drying (D) and powder A1. Two factors probably affect this behavior of h* in the process A. Maybe, the first one would be the smaller particle size of fraction 1 then 2, associated with an increase in the specific surface area [38,40,41], and the second would be the chemical reaction that led to browning associated to reducing sugars [12].
To our knowledge, the mechanisms underpinning changes in BSG color during drying have not yet been reported. However, color changes of BSG during drying using hot-air dried, mainly at higher temperature (110 °C), is probably due to Maillard reaction and caramelization, generating a darker color product [12]. Also, the Maillard reactions would be those that occurred in the extrusion grinding of BSG performed by thermo-mechanical treatment in the twin-screw extruder [38,39].
Process B (Table 3), which includes ultrasound treatments before (U1) and after (U2) pressing, presents similar patterns to process A (Table 2), with significant differences (p < 0.05) in L*, a*, ΔE and h* color parameters. Hence, lightness (L*) is strongly affected by drying (D), sieving, and milling (Figure 1), with higher values for powder B1 and B2. Moreover, the process B shows variations in a* after, indicating an impact of drying, sieving, and milling on red/green intensity with respect to W. Furthermore, the total color difference (ΔE) increases more by pressing (P) in the process B (Table 3) than A (Table 2). Nonetheless, similarly to process A, the greater changes in ΔE are observed after drying, sieving, and milling. Thus, according to Adekunte et al. [22], the observed changes concerning W range from very different colors (ΔE > 3) for D, B1, and B2, to different colors (1.5 < ΔE < 3) for P and U2 and including small color difference (ΔE < 1.5) for U1. The process B affect significantly (p < 0.05) the values of h*, but the change in this color parameter occur in the pressing (P) operation, while in process A occur in the drying (D) operation. As mentioned above, the changes in color parameter in process B could be attributed to chemical modifications such as Maillard reaction and caramelization [12,38,39] and to the decrease in particle size [38,40,41] caused mainly by drying and milling, respectively.
For both processes (Table 2 and 3), the values of b*, and C* (chroma) are not affected after treatment applied to W, since no significant differences (p > 0.05) were observed. This behavior agrees with those reported by Shih et al. [12], Hejna et al. [38] and Hejna et al. [39] for the effect of drying and extrusion on C* at different temperatures. This color parameter did not vary from fresh to dried or extruded BSG.
4.1.2. Ultrasonic Temperature Monitoring
Figure 2 and Figure 3 show the temperature increase of water ultrasonic bath during operations U1 and U2 applied for 60 min to wet original (W) and pressed (P) BSG, respectively. This increase in temperature can be attributed to energy release that occurs by acoustic cavitation in ultrasonic operations. Acoustical energy is generated by the transmission of ultrasound waves that consist of the rarefaction and compression cycles traveling through the liquid medium. When the cavities formed in the liquid collapse, small amounts of energy are released in the form of heat. In fact, the cavitation effects generate high temperatures, pressure, and violent shear forces, leading to the formation of the referred as "hot spots" [28]. The final collapse phase is adiabatic in nature and, thus, locally produces high-temperature and high-pressure conditions [42].
The slope of the temperature-time curves showed in Figure 2 and Figure 3, which represent the rate of water temperature rise at U1 and U2 were 0.62 ± 0.04 °C/min and 0.57 ± 0.05 °C/min, respectively. The maximum water temperatures reached during the ultrasound treatment were 55.8 ± 1.9 °C for U1 and 53.8 ± 1.2 °C for U2. No significant differences (p < 0.05) were observed in values of slop and maximum water temperatures between U1 and U2.
Increasing the temperature of water used into the ultrasonic equipment certainly produced a heating in the BSG, which was not measured due to the difficulty in introducing a thermocouple into the Ziploc® bag without water infiltration. However, the temperature reached by BSG in U1 and U2 probably did not exceed 55.8 and 53.8 °C, respectively. Therefore, we consider that no important chemical or structural changes should have occurred in the BSG due to the increase in the water temperature during ultrasound operation. Hassan et al. [9] have applied ultrasound at temperatures of 20 to 60 °C for times of 20 to 60 min and after the optimized pretreatment of the native BSG, and following saccharification, 74% of sugars in BSG were recovered, while no degradation of lignin was observed. Conversely, Alonso-Riaño et al. [29], aiming at obtaining polyphenol compounds from BSG, fixed 47 °C as the temperature during application of ultrasound assisted extraction for 30 min (60 min of total experiment) to avoid the degradation of these bioactive compounds.
4.1.3. Particle Sieve Size Distribution
Figure 4 shows the distribution of particle sieve size in percentage of the BSG for processes A and B, after sieving. There are statistically significant differences (p < 0.05) between A and B for particle size fractions (in percentage) retained at the U.S.A. Standard Test Sieve No 6, 8, 10, 14, and 18 (Gilson Company Inc., USA), with specific openings of 3.35, 2.36, 2, 1.41, and 1 mm, respectively. This suggests that ultrasound applied to the wet original and pressed BSG, according to process B, has an impact on the size distribution of the particles that have been dried and sieved.
For process A (Figure 4), the particle sieve size fractions retained on the 3.35- and 3.00-mm sieves predominated, representing 50.9 % (± 3.6%) of the total mass of BSG after sieving, while for process B, these two particles size fractions previously mentioned represented 43.6 % (± 3.5%) of the total BSG mass. The particles sieve size fractions (in percentage) retained in sieves equal and smaller than 2.36 mm was higher for the process B (56.4 ± 3.0 %) than A (49.1± 3.3%). The ultrasound applied (U1 and U2, process B) apparently allowed that parts of the BSG were to be broken or detached. There was an effect at a structural level of BSG, which produced an increase in the fractions (in percentage) of smaller sizes in the process B compared to A. This phenomenon could be associated with the effects of ultrasound, which produces cavitation phenomena where microbubbles are formed that grow and then collapse violently when they reach a critical size, transforming sonic energy into mechanical energy [9]. This energy could be transmitted to vegetal material into the Ziploc® bag allowing it to be broken or detach husk, pericarp and seeds of the BSG grains. Bundhoo and Mohee [28] explain how the ultrasound impacts physical characteristics of the biomass or waste materials by decreasing the particle size and increasing the surface area. Li et al. [31] suggested that ultrasound assisted extraction exposed more buried SH bonds on the surface through reduction in BSG partial size and modification of protein structures.
4.2. Characterization of the BSG Powders
As previously mentioned, powders A1, A2, B1 and B2 from processes A and B (Figure 1) were obtained after dried BSG sieving by separation in two fractions (1 and 2). The obtained final BSG powders from both operational sequences A (without ultrasound application) and B (with ultrasound application) with different particle size fractions (1 and 2) were then characterized.
4.2.1. Color
Table 4 presents the differences in color (ΔE) between the BSG powders obtained by processes A and B (Figure 1).
As show at the Table 4, the higher (p < 0.05) total difference colors was reached between powders A2 and B1, which behavior would be affected by the use of ultrasound (U1 and U2) in process B added to fraction separation (1 and 2) as show al Figure 1 in both processes.
Following the classification by Adekunte et al. [22], very different colors (ΔE > 3) were observed between powders A1 and A2 (Table 4), suggesting that the color difference could be attributed to the structural composition of the two fractions of dried BSG obtained after sieving by separation in particle size above and below 2.36 mm (Fractions 1 and 2, respectively). The powders B1 and B2 showed smoother differences in color (1.5 < ΔE < 3) between each other, according to the classification mentioned. We considered that the structural modification in the distribution of particle size (Figure 4) produced by ultrasound (U1 and U2) allowed obtaining powders with smaller differences in their colors in the process B respect to the process A.
When the analysis is for the powder obtained from the same fractions (1 and 2, above and below 2.36 mm, respectively) but by different processes, the comparison between A1 and B1 (Table 4) showed smoother color differences (ΔE < 1.5) than between A2 and B2 (1.5 < ΔE < 3), according to the Adekunte et al. [22] classification. Our results reveal that changes in the powders color due to ultrasound treatments (U1 and U2) applied in the process B but not in A affected to a greater extent the fraction 2, composed by particles sizes smaller than 2.36 mm (Figure 4). Possibly, the chemical composition of fraction 2 particles after separation are more affected by the ultrasound than fraction 1 particles. Several chemical changes are impacted by ultrasound on biomass or waste material, as reported by Bundhoo and Mohee [28] that include changes in lignin, hemicellulose and cellulose content, cellulose crystallinity, and extent of polymerization, organic matter solubilization, among others. It is possible that particles of fraction 2 that were submitted to ultrasound have been affected to a greater extent than the particles of the fraction 1 by the following operations of process B. Then, the impact on color was greater in fraction 2 than 1 due to Maillard reaction or caramelization, which probably occurred during the drying step [12,38,39] and to the effect of decreased particle size caused by milling [39,40,41] in process B.
4.2.2. Total Phenolic Content and Antioxidant Activity against ABTS Radical
Table 5 shows the total phenolic content (TPC) and antioxidant activity against ABTS radical in BSG powders (A1, A2, B1, B2) obtained by processes A and B.
The ultrasound application and particle size had no influence on the extraction of phenolic compounds from BSG, as evidenced by the lack of significant differences in total phenolic content between the treatments (Table 5).
Regarding the total phenolic compounds of BSG, our findings are consistent with previous results reported by Carciochi et al. [43], who found TPC values ranging from 1.59 to 3.57 mg GAE g-1 BSG d.m., as well as with the results reported by Alonso-Riaño et al. [29], Petrón et al. [44] and Patrignani et al. [45]. Other researchers have reported higher TPC values for BSG extracts, such as those found by Meneses et al. [23] and Bonifácio-Lopes et al. [46], which were 7.13 and 13 mg GAE g-1 BSG d.m., respectively. It is important to note that in this study, we analyzed the free phenolic compounds, as no hydrolysis step was employed during the extraction process. Since a portion of phenolic acids present in BSG are bound to the cell wall of lignins, they can be more readily released during alkaline extraction, given that the solubility of lignin is enhanced under such conditions [29].
The ABTS assay is a commonly used method for evaluating antioxidants in vitro, which determines the capacity of antioxidants to neutralize ABTS radicals through electron donation, relative to a standard such as Trolox [24]. The results obtained by the ABTS method showed that the antioxidant activity slightly increased in treatments without ultrasonic application. This may be explained by the release of antioxidant substances able to scavenge the ABTS radical from the solid to the liquid fraction during process B, where ultrasound was employed. Thus, the first application of ultrasound was able to extract these ABTS radical scavengers retained in the BSG, which possibly drained to the liquid fraction during subsequent pressing in process B (Figure 1). In fact, the application of ultrasound increases the extraction of phenolic compounds from BSG by using water and ethanol as solvents [30]. Additionally, no difference (p > 0.05) was observed between the fractions of different particle sizes (A1 and A2; B1 and B2) within the processes for antioxidant activity, as measured by the capacity to scavenge ABTS radical.
4.2.3. Proximate Composition
Table 6 shows the proximate composition (in dry matter, % w/w) of BSG powders obtained by processes A and B. Results showed significant differences (p < 0.05) for total dietary, soluble and insoluble fiber and available carbohydrate among four types of powder (A1, A2, B1 and B2), but total lipid, protein and ash do not differ statistically (p > 0.05) among them. Lynch et al. [1] presents an extensive recompilation of several authors concerning the chemical composition of BSG, based on dry matter, reporting a content of lipid of 3-13%, protein 14.2-31%, ash 1.1-4.2%, hemicellulose 19.2-41.9, cellulose 12-33%, starch 1-12% and lignin 11.5-27.8%. Our results of total lipids, protein, total dietary fiber, and ash are within the values recently aforementioned. Accordingly, Shih et al. [12] obtained BSG flours with two drying methods to produce muffins, and the chemical composition of BSG was 7.1-12.4 g 100 g-1 d.m. of lipids, 14.5-18 g 100 g-1 d.m. of protein, 2.7-4.1 g 100 g-1 d.m. of ash, 8.1-15.9 g 100 g-1 d.m. of soluble sugar and 29.2-49.7 g 100 g-1 d.m. of dietary fiber. Recently, Garrett et al. [27] reported the proximate composition of BSG used to prepare a flour by drying (65°C for 72 h) and grinding, with contents in dry basis as 4.9%, 16.8%, 2.9% and 75.4% for fat, protein, ash, and carbohydrates, respectively.
Total lipid, protein and ash in powders were not affected by differences in processes A and B respect to ultrasound neither by fraction separation used as showed at Figure 1. We considered that an improvement will be necessary for future study respect to application of ultrasound treatment and sieving to obtain differences, mainly in protein proportions. The intensity of cell wall components breakdown and consequent release of protein during ultrasound of BSG could be to influence in this difference [13,31]. Kissell and Prentice [47] determined that in brewers' spent grain, the finer fractions had a higher protein concentration compared to the coarser fractions. The smaller particles may come from regions of the grain with a higher concentration of proteins.
Changes in the sieve used for fraction separation, itself, contributed for differences in fiber and available carbohydrate content of the powders. Finer fractions (2: particles < 2.36 mm), were able to recover more dietary fibers in treatments without ultrasound (A). Use of ultrasound combined with the finer fractions can be a method to increase the efficiency of dietary fibers extraction from BSG.
According to the study by Hassan et al. [9], the application of ultrasound can induce an increase in the concentration of reducing sugars. In our study for the same fraction, the A powders, that do not include ultrasound in the process, show higher (p < 0.05) percentage of available carbohydrates compared to the powders obtained with process B (Table 6). This behavior could be explained by release of carbohydrates from solid to liquid fraction promoted by ultrasonic treatment and pressing applied after U1 (Figure 1) allowing that more sugar was transferred to the liquid fraction and less sugar was retained in BSG solid fraction obtained in process B.
Considering one of the processes (A or B), it can be observed (Table 6) that the fraction separation (Figure 1), in coarse (1: equal to or larger than 2.36 mm) and fine (2: smaller than 2.36 mm) particles size, affect the proximate composition of total dietary, soluble and insoluble fiber and available carbohydrate of BSG powders obtained in our research. This behavior can be attributed to the fact that fraction 1 consists of whole grains and agglomerates, while fraction 2 consists of broken and/or segmented grains. BSG consists of layers of husk, pericarp, and seeds with residual amounts of barley endosperm and aleurone [48]. It is a lignocellulosic material, and its main components are dietary fiber (50%) and protein (30%) [1]. Therefore, sieving and fraction separation into coarse and fine particle size of dried BSG (Figure 1) before milling would allow obtaining powders with different proximate compositions. These powders could be applied as specific ingredient in food products, according to requirements with higher levels of dietary fiber (Fraction 2) or carbohydrates (Fraction 1).
Table 6 also shows the soluble and insoluble dietary fibers (% w/w) of BSG powders obtained by processes A and B. Dietary fibers can represent up to 70% (w/w) of BSG [49] and are classified according to their solubility in water: the soluble dietary fibers include β-glucans, pectic polysaccharides, arabinogalactans, high branched arabinoxylans, and xyloglucans, and insoluble dietary fibers include, cellulose, hemicellulose, and lignin [48,50]. Barley (Hordeum vulgare), and its by-products, as BSG, stand out as a sustainable source of dietary fibers, delivering a mix of soluble and insoluble fibers with numerous health benefits [51] allowing the development of dietary fiber-enriched products.
Soluble fibers have prebiotic activity, selectively modifying the growth and/or activity of bacteria in the colon, thus contributing to the improvement of intestinal flora and overall host health. Additionally, soluble fibers form colloidal solutions in the intestine contributing to the reduction of blood sugar and cholesterol levels, and to the prevention of cardiovascular diseases, type 2 diabetes, cancer, obesity, and others [52,53]. Insoluble fibers help in the formation of fecal bolus, accelerate intestinal transit, and playing a crucial role in the body's detoxification [53]. However, they are not fermentable by the intestinal flora, reducing their potential as a functional ingredient. Food processing techniques can be used to alter the structural properties and, consequently, the functional and nutritional functions of insoluble fibers [54].
Soluble dietary fiber among the two group of powders (A and B) show statistical differences (p < 0.05). The percentage of soluble dietary fiber in the powders B1 and B2 exceeds A1 and A2, showing that ultrasound positively affected the content of soluble fibers of BSG. The application of ultrasound treatment has been used for structural modification of BSG and several biological materials [9,16,28,31]. β-glucan can be extracted from BSG and used as a food supplement. Recently, it was possible to demonstrate that BSG β-glucan improved the color and increased the stability of orange juice by reducing the precipitation of orange pulp and exhibited the highest lightness and color values [55].
At Table 6, it is possible to observe that processes A and B, especially the application of ultrasound and the particle size (fractions 1 and 2, above and below 2.36 mm, respectively), directly influenced the content of insoluble dietary fiber (p < 0.05) as well. Cellulose is a common insoluble dietary fiber found in barley cell walls, as well as hemicellulose, which is composed by various sugar monomers, including pentoses like xylose and arabinose and hexoses like glucose and mannose [51]. According to Lynch et al. [1], hemicelluloses, composed mainly by arabinoxylan, are the main BSG constituent (up to 40% dry weight) followed by cellulose.
Several factors affect the proximal composition of powder or flour obtained from BSG grain. Two of them are ingredient used in the beer formulation and other is the process [1,12,27]. Jin et al. [56] present a detailed proximate analysis of various craft BSGs, comparing them with those from industrial breweries. It was observed that craft BSG has significant differences in its proximate components compared to industrial BSG. Therefore, based on the proximate analysis, it could be possible to evidence the origin of the BSG, whether it is craft or industrial, and further studies should be encouraged with different samples of BSG to confirm our findings.
4.2.4. Powder Particles Sieve Size Distribution
Table 7 shows the particles sieve size distribution of BSG powders obtained by processes A and B after milling (Figure 1) using an ultracentrifugal mill with an 80 µm sieve and 12,000 rpm.
In the Table 7, the effect of ultrasound applied by the process B and fraction separation (Figure 1) applied in both processes can be observed respect to different particle size distribution of powders. For A1 the high particle proportion (36.3%) is between 90 and 75 µm, for A2 (31.8%) between 75 and 45 µm, for B1 (38.3%) between 125 and 90 µm and for B2 (27.9%) between 180 and 125 µm. For both A1 (93.8%) and B1 (92.4%) the particles are distributed mainly from 125 to 75 µm while for A2 (98.4%) and B2 (96.4%) the particles are distributed mainly from 125 to 45 µm. In this case, the separation of dried (D) and sieved (S) BSG in two fractions (coarse and fine) before milling (Figure 1) produced effect on size particle distribution.
Statistically differences (p < 0.05) are observed in the percentage particles retained in the sieves with nominal size of 125, 90, 75 and 45 µm. For that three sizes (90, 75 and 45 µm), the operation of fraction separation (Figure 1), in coarse (1: equal to or larger than 2.36 mm) and fine (2: smaller than 2.36 mm) particles size, affect the percentage of particles between A1 and A2 or B1 and B2. Process B, which include ultrasound operation, produce higher (p < 0.05) proportion of particles in the 125 and 75 µm for fraction 2 compared to process A. But, for 90 and 45 µm, A2 show higher (p < 0.05) proportion of particles than B2. When analyzing fraction 1, for 90 µm, B1 show higher (p < 0.05) proportion of particles than A1, however, for 75 µm, A1 shows higher (p < 0.05) proportion of particles than B1.
We used an 80 µm sieve to mill the factions 1 and 2 of the four powders obtained. In all powders were founded particles above this size of sieve. Therefore, it can be indicated that the milling equipment used in this work could not carry out the size reduction very efficiently to obtain particles below 80 µm. However, powder below 125 µm are considered adequate for many food applications [5,10,12,35,36].
Conclusions
The two processes developed in this work allowed to obtain powders with different characteristics concerning instrumental color, antioxidant capacity by the ABTS assay, proximate composition, dietary fibers and particle size distribution. We considered that technology adoption of process A is possible for industrial and craft brewers since the operations and equipment required are well known and could be implemented. This process allows to obtain differentiated powders for different applications and products in food industry. Process B requires further analysis, so that the favorable effects of ultrasound related to increased contents of soluble fibers can be applied by industrial and craft brewers.
The BSG processing for use by the food industry in a progress towards a circular bioeconomy and give value to this by-product for feeding human, especially in sectors where there is a lack of food security. On the other hand, the powders obtained by processes A and B may be used in several plant-based foodstuffs, since the vegetarian and vegan population are increasing. Further studies regarding the effect of their application in foods should be encouraged.
Author Contributions
Conceptualization, E.S., S.M.d.A. and C.R.; Methodology, C.R., P.S.M., C.d.S.M., H.S. and A.G.d.O.S.; Validation, C.R., P.S.M., C.d.S.M., H.S. and A.G.d.O.S.; Formal Analysis, C.R., P.S.M., and C.d.S.M.; Investigation, C.R., P.S.M., C.d.S.M., H.S. and A.G.d.O.S.; Resources, E.S., and S.M.d.A.; Data Curation, C.R., P.S.M., C.d.S.M., and A.G.d.O.S.; Writing – Original Draft Preparation, C.R., P.S.M., C.d.S.M., A.G.d.O.S. and E.S.; Writing – Review & Editing, P.S.M., C.d.S.M., A.G.d.O.S., S.M.d.A. and E.S.; Visualization, P.S.M., A.G.d.O.S., S.M.d.A. and E.S.; Supervision, S.M.d.A. and E.S.; Project Administration, P.S.M., S.M.d.A. and E.S.; Funding Acquisition, S.M.d.A. and E.S. All authors have read and agreed to the published version of the manuscript.
Funding
This study was funded by the Universidad de La Frontera, Project FAPESP-UFRO FPP22-0017 and Fundação de Amparo à Pesquisa do Estado de São Paulo, Project No 2022/09431-3.
Data Availability Statement
Data are available on request from the corresponding authors upon reasonable request.
Conflicts of Interest
The authors declare no conflict of interest, competing financial interests or personal relationships respect to work reported in this manuscript. The funders had no role in the design of the study; in the collection, analyses, or interpretation of data; in the writing of the manuscript; or in the decision to publish the results.
References
- Lynch, K.M.; Steffen, E.J.; Arendt, E.K. Brewers’ spent grain: a review with an emphasis on food and health. J. Inst. Brew. 2016, 122(4), 553–568. [Google Scholar] [CrossRef]
- Rojas-Chamorro, J.A.; Romero-García, J.M.; Cara, C.; Romero, I.; Castro, E. Improved ethanol production from the slurry of pretreated brewers’ spent grain through different co-fermentation strategies. Bioresour. Technol. 2020, 296, 122367. [Google Scholar] [CrossRef] [PubMed]
- Fărcaş, A. C.; Socaci, S.A.; Dulf, F.V. Volatile profile, fatty acids composition and total phenolics content of brewers’ spent grain by-product with potential use in the development of new functional foods. J. Cereal Sci. 2015, 64, 34–42. [Google Scholar] [CrossRef]
- Zhao, H.; Fan, W.; Dong, J.; Lu, J.; Chen, J.; Shan, L.; Lin, Y.; Kong, W. Evaluation of antioxidant activities and total phenolic contents of typical malting barley varieties. Food Chem. 2008, 107(1), 296–304. [Google Scholar] [CrossRef]
- Naibaho, J.; Korzeniowska, M.; Wojdyło, A.; Ayunda, H.; Foste, M.; Yang, B. Techno-functional properties of protein from protease-treated brewers’ spent grain (BSG) and investigation of antioxidant activity of extracted proteins and BSG residues. J. Cereal Sci. 2022, 107, 103524. [Google Scholar] [CrossRef]
- Thai, S.; Avena-Bustillos, R.J.; Alves, P.; Pan, J.; Osorio-Ruiz, A.; Miller, J.; Tam, C.; Rolston, M.R.; Teran-Cabanillas, E.; Yokoyama, W.H.; McHugh, T.H. Influence of drying methods on health indicators of brewers spent grain for potential upcycling into food products. Appl. Food Res. 2022, 2(1), 100052. [Google Scholar] [CrossRef]
- Pabbathi, A.; Velidandi, S.; Pogula, P.K.; Gandam, R.R.; Baadhe, M.; Sharma, R.; Sirohi, V. K.; Thakur, V.K.; Gupta, V.K. Brewer's spent grains-based biorefineries: a critical review. Fuel 2022, 317, 123435. [Google Scholar] [CrossRef]
- Lech, M.; Labus, K. The methods of brewers’ spent grain treatment towards the recovery of valuable ingredients contained therein and comprehensive management of its residues. Chem. Eng. Res. Des. 2022, 183, 494–511. [Google Scholar] [CrossRef]
- Hassan, S.S.; Ravindran, R.; Jaiswal, S.; Tiwari, B.K.; Williams, G.A.; Jaiswal, A.K. An evaluation of sonication pretreatment for enhancing saccharification of brewers' spent grain. Waste Manage. 2020, 105, 240–247. [Google Scholar] [CrossRef] [PubMed]
- Bjerregaard, M.F.; Charalampidis, A.; Frøding, R.; Shetty, R.; Pastell, H.; Jacobsen, C.; Zhuang, S.; Pinelo, M.; Hansen, P.B.; Hobley, T.J. Processing of brewing by-products to give food ingredient streams. Eur. Food Res. Technol. 2018, 245, 545–558. [Google Scholar] [CrossRef]
- Ibbett, R.; White, R.; Tucker, G.; Foster, T. Hydro-mechanical processing of brewer's spent grain as a novel route for separation of protein products with differentiated techno-functional properties. Innov. Food Sci. Emerg. Techno. 2019, 56, 102184. [Google Scholar] [CrossRef]
- Shih, Y.-T.; Wang, W.; Hasenbeck, A.; Stone, D.; Zhao, Y. Investigation of physicochemical, nutritional, and sensory qualities of muffins incorporated with dried brewer's spent grain flours as a source of dietary fiber and protein. J. Food Sci. 2020, 85(11), 3978–3988. [Google Scholar] [CrossRef]
- Tang, D.-S.; Tian, Y.-J.; He, Y.-Z.; Li, L.; Hu, S.-Q.; Li, B. Optimisation of ultrasonic-assisted protein extraction from brewer's spent grain. Czech J. Food Sci. 2010, 28(1), 9–17. [Google Scholar] [CrossRef]
- Sun, M.; Xu, Y.; Ding, Y.; Ding, Y.; Ying Gu, Y.; Zhuang, Y.; Fan, X. Effect of ultrasound pretreatment on the moisture migration and quality of Cantharellus cibarius following hot air drying. Foods 2023, 12(14), 2705. [Google Scholar] [CrossRef] [PubMed]
- Kong, L.; Li, J.; Eichhammer, W. Intensification of moisture separation in the pulp convective drying process with ultrasound-assisted method. Bioresour. Technol. 2024, 394, 130226. [Google Scholar] [CrossRef] [PubMed]
- Wang, K.; He, P.; Wang, Q.; Yang, Z.; Xing, Y.; Ren, W.; Wang, J.; Xu, H. Ultrasound pretreatment enhances moisture migration and drying quality of mulberr y via microstructure and cell-wall polysaccharides nanostructure modification. Food Res. Int. 2024, 2024(184), 114245. [Google Scholar] [CrossRef]
- Hendriks, A.; Zeeman, G. Pretreatments to enhance the digestibility of lignocellulosic biomass. Bioresour. Technol. 2009, 100(1), 10–18. [Google Scholar] [CrossRef]
- Instituto de Salud Pública de Chile. Manual Métodos de Análisis Físico-Químicos de Alimentos, Aguas y Suelo, Andros Ltda.: Santiago, Chile, 1998; pp. 13–14.
- Scheuermann, E.; Ihl, M.; Beraud, L.; Quiroz, A.; Salvo, S.; Alfaro, S.; Bustos, R.; Seguel, I. Effects of packaging and preservation treatments on the shelf life of murtilla fruit (Ugni molinae Turcz) in cold storage. Packag. Technol. Sci. 2013, 27(1), 241–248. [Google Scholar] [CrossRef]
- Ihl, M.; Aravena, L.; Scheuermann, E.; Uquiche, E.; Bifani, V. Effect of immersion solutions on shelf-life of minimally processed lettuce. LWT - Food Sci. Technol. 2003, 36(6), 591–599. [Google Scholar] [CrossRef]
- Pathare, P.B.; Opara, U.L.; Al-Said, F.A.J. Colour measurement and analysis in fresh and processed foods: a review. Food Sci. Biotechnol. 2013, 6, 36–60. [Google Scholar] [CrossRef]
- Adekunte, A.; Tiwari, B.; Cullen, P.; Scannell, A.; O’Donnell, C. Effect of sonication on colour, ascorbic acid and yeast inactivation in tomato juice. Food Chem. 2010, 122(3), 500–507. [Google Scholar] [CrossRef]
- Meneses, N.G.T.; Martins, S.; Teixeira, J.A.; Mussatto, S.I. Influence of extraction solvents on the recovery of antioxidant phenolic compounds from brewer’s spent grains. Sep. Purif. Technol. 2013, 108, 152–158. [Google Scholar] [CrossRef]
- Al-Duais, M.; Müller, L.; Böhm, V.; Jetschke, G. Antioxidant capacity and total phenolics of cyphostemma digitatum before and after processing: use of different assays. Eur. Food Res. Technol. 2009, 228, 813–821. [Google Scholar] [CrossRef]
- AOAC. Official Methods of Analysis of AOAC International, 21st ed.; AOAC International: Rockville, USA, 2019; pp. 325–354. [Google Scholar]
- Asp, N.G.; Johansson, C.G.; Hallmer, H.; Siljeström, M. Rapid enzymatic assay of insoluble and soluble dietary fiber. J. Agric. Food. Chem. 1983, 31(3), 476–82. [Google Scholar] [CrossRef] [PubMed]
- Garrett, R.; Bellmer, D.; McGlynn, W.; Rayas-Duarte, P. Development of new chip products from brewer's spent grain. J. Food Qual. 2021, 2021, 5521746. [Google Scholar] [CrossRef]
- Bundhoo, Z.M.A.; Mohee, R. Ultrasound-assisted biological conversion of biomass and waste materials to biofuels: A review. Ultrason. Sonochem. 2018, 40(A), 298–313. [Google Scholar] [CrossRef] [PubMed]
- Alonso-Riaño, P.; Diez, M.T.S.; Blanco, B.; Beltrán, S.; Trigueros, E.; Benito-Román, O. Water ultrasound-assisted extraction of polyphenol compounds from brewer’s spent grain: kinetic study, extract characterization, and concentration. Antioxidants 2020, 9(3), 265. [Google Scholar] [CrossRef] [PubMed]
- Iadecola, R.; Ciccoritti, R.; Ceccantoni, B.; Bellincontro, A.; Amoriello, T. Optimization of phenolic compound extraction from brewers’ spent grain using ultrasound technologies coupled with response surface methodology. Sustainability 2022, 14(6), 3309. [Google Scholar] [CrossRef]
- Li, W.; Yang, H.; Coldea, T.E.; Zhao, H. Modification of structural and functional characteristics of brewer's spent grain protein by ultrasound assisted extraction. LWT - Food Sci. Technol. 2021, 139, 110582. [Google Scholar] [CrossRef]
- El-Shafey, E.I.; Gameiro, M.L.F.; Correia, P.F.M.; De Carvalho, J.M.R. Dewatering of brewer's spent grain using a membrane filter press: a pilot plant study. Sep. Sci. Technol. 2004, 39(14), 3237–3261. [Google Scholar] [CrossRef]
- Santos, M.V.; Ranalli, N.; Orjuela-Palacio, J.; Zaritzky, N. Brewers spent grain drying: drying kinetics, moisture sorption isotherms, bioactive compounds stability, and Bacillus cereus lethality during thermal treatment. J. Food Eng. 2024, 364, 111796. [Google Scholar] [CrossRef]
- Jongaroontaprangsee, S.; Tritrong, W.; Chokanaporn, W.; Methacanon, P.; Devahastin, S.; Naphaporn, C. Effects of drying temperature and particle size on hydration properties of dietary fiber powder from lime and cabbage by-products. Int. J. Food Prop. 2007, 10(4), 887–897. [Google Scholar] [CrossRef]
- Okpala, L.C.; Ofoedu, P.I. Quality characteristics of cookies produced from sweet potato and wheat flour blend fortified with Brewer’s spent grain flour. Curr. Res. Nutr. Food Sci. 2018, 6(1), 113–119. [Google Scholar] [CrossRef]
- Baiano, A.; la Gatta, B.; Rutigliano, M.; Fiore, A. Functional bread produced in a circular economy perspective: the use of brewers’ spent grain. Foods 2023, 12(4), 834. [Google Scholar] [CrossRef] [PubMed]
- Ahmed, J.; Al-Attar, H.; Arfat, Y.A. Effect of particle size on compositional, functional, pasting and rheological properties of commercial water chestnut flour. Food Hydrocoll. 2016, 52, 888–895. [Google Scholar] [CrossRef]
- Hejna, A.; Barczewski, M.; Skorczewska, K.; Szulc, J.; Chmielnicki, B.; Korol, J.; Formela, K. Sustainable upcycling of brewers’ spent grain by thermo-mechanical treatment in twin-screw extruder. J. Clean. Prod. 2021, 285, 124839. [Google Scholar] [CrossRef]
- Hejna, A.; Marc, M.; Kowalkowska-Zedler, D.; Pladzyk, A.; Barczewski, M. Insights into the thermo-mechanical treatment of brewers’ spent grain as a potential filler for polymer composites. Polymers 2021, 13(6), 879. [Google Scholar] [CrossRef] [PubMed]
- Chen, Q.; Koh, H.K.; Park, J.B. Color evaluation of red pepper powder. Trans. ASAE 1999, 42(3), 749–752. [Google Scholar] [CrossRef]
- Horváth, H.Z.; Halász-Fekete, M. Instrumental colour measurement of paprika grist. Ann. Fac. Eng. Hunedoara 2005, 9, 101–107. [Google Scholar]
- Carpenter, J.; Badve, M.; Rajoriya, S.; George, S.; Saharan, V.K.; Pandit, A.B. Hydrodynamic cavitation: an emerging technology for the intensification of various chemical and physical processes in a chemical process industry. Rev. Chem. Eng. 2017, 33(5), 433–468. [Google Scholar] [CrossRef]
- Carciochi, R.A.; Sologubik, C.A.; Fernández, M.B.; Manrique, G.D.; D’Alessandro, L.G. Extraction of antioxidant phenolic compounds from brewer’s spent grain: optimization and kinetics modeling. Antioxidants 2018, 7(4), 45. [Google Scholar] [CrossRef] [PubMed]
- Petrón, M.J.; Andrés, A.I.; Esteban, G.; Timón, M.L. Study of antioxidant activity and phenolic compounds of extracts obtained from different craft beer by-products. J. Cereal Sci. 2021, 98, 103162. [Google Scholar] [CrossRef]
- Patrignani, M.; Brantsen, J.F.; Awika, J.M.; Conforti, P.A. Application of a novel microwave energy treatment on brewers’ spent grain (BSG): effect on its functionality and chemical characteristics. Food Chem. 2021, 346, 128935. [Google Scholar] [CrossRef] [PubMed]
- Bonifácio-Lopes, T.; Castro, L.M.G.; Vilas-Boas, A.; Campos, D.; Teixeira, J.A.; Pintado, M. Impact of gastrointestinal digestion simulation on brewer’s spent grain green extracts and their prebiotic activity. Food Res. Int. 2023, 165, 112515. [Google Scholar] [CrossRef] [PubMed]
- Kissell, T.; Prentice, N. Protein and fiber enrichment of cookie flour with brewer’s spent grain. Cereal Chem. 1979, 56, 261–266. [Google Scholar]
- Chetrariu, A.; Dabija, A. Brewer’ s spent grains: possibilities of valorization, a review. Appl. Sci. 2020, 10(16), 5619. [Google Scholar] [CrossRef]
- Mussatto, S.I.; Dragone, G.; Roberto, I.C. Brewers' spent grain: generation, characteristics and potential applications. J. Cereal Sci. 2006, 43(1), 1–14. [Google Scholar] [CrossRef]
- Ikram, S.; Huang, L.; Zhang, H.; Wang, J.; Yin, M. Composition and nutrient value proposition of brewers spent grain. J. Food Sci. 2017, 82(10), 2232–2242. [Google Scholar] [CrossRef] [PubMed]
- Boukid, F. Comprehensive review of barley dietary fibers with emphasis on arabinoxylans. Bioact. Carbohydr. Diet. Fibre 2024, 31, 100410. [Google Scholar] [CrossRef]
- Reis, S.F.; Coelho, E.; Coimbra, M.A.; Abu-Ghannam, N. Improved efficiency of brewer’s spent grain arabinoxylans by ultrasound-assisted extraction. Ultrason. Sonochem. 2015, 24, 155–164. [Google Scholar] [CrossRef] [PubMed]
- Ioniță-Mîndrican, C.B.; Ziani, K.; Mititelu, M.; Oprea, E.; Neacșu, S.M.; Moroșan, E.; Dumitrescu, D.E.; Roșca, A.C.; Drăgănescu, D.; Negrei, C. Therapeutic benefits and dietary restrictions of fiber intake: a state of the art review. Nutrients 2022, 14(13), 2641. [Google Scholar] [CrossRef] [PubMed]
- Su, X.; Jin, Q.; Xu, Y.; Wang, H.; Huang, H. Subcritical water treatment to modify insoluble dietary fibers from brewer’s spent grain for improved functionality and gut fermentability. Food Chem. 2024, 435, 137654. [Google Scholar] [CrossRef] [PubMed]
- Jantason, N.; Suphantharika, M.; Wipatanawin, A.; Chansong, S.; Payongsri, P. Valorization of spent grains from beer production through β-glucan extraction. Foods 2024, 13(3), 440. [Google Scholar] [CrossRef] [PubMed]
- Jin, Z.; Lan, Y.; Ohm, J.; Gillespie, J.; Schwarz, P.; Chen, B. Physicochemical composition, fermentable sugars, free amino acids, phenolics, and minerals in brewers' spent grains obtained from craft brewing operations. J. Cereal Sci. 2022, 104, 103413. [Google Scholar] [CrossRef]
Figure 1.
Sequences of operations of processes A and B to obtain food powders from BSG and sampling points.
Figure 1.
Sequences of operations of processes A and B to obtain food powders from BSG and sampling points.
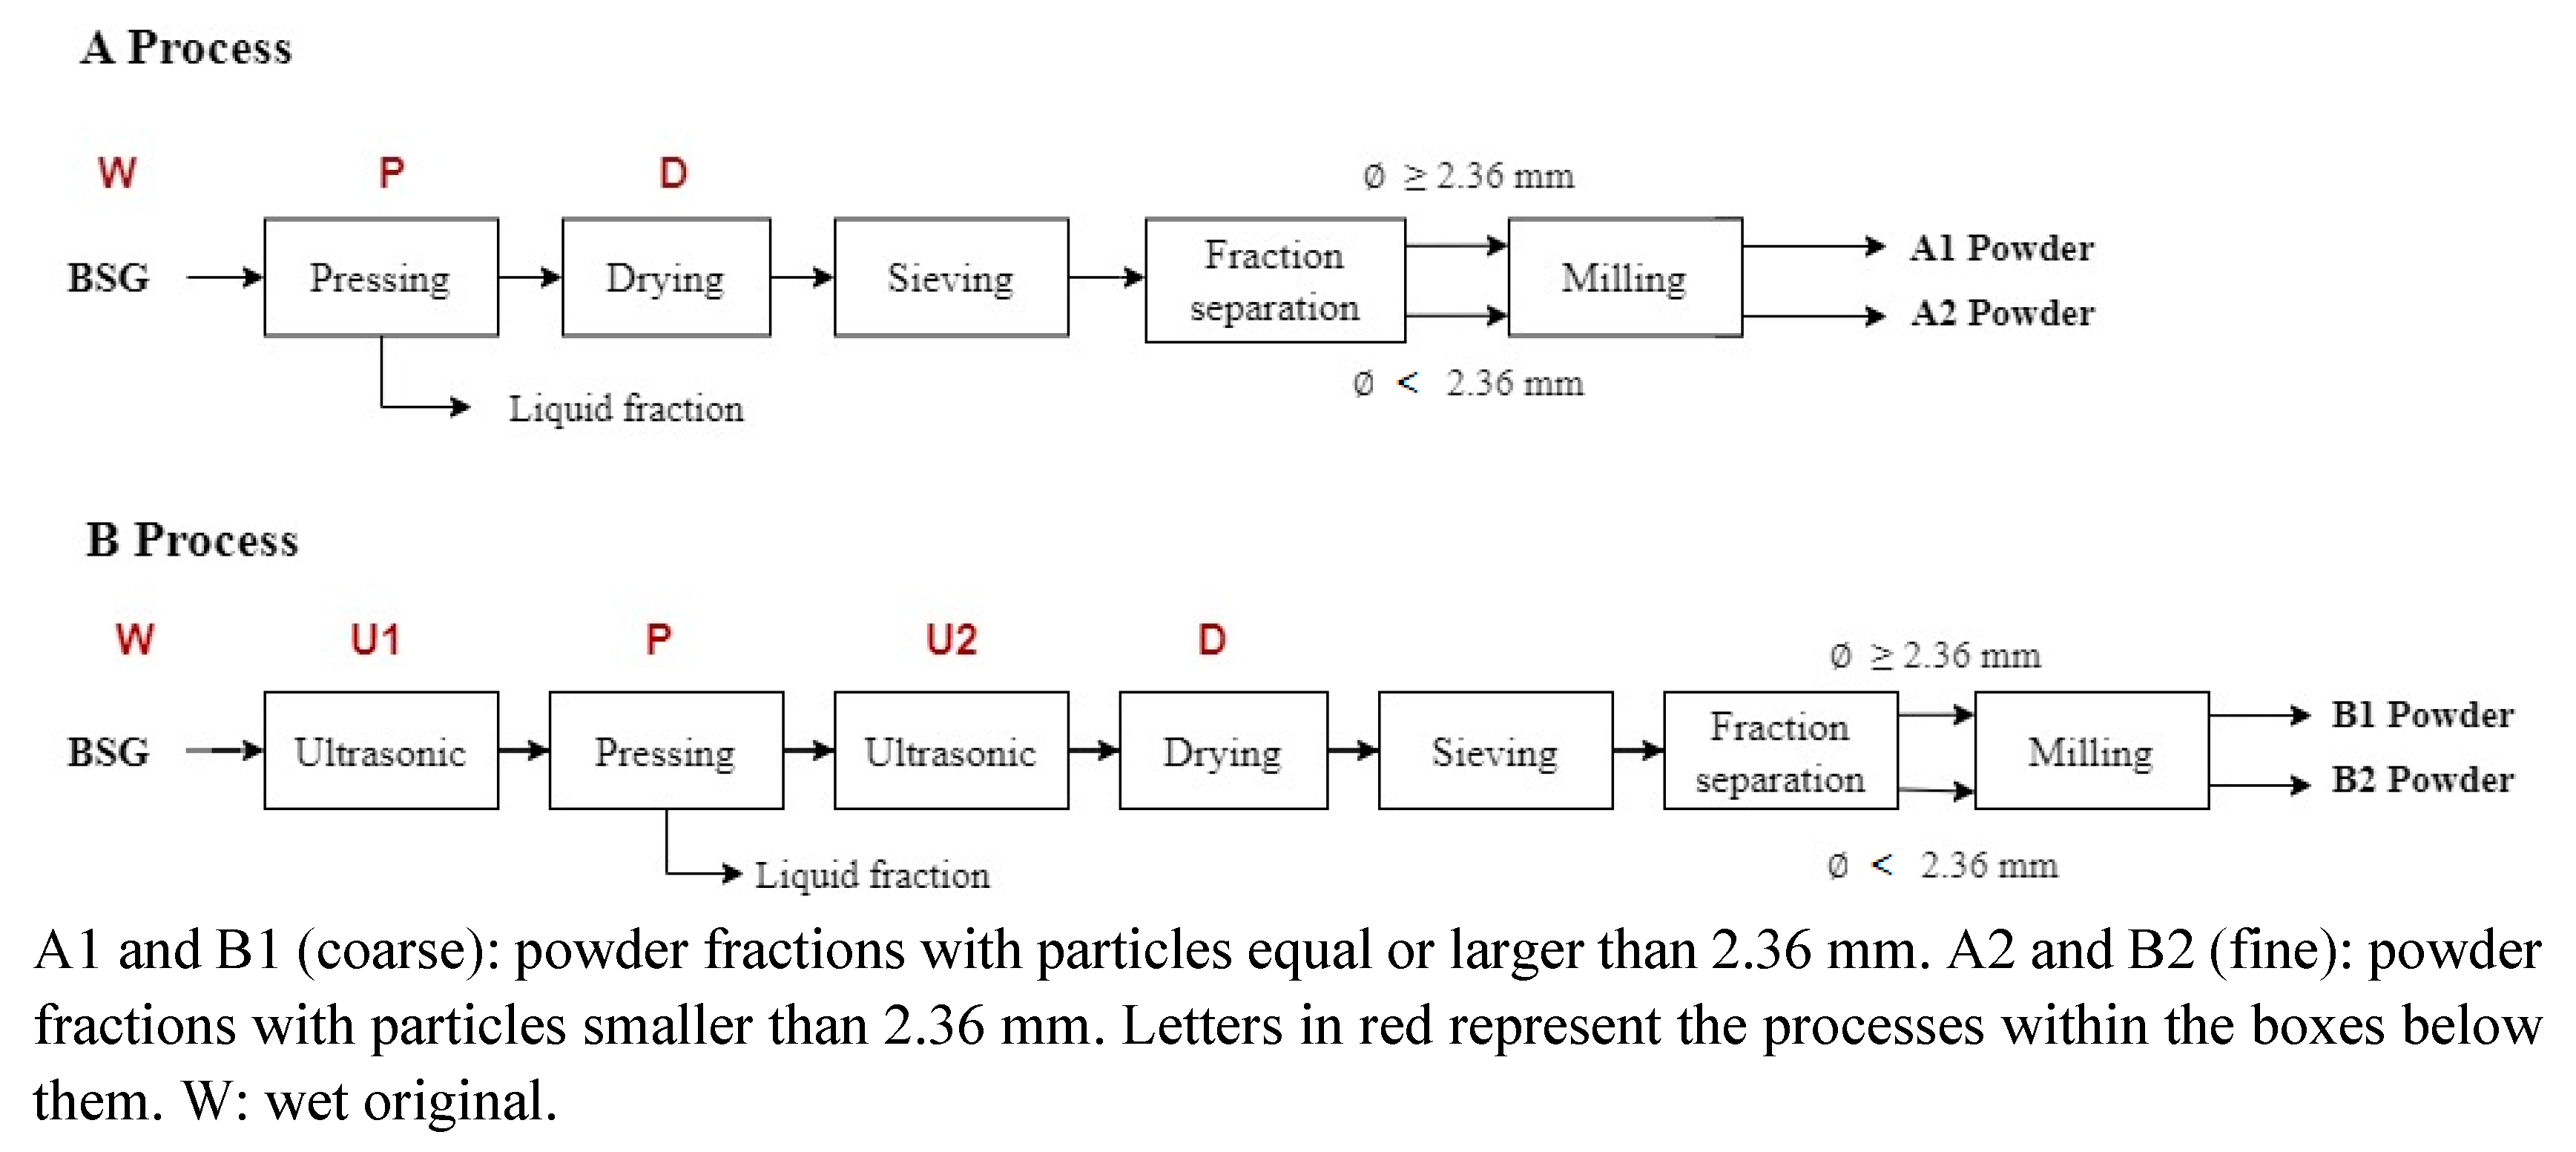
Figure 2.
Temperature-time curve of the U1 ultrasound operation applied to wet original BSG (W).
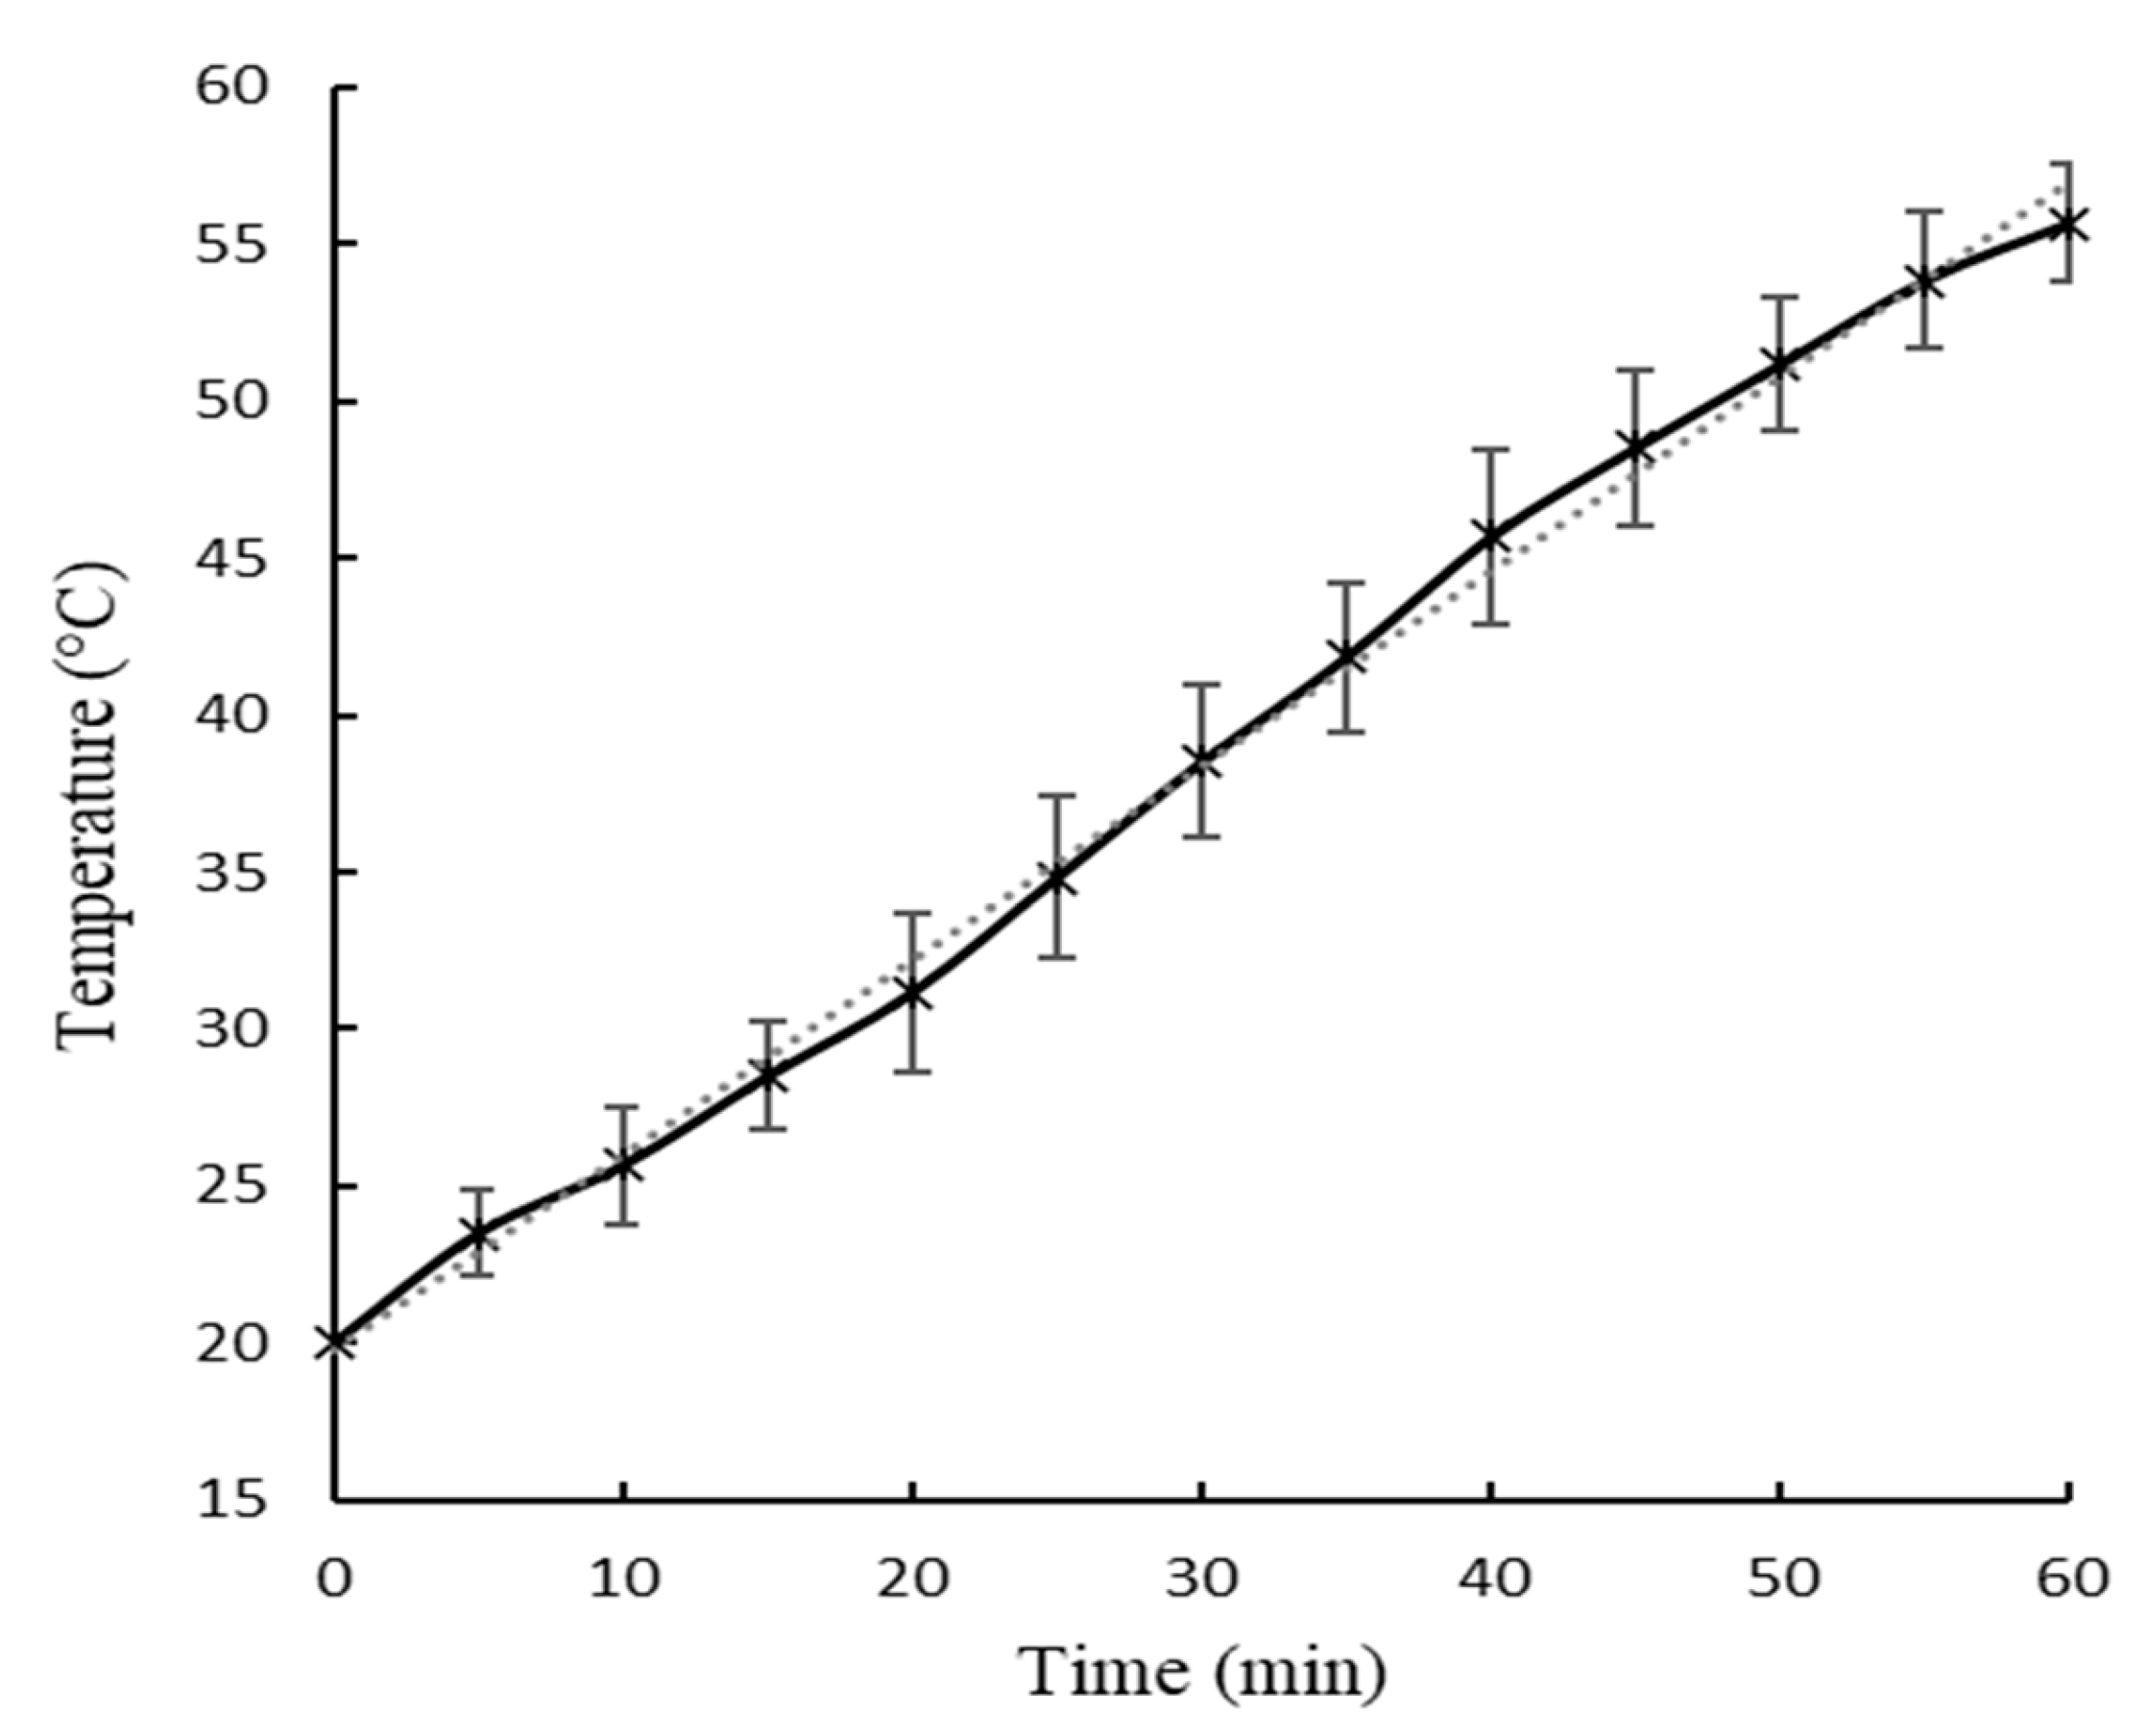
Figure 3.
Temperature-time curve of the U2 ultrasound operation applied to pressed BSG (P).
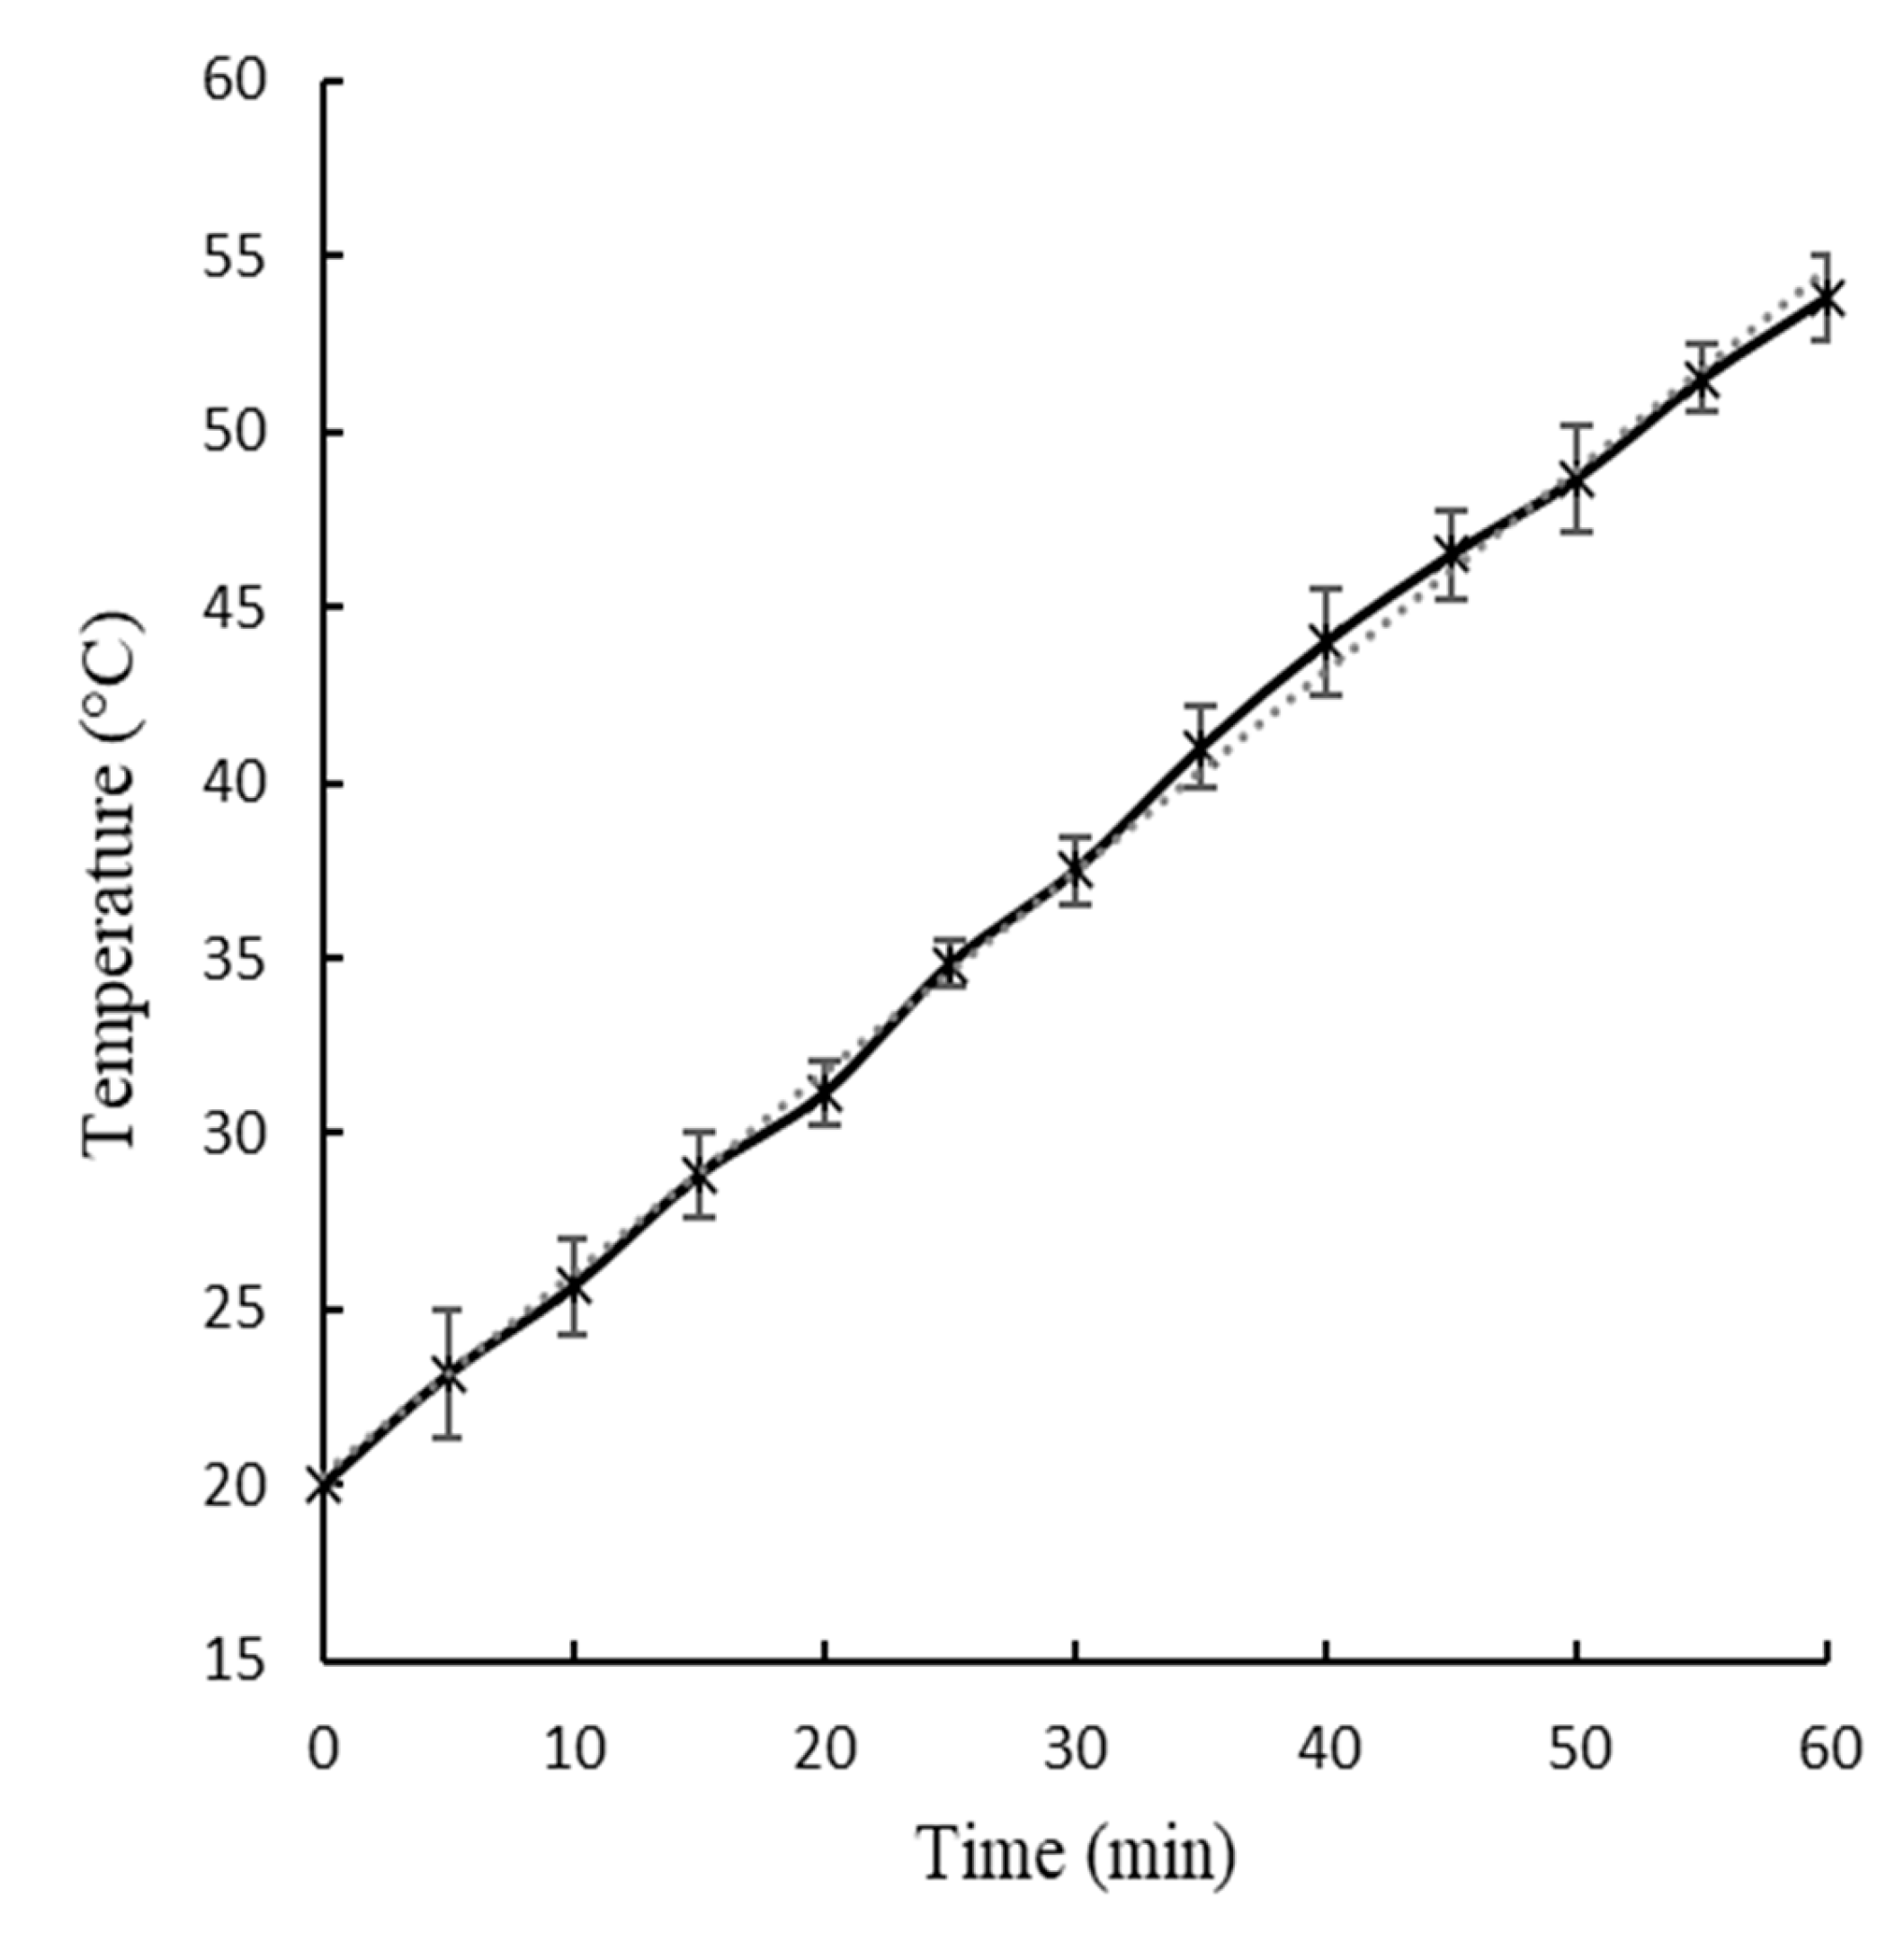
Figure 4.
Distribution particle sieve size (in percentage) of dried BSG (D) after sieving from processes A and B, according to Figure 1. For each particle sieve size, (*) indicates significant difference between each other by t-Student at p < 0.05.
Figure 4.
Distribution particle sieve size (in percentage) of dried BSG (D) after sieving from processes A and B, according to Figure 1. For each particle sieve size, (*) indicates significant difference between each other by t-Student at p < 0.05.
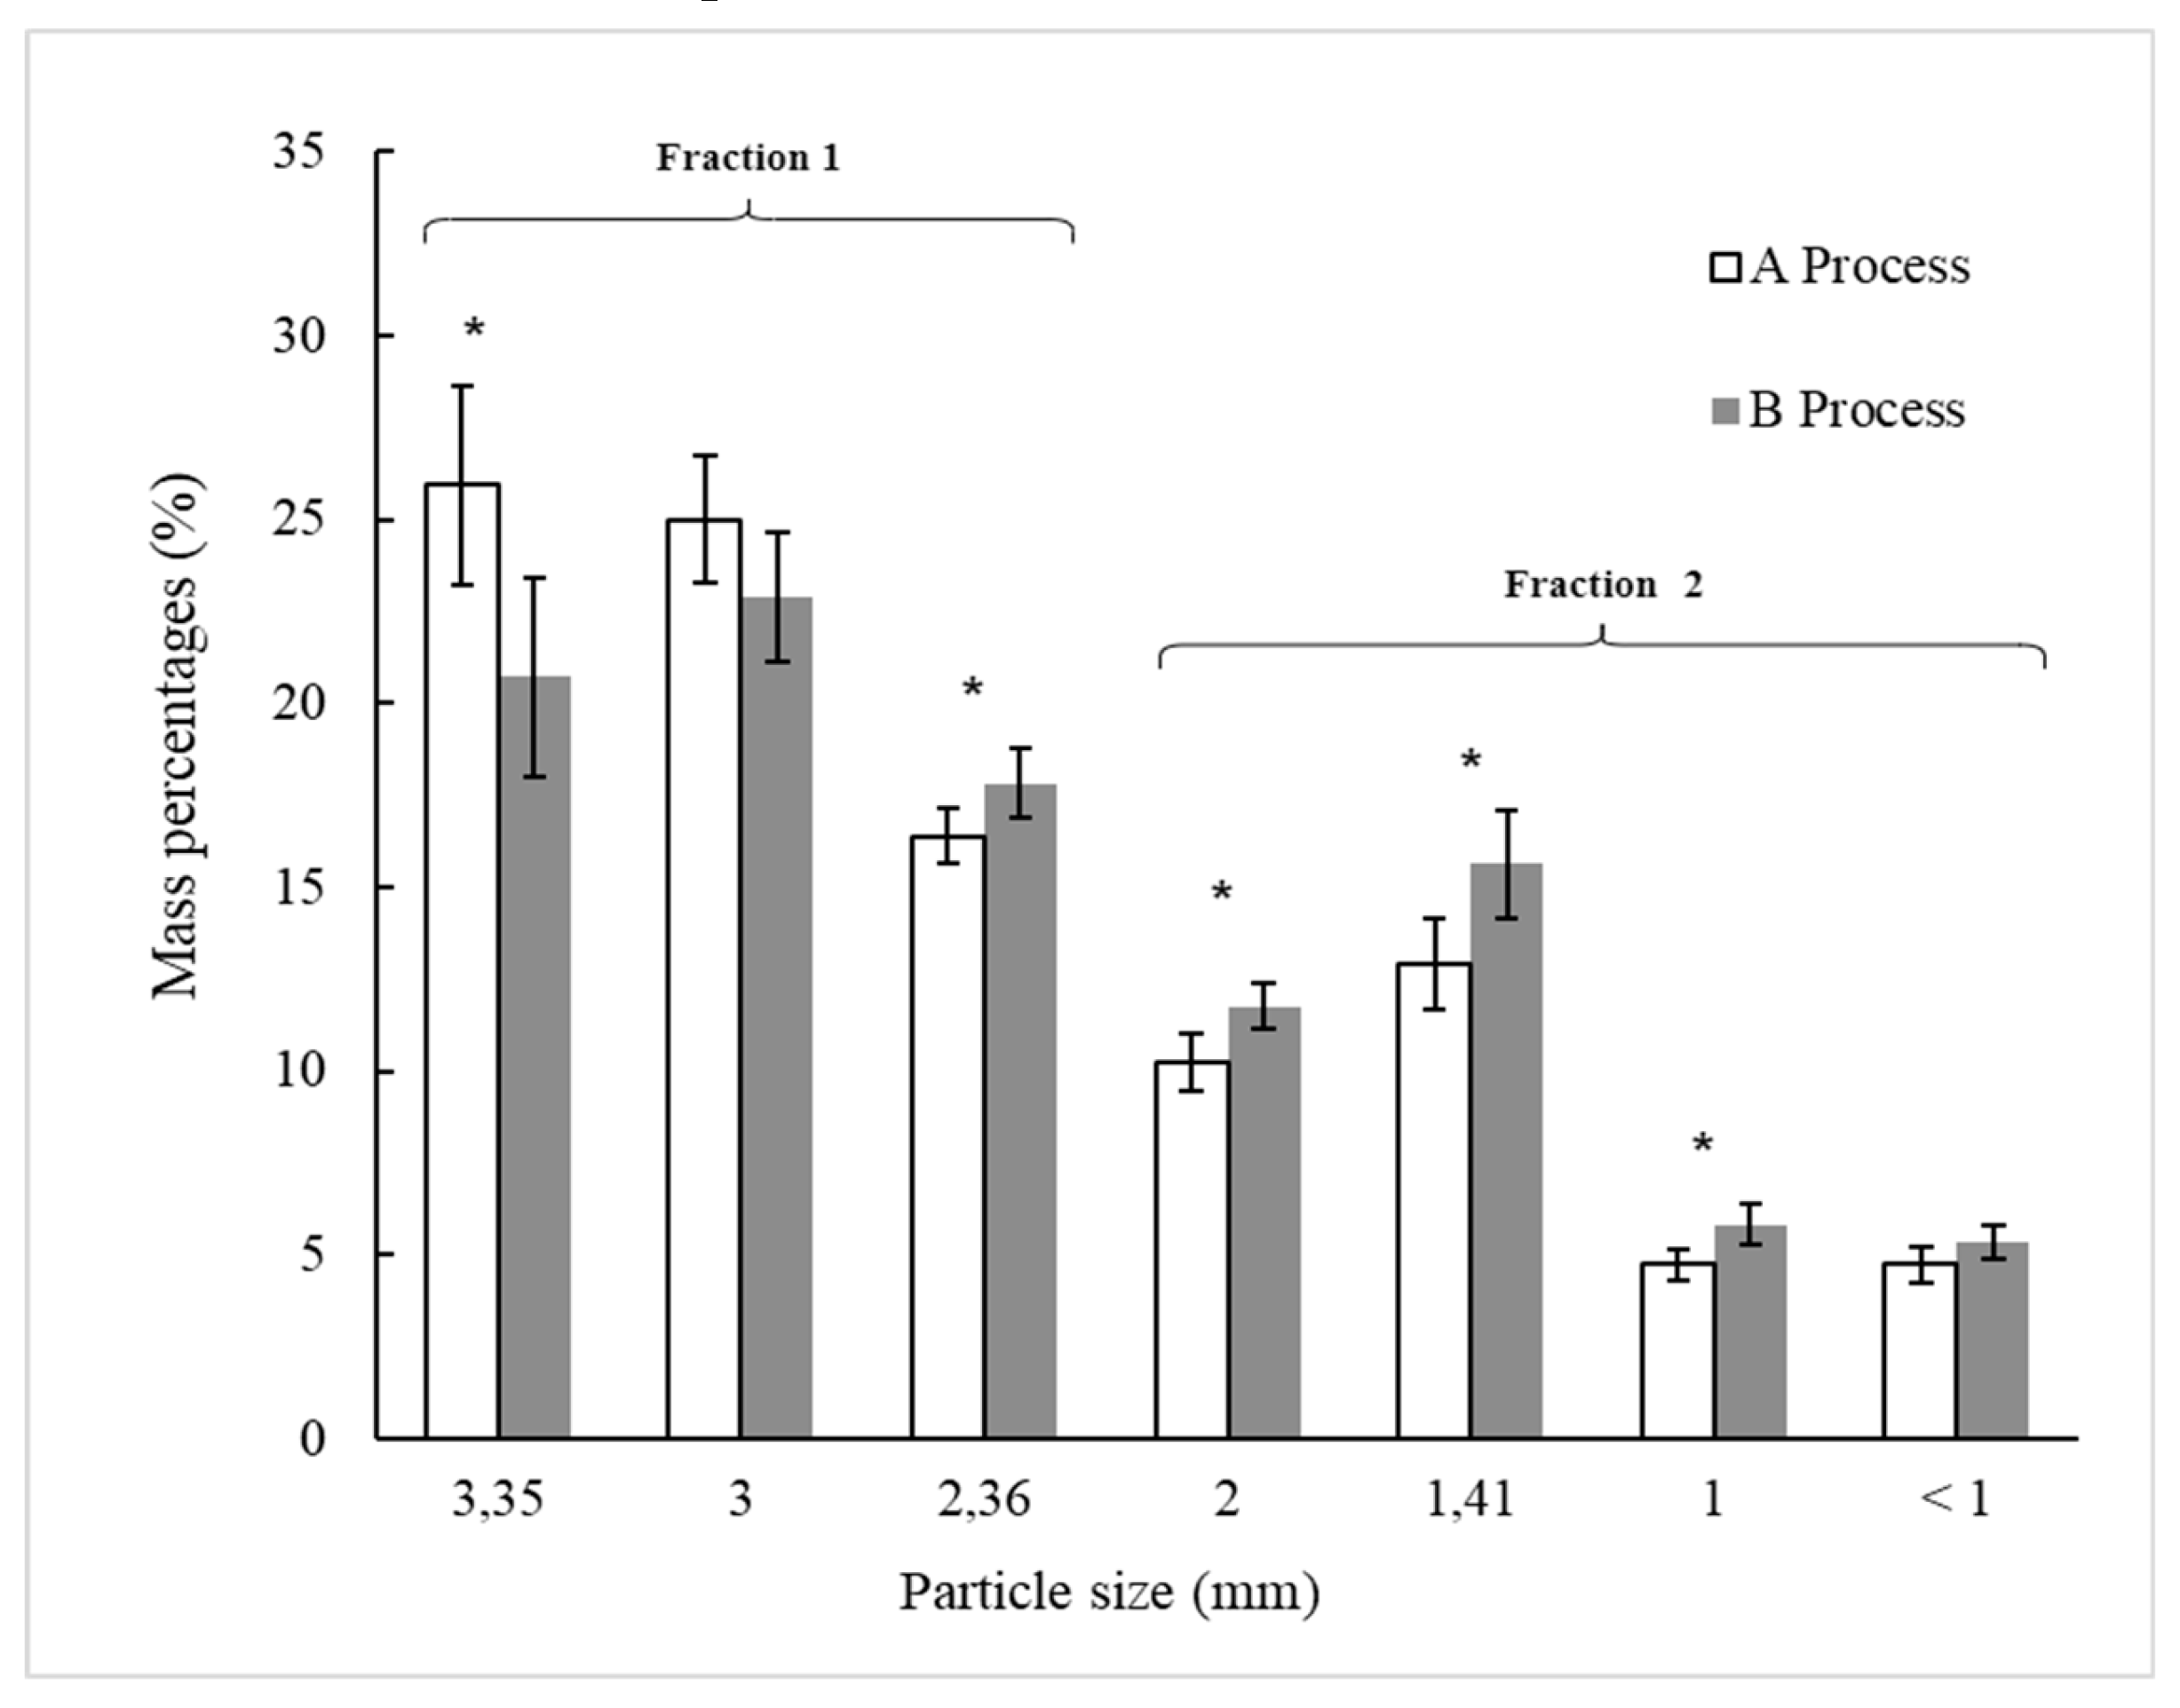

Table 1.
Moisture content monitoring (% w.b.) during processes A and B.
| Process | W | U1 | P | U2 | D | Powder 1 | Powder 2 |
|---|---|---|---|---|---|---|---|
| A | 72.4 ± 2.4 Aa | - | 59.8 ± 1.6 Ab | - | 5.2 ± 0.6Ac | 6.6 ± 0.5Ac | 6.1 ± 0.9Ac |
| B | 71.2 ± 1.7 Aa | 72.1 ± 3.3a | 59.1 ± 1.1 Ab | 60.4 ± 2.6b | 5.4 ± 3.1Ac | 6.4 ± 0.3Ac | 5.9 ± 0.1Ac |
BSG: wet original (W), first ultrasound (U1), pressed (P), second ultrasound (U2), dried (D) and powder (A1, A2, B1, B2) according to Figure 1. In each column, different capital letters indicate significant difference by t-Student at p < 0.05. In each row, different lowercase letters indicate significant difference by Tukey's test at p < 0.05. Media ± standard deviation.
Table 2.
Color monitoring concerning the wet original BSG for process A.
| Color parameter | W | P | D | A1 | A2 |
|---|---|---|---|---|---|
| L* | 44.1 ± 0.6 c | 45.0 ± 1.1 c | 48.7 ± 0.6 b | 68.0 ± 1.4 a | 63.4 ± 1.2 a |
| a* | 5.3 ± 0.3 a | 4.9 ± 0.3 a | 3.4 ± 0.2 b | 3.0 ± 0.3 b | 3.4 ± 0.3 b |
| b* | 22.5 ± 0.5 a | 22.6 ± 0.8 a | 21.5 ± 0.5 a | 20.9 ± 0.2 a | 21.4 ± 1.4 a |
| ΔE | - | 1.3 ± 1.1 d | 5.2 ± 1.0 c | 24.3 ± 1.4 a | 19.4 ± 1.6 b |
| h* (°) | 81.8 ± 0.7 a | 81.0 ± 0.3 a | 76.8 ± 0.6 b | 77.8 ± 0.7 b | 81.0 ± 0.7 a |
| C* | 23.1± 0.4 a | 23.1± 0.8 a | 21.8 ± 0.5 a | 21.1 ± 0.2 a | 21.7 ± 1.7 a |
BSG: wet original (W), pressed (P), dried (D), and powder (A1, A2, B1, B2) according to Figure 1. In each row, different letters indicate significant difference by Tukey's test at p < 0.05. Media ± standard deviation.
Table 3.
Color monitoring concerning the wet original BSG for process B.
| Color parameter | W | U1 | P | U2 | D | B1 | B2 |
|---|---|---|---|---|---|---|---|
| L* | 44.4 ± 0.5 c | 44.8 ± 1.1 c | 47.3 ± 1.3 b | 46.6 ± 1.0 c | 49.9 ± 1.1 b | 69.3 ± 2.1 a | 66.5 ± 3.0 a |
| a* | 5.4 ± 0.4 a | 5.5 ± 0.2 a | 5.2 ± 0.4 a | 5.8 ± 0.4 a | 3.7 ± 0.1 b | 2.7 ± 0.6 c | 3.0 ± 0.5 c |
| b* | 22.8 ± 0.5 a | 22.8 ± 0.3 a | 23.1 ± 0.3 a | 24.0 ± 0.4 a | 21.8 ± 0.4 a | 20.6 ± 0.5 a | 21.2 ± 0.3 a |
| ΔE | - | 1.1 ± 0.5 e | 3.1 ± 1.4 d | 2.6 ± 0.8 d | 5.9 ± 0.7 c | 25.2 ± 2.2 a | 22.4 ± 3.2 b |
| h* (°) | 82.5 ± 1.4 a | 82.0 ± 1.2 ab | 76.8 ± 0.6 c | 76.6 ± 0.3 c | 77.3 ± 0.9 c | 76.4 ± 1.0 c | 80.4 ± 0.5 b |
| C* | 23.5 ± 0.6 a | 23.5 ± 0.3 a | 23.7 ± 0.3 a | 24.7 ± 0.4 a | 22.1 ± 0.4 a | 20.8 ± 0.5 a | 21.4 ± 0.3 a |
BSG: wet original (W), first ultrasound (U1), pressed (P), second ultrasound (U2), dried (D) and powder (A1, A2, B1, B2) according to Figure 1. In each row, different letters indicate significant difference by Tukey's test at p < 0.05. Media ± standard deviation.
Table 4.
ΔE values between the food powders obtained from the BSG in processes A and B.
| A2 | B1 | B2 | |
|---|---|---|---|
| A1 | 4.9 ± 1.0 ab | 1.1 ± 1.0 d | 1.8 ± 1.3 d |
| A2 | - | 5.7 ± 2.6 a | 3.2 ± 1.9 b |
| B1 | - | - | 2.8 ± 1.4 bc |
Different letters among ΔE values indicate significant difference by Tukey's test at p < 0.05. Media ± standard deviation.
Table 5.
TPC and ABTS radical of BSG powders obtained by processes A and B.
| BSG powder | TPC (mg GAE g-1 d.m.) | ABTS (µmol TEAC g-1 d.m.) |
|---|---|---|
| A1 | 3.05 ± 0.28 a | 30.58 ± 1.65 a |
| A2 | 3.04 ± 0.23 a | 30.43 ± 1.98 a |
| B1 | 3.59 ± 0.43 a | 24.72 ± 1.86 ab |
| B2 | 3.68 ± 0.33 a | 22.81 ± 1.59 b |
TPC: Total phenolic content. GAE: Gallic acid equivalent. TEAC: Trolox equivalent antioxidant capacity. d.m.: dry matter. In each column, different letters indicate significant difference by Tukey's test at p < 0.05. Media ± standard deviation.
Table 6.
Proximate composition, expressed in dry matter (% w/w), of BSG powders obtained by processes A and B.
Table 6.
Proximate composition, expressed in dry matter (% w/w), of BSG powders obtained by processes A and B.
| Component | A1 | A2 | B1 | B2 |
|---|---|---|---|---|
| Total lipid (fat) | 8.7 ± 0.1 a | 10.0 ± 0.6 a | 8.6 ± 1.0 a | 9.6 ± 0.0 a |
| Protein (Nx5.83) | 18.1 ± 0.3 a | 21.8 ± 1.9 a | 21.5 ± 1.5 a | 24.2 ± 2.1 a |
| Total dietary fiber | 37.8 ± 0.7 c | 45.5 ± 1.0 b | 46.0 ± 0.2 b | 56.1 ± 0.5 a |
| Soluble | 4.0 ± 0.0 b | 3.9 ± 0.4 b | 4.9 ± 0.3 a | 5.3 ± 0.1 a |
| Insoluble | 33.8 ± 0.7 c | 41.6 ± 1.4 b | 41.1 ± 0.3 b | 50.7 ± 0.6 a |
| Ash | 2.3 ± 0.1 a | 2.7 ± 0.2 a | 2.2 ± 0.4 a | 2.6 ± 0.4 a |
| Available carbohydrate (by difference) | 33.5 ± 0.1 a | 19.6 ± 1.7 b | 21.8 ± 2.3 b | 7.3 ± 1.7 c |
In each row, different letters indicate significant difference by Tukey's test at p < 0.05. Media ± standard deviation.
Table 7.
Powders particles sieve size distribution in percentage obtained by processes A and B.
| Particle sieve size (µm) | A1 | A2 | B1 | B2 |
|---|---|---|---|---|
| 425 | 0.4 ± 0.0 a | 0.3 ± 0.3 a | 0.2 ± 0.2 a | 0.3 ± 0.2 a |
| 180 | 0.0 ± 0.0 a | 0.5 ± 0.1 a | 3.1 ± 2.8 a | 1.4 ± 1.0 a |
| 125 | 22.1 ± 1.1 b | 21.3 ± 2.1 b | 24.0 ± 0.3 ab | 27.9 ± 2.1 a |
| 90 | 35.4 ± 1.1 b | 27.8 ± 0.2 c | 38.3 ± 1.0 a | 19.5 ± 1.5 d |
| 75 | 36.3 ± 1.0 a | 17.5 ± 2.1 d | 30.1 ± 0.6 b | 26.2 ± 1.5 c |
| 45 | 4.6 ± 0.2 c | 31.8 ± 0.5 a | 3.8 ± 1.2 c | 22.8 ± 0.8 b |
| < 45 | 1.2 ± 0.8 a | 0.8 ± 0.3 a | 0.5 ± 0.2 a | 2.0 ± 1.1 a |
In each row, different letters indicate significant difference by Tukey's test at p < 0.05. Media ± standard deviation.
Disclaimer/Publisher’s Note: The statements, opinions and data contained in all publications are solely those of the individual author(s) and contributor(s) and not of MDPI and/or the editor(s). MDPI and/or the editor(s) disclaim responsibility for any injury to people or property resulting from any ideas, methods, instructions or products referred to in the content. |
© 2024 by the authors. Licensee MDPI, Basel, Switzerland. This article is an open access article distributed under the terms and conditions of the Creative Commons Attribution (CC BY) license (http://creativecommons.org/licenses/by/4.0/).
Copyright: This open access article is published under a Creative Commons CC BY 4.0 license, which permit the free download, distribution, and reuse, provided that the author and preprint are cited in any reuse.


