Submitted:
23 July 2024
Posted:
24 July 2024
You are already at the latest version
Abstract
Land surface temperature (LST) variations and anomalies associated with tectonic plate movements are common precursors to earthquakes. Spatially extended and dynamic linear zones of high temperature anomalies at the Earth's surface coinciding with faults in the Earth's crust can be used as a predictor of an approaching earthquake. LST contrast boundary concentration maps are proposed as an indicator for analyzing temperature changes before and after a series of earthquakes. The concentration of LST contrast boundaries is estimated from Landsat 8 data for the East Anatolian Fault zone in the vicinity of epicenters of the destructive earthquakes with magnitudes up to 7.8 Mw on the moment magnitude scale occurred in February 2023. A spatial relationship between earthquake epicenters and the maximum concentration of LST boundaries at azimuths of 0° and 90° was found to strengthen as the earthquake approaches and weaken after it. It was found that 92% of epicenters are located at up to 5 km distance from zones of maximum LST boundary concentration. The found regularity allows to conclude the possibility of using the proposed indicator as additional data for seismic hazard risk assessment.
Keywords:
land surface temperature
; earthquake
; contrast boundaries
; East Anatolian Fault zone
; Landsat 8
1. Introduction
On 6–8 February 2023, a series of catastrophic earthquakes struck southern and central Turkey, northern and western Syria, causing widespread destruction and loss of life [1]. Two shocks of magnitude 7.8 and 7.5 Mw were particularly strong along the East Anatolian fault system, which is known for its seismic activity [2,3]. The approach of this series of earthquakes was not predicted by serious scientific research and instrumental observations, which resulted in unwillingness of local authorities to take the necessary measures to evacuate the population. As a result, more than 52,000 people died in Turkey and neighboring Syria [4]. These facts make the question of the search for new methods of earthquake prediction and indicators of increased seismic activity extremely topical.
Earthquake is a natural phenomenon occurring as a sudden shaking or shifting of the earth’s surface caused by geological or tectonic forces [5]. In most cases, earthquakes occur at the boundaries of tectonic plates, where the contact of the plates prevents their free movement [6]. As a result of tectonic activity, plate boundaries exert pressure on each other and, when released, cause sudden quakes accompanied by strong energy release and potentially severe destruction [7].
There are many precursors to earthquakes, including seismicity, mechanical deformation of the lithosphere and the Earth’s surface, changes in the level and composition of groundwater in the time interval from a few weeks to a few hours before the event, increased emission of gasses, in particular radon or radioactive ions, into the atmosphere, propagation of acoustic gravity waves, fluctuations in electric and magnetic field components over a wide frequency range, changes in ionospheric parameters, in particular the total electron content (TEC), and fluctuations (primarily an increase) in the land surface temperature (LST) [8,9,10,11,12,13,14,15,16]. The LST is of particular interest because temperature variations are themselves the causes of geological and tectonic forces that trigger earthquakes [17]. The temperature rise in the Earth’s interior is accompanied by changes in ground heat flux and ground temperature rise, forming areas of increased thermal background—LST anomalies [13,18]. Temperature anomalies appear at the Earth’s surface as linear structures of elevated temperature along crustal faults, characterized by large spatial extent and high temporal dynamics [13]. LST anomalies are maximal in pre-earthquake periods and can be accompanied by a significant increase in precipitable water vapor immediately after the event [19].
Global and local networks of ground-based monitoring stations are organized in earthquake-prone areas to monitor earthquake precursors. For example, the Global Seismographic Network, operated jointly by the National Science Foundation (NSF) and the U.S. Geological Survey (USGS), is a global network of 152 seismological and geophysical sensors that provides free, open access to real-time data [21]. The International Federation of Digital Seismograph Networks (FDSN) provides assistance in organizing observing networks for partner countries around the world [22]. Changes in geological, hydrogeological and temperature conditions in earthquake-prone areas are monitored by local ground observation networks organized at national, regional or local level, such as the Southern California Seismic Network (SCSN) in the USA, the Monitoring of Waves on Land and Seafloor (MOWLAS) in Japan, etc. [23,24,25]. According to FDSN, the Turkish National Seismic Network, which consists of 267 stations with a mix of surface and borehole broadband seismometers and accelerometers (260 broadband seismometers, 12 surface accelerometers, 14 borehole instruments), provides official earthquake data for Turkey [26]. The main limitations of ground-based networks are the high cost of sensors, low coverage density (sub-kilometer distances between sensors), increased requirements for network stability, and the need to store and process large amounts of data [27]. Remote sensing data from space provide additional information on the Earth’s surface state prior to an earthquake in areas with a low density of ground sensor networks.
Satellite observations of seismic activity zones include assessing the vertical displacement of the Earth’s surface, tracking changes in the pattern of surface occurrence of deep fractures and faults, and monitoring changes in LST. Pre-earthquake surface deformation and vertical displacements (particularly subsidence) can be detected from time series of satellite Synthetic Aperture Radar (SAR) data, such as Sentinel-1, using multi-temporal Interferometric Synthetic Aperture Radar (InSAR) techniques [16,28]. Data from Landsat 8, Landsat 9 satellites provide regular images of the Earth’s surface at medium spatial resolution (100 m) in the thermal range of the electromagnetic spectrum (10.60–12.51 µm) [29]. In the absence of cloud cover, LST maps based on satellite data allow us to detect temperature anomalies preceding earthquakes of magnitude 5.5 Mw and above observed in open areas without vegetation cover or buildings [8,30,31,32,33]. Temperature anomalies are reliable but not sufficient precursors of earthquakes because temperature extremes can be masked by vegetation cover, terrain effects, or climatic conditions [8].
The objective of this study is to evaluate an additional indicator of an approaching earthquake based on the analysis of multi-temporal multispectral satellite images. Landsat 8 images were used as input data, which have two significant advantages—they contain the thermal infrared bands and are in the open access, allowing a wide range of specialists to use the method described below.
The article is organized as follows. The study area and input data are described in Section 2.1 and 2.2. Section 2.3 presents a proposed method of Landsat 8 LST contrast boundary detection and boundary concentration analysis as an indicator of an approaching earthquake. In Section 3, the performance of the proposed indicator is evaluated, and the maximum values of contrast boundary concentration are compared with earthquake epicenters. The peculiarities of the proposed method are analyzed in Section 4. Section 5 presents the conclusions.
2. Materials and Methods
2.1. Study Area
The East Anatolian Fault Zone is a major tectonic feature in eastern Turkey, marking the boundary between the Anatolian Plate and the Arabian Plate. The fault zone is a complex combination of normal and strike-slip faults making the East Anatolian Fault Zone particularly prone to producing large earthquakes.
The East Anatolian Fault Zone has been responsible for several major earthquakes, including the 1983 Erzurum earthquake (6.9 Mw), the 1992 Erzincan earthquake (6.8 Mw), the 2010 Elazığ earthquake (6.1 Mw) and the 2020 Sivrice earthquake (6.8 Mw). These earthquakes caused significant damage and loss of life and had far-reaching social, economic and environmental impacts.
The study area of 6,130 km2 (Figure 1b) is located near the Nurdagı Municipality of Gaziantep Province at the junction of the Anatolian Fault Zone (Figure 1a) and the Dead Sea Transform, making it extremely seismically active. The study area crosses a tectonic fault, which is part of the Anatolian Fault Zone (Figure 1a), in the north-south west direction along the Uzunziyaret mountain range.
Two epicenters of the significant and most destructive earthquakes are located in the study area (Figure 1b):
- Epicenter 1: Atalar (coordinates: 37.17°N, 37.03°E), 6 February 2023, 7.8 Mw;
- Epicenter 2: Nurdagı (coordinates: 37.13°N, 36.94°E), 6 February 2023, 6.7 Mw.
From 3 to 8 February, 24 earthquakes with magnitudes between 4.2 and 5.6 Mw were observed in the study area. In the following month, 16 earthquakes with magnitudes between 4.0 and 4.7 Mw were observed (Figure 1b).
2.2. Data
LST maps derived from Landsat 8 data with cloud cover up to 10% were the main input data used in this study. LST is the Earth’s surface temperature measured to a few centimeters deep [34]. Landsat 8 satellite uses the Thermal InfraRed Sensor (TIRS) that measure the amount of thermal radiation emitted from the Earth’s surface at 100 m spatial resolution in two spectral bands: Thermal Infrared 1 (10.60–11.19 μm) and Thermal Infrared 2 (11.50–12.51 μm) [35]. USGS Landsat 8 Level 2, Collection 2, Tier 1 dataset provided by Google Earth Engine service was used in this study. The LST product is generated using a single-channel algorithm developed jointly by the Rochester Institute of Technology (RIT) and the National Aeronautics and Space Administration (NASA) Jet Propulsion Laboratory (JPL) [36]. According to this algorithm, the temperature values recorded in each pixel of a thermal image are first converted to brightness values, which are then corrected for atmospheric effects and converted to temperature values using empirical or physical models. The LST values obtained can then be presented as a continuous map of the temperature values at the Earth’s surface. Landsat 8 images were acquired from September 2022 to January 2024 and were taken at 08:09 UTC or 11:09 UTC+3 local time. Sensing dates (Table 1) were chosen during the autumn-winter season to minimize the effect of vegetation cover on the spatial distribution of temperatures.
Ground data were collected at the closest meteorological stations to verify the results of the satellite data analysis:
- IGAZIANT7 (37.03°N, 37.32°E), observation time 11:09;
- OĞUZELI AIRPORT STATION (36.97°N, 37.51°E), observation time 11:20.
Ground-based temperature data are publicly available from the Weather Underground service [37].
Information on the epicenters (coordinates, date and magnitude) of earthquakes that occurred on 6–8 February 2023 and in the subsequent period, provided by the USGS Earthquake Hazards Program, was used as input data [38].
2.3. Methodology
This study investigates the relationship between variations in temperature distribution and earthquake epicenters in three observation periods: a few months before the earthquake (September and November 2022), immediately before or after the earthquake (January and February 2023), and one year after the earthquake (January 2024).
Landsat 8 Thermal Infrared 1 data were pre-processed to mask cloud cover and cloud shadows and to fill in the gaps [39]. Ground-based data (Table 1) were used for an additional temperature correction. This correction is necessary to remove as much of the influence of solar heating as possible, so that only the subsurface temperature is used.
To detect temperature variations of the Earth’s surface, this study proposes the creation of concentration maps of the LST contrast boundary as a tool to analyze temperature changes before and after a series of earthquakes (Figure 2). The optimal Canny algorithm is used to detect contrast boundaries. It was developed by John Canny in 1986 and is widely used in computer vision and image processing applications [40]. The contrast boundary concentration is estimated assuming that it is maximum in the vicinity of earthquake epicenters, allowing further use of this indicator for predicting approaching earthquakes.
The computational steps were implemented using the GIS RAPID 3.2 software [41].
3. Results
3.1. Studying the Heating of the Earth’s Crustal Surface
A rise in the Earth’s surface temperature is one of the most obvious and intuitively expected indicators of an approaching earthquake. The accumulation of stress in the earth’s crust and an increase in its permeability can result in surface heating, which is a precursor to an earthquake.
There have been several previous studies using Landsat thermal imagery to investigate the relationship between earthquakes and surface temperature changes in Turkey. For example, thermal anomalies from Landsat and MODIS thermal data are associated with the 2011 Van earthquake in Turkey with a magnitude of 7.2 Mw [42]. Significant thermal anomalies were found to be associated with the earthquake based on changes in LST before and after the earthquake. The LST increased significantly in the days before the earthquake and remained high for several days after the earthquake. Thermal anomalies were found to be consistent with fault location and earthquake seismic activity. The earthquake was preceded by a significant rise in LST, which may have been related to stress accumulation and deformation of the Earth’s crust prior to the earthquake.
In general, Landsat thermal data can be useful for detecting and monitoring thermal anomalies associated with earthquakes and other geohazards in Turkey and other regions. The February 2023 earthquakes were also accompanied by an increase in surface temperature. Figure 3a, b shows a significant rise in LST values during January 2022.
At the same time, following a series of strong earthquakes on 6–8 February 2023 and the release of stresses in the Earth’s crust, the surface temperature continued to rise, as shown in Figure 3c. On the one hand, this may indicate a potential threat of new destructive earthquakes in this region. On the other hand, during the month after 8 February 2023, seismic activity in the region gradually decreased, despite the increase in surface temperature.
There is therefore a need for another indicator that is more flexible and reflects the situation before and after earthquakes.
3.2. Changes of LST Contrast Boundaries Concentration
Methods for studying lineaments in satellite images can play an important role in earthquake prediction. Lineaments are linear features or patterns on the Earth’s surface that can be observed in satellite images. These linear features can vary in length, orientation and width and can be caused by a wide range of geological and tectonic factors. Lineaments can be the result of fault zones or zones of structural weakness, fractures or joints in the rock formations. Remote sensing techniques based on image analysis methods can be used for the detection and mapping of lineaments.
Prior to an earthquake, geological faults and their associated lineaments can undergo various changes and processes. Lineaments may widen or deform due to stress accumulation along the fault zone. This can cause various changes in surrounding rock formations, including bending, fracturing and displacement. Such lineament changes can potentially precede earthquakes [43,44]. The study described below examines these changes by analyzing Landsat satellite images.
It should be noted that the computer detection of lineaments from satellite images is a complex process that usually consists of two stages: identifying the contrast boundaries of the image and combining their linear fragments into extended lineaments.
Algorithms for automatic lineaments detection require the specification of many parameters that radically affect the results.
In this regard, it is suggested to use the first, simpler stage, which includes the detection and analysis of contrast boundaries. This makes lineament analysis faster and less subjective, without losing important information.
When processing satellite images, the Canny algorithm can be used to detect the edges of natural features such as geological formations, vegetation, lakes, as well as linear features such as rivers or geological boundaries. Since all these objects are controlled by faults in the Earth’s crust, the Canny algorithm makes it possible to identify linear boundaries associated with fault structures.
Figure 4 shows a fragment of the Landsat thermal infrared band and the contrast boundaries detected on it.
By analyzing these contrast boundaries over time, we will try to identify patterns of change that can be used to predict seismic activity.
In addition to analyzing the entire set of contrast boundaries, their oriented fragments were also studied, because differently oriented geological faults and their corresponding lineaments can undergo varying changes prior to earthquakes.
Figure 5 shows the total length of oriented contrast boundaries in Landsat thermal infrared images taken before and after a series of catastrophic earthquakes on 6–8 February 2023.
Calculation results showed that the number of contrast boundaries with azimuths of 0° and 90° gradually increased as earthquakes approached, and their number decreased sharply after seismic events. At the same time, the number of boundary fragments with other azimuths changed insignificantly.
For further analysis, maps were produced showing the concentration (total length) of detected boundaries within a sliding window of 2.5×2.5 km (Figure 6).
As earthquakes approach, the concentration of contrast boundaries at 0° azimuth (Figure 6a–c) and 90° azimuth (Figure 6d–f) increases significantly. Combining these maps gives the generalized maps of Figure 6g–i. The subsequent analysis was based on these maps. They expressively show an increase in the number of distinct contrast boundaries as a series of catastrophic earthquakes approaches on 6–8 February 2023.
A decreasing number of contrast boundaries is observed as seismic activity decreases (Figure 5).
The accuracy of the result was evaluated as the percentage of earthquake epicenters within a radius of up to 5 kilometers from the zones of maximum concentration of contrast boundaries at azimuths of 0° and 90°. In anticipation of the major earthquakes on 6–8 February 2023, the accuracy was 92%.
4. Discussion
Figure 5 show that the concentration of contrast boundaries increases as the earthquake approaches and then decreases. This generally correlates with a gradual decrease in seismic activity for at least three months after 6–8 February 2023. Unfortunately, after February 2023, Landsat images are covered by thick cloud cover, making it impossible to extract contrast boundaries with acceptable accuracy, and summer images are difficult to compare with winter images due to the seasonal factor.
There are at least three important questions to be answered in the discussion of the results:
- Is there a spatial relationship between the localization of earthquake epicenters and anomalies in the contrast boundaries concentration map?
- Are there any other indicators calculated from Landsat satellite images (e.g. spectral indices) that also increased before the February 2023 earthquakes and then decreased?
- Do maps show the location of aftershock epicenters?
Consider possible answers.
Figure 7 helps to answer the first question. For each of the multi-temporal images, two indicators were calculated: the average concentration of the contrast boundaries only in pixels above the epicenters and in all pixels of the image.
Both these two indicators themselves and the difference between them increase with the approach of earthquakes and decrease sharply after them. In other words, the concentration of contrast boundaries at the locations where earthquakes occurred on 6–8 February 2023 increased faster than in the study area as a whole. The concentration of boundaries, both above the epicenters and across the study area, decreases sharply after stress relief.
Answering the second question requires too much calculation, given that several hundred spectral indices are known (https://www.indexdatabase.de/). One of the indicators based on them is the Soil Moisture Index (SMI) [45].
SMI is modelled based on a linear relationship between the Normalized Difference Vegetation Index (NDVI) and LST derived from Landsat 8 images (Figure 8). It is calculated from the Thermal–Optical TRAapezoid Model (TOTRAM). SMI values range from 0 (dry soil) to 1 (wet soil) [45]. Increased rock fracturing causes increased rock moisture [46]. The index is highly dependent on vegetation conditions, but images taken in January can be compared correctly.
The difference between the maps generated from the data of 5 January 2023 (Figure 8a) and 21 January 2023 (Figure 8b) is quite noticeable, but it is of the opposite nature to that expected: as the date of the earthquake approaches, the SMI values do not increase but decrease.
Calculations with some other vegetation indices did not give convincing results either.
Figure 9 compares concentration maps of contrast boundary fragments with azimuths of 0° and 90° from 21 January 2023 and 22 February 2023, with plotted epicenters of aftershocks. The dots indicate aftershock magnitude greater than 4 Mw between 9 February 2023 and 9 March 2023.
Both maps show the spatial association of aftershocks with areas of increased concentration of contrast boundaries. Despite a significant decrease in the concentration values after the earthquake, the aftershock epicenters are clearly located in the zones of local maxima of contrast boundary concentration. This may provide indirect evidence for the proposed indicator.
Finally, an image of the study area taken one year after the series of earthquakes (24 January 2024) was examined. Figure 10 shows the LST values obtained on 21 January 2023 and 24 January 2024. There is a significant decrease in surface temperature, but this cannot be an indicator of a reduced risk of new earthquakes (as mentioned above, LST values on 22 February 2023 are even higher than on 21 January 2023, just before the earthquakes).
The concentration map of boundaries with azimuths of 0° and 90° is much more informative. It shows that, in general, the risk of new significant earthquakes in the study area has decreased during the year. Significant hotspots of seismic activity are found only in the northern part of the country, while they are almost absent in the south-western part.
However, Figure 5 shows that there was a slight increase in the risk of new earthquakes in the year following the 6–8 February 2023 events.
5. Conclusions
For the study area of the East Anatolian Fault Zone, the use of land surface temperature boundary concentration maps from Landsat 8 satellite images, especially at 0° and 90° azimuth, is proposed and justified as an indicator of earthquake hazard. This indicator has a simple and clear physical meaning: as earthquakes approach, crustal stress and seismic activity increase, leading to an increase in heat flows from the depths to the surface. As a result, the pressure on near-surface regions increases, resulting in the extension of geological faults and fractures and their improved delineation on images.
Of interest is the fact that the main fault structures of the study area have subdiagonal azimuths, but the change in the number of contrast boundaries of latitudinal and meridional directions is more pronounced. This issue requires further study.
The proposed indicator can be used for seismic hazard risk assessment in combination with other indicators currently in use (except for land surface temperature, which has proven to be insufficiently reliable at this location).
From the results it can be concluded that the risk of new large earthquakes in the study area is gradually increasing but has not yet reached the recorded in January 2023.
Author Contributions
Conceptualization, S.N., K.S., O.K. and V.K.; methodology, S.N., K.S.; software, S.N.; validation, S.N., K.S., O.K. and V.K.; formal analysis, S.N.; investigation, S.N., K.S., O.K. and V.K.; data curation, K.S.; writing—original draft preparation, S.N. and K.S.; writing—review and editing, S.N., K.S., O.K. and V.K.; visualization, S.N. and K.S. All authors have read and agreed to the published version of the manuscript.
Funding
This research received no external funding.
Data Availability Statement
The data used to support the findings of this study are described in this article.
Acknowledgments
The authors would like to thank the National Aeronautics and Space Administration (NASA), and the United States Geological Survey (USGS) for providing Landsat data.
Conflicts of Interest
The authors declare no conflicts of interest.
References
- Vesnin, A.; Yasyukevich, Y.; Perevalova, N.; Şentürk, E. Ionospheric Response to the 6 February 2023 Turkey–Syria Earthquake. Remote Sens. 2023, 15, 2336. [Google Scholar] [CrossRef]
- Karabulut, H.; Güvercin, S.E.; Hollingsworth, J.; Konca, A.Ö. Long silence on the East Anatolian Fault Zone (Southern Turkey) ends with devastating double earthquakes (6 February 2023) over a seismic gap: implications for the seismic potential in the Eastern Mediterranean region. Journal of the Geological Society 2023, 180, jgs2023-021. [Google Scholar] [CrossRef]
- Provost, F.; Karabacak, V.; Malet, J. P.; Van der Woerd, J.; Meghraoui, M.; Masson, F.; Ferry, M.; Michéa, D.; Pointal, E. High-resolution co-seismic fault offsets of the 2023 Türkiye earthquake ruptures using satellite imagery. Scientific Reports 2024, 14, 6834. [Google Scholar] [CrossRef] [PubMed]
- Dal Zilio, L.; Ampuero, J.P. Earthquake doublet in Turkey and Syria. Communications Earth & Environment 2023, 4, 71. [Google Scholar] [CrossRef]
- Ghosh, A.; Holt, W.E.; Bahadori, A. Role of large-scale tectonic forces in intraplate earthquakes of central and eastern North America. Geochemistry, Geophysics, Geosystems 2019, 20, 2134–2156. [Google Scholar] [CrossRef]
- Cui, Y.; Huang, J.; Zeng, Z.; Zou, Z. CO Emissions Associated with Three Major Earthquakes Occurring in Diverse Tectonic Environments. Remote Sens. 2024, 16, 480. [Google Scholar] [CrossRef]
- Ning, L.; Hui, C.; Cheng, C. Exploring the Dynamics of Global Plate Motion Based on the Granger Causality Test. Appl. Sci. 2021, 11, 7853. [Google Scholar] [CrossRef]
- Boudriki Semlali, B.-E.; Molina, C.; Park, H.; Camps, A. First Results on the Systematic Search of Land Surface Temperature Anomalies as Earthquakes Precursors. Remote Sens. 2023, 15, 1110. [Google Scholar] [CrossRef]
- Nahornyi, V.V.; Pigulevskiy, P. Vibration forecast in Europe from the results of groundwater monitoring on the territory of Ukraine, MM Science Journal 2022, October, 5926-5930. [CrossRef]
- Conti, L.; Picozza, P.; Sotgiu, A. A critical review of ground based observations of earthquake precursors. Frontiers in Earth Science 2021, 9, 676766. [Google Scholar] [CrossRef]
- Picozza, P.; Conti, L.; Sotgiu, A. Looking for earthquake precursors from space: A critical review. Frontiers in Earth Science 2021, 9, 676775. [Google Scholar] [CrossRef]
- Lee, H.A.; Hamm, S.-Y.; Woo, N.C. Pilot-Scale Groundwater Monitoring Network for Earthquake Surveillance and Forecasting Research in Korea. Water 2021, 13, 2448. [Google Scholar] [CrossRef]
- Mahmood, I. Anomalous variations of air temperature prior to earthquakes. Geocarto International 2019, 36, 1396–1408. [Google Scholar] [CrossRef]
- Sekertekin, A.; Inyurt, S.; Yaprak, S. Pre-seismic ionospheric anomalies and spatio-temporal analyses of MODIS Land surface temperature and aerosols associated with Sep, 24 2013 Pakistan Earthquake. Journal of Atmospheric and Solar-Terrestrial Physics 2020, 200, 105218. [Google Scholar] [CrossRef]
- Semenov, V.; Ladanivskyy, B.; Petrishchev, M. Emergence of earthquakes footprint in natural electromagnetic field variations. Geodynamics 2018, 2, 65–70. [Google Scholar] [CrossRef]
- Albano, M.; Chiaradonna, A.; Saroli, M.; Moro, M.; Pepe, A.; Solaro, G. InSAR Analysis of Post-Liquefaction Consolidation Subsidence after 2012 Emilia Earthquake Sequence (Italy). Remote Sens. 2024, 16, 2364. [Google Scholar] [CrossRef]
- Chalyi, O.; Diaconescu, M.; Gurova, I.; Lisovyi, Y.; Pigylevsky, P.; Shcherbina, S.; Shevtsov, A.; Shumlianska, L. The cause of high intensity of seismicity in Ukraine. Visnyk of Taras Shevchenko National University of Kyiv. Geology 2018, 4, 38–45. [Google Scholar] [CrossRef]
- Bhardwaj, A.; Singh, S.; Sam, L.; Joshi, P.K.; Bhardwaj, A.; Martín-Torres, F.J.; Kumar, R. A review on remotely sensed land surface temperature anomaly as an earthquake precursor. International journal of applied earth observation and geoinformation 2017, 63, 158–166. [Google Scholar] [CrossRef]
- Guo, A.; Xu, Y.; Jiang, N.; Wu, Y.; Gao, Z.; Li, S.; Xu, T.; Bastos, L. Analyzing correlations between GNSS retrieved precipitable water vapor and land surface temperature after earthquakes occurrence. Science of The Total Environment 2023, 872, 162225. [Google Scholar] [CrossRef] [PubMed]
- Uzun, A.; Oğlakci, B. Turkey’s earthquake history and institution based earthquake reduction policies and strategies. In Earthquake risk perception, communication and mitigation strategies across Europe, Geographies of the Anthropocene; Farabollini, P., Lugeri, F.R., Mugnano, S.; Publisher: Il Sileno Edizioni, Università della Calabria, Italy, 2019; 2, pp. 64–83.
- Ringler, A.T.; Steim, J.; Wilson, D.C.; Widmer-Schnidrig, R.; Anthony, R.E. Improvements in seismic resolution and current limitations in the Global Seismographic Network. Geophysical Journal International 2020, 220, 508–521. [Google Scholar] [CrossRef]
- International Federation of Digital Seismograph Networks. Available online: https://www.fdsn.org/networks (accessed on 12 July 2024).
- Nolte, K.A.; Tsoflias, G.P.; Holubnyak, Y.; Raney, J.; Wreath, D. Designing monitoring networks for local earthquakes. Journal of Geophysics and Engineering 2022, 19, 75–84. [Google Scholar] [CrossRef]
- Hauksson, E.; Yoon, C.; Yu, E.; Andrews, J.R.; Alvarez, M.; Bhadha, R.; Thomas, V. Caltech/USGS Southern California Seismic Network (SCSN) and Southern California Earthquake Data Center (SCEDC): Data availability for the 2019 Ridgecrest sequence. Seismological Research Letters 2020, 91, 1961–1970. [Google Scholar] [CrossRef]
- Aoi, S.; Asano, Y.; Kunugi, T.; Kimura, T.; Uehira, K.; Takahashi, N.; Ueda, H.; Shiomi, K.; Matsumoto, T.; Fujiwara, H. MOWLAS: NIED observation network for earthquake, tsunami and volcano. Earth, Planets and Space 2020, 72, 1–31. [Google Scholar] [CrossRef]
- Alver, F.; Kılıçarslan, Ö.; Kuterdem, K.; Türkoğlu, M.; Şentürk, M.D. Seismic Monitoring at the Turkish National Seismic Network (TNSN). Summary of the Bulletin of the International Seismological Centre 2019, 53, 41–58. [Google Scholar] [CrossRef]
- Li, Z. Recent advances in earthquake monitoring I: Ongoing revolution of seismic instrumentation. Earthquake science 2021, 34, 177–188. [Google Scholar] [CrossRef]
- Panchal, H.; Saraf, A.K.; Das, J.; Dwivedi, D. Satellite based detection of pre-earthquake thermal anomaly, co-seismic deformation and source parameter modelling of past earthquakes. Natural Hazards Research 2022, 2, 287–303. [Google Scholar] [CrossRef]
- USGS, Landsat missions. Available online: https://www.usgs.gov/landsat-missions (accessed on 12 July 2024).
- Huda, D.N.; Shidiq, I.P.A. Spatiotemporal analysis land surface temperature in relation to earthquake occurrence around the cimandiri fault. In IOP Conference Series: Earth and Environmental Science, Kuala Lumpur, Malaysia, 20-21 October 2020; Volume 540, p. 012069. [CrossRef]
- Jiao, Z.; Shan, X. A Bayesian Approach for Forecasting the Probability of Large Earthquakes Using Thermal Anomalies from Satellite Observations. Remote Sens. 2024, 16, 1542. [Google Scholar] [CrossRef]
- Ghosh, S.; Sasmal, S.; Maity, S.K.; Potirakis, S.M.; Hayakawa, M. Thermal Anomalies Observed during the Crete Earthquake on 27 September 2021. Geosciences 2024, 14, 73. [Google Scholar] [CrossRef]
- Pavlidou, E.; Van der Meijde, M.; Van der Werff, H.; Hecker, C. Time Series Analysis of Land Surface Temperatures in 20 Earthquake Cases Worldwide. Remote Sens. 2019, 11, 61. [Google Scholar] [CrossRef]
- Li, Z.L.; Wu, H.; Duan, S.B.; Zhao, W.; Ren, H.; Liu, X.; Leng, P.; Tang, R.; Ye, X.; Zhu, J.; et al. Satellite remote sensing of global land surface temperature: Definition, methods, products, and applications. Reviews of Geophysics 2023, 61, e2022RG000777. [Google Scholar] [CrossRef]
- Boudriki Semlali, B.E.; Molina, C.; Park, H.; Camps, A. Association of land surface temperature anomalies from GOES/ABI, MSG/SEVIRI, and Himawari-8/AHI with land earthquakes between 2010 and 2021. Geomatics, Natural Hazards and Risk 2024, 15, 2324982. [Google Scholar] [CrossRef]
- Google Earth Engine USGS Landsat 8 Level 2, Collection 2, Tier 1. Available online: https://developers.google.com/earth-engine/datasets/catalog/LANDSAT_LC08_C02_T1_L2#description (accessed on 12 July 2024).
- Weather Underground. Available online: https://www.wunderground.com (accessed on 12 July 2024).
- Jones, L.; Bernknopf, R.; Cox, D.; Goltz, J.; Hudnut, K.; Mileti, D.; Perry, S.; Ponti, D.; Porter, K.; Reichle, M.; Seligson, H.; Shoaf, K.; Treiman, J.; Wein, A. Earthquake Hazards Program. US Geological Survey Open File Report 2008, 1150. Available online: https://pubs.usgs.gov/of/2008/1150/of2008-1150small.pdf (accessed on 12 July 2024).
- Shedlovska, Y.I.; Hnatushenko, V.V. Shadow removal algorithm with shadow area border processing. In 2016 II International Young Scientists Forum on Applied Physics and Engineering (YSF), Kharkiv, Ukraine, 10-14 October 2016; Volume 24, pp. 164-167. [CrossRef]
- Nikulin, S.L.; Sergieieva, K.L.; Korobko, O.V. Computer detection of the Earth’s crust blocks using satellite image lineaments. In Geoinformatics: Theoretical and Applied Aspects, Kyiv, Ukraine, 11-14 May 2020; Volume 2020, pp. 1-5. [CrossRef]
- BusyginB, B.; Nikulin, S.; Sergieieva, K. Solving the tasks of subsurface resources management in GIS RAPID environment. Mining of Mineral Deposits 2019, 13, 49–57. [Google Scholar] [CrossRef]
- Ouzounov, D.; Pulinets, S.; Kafatos, M.C.; Taylor, P. Thermal radiation anomalies associated with major earthquakes. Pre-earthquake processes: a multidisciplinary approach to earthquake prediction studies 2018, 259-274. [CrossRef]
- Sichugova, L.; Fazilova, D. Study of the seismic activity of the Almalyk-Angren industrial zone based on lineament analysis. International Journal of Engineering and Geosciences 2024, 9, 1–11. [Google Scholar] [CrossRef]
- Pappachen, J.P.; Hamdan, H.A.; Sathiyaseelan, R.; Darya, A.M.; Shanableh, A. Possible seismo-ionospheric anomalies of Mw 6.0 and 6.4 south Iran twin earthquakes on 14 November 2021 from GPS and ionosonde observations. Arabian Journal of Geosciences 2024, 17, 1–15. [Google Scholar] [CrossRef]
- Burdun, I.; Bechtold, M.; Sagris, V.; Komisarenko, V.; De Lannoy, G.; Mander, Ü. A Comparison of Three Trapezoid Models Using Optical and Thermal Satellite Imagery for Water Table Depth Monitoring in Estonian Bogs. Remote Sens. 2020, 12, 1980. [Google Scholar] [CrossRef]
- Baik, H.; Son, Y.-S.; Kim, K.-E. Detection of Liquefaction Phenomena from the 2017 Pohang (Korea) Earthquake Using Remote Sensing Data. Remote Sens. 2019, 11, 2184. [Google Scholar] [CrossRef]
Figure 1.
Study area in East Anatolian Fault Zone: (a) Major tectonic faults in the region. Basemap: Here Wego Terrain (EPSG:4326–WGS 84); (b) Landsat 8 Natural Color image of the study area acquired on 21 January 2023 and epicenters of earthquakes in different time periods.
Figure 1.
Study area in East Anatolian Fault Zone: (a) Major tectonic faults in the region. Basemap: Here Wego Terrain (EPSG:4326–WGS 84); (b) Landsat 8 Natural Color image of the study area acquired on 21 January 2023 and epicenters of earthquakes in different time periods.
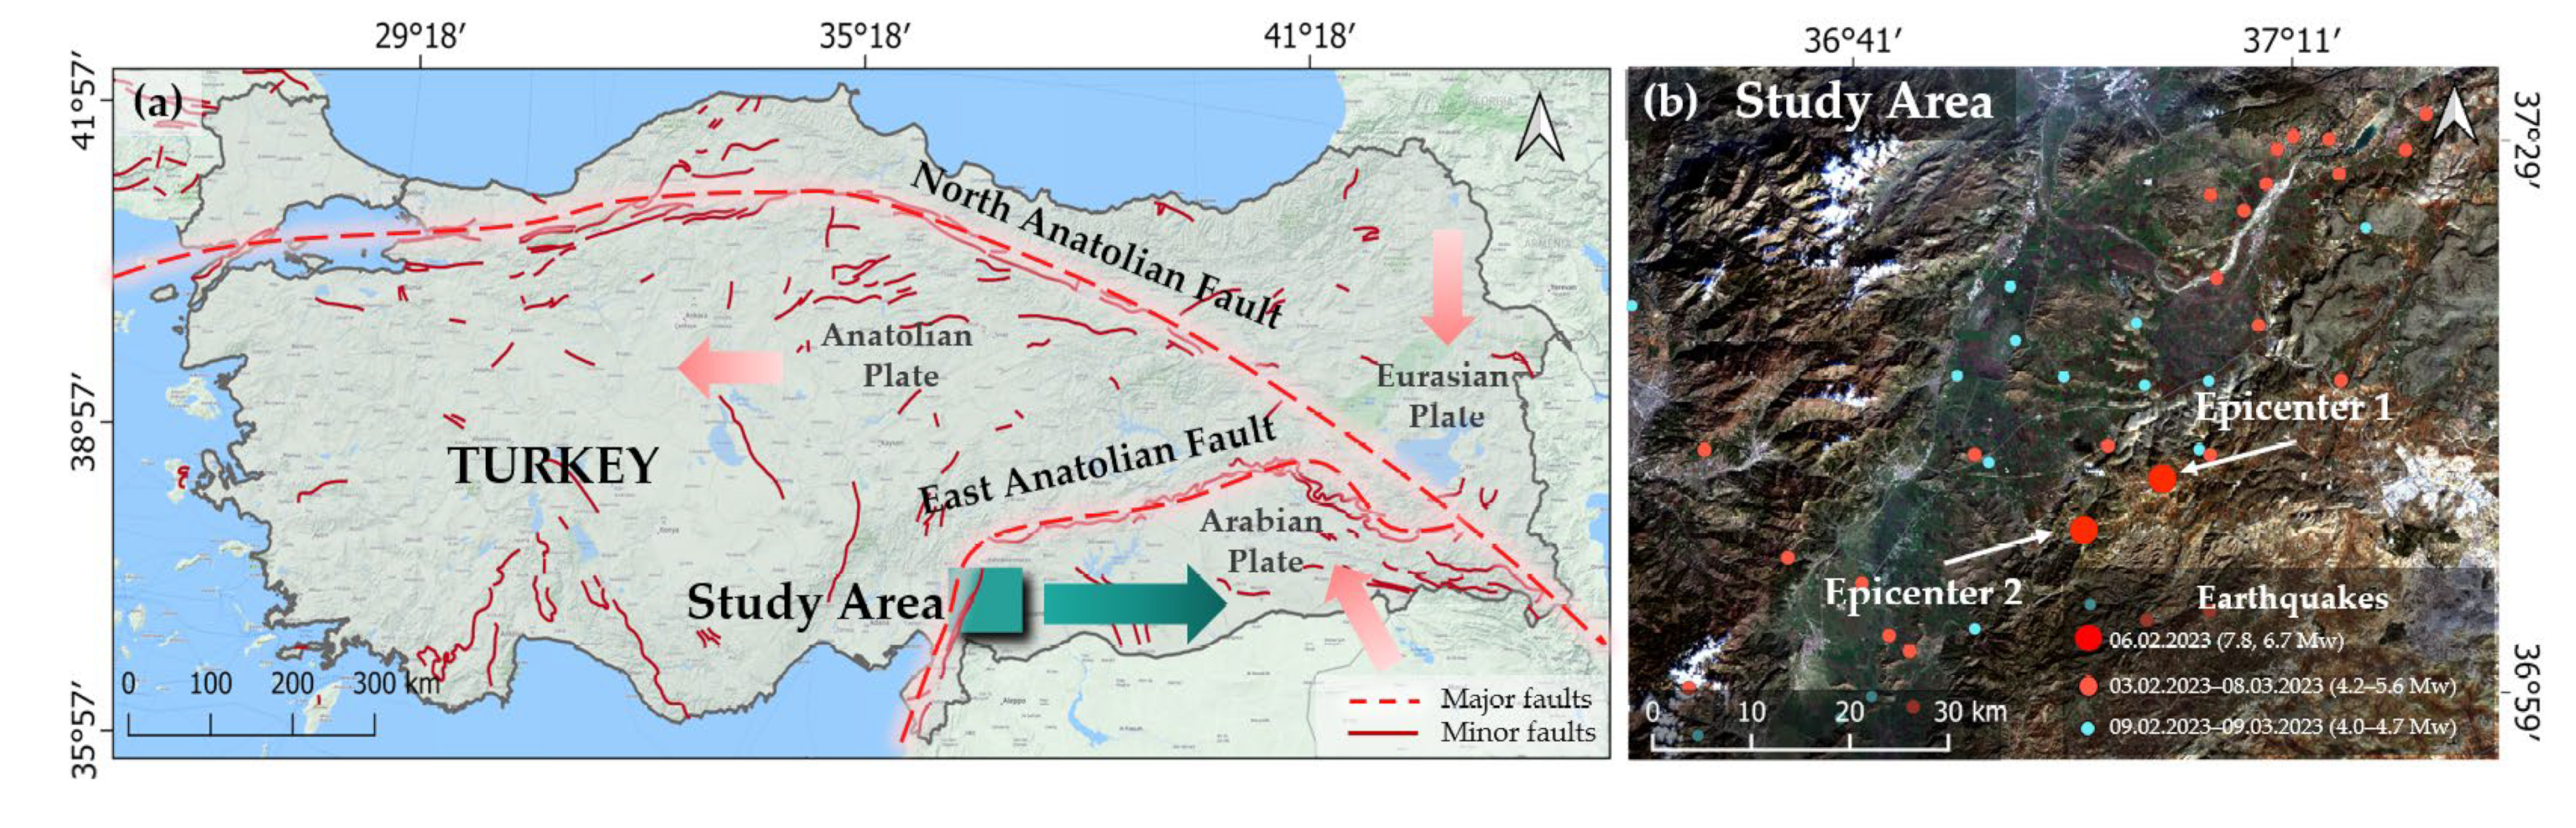
Figure 2.
Constructing and analyzing LST contrast boundary concentration maps.
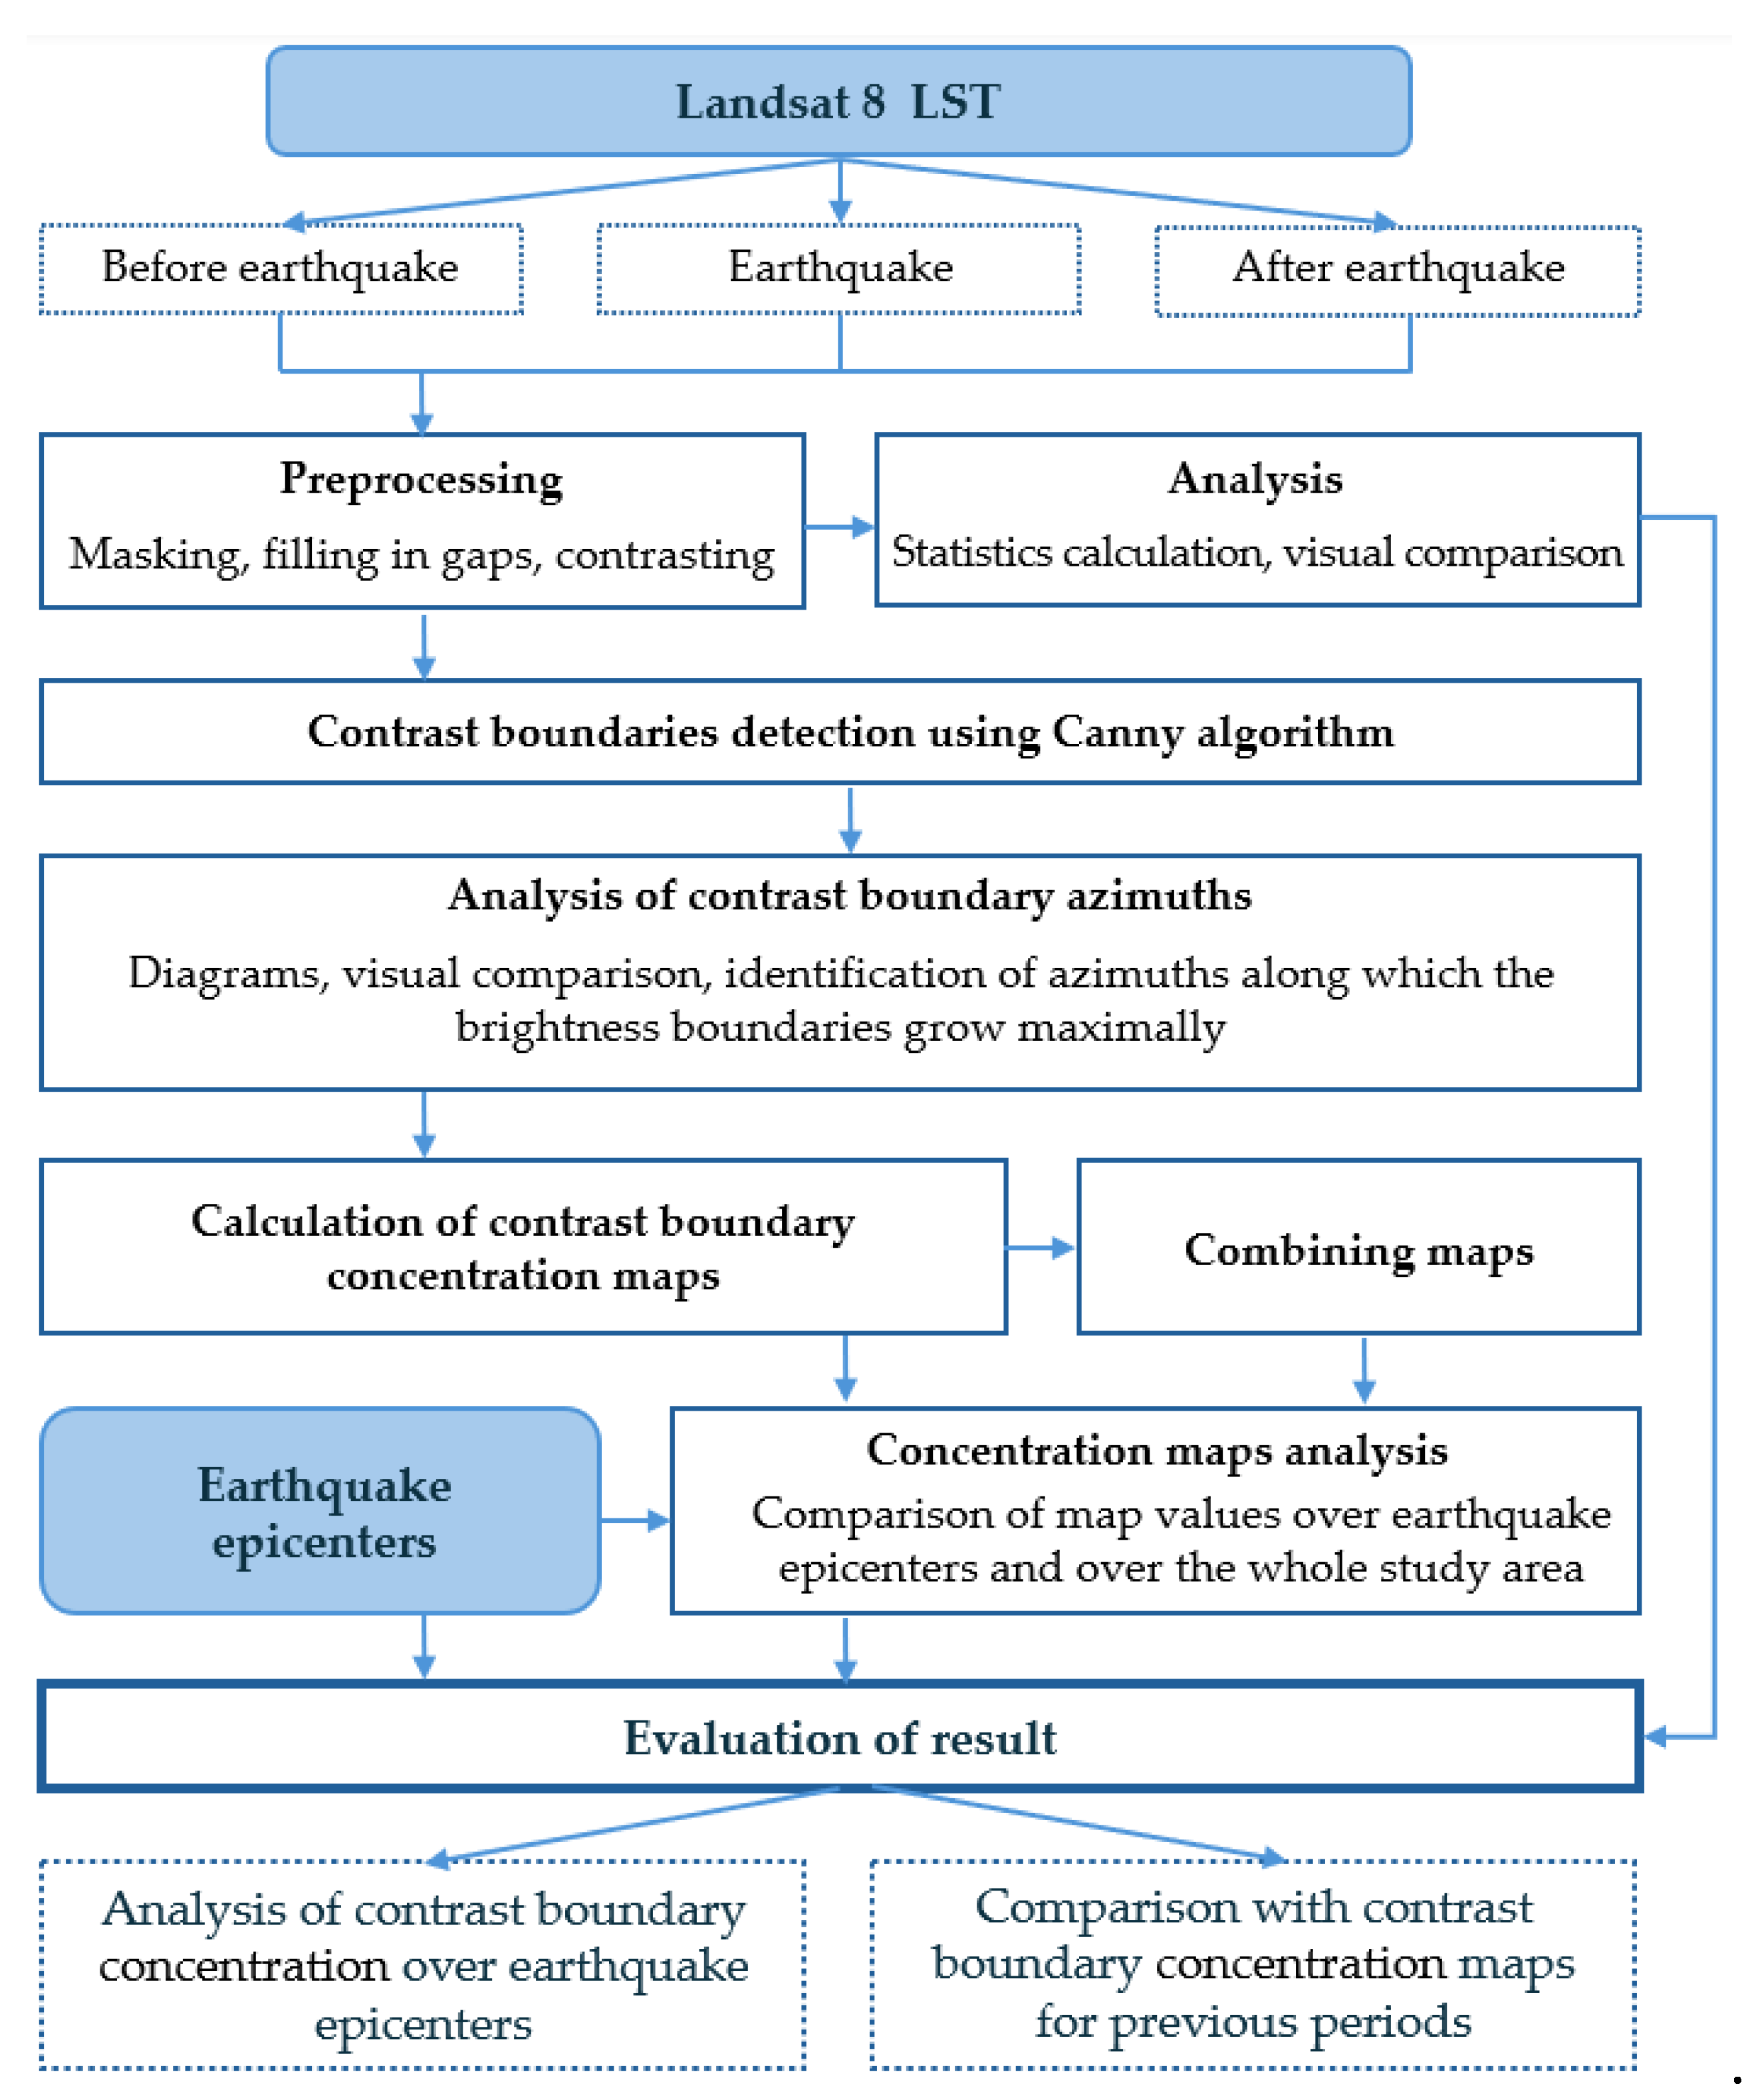
Figure 3.
LST maps from Landsat 8 data before and after the earthquake 6–8 February 2023: (a) 5 January 2023; (b) 21 January 2023; (c) 22 February 2023.
Figure 3.
LST maps from Landsat 8 data before and after the earthquake 6–8 February 2023: (a) 5 January 2023; (b) 21 January 2023; (c) 22 February 2023.
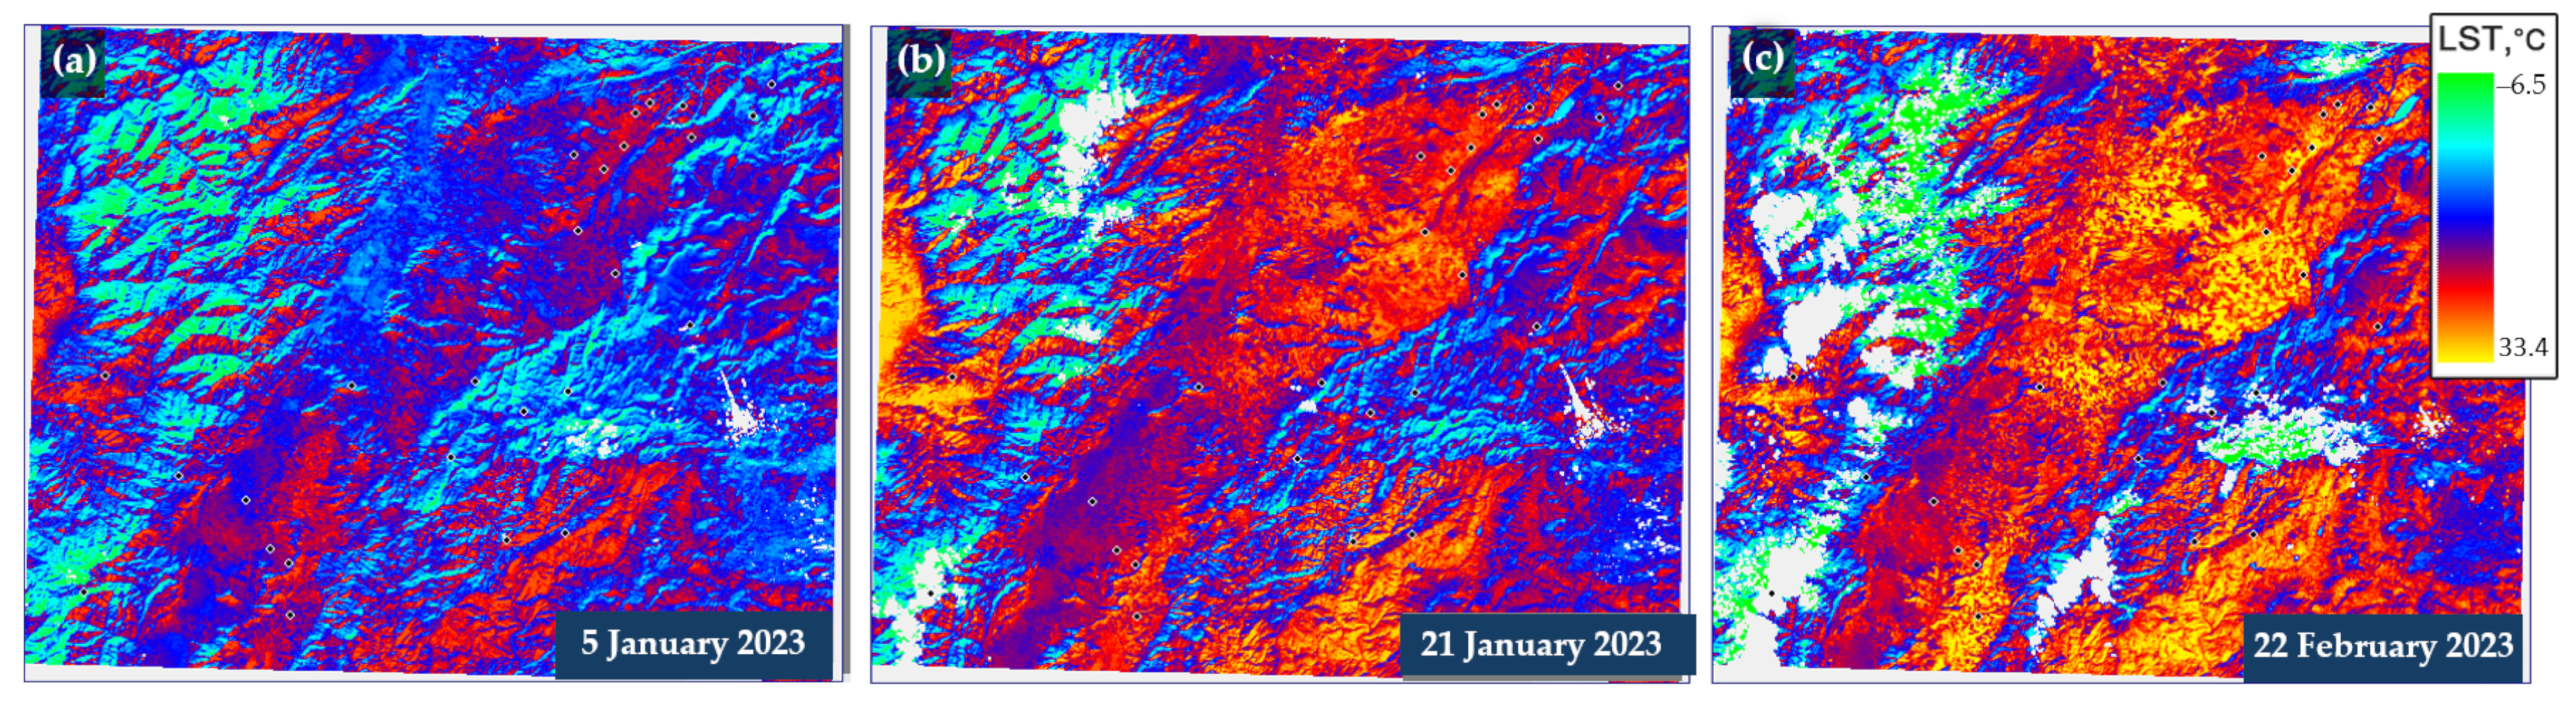
Figure 4.
Example of contrast boundaries for Landsat 8 Thermal Infrared band 1 from 5 January 2023: (a) Thermal Infrared band 1; (b) Contrast boundaries.
Figure 4.
Example of contrast boundaries for Landsat 8 Thermal Infrared band 1 from 5 January 2023: (a) Thermal Infrared band 1; (b) Contrast boundaries.
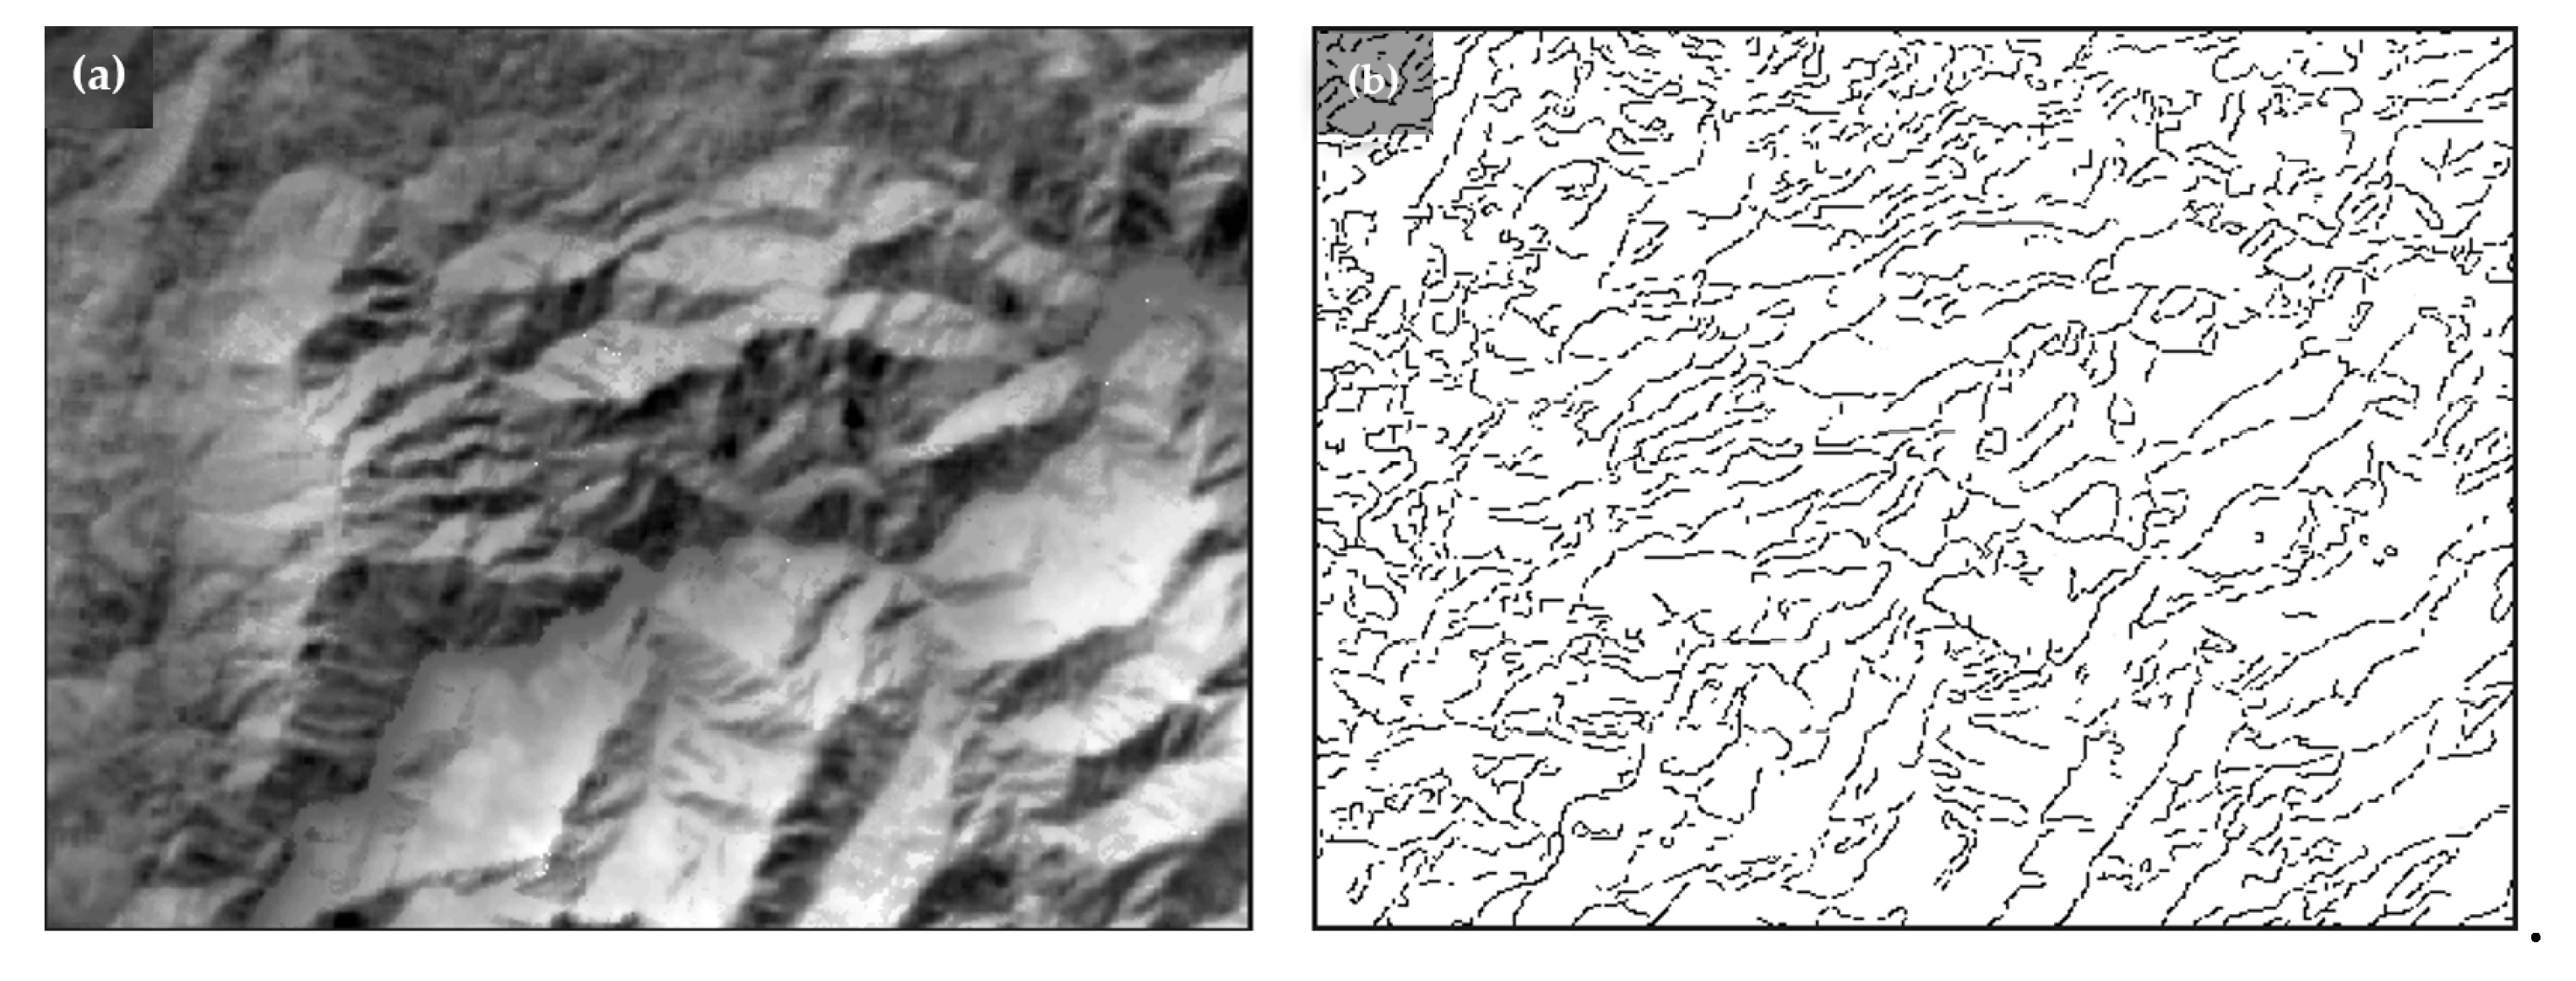
Figure 5.
Cumulative length of oriented contrast boundaries (km).
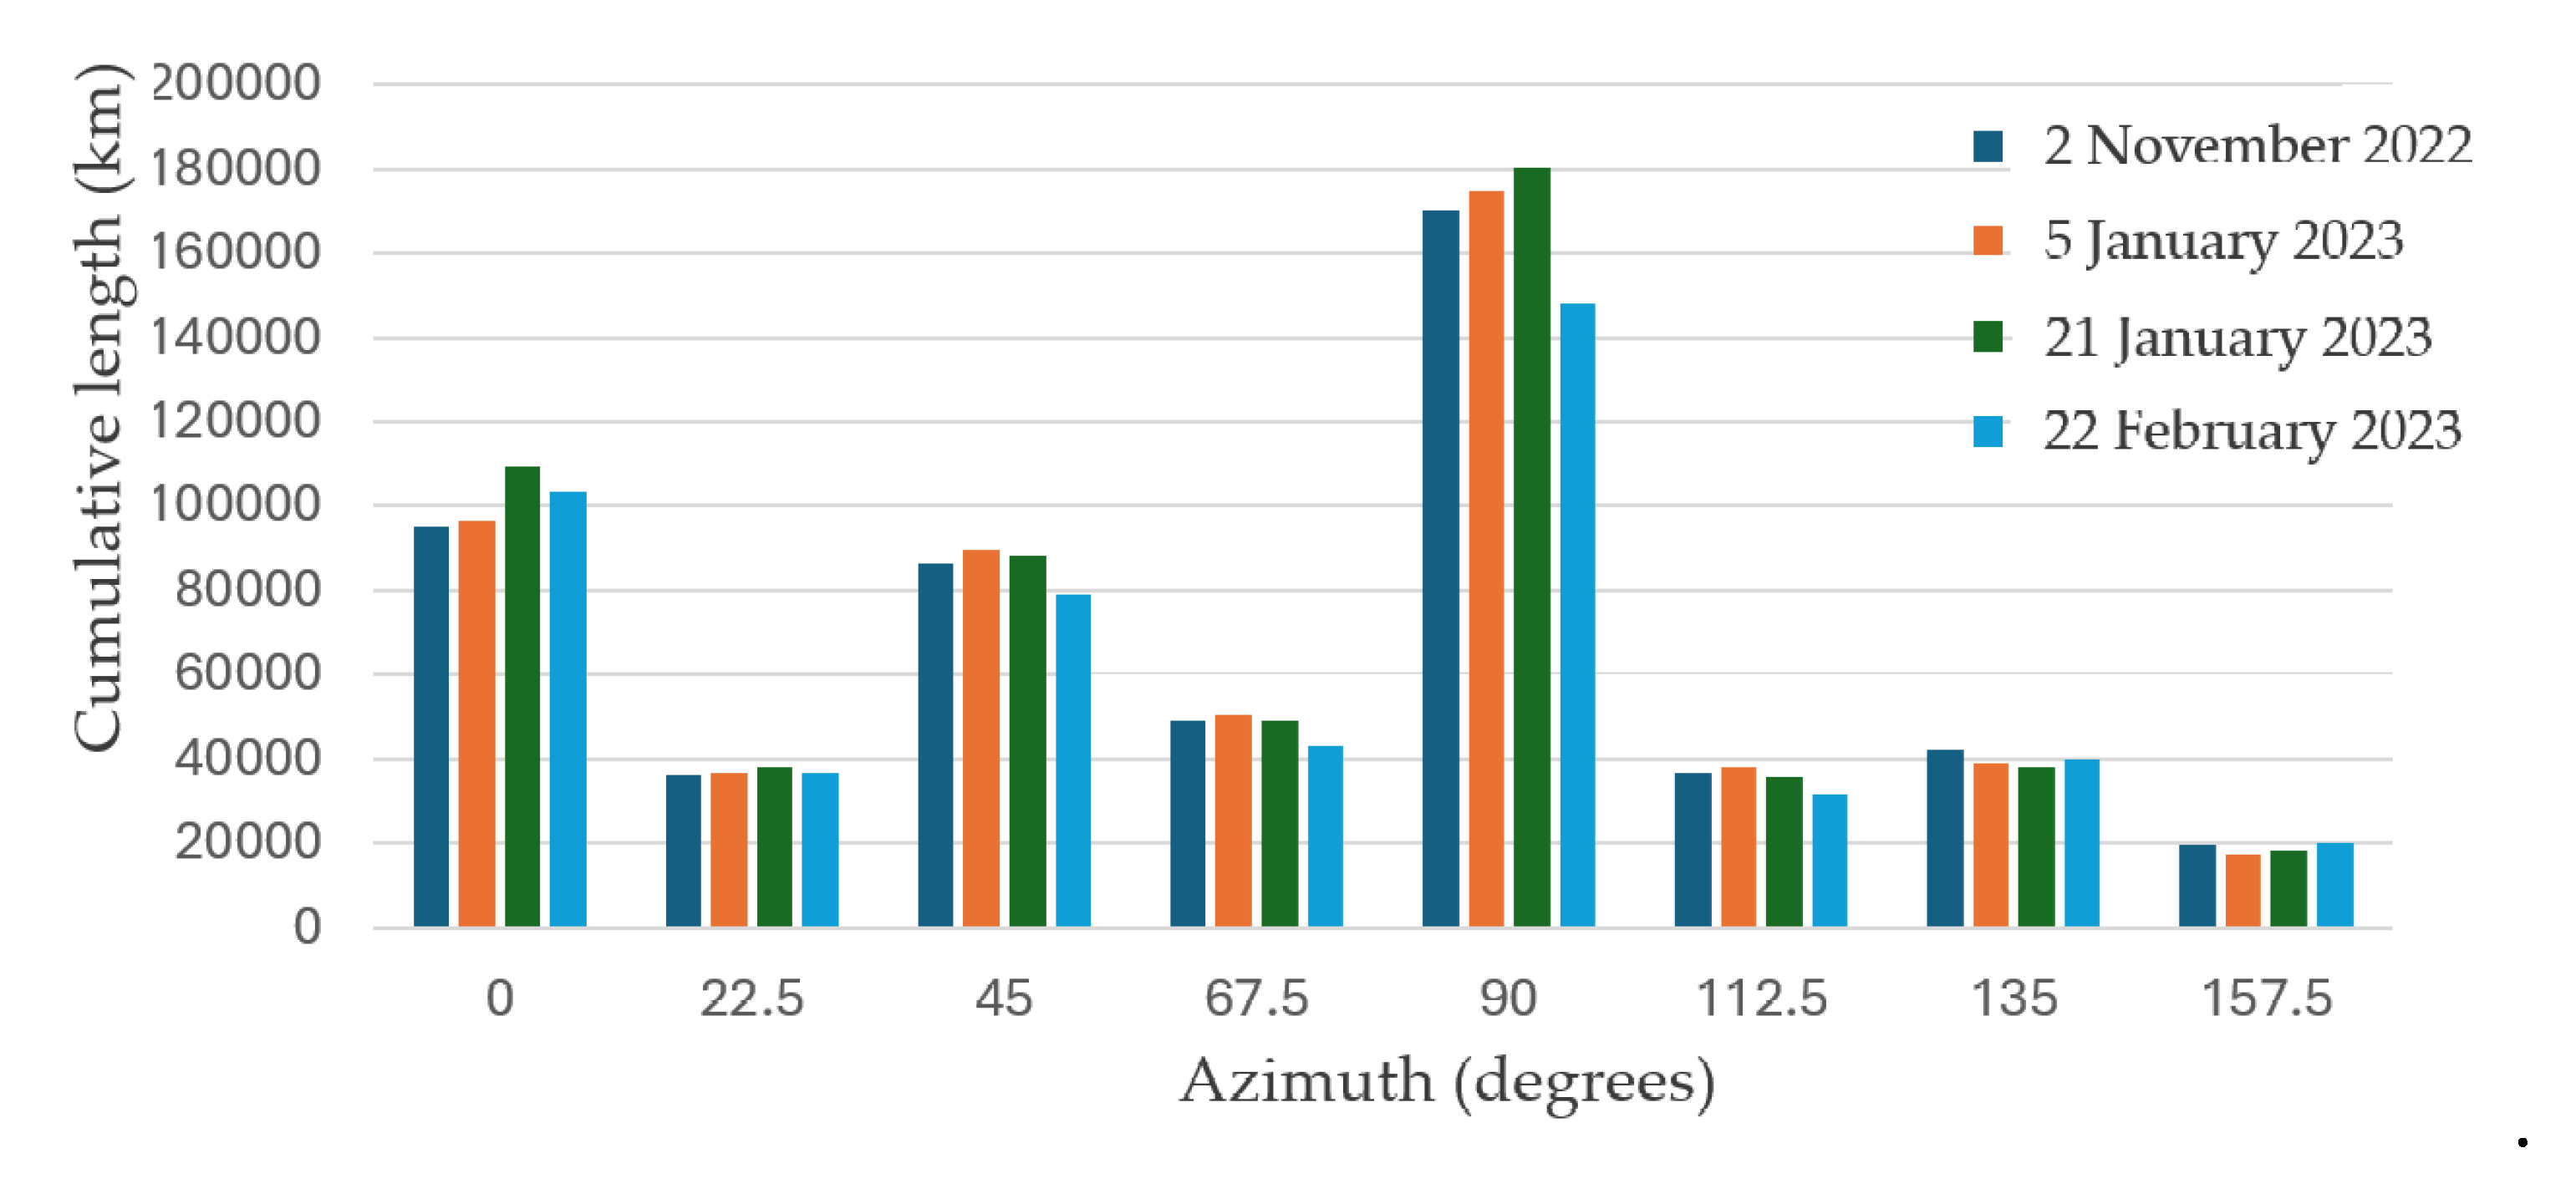
Figure 6.
LST contrast boundary concentration maps at 0° and 90° azimuths before the 6–8 February 2023 earthquake: (a) 0°, 2 November 2022; (b) 0°, 5 January 2023; (c) 0°, 21 January 2023; (d) 90°, 2 November 2022; (e) 90°, 5 January 2023; (f) 90°, 21 January 2023; (g) 0° and 90°, 2 November 2022; (h) 0° and 90°, 5 January 2023; (i) 0° and 90°, 21 January 2023.
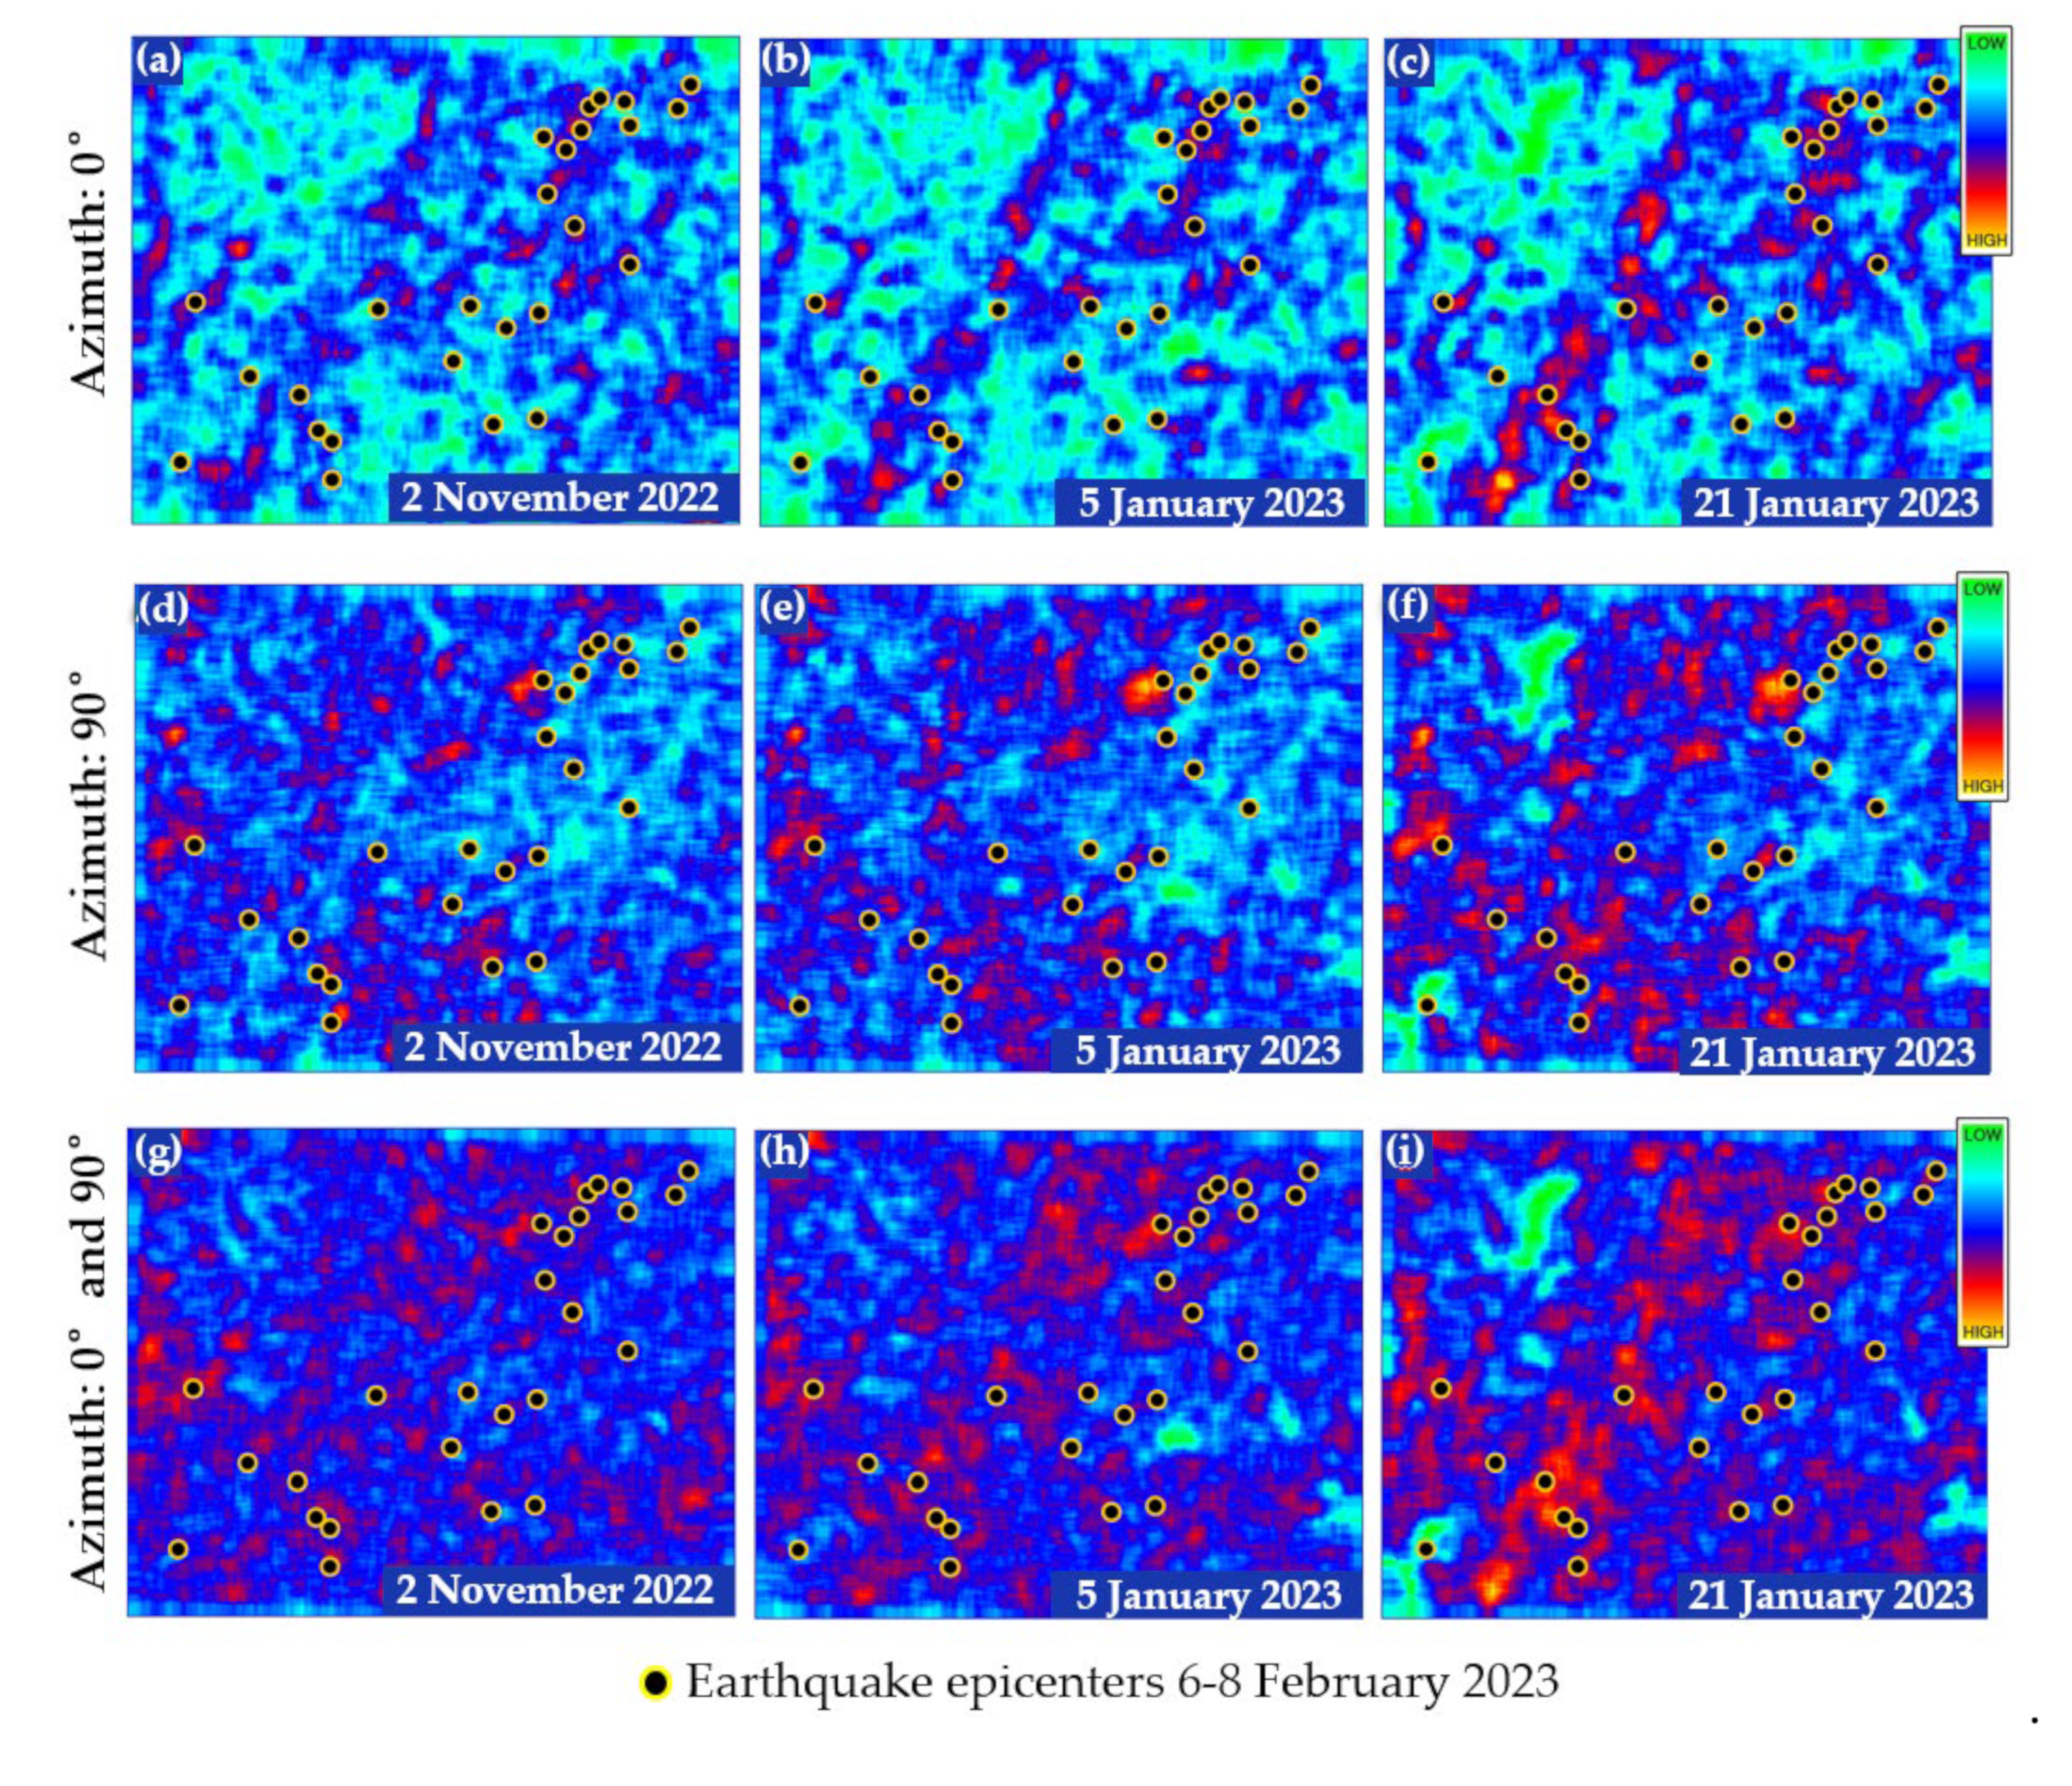
Figure 7.
Average concentration of LST contrast boundaries at 0° and 90° azimuth.
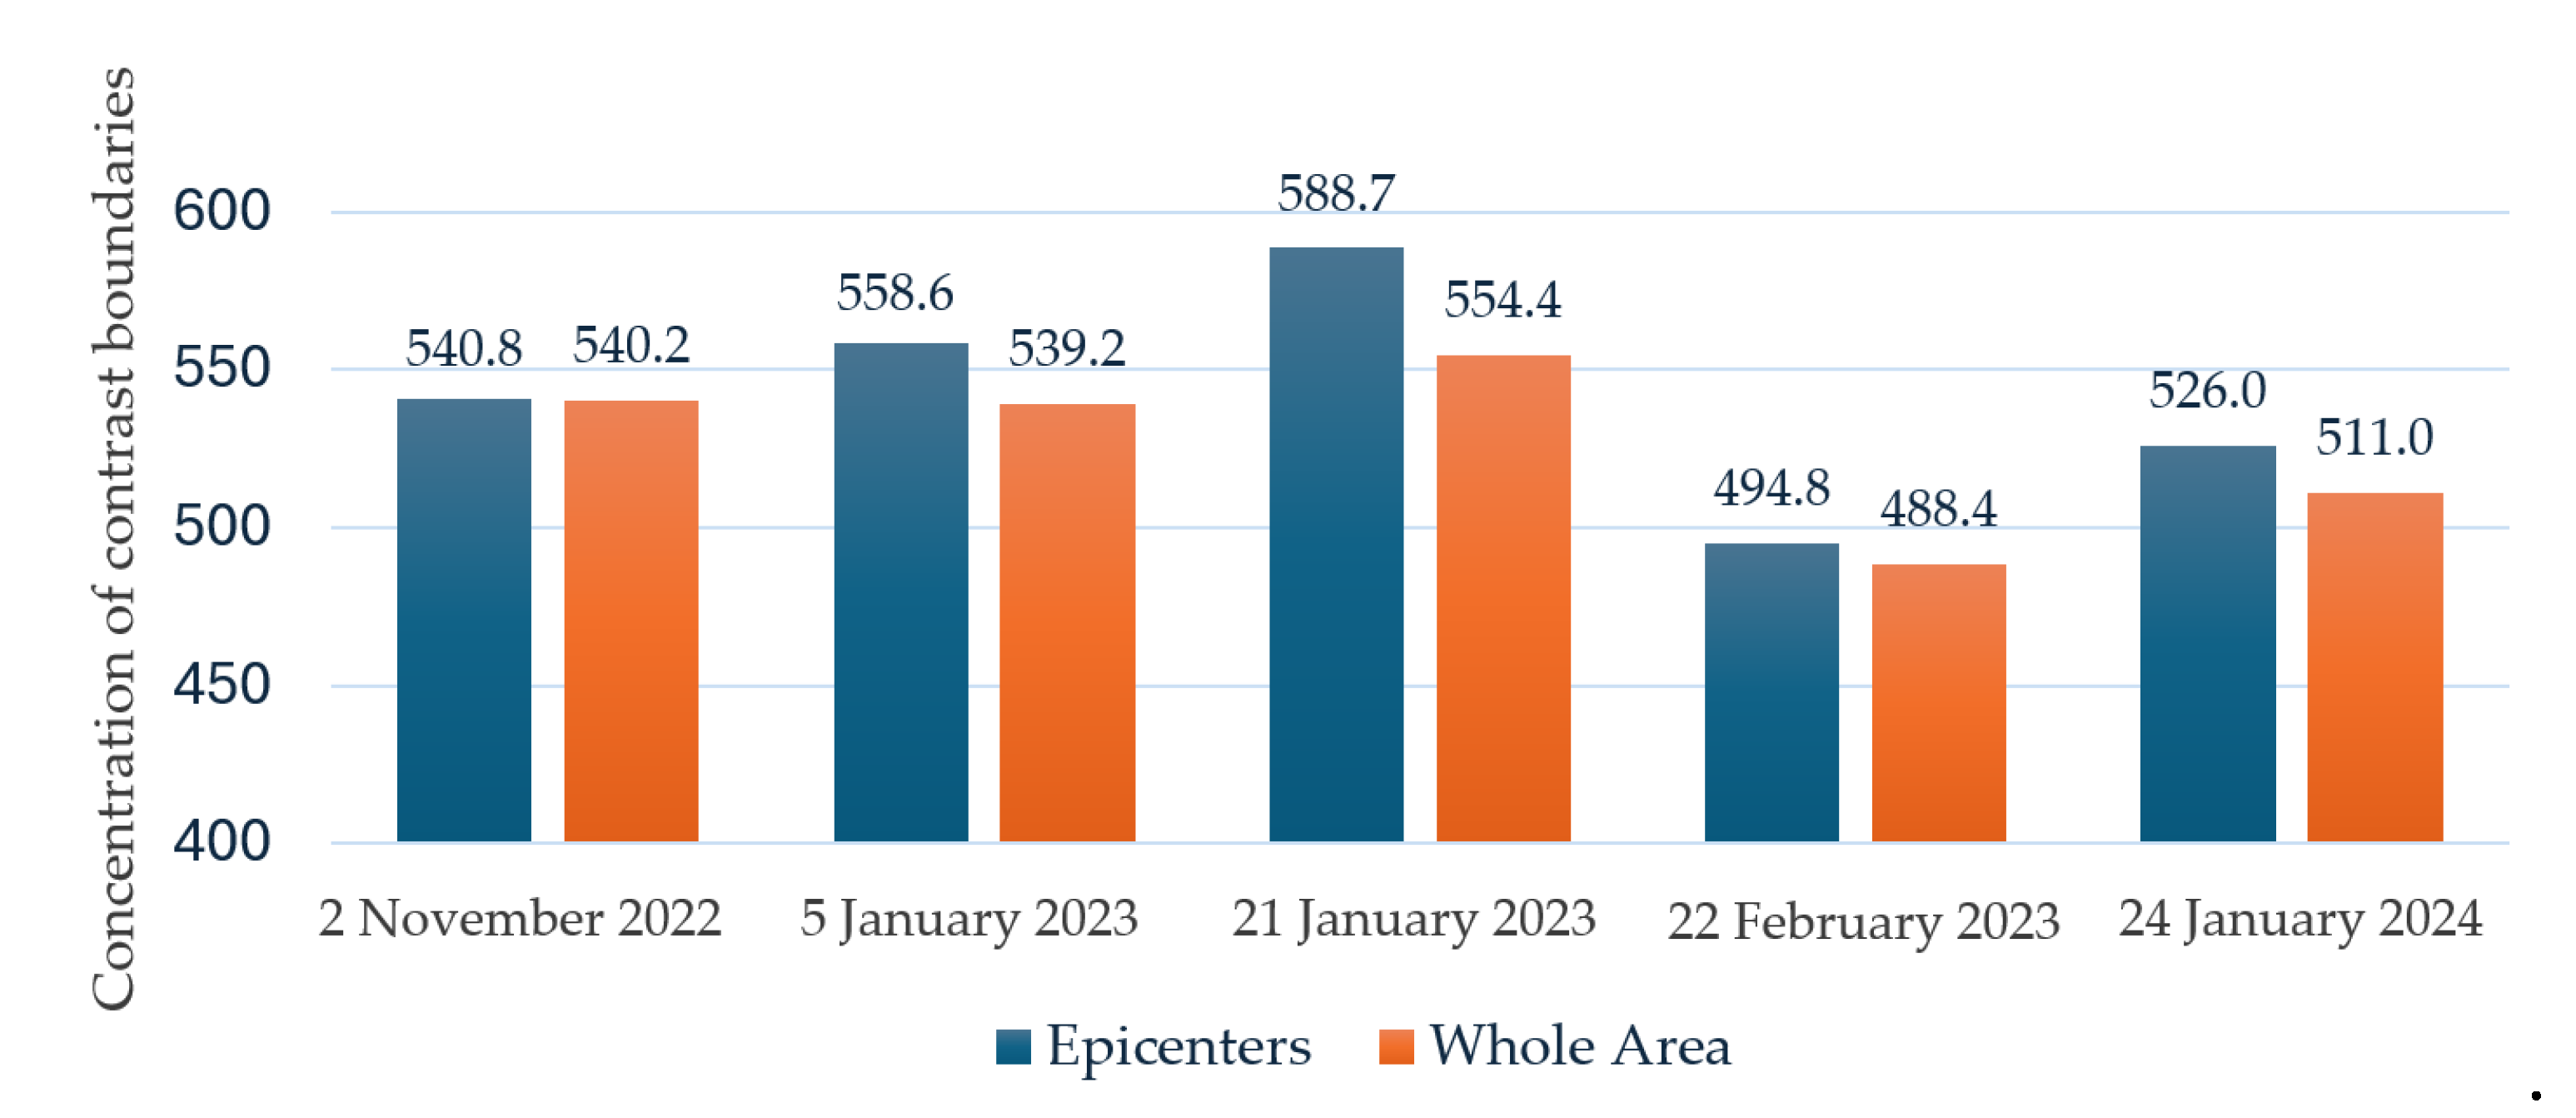
Figure 8.
SMI maps before the 6–8 February 2023 earthquake: (a) 5 January 2023; (b) 21 January 2023.
Figure 8.
SMI maps before the 6–8 February 2023 earthquake: (a) 5 January 2023; (b) 21 January 2023.
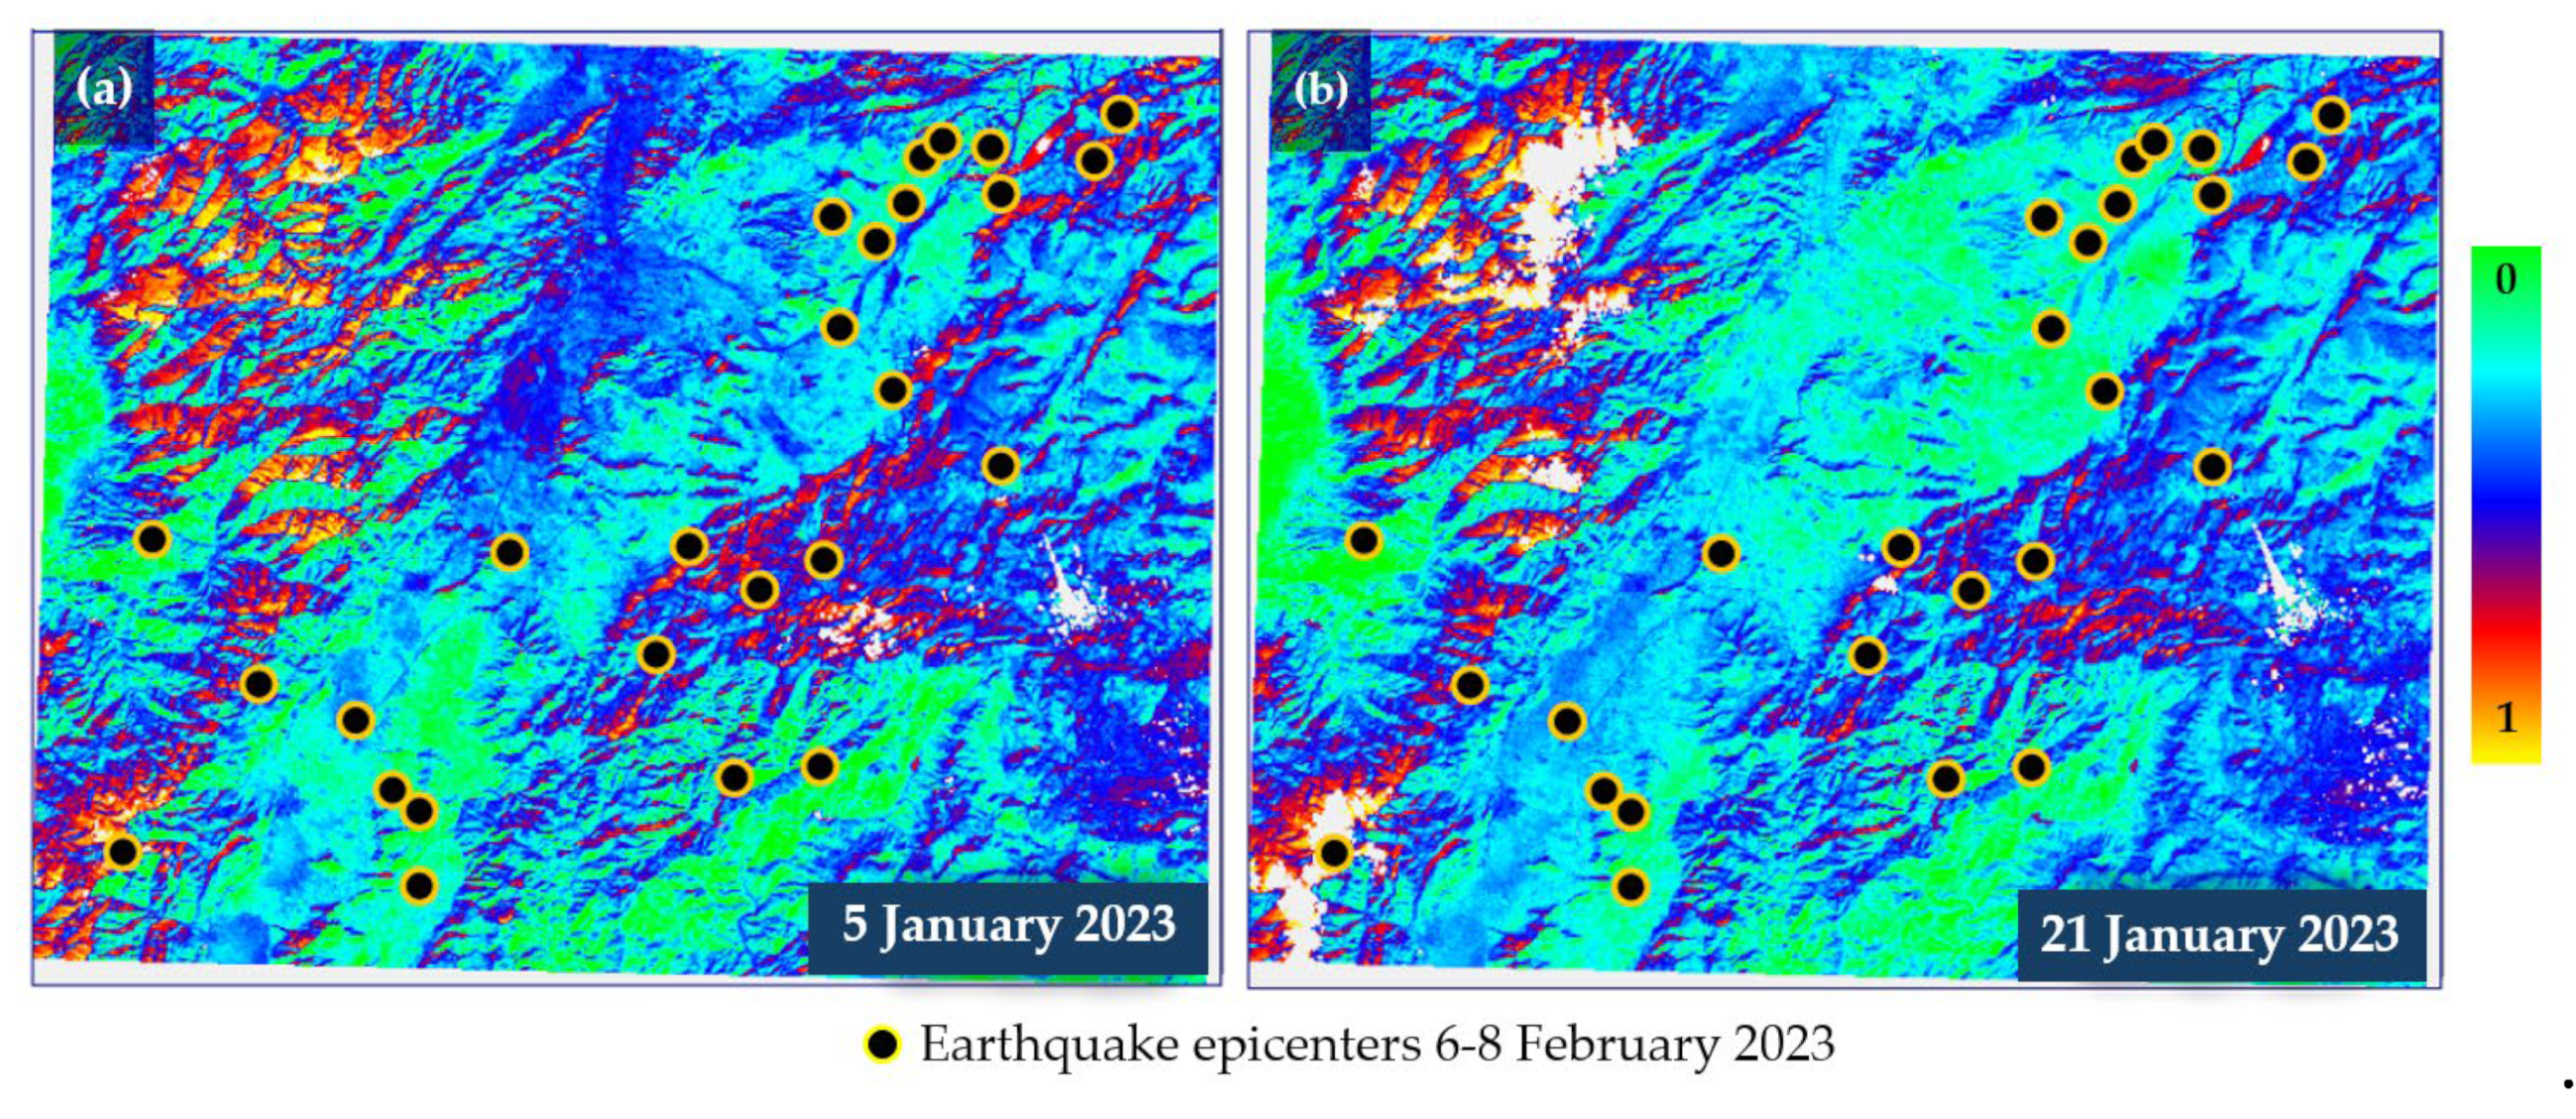
Figure 9.
Fragment of concentration maps of contrast LST boundary at 0° and 90° azimuths: (a) 21 January 2023; (b) 21 February 2023.
Figure 9.
Fragment of concentration maps of contrast LST boundary at 0° and 90° azimuths: (a) 21 January 2023; (b) 21 February 2023.
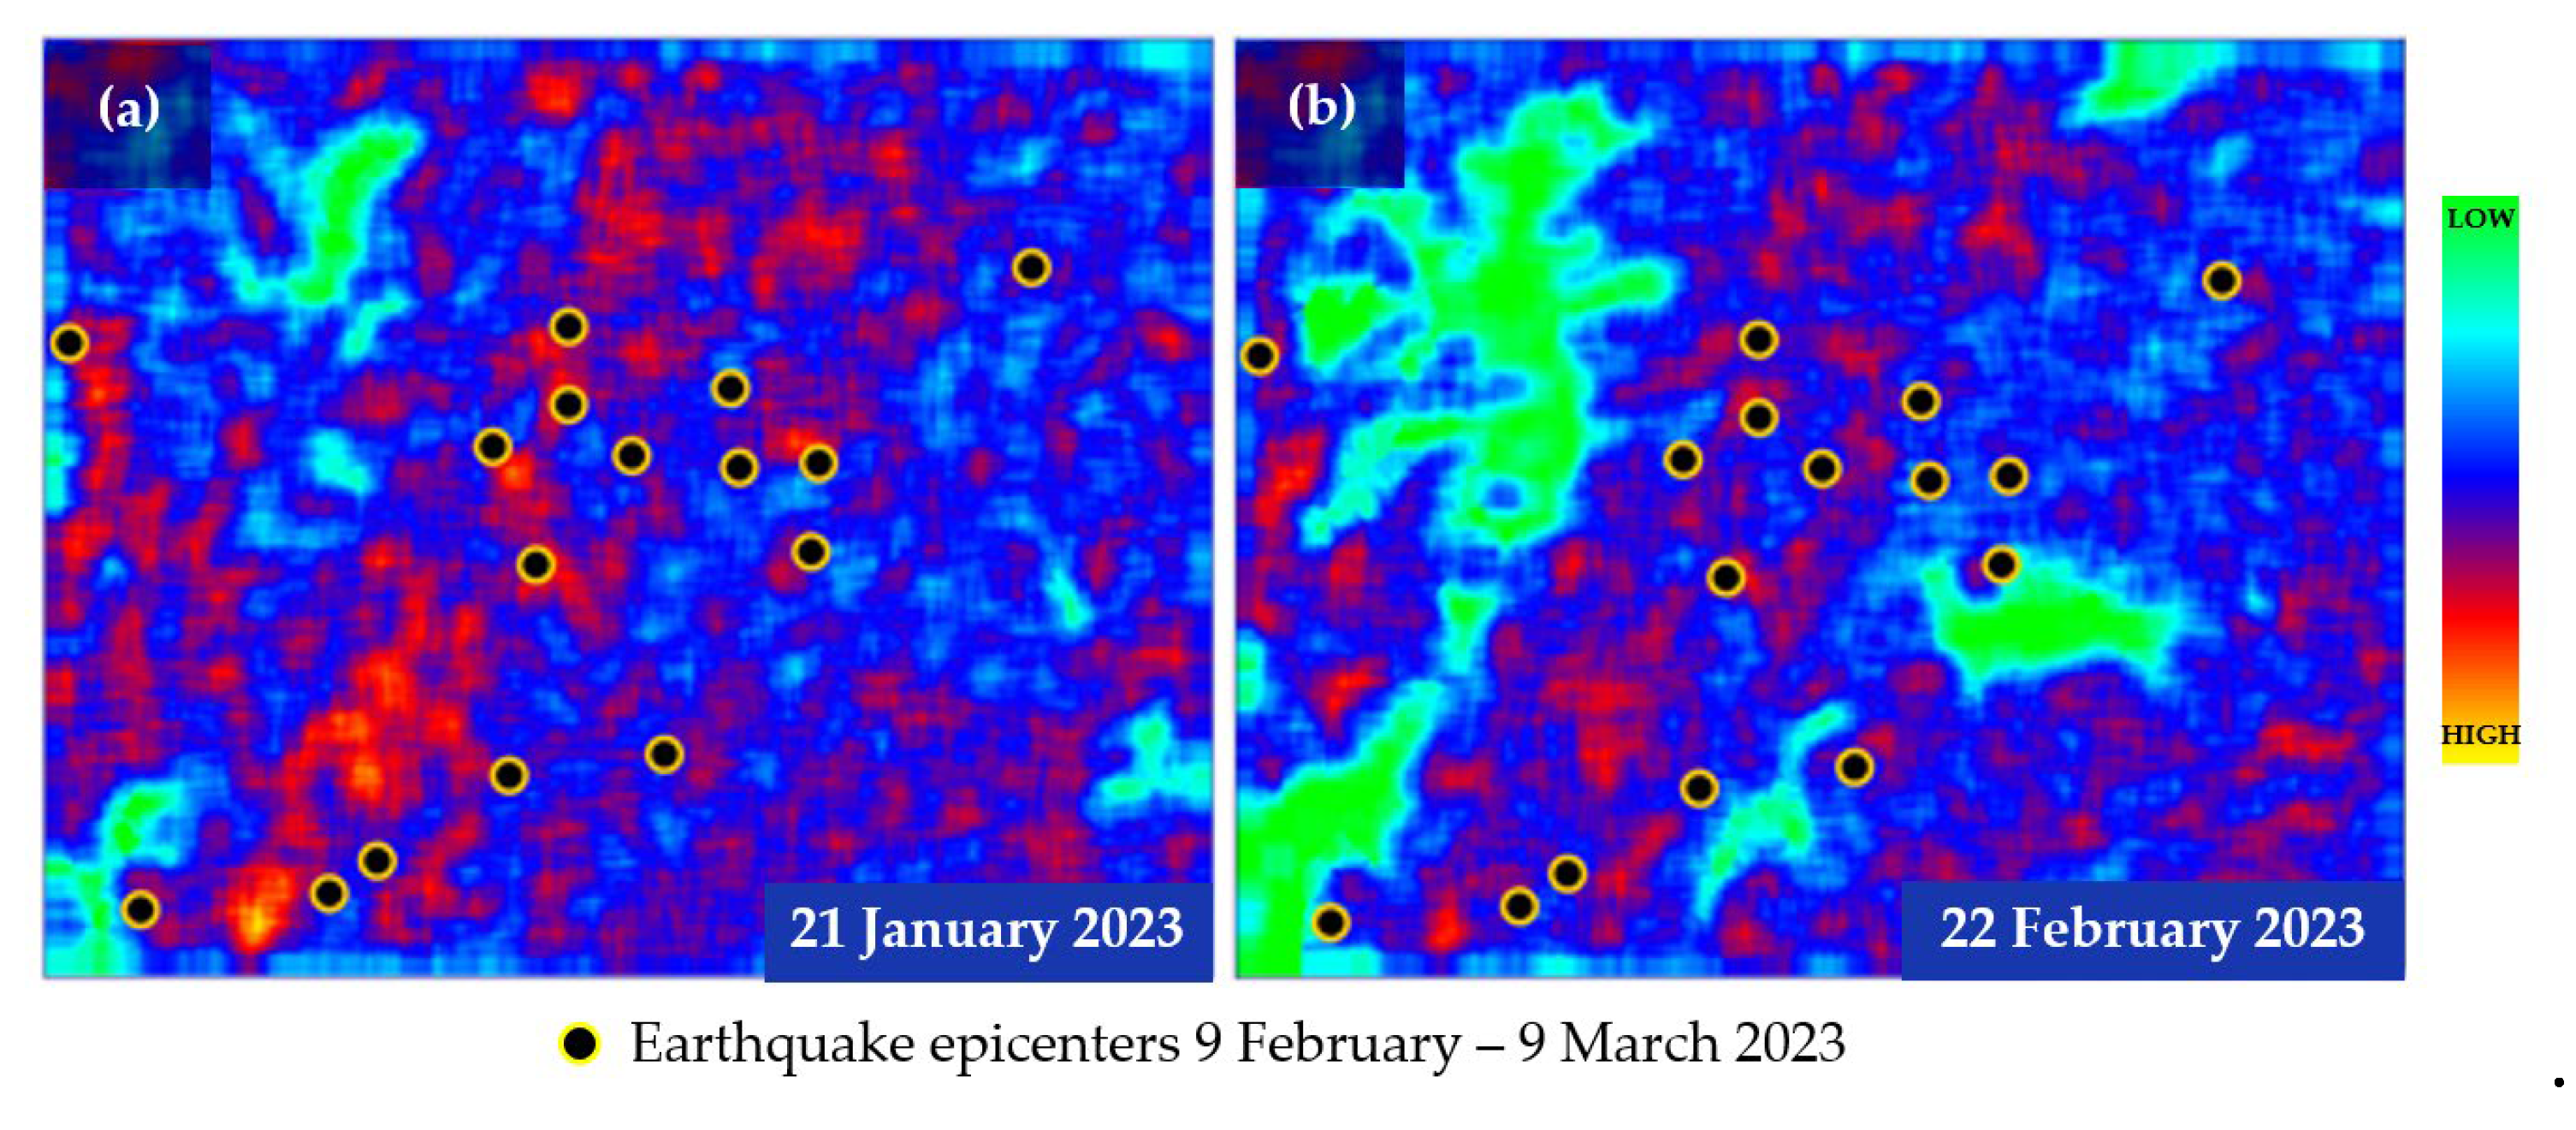
Figure 10.
LST values for images from (a) 21 January 2023 and (b) 24 January 2024; contrast boundaries concentrations at 0° and 90° azimuth for images from (c) 21 January 2023 and (d) 24 January 2024.
Figure 10.
LST values for images from (a) 21 January 2023 and (b) 24 January 2024; contrast boundaries concentrations at 0° and 90° azimuth for images from (c) 21 January 2023 and (d) 24 January 2024.
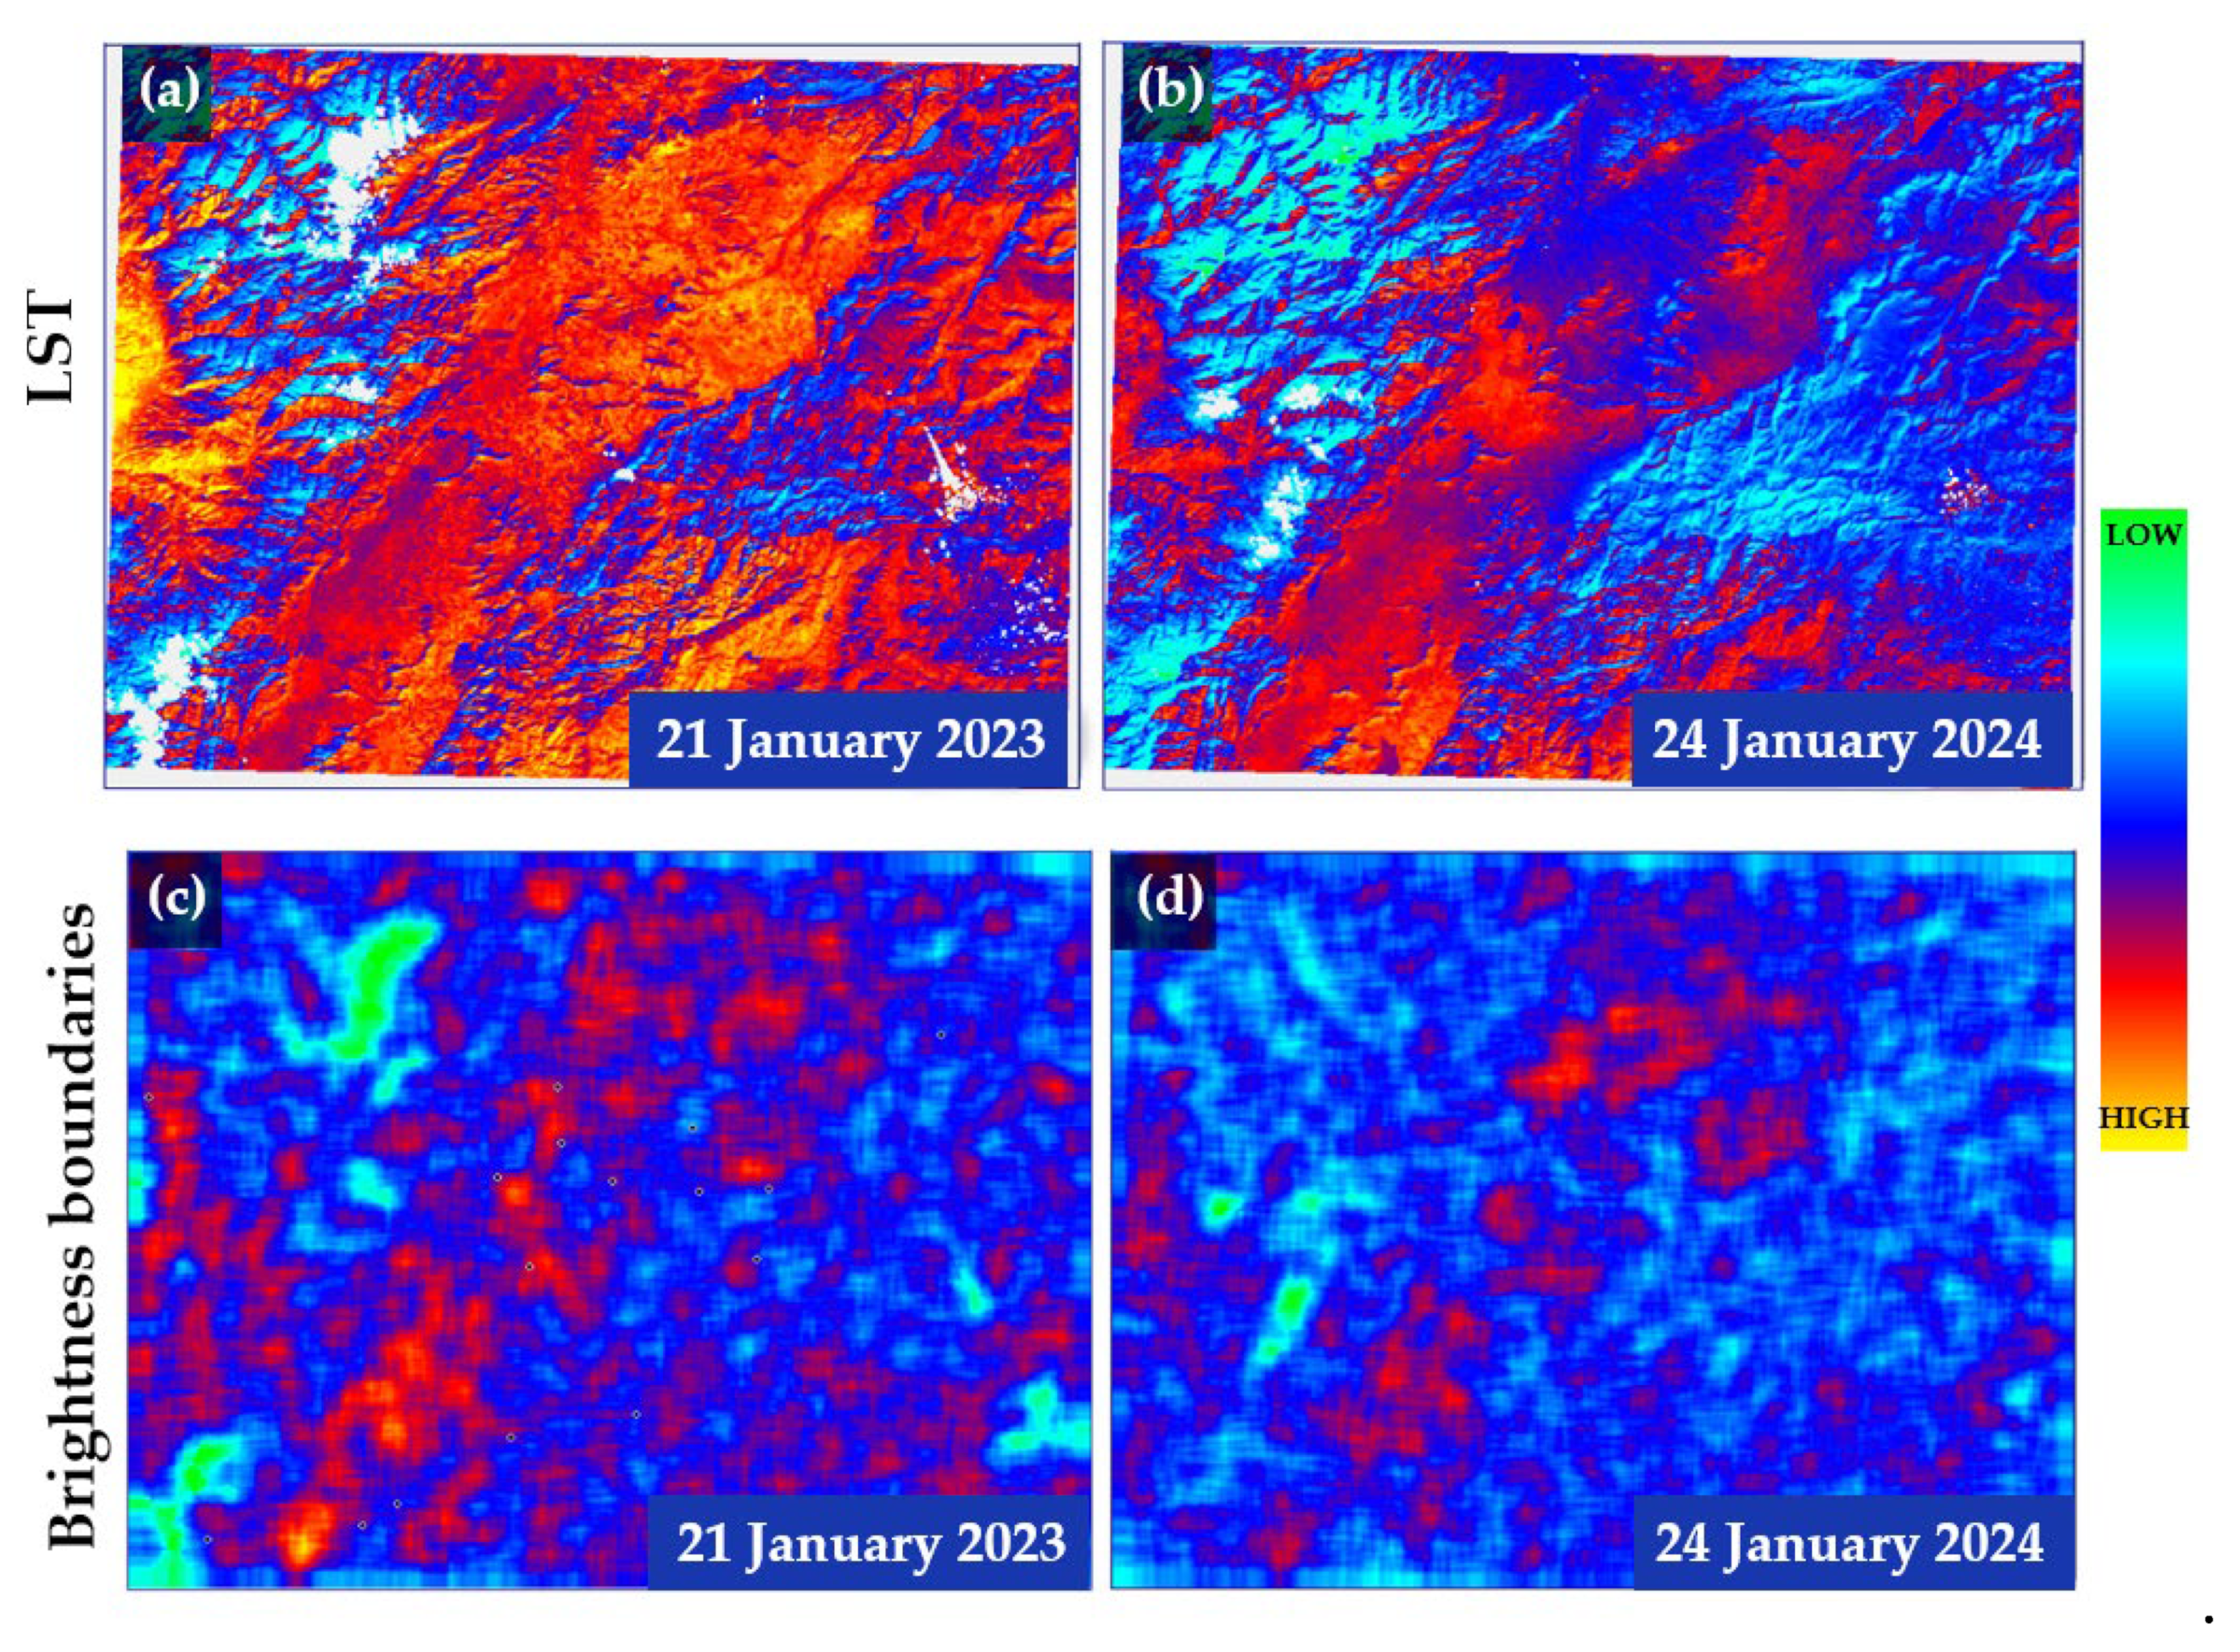

Table 1.
Landsat 8 image acquisition dates and ground temperature from nearest meteorological stations.
Table 1.
Landsat 8 image acquisition dates and ground temperature from nearest meteorological stations.
| Landsat 8 acquisition dates | Ground-based temperature (°C) | |
|---|---|---|
| IGAZIANT7 | OĞUZELI AIRPORT | |
| 24 January 2024 | 5.0 | 9.0 |
| 22 February 2023 | 10.1 | 12.0 |
| 21 January 2023 | 8.0 | 11.0 |
| 05 January 2023 | 11.2 | 10.0 |
| 02 November 2022 | 22.2 | 19.0 |
| 15 September 2022 | no data | 28.0 |
Disclaimer/Publisher’s Note: The statements, opinions and data contained in all publications are solely those of the individual author(s) and contributor(s) and not of MDPI and/or the editor(s). MDPI and/or the editor(s) disclaim responsibility for any injury to people or property resulting from any ideas, methods, instructions or products referred to in the content. |
© 2024 by the authors. Licensee MDPI, Basel, Switzerland. This article is an open access article distributed under the terms and conditions of the Creative Commons Attribution (CC BY) license (http://creativecommons.org/licenses/by/4.0/).
Copyright: This open access article is published under a Creative Commons CC BY 4.0 license, which permit the free download, distribution, and reuse, provided that the author and preprint are cited in any reuse.


