Submitted:
19 July 2024
Posted:
22 July 2024
You are already at the latest version
Abstract
This study investigated the effects of a ten-visit individual coordinative locomotor training (CLT) program, including both a hands-on and a hands-off approach, on static and dynamic trunk stability in healthy adults with sedentary occupations. During the ten-visit program, the performance of eight subjects was monitored using a modified one-leg stance test in the sprinter and skater position, the Y-balance test, and the scapula and ischial tuberosity control test in the four-legged position. The data were analyzed using parametric and nonparametric statistics at an overall level of significance α=0.05. In the one-leg stance test, all subjects achieved a maximum value of 60 s on all ten visits. The improvement over time in the Y-balance test results was statistically significant for all directions (p<0.001). In addition, a statistically significant improvement in the Y-balance test composite score was observed between the first and the last visit (p=0.015-0.041). Subject-specific patterns were observed in the results of the Y-balance test. Significant improvements were observed over time in the four-legged position test score (p=0.008-0.010). Overall, the CLT program led to a significant improvement in trunk stability and leg extension in the anterior and posterolateral directions, as well as a reduction in instability as determined by the composite score of the Y-balance test.
Keywords:
proprioceptive neuromuscular facilitation
; coordinative locomotor training
; sprinter
; skater
; trunk stability
; Y-balance test
; one-leg stance test
1. Introduction
The concept of coordinative locomotor training (CLT) is a therapeutic approach based on a similar technique known as proprioceptive neuromuscular facilitation (PNF) [1]. The concept is based on activating the whole body by utilizing the synergy of bilateral asymmetric PNF patterns in each movement [2]. CLT can be used as a rehabilitation treatment to restore the patient's stability, strength, and mobility, as well as to relieve pain. However, the use of CLT is not limited to rehabilitation, but can also be used with healthy people, e.g. athletes, to improve their performance [3,4,5,6]. There are both "hands-on" and "hands-off" approaches that offer a wide range of therapeutic possibilities and enable the patient to perform the exercises themselves following the therapist's initial instructions [1].
As CLT is a recently developed therapeutic concept that is constantly evolving, diverse terminology has been used in the literature for what is essentially the same therapeutic approach. Most terms reflect the similarity and overlap between PNF and CLT concepts, as the latter can be considered to have evolved from the former: Sprinter-Skater Patterns [7], Sprinter Patterns of PNF [8], PNF Combined Patterns [9], Combination Patterns Exercise of Proprioceptive Neuromuscular Facilitation [10], Combination of PNF Patterns for Coordinative Locomotor Training [11], Upper and Lower Limb Coordinated Exercise of PNF [12,13], Integrated Patterns of PNF [14], PNF Skater Pattern [15], Proprioceptive Neuromuscular Facilitation Integration Pattern [16], Coordinative Locomotion Training Using the PNF Pattern [17], Skater and Sprinter Combined Pattern in PNF [18], Skater and Sprinter Pattern [19], Upper and Lower Extremity Coordination Training [20]. Finally, in more recent literature, the term CLT [21,22,23,24,25,26,27,28] is used, reflecting the fact that the therapeutic approach has diverged enough from its parent concept (PNF) that it is referred to with its own, PNF-independent terminology.
The benefits of CLT have been studied in various populations, including patients with stroke [13,20,23,25,28,29,30,31], cancer [24], scoliosis [27,32], patients with hyperlordosis [33], spinal injuries [7,17], the elderly [12,16,21], obese women [34], children [35], baseball players [3], badminton players [4], archers [5], athletes [6], and healthy adults [18,36,37]. These studies have shown a number of positive effects on pain [16,38], posture [5,35], various parameters of gait [13,17,25], balance [18,19], muscle strength [37,38], fall factor [21,23], plantar foot pressure [36], etc. Overall, the effects of CLT have been studied much more extensively in patients with certain pathologies than in healthy adults.
Modern lifestyles with a lot of sitting at work for eight or more hours a day, additional sitting in transportation, lack of exercise in nature, etc. have a negative effect on posture and the static and dynamic stability of the body. The aim of this study was therefore to quantify the effects of a ten-visit individual CLT training program including both a hands-on and a hands-off approach, on static and dynamic trunk stability in healthy adults with sedentary occupations. For this purpose, a modified one-leg stance test in the sprinter and skater position, the Y-balance test, as well as the scapula and ischial tuberosity control test in the four-legged position were used. The null hypothesis was that there would be no change in the variables of the aforementioned tests over ten visits.
2. Materials and Methods
2.1. Test Subjects
The inclusion criteria for candidate selection were as follows: healthy adults (18+) employed in a sedentary work environment and voluntarily attending the private physical therapy center twice a week. Exclusion criteria for candidate selection were: acute orthopedic deficits and other acute health conditions. All subjects were familiarized with the study protocol and written informed consent was obtained. The study was conducted according to the guidelines of the Declaration of Helsinki and approved by the Ethics Committee of the Croatian Association for Proprioceptive Neuromuscular Facilitation, Rijeka, Croatia (No. 01-02/2023, approved February 25 2023).
Preliminary clinical observations were used to conduct a power analysis which indicated that in the self-controlled study design with ten repeated measurements of six Y-balance test variables (three directions, measured before and after training) as the main outcome variables performed throughout the CLT training, a sample size of n=8 would be sufficient to detect a statistically significant improvement of at least 10% from the baseline values at the significance level of α=0.05 and with a statistical power of over 80%. The study was designed as a case series involving eight subjects (seven females and one male) whose individual improvement in performance over time was presented descriptively, with pooled data of all subjects analyzed using inferential statistics. The age of the subjects ranged from 28-56 years (average: 43 years) and the body mass index ranged from 19.0-30.1 kg/m2 (average: 23.2 kg/m2).
2.2. Coordinative Locomotor Training (CLT) Exercises
The exercises were progressively structured according to the degrees of motor control [1]. The first part of the exercises consisted of a large support base with emphasis on static holding of a specific position with the aim of achieving stability and trunk control through key control points (ischial tuberosity and inferior angle of scapula). The gradual progression leads to a change in the position of the body in space and the movements of the individual segments with regard to the mobility of one limb in an open kinematic chain, while the posture of the rest of the body is controlled by the therapist through the application of resistance to key points or the moving segment. The third level of motor control involves controlled movements in a closed kinematic chain with simultaneous control over the rest of the body. Further progression leads to integration, i.e. the free execution of a specific action in complete harmony and synergy with the work of the rest of the body. All measurements and all exercises were performed barefoot. The training program consisted of 10 visits (2 visits per week over 5 weeks), with each training session lasting 30 minutes. The detailed training protocol can be found in Table 1.
At each visit, measurements were taken before and after the CLT exercises using a modified one-leg stance test, the Y-balance test, and a visual analog (VAS) pain scale, as shown in the flowchart in Figure 1. In addition to these tests, the four-legged position test was performed at the first and the last visit.
2.3. Modified One-Leg Stance Test
The standard one-leg stance test is performed in a standing position with the arms crossed over the chest [39]. The timing begins when the opposite leg lifts off the ground and ends when the leg is lowered or when the subject raises the arms to maintain balance. Otherwise, the timing is terminated after 60 s, which is considered the maximum score attainable for the test [40]. The standard form of this test was also used in previous studies on CLT and showed positive effects [24,35]. In the present study, a modified version of the one-leg stance test was used, which was based on different load distributions on the stance foot depending on changes in the posture [36]. The modified one-leg stance test involved standing on one leg in two basic CLT patterns, namely the sprinter and the skater pattern. Although the foot is in full contact with the ground in both patterns, the distribution of plantar pressure on the ground and the distribution of forces in the body varies depending on the position of the rest of the body [36]. In the sprinter pattern, the pressure is more on the toe side of the foot, while in the skater pattern, there is more pressure on the little finger side [1,36]. The testing is performed with bare feet to increase proprioceptive stimulation and awareness of the feet and reduce the false stability that can be obtained from the stabilizing support of footwear.
2.4. Y-Balance Test
At the first visit, each subject was demonstrated the Y-balance test. According to the standard protocol, each subject had to try each test direction 6 times in each direction to eliminate the effect of motor learning [41]. Only then was the first measurement taken. The measurements were performed according to the protocol recommended in the manufacturer's instructions. First, the anterior direction was measured for one leg and then for the other, then the posterolateral direction for the first and the other leg, and finally the posteromedial direction for one leg and then for the other. Each direction was performed three times in succession and the best result of the three trials was recorded [42]. The measurements were taken at each visit before and after the exercises. In addition to analyzing the scores achieved for each individual direction of the Y-balance test, the composite score for each leg was calculated as the sum of the three reach directions divided by three times the leg length, and expressed as a percentage [41].
2.5. Four-Legged Position Test
The test of scapular and ischial tuberosity control in the four-legged position was carried out as a combined exercise/test on the first and last visit. The subject's task is to maintain posterodepression of the scapula and ischial tuberosity of the supporting arm and leg throughout the test if the sprinter position is tested, or anterodepression of the scapula and ischial tuberosity of the supporting arm and leg if the skater position is tested [1]. The examiner applies resistance simultaneously to the inferior angulus of one arm and the ischial tuberosity of the opposite leg. The stability of the key points for the sprinter position is tested by applying resistance in the direction of anterolevation to activate the muscles responsible for performing posterodepression. The stability of the key points for the skater position is tested by applying resistance in the direction of posteroelevation direction to activate the muscles responsible for performing anterodepression. The test begins with the easiest position, i.e. with the load distributed on all four limbs, and then progresses to more difficult positions. In each position, the examiner applies resistance to key points three times for five seconds and notes the worst result from three trials.
The first position is a four-legged stance with all four limbs on the floor. The second position is more challenging as the subject must hold the position of the key points against the resistance using three supports on the floor while one limb moves in an open kinematic chain in the sprinter or skater pattern. All combinations of key points and movement patterns (sprinter/skater) are performed, i.e. each limb is eventually lifted from the floor. The third position is the most challenging and involves holding key points against a resistance with two supports on the floor while the other two limbs move in an open kinematic chain in the sprinter or skater pattern.
For the first and second position there are a total of 8 possible combinations (4 key points x 2 movement patterns, i.e. sprinter/skater), while for the third position there are 4 possible combinations (2 body diagonals x 2 movement patterns). To reduce the amount of data, for each position the result of the weakest key point is recorded as the most meaningful. In this way, each position is given a single value according to the scoring criteria explained in Table 2. Tremor is allowed and has no influence on the score given. However, trunk lateralization, holding on to the wall or touching the floor after the free limb has been lifted is not permitted and will result in a lower score.
2.6. Visual-Analog Scale (VAS) for Pain Evaluation
The level of pain was assessed by asking the subjects to rate the pain before and after the exercises using the visual-analog scale (VAS), with scores ranging from 0-10.
2.7. Statistical Analysis
Based on the data distributions analyzed with the Shapiro-Wilk test and normal Q-Q plots, it was decided whether parametric or nonparametric tests should be used. As the pseudo-interval data for the four-legged position test score showed significant departures from the normality assumption, a non-parametric Wilcoxon signed rank test for related samples was used to compare the values between the first and last visit. The extent of improvement in said scores (calculated as the difference between the last and the first visit) was compared between the three positions of the four-legged position test using the Kruskal-Wallis test for independent samples. A large amount of data collected with the Y-balance test including 960 individual data points (8 subjects x 10 visits x 2 legs x 3 directions x 2 measurement time points), was summarized into 12 variables created as combinations of 2 legs x 3 directions x 2 measurement time points. The data for these Y-balance test variables did not deviate significantly from the normal distribution and were therefore compared between the first and last visit using repeated measures analysis of variance (ANOVA). For the extent of improvement measured by the Y-balance test, comparisons were made among 12 combinations of (2 legs x 3 directions x 2 time points) using a one-way ANOVA. Tukey’s adjustment was used for multiple comparisons. The difference between the left and right leg in the Y-balance test, calculated as the absolute value of the difference between the results of the two legs, was compared between the first and last visit using repeated measures ANOVA. The result of the Y-balance test composite score was compared among 10 visits using a repeated measures ANOVA with Bonferroni adjustment for multiple comparisons. The overall significance level was set at α=0.05 for all analyzes. Statistical analysis was performed using SPSS, version 25.0 (IBM, Armonk, NY, USA).
3. Results
In the one-leg stance test, all subjects achieved a maximum value of 60 s on all ten visits. As the test protocol requires the test to end after 60 s, this means that all subjects reached the plateau value, making the variable basically non-discriminative and therefore no statistical comparisons were made. Similarly, no statistical comparisons were made for the results of the VAS pain scale, as all subjects reported “no pain” on all ten visits.
The three-dimensional bar charts in Figure 2 show the values measured with the Y-balance test for each of the subjects over their ten visits. The values measured for direction “1” were generally lower than the values for direction “2” and “3”. In addition, less improvement over time was observed for direction “1” than for the other two direction. Overall, the values measured in the Y-balance test gradually increased over the course of the ten visits, although there were differences among subjects. For example, while subjects 1, 2, 4, 5, and 6 showed a clearly visible increase in the measured values over the course of ten sessions, some subjects showed comparatively flatter patterns with less improvement (subject 3) and some subjects showed a more subtle trend of increase with a greater spread of data over ten sessions (subjects 7 and 8).
The results of the Y-balance test measured at the first and the last visit are compared in Figure 3a. The values for direction 1 were generally lower than the values for directions 2 and 3. The increase in Y-balance test results was statistically significant for all directions and both measurement times (before and after the exercises), with the exception of direction L1 measured before the exercises, which showed a marginally significant improvement (p=0.066). Figure 3b, which shows the extent of improvement in Y-balance test results, indicates that the interquartile ranges (Q1-Q3) were above zero for all directions and both measurement times, with the bottom 25% of the distributions spreading below zero for only 4 of 12 groups. The extent of improvement was mostly statistically similar across all 12 groups due to the combined effect of data scatter and the use of adjustment for multiple comparisons.
The results of the Y-balance test composite score over the ten visits are shown in Figure 4. An increasing pattern was observed for both legs at both measurement times (before and after the exercises). A statistically significant (p=0.015-0.041) increase was observed between the first and last visit. Pairwise comparisons with significance adjustment for multiple comparisons identified significant increases for several other combinations of measurement time points. As the statistical results of the individual pairwise comparisons varied due to the relative magnitudes of the mean difference and the data dispersion of the respective pair of time points, only the p-values for the comparison of the first and the last time point are shown for reasons of clarity.
By plotting the results of the Y-balance test composite score for each subject individually, subject-specific patterns can be observed (Figure 5). Despite different baseline values measured at the first visit (85.6-94.7%), four of the eight subjects (No. 1, 2, 4, and 5) achieved the composite score of about 100% at the last visit. One subject (No. 6) showed a clear trend towards an increase over ten visits, with lower final scores of 90.9-93.8% failed to surpass the 94% threshold. Three subjects (No. 3, 7, and 8) showed a noisy data pattern with no clear trend of increase over ten visits. However, in the latter two subjects (No. 7 and 8), the final scores were higher than the initial scores measured at the first visit, despite the noisy data in between.
The difference in Y-balance test values between the left and right leg (presented as absolute values to quantify the extent of imbalance regardless of direction) are shown in Figure 6. The data distributions were generally shifted towards lower values at the last visit than at the first visit, resulting in an overall statistically significant (p=0.035) difference between the last and first visit, i.e. when the values of all six directions and measurement times were pooled together. When each combination of direction and measurement time point was considered individually, the decrease for direction 3 after the exercises was identified as statistically significant (p=0.041).
Figure 7a shows how the scores on the four-legged position test changed between the first and the last visit. On the first visit, the score decreased in the following order: 4 supports > 3 supports > 2 supports. The statistically significant improvement between the first and the last visit was observed for 3 supports and 2 supports, while the increase observed for 4 supports can be considered marginally significant (p=0.063). The extent of improvement is shown in Figure 7b, which shows that all improvements were statistically similar. Nevertheless, higher improvements can be observed for 3 and 2 supports than for 4 supports.
4. Discussion
The CLT exercise program investigated in the present study was developed empirically and is based on clinical experience with healthy adults who have provided positive feedback over the past several years that it has been offered as an optional program for healthy adults at the physical therapy center. The positive feedback from clients and anecdotal evidence collected from therapists about the benefits of the program were the motivation for the present study. In this context, the study was designed to quantify the benefits of the empirically designed training protocol without attempting to evaluate separately individual factors of the protocol, such as the position, movement pattern, technique, the choice of hands-off or hands-on approach, etc. The protocol was designed primarily for healthy, non-athletic adults, follows degrees of motor control, involves changes in the subject's position, and progressively increases in difficulty. The progression went in several directions: by changing the position from a larger support surface to a standing position, by additional loading with elastic bands and by increasing the level of activity according to the degrees of motor control. During the first visits, the focus was on the level of stabilization, then on the level of linking and then on the level of controlling, up to integration through walking activities, which took place during the last two visits. All stages of progression were combined to achieve a higher load. The use of such an integrated CLT program differs from most other studies in which specific movement patterns or positions were used in isolation [20,27,30,35,38,43]. Furthermore, the present study focused on a general population of non-athletic adults, in contrast to most studies that focus on specific subgroups of either athletes [3,5,6,43] or patients with a particular pathology [17,24,30,44].
All subjects were long-term clients of the physical therapy center where this study was conducted. All were healthy adults whose jobs were predominantly sedentary and who spent 8-12 hours per day at work. Prior to the present study, all subjects attended the center regularly for at least twelve months, twice a week for 30 minutes of individual training, which was essentially a routine “fitness” program for healthy clients offered by the physical therapy center. It was found that although they were exercising regularly, they had poor balance and relatively low awareness of their bodies and consequently showed poor body control when performing the standard “fitness” exercises. It can be assumed that they had reached their performance plateau with the current training program and made little or no further progress in stability or body control over time. This condition ensured a constant baseline performance and allowed for a repeated measures design where each subject was their own “control” to measure progress over time. This resulted in high statistical power despite the small sample size, with null hypothesis being rejected for the two main measures of progress, namely the Y-balance test score and four-legged position score.
The standard for the one-leg stance test is to measure the time the subject is able to hold the position, up to a maximum of 60 s. After reaching 60 s, the time measurement is stopped and it is assumed that the subject has reached the maximum score [40]. As this was the case for all subjects and at all time points in the present study, there were no quantitative differences in the one-leg stance test. However, qualitative differences were noted by both the investigator and the subjects. These qualitative observations, which were not captured by the standard variable of the test, i.e. the timing of the stance, included higher instability and visible tremor while performing the sprinter/skater pattern, weight shift on the stance foot in the mesio-lateral or antero-posterior direction, and fatigue after performing the test. All of these phenomena were most pronounced on the first few visits and became less noticeable on subsequent visits as subjects gained better awareness of their key points and were better able to maintain stability without shifting body weight and adjusting limb positions to compensate for instability.
The most notable effects of the CLT program investigated in the present study were seen in the results of the Y-balance test. Despite individual differences in both the initial Y-balance test performance and the extent of improvement over ten visits (Figure 2), an overall statistically significant improvement was found for all directions (Figure 3a). Considering the amount and direction of change in the Y-balance test score between the last and the first visit (Figure 3b), most changes were in the positive direction (i.e. higher scores at the last visit), with only several datapoints showing negative values, particularly for direction L1. Although the extent of improvement was statistically similar for all directions, it was lower for directions D1 and L1 compared to the other directions (D2, D3, L2, and L3). This result is consistent with directions D1 and L1 generally having lower values than the other directions at all time points (Figure 2 and Figure 3a), which is in turn related to the general mechanics of the Y-balance test, where the anterior directions (D1 and L1) are more difficult to reach than the lateral directions (D2, D3, L2 and L3) [45].
In addition to the significant improvements in the Y-balance test results for the individual directions (Figure 3a), the composite score of the Y-balance test showed a statistically significant improvement over the course of ten visits (Figure 4). The composite score is calculated by considering all three directions of the Y-balance test, normalizing their sum to the length of the respective leg, and expressing the obtained "composite" value as a percentage [41]. In the literature, composite score values below 94% are cited as an indication of an increased risk of injury due to instability [42]. In the present study, all eight subjects initially had values below the threshold of 94% (range: 71-93%), while at the final visit half of them (four out of eight) improved enough to surpass the threshold (Figure 5). The comparatively poorest performance in the Y-balance test for the composite score (Figure 5) and for the scores in each individual direction (Figure 2) observed in subjects 3, 7, and 8 could be related to their age, as they were the oldest subjects in the study at the age of 53, 56 and 51 years, respectively. In addition to the composite score, a difference in the Y-balance test value between the two legs in the anterior direction (absolute value of L1-D1) of more than 4 cm has been described in the literature as an indication of injury risk [41]. According to this criterion, only one subject had an increased risk of injury, as the difference between the legs in the anterior direction was 5 cm. After ten CLT training visits, all subjects were below the 4 cm threshold (Figure 6).
The four-legged position test is based on a CLT exercise that was modified to simultaneously collect data on the degree of control of key points during the execution of the exercise [1]. The first author of the present study developed a simple scoring system in which a score between 0 and 3 is assigned for each position according to a set of predefined criteria (Table 2) to facilitate the monitoring of patient progress in daily clinical practice. The scoring system is introduced in the present study as a simple and time-effective means of measuring the level of key point control. The main advantage is that the scoring is integrated into the routinely performed exercises, which means that no additional time needs to be spent on the test itself.
Between the first and last visit, a statistically significant difference was found in the test results for the four-legged position in the three-support and two-support positions, indicating an improvement in stability in these more difficult positions (Figure 7a). In the easiest position (with four supports), most subjects already had a high score at the beginning, which, together with the score of three as the highest possible score, did not leave much room for improvement and therefore led to a lower extent of improvement that was only marginally significant (p=0.063). Nevertheless, it should be noted that at the first visit a wide range of scores (1-3) were measured for the four-support position, while at the last visit all subjects achieved the maximum possible score of 3. Despite the lack of formal statistical significance (or the consideration of significance as marginal), such a complete loss of data dispersion clearly indicates an improvement in key point control. When the extents of the improvement were statistically compared (Figure 7b), they were similar among all three positions. However, the greatest improvement was observed in the two more difficult positions compared to the easiest position (on four supports). This is due to the fact that in the latter position, the initial score was already close to the maximum possible score.
The present study is unique in that it uses the Y-balance test and the self-developed four-legged position test as simple and cost-effective means to track progress in trunk stability during the ten-visit CLT program for healthy adults. While the use of these tests to evaluate the effects of CLT exercise has not been reported in the literature, one study used the star excursion balance test (SEBT), which can be considered a variation of the Y-balance test based on similar movement patterns, but quantifying the time required to change direction instead of the length of the reach [24]. Although the mechanics of SEBT are similar to those of the Y-balance test [46], the outcome variable of SEBT (time to execution) used in the above study [24] cannot be directly compared to the outcome variable of the Y-balance test (length of reach) in our study, apart from noting that an improvement in trunk balance was demonstrated in both studies.
In general, multiple previous studies have reported an improvement in trunk stability after CLT exercises [5,8,12,13,16,20,22,23,24,38,44,47], but methodological heterogeneity makes a direct comparison of the results difficult. Exercise protocols differed significantly across studies, as did the variables used to monitor patient performance. For example, the frequency of visits varied from daily [35], five times per week [17,43], three times per week [24,26,38,44] to twice per week [30]. The duration of the exercise program also varied widely, with reports of two weeks [24], 4-6 weeks [17,26,27,30,44,48], and 8 weeks [43]. Treatment duration varied between a few minutes [47], 30 minutes [17,24,38,43] or 50 minutes [27,32]. Some programs included distinct warm-up, strengthening, and cool-down phases [6,27,32,34,35], while others additionally included a home exercise, e.g., community walk [30]. Some studies used only selected movement patterns (e.g. sprinter and skater) [27,30,35,38,43,47], others used only specific positions (standing and four-legged) [47], while different combinations of positions were also reported [20,27,30,35,38]. In some studies, the progression in difficulty was made by increasing the number of sets and subsequently the duration of the exercise [4,22,43]. The exercises were performed in a group [21], with elastic bands to increase the level of difficulty [3,20,49], with the hands-off approach [18,26] or as self-exercise [47]. The study designs varied from case reports [7,30,50] to case series [24,27,32,35] and randomized clinical trials [3,17,43,49]. In general, the exercise programs and measurement tools in the different studies were selected according to the specific research questions and populations of interest, leading to extreme inter-study heterogeneity and making direct comparisons among different studies virtually impossible. Nevertheless, most of the published studies have shown a benefit of CLT in terms of improvement of relevant variables, regardless of study design and exercise program. Notwithstanding the possible role of publication bias in such pronounced positive results of a still developing technique in populations with different pathologies, the present study complements these reports by demonstrating the benefits of the CLT program in healthy adults who voluntarily attended the program as a substitute for their regular “fitness” routine.
The limitations of the present study are that all participants were recruited from a single private physiotherapy center and the gender asymmetry, as 7/8 of the participants were female. Although the benefits of the integrated, empirically developed CLT program were shown to be statistically significant in the present study, larger studies, preferably with full factorial models, should follow to evaluate the effects of the individual factors of CLT exercises. Since it was assumed that the age of the subjects is a possible confounding factor leading to individually different responses to the CLT program, it was not possible to statistically evaluate its effect due to the small sample size. Finally, despite a significant improvement over the course of the 10 training sessions, the retention of improved performance over time was not assessed and could be investigated in future studies.
5. Conclusions
The present study demonstrated the benefits of a ten-session coordinative locomotor training program for healthy adults in terms of significantly improved trunk stability, greater range of leg extension in the anterior and posterolateral directions, and reduced risk of injury due to instability as determined by the composite score of the Y-balance test.
Author Contributions
Conceptualization, Martina Par, Gordana Pošćić and Britta Dietz; Data curation, Matej Par; Formal analysis, Matej Par; Investigation, Martina Par; Methodology, Martina Par and Gordana Pošćić; Project administration, Matej Par; Software, Matej Par; Supervision, Gordana Pošćić and Britta Dietz; Validation, Matej Par; Visualization, Matej Par; Writing – original draft, Martina Par; Writing – review & editing, Gordana Pošćić, Britta Dietz and Matej Par.
Funding
This research received no external funding.
Institutional Review Board Statement
The study was conducted in accordance with the Declaration of Helsinki, and approved by the Ethics Committee of the Croatian Association for Proprioceptive Neuromuscular Facilitation, Rijeka, Croatia (protocol code 01-02-2003, date of approval: February 25 2023).
Informed Consent Statement
Informed consent was obtained from all subjects involved in the study. Written informed consent has been obtained from the patients to publish this paper.
Data Availability Statement
Anonymized data is available from corresponding author on request.
Acknowledgments
Many thanks to Gramamed Private Practice for Physiotherapy for providing the premises and test subjects for this study.
Conflicts of Interest
The authors declare no conflicts of interest.
References
- Dietz, B. PNF in Lokomotion; Springer Berlin Heidelberg: Berlin, Heidelberg, 2018; ISBN 978-3-642-27665-1.
- Jochim-Lauth, B.; Ritter, K. Komplexe Patternaddition–Coordinative Locomotor Training by Britta Dietz. Physiopraxis 2023, 21, 42–43. [CrossRef]
- Lee, H. The Effects of Coordinative Locomotor Training Using Elastic Band on Dynamic Balance and Grip Strength in Elementary School Baseball Player. Phys. Ther. Rehabil. Sci. 2021, 10, 414–420. [CrossRef]
- Kim, T.; Kim, S. The Effects of a Coordinative Locomotor Training Program on the Functional Movement Screen Scores of Badminton Players. J. Korea Proprioceptive Neuromuscul. Facil. Assoc. 2016, 14, 23–32. [CrossRef]
- Kim, J. The Effect of Balance Exercise on Postural Control and Shooting Record in Archers. Korean J. Sport Biomech. 2008, 18, 65–74. [CrossRef]
- Lee, K.; Kim, S. The Effects of Combined Training on the Physical Fitness of Male Short Distance Athletes-A Case Study. J. Korea Proprioceptive Neuromuscul. Facil. Assoc. 2019, 17, 177–187. [CrossRef]
- Kim, T.-Y. The Effect of Strengthening Exercise Using the Sprinter/Skater Patterns. J. Korean Proprioceptive Neuromuscul. Facil. Assoc. 2006, 4, 71–79.
- Jeong, W.-S.; Jeong, J.-Y.; Kim, C.-K.; Jung, D.-I.; Kim, K.-Y. Effect of Lower Limb Muscle Activity on Balancing through Sprinter Patterns of PNF. J. Korea Contents Assoc. 2011, 11, 281–292. [CrossRef]
- Ann, Y.D.; Jong, H.P. The Effects of PNF Combined Patterns Training on Balance Ability and Functional Ability of Hockey Players. J. Digit. Converg. 2013, 11, 521–528.
- Jeon, J.-K. The Effects of Combination Patterns Exercise of Proprioceptive Neuromuscular Facilitation on Balance in Chronic Low Back Pain Elderly Patients. J. Digit. Converg. 2013, 11, 361–368.
- Lim, J.-H.; Lee, M.-K.; Kim, T.-Y.; Ko, H.-E. The Combination of PNF Patterns for Coordinative Locomotor Training. J. Korean Proprioceptive Neuromuscul. Facil. Assoc. 2013, 11, 17–25.
- Cho, H.-S.; Shin, H.-S.; Bang, D.-H. The Effects of Upper and Lower Limb Coordinated Exercise of PNF for Balance in Elderly Woman. J. Korea Proprioceptive Neuromuscul. Facil. Assoc. 2015, 13, 189–196.
- Cho, H.-S.; Cha, H.-G.; Shin, H.-S. The Effects of PNF Upper- and Lower Limb Coordinated Exercise on the Balancing and Walking-Abilities in Stroke Patients. J. Korea Proprioceptive Neuromuscul. Facil. Assoc. 2017, 15, 27–33. [CrossRef]
- Choi, J.-W.; Hwang, S.-P. A Comparison between Integrated Patterns of PNF and Bowling Exercises. J. Korea Proprioceptive Neuromuscul. Facil. Assoc. 2015, 13, 89–93. [CrossRef]
- Choi, W.; Seo, T. The Effects of PNF Skater Pattern on the Balance in Stroke Patients. J. Korea Entertain. Ind. Assoc. 2015, 9, 289–298. [CrossRef]
- Kim, J.; Choi, W.; Seo, T. Effect of Proprioceptive Neuromuscular Facilitation Integration Pattern and Swiss Ball Training on Pain and Balance in Elderly Patients with Chronic Back Pain. J. Phys. Ther. Sci. 2015, 27, 3237–3240. [CrossRef]
- Hwang, S.; Maeng, G.; Kim, J.; Jung, C. The Effects of Coordinative Locomotion Training Using the PNF Pattern on Walking in Patients with Spinal Cord Injury. J. Korea Proprioceptive Neuromuscul. Facil. Assoc. 2016, 14, 67–74. [CrossRef]
- Kim, Y.; Lee, H. Effects of Skater and Sprinter Combined Pattern in PNF on Muscle Contraction Onset Time and Muscle Activation of Trunk Muscle. Arch. Orthop. Sports Phys. Ther. 2018, 14, 55–64. [CrossRef]
- Pyo, A.; Kim, S.; Kim, T.; Na, E.; Eom, M.; Jeon, Y.; Jo, E.; Jo, H.; Kim, J. Changes of Dynamic Balance and Flexibility after Skater and Sprinter Pattern. J. Korean Clin. Health Sci. 2016, 4, 644–651. [CrossRef]
- Kim, H.; Choi, J.; Cho, Y. The Effect of Upper and Lower Extremity Coordination Training with Elastic Band on Balance and Functional Ability for Chronic Stroke Patients. J. Korea Proprioceptive Neuromuscul. Facil. Assoc. 2019, 17, 119–127. [CrossRef]
- Park, M.; Lee, D.; Jeong, M. The Effect of Coordinative Locomotor Training on Physical Factors for Falls in the Elderly with Mild Cognitive Impairment. Korean Soc. Phys. Med. 2020, 15, 65–73. [CrossRef]
- Cho, W.; Park, S.; Choi, A. The Effect of Coordinative Locomotor Training with Elastic Band on Balance and Flexibility in Elementary School Baseball Players. J. Korea Converg. Soc. 2019, 10, 261–266.
- Ko, H.; Song, H.; Jeon, B. Effects of Functional Taping and CLT Program on the Fall Efficacy and Balance of Stroke Patients with Knee Pain on the Non-Affected Side. J. Korea Proprioceptive Neuromuscul. Facil. Assoc. 2016, 14, 203–208. [CrossRef]
- Hwang, J.; Park, J.; Lim, J. Effects of Coordinative Locomotor Training Program on Low Extremity Strength, Balance and Quality of Life in Patients with Cancer: Single-Subject Design. J. Korean Soc. Phys. Med. 2017, 12, 47–59. [CrossRef]
- Kim, J.; Lim, J. The Effects of Coordinative Locomotor Training on Coordination and Gait in Chronic Stroke Patients: A Randomized Controlled Pilot Trial. J. Exerc. Rehabil. 2018, 14, 1010–1016. [CrossRef]
- Lim, J.; Jang, H.; Cho, W.; Park, S. The Effects of Coordinative Locomotor Training Combined with Climbing on the Trunk Muscles in Adults. J. Korea Proprioceptive Neuromuscul. Facil. Assoc. 2018, 16, 397–404. [CrossRef]
- Kim, J.; Kim, T.; Lee, J. Effect of Coordinative Locomotor Training on Balance and Plantar Foot Pressure in Scoliosis Patients -A Single Subject Study. J. Korea Proprioceptive Neuromuscul. Facil. Assoc. 2017, 15, 227–236. [CrossRef]
- Lim, J.; Park, S. The Effects of Coordinative Locomotor Training on Balance in Patients with Chronic Stroke: Meta-Analysis of Studies in Korea. J. Korean Phys. Ther. Sci. 2020, 27, 36–47. [CrossRef]
- Lee, S.; Bae, S.; Kim, K. The Effect of Pressure Belt during PNF Sprinter Pattern Training Using Thera-Band on Leg Muscle Strength and Gait in Stroke Patients: One-Group Pretest-Post Test Design. J. Korean Acad. Orthop. Man. Phys. Ther. 2021, 27, 63–73.
- Kim, J.; Lee, M.; Lee, J.; Ko, H. The Effect of Coordinative Locomotor Training on Walking in a Chronic Stroke Patient-A Single Subject Design. J. Korea Proprioceptive Neuromuscul. Facil. Assoc. 2018, 16, 7–17. [CrossRef]
- Kim, K.; Lee, D.; Jung, S. Effect of Coordination Movement Using the PNF Pattern Underwater on the Balance and Gait of Stroke Patients. J. Phys. Ther. Sci. 2015, 27, 3699–3701. [CrossRef]
- Kim, J.; Oh, E. Effect of Coordinative Locomotor Training on Spine Appearance and Quality of Life in Patients with Idiopathic Scoliosis: Single Subject Study. Korean Soc. Phys. Med. 2021, 16, 89–97. [CrossRef]
- Lee, S.; Kim, H.; Jung, J.; Lee, S. Immediate Effects of Sprinter-Pattern Exercise on the Lordotic Curve and Abdominal Muscle Activity in Individuals with Hyperlordosis. Medicina (Mex.) 2023, 59, 2177. [CrossRef]
- Noh, H.; Kim, S. Comparative Study on the Effects of Proprioceptive Neuromuscular Facilitation and Elastic Band Exercise on the Physical Function and Blood Lipid Levels of Obese Elderly Women. Phys. Ther. Korea 2015, 22, 79–92. [CrossRef]
- Lee, J.; Kim, J. Effect of Coordinative Locomotor Training on Postural Imbalance and Gait in Children: A Single Subject Design. J. Korean Soc. Phys. Med. 2019, 14, 63–71. [CrossRef]
- Lim, J.; Kuk, E.; Kim, J. Change of Foot Pressure Distributions on Stance Leg during Coordinative Locomotor Training in Healthy Adults. Korean Soc. Phys. Med. 2023, 18, 59–66. [CrossRef]
- Kim, G.; Yi, D.; Yim, J. Effect of Sprinter Pattern Bridging Exercise Using Theraband on Activation of Lower Extremity and Abdominal Muscle. Phys. Ther. Rehabil. Sci. 2021, 10, 244–250. [CrossRef]
- Lee, H. The Effect of Coordinative Locomotor Training Using Elastic Band on Pain, Muscle Strength, Dynamic Balance and Muscle Activity of Female College Students with Patellofemoral Pain Syndrome. J. Korean Phys. Ther. Sci. 2023, 30, 59–71. [CrossRef]
- Springer, B.A.; Marin, R.; Cyhan, T.; Roberts, H.; Gill, N.W. Normative Values for the Unipedal Stance Test with Eyes Open and Closed. J. Geriatr. Phys. Ther. 2007, 30, 8–15. [CrossRef]
- Michikawa, T.; Nishiwaki, Y.; Takebayashi, T.; Toyama, Y. One-Leg Standing Test for Elderly Populations. J. Orthop. Sci. 2009, 14, 675–685. [CrossRef]
- Fratti Neves, L.; Quadros de Suoza, C.; Martins Picasso, C. The Y Balance Test – How and Why to Do It? Int. Phys. Med. Rehabil. J. 2017, 2. [CrossRef]
- Hébert-Losier, K. Clinical Implications of Hand Position and Lower Limb Length Measurement Method on Y-Balance Test Scores and Interpretations. J. Athl. Train. 2017, 52, 910–917. [CrossRef]
- Park, S.; Park, C.; Kim, Y. The Effects of Coordinative Locomotor Training with Elastic Bands on the Body Alignment of Elementary School Baseball Players. J. Korea Proprioceptive Neuromuscul. Facil. Assoc. 2019, 17, 411–419. [CrossRef]
- Ko, H.; Jeon, B.; Song, H. Effects of Coordinative Locomotor Training Program on Balance and Gait of Stroke Patients. J. Korea Proprioceptive Neuromuscul. Facil. Assoc. 2017, 15, 247–252. [CrossRef]
- Alnahdi, A.H.; Alderaa, A.A.; Aldali, A.Z.; Alsobayel, H. Reference Values for the Y Balance Test and the Lower Extremity Functional Scale in Young Healthy Adults. J. Phys. Ther. Sci. 2015, 27, 3917–3921. [CrossRef]
- Plisky, P.J.; Gorman, P.P.; Butler, R.J.; Kiesel, K.B.; Underwood, F.B.; Elkins, B. The Reliability of an Instrumented Device for Measuring Components of the Star Excursion Balance Test. North Am. J. Sports Phys. Ther. NAJSPT 2009, 4, 92–99.
- Choi, J.; Kim, Y.; Lee, S. The Effects of the Combined Patterns of Proprioceptive Neuromuscular Facilitation on Static Balance. J. Korea Proprioceptive Neuromuscul. Facil. Assoc. 2008, 6, 1–2.
- Kim, S.; Yu, S.; Park, S. Effect of CLT and Sling Exercise Combined Program on Knee Pain in Patellofemoral Pain Patient: A Single-Subject Study. J. Korean Acad. Orthop. Man. Phys. Ther. 2019, 25, 73–81.
- Jeong, M. The Effect of Coordinative Locomotor Training Using Elastic Bands on the Flexibility and Body Alignment of Elementary School Right-Handed Baseball Players. J. Korean Phys. Ther. 2021, 33, 217–223.
- Lee, J.; Kim, J. The Coordinative Locomotor Training Intervention Strategy Using the Icf Tool to Improve the Standing Posture in Scoliosis: A Case Report. J. Korean Phys. Ther. 2021, 33, 7–15. [CrossRef]
Figure 1.
Flowchart of the study protocol, with exercises (red) and tests (green and blue).
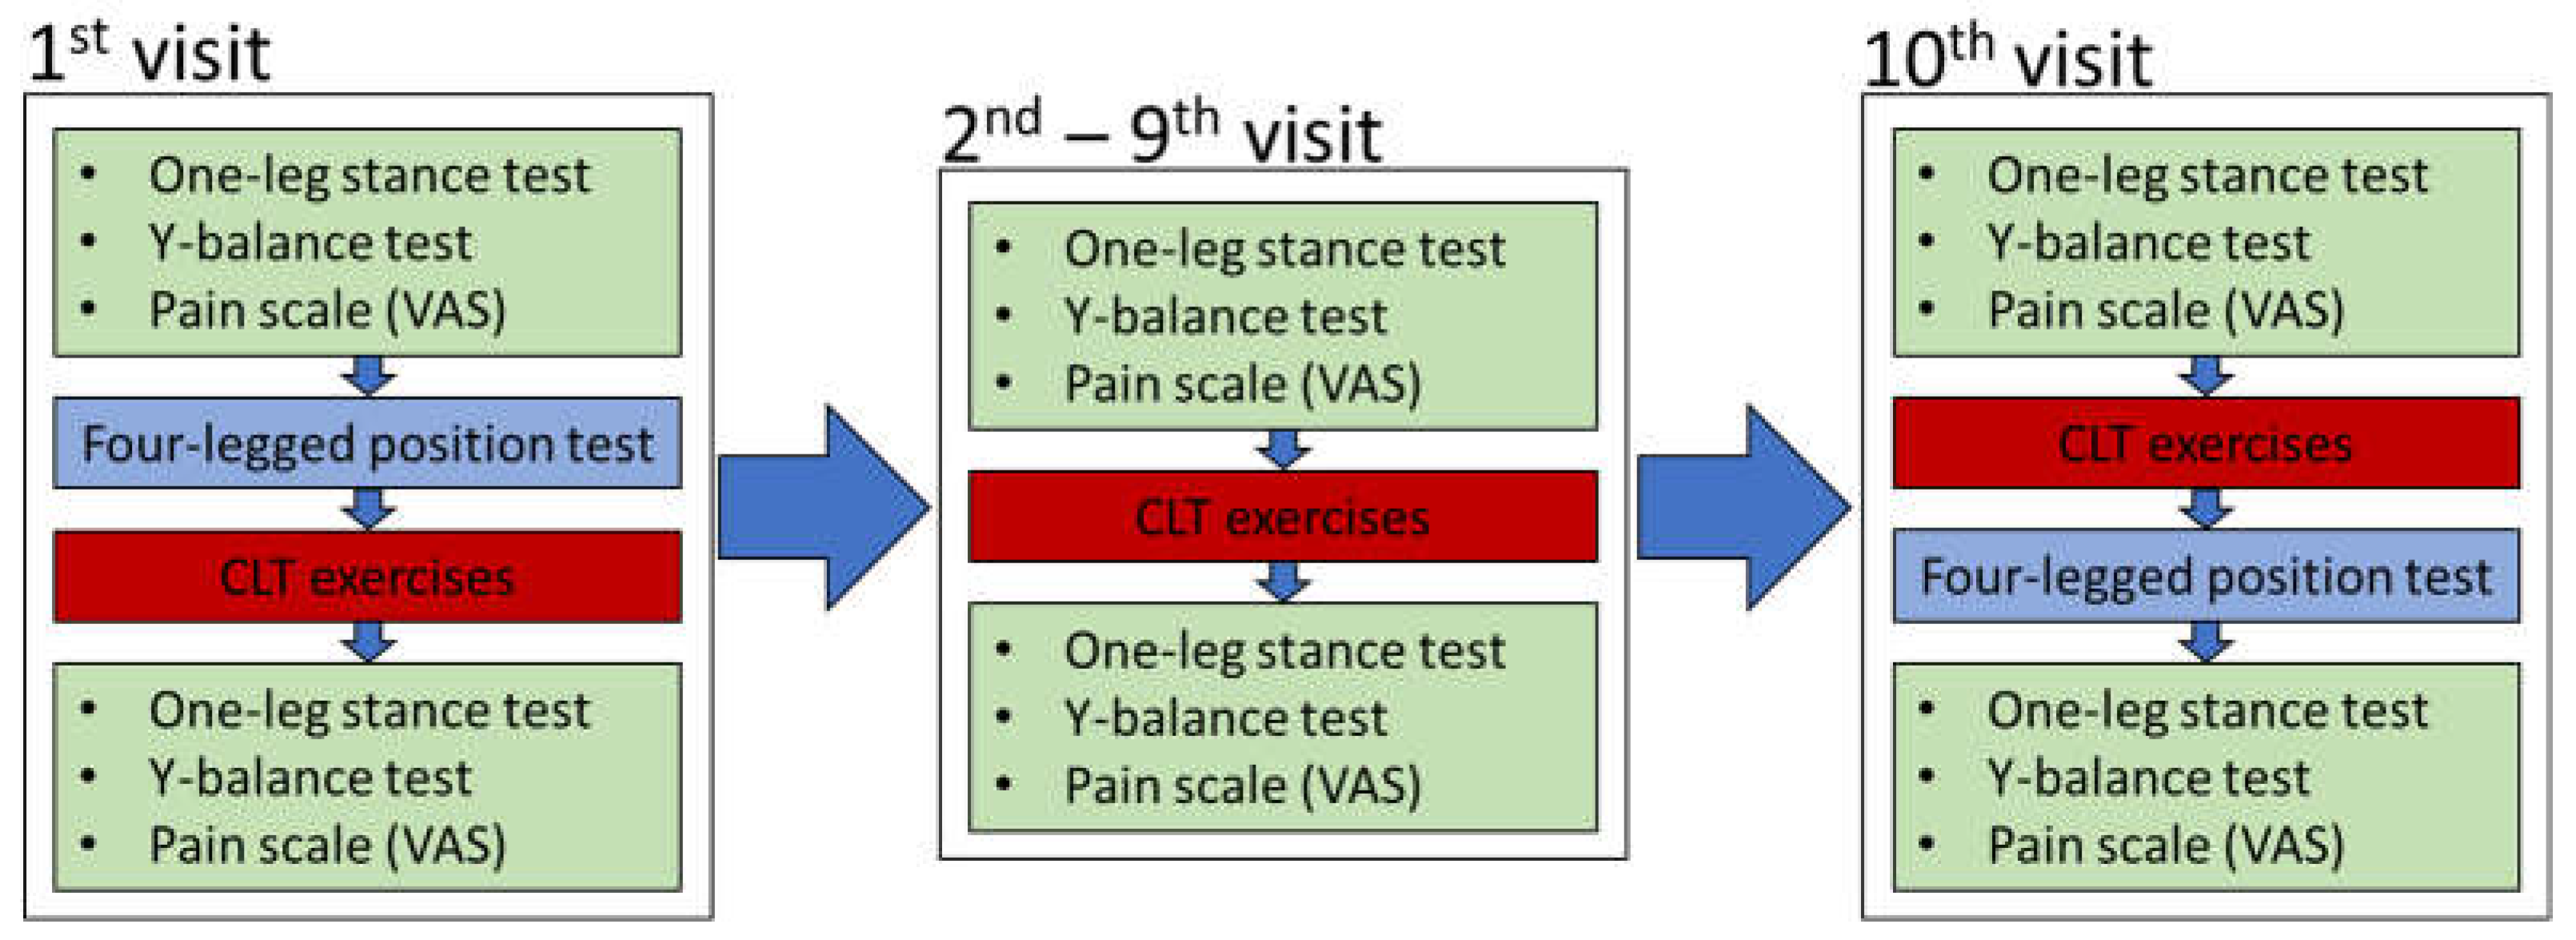
Figure 2.
Y-balance test values. Each bar represents the best measured value of three repetitions. The left horizontal axis represents the directions in the Y-balance test measured before and after performing the exercises (2 legs x 3 directions x before/after = 12 variables in total). The right horizontal axis represents the progression over ten sessions. The vertical axis represents the values measured with the Y-balance test.
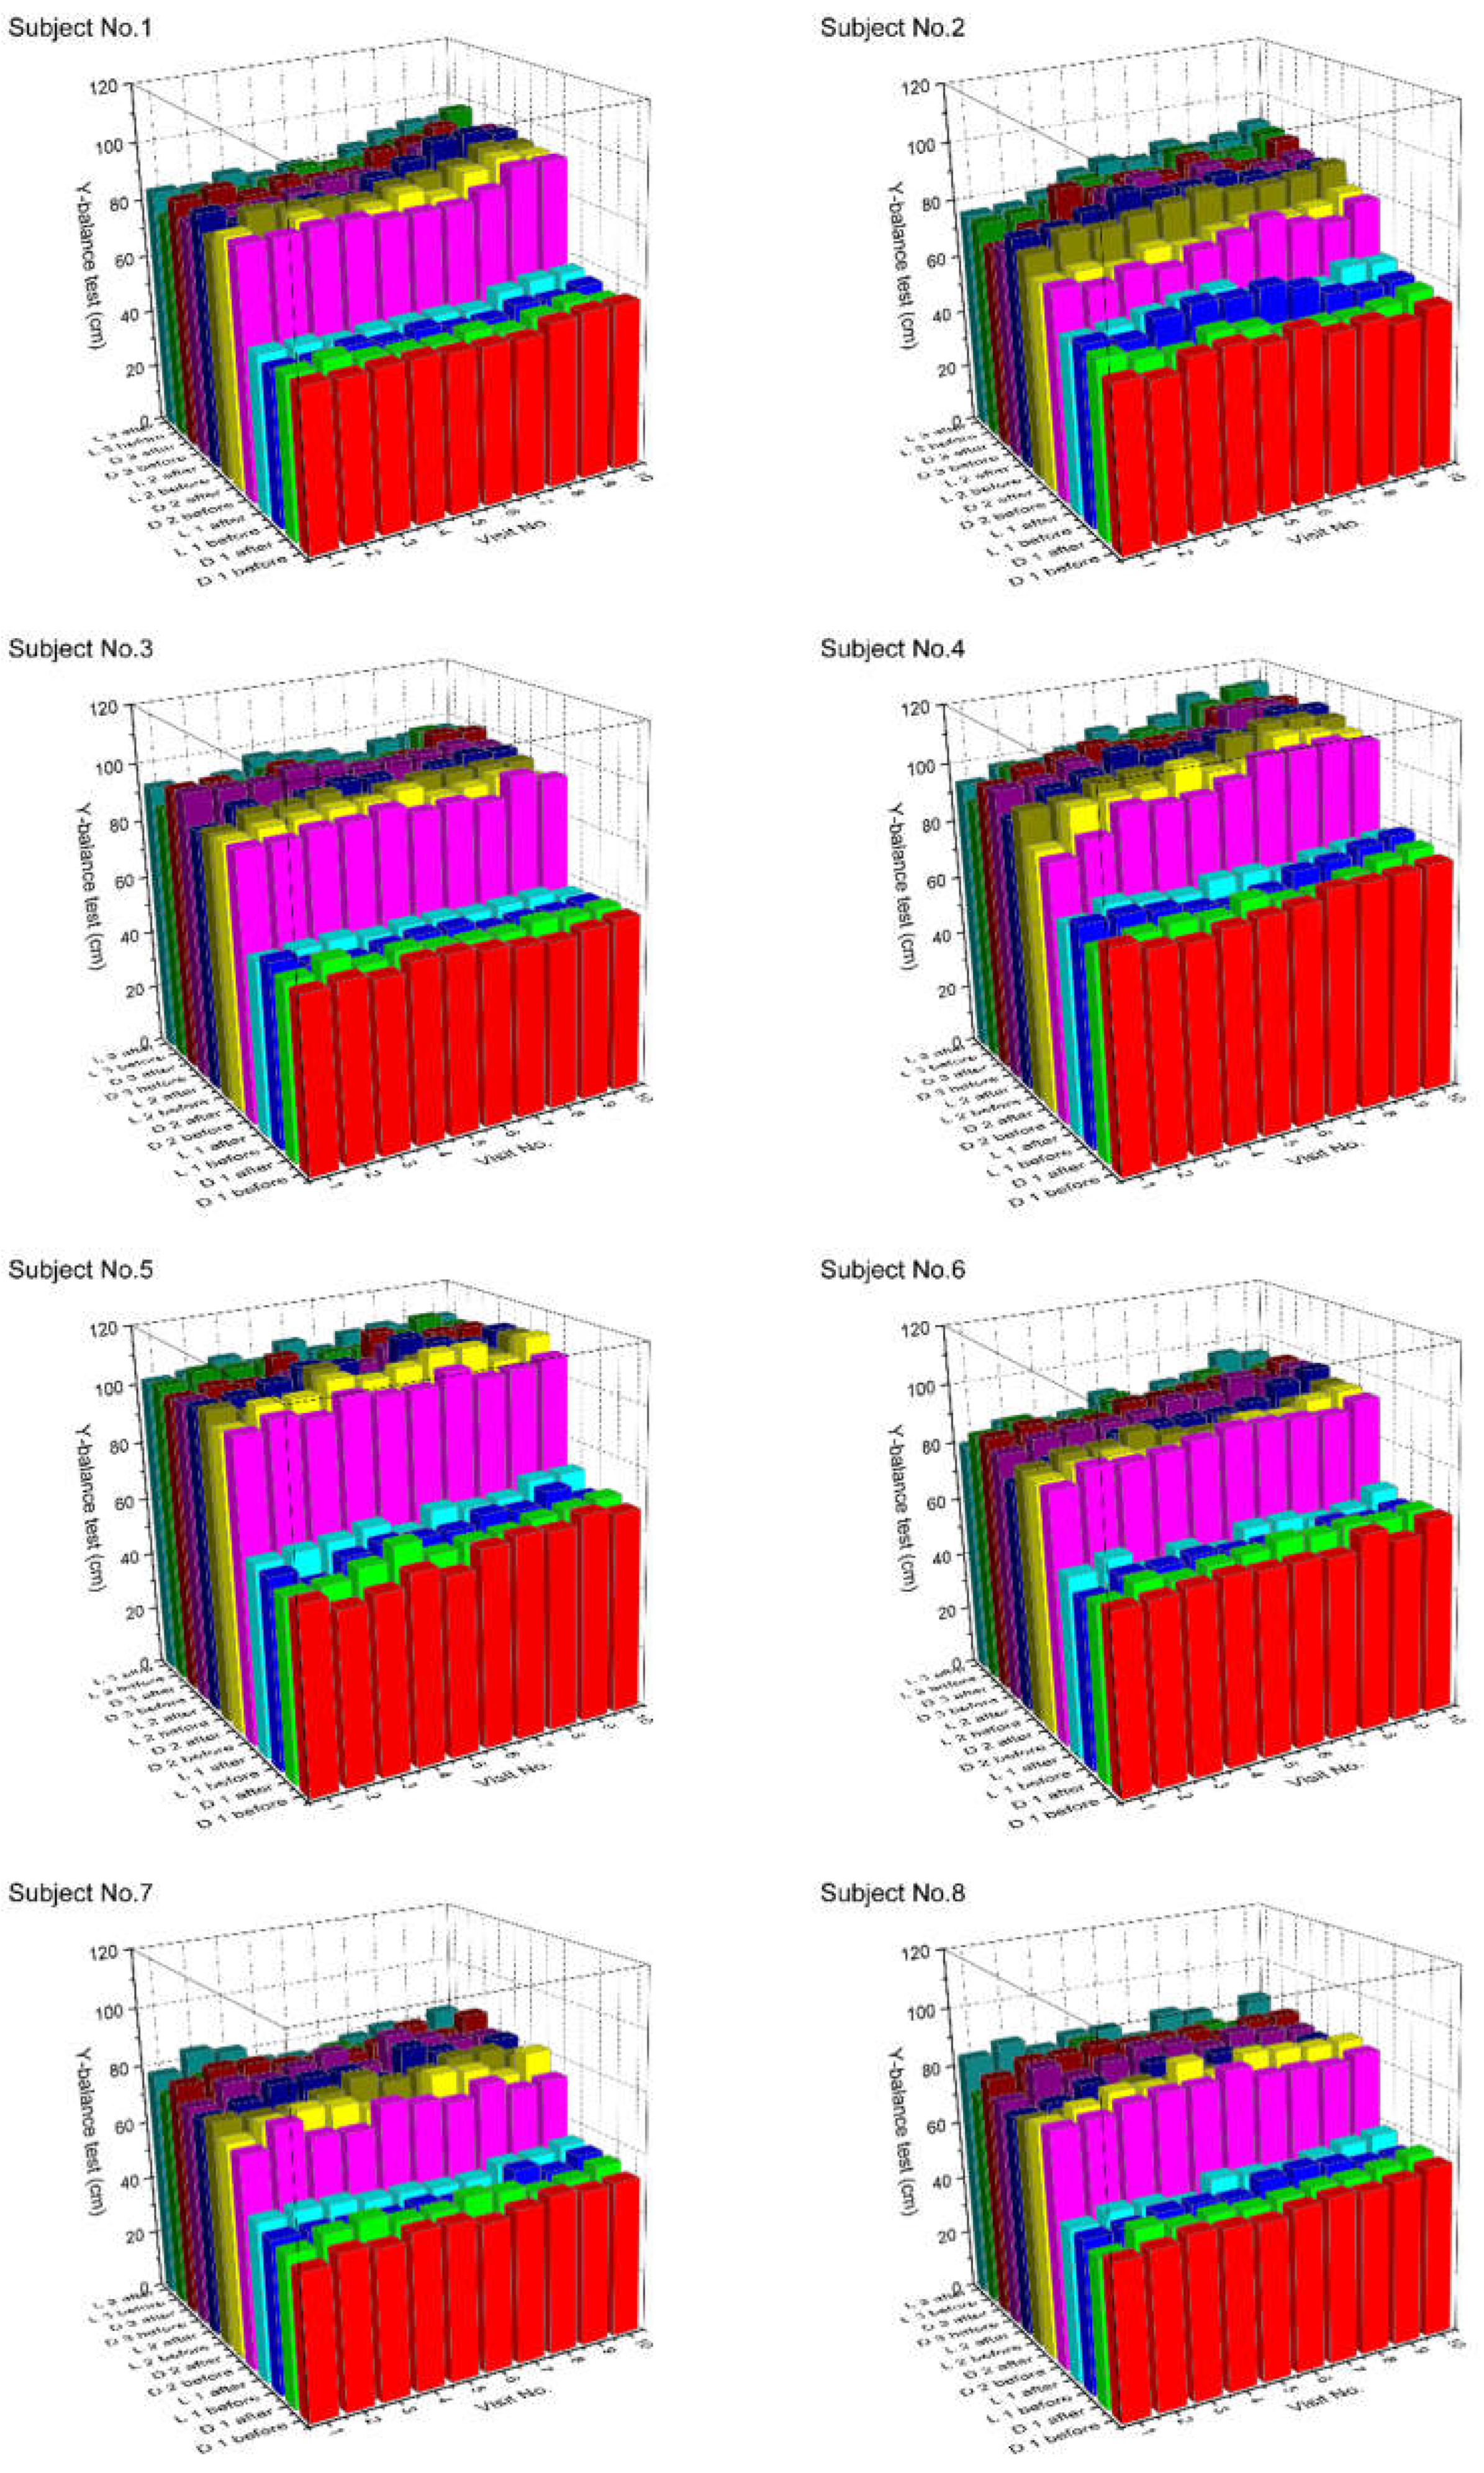
Figure 3.
The results of the Y-balance test with p-values for the comparisons between the first and the last visit (a). Statistically significant results (p<0.05) are marked in bold letters. Before: values measured before the exercises, after: values measured after the exercises. Panel (b) shows the extent of improvement in the Y-balance test results, calculated as the difference between the values measured at the last and first visit. Identical letters represent statistically homogeneous groups for the comparisons of all 12 groups together.
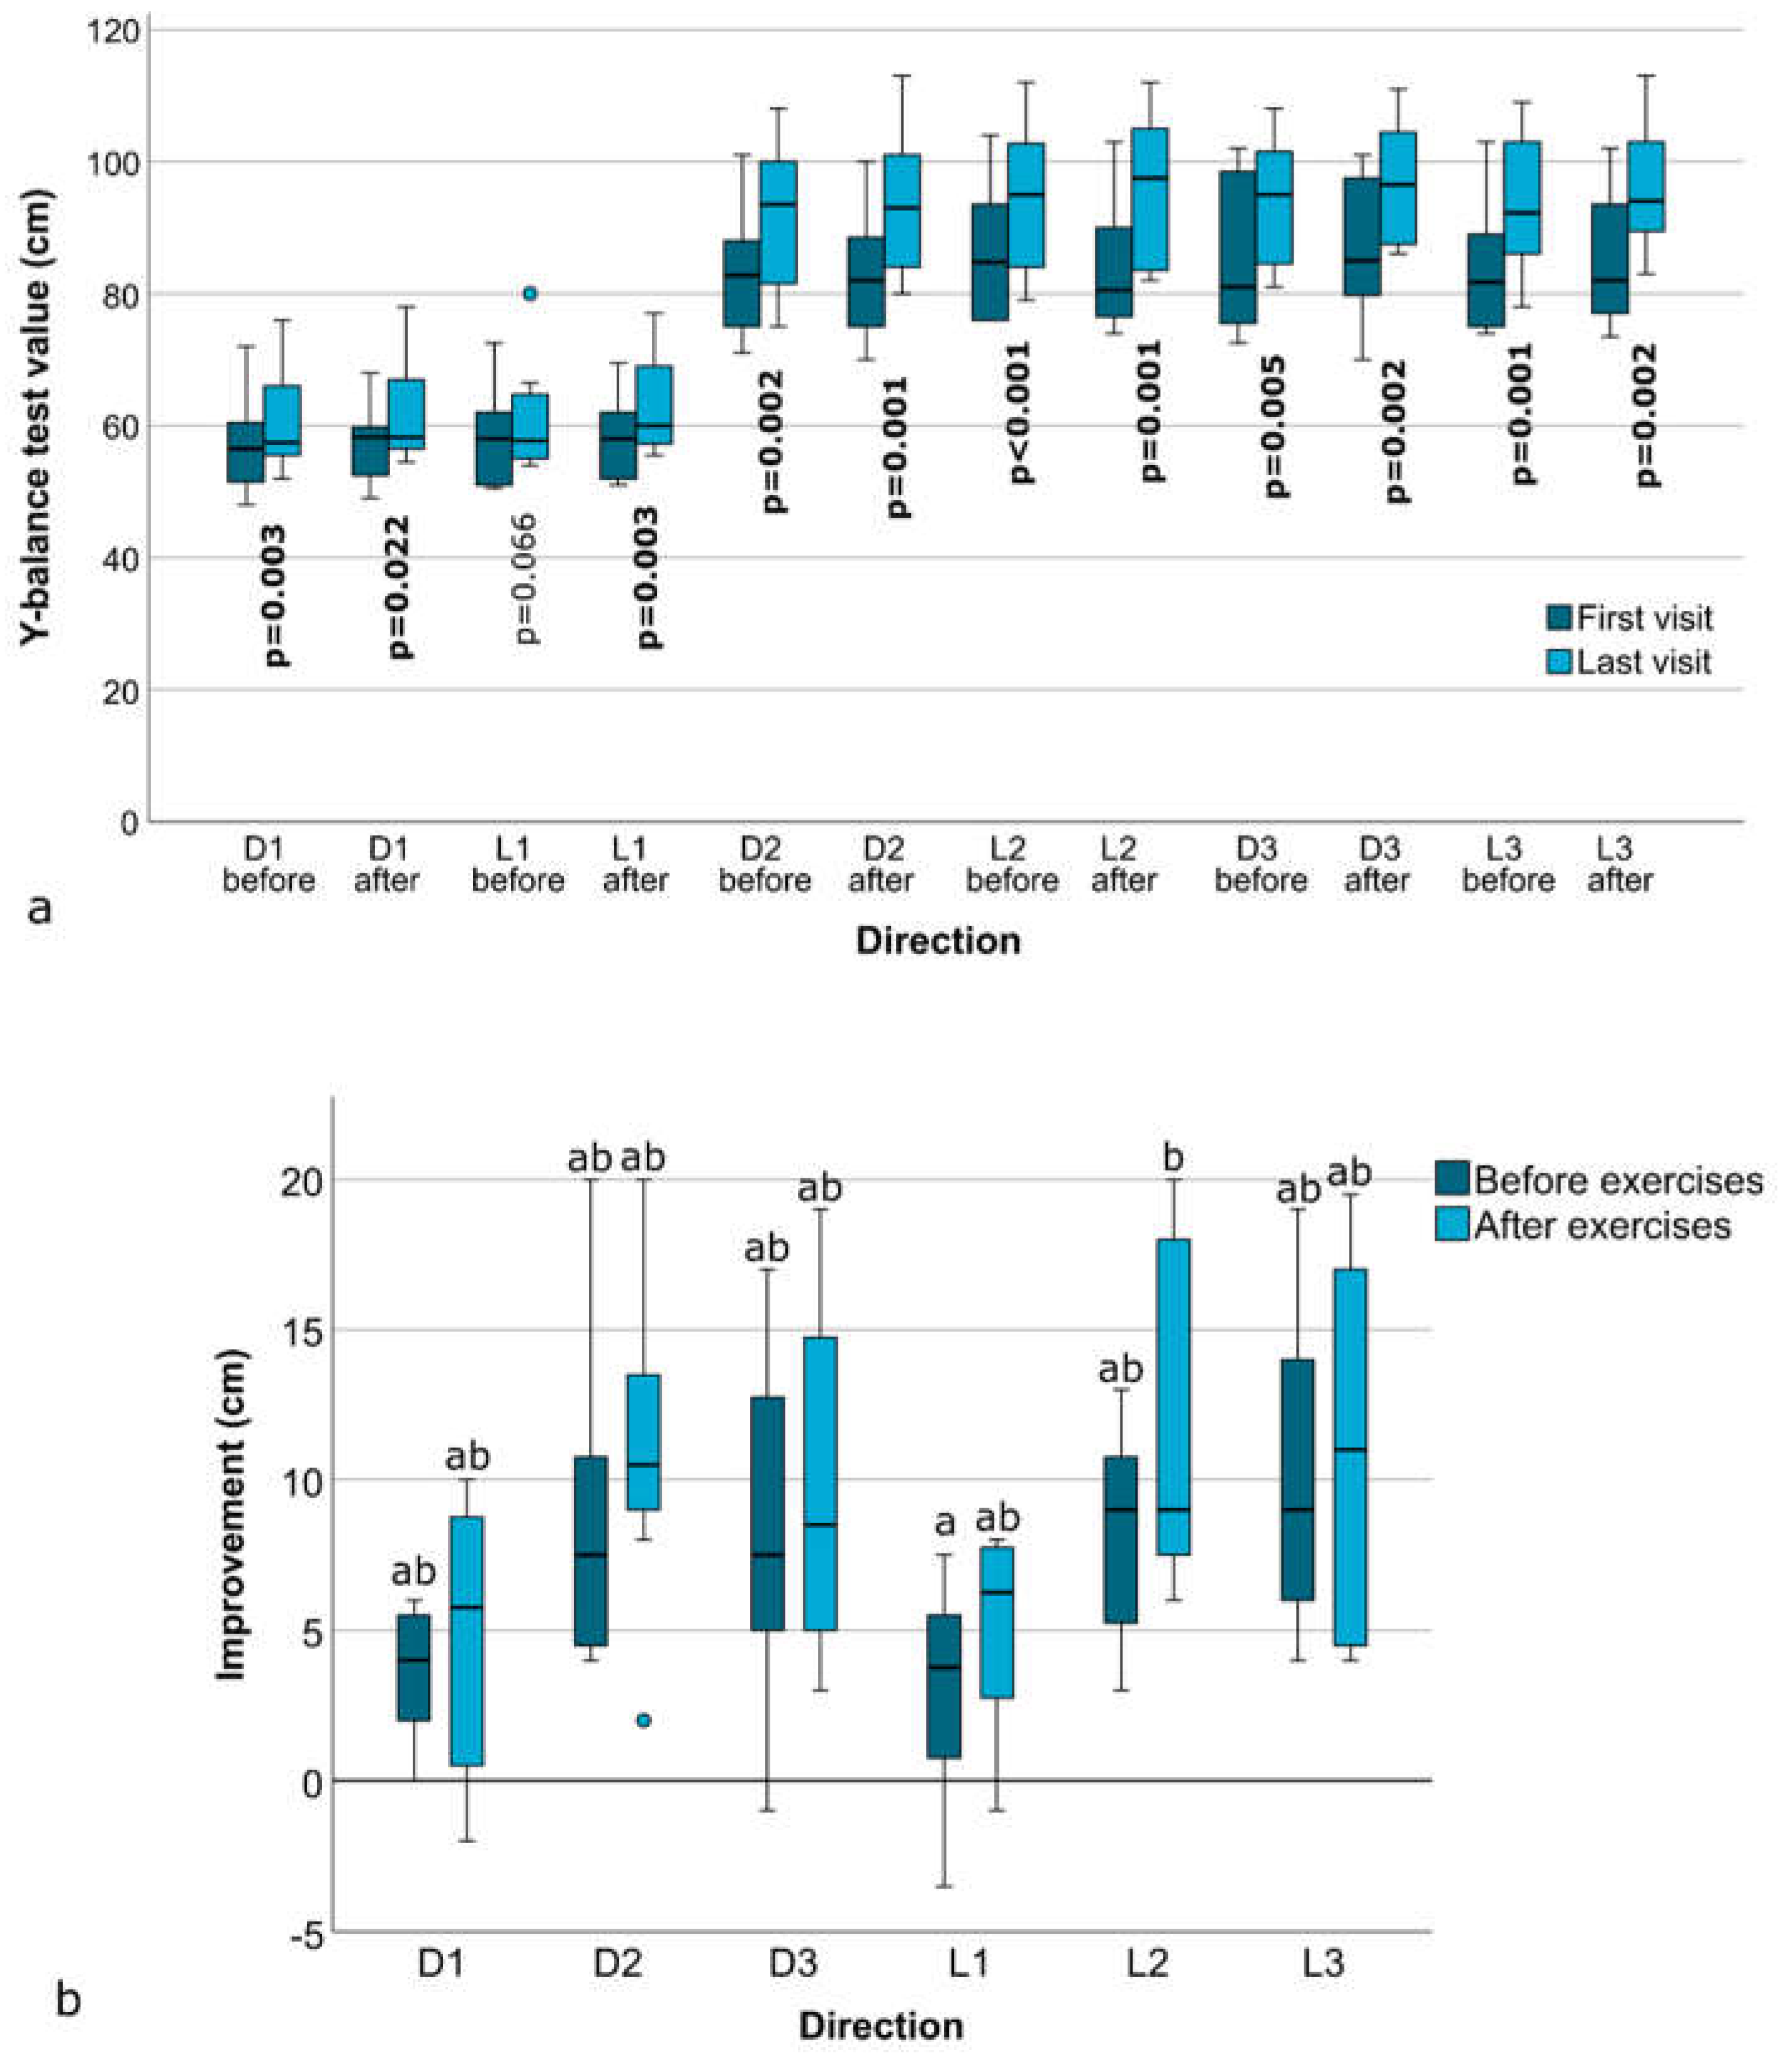
Figure 4.
Changes in Y-balance test composite scores over ten visits, represented separately for the left and right leg, measured before and after the exercises. P-values are shown for comparisons between the first and last visit.
Figure 4.
Changes in Y-balance test composite scores over ten visits, represented separately for the left and right leg, measured before and after the exercises. P-values are shown for comparisons between the first and last visit.
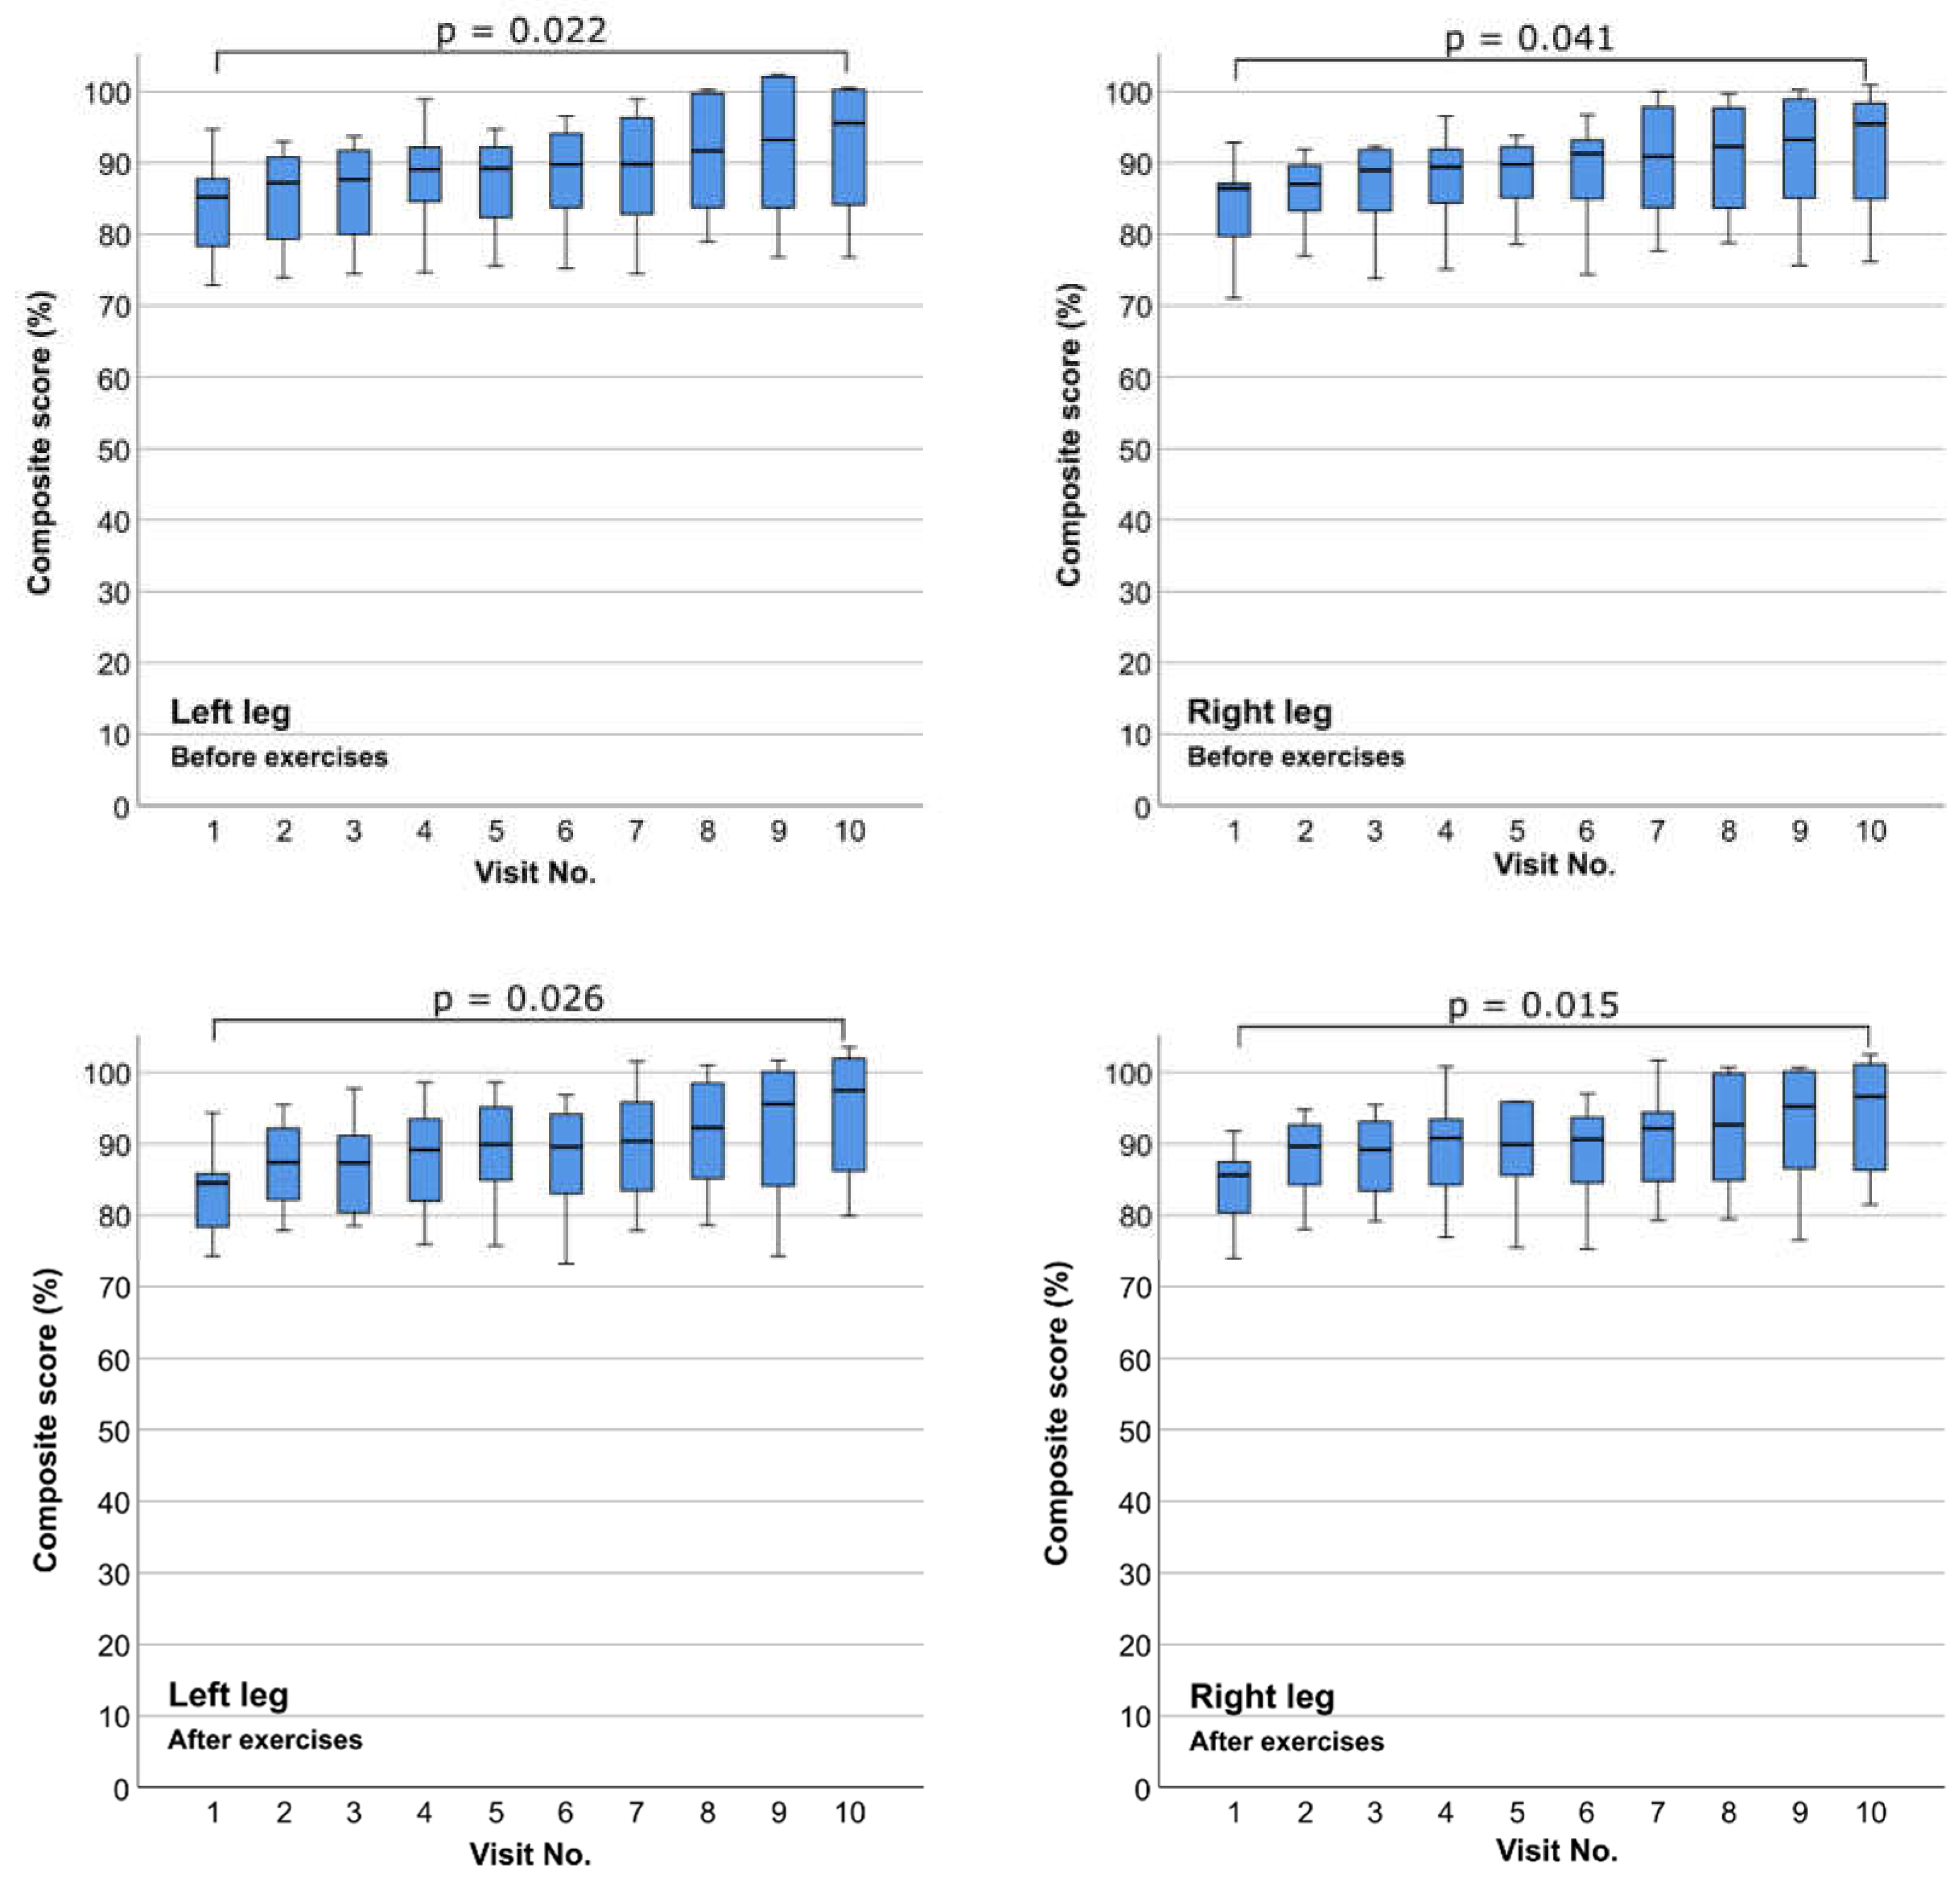
Figure 5.
Changes in the Y-balance test composite score over the course of ten visits, shown for each subject individually. For each combination of leg (right/left) and measurement time (before/after exercises), clusters of ten bars represent the values obtained during consecutive visits from 1 to 10. The red dashed line indicates the 94% threshold.
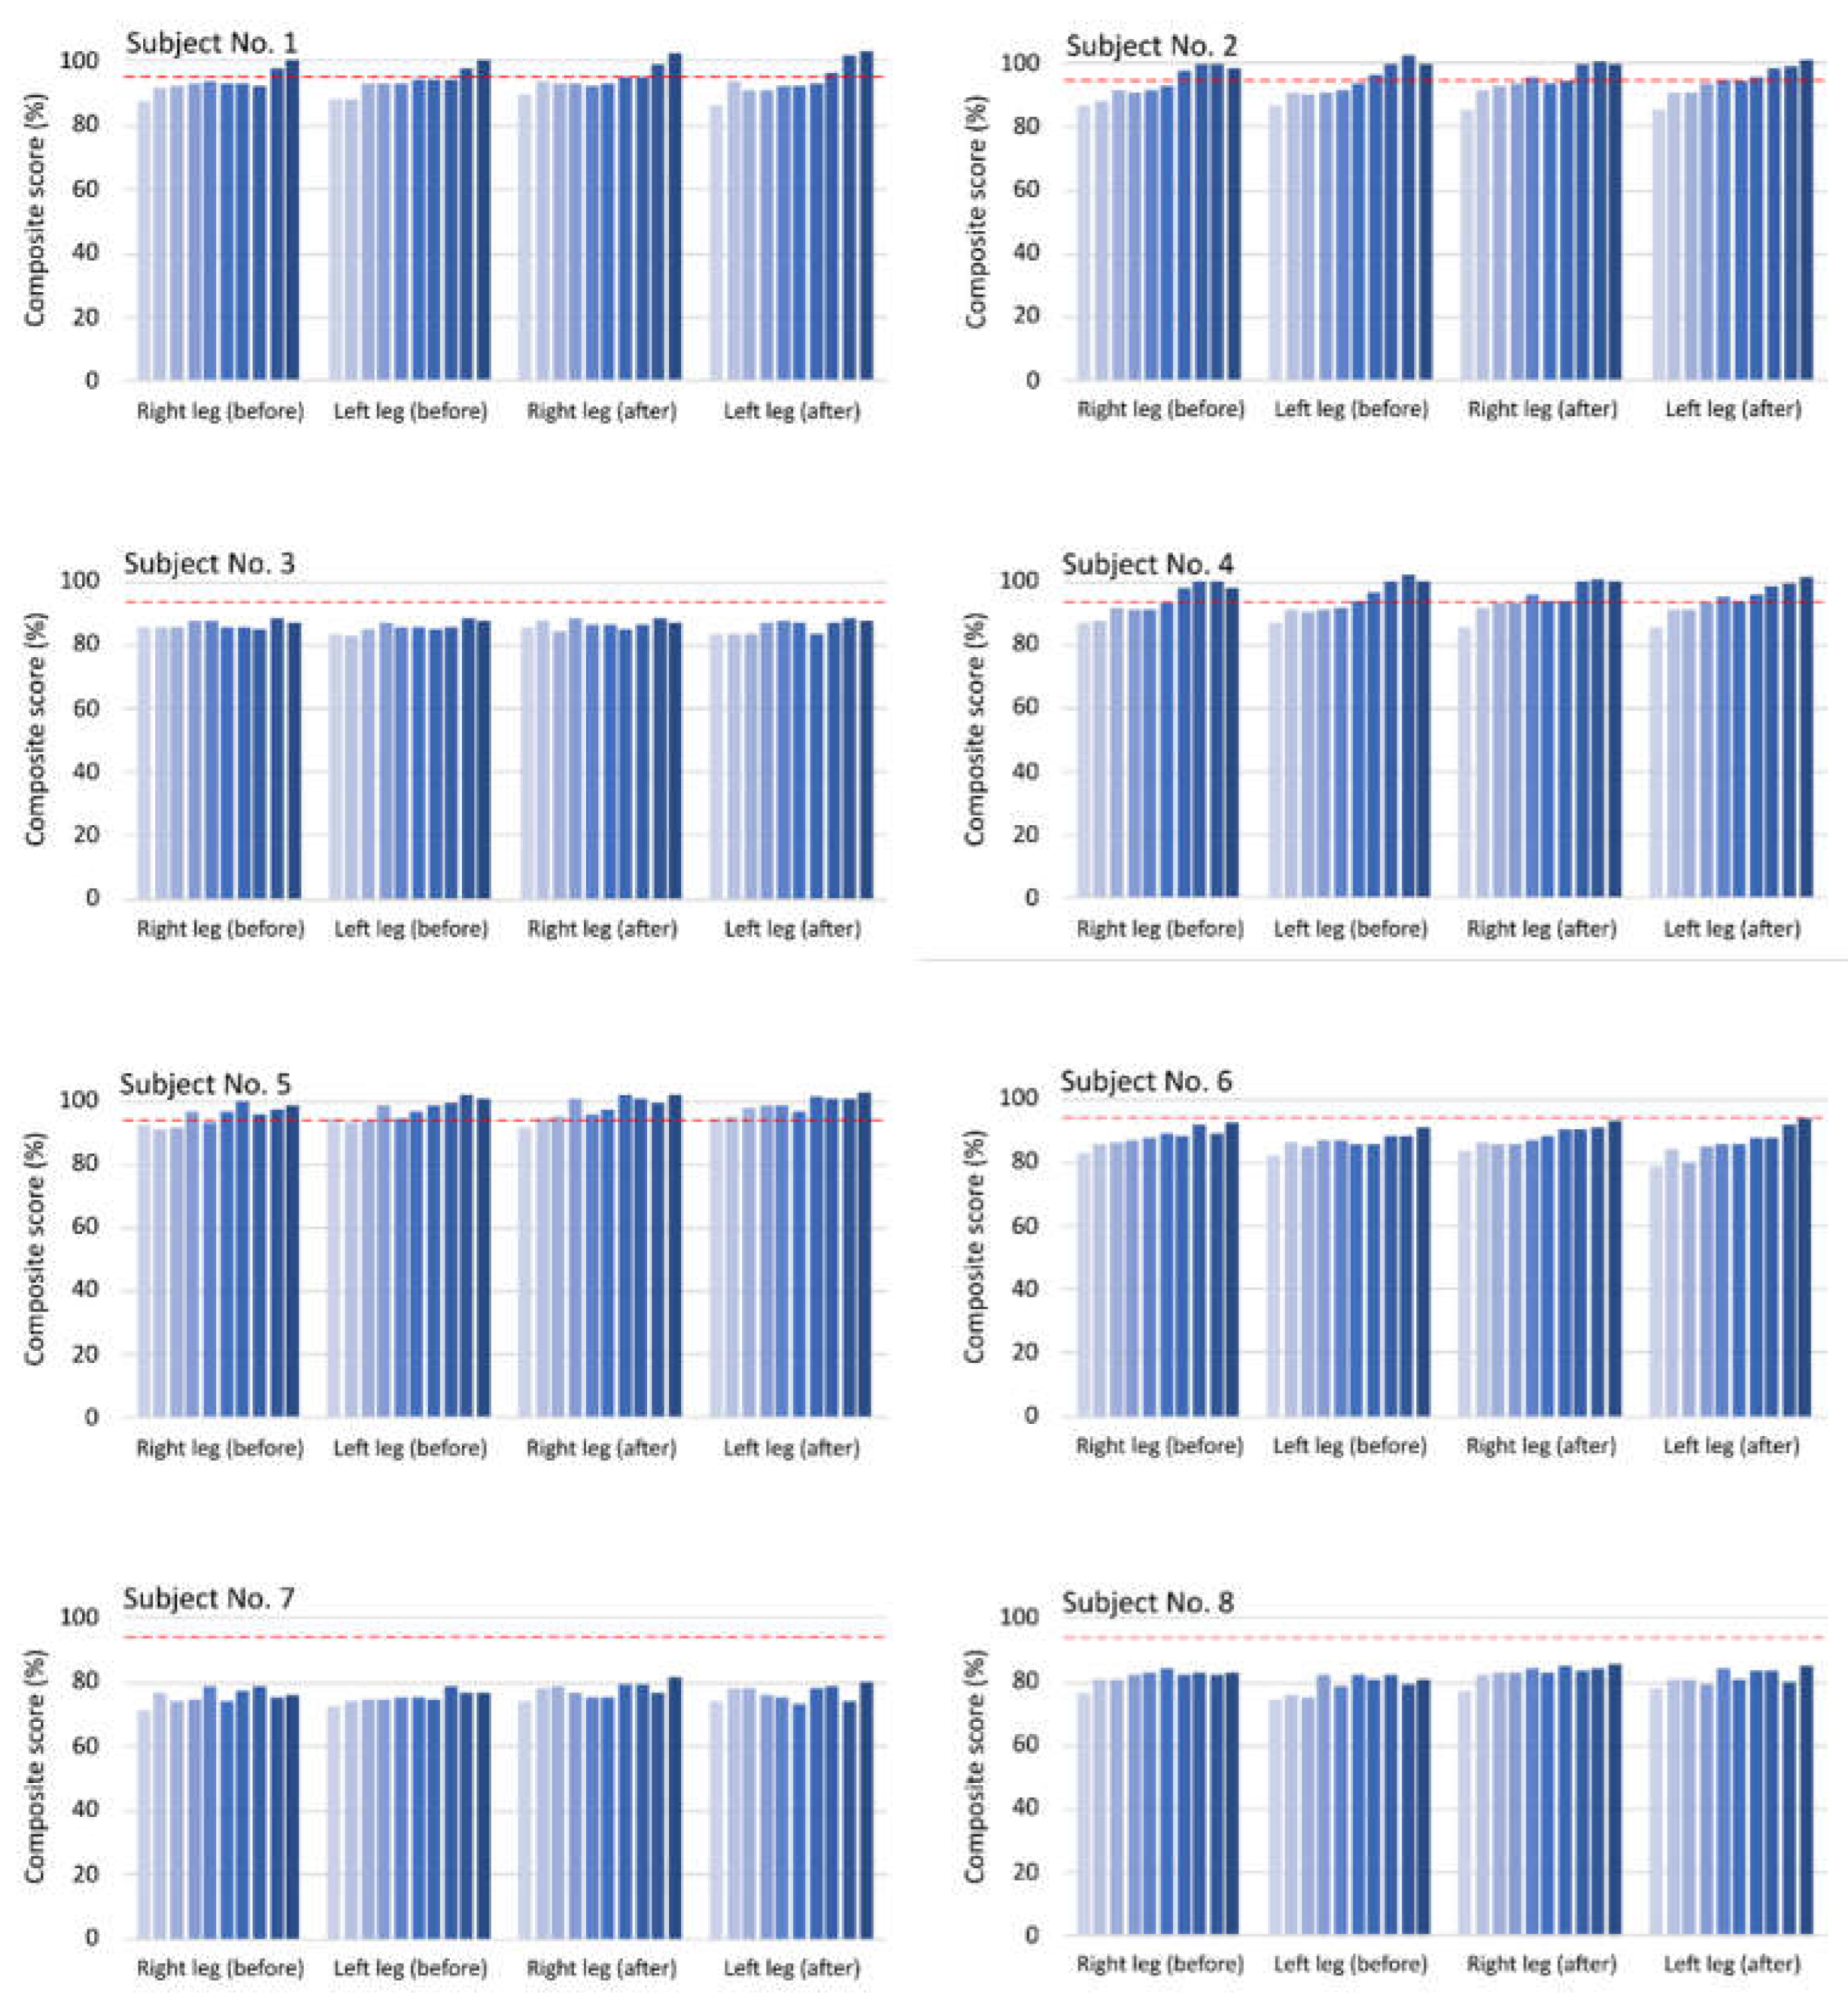
Figure 6.
Y-balance test results for the absolute values of the difference between the left and right leg, measured before and after the exercises. P-values are shown for comparisons between the first and the last visit. Statistically significant results (p<0.05) are marked in bold letters.
Figure 6.
Y-balance test results for the absolute values of the difference between the left and right leg, measured before and after the exercises. P-values are shown for comparisons between the first and the last visit. Statistically significant results (p<0.05) are marked in bold letters.
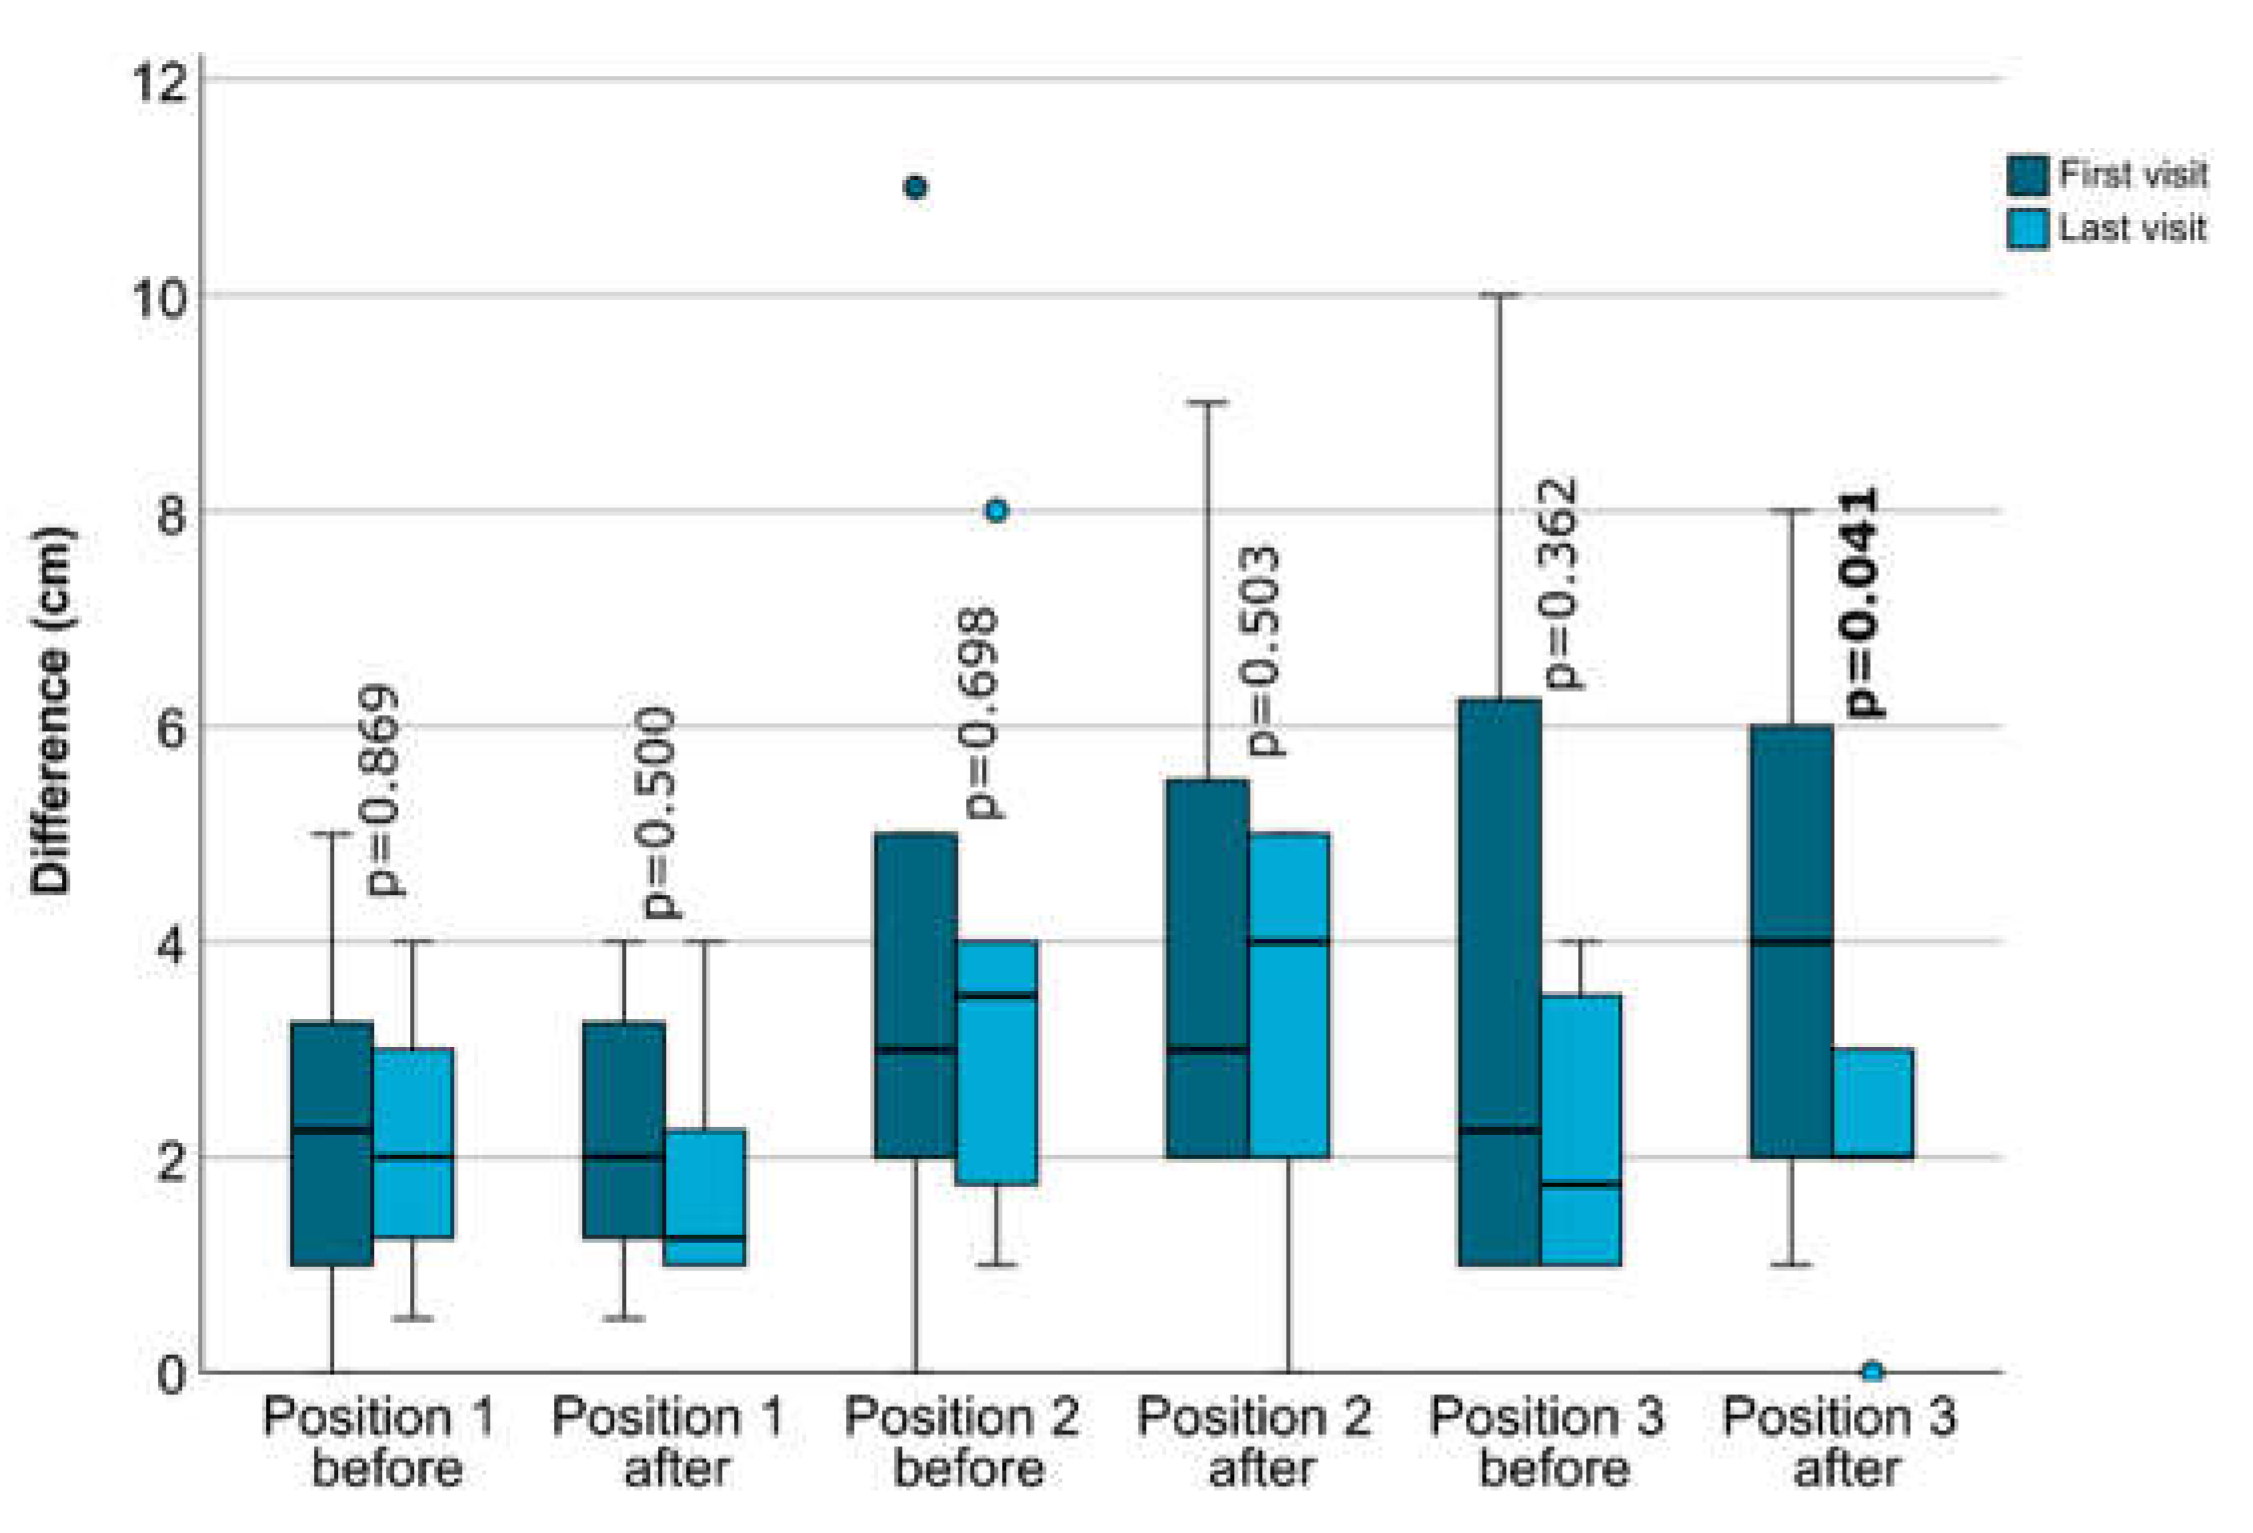
Figure 7.
Results for the four-legged position test, measured at the first and last visit (a). The P-values for the comparison between the first and last visit are shown. Statistically significant results (p<0.05) are marked in bold letters. Panel (b) shows the extent of score improvement, calculated as the difference between the scores measured at the last and first visit. The P-value is given for the omnibus test comparing all three improvements.
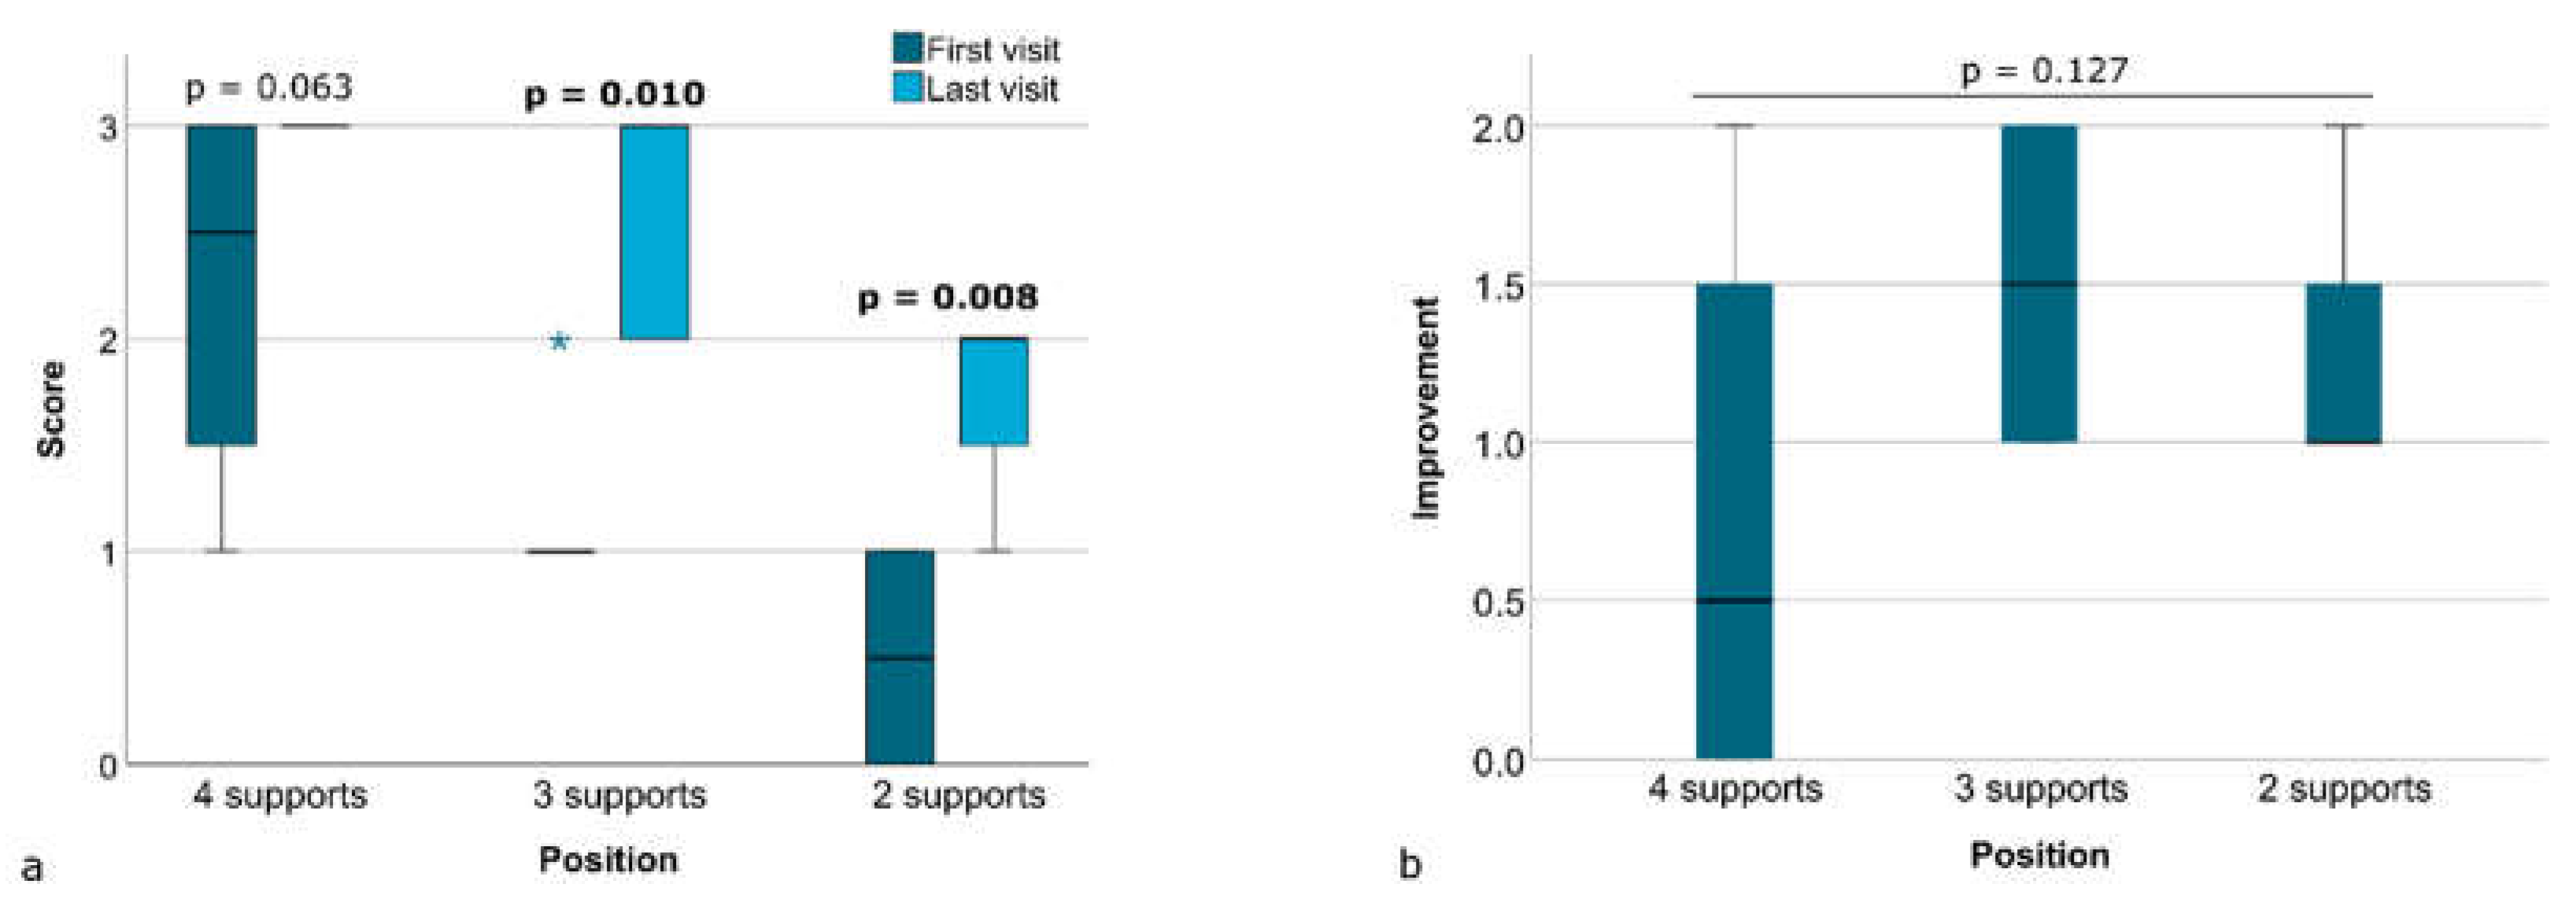

Table 1.
Exercise protocol of the ten-visit CLT program.
| Visit No. / Approach |
Position | Pattern | Activity level |
|---|---|---|---|
|
1 Hands on |
Four-legged position 4 contact points* Four-legged position 3 contact points* Four-legged position 2 contact points* Supine |
Sprinter/skater Sprinter/skater Sprinter/skater Sprinter/skater |
Securing Linking Linking Securing/linking |
|
2 Hands on |
Sitting High sitting |
Sprinter/skater Sprinter/skater |
Securing/linking Securing/linking |
|
3 Hands on |
Bear stand 4 contact points Bear stand 3 contact points Bear stand 2 contact points |
Sprinter/skater Sprinter/skater Sprinter/skater |
Securing Securing/linking Securing/linking |
|
4 Hands on |
Hook lying Bridging Supine |
Chopping Chopping Lifting |
Securing/linking Securing Securing/linking |
|
5 Hands on |
Supine Hook lying One-leg bridging |
Chopping Sprinter/skater+ Sprinter/skater+ |
Securing/linking Securing/linking+ Securing/linking+ |
|
6 Hands on |
Half-edge seat Standing position with arm support on the table |
Chopping Sprinter/skater |
Securing/linking Securing/linking |
|
7 Hands on |
Four-legged position 4 contact points Four-legged position 3 contact points Four-legged position 2 contact points (head leaning on the wall) Side lying |
Sprinter/skater Sprinter/skater Sprinter/skater Sprinter/skater |
Securing Linking Linking Linking |
|
8 Hands on |
Hook lying One-leg bridging |
Sprinter/skater+ Sprinter/skater+ Sprinter/skater+ |
Linking+ Linking+ Controlling+ |
|
9 Hands off |
Standing | Sprinter/skater Sprinter/skater/chopping Sprinter/skater CLT dance |
Securing Linking Controlling Integration |
|
10 Hands off |
Standing Four-legged position 4 contact points* Four-legged position 3 contact points* Four-legged position 2 contact points* |
Sprinter/skater+ Sprinter/skater/chopping+ Sprinter/skater+ CLT dance+ Sprinter/skater Sprinter/skater Sprinter/skater |
Securing+ Linking+ Controlling+ Integration+ Securing Linking Linking |
* In the four-legged position, the evaluation (scoring) takes place simultaneously with the execution of the exercise. + Exercise involves the use of elastic bands .
Table 2.
Scoring criteria for the four-legged position test.
| Position No. | Position consists of four-legged stance with: | Scoring criteria (for each position) The subject is able to hold the position against resistance on the scapula and ischial tuberosity: |
Score |
|---|---|---|---|
| 1 | Four supports |
|
3 |
| 2 | Three supports with arm or leg movement in sprinter/skater pattern |
|
2 |
| 3 | Two supports with arm and leg movement in sprinter/skater pattern |
|
1 |
|
0 |
Disclaimer/Publisher’s Note: The statements, opinions and data contained in all publications are solely those of the individual author(s) and contributor(s) and not of MDPI and/or the editor(s). MDPI and/or the editor(s) disclaim responsibility for any injury to people or property resulting from any ideas, methods, instructions or products referred to in the content. |
© 2024 by the authors. Licensee MDPI, Basel, Switzerland. This article is an open access article distributed under the terms and conditions of the Creative Commons Attribution (CC BY) license (http://creativecommons.org/licenses/by/4.0/).
Copyright: This open access article is published under a Creative Commons CC BY 4.0 license, which permit the free download, distribution, and reuse, provided that the author and preprint are cited in any reuse.


