Submitted:
18 July 2024
Posted:
18 July 2024
You are already at the latest version
Abstract
In the foodservice industry, clients judge not only the product standard but also the service quality they receive during their restaurant experience. Therefore, when the importance of the dining experience is strongly regarded by consumers in terms of intellectual and motivational attributes, they are happier to suggest the establishment to others. The main objective of this research is to study the influence of different service quality factors in restaurants and their impact on customer satisfaction. This research is also undertaken to evaluate the identification of important factors for the restaurant industry and the levels of service quality among customers satisfaction with the services offered by restaurants in India. As factor analysis, correlation, and regression research, this study was conducted using a modified IBM SPSS Statistics 24 and AMOS instrument among the 630 randomly selected customers. A weighted mean was used to describe the levels of service quality and customer satisfaction. Multiple regressions were used to determine the predictors of customer satisfaction. The results reveal the main 12 service quality factors, which are: 1. Process-related factors: system for take-away orders, order tracking system, and time for food preparation 2. People-related factors: focus on customers' special requests, peer group influence, and making you feel special. 3. Physical Environment: Walking Space, Architecture of the Restaurant, and Signals for Direction 4. Performance-related factors: food served at an appropriate temperature; food presentation; portion size of food in the restaurant. The researchers have developed one model on service quality factors that is described in the research paper.
Keywords:
foodservice
; customer satisfaction
; service quality factors
; physical environment
; people
; performance
INTRODUCTION
Background of the Study
The restaurant sector within the hospitality industry is undergoing a range of transformations in an exceedingly competitive landscape. Customers are now placing greater emphasis on factors such as the quality of food (FQ), the excellence of restaurant services (RSQ), and the overall physical environment (PEQ) provided by fast food establishments. A single disappointing encounter can prompt consumers to swiftly switch to alternatives. As a result, fast food restaurants are compelled not only to draw in fresh patrons but also to maintain the loyalty of their current clientele. Within Pakistani culture, there is an increasing inclination to frequent fast food restaurants for social gatherings with family, friends, and colleagues [1].Quality holds significant importance, especially when evaluating the service quality of food, as it constitutes a crucial component of any product. The success of organizations hinges on their ability to attract a satisfactory customer base. Service quality becomes a distinguishing factor in comparison to other services, as it directly contributes to customer contentment. In essence, customer satisfaction emerges as the pivotal determinant for the success of firms that prioritize service quality as their foremost factor for achieving success. [3] The progression of information technology holds a significant role in driving both societal advancement and economic expansion. It serves as a catalyst for innovation and the emergence of new ventures. The utilization of computers and interconnected systems has dramatically amplified both the volume and speed of information processing. The evolution of the Internet has brought about a transformation in the way businesses communicate, while also establishing a foundation for electronic commerce, thereby reshaping approaches to marketing, advertising, and product distribution. The continual evolution of information technology has revolutionized operational paradigms across various sectors, including the hospitality industry. Within the realm of lodging, the implementation of technological solutions has been acknowledged for its contribution to gaining a competitive edge, enhancing productivity, improving financial performance, and expanding guest services. [2] It is widely recognized that within the service industry, customers possess a restricted set of criteria to assess the quality of services, in contrast to products. This situation is particularly evident in the hospitality sector, where the tangible cues of the physical environment and the perceived pricing play a significant role in evaluating service excellence and cultivating customer contentment. In connection to this, a study by Martin and his associates in 2008 underscored that the emotions encountered within a service environment have the potential to influence a customer's perceptions and judgments regarding their level of satisfaction. Hence, considering the standpoint of service providers, enhancing the physical environment can enhance perceptions of value for the price and can evoke emotional responses in customers, ultimately leading to an augmentation in customer satisfaction. [4] Scholars have approached the concept of customer satisfaction from various angles. The optimal method for assessing satisfaction has been a subject of considerable debate, as highlighted by Jones and Suh (2000). This prompts an inquiry: does the methodology for gauging customer satisfaction hold significance? Specifically, could the determinants of customer satisfaction yield different outcomes based on the chosen conceptualization and measurement of satisfaction? Moreover, does the connection between customer satisfaction and customer-related results like word of mouth hinge on the measurement employed? In a bid to delve into these queries, this study investigates two alternative yardsticks for customer satisfaction – encompassing overall satisfaction and relative satisfaction. Notably, Dick and Basu (1994) propose that a relative approach might offer a more potent indicator of repeat purchases. Nevertheless, it's worth noting that only a limited number of studies have thus far delved into the realm of relative satisfaction. [5]
LITERATURE REVIEW
L., Allem, Chrizel, Bonimar, & Leila, 2022, this research evaluates service quality and customer satisfaction in two fast-casual dining restaurants in Nueva Vizcaya, Philippines. The study used a modified SERVQUAL instrument and weighted mean to describe service quality and satisfaction. Results showed that fast-casual restaurants met customer expectations, providing respectable service quality. Factors affecting customer satisfaction include the restaurant's physical design, product price, and workforce responsiveness.(L., Allem, Chrizel, Bonimar, & Leila, 2022).[4] Norfadzilah, Zaidi, & Ayu, 2019, the restaurant business has evolved due to changing customer preferences and demands. Entrepreneurs must be flexible and adaptable to meet these changes to maintain customer satisfaction and loyalty. This study investigates key dimensions of service quality in local restaurants in Bukit Jelutong, Malaysia. A survey of 238 customers revealed that only responsiveness and tangibility were supported, while assurance, empathy, price, and reliability were significant. This suggests further investigation into service quality factors and suggests managers consider strategies to sustain and maintain customer satisfaction.(Norfadzilah, Zaidi, & Ayu, 2019).[5] Shaher & Muhammad, 2015, this study investigates service quality and its impact on customer satisfaction in the Pakistani restaurant industry. It examines how different service dimensions affect customer loyalty and perception. The study uses questionnaire technique and 152 respondents from different demographics. Findings show a significant relationship between service quality (tangibles, assurance, responsiveness, reliability, empathy) and customer satisfaction. The fast-growing restaurant industry in Pakistan requires attention to customer satisfaction and service quality to ensure a healthy and enjoyable experience.(Shaher & Muhammad, 2015).[10] Rajput, A., Gahfoor, R.Z., 2020, this study examines the positive association between food quality, restaurant service quality, physical environment quality, and customer satisfaction with revisit intention in fast food restaurants. Data was collected from 433 customers, and the study found that word of mouth does not positively moderate the relationship between customer satisfactions and revisit intentions. The study highlights the importance of revisiting intention as a crucial behavioural reaction in fast food restaurants. [11] Samuel Putta, 2023, the study found a significant positive relationship between service quality and customer satisfaction in restaurants. Tangible service quality had the most influence on customer satisfaction, followed by food quality, menu, reliability, assurance, responsiveness, and empathy. (Samuel Putta, 2023). [9] Villanueva, M. et al, 2023, the COVID-19 pandemic has led to a decline in fast-food restaurants, but innovation and recovery are crucial for their recovery. A study examining service quality, customer satisfaction, and loyalty in Pasay City, Philippines, found that fast-food restaurants met customer expectations, but innovation had the lowest rating among other dimensions. The study suggests implementing innovative strategies to adapt to the new normal setting and re-measure service quality to develop innovative strategies without compromising customer satisfaction. [12] Hsinkuang, KuaChung, & Bich Dao, 2019, this study summarizes customer satisfaction literature and concern factors in restaurant service context using meta-analysis. A conceptual framework was developed to understand the relationships between factors. A meta-analysis of 35 research studies from leading tourism and hospitality journals was tested using 334 respondents from three traditional restaurants in Ho Chi Minh City, Vietnam. The findings suggest that the precision of meta-analysis findings has important consequences for research and practice, and will discuss implications for future research ideas.(Hsinkuang, KuaChung, & Bich Dao, 2019). [3] Harr, Ko King Lily, 2008, this study explores customer satisfaction in Singapore's fine dining restaurants, focusing on service dimensions such as assurance, empathy, and tangibles. The findings suggest that these dimensions positively influence customer satisfaction, and recommendations are made for restaurateurs to improve their services to achieve higher levels of satisfaction. [13] Ala’a et at, 2015, this paper examines staff restaurant processes and their relationship with service quality (SQ) and total quality management (TQM) in the hotel industry. It introduces a new SQ measurement model that incorporates staff performance, making it more comprehensive and better reflecting actual SQ situations. [17] Zibarzani M, 2022, this research aims to explore consumers' satisfaction and preferences of restaurants during the COVID-19 crisis using online reviews. A hybrid approach was developed using clustering, supervised learning, and text mining techniques. Decision trees were applied to cluster customers' preferences, while Latent Dirichlet Allocation (LDA) was used for textual data analysis. A theoretical model was developed to examine the relationships between restaurant quality factors and customer satisfaction using Partial Least Squares (PLS) techniques. The study evaluated the approach using a dataset from the Trip Advisor platform. Future research directions are suggested based on the study's limitations. [18] Zygiaris S et al., 2022, this research examines the impact of service quality on customer satisfaction in the post-pandemic auto care industry. The study found that empathy, reliability, assurance, responsiveness, and tangibles significantly contribute to customer satisfaction. Workshops must recognize these factors and provide personal attention, friendly greetings, timely delivery, and clear communication of services. Proper service quality is aided by prompt services. [19] Zhou, R., 2019, the study examines the impact of e-service quality (e-SQ) on customer satisfaction and loyalty in telecom settings. A scale with five user experience dimensions was developed, revealing a positive relationship between e-SQ, customer satisfaction, and loyalty. E-SQ is a core predictor of satisfaction and loyalty, with customer satisfaction being the strongest predictor. [20] Timothy Jeonglyeol Lee, 2012, this research examines the perception of restaurant service among senior citizens and its differences from younger customers. It finds significant differences in satisfaction levels between older and younger customers, but no significant relationship between satisfaction and perceived service quality. The study offers valuable insights for restaurant managers and can help develop marketing strategies targeting senior customers. [21] HON G Qin, 2008, this research aims to develop a model and metrics to measure service quality in fast-food restaurants (FFRs). The modified SERVPERF instrument was administered to college students at a south-western university. The study found that five dimensions positively influence service quality perception, and that service quality and customer satisfaction are important antecedents of customer intention. However, no significant relationship was found between service quality and customer satisfaction. Food quality is a significant factor in satisfaction. FFR managers should focus on monitoring and improving service quality and food quality to drive repurchases.[14] Masoumeh Zibarzani a, R. A. Et al (2022), with the help of a dataset gathered from the Trip Advisor platform, we assessed the suggested methodology. In light of the limitations of this study, the two-stage methodology's results were examined, and recommendations for future research were made. (Masoumeh Zibarzani a, 2022). [18] Managers need to focus on the essential food quality characteristics that increase customer satisfaction and repeat business in the restaurant industry. Namkung, Y., & Jang, S. C. (2007). Social conformity theory fails when consumers experience quality and satisfaction, as word of mouth doesn't influence revisit intention. [28] Rajput, A., (2020). Evaluated approach using Tripadvisor dataset, discussed outcomes, and suggested future research directions. [11] Zibarzani, M., Abumalloh, (2022) [18]
RESEARCH PROBLEM
Restaurant owners face challenges in inventory management, including uncontrolled stock waste, employee theft, and inconsistent warehouse locations. To avoid losses, it's crucial to identify and prevent internal theft. Franchise restaurants often have multiple locations or warehouses, making it difficult to address issues at different locations. To retain customers, a persistent approach, an easy customer experience, and social media engagement are essential. Retaining customers is crucial for generating revenue and retaining customers. What factors are considered by consumers with special reference to service quality in tune to performance factors?
OBJECTIVES
- To explore the relationship between these factors, Process, People, Physical environment, and performance of service quality factors and customer satisfaction.
- To investigate the effect of demographic factors on service quality factors (Process, People, Physical Environment, Performance.
- To investigate the effects of service quality on customer satisfaction and purchasing intentions.
- To identify service quality factors and models.
HYPOTHESIS
H1: There is no association between service quality factors with respect to demographic factors.
H1: There is an effect of demographic factors on service quality factors.
H1: There are positively associated service quality factors with respect to online and offline service quality satisfaction.
METHODOLOGY
SPSS v24, G-power, and thorough literature studies were used as research tools in tandem. The stratified random sample approach, regression analysis, one-way ANOVA, correlation, t-test, and percentage analysis were used to examine respondents' impressions across four (4) important service quality factors: process, people, physical environment, and performance in tune with restaurant services. [33] The researcher also created a model using the SPSS 24 AMOS programme. [34]
VALIDITY AND RELIABILITY
Validity taps ability of scale to measure the construct; in other words, it means that the representative items measure the concept adequate [35]. The content validity in two steps; firstly, the items are presented to the many marketing experts for further evaluation and modification; secondly, the constructive feedback about the understanding of it was acquired from 100 respondents who filled the questionnaire. The factor analysis allotted the items to their respective factors [36]. Composite reliability p is calculated for each construct using partial least squares (PLS) structural equation modelling and Cronbach’s coefficient α [37].
Result and Discussion:

Table 1.
Result and Interpretation of Reliability Statistics.
| Questions | N of Items | Reliability result |
|---|---|---|
| Process Related Factors | 8 | 0.794 |
| People Related Factors | 9 | 0.778 |
| Physical Environment of Restaurant | 10 | 0.845 |
| Performance Factors | 10 | 0.880 |
Sources: self-constructed from the questionnaire data.
Interpretation:
Table 1 Cronbach's alpha was used to assess the internal reliability of the 4-items that are process-related factors, people-related factors, the physical environment of the restaurant, and performance factors. Cronbach's alpha for the overall scale was 0.82, according to the results. The final reliability of the resulting 4-item scale was considered acceptable α = 0.82.
Table 2.
Result and Interpretation of demographic factors.
| Sr.N | Demographic Factors | Descriptions | Responses | % |
|---|---|---|---|---|
| 1 | Gender | Male | 356 | 56.5 |
| Female | 274 | 43.5 | ||
| Total | 630 | 100.0 | ||
| 2 | Age | Below 18 | 68 | 10.8 |
| 19-23 | 305 | 48.4 | ||
| 24-28 | 108 | 17.1 | ||
| 29-33 | 27 | 4.3 | ||
| 34 and more | 122 | 19.4 | ||
| Total | 630 | 100.0 | ||
| 3 | Marital Status | In Relationship | 21 | 3.3 |
| Married | 222 | 35.2 | ||
| Unmarried | 387 | 61.4 | ||
| Total | 630 | 100.0 | ||
| 4 | Occupation | Salaried | 169 | 26.8 |
| Businessman | 94 | 14.9 | ||
| Professional | 109 | 17.3 | ||
| Retired | 258 | 41.0 | ||
| Total | 630 | 100.0 | ||
| 5 | Monthly income | Below 30,000 | 413 | 65.6 |
| 30,000 to 50,000 | 105 | 16.7 | ||
| 50,000 to 70,000 | 55 | 8.7 | ||
| 70,000 or more | 57 | 9.0 | ||
| Total | 630 | 100.0 |
Sources: self-constructed from the questionnaire data.
Analysis and Interpretations:
Table 2 Researchers obtained data from 630 respondents in this study, 274 (43.5%) of whom were female and 356 (56.5%) were male. The bulk of investors are between the ages of 19 and 33, with 305 (48.4%) respondents falling into this category. Only 27 (4.3%) of those polled are between the ages of 29 and 33. More than 122 (19.4%) responders are over the age of 34. Researchers discovered that the bulk of respondents, 387 (61.4%), were unmarried, followed by married respondents, 222 (35.2%), when they examined the marital status of the respondents. Only 21 (3.3%) of the respondents are in a relationship. In terms of occupation, 258 (41%) of respondents were retired, followed by salaried people (169) (26.8%). In the case of the monthly income majority, 413 (65.6%) of respondents had a monthly income of less than 30,000, followed by 105 (16.7%) with a monthly income of 30,000 to 50,000. There were 57 (9%) respondents earning Rs 70,000 or higher.
Table 3.
Result and Interpretation of Weighted average Means of service quality factors.
| Particulars (Process Related Factors) | NI | SI | MI | I | VI | WAM |
| Customer side Application System | 13 | 24 | 64 | 270 | 259 | 4.17 |
| Restaurant side Application System | 9 | 28 | 82 | 283 | 228 | 4.1 |
| Payment System (UPI, Cash, Net Banking etc.)` | 9 | 23 | 70 | 160 | 368 | 4.35 |
| Delivery System for Takeaway Orders | 14 | 34 | 71 | 220 | 291 | 4.17 |
| Rewards, Offers and Discount Coupons | 35 | 27 | 75 | 270 | 223 | 3.98 |
| Order Tracking System | 13 | 16 | 62 | 239 | 300 | 4.26 |
| Serving Style and Facilities | 3 | 18 | 51 | 219 | 339 | 4.39 |
| Time for Food Preparation | 10 | 14 | 38 | 186 | 382 | 4.45 |
| Particulars (People Related Factors) | NI | SI | MI | I | VI | WAM |
| Welcome Staff | 14 | 30 | 86 | 227 | 273 | 4.13 |
| Employee Behaviour | 10 | 3 | 38 | 165 | 414 | 4.54 |
| Experienced Employee | 7 | 25 | 95 | 224 | 279 | 4.17 |
| Make you Feel Special | 7 | 25 | 100 | 251 | 247 | 4.12 |
| Focus on Customers' Special Request | 13 | 8 | 47 | 218 | 344 | 4.38 |
| Peer Group Influence | 14 | 29 | 140 | 293 | 154 | 3.86 |
| Past Experience of Consumers | 8 | 29 | 56 | 264 | 273 | 4.21 |
| Celebrities Endorsement | 42 | 41 | 160 | 237 | 150 | 3.65 |
| Provide Ease of Selection to Customers | 13 | 12 | 94 | 252 | 259 | 4.16 |
| Particulars (Physical Environment of Restaurant ) | NI | SI | MI | I | VI | WAM |
| Lighting, Temperature and Aroma | 7 | 4 | 50 | 202 | 367 | 4.46 |
| Background Music | 10 | 20 | 115 | 289 | 196 | 4.01 |
| Interior Design | 4 | 20 | 95 | 205 | 306 | 4.252381 |
| Seating Arrangements | 11 | 12 | 40 | 182 | 385 | 4.45 |
| Signals for Direction | 13 | 31 | 98 | 227 | 261 | 4.09 |
| Walking Space | 15 | 19 | 77 | 241 | 278 | 4.18 |
| Location | 5 | 5 | 53 | 161 | 406 | 4.52 |
| Overall Environment and Safety | 12 | 11 | 36 | 190 | 381 | 4.45 |
| Parking Facilities | 6 | 10 | 45 | 162 | 407 | 4.51 |
| Architecture of Restaurant | 6 | 23 | 74 | 269 | 258 | 4.19 |
| Particulars (Performance Factors ) | NI | SI | MI | I | VI | WAM |
| Quality of Food | 1 | 4 | 11 | 69 | 545 | 4.83 |
| Taste of Food | 4 | 2 | 22 | 133 | 469 | 4.68 |
| Healthy | 3 | 4 | 39 | 106 | 478 | 4.66 |
| Portion Size of Food in Restaurant | 8 | 21 | 43 | 229 | 329 | 4.34 |
| Served at Appropriate temperature | 18 | 12 | 40 | 229 | 331 | 4.33 |
| Food Presentation | 0 | 20 | 54 | 255 | 301 | 4.32 |
| Provide Better Value for Money | 7 | 9 | 62 | 187 | 365 | 4.41 |
| Services During Waiting Time | 6 | 12 | 60 | 217 | 335 | 4.36 |
| Hygiene/ Cleanliness | 6 | 11 | 23 | 129 | 461 | 4.63 |
| Gratuitous Performance | 4 | 10 | 53 | 212 | 351 | 4.42 |
Sources: self-constructed from the questionnaire data.
Interpretation: Table 3, Based on their perceptions of dining in restaurants, customers' interpretations of the products, facilities, and atmospheres are directly linked to their emotions and psychological objectives. Customer satisfaction and service quality have a long history in the field of restaurant industry management. It was discovered that study into these crucial elements of business success has advanced significantly in the tourism and hospitality fields. The hotel and tourism industries place a great priority on providing excellent customer service, which is a significant source of competitive advantage. [38] The ability of an organisation to satisfy quality benchmarks and surpass customer expectations of service quality is essential to the survival and development of the tourism and hospitality industries. Since 2006, there has been a continuous increase in the number of publications in the service quality factors in the restaurant industry, highlighting the importance of the study topic once again in this paper. [39]
MODEL ASSESSMENT
A convergent validity measurement model (outer model) is assessed that includes composite reliability (CR) to evaluate internal consistency, individual indicator reliability, and average variance extracted (AVE). [40] Indicator reliability explains the variation in the items by a variable. Outer loadings assess indicator reliability; a higher value (an item with a loading of .70) on a variable indicates that the associated measure has considerable mutual commonality. CR values of all the latent variables have higher values than .80 to establish internal consistency; [41]
Interpretation:
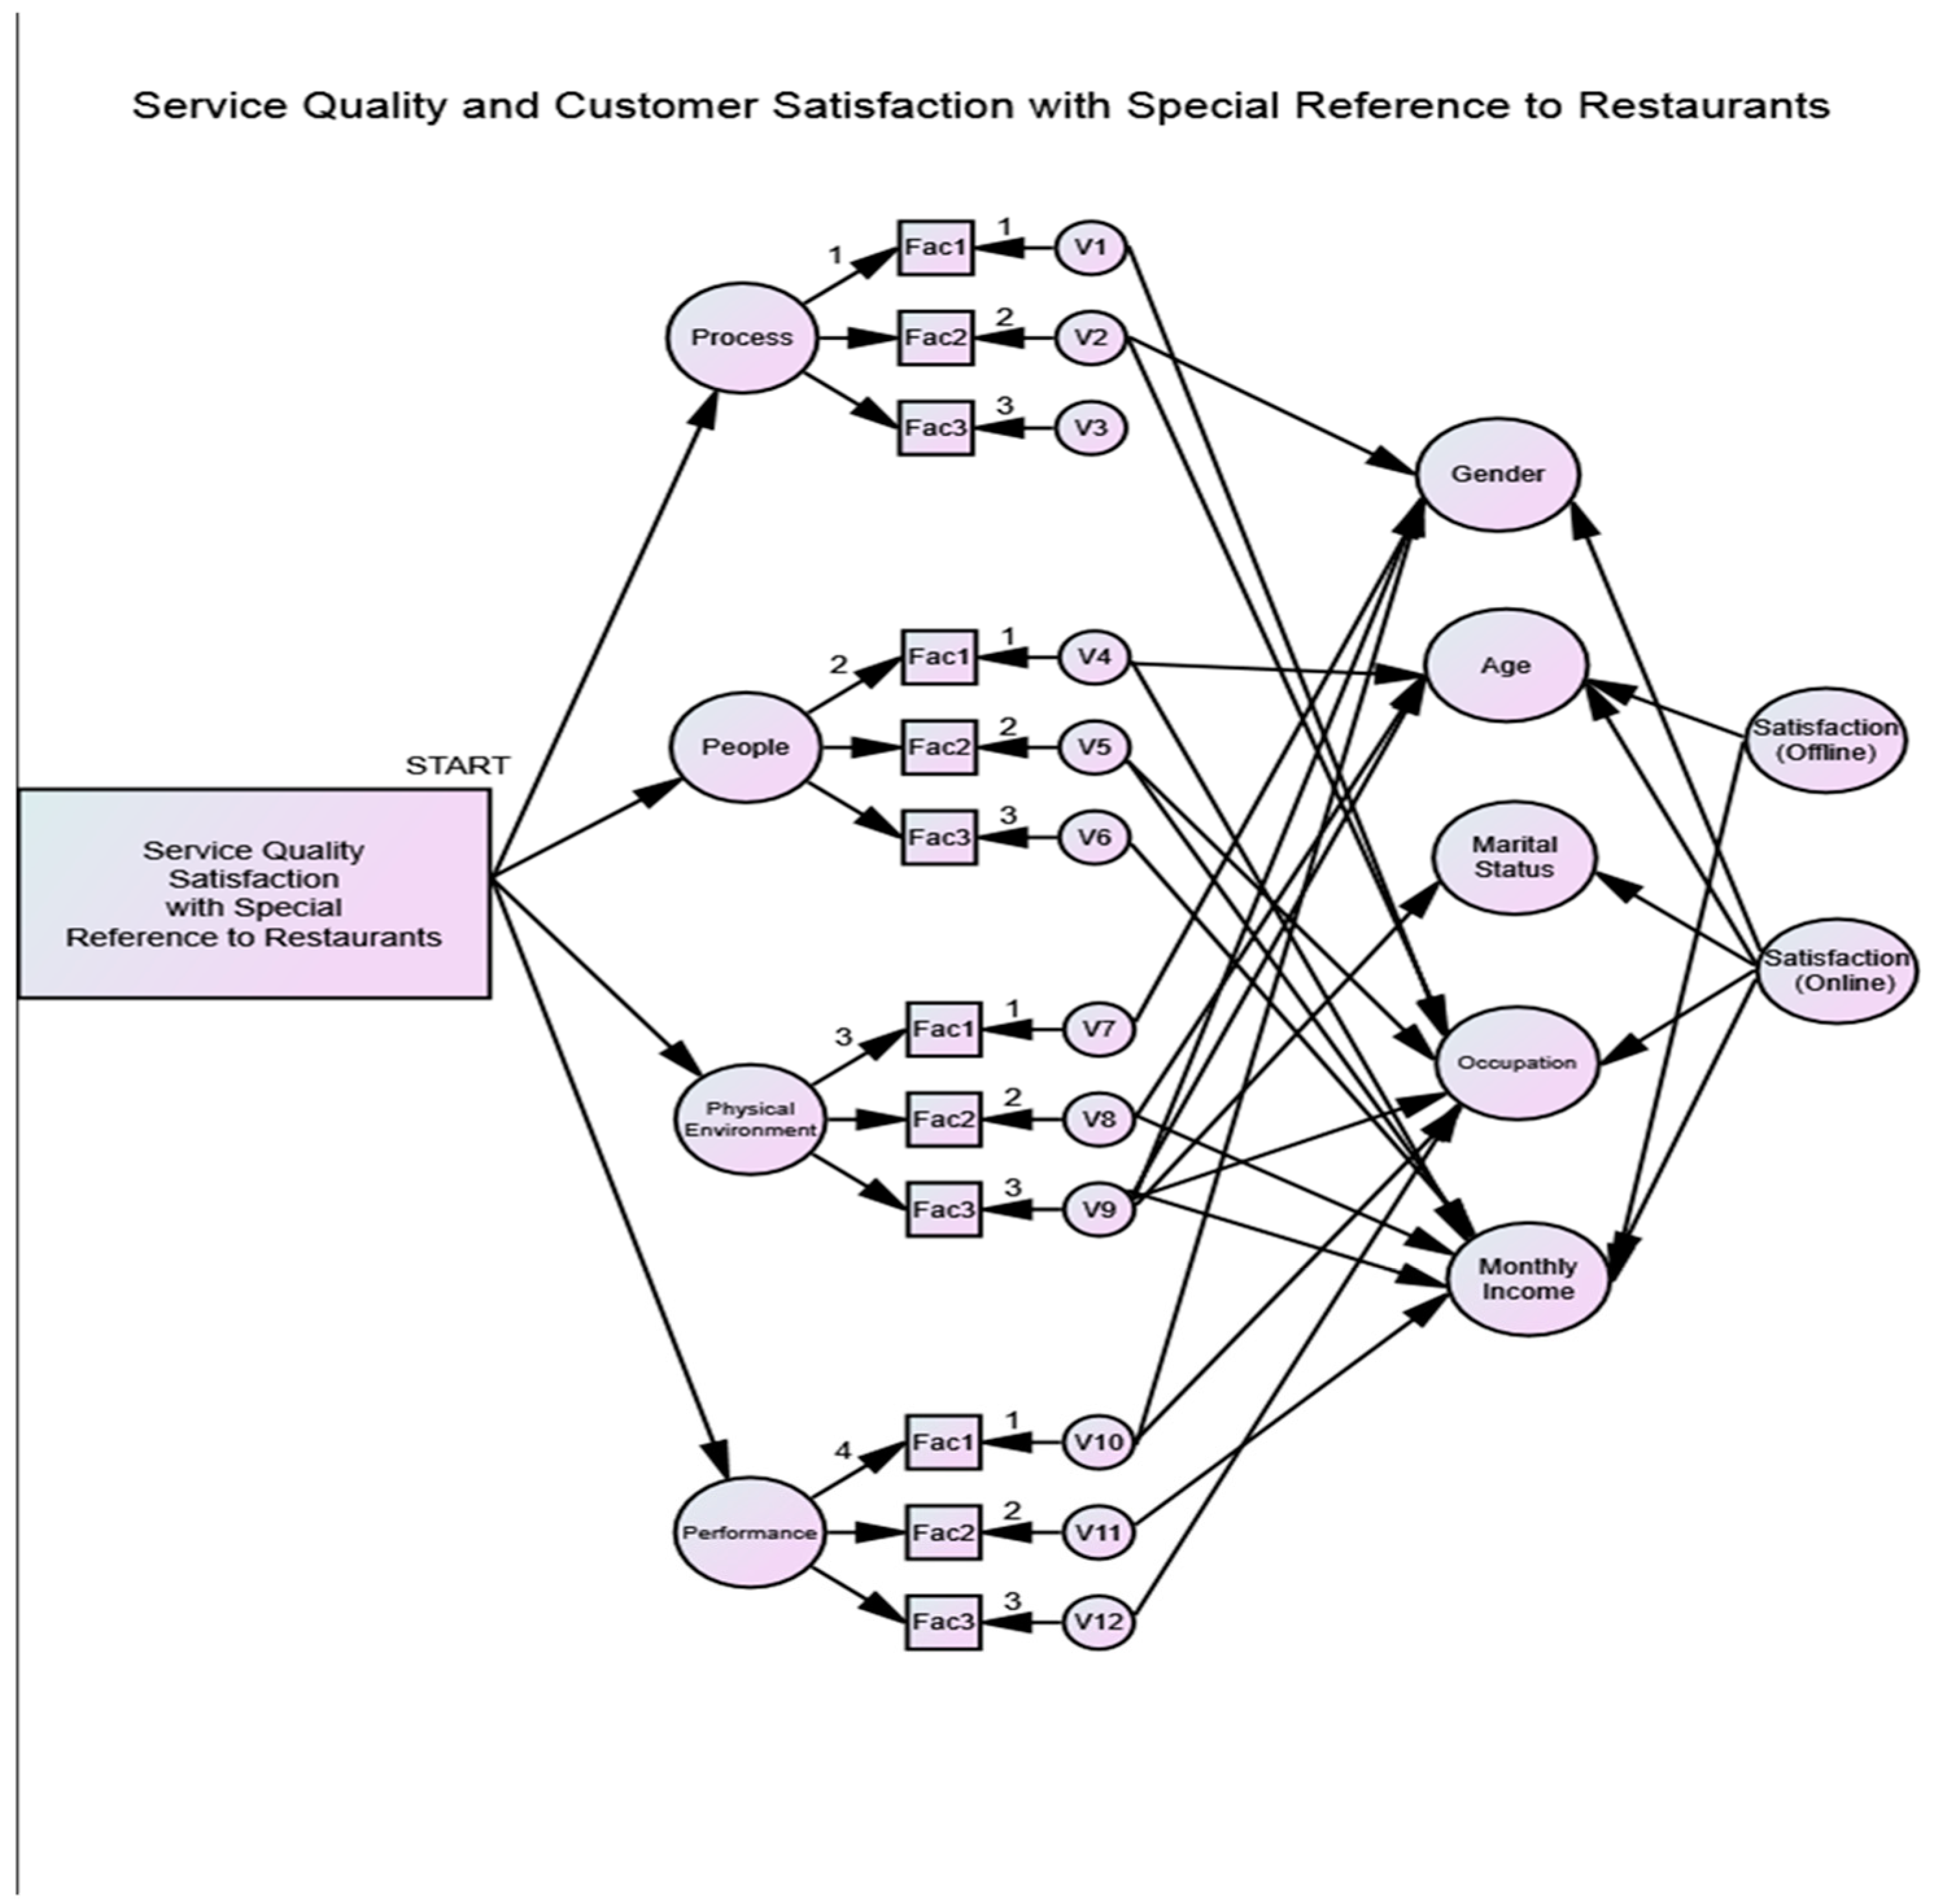
Figure 1 the researchers selected 12 factors from the 37 factors in the preceding picture, which correspond to restaurant service quality factors. The researchers chose service quality parameters to establish, which factors the restaurant sector must consider for maximum customer satisfaction. Researchers conducted factor analysis to discover the 12 factors that are important. 1. Process-related factors: system for take-away orders, order tracking system, and time for food preparation 2. People-related factors: focus on customers' special requests, peer group influence, and making you feel special. 3. Physical Environment: Walking Space, Architecture of the Restaurant, and Signals for Direction 4. Performance-related factors: food served at an appropriate temperature; Food Presentation; Portion size of food in the restaurant. According to the findings, system de takeaway orders are an important factor for the customer, so the restaurant industry has to focus on takeaway orders. The order tracking system is also an important factor, because they are considered, and time for the food and its preparation is an important factor. People-related elements in the industry must focus on particular requests and comments from customers to make them feel like special clients. While visiting a restaurant, the staff of the restaurant must focus on it; thus, the restaurant sector must provide training to employees on how to manage clients in the restaurant. If we look at the physical environment of the restaurant, we can see that walking space, restaurant architecture, and directional signals are all highly important considerations for the restaurant sector. When we go to a restaurant, we focus on the walking space, the signal for the parking direction, and the signal in the restaurant at that location. So here the restaurant has to focus on the food preparation and the temperature of the food; if it is cold, then they do not like the food, so they have to concentrate more on the food and their time.
Figure 2, Customer satisfaction encompasses pleasure and well-being. Consumer satisfaction grows as a result of receiving what the consumer expects from the service. Customer satisfaction is widely studied in the fields of consumer behaviour and social psychology. Customer satisfaction is defined as "the customer's subjective assessment of the consumption experience, based on certain associations between the customer's perceptions and objective product characteristics."[42] Customer satisfaction is the degree to which a consumption experience elicits positive emotions. Customer satisfaction is defined as "a comparison of the level of product or service performance, quality, or other outcomes perceived by the consumer with an evaluative standard". [43] Customer satisfaction is defined as a customer's comprehensive opinion of an experience. Client satisfaction is a result of meeting the needs of the client. Customer satisfaction leads to increased recurrent purchase behaviour and referral intent. [44] Dissatisfied consumers are uncertain to return to the place. [45] A satisfying restaurant experience can increase the consumer's desire to return. Customers generate positive WOM when they are not only satisfied with the brand but also want excellent core offerings and a high level of service. [46]
1. Process Related Factors: system for take-away orders, order tracking system, and time for food preparation. Take-Away Orders: It's crucial to have a system in place for managing takeaway orders. Orders placed over the phone, online through a website or app, or in person at the restaurant may all fall under this category. This procedure can be made more efficient to assure accuracy and client satisfaction. Order Management Software: It's critical to implement software that keeps track of orders from the time they're placed until they're delivered or picked up. By doing so, errors may be avoided, orders can be tracked, and customers can get real-time updates on their orders. Kitchen Efficiency: The amount of time spent cooking is crucial. To ensure that orders are produced fast without sacrificing quality, the kitchen staff should be well-trained, and workflows should be optimised.
2. People Related Factors: focus on customers' special requests, peer group influence, and making you feel special. Focus on Special Requests: The dining experience can be greatly improved by making sure staff members pay attention to and meet clients' special requests or dietary restrictions. Peer Group Influence: To account for peer group dynamics, consider seating configurations that accommodate various groups, such as families, couples, or bigger gatherings. Making Customers Feel Special: Giving customers individualised care, such as remembering their names and preferences, may establish a deep emotional bond and make clients feel appreciated.
3. Physical Environment of Restaurant: Walking Space, Architecture of the Restaurant, and Signals for Direction
Walking Space: Make sure there is enough room among tables or sitting places so that customers and staff may move about without feeling crowded. For customers with disabilities, accessibility can be further enhanced by providing enough walking space. Architecture and Interior Design: The restaurant's architecture and interior design should align with its theme, concept, and target demographic. The ambiance created by the decor, lighting, and layout should complement the dining experience. Directional Signage: Directional signage may enhance both the customer experience and safety by clearly and strategically placing signs that point to the toilets, emergency exits, and particular parts of the restaurant.
4. Performance Factors: food served at an appropriate temperature; Food Presentation; Portion size of food in the restaurant. Food Served at Appropriate Temperature: Temperature Control: Food safety and flavour both depend on serving it at the proper temperature. Cold meals ought to be chilled and hot dishes ought to be heated. This covers the right temperatures for cooking, serving, and storing. Food Presentation: Plating and Garnishing: A diner's opinion of a dish can be significantly influenced by how it is presented on the plate. A meal can be more aesthetically pleasing by paying attention to the plating, garnishing, and arrangement of its components. Portion Size: Portion sizes should match the menu's description and cost while also satisfying customer expectations. The perception of value and consumer satisfaction might be affected by excessively large or little amounts.
Overall satisfaction level with respect to restaurant online and offline
Pleasant and content feelings are components of customer satisfaction. When clients receive the service as expected, customer satisfaction grows. Customer happiness is a topic that is extensively studied in social psychology and consumer behaviour. "The customer's subjective assessment of the consumption experience, grounded on certain associations between the customer's perceptions and the objective characteristics of the product," is how customer satisfaction is defined. [47]. Customer satisfaction measures how positively a purchasing experience makes the consumer feel. "A comparison of the level of product or service performance, quality, or other outcomes perceived by the consumer with an evaluative standard" is how customer satisfaction is defined. [48]. Customer satisfaction is defined as a customer's objective assessment of a particular experience. The result of meeting the needs of the consumer is customer satisfaction. Customers who are satisfied are more likely to make repeat purchases and recommend products to others. [49]. Unhappy customers are hesitant to visit the establishment again. [50]. A positive dining experience can increase a customer's desire to return. Customers that are satisfied with the brand and also desire a great core offering and high quality of service create positive word-of-mouth marketing (WOM). [51]
Funding
No funding from any organization.
Abbreviations
| MSME | Micro, Small, Medium enterprise |
Acknowledgements
This paper is helpful to the Central Bank (RBI). When searching for research papers, use relevant keywords such as "Reserve Bank of India," "RBI policies," "Fiscal policy in India," "central banking in India," and Government of India so on. Once you find research papers, ensure they are from reputable sources and have been peer-reviewed if possible.
Author contributions
First Author; The COVID-19 pandemic significantly impacted the global economy, including India. 2020 lockdowns and disruptions led to inflationary pressures in sectors. Sources like RBI reports, economic news outlets, and government publications provide the latest data on regarding problems face by MSME. Second Author; Atour’s expertise in data collection methodologies revolutionizes our approach, ensuring meticulous and comprehensive gathering of essential information. Third Author; Author’s contributions to publication and charges are invaluable, encompassing meticulous editing, thorough peer review, and transparent fee structuring to uphold the quality and integrity of scholarly works.
Data Availability Statement
Data for this study would be provided upon request.
Approval and consent to participate
Research advisory committee: In justifying the selected methodology, it is imperative to draw upon relevant literature and precedent studies to support the proposed approach.
Consent for publication
Yes.
Disclosure of Interest
”Disclosure of interest is paramount in maintaining transparency and integrity within academic and professional spheres. Researchers and authors are obligated to provide clear and comprehensive statements regarding any financial, personal, or professional interests that may influence their work or its interpretation. This practice fosters trust, facilitates informed decision-making, and upholds ethical standards in scholarly endeavors.
References
- Berezina K, C. C. (2010). The impact of information security breach on hotel guest perception of service quality, satisfaction, revisit intentions and word-of-mouth. International Journal of Contemporary Hospitality Management , 99-1010. [CrossRef]
- F, A. (2015). The Role of Physical Environment, Price Perceptions, and Consumption Emotions in Developing Customer Satisfaction in Chinese Resort Hotels. Journal of Quality Assurance in Hospitality & Tourism. [CrossRef]
- Hsinkuang, C., KuaChung, H., & Bich Dao, T. N. (2019). Service quality and customer satisfaction in restaurant industry in Vietnam - A comparison between meta-analysis and empirical study. Nanhua University,, Department of Business Administration, Nanhua University,. Vietnam: International Journal of Business and Management Invention (IJBMI).
- L., R., Allem, M., Chrizel, M., Bonimar, A., & Leila, D. (2022). Service Quality and Customer Satisfaction in Dining Restaurants: Inputs for Tourism and Hospitality Curriculum Enhancement. Nueva Vizcaya 3700, Philippines: Academic Journal of Interdisciplinary Studies.
- Norfadzilah, A., Zaidi, M., & Ayu, R. (2019). SERVICE QUALITY AND CUSTOMER SATISFACTION IN RESTAURANT INDUSTRY USING PARTIAL LEAST SQUARE. Malaysia : European Proceedings of Social and Behavioural Sciences.
- R, J. (2017). Alternative measures of satisfaction and word of mouth. Journal of Services Mark. [CrossRef]
- Rajput A, Z. G. (2020). Satisfaction and revisit intentions at fast food restaurants. Future Business Journal , 1-12. [CrossRef]
- Rana M, L. R. (2017). How Determinants of Customer Satisfaction are Affecting the Brand Image and Behavioral Intention in Fast Food Industry of Pakistan? Journal of Tourism & Hospitality. [CrossRef]
- Samuel Putta, S. (2023). Effect of Service Quality on Consumer Satisfaction in Restaurants. Jayawantrao Sawant Institute of Management & Research - Savitribai Phule Pune University, Pune, India, Department of Management. Pune: IJRTI.
- Shaher, M., & Muhammad, A. (2015). IMPACT OF SERVICE QUALITY ON CUSTOMER SATISFACTION IN. Pakistan: SINGAPOREAN JOuRNAl Of buSINESS EcONOmIcS, ANd mANAGEmENt StudIES.
- Rajput, A., Gahfoor, R.Z. Satisfaction and revisit intentions at fast food restaurants. Future Bus J 6, 13 (2020). [CrossRef]
- Villanueva, M. , Alejandro, A. and Ga-an, M. (2023) Measuring the Service Quality, Customer Satisfaction, and Customer Loyalty of Selected Fast-Food Restaurants during the COVID-19 Pandemic. Open Journal of Business and Management, 11, 1181-1207. [CrossRef]
- Harr, Ko King Lily, "Service dimensions of service quality impacting customer satisfaction of fine dining restaurants in Singapore" (2008). UNLV Theses, Dissertations, Professional Papers, and Capstones. 686. [CrossRef]
- HON G Qin & Victor R. Prybutok (2008) Determinants of Customer-Perceived Service Quality in Fast-Food Restaurants and Their Relationship to Customer Satisfaction and BehaviouralIntentions, QualityManagementJournal, 15:2, 3550. [CrossRef]
- Khaldoun I. Ababneh, Subramaniam Ponnaiyan, Ahmed R. ElMelegy, Victor Prybutok. (2022) Determinants of customer satisfaction and behavioral intentions in fast-food restaurants among undergraduate students during the COVID-19 pandemic. Quality Management Journal 29:2, pages 104-124. [CrossRef]
- Kwabena G. Boakye, Victor R. Prybutok, Wesley S. Randall, Kwame S. Ofori. (2023) Emotional connection and customer orientation as moderators in improving the customer satisfaction–behavioral intention link: A moderated moderation service model. Quality Management Journal 30:3, pages 153-167. [CrossRef]
- Ala`a Nimer Abukhalifeh and Ahmad Puad Mat Som., Service Quality, Customer Satisfactions and Restaurants‟ Performance Appraisal in Hotel Industry. Adv. Environ. Biol., 9(3), 27-20, 2015.
- Zibarzani M, Abumalloh RA, Nilashi M, Samad S, Alghamdi OA, Nayer FK, Ismail MY, Mohd S, Mohammed Akib NA. Customer satisfaction with Restaurants Service Quality during COVID-19 outbreak: A two-stage methodology. Technol Soc. 2022 Aug;70:101977. doi: 10.1016/j.techsoc.2022.101977. Epub 2022 Apr 30. [CrossRef] [PubMed] [PubMed Central]
- Zygiaris S, Hameed Z, Ayidh Alsubaie M and Ur Rehman S (2022) Service Quality and Customer Satisfaction in the Post Pandemic World: A Study of Saudi Auto Care Industry. Front. Psychol. 13:842141. [CrossRef]
- Zhou, R., Wang, X., Shi, Y., Zhang, R., Zhang, L., & Guo, H. (2019). Measuring e-service quality and its importance to customer satisfaction and loyalty: an empirical study in a telecom setting. Electronic Commerce Research, 19, 477-499. [CrossRef]
- Timothy Jeonglyeol Lee, Hwaim Cho & Tae-Hong Ahn (2012) Senior Citizen Satisfaction with Restaurant Service Quality, Journal of Hospitality Marketing & Management, 21:2, 215-226. [CrossRef]
- Javed, S., Rashidin, M.S. & Jian, W. Predictors and outcome of customer satisfaction: moderating effect of social trust and corporate social responsibility. Futur Bus J 7, 12 (2021). [CrossRef]
- Alfalih, A.A. Customer engagement design during the COVID 19 pandemic, mutual trust and intelligent automation: a conceptual perspective. J Innov Entrep 11, 32 (2022). [CrossRef]
- Graf-Drasch, V., Röglinger, M., Wenninger, A. et al. A Contextualized Acceptance Model for Proactive Smart Services. Schmalenbach J Bus Res 74, 345–387 (2022). [CrossRef]
- Service Quality and Customer Satisfaction in Dining Restaurants: Inputs for Tourism and Hospitality Curriculum Enhancement. (2022). Academic Journal of Interdisciplinary Studies, 11(3), 30. [CrossRef]
- Pan, Huifeng, and Hong-Youl Ha. 2021. "Service Quality and Satisfaction in the Context of Varying Levels of Restaurant Image and Customer Orientation during the COVID-19 Pandemic" Sustainability 13, no. 17: 9694. [CrossRef]
- Shyju P.J., Kunwar Singh, Jithendran Kokkranikal, Rahul Bharadwaj, Somesh Rai & Jiju Antony (2023) Service Quality and Customer Satisfaction in Hospitality, Leisure, Sport and Tourism: An Assessment of Research in Web of Science, Journal of Quality Assurance in Hospitality & Tourism, 24:1, 24-50. [CrossRef]
- Namkung, Y., & Jang, S. C. (2007). Does Food Quality Really Matter in Restaurants? Its Impact On Customer Satisfaction and Behavioral Intentions. Journal of Hospitality and Tourism Research, 31(3), 387-409. [CrossRef]
- Cheng-Wen Liao (2009) Service quality and customers’ satisfaction of the food and beverage industry, Journal of Statistics and Management Systems, 12:4, 759-774. [CrossRef]
- Zibarzani, M., Abumalloh, R. A., Nilashi, M., Samad, S., Alghamdi, O. A., Nayer, F. K., Ismail, M. Y., Mohd, S., & Mohammed Akib, N. A. (2022). Customer satisfaction with Restaurants Service Quality during COVID-19 outbreak: A two-stage methodology. Technology in society, 70, 101977. [CrossRef]
- Ahmad, S. Z., Ahmad, N., & Papastathopoulos, A. (2018). Measuring service quality and customer satisfaction of the small-and medium-sized hotels (SMSHs) industry: lessons from United Arab Emirates (UAE). Tourism Review, 74(3), 349-370. [CrossRef]
- Samuel Putta, S. (2023). Effect of Service Quality on Consumer Satisfaction in Restaurants. Jayawantrao Sawant Institute of Management & Research - Savitribai Phule Pune University, Pune, India, Department of Management. Pune: IJRTI.
- Simonin BL (1999) Ambiguity and the process of knowledge transfer in strategic alliances. Strateg Manag J 20(7):595–623. [CrossRef]
- Robson MJ, Katsikeas CS, Bello DC (2008) Drivers and performance outcomes of trust in international strategic alliances: the role of organizational complexity. Organ Sci 19(4):647–665. [CrossRef]
- Sekaran U (2006)research methods for business: a skill building approach. wiley, new york.
- Fornell C, Larcker DF (1981) Evaluating structural equation models with unobservable variables and measurement error. J Mark Res 18(1):39–50. [CrossRef]
- Cronbach LJ (1951) Coefficient alpha and the internal structure of tests. Psychometrika 16(3):297–334.
- Shyju P.J., Kunwar Singh, Jithendran Kokkranikal, Rahul Bharadwaj, Somesh Rai & Jiju Antony (2023) Service Quality and Customer Satisfaction in Hospitality, Leisure, Sport and Tourism: An Assessment of Research in Web of Science, Journal of Quality Assurance in Hospitality & Tourism, 24:1, 24-50. [CrossRef]
- Hair JF Jr, Hult GTM, Ringle C, Sarstedt M (2016) A primer on partial least squares structural equation modeling (PLS-SEM). Sage Publications, Thousand Oaks.
- Nunnally JC (1978) Psychometric theory. McGraw-Hill, New York.
- Fornell C, Larcker DF (1981) Evaluating structural equation models with unobservable variables and measurement error. J Mark Res 18(1):39–50. [CrossRef]
- Pizam, A., Shapoval, V., & Ellis, T. (2016). Customer satisfaction and its measurement in hospitality enterprises: a revisit and update. International journal of contemporary hospitality management, 28(1), 2-35. [CrossRef]
- Westbrook, R. A., & Oliver, R. L. (1991). The dimensionality of consumption emotion patterns and consumer satisfaction. Journal of consumer research, 18(1), 84-91. [CrossRef]
- Prayag, G., Hosany, S., Muskat, B., & Del Chiappa, G. (2017). Understanding the relationships between tourists’ emotional experiences, perceived overall image, satisfaction, and intention to recommend. Journal of travel research, 56(1), 41-54.
- Alegre, J., & Garau, J. (2010). Tourist satisfaction and dissatisfaction. Annals of tourism research, 37(1), 52-73. [CrossRef]
- Sivadas, E., & Jindal, R. P. (2017). Alternative measures of satisfaction and word of mouth. Journal of Services Marketing, 31(2), 119-130. [CrossRef]
- Pizam A, Shapoval V, Ellis T (2016) Customer satisfaction and its measurement in hospitality enterprises: a revisit and update. Int J Contemp Hosp Manag 28(1):2–35.
- Westbrook RA, Oliver RL (1991) The dimensionality of consumption emotion patterns and consumer satisfaction. J Consum Res 18(1):84–91.
- Prayag G, Hosany S, Muskat B, Del Chiappa G (2017) Understanding the relationships between tourists’ emotional experiences, perceived overall image, satisfaction, and intention to recommend. J Travel Res 56(1):41–54.
- Alegre J, Garau J (2010) Tourist satisfaction and dissatisfaction. Ann TTour Res 37(1):52–73.
- Sivadas E, Jindal RP (2017) Alternative measures of satisfaction and word of mouth. J Serv Mark 31(2):119–13.
Figure 1.
Result of Factors Analysis with reference to restaurant.

Figure 2.
Demographic factors and its Impact on Service related factors in tune with Restaurant.
Disclaimer/Publisher’s Note: The statements, opinions and data contained in all publications are solely those of the individual author(s) and contributor(s) and not of MDPI and/or the editor(s). MDPI and/or the editor(s) disclaim responsibility for any injury to people or property resulting from any ideas, methods, instructions or products referred to in the content. |
© 2024 by the authors. Licensee MDPI, Basel, Switzerland. This article is an open access article distributed under the terms and conditions of the Creative Commons Attribution (CC BY) license (http://creativecommons.org/licenses/by/4.0/).
Copyright: This open access article is published under a Creative Commons CC BY 4.0 license, which permit the free download, distribution, and reuse, provided that the author and preprint are cited in any reuse.


