
Submitted:
16 July 2024
Posted:
17 July 2024
You are already at the latest version
Abstract
The enzyme acetylcholinesterase (AChE) plays a crucial role in the termination of nerve impulses by hydrolyzing the neurotransmitter acetylcholine (ACh). The inhibition of AChE has emerged as a promising therapeutic approach for the management of neurological disorders such as Lewy body dementia and Alzheimer's disease. The potential of various compounds as AChE inhibitors has been investigated. In this study, we evaluated the impact of natural compounds of interest on the intrinsic deformability of human AChE using computational biophysical analysis. Our approach incorporates classical dynamics, elastic networks, statistical potentials, energy frustration, and volumetric cavity analyses. The results revealed that cyanidin induced significant changes in the flexibility and rigidity of AChE, especially in the distribution and volume of internal cavities, compared to model inhibitors such as TZ2PA6, and through a distinct biophysical-molecular mechanism from the other inhibitors considered. These findings suggest that cyanidin could offer potential mechanistic pathways for future research and applications in the development of new treatments for neurodegenerative diseases.
Keywords:
Alzheimer's disease
; structural flexibility
; AChE inhibitors
1. Introduction
The enzyme known as acetylcholinesterase (AChE) is responsible for hydrolyzing acetylcholine and has an esterase activity. It plays a crucial role in the proper functioning of neurons through cholinergic pathways. AChE is primarily found in the synaptic spaces of both the central and peripheral nervous systems, as well as in the membranes of red blood cells. Its main function is to halt nerve impulses by catalyzing the hydrolysis of acetylcholine (ACh), which is a neurotransmitter involved in various cognitive processes within the cholinergic system. Consequently, the inhibition of the AChE enzyme using specific inhibitors has emerged as a promising therapeutic approach for managing a range of neurological disorders, including Lewy body dementia and Alzheimer’s disease [1,2]. Moreover, the accumulation of ACh in synapses can lead to pathological conditions. This occurs when ACh receptors, namely nicotinic and muscarinic receptors, are excessively stimulated, resulting in neurological ailments such as depression, dizziness, headaches, nausea, breathing difficulties, and even sudden death [3].
AChE inhibitors (IECA) are employed in the treatment of these disorders to enhance cholinergic activity by increasing the levels of ACh in cholinergic synapses [3]. Nonetheless, apprehensions regarding the toxicity and adverse effects associated with synthetic substances have spurred the quest for novel, safe, and effective natural compounds. In this regard, plant phenolic compounds have gained significant attention as extensively studied natural products due to their diverse biological applications, including the inhibition of AChE [4].
Indeed, numerous studies have indicated that huperzine A, a derivative of the Chinese herb Huperzia serrata, exhibits selectivity, potency, and reversibility as an inhibitor of the AChE receptor antagonist. Both preclinical research and clinical trials have demonstrated the potential therapeutic effect of huperzine A in Alzheimer’s disease (AD) treatment, although there is currently insufficient evidence to recommend its clinical use. Presently, huperzine A is utilized as a dietary supplement in certain countries [1]. Moreover, our research group has recently investigated other natural compounds, such as cyanidin and resveratrol, for their diverse therapeutic properties, particularly their potential as anti-Alzheimer’s alternatives, given their ability to interact with and inhibit AChE [5,6,7].
Cyanidin, known scientifically as 3,5,7,3’,4’-Pentahydroxyflavilium, 2-(3,4-Dihydroxyphenyl)-3,5,7-trihydroxy-1-Benzopyrylium, is a naturally occurring organic compound that falls under the categories of both flavonoids and anthocyanins. It serves as a pigment and is commonly found in a variety of fruits including blackberries, raspberries, grapes, cherries, blueberries, and even purple corn. Additionally, cyanidin can be found in fruits like apples and plums. The highest concentrations of this compound are typically found in the fruit peel [8].
Resveratrol, chemically known as 3,5,4’-trihydroxystilbene, belongs to the class of stilbenoids, which are natural phenolic compounds. It is classified as a phytoalexin, naturally synthesized by different plants, particularly in the skin of grapes, blueberries, raspberries, and blackberries [9].
The significance of assessing the inherent flexibility or deformability of protein complexes has been well-established. Understanding this intrinsic deformability, which is determined by their three-dimensional structures or the inter-residue contact topology, is crucial for comprehending the flexibility and dynamics of cooperative movements that are closely associated with the structural alterations observed during their biological functions [10,11,12,13,14].
Intrinsic conformational movements play a crucial role in protein function and are typically energetically advantageous. These movements are conserved throughout evolution among orthologs. As a result, it has been observed that the sequences and structures of proteins, shaped by evolutionary processes, rely on their intrinsic dynamics to carry out their specific functions. These intrinsic dynamics can be influenced by various physicochemical perturbations, including ligand-induced changes. Such changes have the potential to alter the preferred modes or conformations that the protein adopts during its functional processes. Particularly, the binding of ligands can regulate the intrinsic dynamics by modifying the energy landscape of the protein, often by influencing its curvature [14].
The intrinsic deformability of AChE has been extensively studied, revealing that the magnitude of its structural fluctuations can significantly increase when specific inhibitors bind to the primary entry channel leading to the active site. This binding effectively abolishes the enzyme’s activity towards natural substrates like acetylcholine. Exploring the intrinsic flexibility of AChE has also been studied by other authors in relation to synthetic compounds obtained through “click” chemistry, resulting in the development of exceptionally potent binding compounds [15,16,17]. This approach enables the design of inhibitors that elicit a pronounced “induced fit” response in AChE, leading to the exposure of previously solvent-hidden regions. Consequently, ligand-induced conformational rearrangements can facilitate the formation of enzyme complexes that optimize their inhibitory activity on AChE by modulating the transient movements associated with both the active and peripheral sites. These interactions can even occur in time-dependent conformations [15,16].
Efforts to investigate the intrinsic deformability of AChE have primarily utilized classical dynamics tools [15,16], and elastic network models [17,18]. These approaches have been employed to analyze the inherent conformational movements of this protein system in the presence and absence of ligands [11,19,20,21]. This type of comparative analysis is particularly valuable due to two main reasons. Firstly, the conformational flexibility of target proteins poses a significant challenge in accurately modeling and describing protein-inhibitor interactions [22,23,24]. Secondly, in theoretical inhibition assays, it is essential to determine whether the observed conformational changes, beyond those naturally controlled by the protein for its functional interactions, could be induced by the inhibitor [25].
In order to tackle the challenges and considerations mentioned above, it is important to highlight that a crucial element in the biophysical exploration of intrinsic conformational movements lies in the utilization of complementary analyses based on statistical energy functions or potentials. These functions describe local interactions along the protein chain, hydrophobic forces, and tertiary interactions. This approach has demonstrated its effectiveness in predicting and interpreting critical regions within proteins with respect to conformational changes, protein folding, and perturbations at complex interfaces [23,26,27].
Likewise, the utilization of algorithms inspired by energy landscape theory provides a means to quantify the localization and distribution of energy within protein structures. This concept proves to be valuable in gaining a deeper comprehension of the biological behavior of proteins and the impact of perturbations on their intrinsic energy. This intrinsic energy, which is conserved, is closely linked to conformational changes and plays a significant role in understanding protein dynamics [28,29,30].
In this study, our objective was to conduct a comprehensive biophysical-computational comparative analysis to investigate the potential impact of natural compounds of interest on the intrinsic deformability of AChE human. To achieve this, we employed models based on classical dynamics, elastic networks, statistical potentials, energy frustration, and volumetric analysis. This computational approach provides an integrative perspective by utilizing various tools to assess the extent of conformational changes induced by the ligands of interest on AChE. This protein system holds significant biomedical relevance, particularly in the context of neurodegenerative diseases.
2. Results and Discussion
2.1. Docking, Inhibitory Potency and Molecular Dynamics (MD) Analysis
Table 1 shows the results of molecular docking obtained by machine learning using the DockThor algorithm for the compounds considered in this study against AChE (Figure 1), and also shows the values of the post-classification performed to validate the viability of the links of the complexes formed using MM/PBSA before and after MD analysis at 200 ns.
All docking results were thermodynamically favorable regardless of the conditions considered in this study, with an overall mean binding energy of ΔG ≈ -12.2 kcal.mol–1. According to DockThor calculations, the thermodynamic mean was ΔG ≈ -9.7 kcal.mol–1, with a minimum of ΔG ≈ -8.9 kcal.mol–1 and a maximum of ΔG ≈ -12.0 kcal.mol–1. TZ2PA6 was the compound with the most favorable binding free energy (ΔG = -12.03 kcal.mol–1) followed by Cyanidin (ΔG = -9.50 kcal.mol–1), while the rest of the compounds presented similar energetics (ΔG ≈ -8.9 kcal.mol–1) as predicted by DockThor. It is important to highlight that both the TZ2PA6 control and Cyanidin bound to residues adjacent to the active site reported for AChE, even highlighting the interaction with the aromatic residue Tyr332, which is also present in the active site of the highly related enzyme BuChE [31,32]. These results are significant because most of the binding affinities predicted by DockThor have been described to be moderate in the range of high to low micromolar affinity units (scores < -8 kcal.mol–1 are associated with submicromolar affinities) [33].
On the other hand, MM/PBSA calculations showed an increase in the binding energies of all compounds after MD with a global mean that increased from ΔGMM/PBSA ≈ -5.8 kcal.mol–1 to ΔGMM/PBSA ≈ -21.1 kcal.mol–1. The thermodynamic mean of MM/PBSA was ΔGMM/PBSA ≈ -13.5 kcal.mol–1, with a minimum of ΔGMM/PBSA ≈ -1.4 kcal.mol–1 and a maximum of ΔGMM/PBSA ≈ -38.8 kcal.mol–1. As predicted by DockThor, TZ2PA6 was the compound with the most favorable relative binding energy calculated by MM/PBSA (ΔGMM/PBSA =-38.78 kcal.mol–1), followed by Huperzine A (ΔGMM/PBSA =-22.74 kcal.mol–1) and Cyanidin (ΔGMM/PBSA =-17.21 kcal.mol–1) after 200 ns MD (Table 1; Figure 2). Resveratrol was one of the compounds with the least favorable relative binding energy in both DockThor predictions and after 200 ns MD according to MM/PBSA calculations (Table 1). These results are important because MM/PBSA calculations have been described to have an overall success rate of ≈74%, even improving the predictions made by efficient scoring functions such as Glide SP (≈59% success rate) [34].
The complexes were used in MD simulations to evaluate the stability of the compounds bound to AChE and select low-energy conformations to study the deformability and conformational and energy-structural changes of AChE in the presence of each ligand [24,35]. From the minimum energy structures generated by MD, empirical data were obtained for 1) MM/PBSA (Table 1), 2) RMSD (Figure 3a), 3) RMSF (Figure 3b), 4) Rg (Figure 3c), and 5) interaction depletion (Figure 3d) as suggested [24,36,37]. The means of the dynamic parameters calculated after 200 ns MD showed stable binding of all the compounds considered in this study to AChE regardless of the nature of the compounds (RMSD ≤ 0.55 Å, RMSF ≤ 0.32 Å and Rg ≤ 0.02 Å) (Figure 3). Cyanidin was the compound that presented the slightly more stable binding oriented towards structural folding (RMSD = 2.33 Å and RMSF = 1.50 Å) compared to the free protein (RMSD = 2.88 Å and RMSF = 1.83 Å) and the rest of the compounds (Figure 3) in terms of both RMSD and RMSF. In all cases, an increase in the type and number of interactions was predicted after 200 ns of MD, with the largest number of predicted interactions being of the hydrophobic type (Figure 3).
By calculating theoretical kinetic parameters of the compounds considered for which inhibition constants (Ki) or IC50 values against AChE have not been described, such as Cyanidin and Resveratrol, a higher inhibitory potency was predicted for Cyanidin (pIC50 = 12.2) compared to Resveratrol (pIC50 = 7.4) (Table 2). When comparing the experimental kinetic calculations described for the rest of the compounds, it was observed that the theoretical kinetic calculations for Resveratrol are similar to those reported experimentally for Huperzine A after an average of 18 assays [38], but less favorable than those reported for TZ2PA6 [17]. The compound Bis-DMM was the compound with the least favorable experimentally reported kinetic parameters [39] (Table 2). These inhibition potency results are in line with most of the binding affinities predicted from the docking algorithm used before MD and based on machine learning, in which the compounds that presented the most favorable energies such as Cyanidin and TZ2PA6 tend to also present submicromolar affinities [33].
2.2. Analysis of Intrinsic Deformability Associated with AChE Conformational Changes
In relation to the structural deformability of the complexes formed between the compounds and AChE after 200 ns of MD, empirical data were obtained using coarse-grained computational strategies recommended to determine possible conformational changes in these dynamic systems (Table 3) [23]. In this sense, and in terms of statistical potentials, all the compounds induced local changes in the protein residues in terms of distance and solvent accessibility. Cyanidin was the compound that mediated the greatest perturbation of the intrinsic accessibility of the residues to the solvent compared to the rest of the complexes, and it was also able to alter the psi (Ψ) angles of the AChE system (Table 3).
On the other hand, it was additionally predicted that the greatest change induced by TZ2PA6 was in terms of the torsion of both phi (φ) and psi (Ψ) angles, while Huperzine A and Resveratrol affected the psi (Ψ) angles to a greater extent (Table 3). These results show how the compounds can perturb the stability of protein biomolecules in relation to the structural fluctuations related to their energy landscape in both free and bound states. This approach allows us to analyze the contribution of residues to the global folding of a conformation, as well as the relationship between the free energy of that conformation and the probability of observing that conformation, as has been reported [23,26].
The predictions of the intrinsic quasi-rigid regions or domains (Q) showed that Cyanidin, in addition to perturbing both specific angles and ASA, was the only compound that increased the number of Q regions, while the rest of the compounds were able to alter these regions but promoted a decrease in them. The increase in the predicted intrinsic Q domains in AChE in the presence of Cyanidin could be related to a redistribution of the intrinsic quasi-rigid regions of AChE, indicating a probable gain in rigidity of the protein system, as opposed to the probable flexibilization of the protein by the rest of the compounds. All complexes presented valid rigidity quality (QS) values, being similar or higher than that calculated for the free protein (Table 3). These perturbations in the Q regions are determinants because, thanks to the specific properties of each complex and the alterations of the free energy landscapes, they can reliably reproduce the structural fluctuations induced by the compounds. The Q region prediction method is based on the notion that, in genuinely rigid regions (validated by the internal quality parameter QS), the distances between two points remain strictly unchanged during MD [23,40].
In addition to the predicted stability at the MD level, statistical potentials, and Q regions, it was observed that all the compounds altered the number of intrinsic nodes (#Nodes) and links (#Links) associated with the alpha carbons and their interactions in AChE, with Cyanidin being the compound that mediated the greatest increase in both the number of nodes and their links, compared to the rest of the complexes and free AChE (Table 3). This greater number of predicted amino acid interaction networks in the AChE + Cyanidin complex have been shown to be valuable for both protein folding and establishing residue contributions to complex binding. In this sense, the stability of Cyanidin binding is due to its having a greater number of interactions of the residues that act as nodes (intersecting, connecting, or binding points) [22,41].
To further investigate and improve the comprehensiveness of the search for possible conformational changes in the complexes, the DynOmics-ENM tool was used, which integrates the two most widely used elastic network models (GNM and ANM). After applying these elastic network models to the complexes considered, it was observed in the same way that all the compounds altered the intrinsic conformational displacement of AChE at the level of the “collectivity” data of the modes, which is indicative of the proportion of conformations that move collectively together in the same mode. Cyanidin was the compound that caused the greatest collective displacement compared to the rest of the complexes and free AChE (Table 3), promoting increased flexibility at the ends of the chain (Figure 4).
The data suggest that the increase in the collectivity of the AChE + Cyanidin complex could be associated with the stable binding of Cyanidin, which promotes an increase in the local rigidity of the complex by displacing the intrinsic flexibility of the system to the ends of the chain, being able to drive the conformations of the native structure towards a folded state around the ligand as predicted in the MD analyses, and as predicted by this ENM method, which considers unique characteristics, relating the environment, the prediction of the functional regions of the protein and the modeling of dynamic structures using the coarse-grained approach [42].
ENM also revealed that Cyanidin was the only molecule considered in this study that slightly altered the intrinsic sensitivity (or sensor-like behavior) of the AChE protein system differently from the rest of the compounds. Cyanidin caused the AChE + Cyanidin complex to have a greater propensity to behave as a “receptor” molecule (the greater the magnitude, the more likely a receptor-type response), that is, a greater propensity for residues to receive signals due to the effect of the ligand affecting the native contact time between the residues (Figure 4). The rest of the compounds, although they altered the native response of AChE to perturbations, the measurements were oriented towards the sensor-like behavior of the system, as in the case of the model drug TZ2PA6 (Figure 4).
This behavior can in turn alter the system’s allosteric communication, as shown by the increased number of steps (Communication) required for residues/nodes to transfer interaction-mediated perturbation, as indicated by the stochastic Markov model of information diffusion. This model has been developed to explore communication between residues in proteins and allows the generation of response maps that indicate the regions where residues potentially act as sensors (capable of detecting and responding to changes in the environment) and effectors (participating in the catalysis of chemical reactions, among others) [31,42].
Theoretical methods such as the energy frustration model allow us to locate and quantify the energy frustration present in native protein structures by comparing the contribution to the additional stabilization energy attributed to a given pair of amino acids in the native protein with the energies that would be found through a perturbation (in this case, a ligand) that is capable of creating a different environment for the pair of interacting amino acids in the protein system [30,43]. Based on the energy frustration approaches, a trend similar to that observed in previous deformability analyses was predicted, where Cyanidin was the only one of the compounds whose contribution to folding led to sufficient additional stabilization for normalized native pairs of residues in terms of typical energy fluctuation (according to the global scoring criterion established by the model for minimum frustration) (Figure 5). Cyanidin managed to decrease local interaction and generate an increase in the protein regions called “minimally frustrated” or stabilized [30], as observed in terms of MD and ENM.
2.3. Volumetric Analysis of Internal Cavities
All compounds altered the distribution of AChE’s internal cavities with an average of ≈ 132 Å3, which represented a difference of ≈ 5 Å3 compared to the average volume of AChE’s intrinsic internal cavities after 200 ns MD, with an average minimum of ≈ 40 Å3 and a maximum of ≈ 528 Å3. Cyanidin was the compound that produced the greatest variability in the distribution of internal cavity volume (Figure 6), generating the largest cavities compared to the other compounds, and even exceeding up to 10 times the volume of the largest internal cavity predicted for AChE (Table 4).
These results were further supported by the analysis of the fluctuation of the volume of the internal cavities. , which showed that Cyanidin is capable of promoting an increase of almost double the fluctuation (≈ 222 Å3) compared to the native volume (≈ 117 Å3), followed by Bis-DMM and unlike the rest of the compounds that decreased this fluctuation (Table 4).
In this sense, when analyzing the probability that the formed internal cavities can be modulated by a drug-like molecule (Druggability Probability), it was found that 95% of the internal cavities generated in AChE by the effect of interaction with Cyanidin, followed by Huperzine A and above the probability predicted for the rest of the compounds considered in this study. In fact, it is important to note that the internal cavities with druggability probability by the effect of Cyanidin were not only those with the highest average number of residues in the site, but 75% corresponded to internal cavities with a Druggability Probability = 1.0, followed by 40% for TZ2PA6 (Figure 7; Table 4).
These druggability predictions are important because this parameter is a key factor in determining whether a drug candidate progresses from an early stage to a more advanced stage. Therefore, druggability allows us to represent the ability of a drug to bind to cavities with high affinity [44].
Therefore, since Cyanidin can generate guided pockets by its proximity, as well as non-guided pockets by said proximity according to the considered druggability prediction model [45], it could serve to mediate synergistic inhibitions as reported [46], or to consider transport assays for other ligands by co-pigmentation using compounds even like those considered in this study [5]. These results are relevant because predicting the ability of protein cavities to bind to drugs or drug-like molecules is of great interest in the target identification phase in drug discovery or repurposing [47].
As shown by the dynamic and energy models, as well as the various volumetric analysis strategies considered in this study to predict the intrinsic deformability of this type of protein system, it is evident that studying the intrinsic flexibility of AChE can be used both for system characterization and for the selection of potential inhibitors of interest such as Cyanidin, as has been previously done by applying similar approaches with the compound TZ2PA6 [15,16]. In addition, the volumetric results offer a mechanistic insight as has been suggested [48], and in turn support the observations of experimental reports demonstrating the inhibitory activity of the compounds tested in this study [17,38,39].
3. Materials and Methods
3.1. Selected Molecules and Preparation from Databases for Docking, Theoretical Inhibition, and Molecular Dynamics (MD)
The crystal structure of human acetylcholinesterase (AChE) (EC3.1.17) (PDB: 4EY5) was obtained in PDB format from the RCSB Protein Data Bank (https://www.rcsb.org/). For this study, we considered protein structure chain A and two drugs: the polyphenol Resveratrol (CID: 445154) and the flavonoid Cyanidin (CID: 128861). These compounds have been computationally investigated as potential alternatives for Alzheimer’s treatment due to their ability to interact with and inhibit AChE [5,6,7]. Additionally, we included the alkaloid as bis-(-)-8-demethylmaritidine (CID: 169450457) [39], and Huperzine A (CID: 854026) [38], and the click chemistry compound TZ2PA6 (CID: 5289508) [38] as experimental controls capable of inhibiting AChE in vitro. All compounds were obtained from PubChem (https://pubchem.ncbi.nlm.nih.gov/) in SDF format and converted to PDB format using OpenBabel-3.0 [48]. The Molegro Molecular Viewer (MMV) [49] and BIOVIA Discovery Studio Visualizer [50] packages were utilized for visualization and file preparation.
To explore the interaction between AChE and the compounds, we constructed complexes using directed molecular docking based on the coordinates of the previously reported binding pocket [39]. To carry out this task, we employed the DockThor tool (https://www.dockthor.lncc.br/), a machine learning-based molecular docking algorithm [51]. In order to enhance accuracy, the program was executed with approximately 1 × 10⁶ evaluations per run, while default parameters were utilized for the remaining configuration settings. One of the advantages of using DockThor is that it provides additional steps for the automatic preparation of ligands, including the addition of partial charges, hydrogen atoms, adjustment of rotatable bonds, among other parameters. During the preparation stage, multiple PDB files were generated from the most favorable poses predicted by DockThor, representing AChE with and without ligands bound. During the sampling and ligand pose generation process, the selection criterion was limited to the three most thermodynamically favorable binding poses (with the highest negative magnitudes). This approach allowed us to focus on the most feasible and thermodynamically favorable positions within the complexes.
Based on this criterion, the selected complexes underwent further analysis, including calculations of inhibitory potency and molecular dynamics (MD). The inhibition constant for binding of ligand to proteins () (in units of M) was obtained as:
The equation provided defines the binding affinity () in kcal mol–1, where R represents the universal gas constant, and T represents the absolute temperature. According to this equation, a higher value indicates weaker binding between the inhibitor and the protein, suggesting a higher likelihood of dissociation of the protein-inhibitor complex. To determine the IC50 values (concentration of the inhibitor required to achieve 50% inhibition), we utilized the IC50-to-Ki web tool (https://bioinfo-abcc.ncifcrf.gov/IC50_Ki_Converter/index.php) assuming competitive inhibition as recommended [24]. In this study, we assumed a hypothetical quantitative or stoichiometric substrate-inhibitor ratio of 1:1 in order to simulate the same amount of protein and inhibitors and thus avoid concentration-driven interactions, based on the assumption of structural similarities between the ligand and the substrate as previously suggested [24,52]. In contrast, the experimental inhibitory concentration values were obtained in molar expression, as described later for each of the compounds considered. MD simulations were conducted on the docking hits with two primary objectives: 1) to assess the relative stability of the ligand within the binding pocket, and 2) to explore the conformations with minimum energy and analyze their impact on the thermodynamic and structural stability of the complexes.
For each protein-ligand complex, a series of procedures were carried out to relax the MD system. This process consisted of three phases: relaxation, equilibrium, and sampling, following recommended protocols [24]. The MD simulation took place in a water system with explicit representation, where the system was immersed in a cubic water box with dimensions of 70 Å for each axis (X, Y, Z) and a minimum distance from the protein to the edge of the box at the beginning of the simulation of 8 Å. The system comprised of 8016 water molecules, 32 Na+ ions, and 22 Cl- ions, resulting in a molar density of Na/Cl = 2.76 × 10⁻³. Each MD system contained one instance of the protein system and one instance of the docking ligand. The simulation used the Amber99SB-ILDN force field and the TIP3P water model, as widely suggested for the study of AChE [53,54,55,56]. The ligands were automatically described using GAFF from the myPresto package, and both the topology files for the ligands and the proteins were generated automatically using the myPresto package [57]. The system was neutralized, and water molecules were treated as rigid bodies, with periodic boundary conditions applied. The simulation was initiated using the steepest descent algorithm and the conjugate gradient energy minimization method, with position restrictions on the atoms of the protein-ligand complex. An initial 100 ps simulation was conducted, allowing water molecules to diffuse around the protein and reach equilibrium with the protein-ligand system. The PME method was used to calculate the electrostatic contribution to non-bonded interactions, with a cutoff of 14 Å. The NVT ensemble was applied for 100 ps to balance all systems and thermalize them at 300 K, followed by a second run of 100 ps using the NPT ensemble to equilibrate the system at 1 atm and 300 K. The SHAKE algorithm was applied to satisfy link geometry constraints. The production step was performed using the output from the NPT ensemble as the initial configuration for an MD production series at a constant temperature of 300 K, with a total simulation time of 200 ns. Minimum energy structures were obtained every 20 ns as target structures for subsequent analyses. The system was neutralized as suggested to study the ligand-protein systems [24]. In addition, several MD simulation analyses were included, such as RMSD (root mean square deviation), RMSF (root mean square fluctuation), Rg (radius of gyration), and interaction depletion, alongside comparisons to positive controls as recommended [24,58,59]. All MD simulations and additional adjustments were carried out using myPresto package, which can be accessed at https://www.mypresto5.jp/en/.
To evaluate the complexes and calculate the binding free energy () from the MD trajectories, we employed the widely used molecular dynamics/Poisson-Boltzmann surface area (MM/PBSA) method, which utilizes a thermodynamic integration approach. The final snapshots of the minimized system were subjected to MM/PBSA rescoring, implemented in AMBER22. In line with the aforementioned suggestion, we selected 2500 frames from the last 20 ns of the MD simulation to compute the solvation free energy and molecular mechanics potential energy, which are used to estimate the overall binding affinity of the complexes of interest. The equations to calculate the MM/PBSA binding free energy, as well as the detailed parameters for the MM/PBSA calculation procedures [60], can be found in Supplementary Material. The ΔGMM/PBSA of the complexes was determined based on the frames extracted after the MD simulation. For visualization and analysis, we employed MMV and BIOVIA. For more details on the method, we recommend referring to [24].
3.2. Determination of Conformational Changes of Dynamized Complexes Using Statistical Potentials, Elastic Network Models, and Energy Frustration
3.2.1. Statistical Potentials of Complexes
To determine conformational changes in dynamized complexes, we utilized the CUPSAT (http://cupsat.tu-bs.de/index.jsp) [61] and SWOTein (http://babylone.ulb.ac.be/SWOTein/) packages [62]. These algorithms are inspired by potential statistics and are specifically designed to study protein stability in relation to fluctuations in the energy landscape. CUPSAT (Cologne University Protein Stability Analysis Tool) is a powerful tool used for analyzing and predicting protein stability changes. It employs structural environment-specific atom potentials and torsion angle potentials to predict the unfolding free energy (ΔG) in kcal mol–1 of the complexes. The prediction model of CUPSAT is built upon a dataset of over 4000 non-redundant protein structures with 50% sequence identity. The atomic potentials are derived from a radial pair distribution function and an atomic classification system. Boltzmann energy values are then calculated based on the distribution of radial pairs of amino acid atoms [61]. The details of the equations and theoretical foundations for calculating energy functions of CUPSAT model, which are derived from mean force potentials and are based on the inverse Boltzmann principle (establishing a close relationship between probability densities and energies), are shown in the Supplementary Material.
SWOTein (Strengths and Weaknesses of prOTEINs) is a research tool that investigates how individual residues contribute to the overall folding free energy of proteins. It accomplishes this by utilizing statistical potentials derived from databases that incorporate structural elements, including inter-residue distances. Positive contributions to the free energy are interpreted as stability weaknesses, while negative contributions represent stability strengths. Statistical potentials have proven useful in studying various biophysical properties of proteins, such as protein-protein interactions. The SWOTein model employs knowledge-based mean force potentials derived from datasets of experimentally solved 3D protein structures, employing the principles of the inverse Boltzmann law. The central objective of this model is to establish a relationship between the free energy of a given state and the probability of observing the system in that state. These statistical potentials are based on a coarse-grained representation of protein structures, focusing on main-chain heavy atoms and the amino acid-dependent geometric average center of side chains [62]. The details of the equations and theoretical foundations for calculating energy functions of SWOTein model, are shown in the Supplementary Material.
By combining atomistic MD trajectories and minimum energy structures, we gain a comprehensive understanding of the dynamics and atomic fluctuations within a complex [41]. The low-frequency modes of the Elastic Network Model (ENM) align closely with the dynamic modes or minimum energy structures predicted by MD simulations, exhibiting consistent directions, relative amplitudes of motion, and distances. As a result, several ENM-based approaches enable various applications, including direct MD simulations, and the incorporation of receptor flexibility in docking approaches [63].
3.2.2. Analysis of Intrinsic Deformability Associated with AChE Conformational Changes
In this study, tools based on Elastic Network models (ENM), a technique known as coarse-grained (CG) normal mode analysis (NMA) [64,65], were considered. These tools offer a valuable approach for studying the vibrational dynamics of protein systems near their energy minimum state. In the ENM model, the protein structure is represented using a reduced set of atoms, specifically the Cα atoms, which are treated as nodes. The interactions between pairs of nodes are described by a single-term Hooke harmonic potential. ENM approaches utilize two methods for computing the cross-correlation of atomic motion. The first method, known as the linear cutoff ENM, assumes a force constant for pairwise interactions between Cα atoms within a specified cutoff distance. The second method, referred to as Kovacs-ENM, adjusts the force constant based on the distance between the interacting particles [35,41,66,67,68,69]. The details of the equations and theoretical foundations of ENM, are shown in the Supplementary Material.
Specifically, in this study, we utilized the SPECTRUS (SPECTral-based Rigid Units Subdivision) server (http://spectrus.sissa.it/#home) [40], which performs a decomposition of proteins or protein complexes into quasi-rigid domains. This decomposition is based on analyzing the fluctuations in distances between pairs of amino acids. To compare the functional dynamics of protein complexes with varying degrees of structural similarity, we employed the MD trajectories obtained under the aforementioned conditions. SPECTRUS utilizes an ENM approach, which takes into account the specific properties of each protein complex and its free energy landscape. This allows for reliable reproduction of structural fluctuations [40]. Quasi-rigid domain decomposition methods are based on the concept that, for truly rigid bodies, the distances between any two constituent points remain constant during motion in space [40]. The details of the equations and theoretical foundations of NMA and SPECTRUS, are shown in the Supplementary Material.
In order to further explore and improve the comprehensiveness of our search for potential conformational changes in the complexes, we utilized the DynOmics-ENM server (http://gnm.bahargroup.org/index.php). This server offers a dynamic analysis of biomolecular systems using two popular elastic network models (ENM): Gaussian network model (GNM) and anisotropic network model (ANM). By integrating these models, the server calculates the dynamics of structural coordinates. The DynOmics-ENM method takes into account various unique characteristics, such as the environment, functional site prediction, and the reconstruction of coarse-grained deformed structures. For more detailed information about the method, we recommend referring to [42]. GNM and its extension ANM are elastic network models that operate at a coarse-grained residue level. GNM focuses on predicting the relative magnitudes of fluctuations, while ANM goes a step further by predicting both the magnitudes and directionalities of collective motions. GNM results are generally more robust and are therefore preferred for evaluating square displacements in low-frequency modes. GNM is specifically used to calculate mean-square fluctuations and correlations between residue fluctuations. On the other hand, ANM is utilized to generate conformations that describe residue fluctuations based on the average X-ray structure, specifically in the principal directions of motion [69].
3.2.3. Local Energy Frustration of Complexes
Proteins undergo biologically optimized folding processes to achieve stability and carry out their functions effectively. Consequently, it is expected to observe a certain level of energetic conflict within their local structures. These conflicts enable proteins to explore various conformations within their native set, ultimately contributing to the emergence of “biological function.” In order to gain insights into the configurational patterns, dynamics, and transitions of complex systems, an examination of frustration and its role in the functional dynamics of these complexes was conducted [30]. To quantify the degree of local protein frustration, we utilized the Frustratometer software (http://frustratometro.qb.fcen.uba.ar/) [28,30]. This software is built on the energy landscape theory and provides a model for assessing protein frustration. The Frustratometer employs the Associative Memory, Water Mediated, Structure and Energy Model (AWSEM), a non-additive and coarse-grained force field that can accurately predict protein and complex structures. AWSEM incorporates various factors, including hydrogen bonding and a bioinformatics-based local structure bias term, which considers the effects of neighboring bodies influenced by the local sequence. The local frustration index provided by the Frustratometer measures the contribution of a residue or pair of residues to the overall energy of each structure, particularly when they deviate from their native positions. This index effectively captures the energy variations associated with the molten globule conformations of the polypeptide chain. The local frustration index is particularly valuable for studying tertiary structures and allows for the analysis of energy variations by manipulating parameters such as the distances and densities of the interacting amino acids. For more detailed information about the methodology, we recommend referring to the provided references [28,30]. The details of the equations and theoretical foundations of Frustratometer, are shown in the Supplementary Material.
3.2.4. Volumetric Analysis of Internal Cavities
To determine the changes in the internal cavities of the AChE protein in each complex, the MOLE 2.5 tool (https://mole.upol.cz/) was used. This tool is specialized in the rapid and fully automated localization and characterization of internal cavities in (bio)macromolecular structures [70]. Additionally, the PockDrug tool (https://pockdrug.rpbs.univ-paris-diderot.fr/cgi-bin/index.py?page=Home) was employed to predict pocket druggability or the probability of a drug-like molecule interacting with a specific cavity. This tool provides consistent pharmacological results using different pocket estimation methods. It is robust with respect to pocket boundaries and estimation uncertainties, making it efficient even for pockets that are difficult to estimate. It clearly distinguishes druggable pockets from non-druggable ones using different estimation methods [45]. Besides, the web tool CavityPlus (http://www.pkumdl.cn:8000/cavityplus/index.php#/) was also used for the visualization of the internal cavities. It features a CAVITY module that generates all potential ligand binding sites on protein surfaces. This tool allows assigning different colors to the cavities for easier visual perception. The entire graphical visualization is implemented using the JSmol subprogram on the website [71,72].
On the other hand, knowing that the intrinsic protein flexibility is relevant to the interaction with the ligand and can contribute to the binding process and that the internal cavities play an important role in this structural flexibility and stability [48]; the fluctuation of the cavity volume is estimated using the following equation:
where, is the cavity volume of each true cavity estimated through MOLE 2.5 tool, is the mean value of and N the total number of cavities [48].
4. Conclusions
All binding affinity, theoretical inhibitory potency, and dynamics analyses showed thermodynamically favorable and stable binding of the tested compounds against AChE during the considered molecular dynamic simulation time in this study. TZ2PA6 showed the most favorable binding to AChE, followed by the alkaloid Huperzine A and the flavonoid Cyanidin. On the other hand, intrinsic deformability and frustration analyses revealed that all compounds also induced changes in the intrinsic flexibility and rigidity of AChE, with Cyanidin causing the greatest perturbation in the structure of AChE compared to the compounds used as controls due to its in vitro inhibitory activity. Additionally, volumetric analysis of the internal cavities revealed that although all compounds altered the distribution and size of these cavities within AChE, Cyanidin generated the greatest variability in the distribution of the internal cavity volume. Cyanidin significantly increased the fluctuation of the internal cavity volume. These findings suggest that variations in the binding affinity of the compounds can impact AChE differently. On the other hand, Cyanidin could play an important role as a potential inhibitor of AChE, showing a different biophysical and molecular mechanism than other compounds demonstrated as inhibitors, primarily targeting the alteration of the internal cavities of the AChE system. In this sense, Cyanidin could offer a new avenue for future research and therapeutic applications, especially due to its ability to induce conformational changes, particularly at the level of the internal cavities. This behavior is essential, as the ability of protein cavities to bind to drugs is of great interest in the target identification phase of drug discovery.
Supplementary Materials
The following supporting information can be downloaded at the website of this paper posted on Preprints.org, Table S1: Detailed parameters for the MM/PBSA calculation procedures.
Author Contributions
Conceptualization, L.G.-P and Y.J.A.; Methodology, L.G.-P. and Y.J.A.; Investigation, L.G.-P., M.A.L.-G., J.S.C., C.L., A.V., Y.M.-P., F.M.-R., P.R.-L., Y.B., J.V.-V., Y.J.A., Writing-Reviewing and Editing, L.G.-P., J.L.P., P.R.-L., Y.J.A.
Funding
CONCYTEC - project No. PE501078236-2022-PROCIENCIA.
Institutional Review Board Statement
Not applicable.
Informed Consent Statement
Not applicable.
Data Availability Statement
The original contributions presented in the study are included in the article.
Acknowledgments
The authors J.L.P, M.A.L.G. and J.S.C. thank CONCYTEC for funding the project No. PE501078236-2022-PROCIENCIA.
Conflicts of Interest
The authors declare no conflicts of interest.
References
- G. Marucci, M. Buccioni, D. Dal Ben, C. Lambertucci, R. Volpini, F. Amenta. Efficacy of acetylcholinesterase inhibitors in Alzheimer’s disease. Neuropharmacology. 2021 190, 108352. [CrossRef]
- I. Vecchio, L. Sorrentino, A. Paoletti, R. Marra, M. Arbitrio, The state of the art on acetylcholinesterase inhibitors in the treatment of Alzheimer’s disease. J. Cent. Nerv. Sys. Dis. 2021, 13, 1-13. [CrossRef]
- H. Khan, Mayra, S. Amin, M.A. Kamal, S. Patel, Flavonoids as acetylcholinesterase inhibitors: Current therapeutic standing and future prospects. Biomed Pharmacother. 2018, 101, 860-870. [CrossRef]
- V. Dwibedi, S. Jain, D. Singhal, A. Mittal, S.K. Rath, S. Saxena, Inhibitory activities of grape bioactive compounds against enzymes linked with human diseases. App. Microbiol. Biotechnol. 2022, 106, 1399-1417. [CrossRef]
- B.Y. Chávez, J.L. Paz, L.A. Gonzalez-Paz, Y.J. Alvarado, J.S. Contreras, M.A. Loroño-González. Theoretical Study of Cyanidin-Resveratrol Copigmentation by the Functional Density Theory. Molecules. 2024, 29, 2064. [CrossRef]
- A. Ali, J.J. Cottrell, F.R. Dunshea. Identification and characterization of anthocyanins and non-anthocyanin phenolics from Australian native fruits and their antioxidant, antidiabetic, and anti-Alzheimer potential. Food Res. Int. 2022, 162, 111951. [CrossRef]
- M. Zhang, J. Xue, X. Chen, F.G. Elsaid, E.T. Salem, E.A. Ghanem, A.F. El-Kott, Z. Xu, Bioactivity of hamamelitannin, flavokawain A, and triacetyl resveratrol as natural compounds: Molecular docking study, anticolon cancer, and anti-Alzheimer potentials. Biotechnol. App. Biochem. 2023, 70, 730-745. [CrossRef]
- C. Dini, M.J. Zaro, S.Z. Viña, Bioactivity and functionality of anthocyanins: A review. Curr. Bioact. Compd. 2019, 15, 507-523. [CrossRef]
- Alesci, A., Nicosia, N., Fumia, A., Giorgianni, F., Santini, A., & Cicero, N. Resveratrol and immune cells: a link to improve human health. Molecules. 2022, 27, 424. [CrossRef]
- T.J Narwani 1, C. Etchebest, P. Craveur, S.Léonard, J. Rebehmed, N. Srinivasan, A. Bornot, J-C. Gelly, A.G. de Brevern, In silico prediction of protein flexibility with local structure approach, Biochimie. 2019, 165, 150-155. [CrossRef]
- S.P Tiwari, E. Fuglebakk, S.M. Hollup, L. Skjærven, T. Cragnolini, S.H. Grindhaug, K.M. Tekle, N. Reuter, WEBnm@ v2. 0: Web server and services for comparing protein flexibility. BMC bioinformatics. 2014, 15, 1-12. [CrossRef]
- T. Hrabe, Z. Li, M. Sedova, P. Rotkiewicz, L. Jaroszewski, A.Godzik, PDBFlex: exploring flexibility in protein structures. Nucleic Acids Res. 2016, 44, D423-D428. [CrossRef]
- M. Grimm, T. Zimniak, A. Kahraman, F. Herzog, xVis: a web server for the schematic visualization and interpretation of crosslink-derived spatial restraints. Nucleic Acids Res. 2015, 43, W362-W369. [CrossRef]
- Y. Zhang, P. Doruker, B. Kaynak, S. Zhang, J. Krieger, H. Li, I. Bahar, Intrinsic dynamics is evolutionarily optimized to enable allosteric behavior. Curr. Opin. Struct. Biol. 2020, 62, 14-21. [CrossRef]
- J.M. Bui, J.A. McCammon, Intrinsic conformational flexibility of acetylcholinesterase. Chem. Biol. Interact. 2008, 175, 303-304. [CrossRef]
- Y. Bourne, Z. Radić, H.C. Kolb, K.B. Sharpless, P. Taylor, P. Marchot, Structural insights into conformational flexibility at the peripheral site and within the active center gorge of AChE, Chem. Biol. Interact. 2005, 157, 159-165. [CrossRef]
- Y. Bourne, Z. Radić, P. Taylor, P. Marchot, Conformational remodeling of femtomolar inhibitor− acetylcholinesterase complexes in the crystalline state. J. Am. Chem. Soc. 2010, 132, 18292-18300. [CrossRef]
- K. Hamacher, Efficient perturbation analysis of elastic network models–Application to acetylcholinesterase of T. californica. J. Computat. Phys. 2010, 229, 7309-7316. [CrossRef]
- C.H.M. Rodrigues, D.E.V. Pires, D.B. Ascher, DynaMut: predicting the impact of mutations on protein conformation, flexibility and stability. Nucleic Acids Res. 2018, 46, W350-W355. [CrossRef]
- E. Eyal, G. Lum, I. Bahar, The anisotropic network model web server at 2015 (ANM 2.0). Bioinformatics. 2015, 31, 1487-1489. [CrossRef]
- A. Felline, M. Seeber, F. Fanelli, webPSN v2. 0: a webserver to infer fingerprints of structural communication in biomacromolecules. Nucleic Acids Res. 2020, 48, W94-W103. [CrossRef]
- L. González-Paz, M.L. Hurtado-León, C. Lossada, F.V. Fernández-Materán, J. Vera-Villalobos, M. Loroño, J.L. Paz, L. Jeffreys, Y.J. Alvarado. Structural deformability induced in proteins of potential interest associated with COVID-19 by binding of homologues present in ivermectin: Comparative study based in elastic networks models. J. Mol. Liq. 2021, 340, 117284. [CrossRef]
- A. Delgado, J. Vera-Villalobos, J.L. Paz, C. Lossada, M.L. Hurtado-León, Y. Marrero-Ponce, J. Toro-Mendoza, Y.J. Alvarado, L. González-Paz. Macromolecular crowding impact on anti-CRISPR AcrIIC3/NmeCas9 complex: Insights from scaled particle theory, molecular dynamics, and elastic networks models. Int J Biol Macromol. 2023, 244, 125113. [CrossRef]
- L. González-Paz, C. Lossada, M.L. Hurtado-León, J. Vera-Villalobos, J.L. Paz, Y. Marrero-Ponce, F. Martinez-Rios, Y.J. Alvarado, Biophysical Analysis of Potential Inhibitors of SARS-CoV-2 Cell Recognition and Their Effect on Viral Dynamics in Different Cell Types: A Computational Prediction from In Vitro Experimental Data. ACS Omega. 2024, 9, 8923–8939. [CrossRef]
- A. Bakan, I. Bahar. The intrinsic dynamics of enzymes plays a dominant role in determining the structural changes induced upon inhibitor binding. Proc. Natl. Acad. Sci. U S A. 2009, 106 14349-14354. [CrossRef]
- Q. Hou, F. Pucci, F. Ancien, J-M. Kwasigroch, R. Bourgeas, M. Rooman, SWOTein: a structure-based approach to predict stability strengths and weaknesses of prOTEINs. Bioinformatics. 2021, 37, 1963-1971. [CrossRef]
- V. Parthiban, M.M. Gromiha, M. Abhinandan, D. Schomburg. Computational modeling of protein mutant stability: analysis and optimization of statistical potentials and structural features reveal insights into prediction model development. BMC Struct. Biol. 2007, 7, 54. [CrossRef]
- R.G. Parra, N.P. Schafer, L.G. Radusky, M.Y. Tsai, A.B. Guzovsky, P.G. Wolynes, D.U. Ferreiro, Protein Frustratometer 2: a tool to localize energetic frustration in protein molecules, now with electrostatics, Nucleic Acids Res. 2016, 44, W356-W360. [CrossRef]
- M. Jenik, R.G. Parra, L.G. Radusky, A. Turjanski, P.G. Wolynes, D.U. Ferreiro, Protein frustratometer: a tool to localize energetic frustration in protein molecules. Nucleic Acids Res. 2012, 40, W348-W351. [CrossRef]
- A.O. Rausch, M.I. Freiberger, C.O. Leonetti, D.M. Luna, L.G. Radusky, P.G. Wolynes, D.U. Ferreiro, R. Gonzalo Parra, FrustratometeR: an R-package to compute local frustration in protein structures, point mutants and MD simulations. Bioinformatics. 2021, 37, 3038-3040. [CrossRef]
- Suwanhom, P., Nualnoi, T., Khongkow, P., Tipmanee, V., & Lomlim, L. Novel Lawsone–Quinoxaline Hybrids as New Dual Binding Site Acetylcholinesterase Inhibitors. ACS omega. 2023, 8, 32498-32511. [CrossRef]
- de Almeida, R. B., Barbosa, D. B., do Bomfim, M. R., Amparo, J. A., Andrade, B. S., Costa, S. L., ... & Botura, M. B. Identification of a novel dual inhibitor of acetylcholinesterase and butyrylcholinesterase: in vitro and in silico studies. Pharmaceuticals. 2023, 16, 95. [CrossRef]
- I.A. Guedes, L.S.C. Costa, K.B Dos Santos, A.L M Karl, G.K. Rocha, I.M. Teixeira, M.M. Galheigo, V. Medeiros, E. Krempser, F.L. Custódio, H.J.C Barbosa, M.F. Nicolás, L.E. Dardenne. Drug design and repurposing with DockThor-VS web server focusing on SARS-CoV-2 therapeutic targets and their non-synonym variants. Sci. Rep. 2021, 11, 5543. [CrossRef]
- Z. Wang, X. Wang, Y. Li, T. Lei, E. Wang, D. Li, Y. Kang, F. Zhu, T. Hou, farPPI: a webserver for accurate prediction of protein-ligand binding structures for small-molecule PPI inhibitors by MM/PB (GB) SA methods. Bioinformatics. 2019, 35, 1777-1779. [CrossRef]
- E.C. Dykeman, O.F. Sankey. Normal mode analysis and applications in biological physics, J. Phys. Condens. Mat. 2010, 22, 423202. http://iopscience.iop.org/0953-8984/22/42/423202.
- L.A. González-Paz, C.A. Lossada, L.S. Moncayo, F. Romero, J.L. Paz, J. Vera-Villalobos, A.E. Pérez, E. Portillo, E. San-Blas, Y.J. Alvarado. A Bioinformatics Study of Structural Perturbation of 3CL-Protease and the HR2-Domain of SARS-CoV-2 Induced by Synergistic Interaction with Ivermectins. BRIAC. 2021, 11, 9813. [CrossRef]
- C. Chennubhotla, I. Bahar. Signal Propagation in Proteins and Relation to Equilibrium Fluctuations. PLoS Comp. Biol. 2007, 3, e172. [CrossRef]
- J. Cheung, M.J. Rudolph, F. Burshteyn, M.S. Cassidy, E.N. Gary, J. Love, M.C. Franklin, J.J. Height, Structures of human acetylcholinesterase in complex with pharmacologically important ligands. J. Med. Chem. 2012, 55, 10282-10286. [CrossRef]
- N.V. Duc, V.T. Trang, H.L.T. Anh, L.B. Vinh, N.V. Phong, T.Q. Thuan, N.V. Hieu, N.T. Dat, L.V. Nhan, D.T. Tuan, L.T. Anh, D.T. Thao, B.H. Tai, N.C. Cuong, L.Q. Lien, S.Y. Yang, Acetylcholinesterase inhibition studies of alkaloid components from Crinum asiaticum var. sinicum: in vitro assessments by molecular docking and molecular dynamics simulations. J Asian Nat Prod Res. 2023, 26, 652-662. [CrossRef]
- L. Ponzoni, G. Polles, V. Carnevale, C. Micheletti, SPECTRUS: A dimensionality reduction approach for identifying dynamical domains in protein complexes from limited structural datasets. Structure. 2015, 23, 1516-1525. [CrossRef]
- A. Felline, M. Seeber, F. Fanelli, webPSN v2. 0: a webserver to infer fingerprints of structural communication in biomacromolecules, Nucleic. Acids. Res. 2020, 48, W94-W103. [CrossRef]
- H. Li, Y-Y Chang, J.Y. Lee, I. Bahar, L-W. Yang. DynOmics: dynamics of structural proteome and beyond. Nucleic Acids Res. 2017, 45, W374-W380. [CrossRef]
- L. González-Paz, C. Lossada, M.L. Hurtado-León, F.V. Fernández-Materán, J.L. Paz, S. Parvizi, R.E. Cardenas-Castillo, F. Romero, Y.J Alvarado, Intrinsic Dynamics of the ClpXP Proteolytic Machine Using Elastic Network Models. ACS omega. 2023, 8, 7302-7318. [CrossRef]
- L. Alzyoud, R.A. Bryce, M. Al Sorkhy, N. Atatreh, M.A. Ghattas. Structure-based assessment and druggability classification of protein–protein interaction sites. Sci. Rep. 2022, 12, 7975. [CrossRef]
- H.A. Hussein, A. Borrel, C. Geneix, M. Petitjean, L. Regad, A-C. Camproux, PockDrug-Server: a new web server for predicting pocket druggability on holo and apo proteins. Nucleic. Acids. Res. 2015, 43, W436-W442. [CrossRef]
- K. Singh, R.B. Patil, V. Patel, J. Remenyik, T. Hegedűs, K. Goda. Synergistic Inhibitory Effect of Quercetin and Cyanidin-3O-Sophoroside on ABCB1. Int. J. Mol. Sci. 2023, 24, 11341. [CrossRef]
- H. Abi Hussein, C. Geneix, M. Petitjean, A. Borrel, D. Flatters, A-C. Camproux, Global vision of druggability issues: applications and perspectives. Drug. Discov. Today. 2017, 22, 404-415. [CrossRef]
- Y.J. Alvarado, Y. Olivarez, C. Lossada, J. Vera-Villalobos, J.L. Paz, E. Vera, M. Loroño, A. Vivas, F.J. Torres, L.N. Jeffreys, M.L. Hurtado-León, L. González-Paz. Interaction of the new inhibitor paxlovid (PF-07321332) and ivermectin with the monomer of the main protease SARS-CoV-2: A volumetric study based on molecular dynamics, elastic networks, classical thermodynamics and SPT. Comput. Biol. Chem. 2022, 99, 107692. [CrossRef]
- G. Bitencourt-Ferreira, W. Filgueira de Azevedo Jr, Molegro virtual docker for docking, Methods Mol. Biol. 2019, 2053, 149-167. [CrossRef]
- U. Baroroh, M. Biotek, Z.S. Muscifa, W. Destiarani, F.G. Rohmatullah, M. Yusuf, Molecular interaction analysis and visualization of protein-ligand docking using Biovia Discovery Studio Visualizer, Ind. J. Comput. Biol. 2023, 2, 22-30. [CrossRef]
- I.A. Guedes, M.M. Pereira da Silva, M. Galheigo, E. Krempser, C. Silva de Magalhães, H.J. Correa Barbosa, L.E. Dardenne. DockThor-VS: A Free Platform for Receptor-Ligand Virtual Screening. J. Mol. Biol. 2024, 168548. [CrossRef]
- L.A. González-Paz, C.A. Lossada, F.V. Fernández-Materán, J.L. Paz, J. Vera-Villalobos, Y.J. Alvarado. Can Non-steroidal Anti-inflammatory Drugs Affect the Interaction Between Receptor Binding Domain of SARS-COV-2 Spike and the Human ACE2 Receptor? A Computational Biophysical Study. Front. Phys. 2020, 8, 587606. [CrossRef]
- Nour, H., Hashmi, M. A., Belaidi, S., Errougui, A., El Kouali, M., Talbi, M., & Chtita, S. Design of Acetylcholinesterase Inhibitors as Promising Anti-Alzheimer’s Agents Based on QSAR, Molecular Docking, and Molecular Dynamics Studies of Liquiritigenin Derivatives. ChemistrySelect. 2023, 8, e202301466. [CrossRef]
- Lan, N. T., Vu, K. B., Ngoc, M. K. D., Tran, P. T., Hiep, D. M., Tung, N. T., & Ngo, S. T. Prediction of AChE-ligand affinity using the umbrella sampling simulation. J. Mol. Graph. Model. 2019, 93, 107441. [CrossRef]
- Sirin, G. S., & Zhang, Y. How is acetylcholinesterase phosphonylated by soman? An ab initio QM/MM molecular dynamics study. J. Phys. Chem. A. 2014, 118, 9132-9139. [CrossRef]
- Sirin, G. S., Zhou, Y., Lior-Hoffmann, L., Wang, S., & Zhang, Y. Aging mechanism of soman inhibited acetylcholinesterase. J. Phys. Chem. B. 2012, 116, 12199-12207. [CrossRef]
- K. Kasahara, H. Terazawa, H. Itaya, S. Goto, H. Nakamura, T. Takahashi, J. Higo, myPresto/omegagene 2020: a molecular dynamics simulation engine for virtual-system coupled sampling. Biophys. Physicobiol. 2020, 17, 140–146. [CrossRef]
- P. Coghi, L.J. Yang, J.P.L. Ng, R.K. Haynes, M. Memo, A. Gianoncelli, V.K. Wai Wong, G. Ribaudo. A drug repurposing approach for antimalarials interfering with SARS-CoV-2 spike protein receptor binding domain (RBD) and human angiotensin - converting enzyme 2 (ACE2). Pharmaceuticals. 2021, 14, 954. [CrossRef]
- R. Kumari, V. Kumar, P. Dhankhar, V. Dalal, Promising antivirals for PLpro of SARS-CoV-2 using virtual screening, molecular docking, dynamics, and MMPBSA. J. Biomol. Struct. Dyn. 2023, 4, 4650-4666. [CrossRef]
- Z. Wang, H. Pan, H. Sun, Y. Kang, H. Liu, D. Cao, T. Hou. fastDRH: a webserver to predict and analyze protein–ligand complexes based on molecular docking and MM/PB (GB) SA computation. Brief. Bioinform. 2022, 23, bbac201. [CrossRef]
- V. Parthiban, M.M. Gromiha, D. Schomburg, CUPSAT: prediction of protein stability upon point mutations, Nucleic Acids Res. 2006, 34, W239-W242. [CrossRef]
- Q. Hou, F. Pucci, F. Ancien, J.M. Kwasigroch, R. Bourgeas, M. Rooman, SWOTein: a structure-based approach to predict stability strengths and weaknesses of prOTEINs. Bioinformatics. 2021, 37, 1963-1971. [CrossRef]
- A. Ahmed, F. Rippmann, G. Barnickel, H. Gohlke, A normal mode-based geometric simulation approach for exploring biologically relevant conformational transitions in proteins, J. Chem. Inf. Model. 2011, 51, 1604-1622. [CrossRef]
- J.R, López-Blanco, J.I. Aliaga, E.S. Quintana-Ortí, P. Chacón, iMODS: internal coordinates normal mode analysis server, Nucleic. Acids. Res. 2014, 42, W271-W276. [CrossRef]
- L. Skjaerven, S.M. Hollup, N. Reuter. Normal mode analysis for proteins, J. Mol. Struct. THEOCHEM. 2009, 898, 42-48. [CrossRef]
- P. Doruker, A.R. Atilgan, I. Bahar, Dynamics of proteins predicted by molecular dynamics simulations and analytical approaches: Application to α-amylase inhibitor, Proteins: Struct. Funct. Bioinf. 2000, 40, 512-524. [CrossRef]
- A. R. Atilgan, S. R. Durell, R. L. Jernigan, M. C. Demirel, O. Keskin, I. Bahar, Anisotropy of fluctuation dynamics of proteins with an elastic network model, Biophys. J. 2001, 80, 505-515. [CrossRef]
- M. Seeber, A. Felline, F. Raimondi, S. Muff, R. Friedman, F. Rao, F. Fanelli, Wordom: a user-friendly program for the analysis of molecular structures, trajectories, and free energy surfaces, J. Comput. Chem. 2011, 32, 1183-1194. [CrossRef]
- U. Emekli, D. Schneidman-Duhovny, H.J. Wolfson, R. Nussinov, T. Haliloglu, HingeProt: automated prediction of hinges in protein structures, Proteins: Struct. Funct. Bioinf. 2008, 70, 1219-1227. [CrossRef]
- L. Pravda, D. Sehnal, D. Toušek, V. Navrátilová, V. Bazgier, K. Berka, R.S. Vareková, J. Koca, M. Otyepka, MOLEonline: a web-based tool for analyzing channels, tunnels and pores. Nucleic. Acids. Res. 2018, 46, W368-W373. [CrossRef]
- S. Wang, J. Xie, J. Pei, L. Lai. CavityPlus 2022 update: an integrated platform for comprehensive protein cavity detection and property analyses with user-friendly tools and cavity databases. J. Mol. Biol. 2023, 435, 168141. [CrossRef]
- Y. Xu, S. Wang, Q. Hu, S. Gao, X. Ma, W. Zhang, Y. Shen, F. Chen, L. Lai, J. Pei. CavityPlus: a web server for protein cavity detection with pharmacophore modelling, allosteric site identification and covalent ligand binding ability prediction. Nucleic. Acids. Res. 2018, 46, W374-W379. [CrossRef]
Figure 1.
Structures of a) Resveratrol (CID: 445154), b) Cyanidin (CID: 128861), c) bis-(-)-8-demethylmaritidine (CID: 169450457), d) Huperzine A (CID: 854026) and e) TZ2PA6 (CID: 5289508) drawn using ChemSketch Freeware.
Figure 1.
Structures of a) Resveratrol (CID: 445154), b) Cyanidin (CID: 128861), c) bis-(-)-8-demethylmaritidine (CID: 169450457), d) Huperzine A (CID: 854026) and e) TZ2PA6 (CID: 5289508) drawn using ChemSketch Freeware.
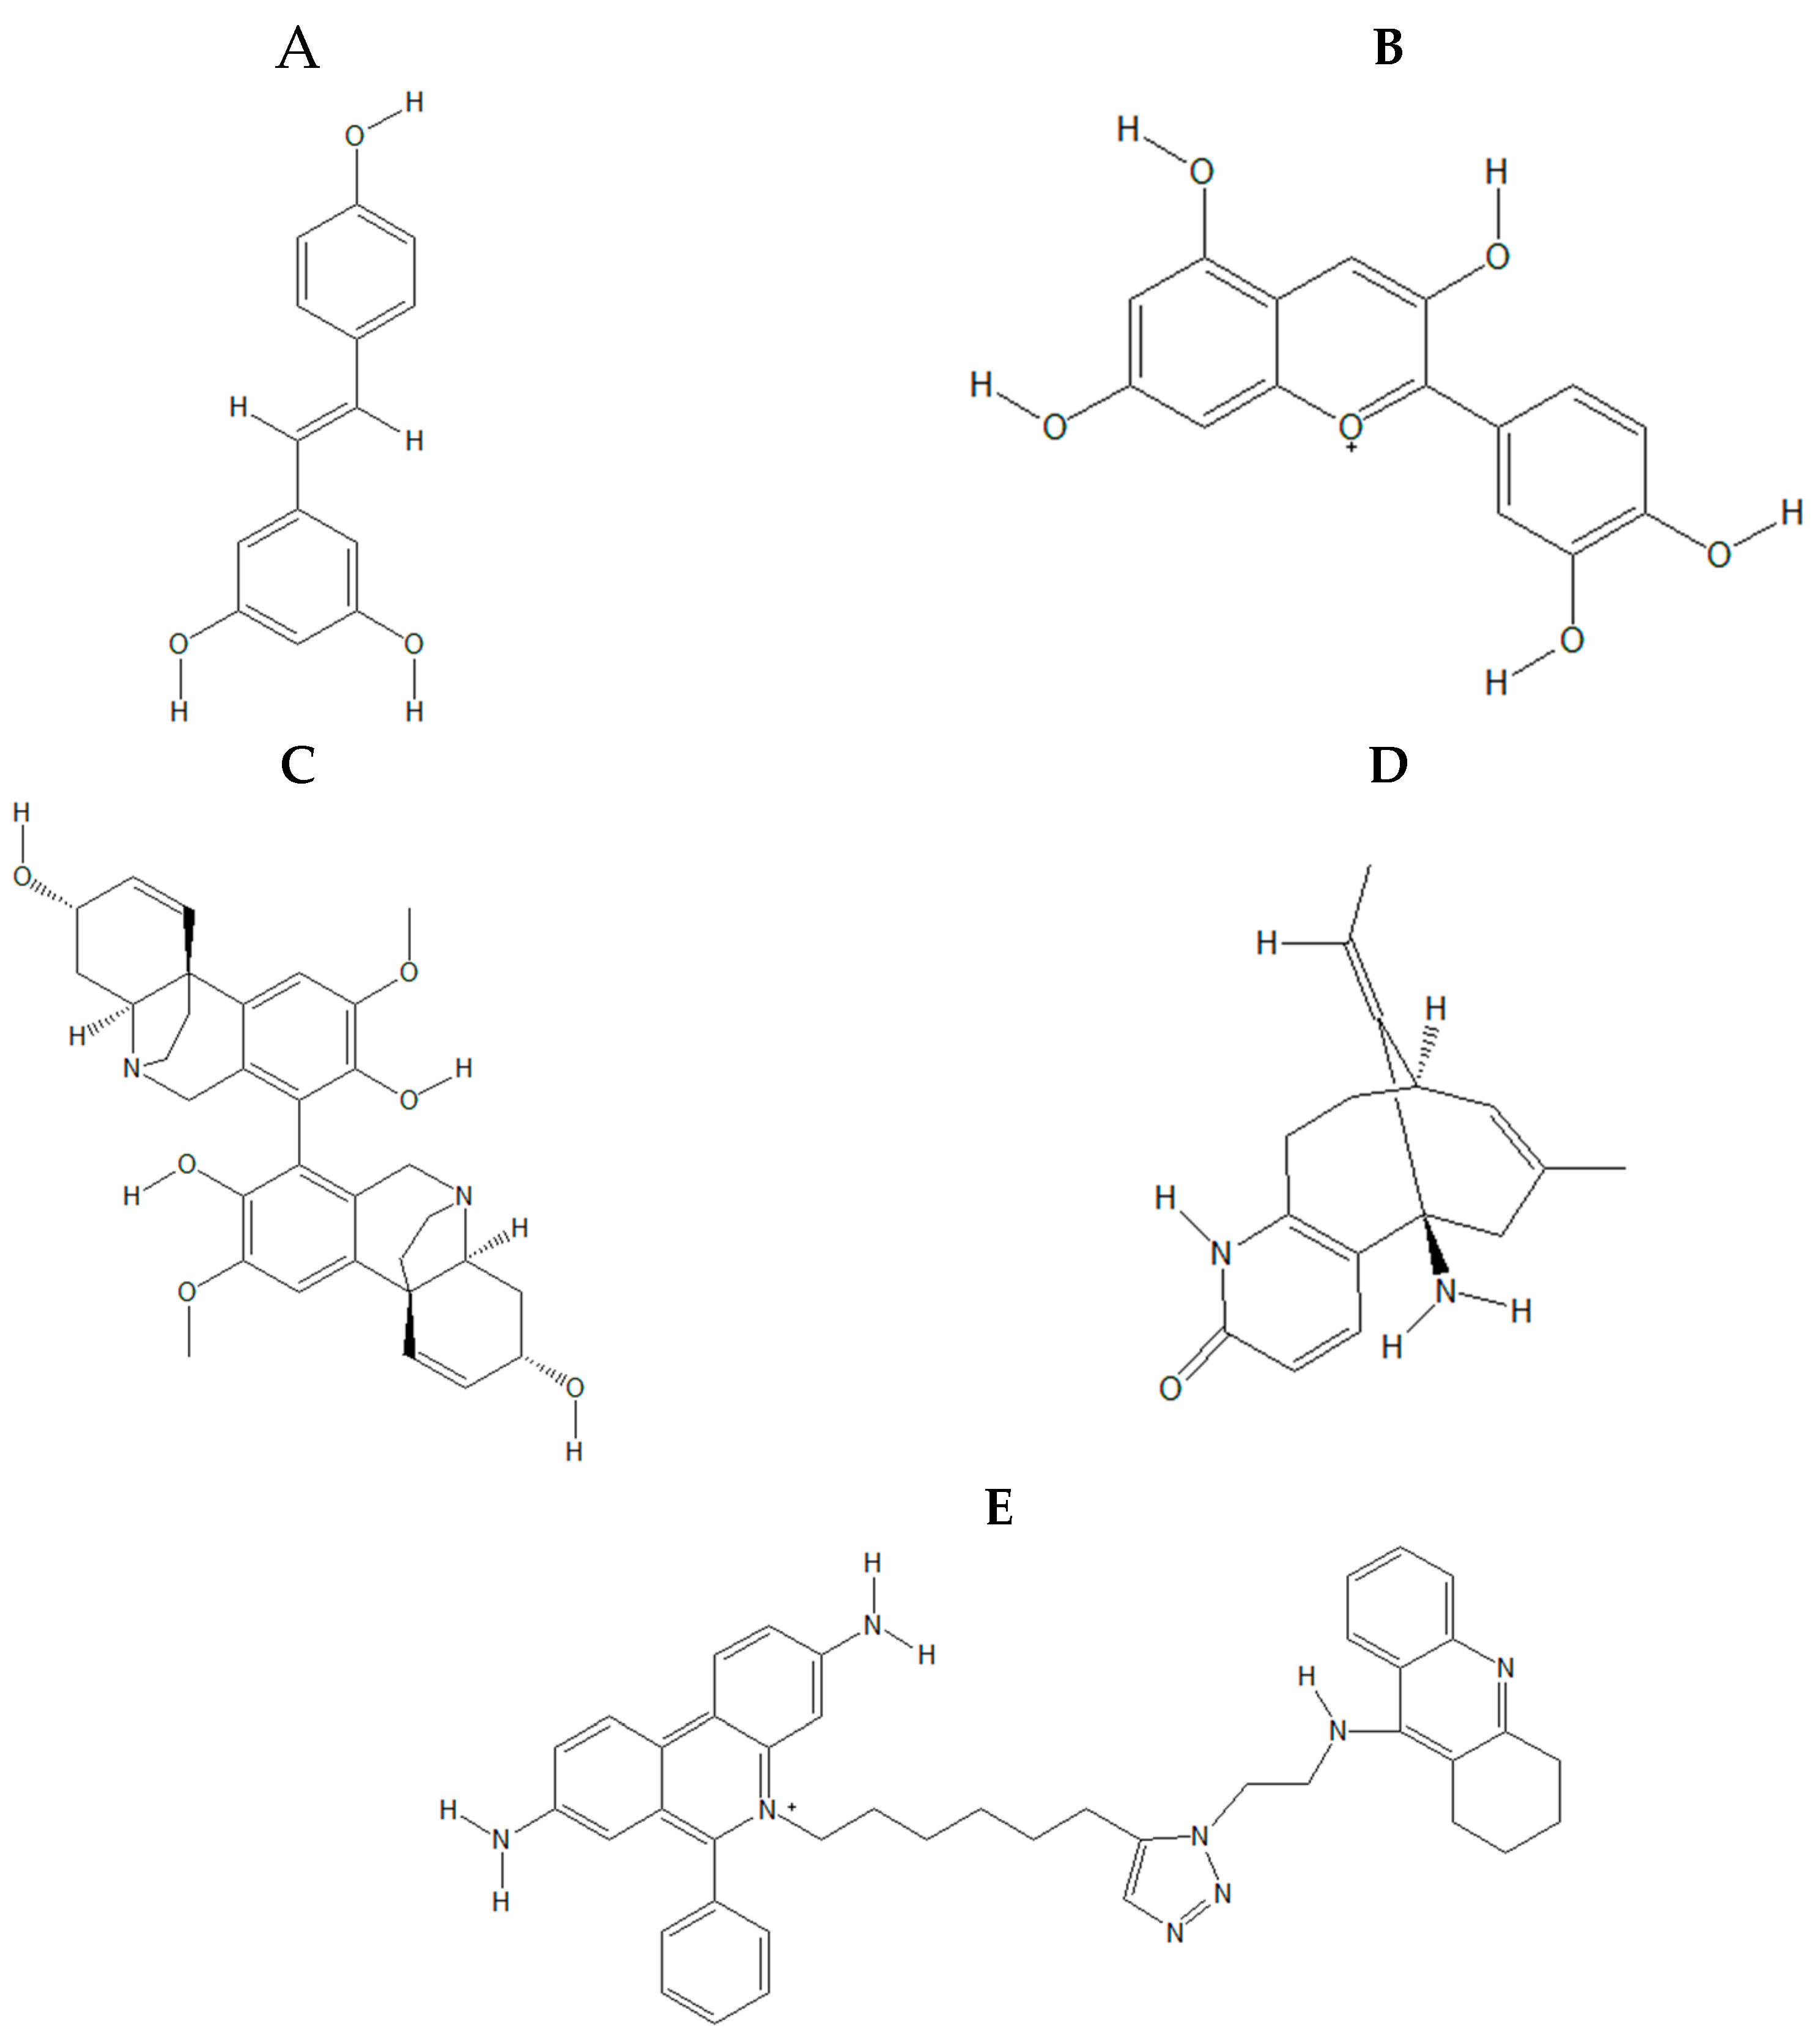
Figure 2.
Minimum energy structures a) TZ2PA6 and b) Cyanidin coupled to AChE after 200 ns MD simulations.
Figure 2.
Minimum energy structures a) TZ2PA6 and b) Cyanidin coupled to AChE after 200 ns MD simulations.
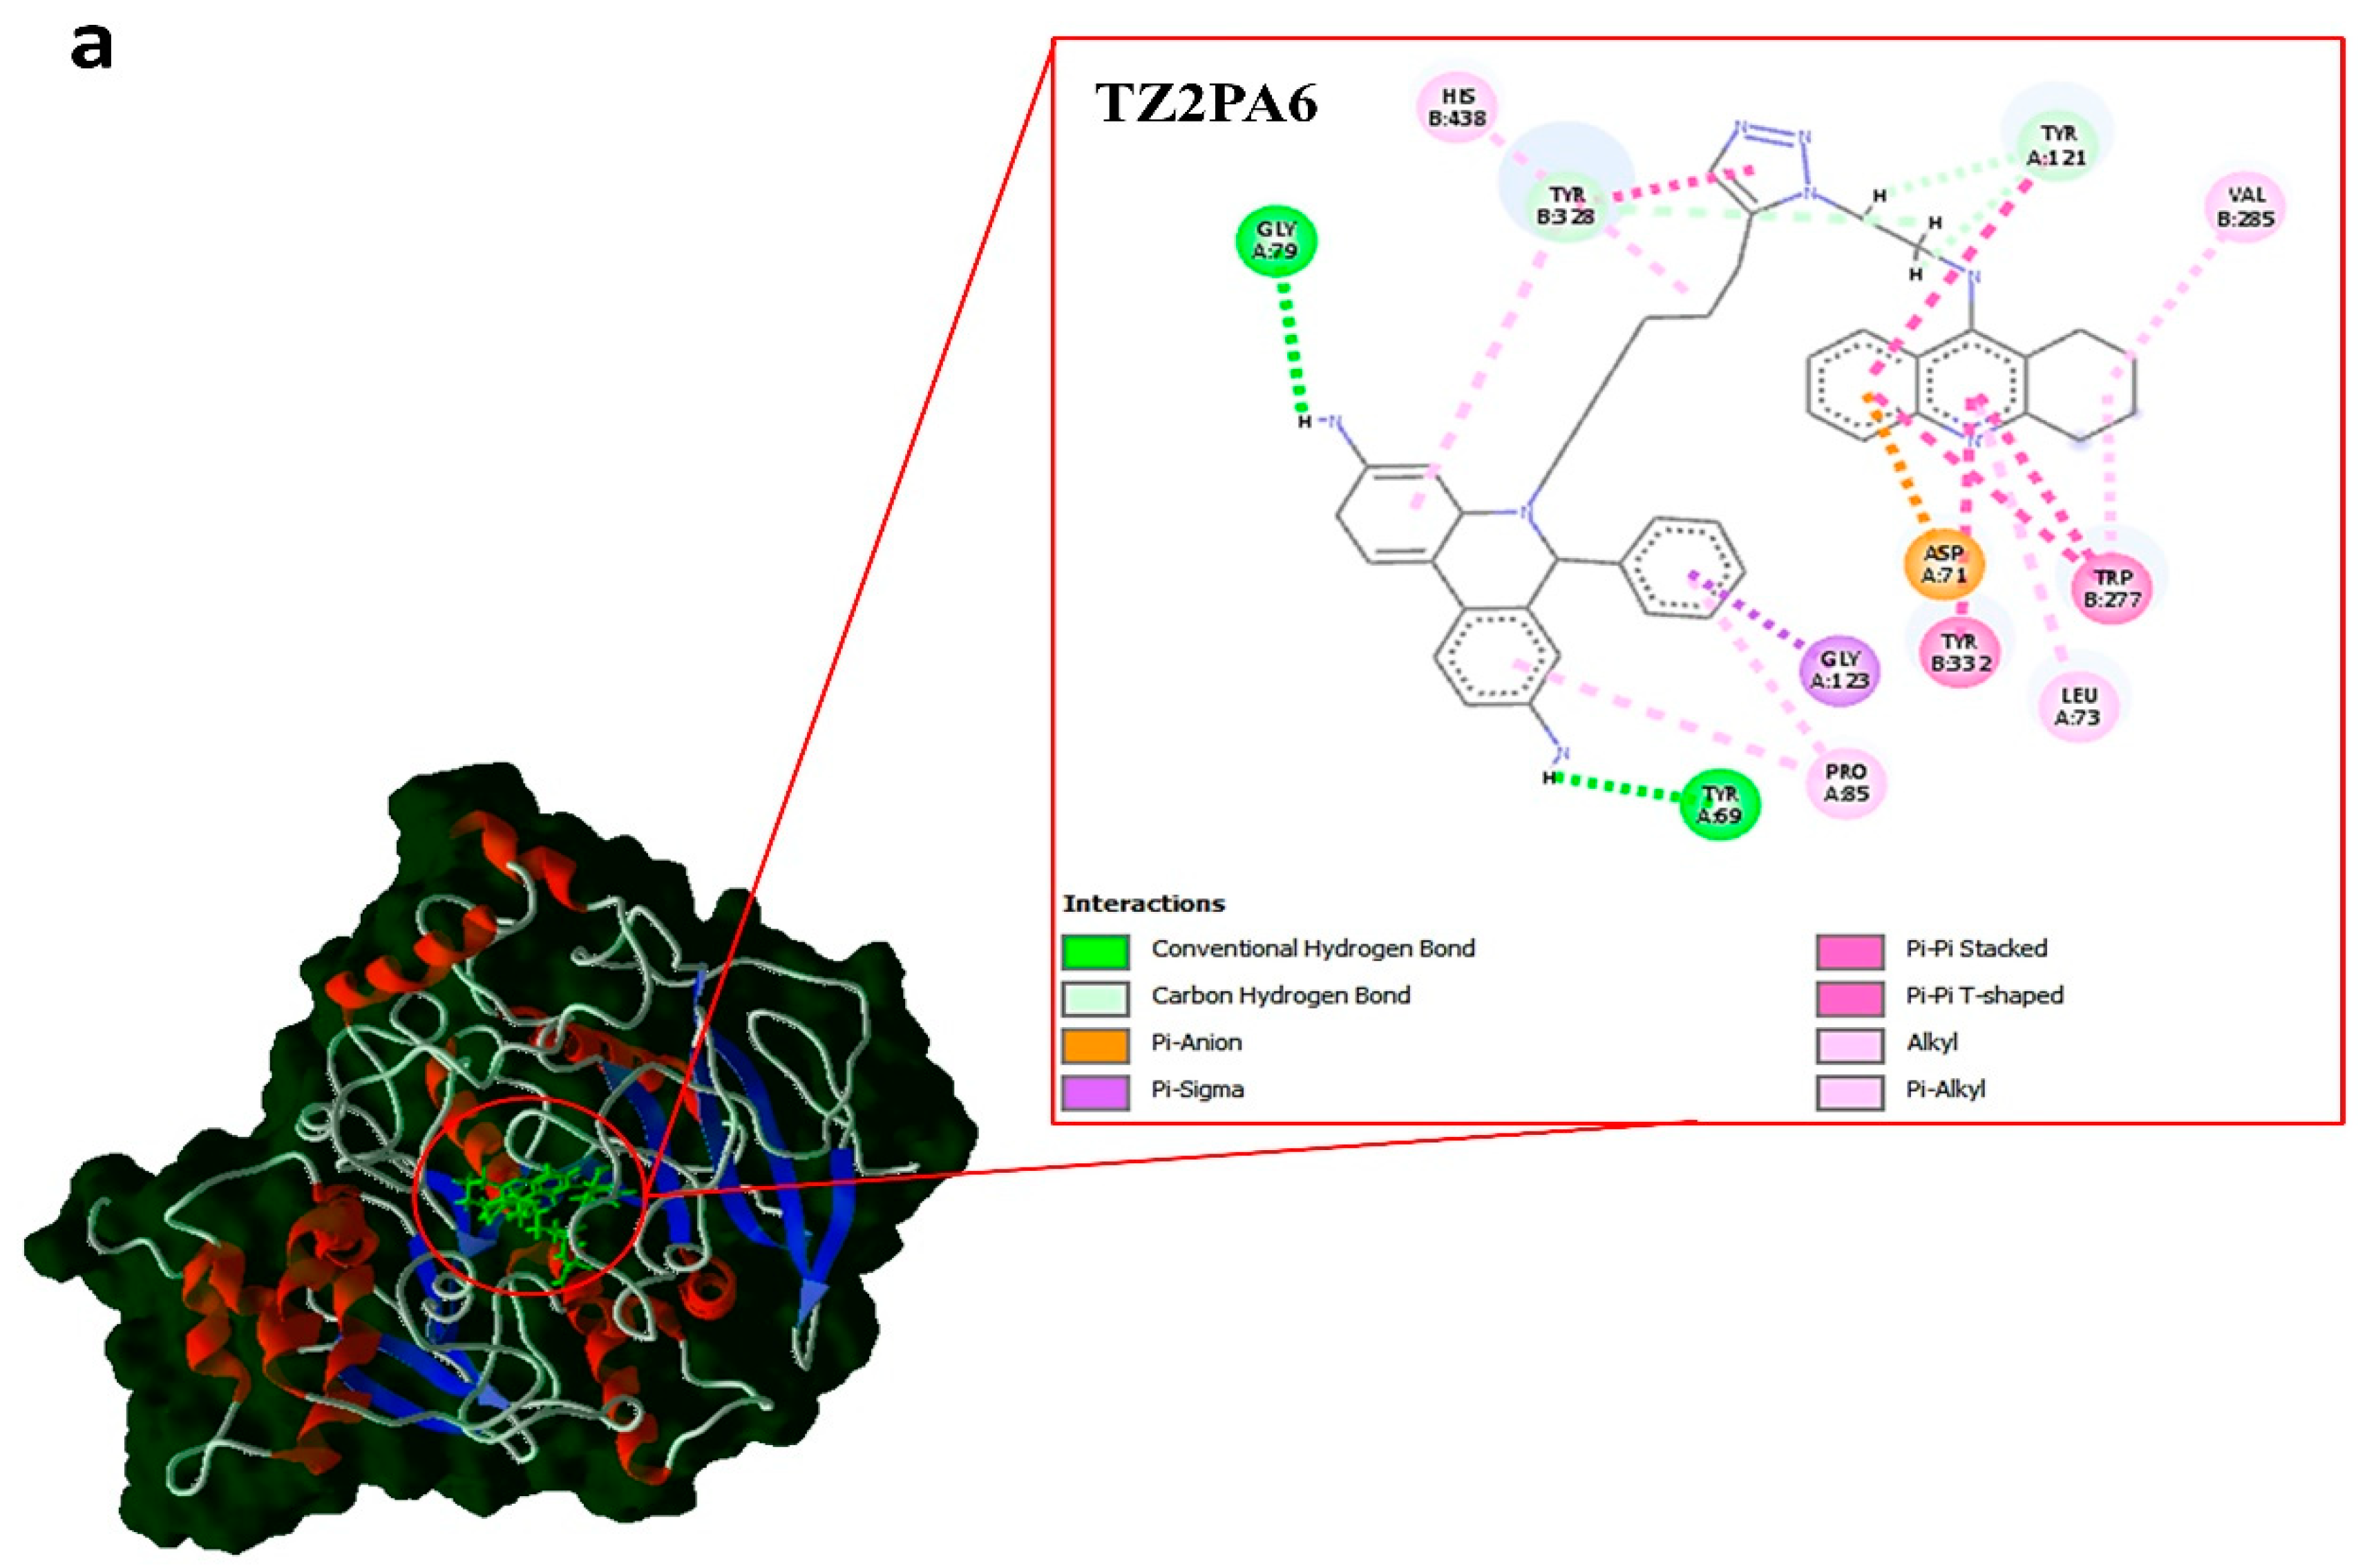
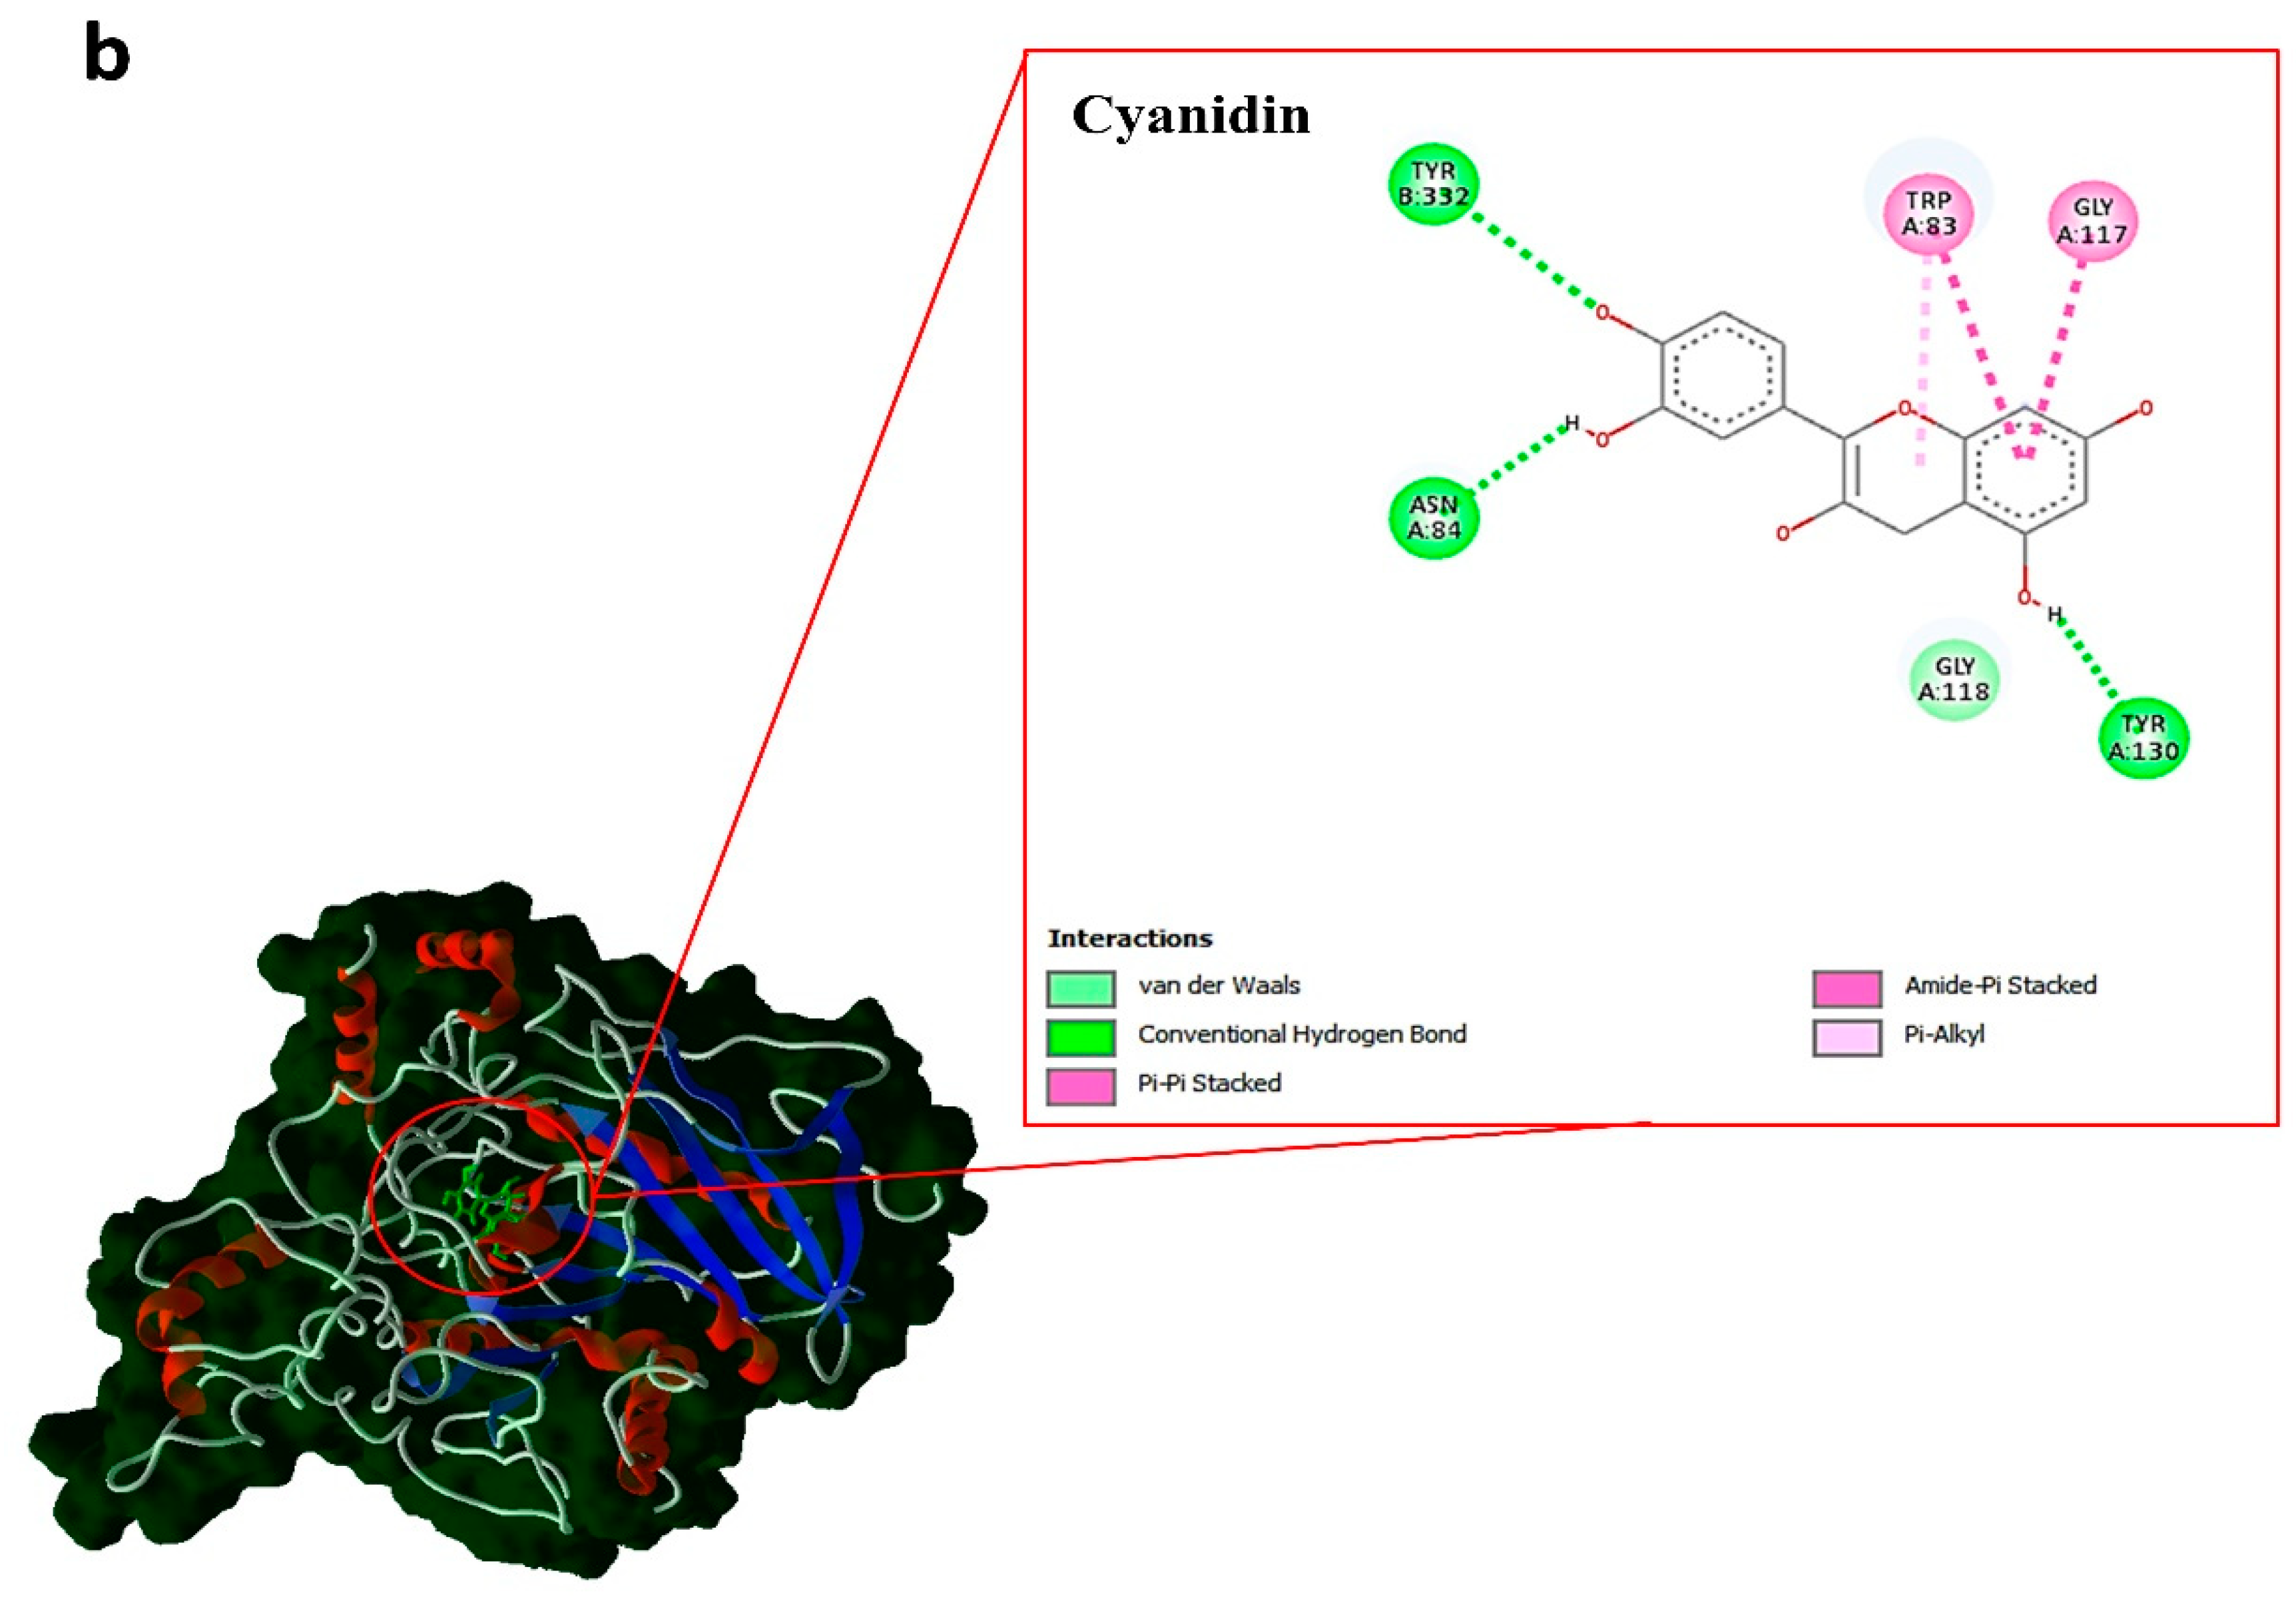
Figure 3.
Root mean square deviation (RMSD), root mean square fluctuation (RMSF), radius of gyration (Rg), and depletion of hydrophobic, electrostatic, and hydrogen bonding interactions of minimum energy complexes AChE with and without ligands after 200 ns of MD simulations.
Figure 3.
Root mean square deviation (RMSD), root mean square fluctuation (RMSF), radius of gyration (Rg), and depletion of hydrophobic, electrostatic, and hydrogen bonding interactions of minimum energy complexes AChE with and without ligands after 200 ns of MD simulations.
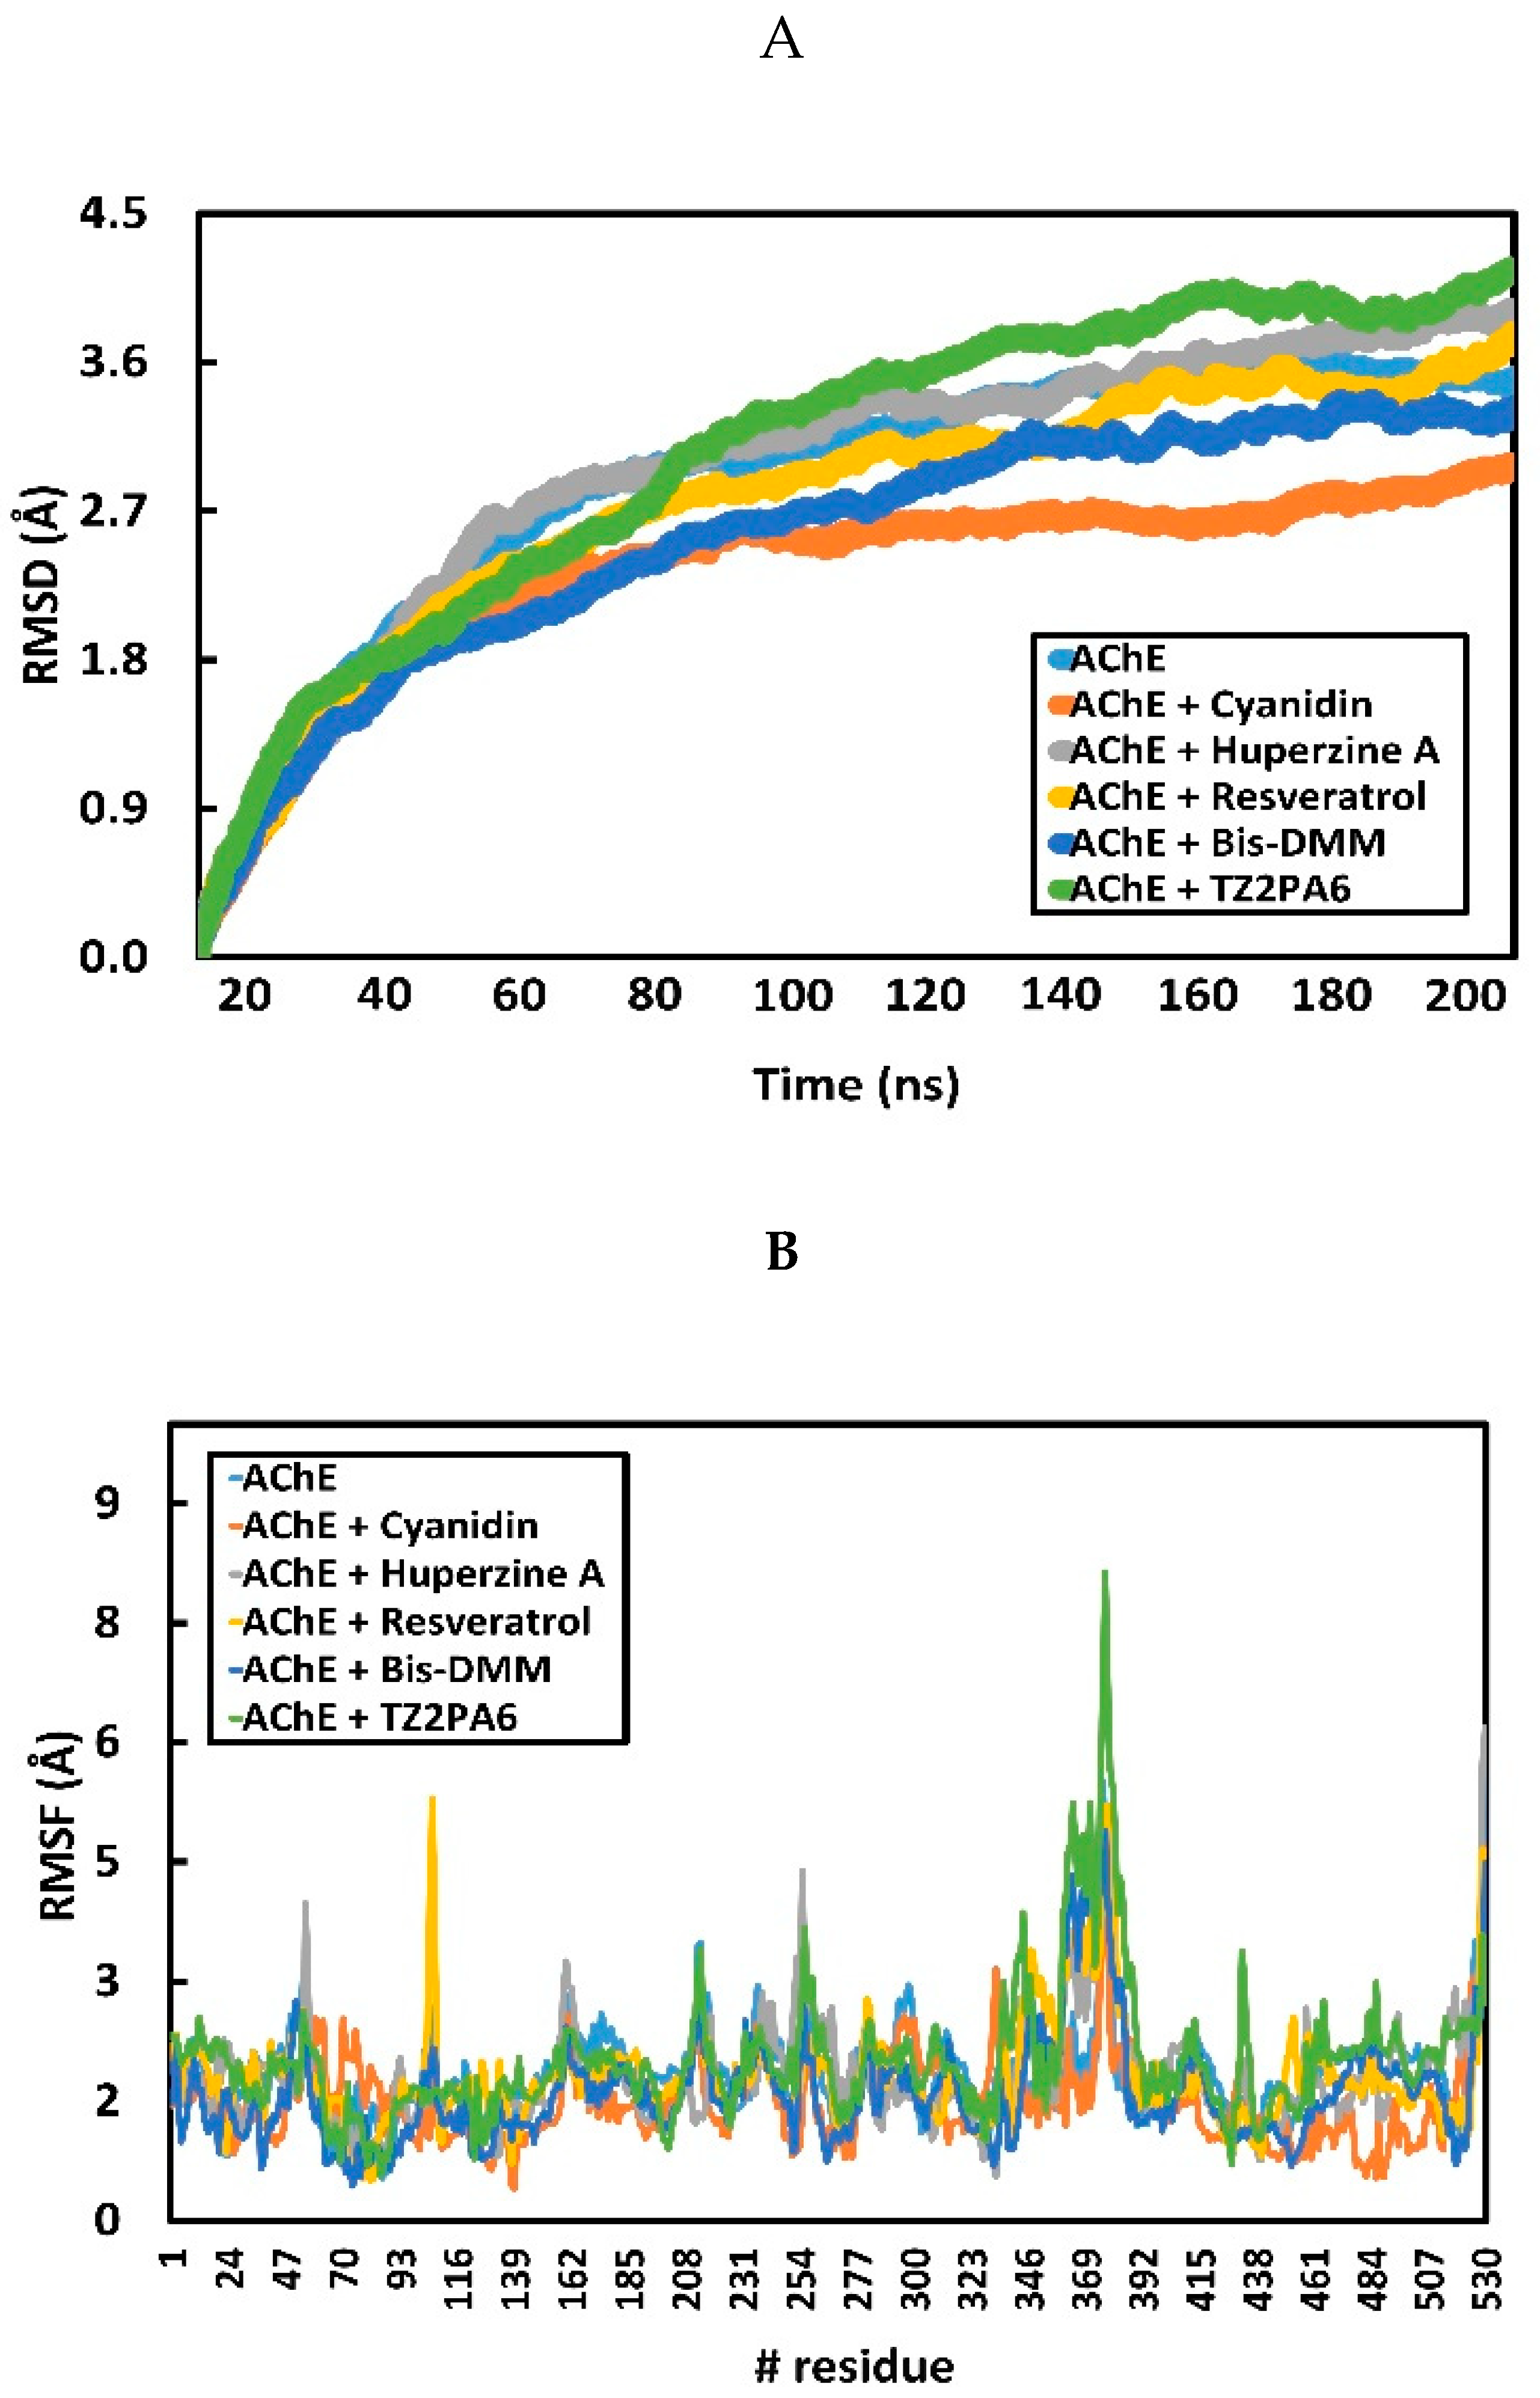
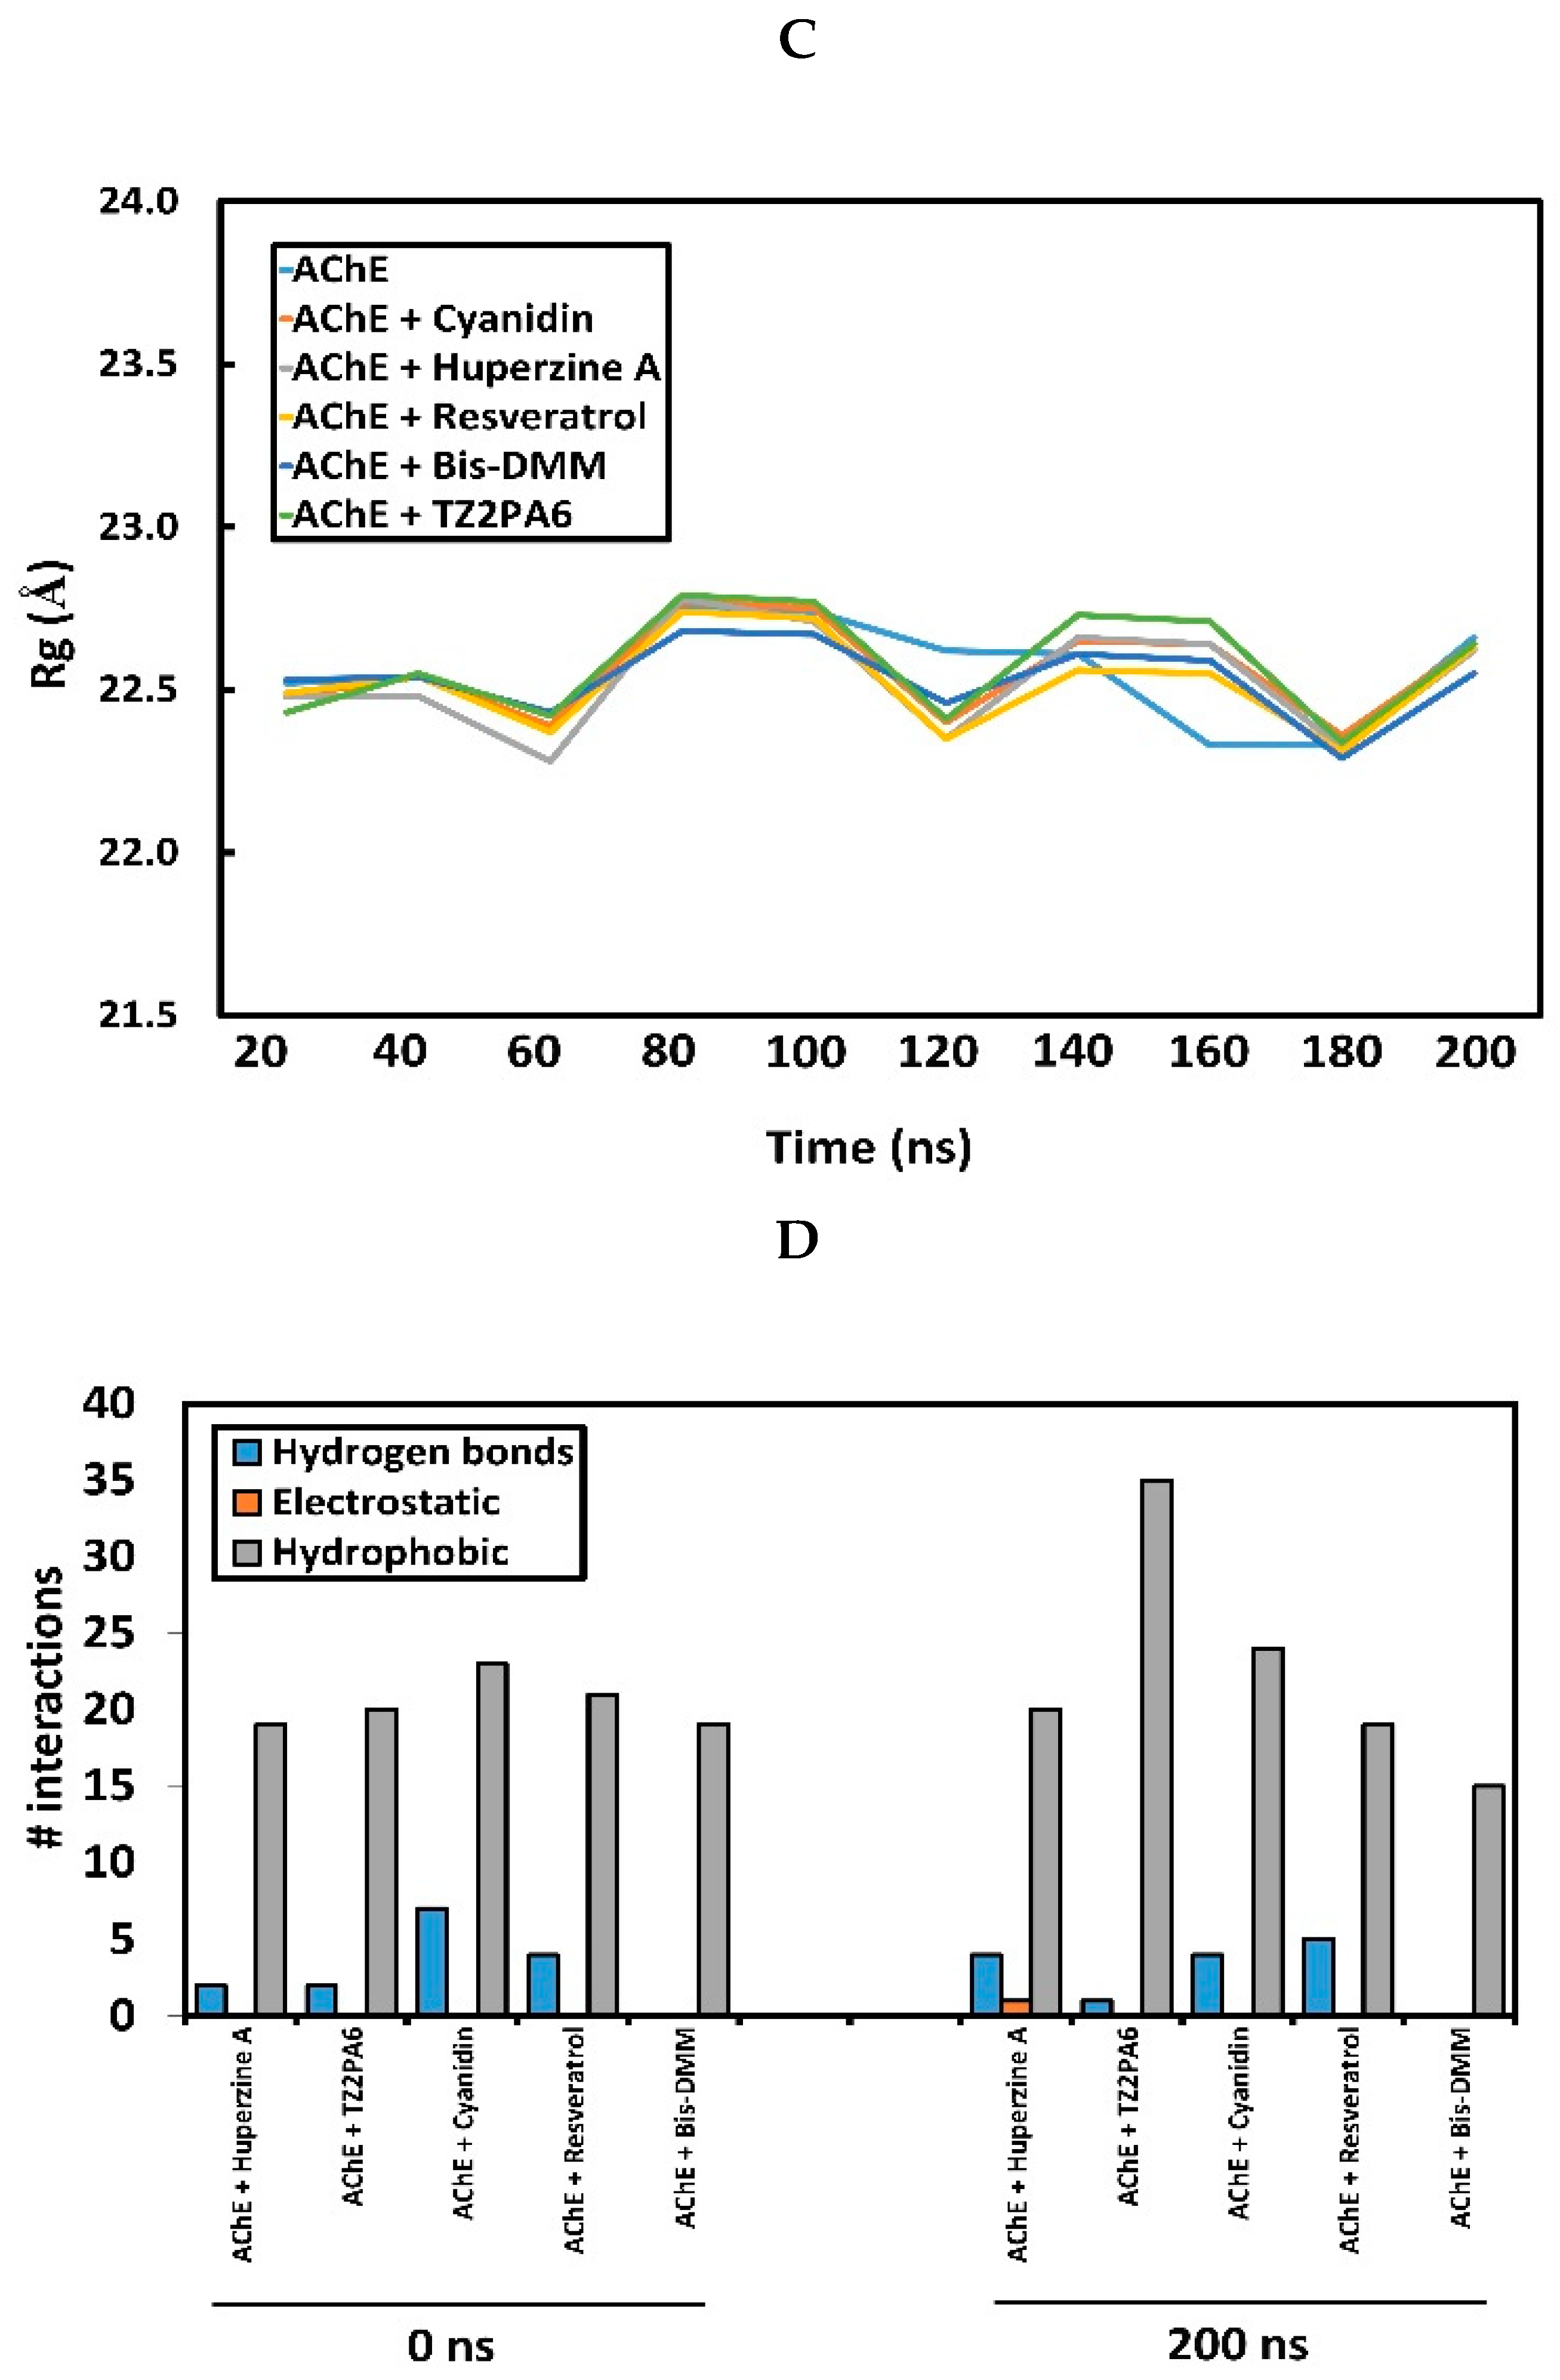
Figure 4.
The top panel shows a graphical representation of the collective mobility of the nodes, indicated by a ribbon ranging from blue (low mobility) to red (high mobility), highlighting in a red circle parts of the complex a) AChE b) with TZ2PA6 and c) with Cyanidin after 200 ns of MD. The lower panel shows the same complexes, but this time represented by a ribbon ranging from blue (residues with a propensity to broadcast the response to a perturbation) to red (residues with a propensity to receive such perturbation).
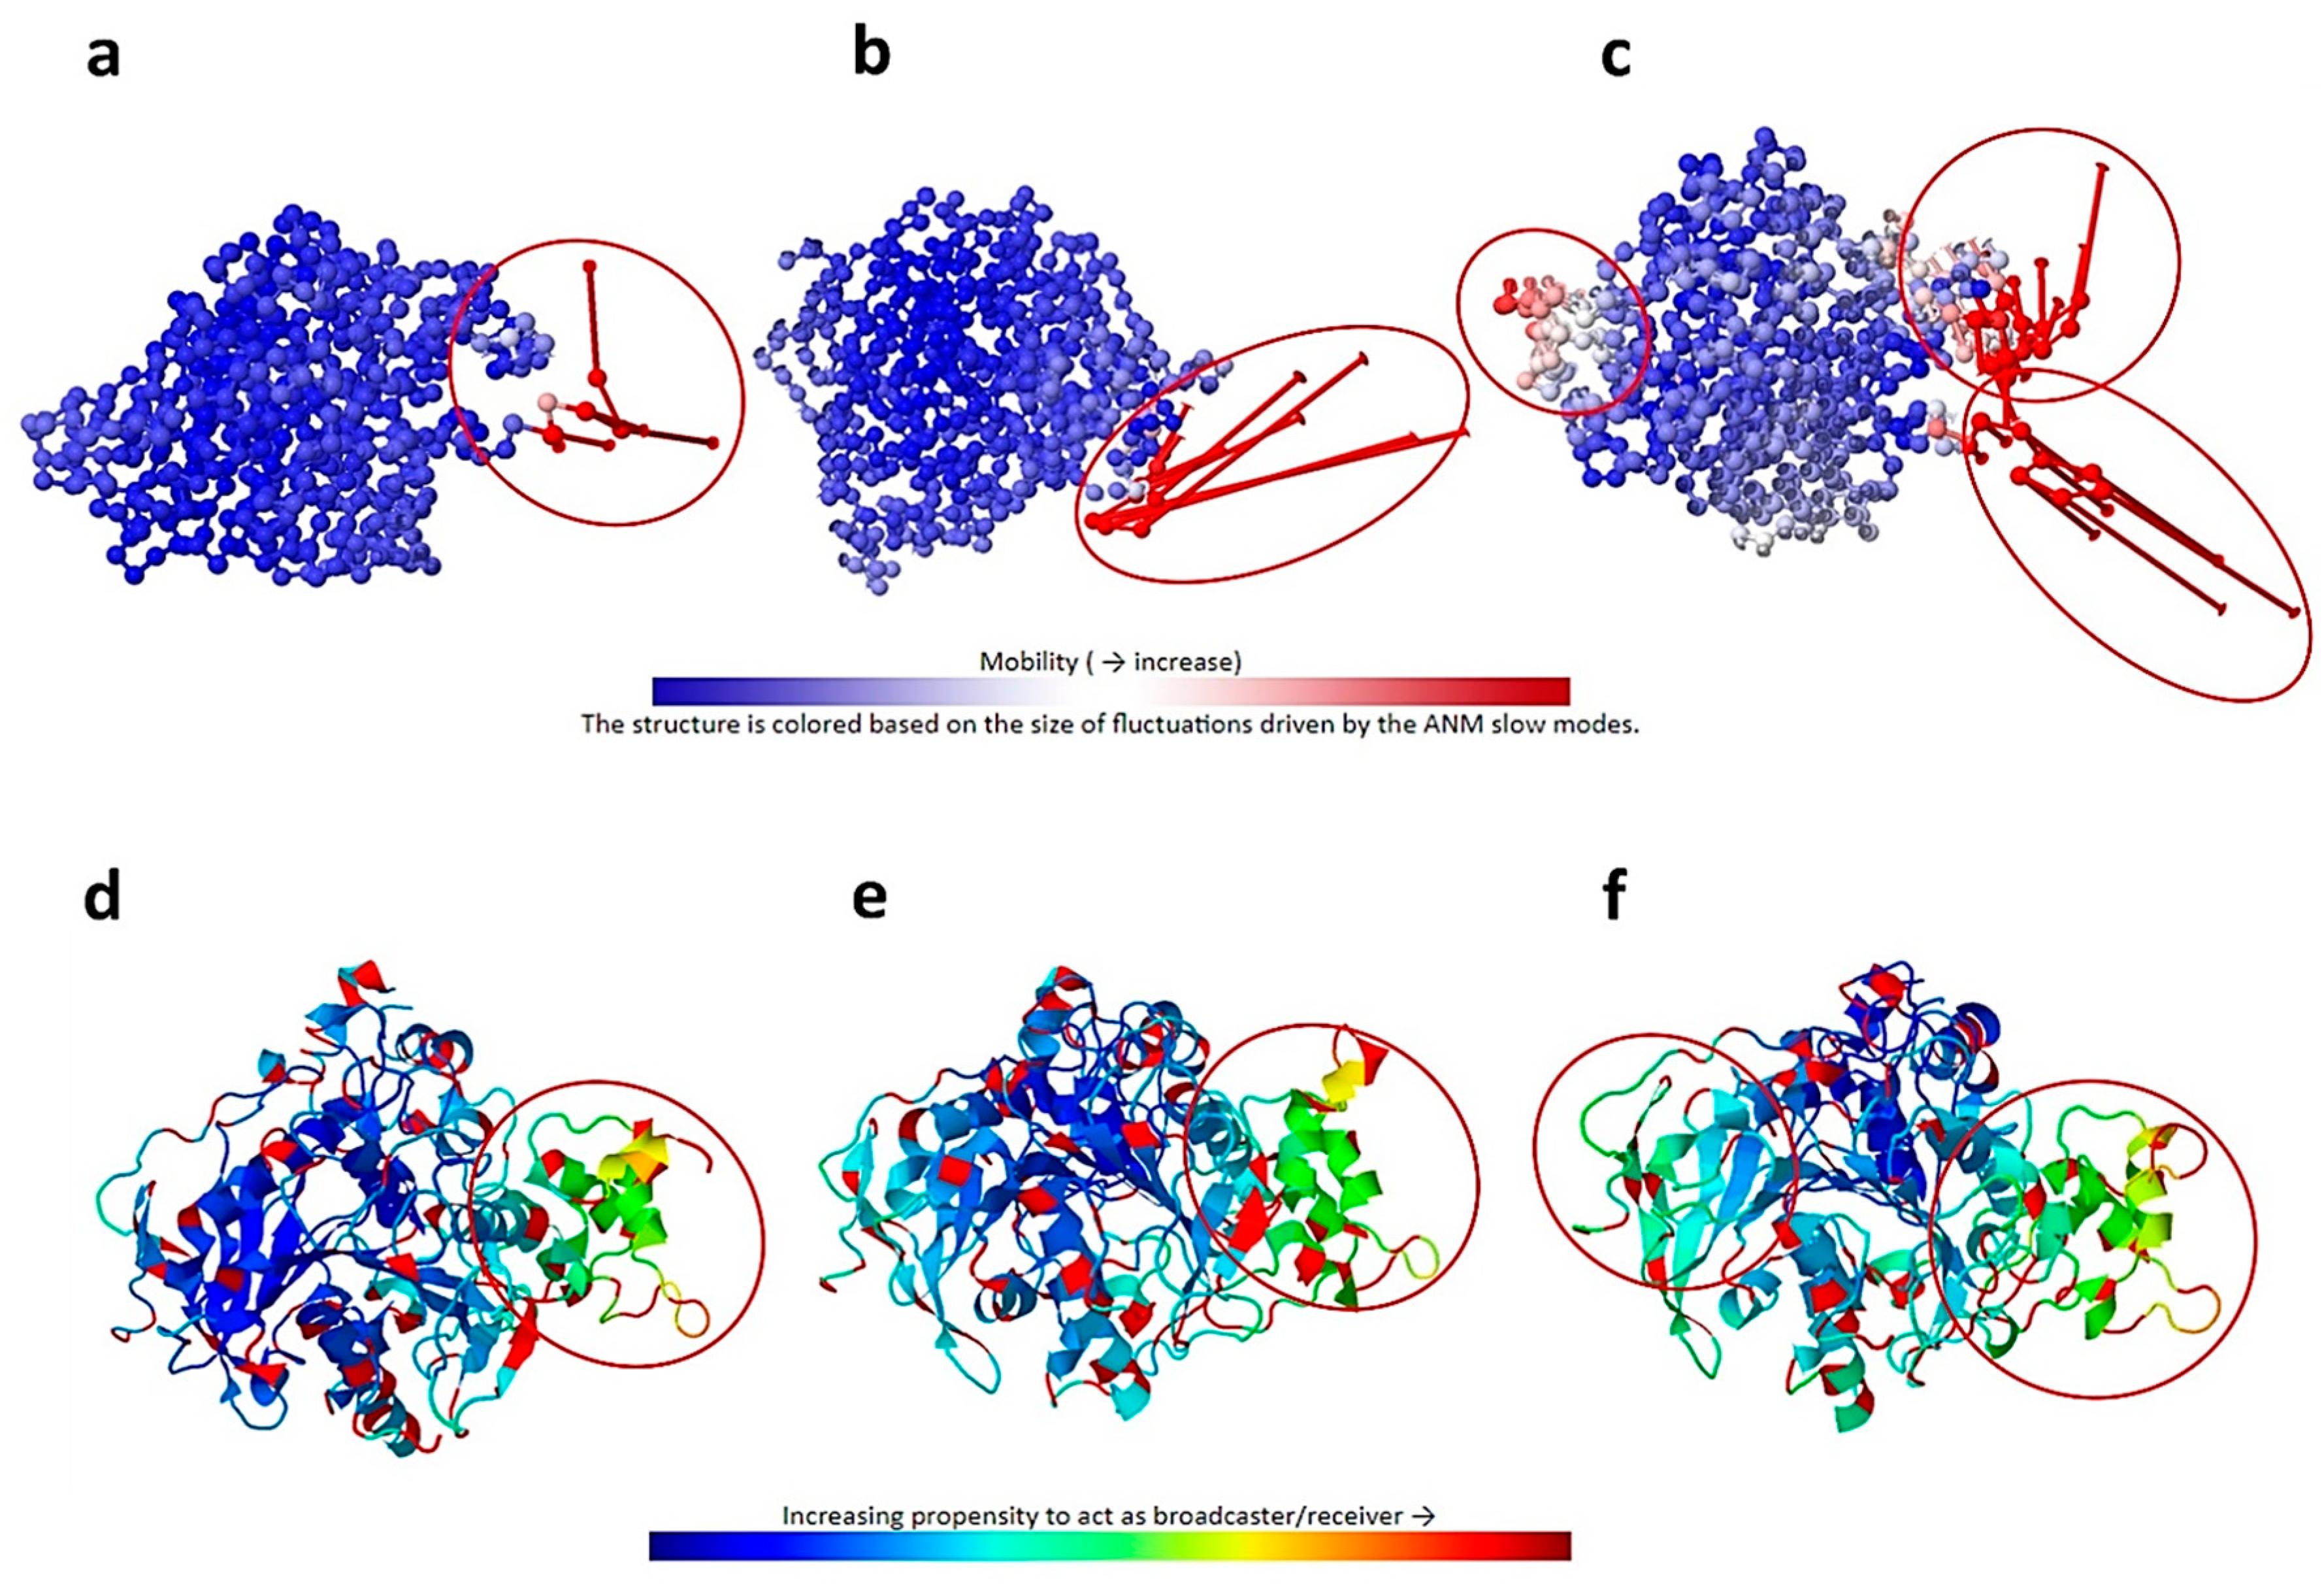
Figure 5.
Graphical representation of the maximum values of minimally frustrated residues of the AChE protein system free and in the presence of each compound.
Figure 5.
Graphical representation of the maximum values of minimally frustrated residues of the AChE protein system free and in the presence of each compound.

Figure 6.
Boxplot of the distribution of the volumes of the internal cavities of the AChE protein system free and in the presence of each compound.
Figure 6.
Boxplot of the distribution of the volumes of the internal cavities of the AChE protein system free and in the presence of each compound.
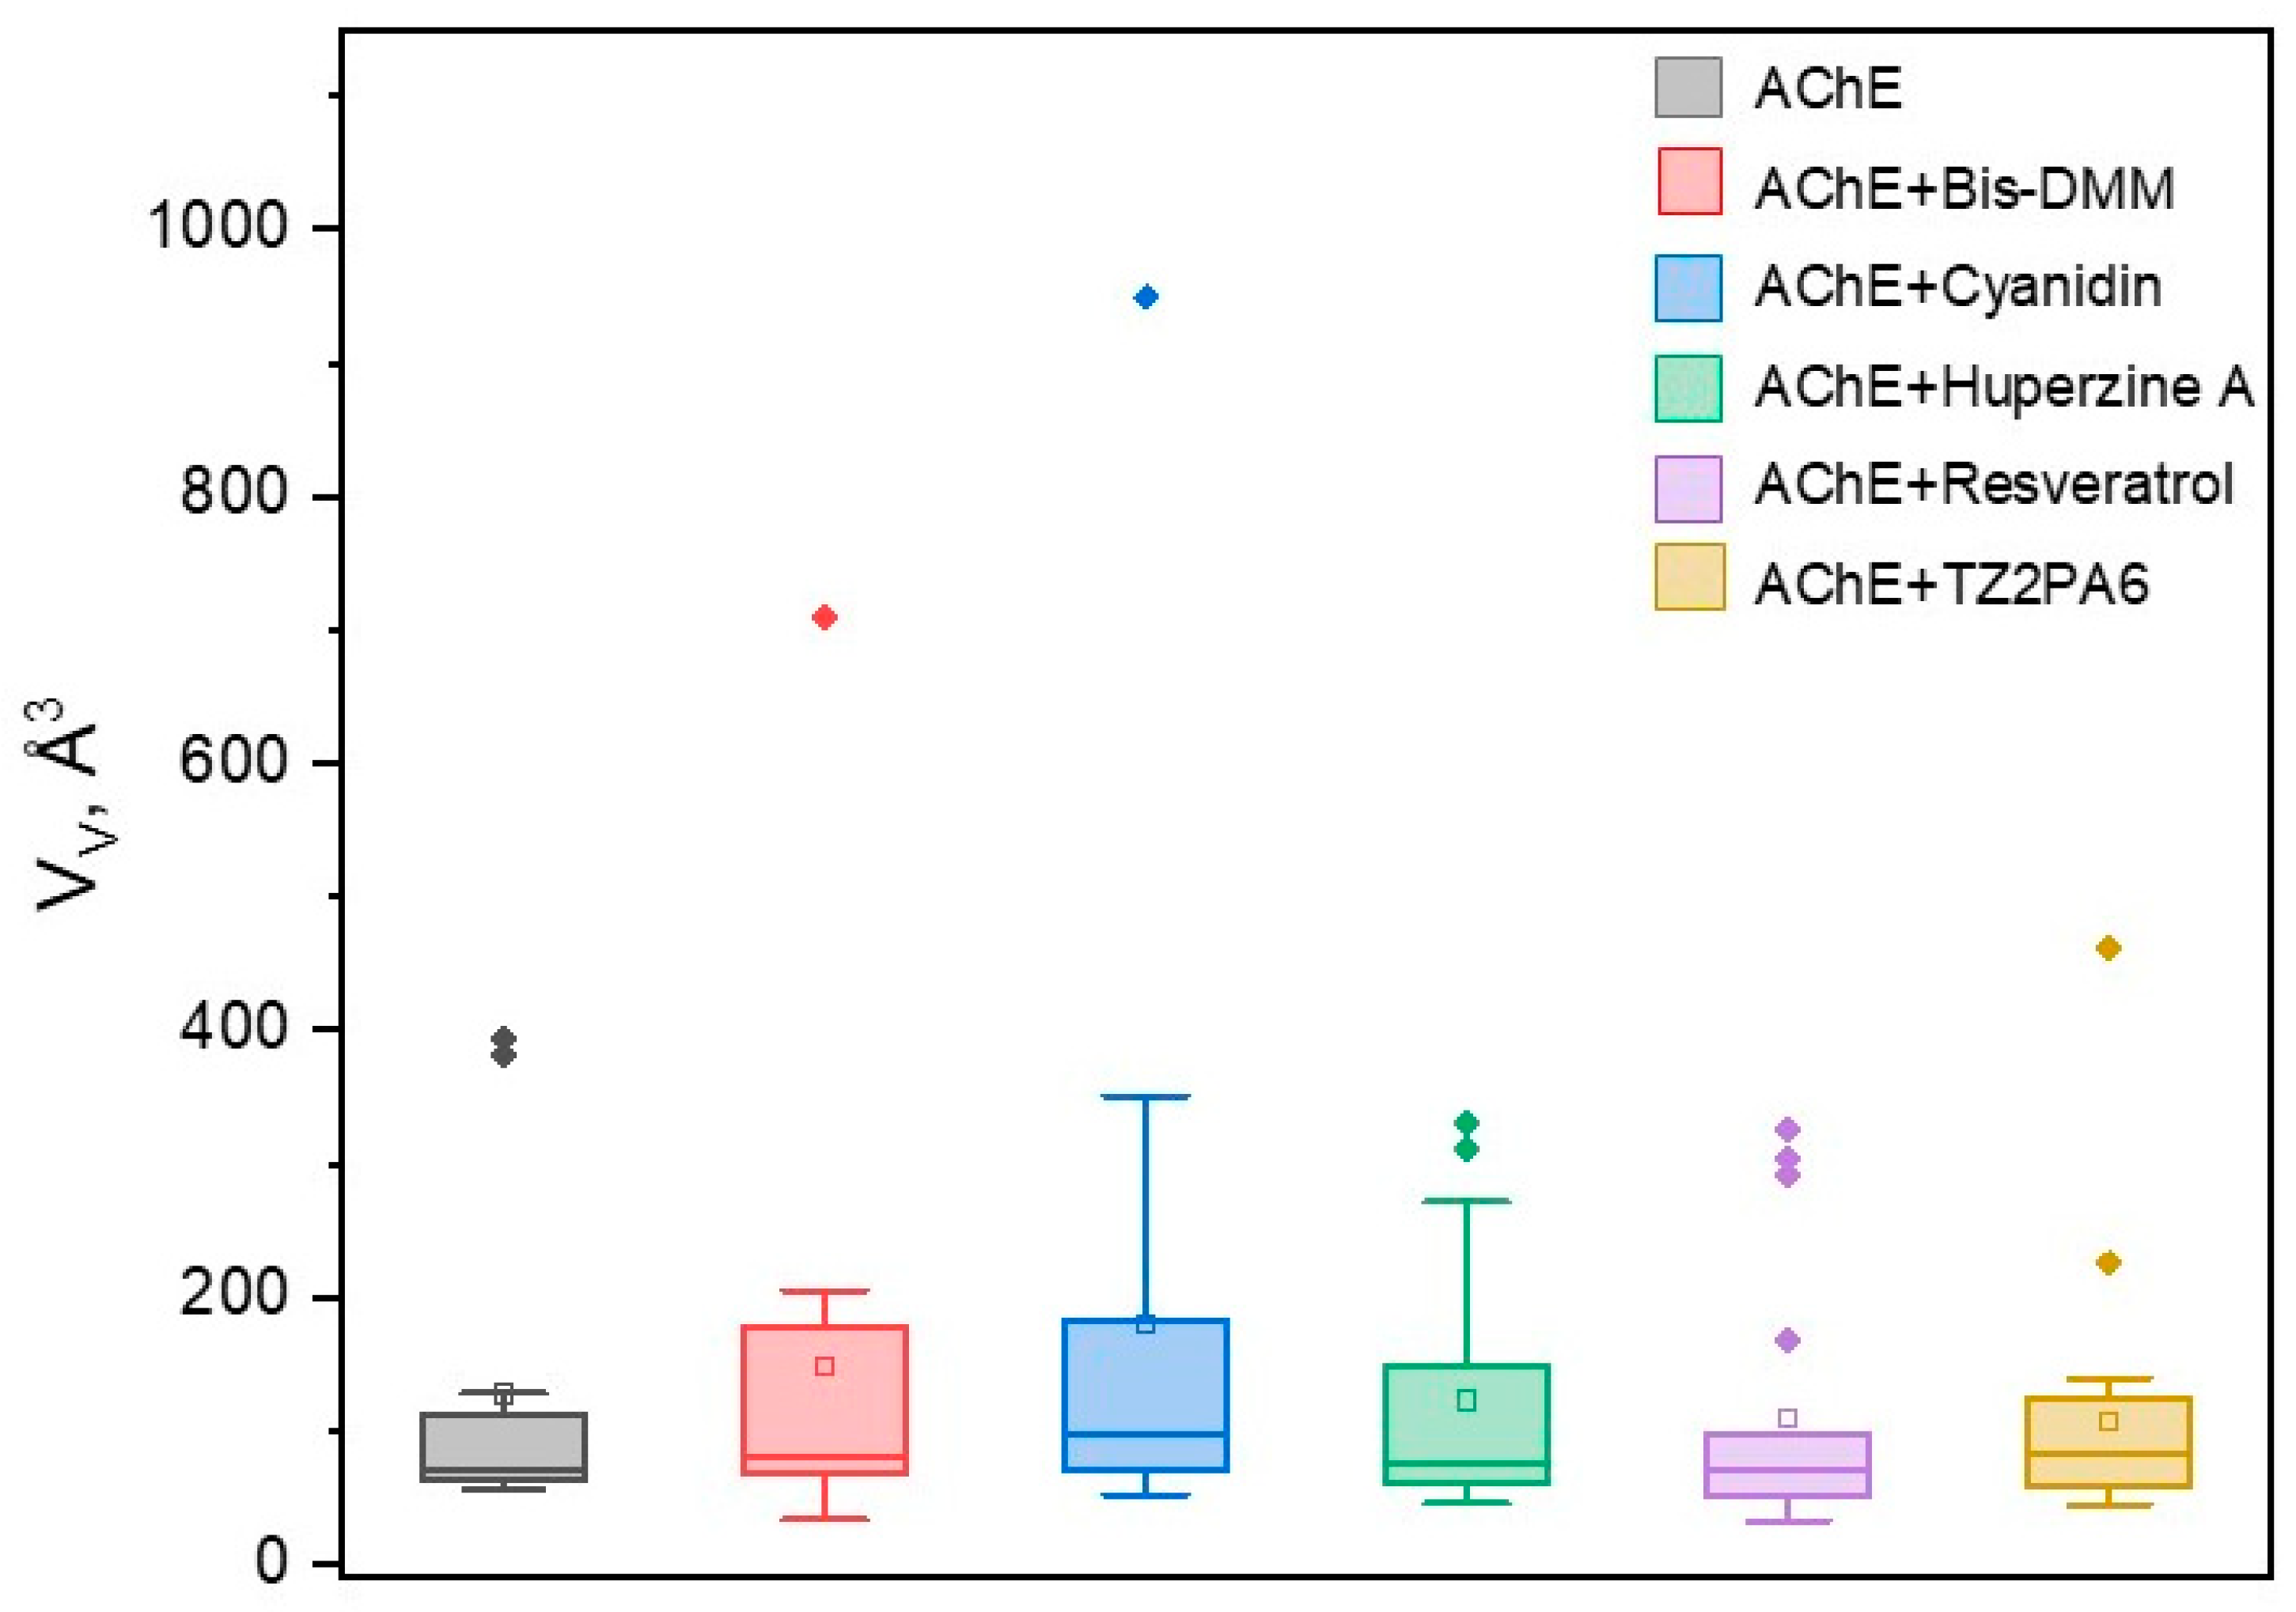
Figure 7.
Tridimensional representation of internal cavities near the binding site. Only internal cavities with Druggability Probability = 1.0 are shown. In the red circle, an internal cavity near the binding pocket, and the blue circles show other internal cavities in different regions also with Druggability Probability = 1.0. a) AChE b) with TZ2PA6 and c) with Cyanidin after 200 ns of MD.
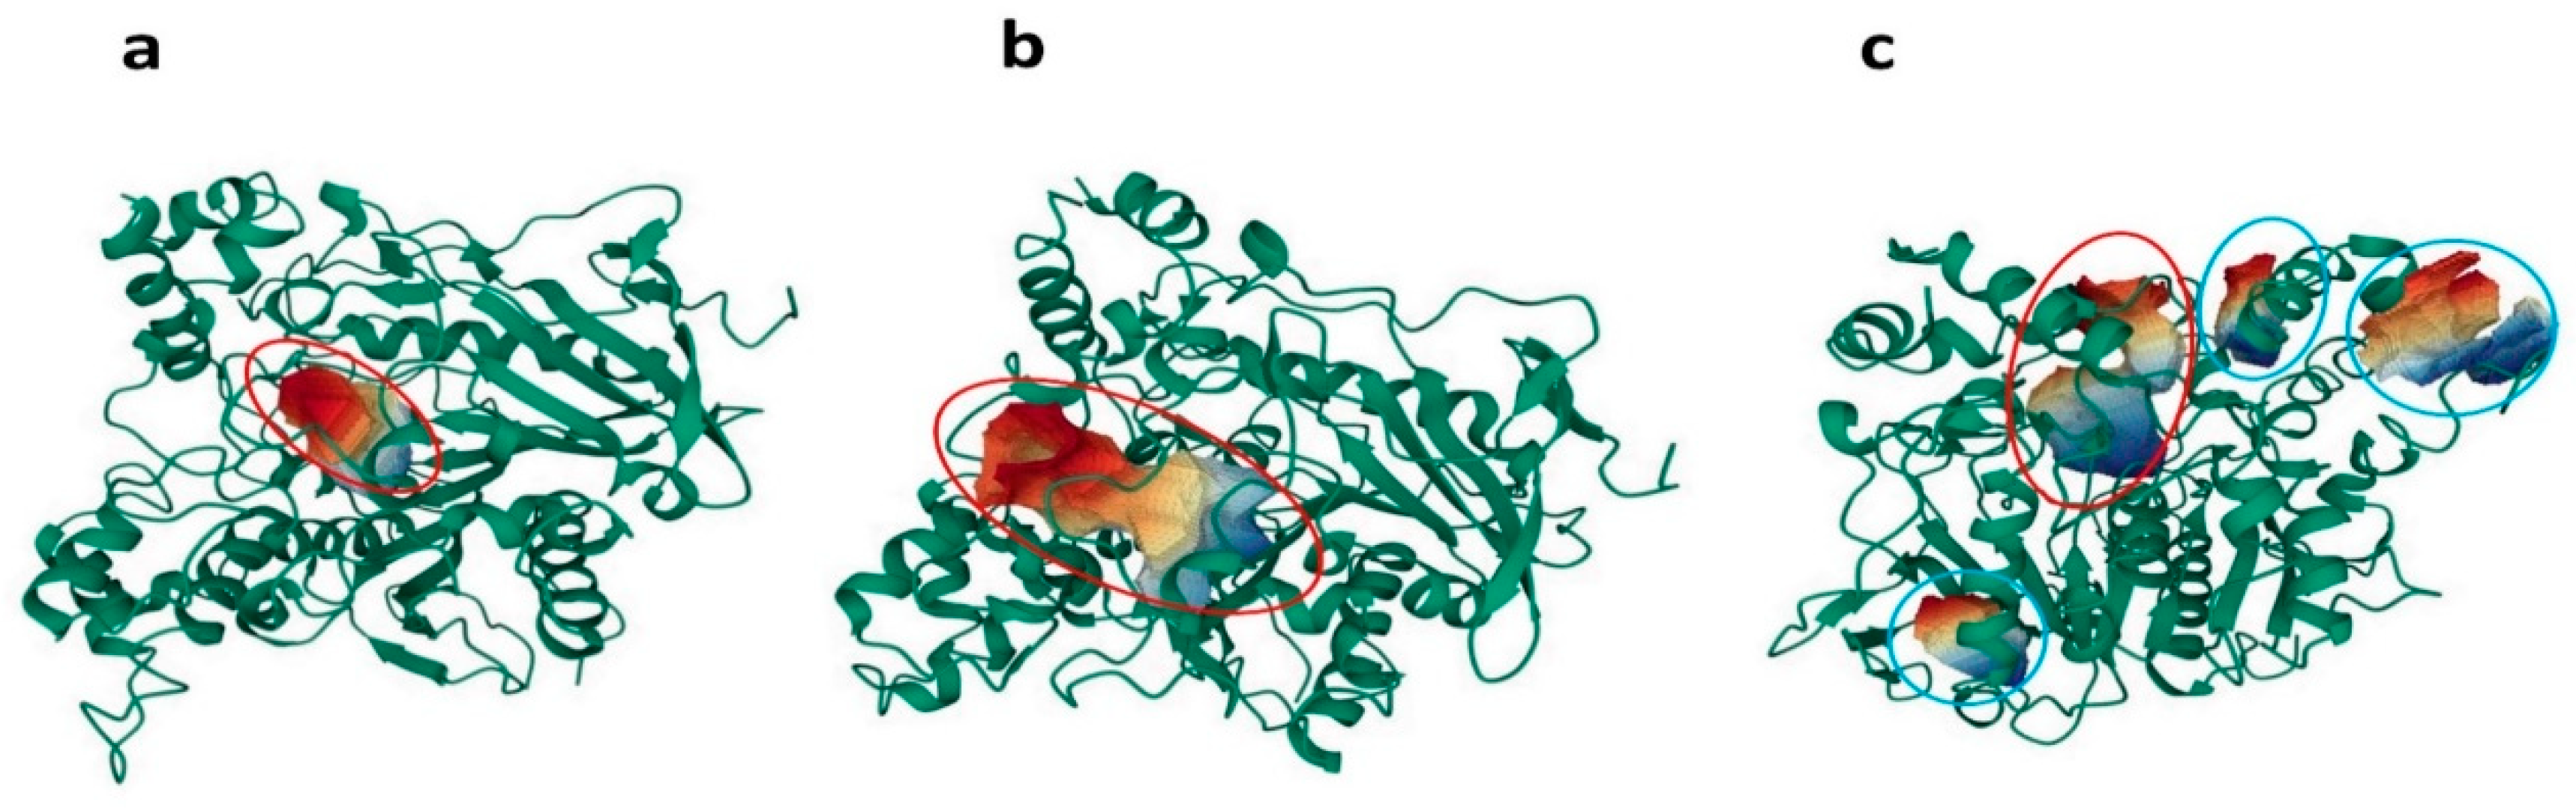

Table 1.
Relative binding energies of the compounds bound to AChE.
| Compounds | type | kcal.mol–1 | ||
|---|---|---|---|---|
| DockTScore | MM/PBSAa | MM/PBSAb | ||
| TZ2PA6 | chemistry click | -12.03 | -9.14 | -38.78 |
| Cyanidin | flavonoid | -9.50 | -5.51 | -17.21 |
| Bis-DMM | alkaloid | -8.97 | -1.37 | -16.06 |
| Resveratrol | polyphenol | -8.95 | -3.48 | -10.6 |
| Huperzine A | alkaloid | -8.95 | -9.64 | -22.74 |
DockTScore, scoring function calculated using the DockThor server; a, 0 ns de MD: refers to the results at 0 nanoseconds of Molecular Dynamics (MD) simulation; b, 200 ns de MD: refers to the results at 200 nanoseconds of MD; MM/PBSA, relative binding energy calculated using the Molecular Mechanics with Poisson-Boltzmann (PB) method and continuous surface area solvation (SA); Bis-DMM, Abbreviation for bis-(-)-8-demethylmaritidine.
Table 2.
Theoretical inhibition of the compounds against AChE.
| Compounds | µM | Ref. | ||
|---|---|---|---|---|
| Ki | IC50 | pIC50 | ||
| TZ2PA6 | 4.0a* | - | 9.7 | [17] |
| Cyanidin | 2.9b | 5.7b | 12.2 | This work |
| Bis-DMM | - | 80.7* | 4.1 | [39] |
| Resveratrol | 0.02 | 0.04 | 7.4 | This work |
| Huperzine A | - | 0.02* | 7.7 | [38] |
a, 10-4; b, 10-7; *, experimental concentration; concentration required to achieve 50% inhibition (IC50) and inhibitory potency expressed logarithmically (pIC50); Bis-DMM, Abbreviation for bis-(-)-8-demethylmaritidine.
Table 3.
Structural and conformational stability, intrinsic flexibility-rigidity (deformability) parameters using ENM, statistical potentials, and energetic frustration of AChE complexes with and without ligands after 200 ns of MD.
Table 3.
Structural and conformational stability, intrinsic flexibility-rigidity (deformability) parameters using ENM, statistical potentials, and energetic frustration of AChE complexes with and without ligands after 200 ns of MD.
| Complex | Distance | ASA | ϕ | Ψ | Q | QS | #Nodes | #Links | Collectivity | Receiver | C | f |
|---|---|---|---|---|---|---|---|---|---|---|---|---|
| AChE | -206.53 | -50.23 | -76.26 | 39.83 | 19 | 3.12 | 104 | 103 | 0.501 | 0.033 | 986.87 | 0.76 |
| AChE + Huperzine A | -156.44 | -37.90 | -76.76 | 35.42 | 11 | 3.68 | 96 | 95 | 0.563 | 0.027 | 985.04 | 0.75 |
| AChE + TZ2PA6 | -153.51 | -33.02 | -77.55 | 37.79 | 4 | 3.29 | 101 | 100 | 0.564 | 0.031 | 972.16 | 0.83 |
| AChE + Cyanidin | -156.22 | -24.35 | -75.77 | 37.93 | 21 | 3.38 | 129 | 128 | 0.584 | 0.035 | 991.64 | 0.86 |
| AChE + Resveratrol | -152.85 | -30.07 | -75.82 | 34.81 | 17 | 3.02 | 126 | 125 | 0.532 | 0.028 | 975.85 | 0.85 |
| AChE + Bis-DMM | -158.18 | -27.63 | -76.63 | 39.08 | 6 | 3.31 | 89 | 88 | 0.505 | 0.030 | 971.18 | 0.75 |
Bis-DMM, Abbreviation for bis-(-)-8-demethylmaritidine; Distance, the negative sign (-) represents a stable system, with greater magnitude indicating greater stability in terms of statistical potentials according to SWOTein; ASA, solvent accessibility according to CUPSAT; The average values obtained for the torsion angles phi (φ) and psi (Ψ) according to the CUPSAT tool; intrinsic quasi-rigid regions or domains (Q); rigidity quality (QS) values; #Nodes, number of nodes in the system or complex; #Links, number of links that connect the nodes of the system or complex; Collectivity, high collectivity indicates that parts of the complex move together in a specific mode; Receiver, the tendency of residues to receive signals, with lower magnitude indicating a greater propensity for communication (C) or allosteric behavior according to the DynOmics-ENM model; f, energetic frustration.
Table 4.
Volumetric parameters considered in this study associated with internal cavities of AChE.
| complex | (Å3) | Drugg. Prob. |
Pockets Drugg Prob. = 1.0 |
Nb. Res. |
|||
|---|---|---|---|---|---|---|---|
| mean | min | max | (Å3) | (%) | (%) | mean | |
| AChE | 127.33 | 56 | 393 | 117.64 | 94 | 17 | 19 |
| AChE + Huperzine A | 122.50 | 45 | 331 | 88.87 | 91 | 20 | 19 |
| AChE + TZ2PA6 | 107.48 | 44 | 461 | 82.43 | 74 | 40 | 21 |
| AChE + Cyanidin | 180.07 | 52 | 949 | 222.85 | 95 | 75 | 24 |
| AChE + Resveratrol | 108.77 | 32 | 325 | 93.46 | 82 | 17 | 22 |
| AChE + Bis-DMM | 147.31 | 33 | 709 | 155.35 | 61 | 20 | 20 |
Bis-DMM, Abbreviation for bis-(-)-8-demethylmaritidine; , fluctuation of the cavity volume estimated trough Eq. 32; Drugg. Prob. = Druggability Probability; Pockets Drugg Prob = Pockets with a Druggability Probability; Nb. Res. = Number of pocket residues.
Disclaimer/Publisher’s Note: The statements, opinions and data contained in all publications are solely those of the individual author(s) and contributor(s) and not of MDPI and/or the editor(s). MDPI and/or the editor(s) disclaim responsibility for any injury to people or property resulting from any ideas, methods, instructions or products referred to in the content. |
© 2024 by the authors. Licensee MDPI, Basel, Switzerland. This article is an open access article distributed under the terms and conditions of the Creative Commons Attribution (CC BY) license (http://creativecommons.org/licenses/by/4.0/).
Copyright: This open access article is published under a Creative Commons CC BY 4.0 license, which permit the free download, distribution, and reuse, provided that the author and preprint are cited in any reuse.


