Submitted:
15 July 2024
Posted:
16 July 2024
You are already at the latest version
Abstract
In this work is proposed a new unsupervised method to evaluate the behavior of urban green areas in presence of heatwave scenarios analyzing the NDVI, NDMI and LST satellite data. To evaluate how these three indices characterize urban green areas during periods of heat waves, a reclassification of the data raster of each index is carried out. Rather than using standard classifications of the three indices, an unsupervised classification approach is proposed that uses the Elbow method to determine the optimal number of classes and the Jenks thematic classification method. Each class is assigned a Gaussian fuzzy set with means and standard deviations equal to that of the associated thematic class. The green urban areas are classified using zonal statistics operators and the degree of membership in the corresponding fuzzy set is used to assess the reliability of the classification. Finally, for each type of greenery the frequencies of belonging to the NDVI, NDMI and LST classes are analyzed to evaluate the behavior of the type of urban greenery during heatwaves. The framework was tested in an urban area consisting of the city of Naples (Italy). The results show that some types of greenery, such as deciduous forests and olive groves, are not very vulnerable to heatwave scenarios, unlike uncultivated areas which, instead, show critical behaviors during heatwaves.
Keywords:
urban greenery
; heatwave
; GIS
; Jenks classification method
; Gaussian fuzzy set
; NDVI
; NDMI
; LST
1. Introduction
The growing phenomena of summer heat waves in urban settlements are producing continuous alerts in local administrations due to the risks to the health of the population, especially vulnerable groups and the chronically ill.
The protection of the urban green ecosystem becomes an important action to address to mitigate these risks and make cities more resilient to summer heat waves.
The use of remote sensing and spatial modeling techniques in GIS-based environments can allow monitoring the health of urban green areas and help make decisions for their protection.
Some remote sensing indices are useful for monitoring the health of green areas.
An index used in various contexts to evaluate how alive or sick the vegetation is the Normalized Difference Vegetation Index. It is based on measurements of the reflectance of light in the red (Red) and near-infrared (NIR) bands and is given by the formula:
where the red wavelength is absorbed by the chlorophyll of the plant and the infrared radiation is reflected by the plant canopy [1].
The NDVI index varies between -1 and +1. Values close to +1 indicate dense and healthy vegetation; on the contrary, values close to 0 or negative indicate a paucity of vegetation, bare ground or other non-vegetated surfaces. Generally, negative values are recorded in impervious open spaces such as urban streets or squares.
Recently, NDVI was used in many researchers to measure the health urban green spaces [2,3,4,5]. One of the main advantages of NDVI is that it represents a non-destructive tool for monitoring the liveability of vegetation as it does not require direct contact with it. Furthermore, it can also be used to monitor large areas covered by the satellite. Finally, it allows the state of the vegetation to be monitored frequently over time, allowing the analysis of seasonal and multi-annual variations.
However, in areas of extremely dense vegetation, the NDVI may become saturated, making it difficult to distinguish further changes in vegetation vigor. Furthermore, the presence of bare soil can influence NDVI values, especially in areas with sparse vegetation.
Other authors integrate NDVI with the Normalized Difference Moisture Index (NDMI), to analyze the presence of humidity in urban greenery [6,7,8,9].
The Normalized Difference Moisture Index (NDMI) is an index used mainly to evaluate the presence and distribution of humidity in the soil or vegetation. It is based on the analysis of multispectral images, often acquired by satellite sensors or aircraft. NDMI compares the response of vegetation in two different bands of the electromagnetic spectrum, generally near infrared (NIR) and shortwave-infrared reflectance (SWIR); it is given by the formula:
where The SWIR band is sensitive to variations in aqueous content in the vegetation, while the NIR reflectance is influenced by the concentration of dry matter in the foliage.
NDMI index varies between -1 and +1. Values close to +1 indicate dense and healthy vegetation without water stress; however, values close to -1 indicate typical bare soils with very sparse or absent vegetal cover.
This index is widely used in agriculture, forestry, hydrology and environmental monitoring to evaluate vegetation health, soil water availability and general environmental conditions. For example, it can be used to monitor drought, identify areas at risk of forest fires, or evaluate crop water stress.
Combined with the Land Surface Temperature (LST), the NDVI and NDMI indices can provide key information for analyzing the resilient effectiveness of urban green areas during heat waves.
LST measures the radiative temperature of the land; it refers to the temperature of the surface of bare soils, or of built or natural roofs and is obtained from the infrared brightness temperatures measured at two channels centered to 11 and 12 µm, respectively; it provides a measure of the canopy temperature of a plant cover and can provide synthetic information on the thermal behavior of an urban green space. Mean annual LST anomalies are used in [10] to detect urban heat islands in the city of New Delhi, in India.
Recent studies carried out on urban settlements have shown the existence of a correlation between LST and NDVI [11,12] and LST and NDMI [13].
Research carried out in [14] on the urban area of Kathmandu Valley in central Nepal showed the presence of a negative relationship both between LST and NDVI and between LST and NDMI, verifying that, compared to dense urban areas, LST decreases in the presence of rural and agricultural areas, in which there is a sharp increase in NDVI and NDMI values. Recently, experiments performed on the city of Hamburg, in Germany [15], showed that, in parks, clay soils showed an average LST higher than approximately 2 °C whit respect to sand-dominated soils.
Analyzes carried out in the city of Dhaka, Bangladesh, in which historical data were used to determine the variations in the last thirty years of LST, NDVI and NDMI, highlighted the presence of a correlation between the three parameters, which shows that the reduction over the time of vigilance coverage in the city of Dhaka there has been a significant reduction in vegetation cover which has led to an increase in surface temperatures and a reduction in soil humidity over the last three decades [16].
Aim of this research is to propose a new unsupervised method to evaluate the resilience capacity of urban green areas in presence of heatwave scenarios, based to NDVI, NDMI and LST. To evaluate how these three indices characterize urban green areas during periods of heat waves, a reclassification of the data raster of each index is carried out. After acquiring the remote sensing multispectral bands, each index is classified separately by applying the Jenks natural breaks thematic classification index proposed in [17,18]; this technique has the advantage of clustering spatial data in such a way as to minimize the within-group variance and maximize the between-group variance [19]. The Elbow method is applied to set the number of classes.
The use of this classification method allows to assign to each thematic class a Gaussian fuzzy set defined by setting the average value and the standard deviation of the class as parameters.
Through zonal statistical processes, each public green urban area, displayed as a polygon on the map, is assigned to a thematic class considering the average of the values of the index assigned to the pixels covering the polygon; furthermore, a reliability of the classification is assessed, given by the membership degree to the corresponding Gaussian fuzzy set.
Finally, an analysis of the characterization of types of urban green areas in periods of heat waves is carried out by determining how the frequencies of urban green areas of a specific type are distributed in the classes into which the domain of each index is partitioned.
- it analyzes the behavior of urban green areas during periods of heatwaves, to evaluate which types of urban greenery are which green areas are least vulnerable to heatwaves, and then, most suitable for mitigating the effects of heatwaves in urban settlements. This behavior is deduced starting from LST, NDMI and NDVI measurements, which allow us to evaluate the thermal responses, health and humidity level of urban greenery;
- to characterize urban green areas, an unsupervised method of classification of the three indices NDVI, NDMI and LST was developed which uses the Jenks algorithm; the Elbow method is used to determine the optimal number of classes. This approach has the advantage of not requiring subjective evaluations for the classification of the three indices;
- the use of the Jenks classification method allows each class to be associated with a Gaussian fuzzy set; the mean membership degree of green areas of a type of urban greenery to the fuzzy set related to an NDVI, NDMI, or LST class can be interpreted as the reliability of the assignment of these urban green areas to this class.
In section 2 the architectural model of the framework is presented, and the phases of the proposed method are discussed in detail. In section 3 is described the urban area of study and are shown and discussed the results obtained executing our method on it. The concluding discussions are given in Section 4.
2. Materials and Methods
The framework analyzes the behavior of urban greenery typologies during heatwaves by considering the raster data indices NDVI, NDMI and LST determined by multispectral satellite images. The next paragraph describes in detail the framework; paragraph 2.2 discusses the case study given by the city of Naples (Italy) and describes the data used to test our method.
2.1. The Proposed Framework
The framework is schematized in Figure 1.
After extracting the raster data and giving the spatial distribution of the three indices during a heatwave, for each index, a raster classification process is performed. This process is implemented using the Natural Breaks thematic classification algorithm which, in partitioning the real interval corresponding to the index definition domain, determines the lower and upper bounds of the subset corresponding to each class (the breaks), so that the average standard deviation of the value of the pixel index assigned to each class is as small as possible.
We adopt the Elbow method to set the number of classes. The Elbow method is a heuristic approach applied in cluster analysis to set the optimal number of clusters, given by the number of clusters for which the curve of the trend of the quadratic sum of the distances of the data points from the centers of the clusters they belong to has an elbow, that is, for higher values of the number of clusters, the curve flattens.
Compared to other validity indices used for determining the optimal number of clusters, the Elbow method has the advantage of being fast; however, its main flaw is the ambiguity in determining the precise location of the curve elbow [20,21]. To overcome this limit, we propose to set the elbow point equal to the value k of the number of classes for which the reduction in variance compared to that obtained with k -1 classes is less than 25%.
Formally, let K be the number of classes in which is partitioned the domain of the index and let be the variance of the index for the ith class, where i = 1,2,…,K. The average variance obtained considering K classes is given by:
The reduction in variance with respect to the use of K-1 classes is given by:
The first value of the number of classes K for which is less than 0.25 is selected as the Elbow point.
In Figure 2 shows an example of application of this approach for determining the optimal number of classes. The selected value for K is K = 7, where a value of less than 0.25 is achieved.
The result of the raster classification process is a raster dataset in which each pixel is assigned the identifier of the thematic class to which it belongs.
A label is assigned to each thematic class following the order of the class and assigned to the central classes the term Medium, if K is odd or the terms Medium low and Medium high if K is even. For example, if K = 5, the third class, which constitutes the central class, is assigned the label Medium, the second and fourth classes, respectively, the labels Medium low and Medium high. Assuming K = 6, the third and fourth classes are assigned the labels Medium low and Medium high, respectively, the labels Low and High are assigned to the second and fifth classes, and the first and last class the labels Very low and Very high.
In the next step, a classification of the urban green areas based on each index is performed, where the urban green areas in the area of study are given by polygons and each polygon is assigned the type of greenery. To carry out this classification, each thematic class into which the index domain has been partitioned is assigned a Gaussian fuzzy set whose parameters are given by the average value and the standard deviation of the pixels belonging to the thematic class.
Formally, let μk and σk be, respectively, the mean and the standard deviation of the values of the pixels belonging to the kth thematic class, where k = 1,…,K. To this thematic class is assigned a Gaussian fuzzy cluster having membership function:
And having as label the label of the thematic class.
For example, let consider the following table, in which are shown the average and the standard deviation of the NDMI index for all the six thematic classes in which is partitioned the domain (Table 1).
Assigning a fuzzy set to each thematic class, are obtained the following Gaussian fuzzy sets (Figure 4)
Using a zonal statistics process, to each polygon representing an urban green area is attributed a value of the index given by the average of the values of the pixels covering this polygon; then to this polygon is assigned the label of the Gaussian fuzzy set to whom it belongs having the highest membership degree.
For example, if the average of the NDMI values of the pixels covering this polygon is 0.11, it is assigned the label Medium high, as it belongs to the Gaussian fuzzy set termed Medium high with the highest membership degree (0.92). This membership degree is interpreted as the uncertainty of this assignment.
The outcomes of this step are three thematic maps in which the green areas are represented, respectively, by NDVI, NDMI and LST class. Each urban green area is assigned the labels of the NDVI, NDMI and LST classes, the uncertainties of the assignment to each of the three classes, as well as the type of greenery.
In the last step, an analysis of the behavior of the different types of urban greenery during the heatwave is conducted. For each type of urban greenery and for each of the three indices, the frequencies of green areas falling into each of the thematic classes into which the index has been divided are determined. By comparing the frequency distributions of the three indices it is possible to evaluate the behavior of the type of urban greenery during heatwaves. This analysis will allow us to detect the presence of types of urban greenery in which significant frequencies of urban areas belonging to specific NDMI, NDVI and LST classes are recorded and to verify whether for these types of urban greenery, these classes relating to the three indices are correlated.
Furthermore, for each type of greenery and each class a reliability is determined consisting of the average of the membership degrees of the green areas to the corresponding Gaussian fuzzy set.
To clarify this process, the frequencies of vineyards belonging to six NDMI classes and the average of membership degrees are shown as an example in Table 2.
The horizontal histogram in Figure 4 shows the distribution of frequencies obtained. The histogram highlights that approximately 70% of vineyards are classified with NDMI High or Medium high; furthermore, over 76% of the vineyards are classified with at least Medium high NDMI and a reliability of at least 67%.
The mean membership degrees can be interpreted as the reliability of the assignment to a class of that frequency of urban greenery. In the example in Table 2 it is higher than 0.5 and can be considered acceptable, as the uncertainty in assigning vineyards to an NDMI class is negligible.
2.2. The Case Study
The city of Naples is a complex urban settlement with a high population density and building density.
The historic city center is the area with the greatest population and built density; it is characterized by a high percentage of impervious open spaces and few urban green spaces. The western and northwestern outskirts of the city are characterized by a greater extension of forest-type green spaces than the rest of the city. The eastern suburbs are predominantly industrial, with a high density of buildings along the coast and a predominance of impervious open spaces.
To test the framework, multispectral satellite data acquired during a heat wave that occurred on July 15, 2023, were acquired; these data were necessary for the creation of the raster data of the NDVI, NDMI and LST indices. In addition, the latest topographic database at 1:5000 scale provided by the Campania Region was used, to extract all the city’s green areas as polygonal features. Table 3 shows information relating to the satellite and spatial resolution.
The urban green areas are extracted as polygons from the regional topographic database at 1:5000 scale. In Table 4 is shown the number of polygons extracted for each type of greenery.
The framework was implemented using the GIS platform ESRI ArcGIS Pro; the code was generated in the Python environment using the ESRI Python library.
In the next section the results obtained are presented and discussed
3. Results and Discussion
After creating the three raster data NDVI, NDMI and LST, starting from the multiband satellite data taken on July 15, 2023, each index was treated separately in a reclassification process in which the Jenks thematic classification method was used for the partitioning into classes. To determine the optimal number of classes the Elbow method was used, analyzing the trend of the average variance value as the number of classes varied.
The optimal number of classes is 6 for NDMI and 7 for NDVI and LST. Each thematic class is assigned a Gaussian fuzzy set where the parameter means, and standard deviation are given by mean and standard deviation of the corresponding thematic class.
In Table 4 are shown, for each index, the label, mean and standard deviation of the thematic classes.
The polygonal spatial dataset of the urban green areas was created extracting from the topographical database and merging all the vector themes corresponding to types of urban green areas. Then, a zonal statistics method was implemented in the GIS platform to calculate statistics on cell values of the raster NDVI, NDMI and LST within each urban green area. To each urban area is calculated the mean value of NDVI, NDMI and LST; then, the urban green area is assigned to the class corresponding to the Gaussian fuzzy set to which it belongs having the greatest membership degree.
Figure 6, Figure 7 and Figure 8 show, respectively, for NDVI, NDMI and LST, the map with the spatial distribution of the index and the thematic map of the green areas with the partitioning of the index domain into thematic classes.
Finally, the analysis focused on each type of greenery is carried out determining the frequencies of green areas belonging to the NDVI, NDMI and LST classes.
Table 5, Table 6 and Table 7 shown, for each type of greenery, the frequences of urban green areas belonging to the thematic classes of, respectively, NDVI, NDMI and LST.
These results highlight the behavior of some types of greenery during heatwaves. Predominantly broad-leaved forests, reeds and shrubs are mainly classified with NDVI and NDMI at least Medium high and with LST at most Medium Low.
Vineyards are mainly classified with NDVI and NDMI at least Medium high, but also with LST at least Medium high.
Gardens and uncultivated areas do not have high frequencies of belonging to specific NDVI and NDMI classes, although they are predominantly classified with LST between Medium and High.
In Table 8, Table 9 and Table 10 are shown the reliability of belonging of the type of urban green area to each class, respectively, of the indices NDVI, NDMI and LST, where the reliability is given by the mean membership degree to the corresponding Gaussian fuzzy set of the type of green areas belonging to the class.
All the measured reliability values are greater than 0.5, indicating that, on average, the degree of membership in the Gaussian fuzzy set corresponding to the class to which a green area belongs is a value greater than 0.5. This result shows that the uncertainty of assigning an urban green area to an NDVI, NDMI and LST class can be considered negligible.
The results obtained for the different types of greenery are analyzed in detail below. For brevity, detailed results are presented for three types of greenery: for the predominantly broad-leveled forests and olive groves, which, like reeds and shrubs, were found to be less vulnerable during the heatwave, and for the uncultivated areas, which instead have shown more critical behaviors during this period.
As can be seen from the histograms in Figure 9, the predominantly broad-leveled forests are classified mostly with NDVI and NDMI classes Medium high, High and Very high (respectively, 81.82% and 85.17%); on the contrary, they are classified largely as medium-low, and very low LST class (87.56%). Only 8% of the predominantly broad-leveled forests are classified with NDVI Medium Low and only 1% with NDVI low. Similarly, only 12% of them are classified with NDMI Medium Low and only 2% with NDMI Low. From this, it can be deduced that the health status of this type of urban greenery remained good during the heatwave. Furthermore, since only 5% of the forest areas are classified with LST Medium High and none of them are classified with LST High or Very High, it can be concluded that these types of urban greenery were able to cool the soil during the heatwave.
These results denote that urban greenery composed of broad-leaved forests during heat waves maintains optimal levels of efficiency in terms of the presence of live vegetation, percentage of humidity, and temperatures that are not high on the ground.
Olive groves also show similar behavior to deciduous forest areas, with a prevalence of olive groves classified with NDVI and NDMI classes Medium high, High and Very high equal to, respectively, 63.90% and 83.39% (Figs. 10a and 10b). Furthermore, the 53.05% of the olive groves are mainly classified as Low or Medium-Low LST (Figure 10c).
In summary, olive groves showed during the heatwave a presence of live vegetation and good humidity, even if not as optimal as that of urban forest areas with a prevalence of broad-leaved trees; Furthermore, even olive groves were able to maintain an acceptable soil temperature during this period (only 13% of them are classified with LST Medium High and only 3% with LST High).
A different behavior is shown by uncultivated areas; they are classified mainly with NDVI and NDMI Medium low, Low and Very low, with values of 42.28% and 51.77% respectively (Figs 11a and 11b). Furthermore, they are mainly classified with LST Medium High, High and Very high, with a value equal to 53.86%. Only 9% of uncultivated areas are classified with LST Low and Very low class, while 54% of them are classified with LST at least Medium high (Figure 11c).
This trend highlights that uncultivated areas during heatwaves represent critical urban green areas, being devoid of living vegetation, predominantly arid and with a reduced capacity to absorb or reduce thermal energy to the ground.
4. Conclusions
All the measured reliability values are greater than 0.5, indicating that, on average, the degree of membership in the Gaussian fuzzy set corresponding to the class to which a green area belongs is a value greater than 0.5. This result shows that the uncertainty of assigning an urban green area to an NDVI, NDMI and LST class can be considered negligible.
The results obtained for the different types of greenery are analyzed in detail below. For brevity, detailed results are presented for three types of greenery: for the predominantly broad-leveled forests and olive groves, which, like reeds and shrubs, were found to be less vulnerable during the heatwave, and for the uncultivated areas, which instead have shown more In this work, a GIS-based model was proposed to evaluate the behavior of types of urban greenery during periods of heatwaves, analyzing the distribution of the NDVI, NDMI and LST rasters in the urban settlement under study.
The model uses an unsupervised classification method of NDVI, NDMI and LST which allows optimizing the similarity between urban green areas belonging to a class and the dissimilarity between green areas in different classes. Furthermore, by assigning a Gaussian fuzzy set to each class the model provides an assessment of the reliability of the assignment of urban greenery types to a class. The model was tested to analyze the behavior of types of urban greenery present in the city of Naples (Italy) during a period of heatwaves. The results highlighted that some types of urban greenery, such as forest areas with a prevalence of broad-leaved trees and olive groves, had optimal behavior over the period, recording on average high values of NDVI and NDMI and on average low values of LST. On the contrary, uncultivated areas appear to have predominantly low values of NDVI and NDMI and predominantly high values of LST.
The proposed method can represent a valid decision support in the choices of adaptive transformation, and plant or maintenance actions to be carried out in urban settlements to deal with heatwave scenarios.
We intend to carry out future research to improve the accuracy of the results, through the acquisition of a more detailed scale of the distribution of green urban areas and their characteristics, and by testing the model in different urban settlements and various heatwave scenarios.
Author Contributions
Conceptualization, B.C., F.D.M., C.M. and V.M.; methodology, B.C., F.D.M., C.M. and V.M.; software, B.C., F.D.M., C.M. and V.M.; validation, B.C., F.D.M., C.M. and V.M.; formal analysis, B.C., F.D.M., C.M. and V.M.; investigation, B.C., F.D.M., C.M. and V.M.; resources, B.C., F.D.M., C.M. and V.M.; data curation, B.C., F.D.M., C.M. and V.M.; writing—original draft preparation, B.C., F.D.M., C.M. and V.M.; writing—review and editing, B.C., F.D.M., C.M. and V.M.; visualization, B.C., F.D.M., C.M. and V.M.; supervision, B.C., F.D.M., C.M. and V.M. All authors have read and agreed to the published version of the manuscript.
Funding
This research received no external funding.
Data Availability Statement
The data presented in this study are available on request from the corresponding author.
Conflicts of Interest
The authors declare no conflicts of interest”.
References
- Serrano, J. ; Shahidian, da Silva, M. Evaluation of normalized difference water index as a tool for monitoring pasture seasonal and inter-annual variability in a mediterranean agro-silvo-pastoral system. Water 2019, 11, 62. [Google Scholar] [CrossRef]
- Dutta, D.; Rahman, A.; Paul, S.K.; Kundu, A. Spatial and temporal trends of urban green spaces: an assessment using hyper-temporal NDVI datasets. Geocarto International 2022, 37, 7983–8003. [Google Scholar] [CrossRef]
- de la Iglesia Martinez, A.; Labib, S.M. Demystifying normalized difference vegetation index (NDVI) for greenness exposure assessments and policy interventions in urban greening. Environmental Research 2023, 220, 115155. [Google Scholar] [CrossRef] [PubMed]
- Aryal, J.; Sitaula, C.; Aryal, S. NDVI Threshold-Based Urban Green Space Mapping from Sentinel-2A at the Local Governmental Area (LGA) Level of Victoria, Australia. Land 2022, 11, 351. [Google Scholar] [CrossRef]
- Cardone, B.; D’Ambrosio, V.; Di Martino, F.; Miraglia, V.; Rigillo, M. Analysis of the Ecological Efficiency Increase of Urban Green Areas in Densely Populated Cities. Land 2023, 12, 523. [Google Scholar] [CrossRef]
- Liu, Y.; Li, H.; Li, C.; Zhong, C.; Chen, X. An Investigation on Shenzhen Urban Green Space Changes and Their Effect on Local Eco-Environment in Recent Decades. Sustainability 2021, 13, 12549. [Google Scholar] [CrossRef]
- Stumpe, B.; Bechtel, B.; Heil, J.; Jörges, C.; Jostmeier, A.; Kalks, F.; Schwarz, K.; Marschner, B. Soil texture mediates the surface cooling effect of urban and peri-urban green spaces during a drought period in the city area of Hamburg (Germany). Sci. Total Environ. 2023, 897, 165228. [Google Scholar] [CrossRef] [PubMed]
- Shi, F.; ang, B.; Li, M. An improved framework for assessing the impact of different urban development strategies on land cover and ecological quality changes -A case study from Nanjing Jiangbei New Area, China. Ecological Indicators 2023, 147, 109998. [Google Scholar] [CrossRef]
- Kim, J.; Khouakhi, A.; Corstanje, R.; Johnston, A.S.A. Greater local cooling effects of trees across globally distributed urban green spaces. Science of the Total Environment 2024, 911, 168494. [Google Scholar] [CrossRef] [PubMed]
- Sharma, R.; Joshi, P. K Identifying seasonal heat islands in urban settings of Delhi (India) using remotely sensed data – An anomaly-based approach. Urban Climate 2014, 9, 19–34. [Google Scholar] [CrossRef]
- Mukherjee, S.; Joshi, P.K.; Garg, R.D. Analysis of urban built-up areas and surface urban heat island using downscaled MODIS derived land surface temperature data. Geocarto International. 2016, 32, 900–918. [Google Scholar] [CrossRef]
- Kumar, S.; Panwar, M. Urban heat island footprint mapping of Delhi using remote sensing. International Jour. of Emerging Technologies 2017, 8, 80–83. [Google Scholar]
- Renard, F.; Alonso, L.; Fitts, Y.; Hadjiosif, A.; Comby, J. Evaluation of the Effect of Urban Redevelopment on Surface Urban Heat Islands. Remote Sens. 2019, 11, 1–31. [Google Scholar] [CrossRef]
- Sarif, M.O.; Rimal, B.; Stork, N.E. Assessment of Changes in Land Use/Land Cover and Land Surface Temperatures and Their Impact on Surface Urban Heat Island Phenomena in the Kathmandu Valley (1988–2018). ISPRS Int. J. Geo-Inf. 2020, 9, 726. [Google Scholar] [CrossRef]
- Stumpe, B.; Bechtel, B.; Heil, J.; Jörges, C.; Jostmeier, A.; Kalks, F.; Schwarz, K.; Marschner, B. Soil texture mediates the surface cooling effect of urban and peri-urban green spaces during a drought period in the city area of Hamburg (Germany). Sci. Total Environ. 2023, 897, 165228. [Google Scholar] [CrossRef] [PubMed]
- Nahin, K.T.K.; Sara, H.H.; Barai, K.R.; Quayyum, Z.; Baumgartner, J. Spatiotemporal Variability of Urban Greenspace and Surface Temperature in Dhaka City: A Public Health Aspect. In: Biloria, N., Sebag, G., Robertson, H. (eds) The Empathic City. S.M.A.R.T. Environments. Springer, Cham. 2023, pp. 143-170. [CrossRef]
- Jenks, G. F: The Data Model Concept in Statistical Mapping, International Yearbook of Cartography, 1967, 7, 186–190.
- North, M.A. A Method for Implementing a Statistically Significant Number of Data Classes in the Jenks Algorithm 2009 Sixth International Conference on Fuzzy Systems and Knowledge Discovery, Tianjin, China 2009, pp. 35-38. [CrossRef]
- Mohamed, M. (2017) Analysis of Digital Elevation Model and LANDSAT Data Using Geographic Information System for Soil Mapping in Urban Areas. Natural Resources 2018, 8, 767–787. [Google Scholar] [CrossRef]
- Arbelaitz, O.; Gurrutxaga, I.; Muguerza, J. : Perez, J.M.: Perona, I. An extensive comparative study of cluster validity indices. Pattern Recognition 2013, 46, 243–25. [Google Scholar] [CrossRef]
- Schubert, E. Stop using the elbow criterion for k-means and how to choose the number of clusters instead. ACM SIGKDD Explorations Newsletter 2023, 25, 36–42. [Google Scholar] [CrossRef]
Figure 1.
Scheme of the proposed framework.
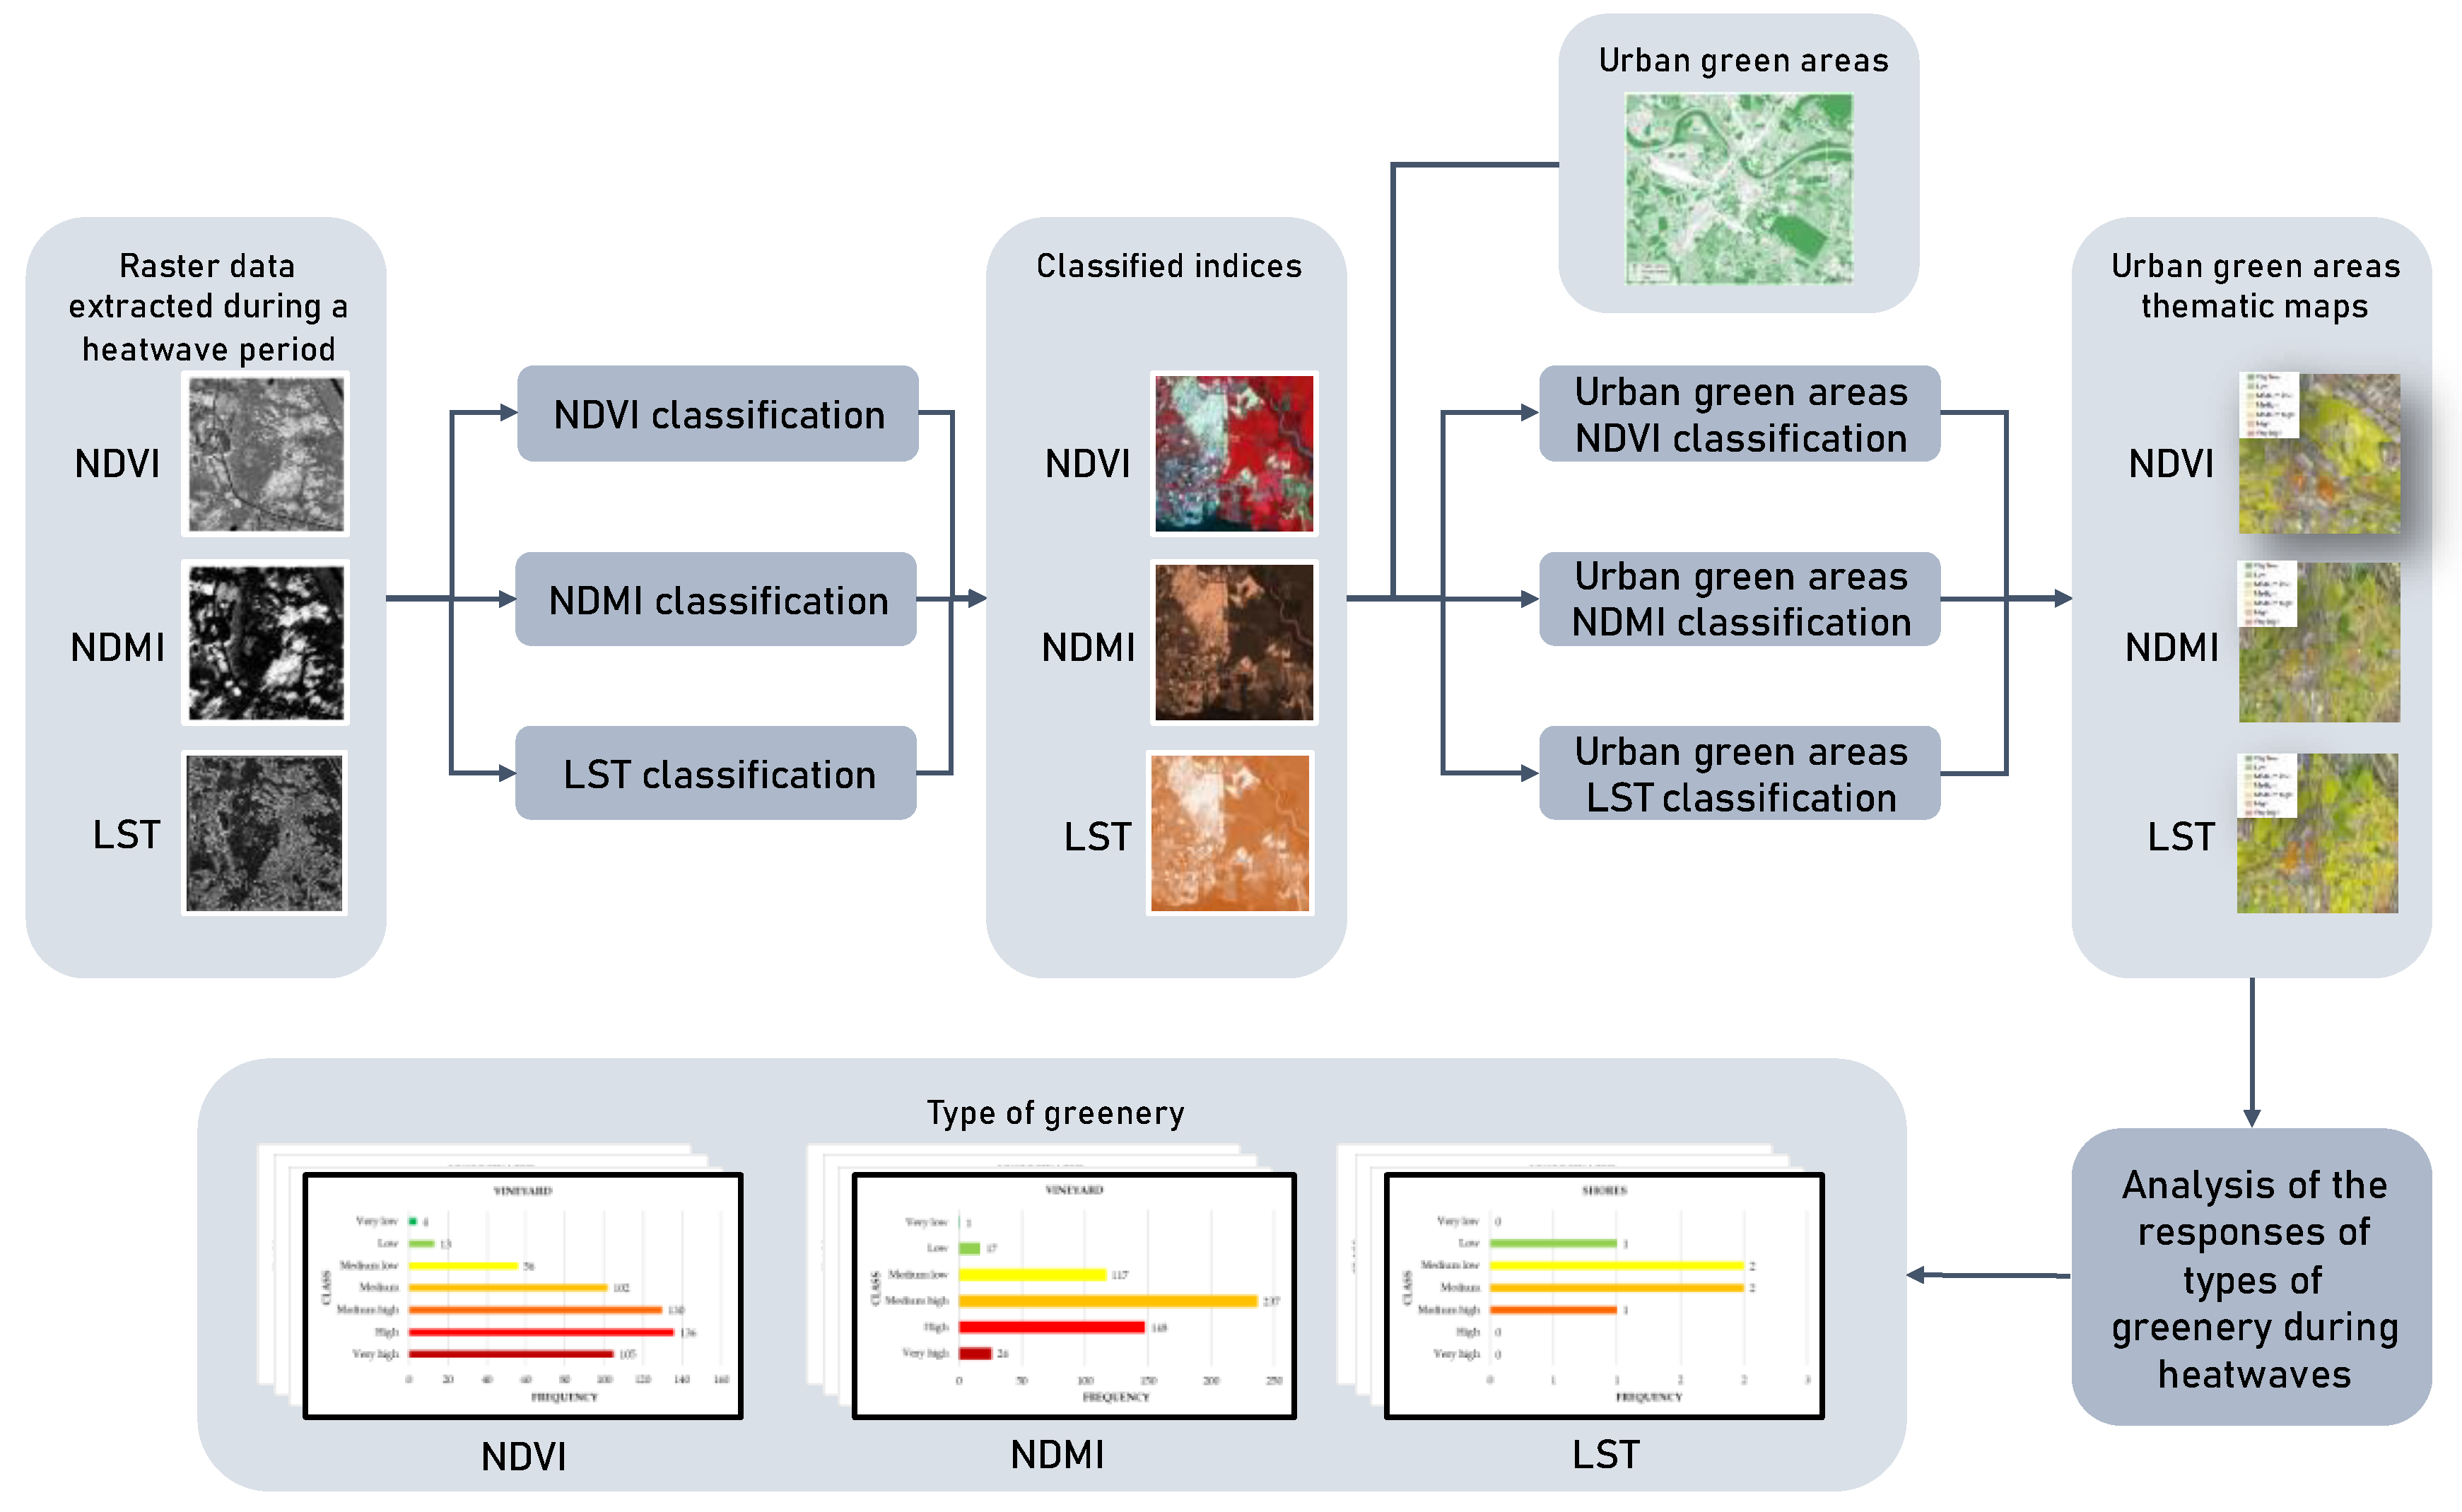
Figure 2.
Example of Elbow point selection.
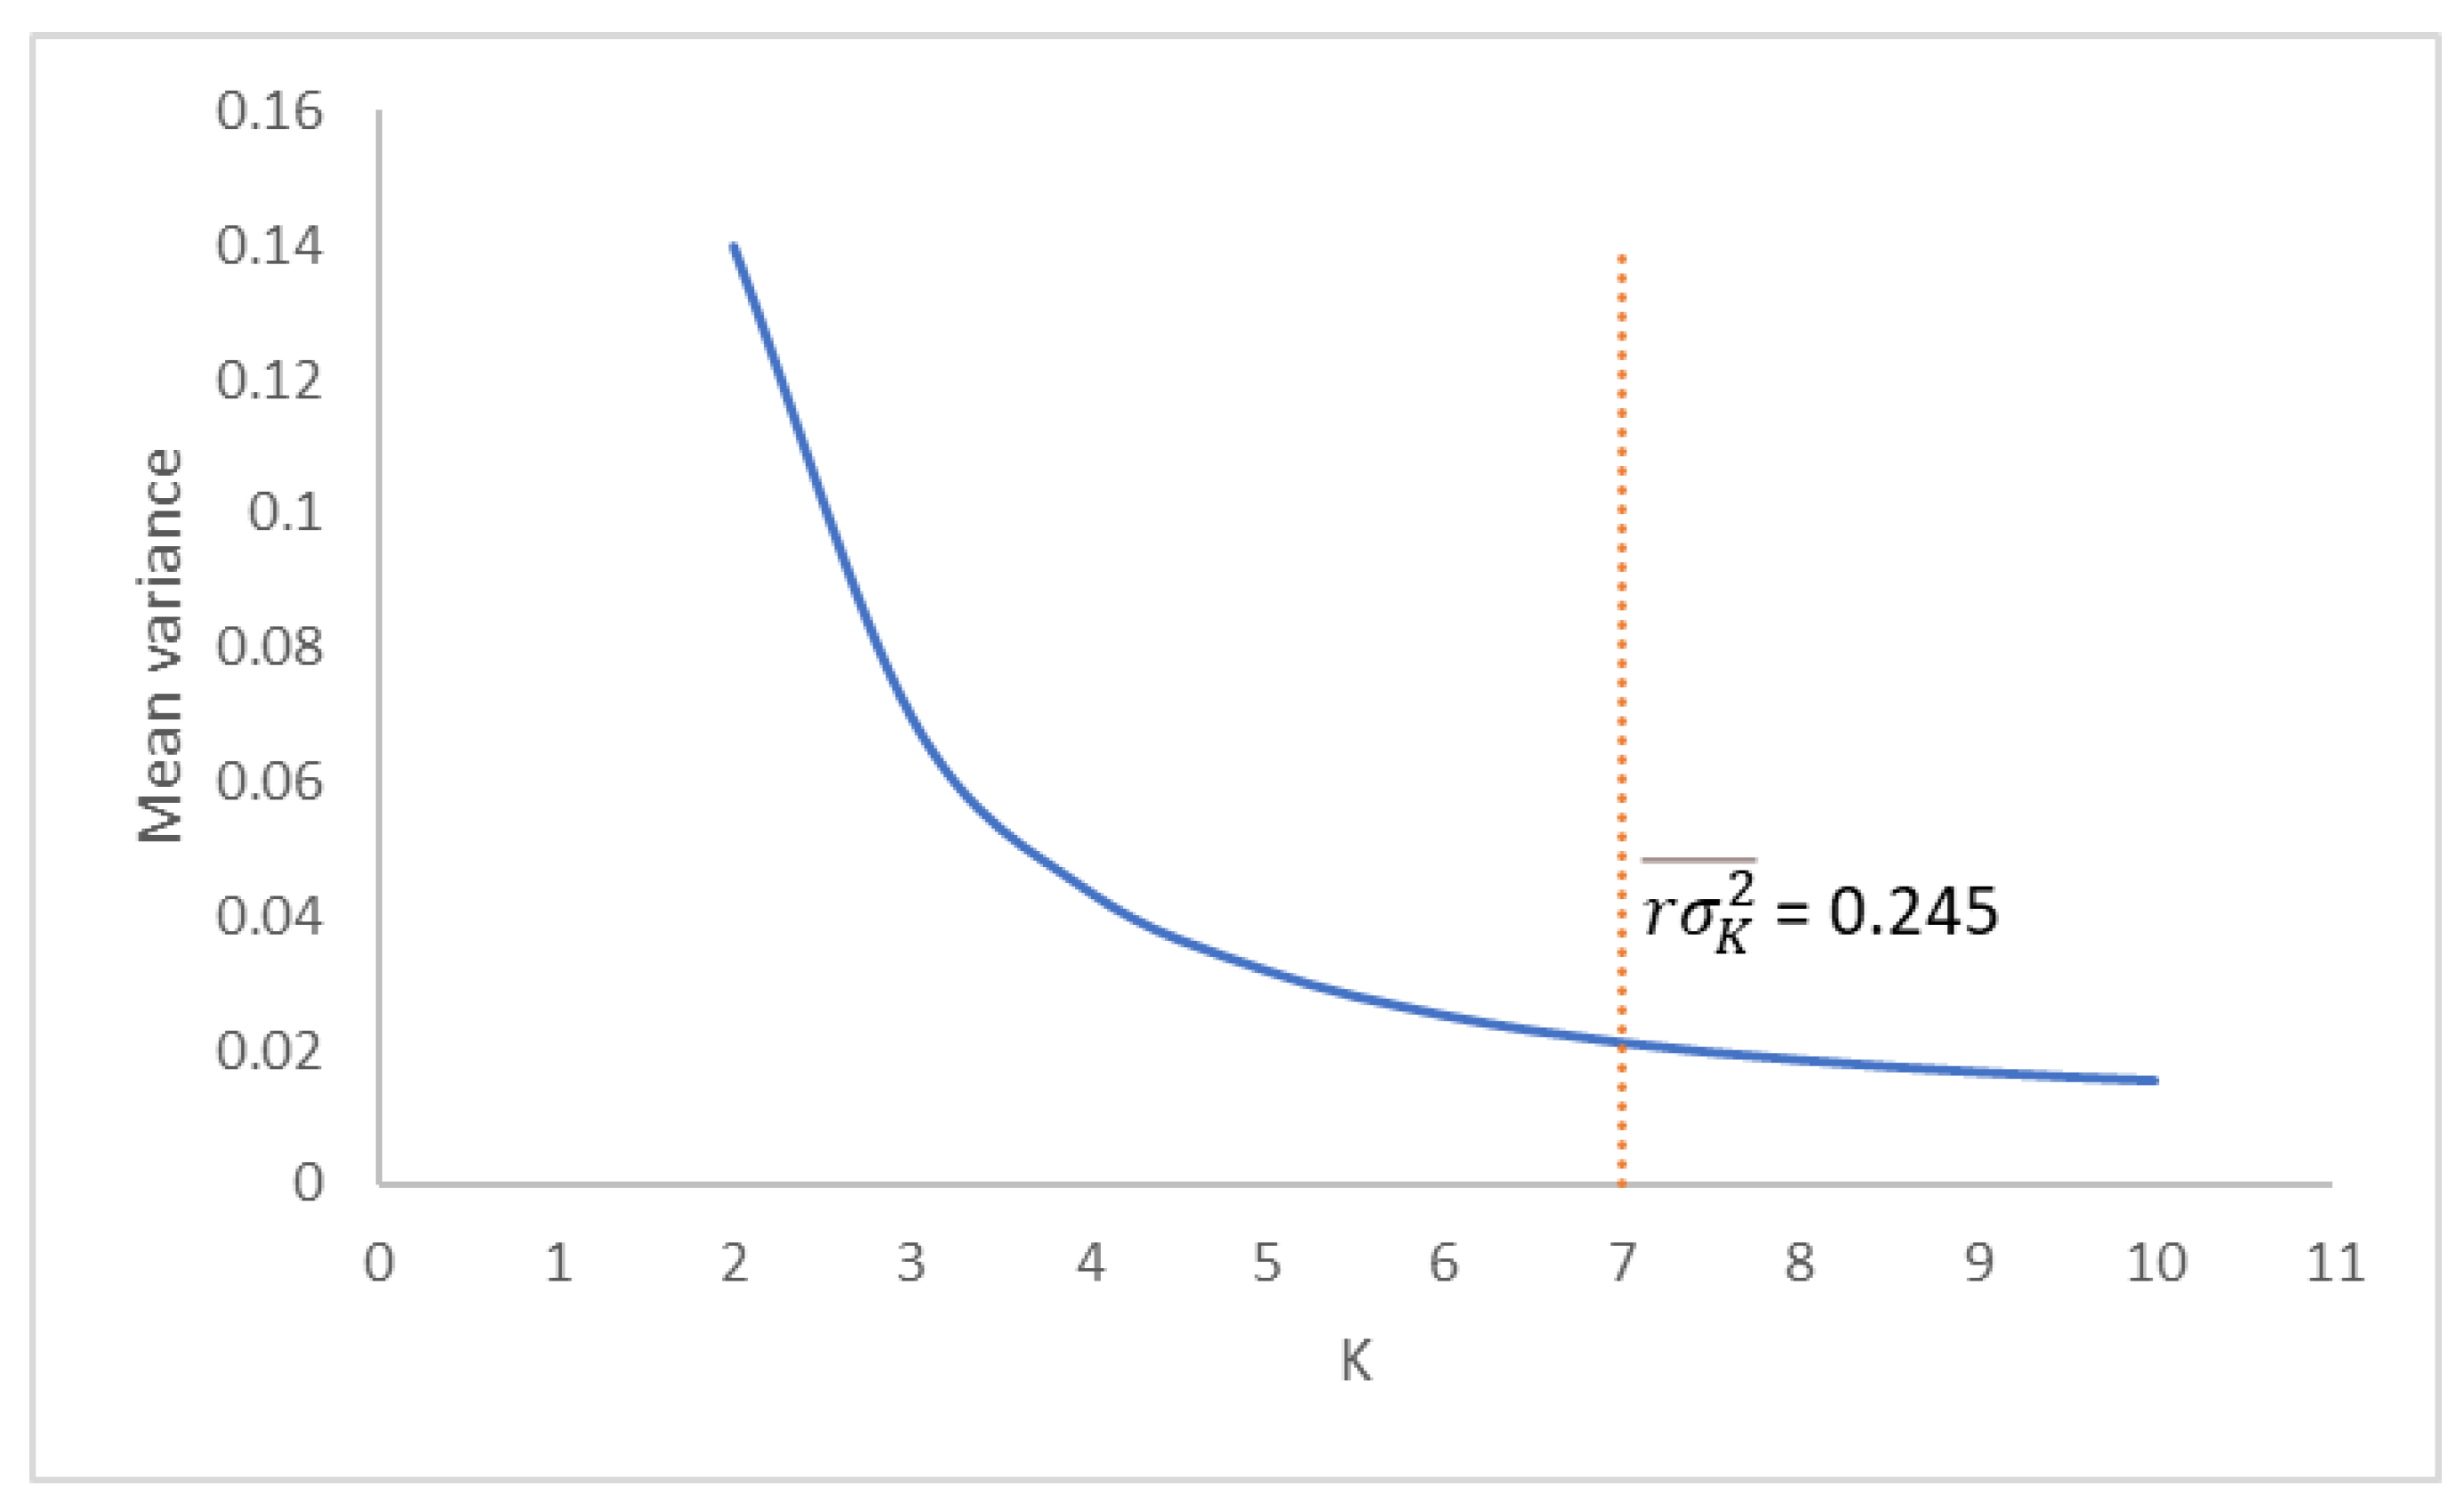
Figure 3.
Gaussian fuzzy sets created from the six NDMI thematic classes in Table 1.
Figure 3.
Gaussian fuzzy sets created from the six NDMI thematic classes in Table 1.
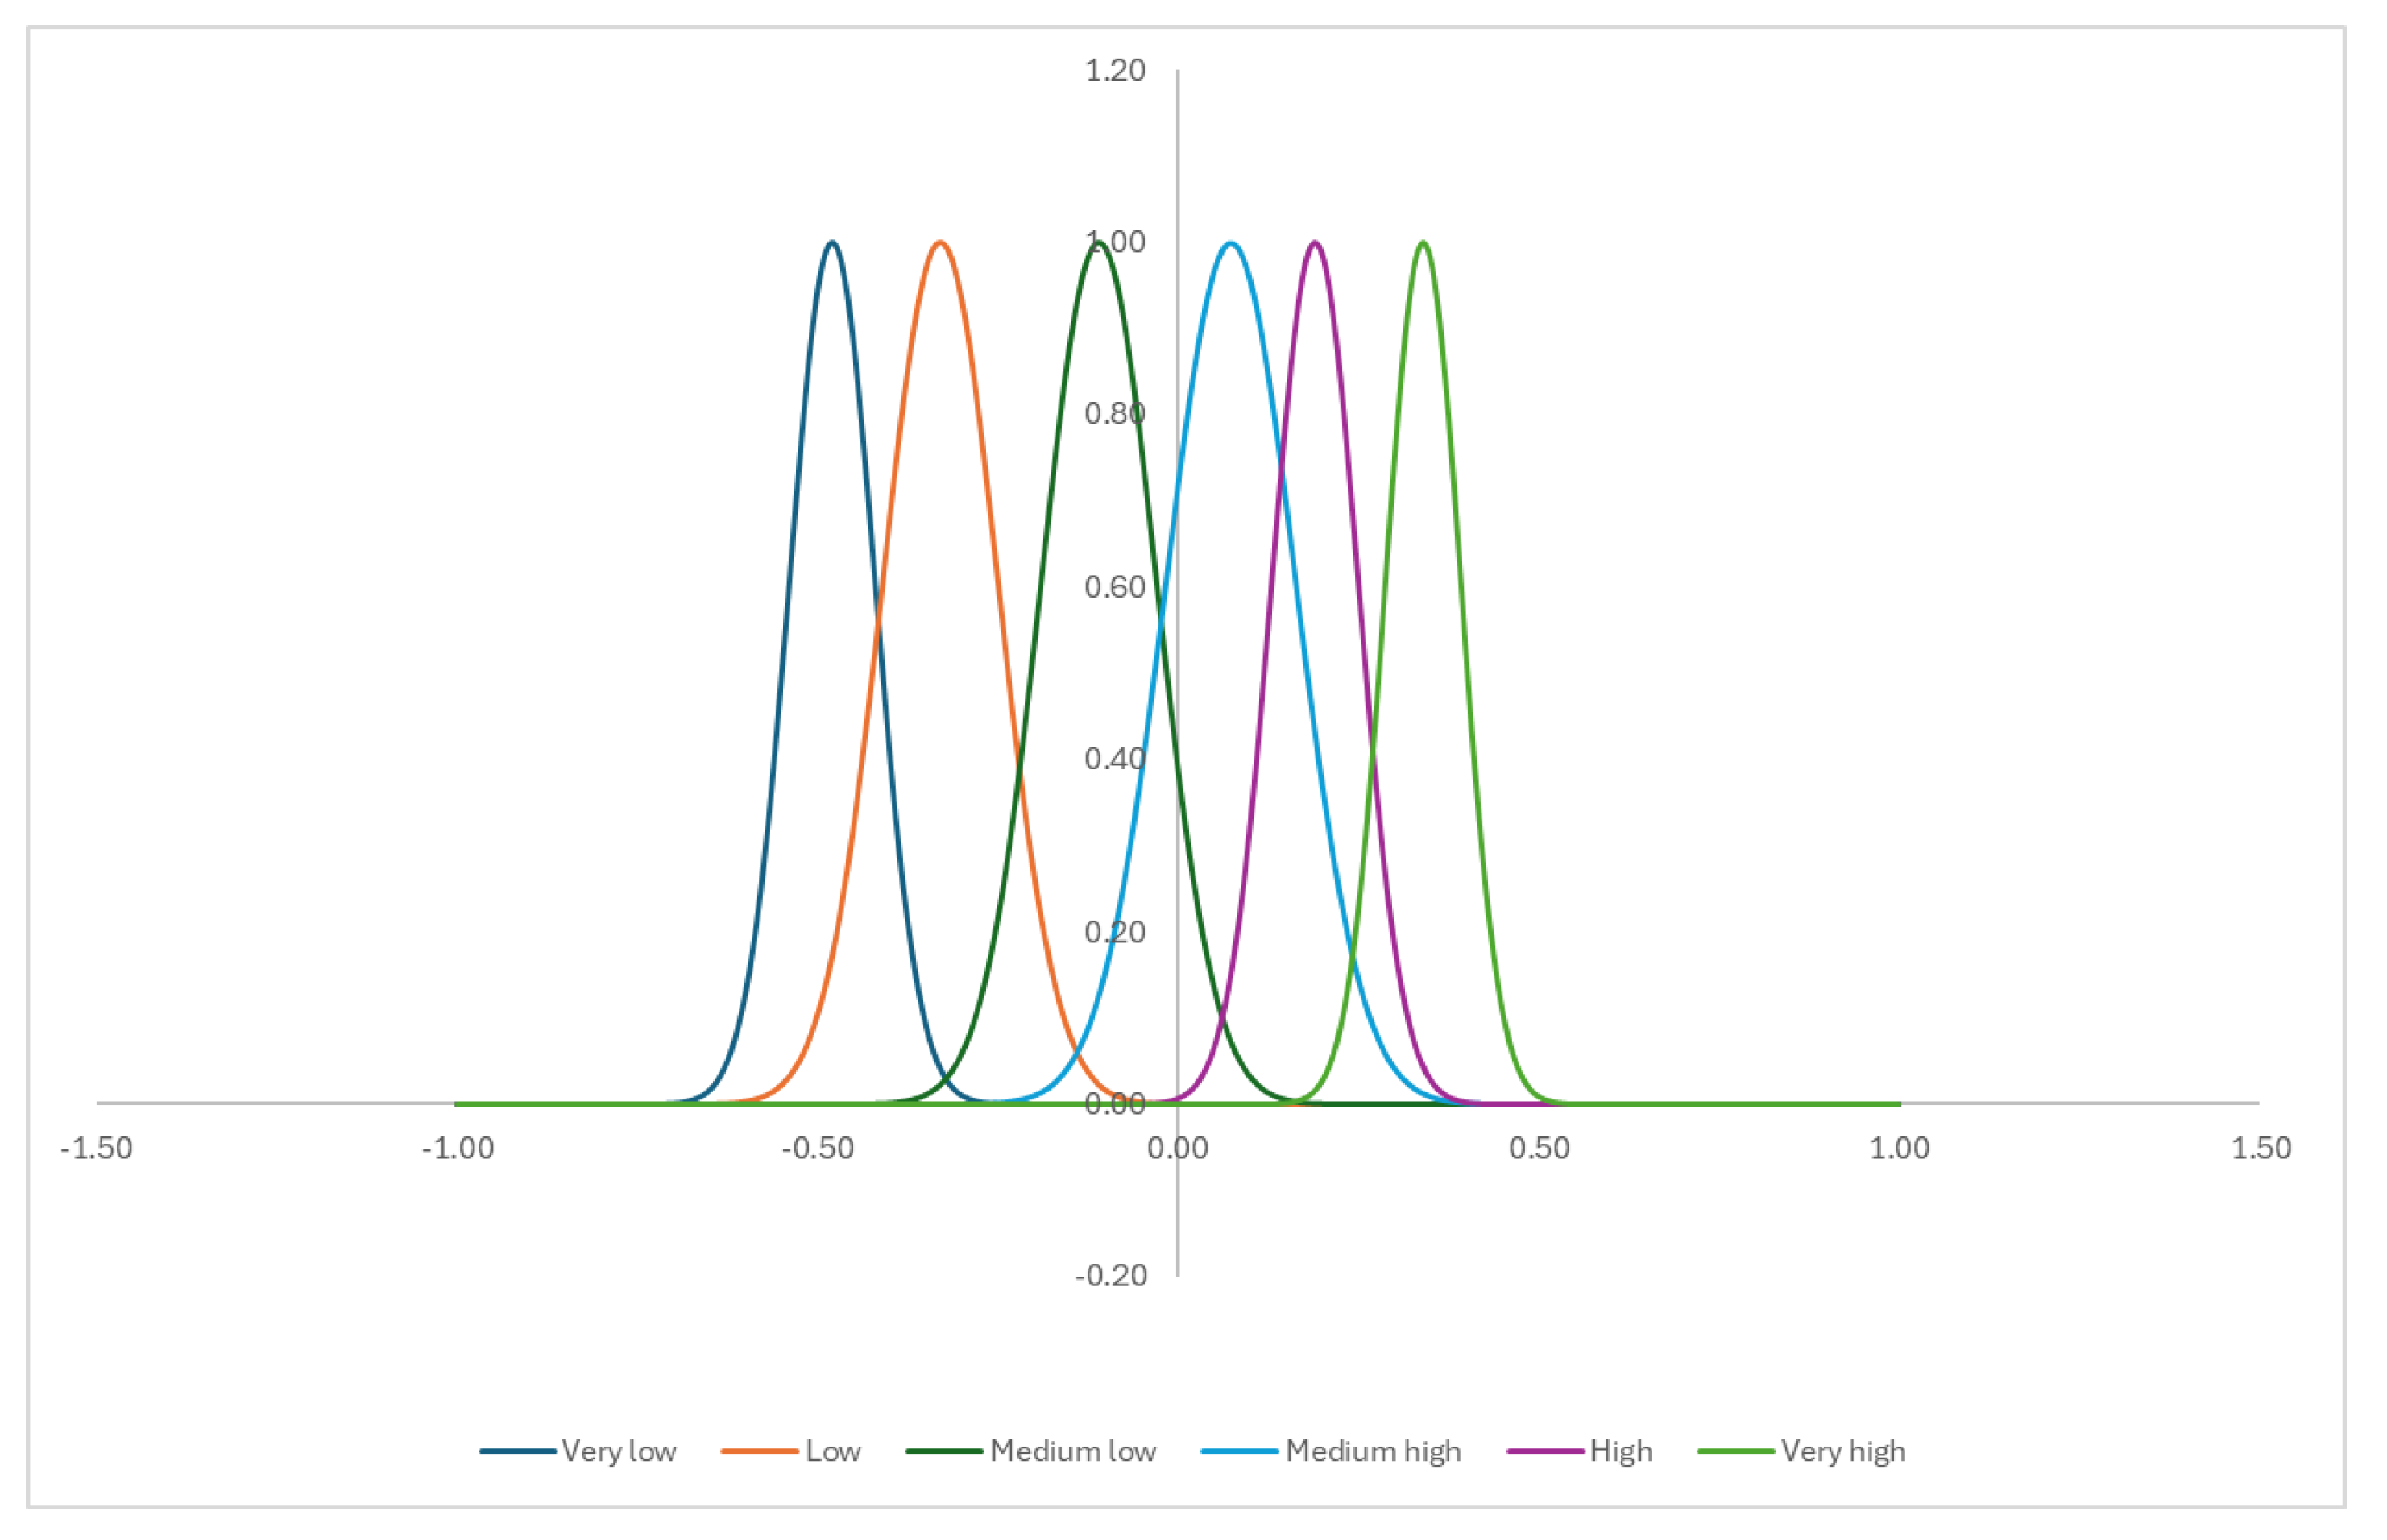
Figure 4.
Histogram showing the frequencies of vineyards belonging to the six NDMI classes.
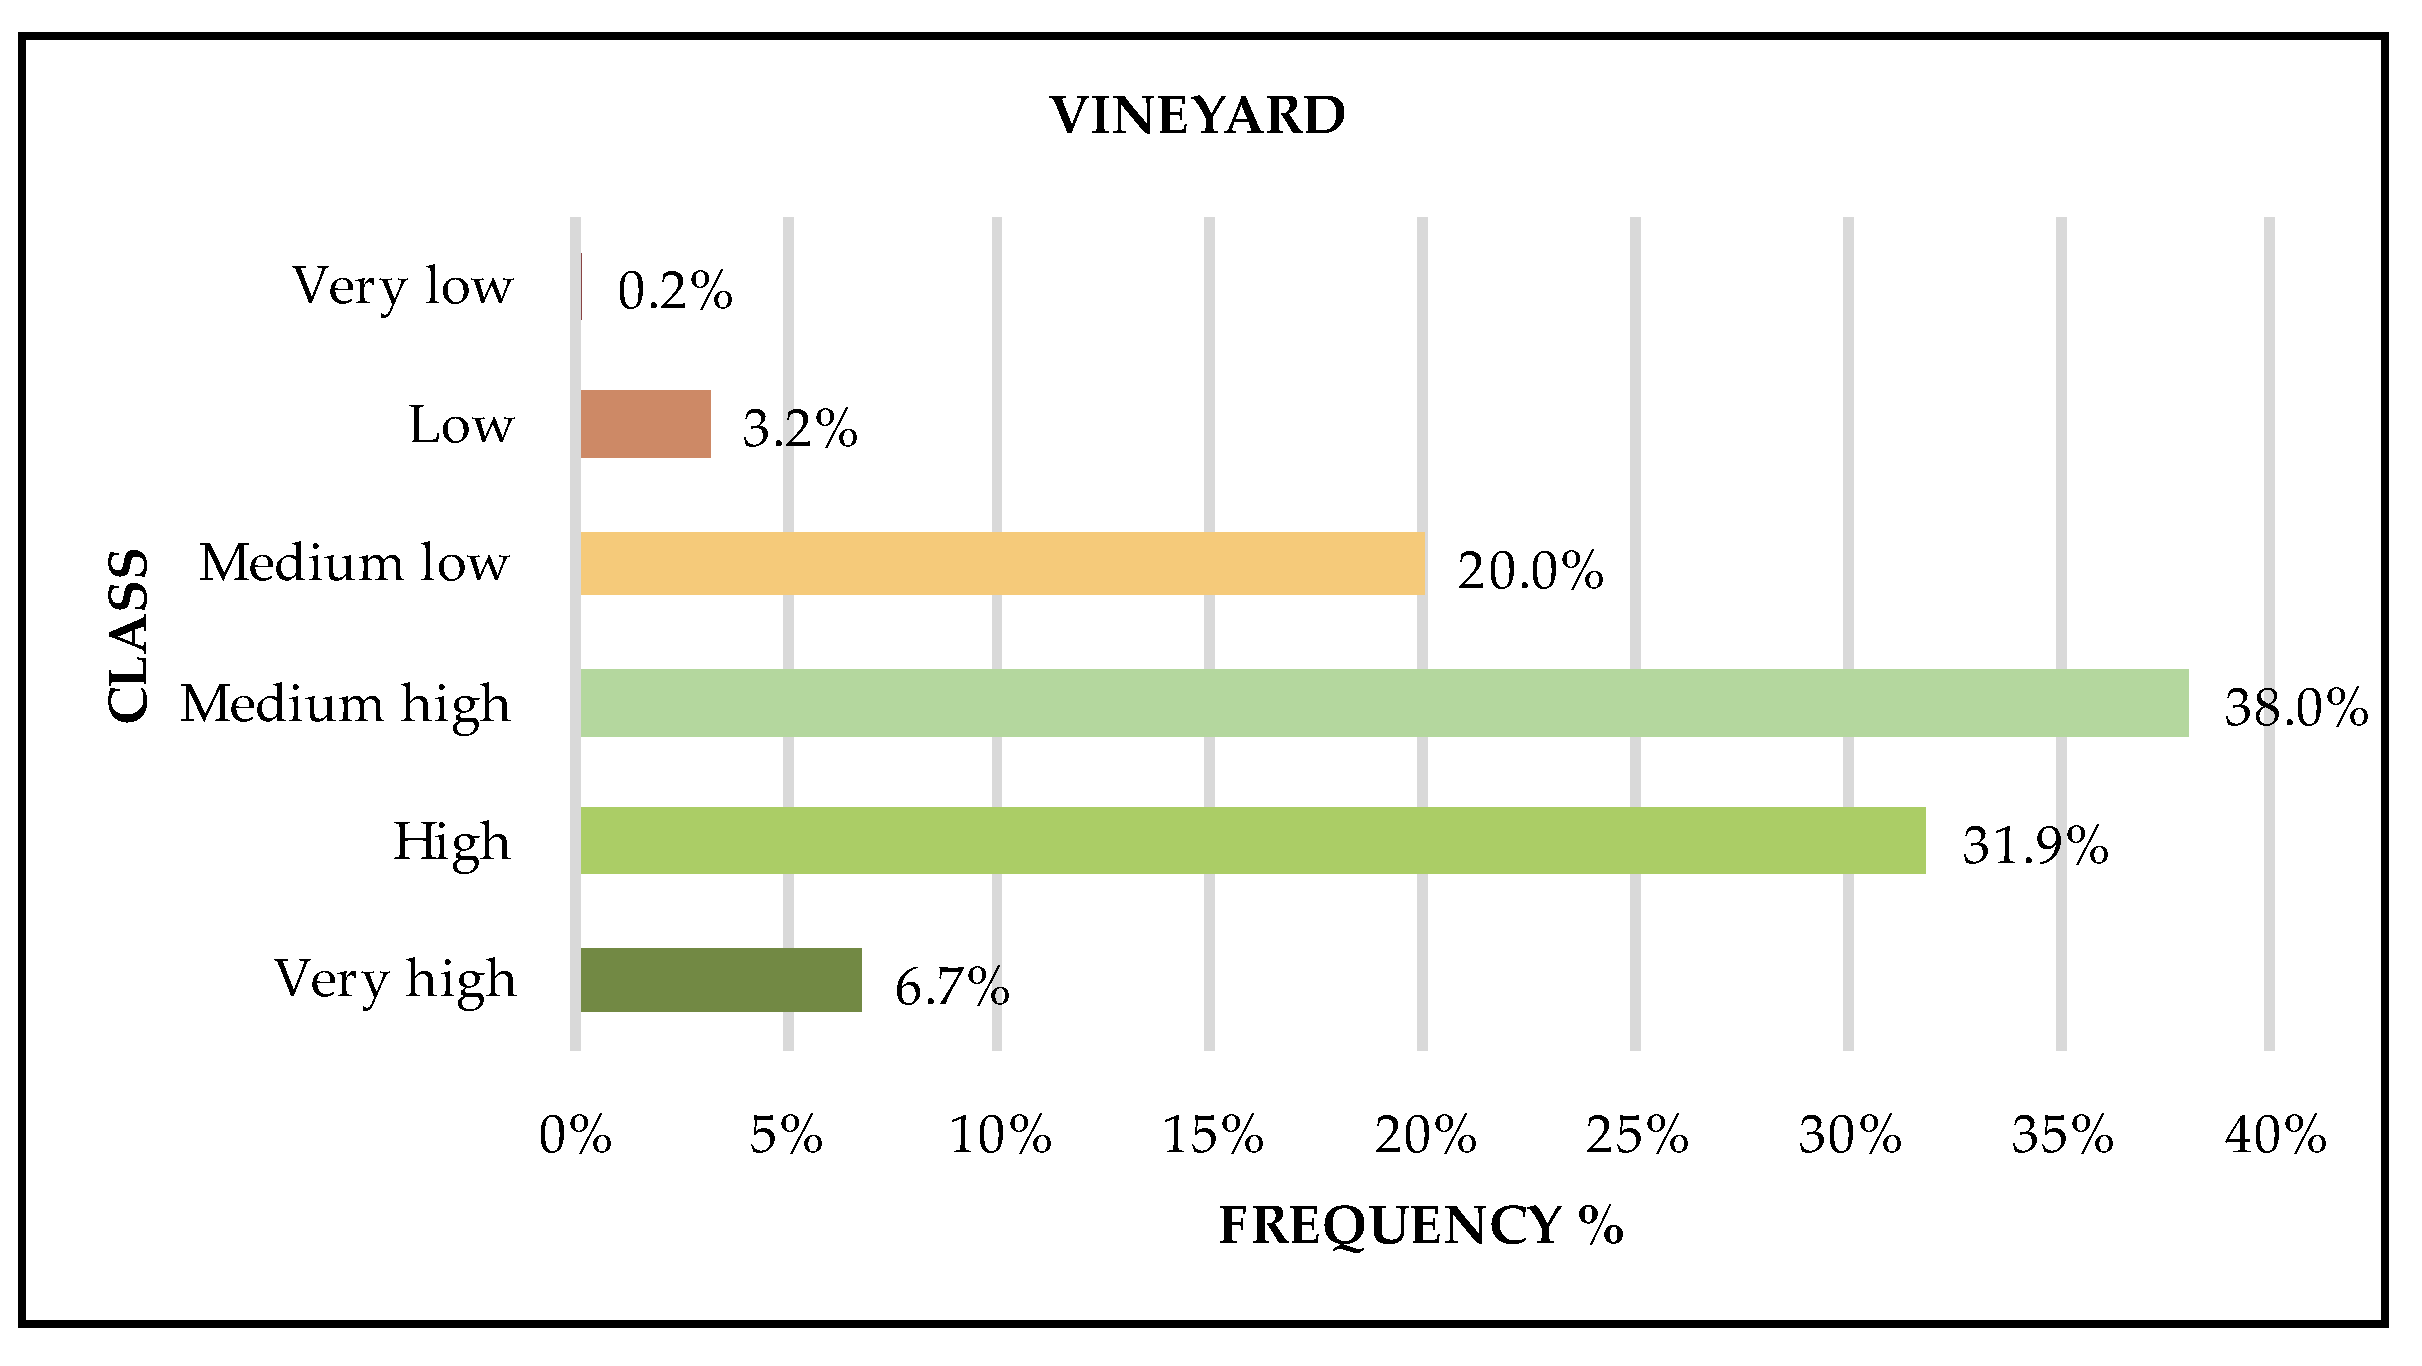
Figure 5.
Types of greenery in the city of Naples, Italy.
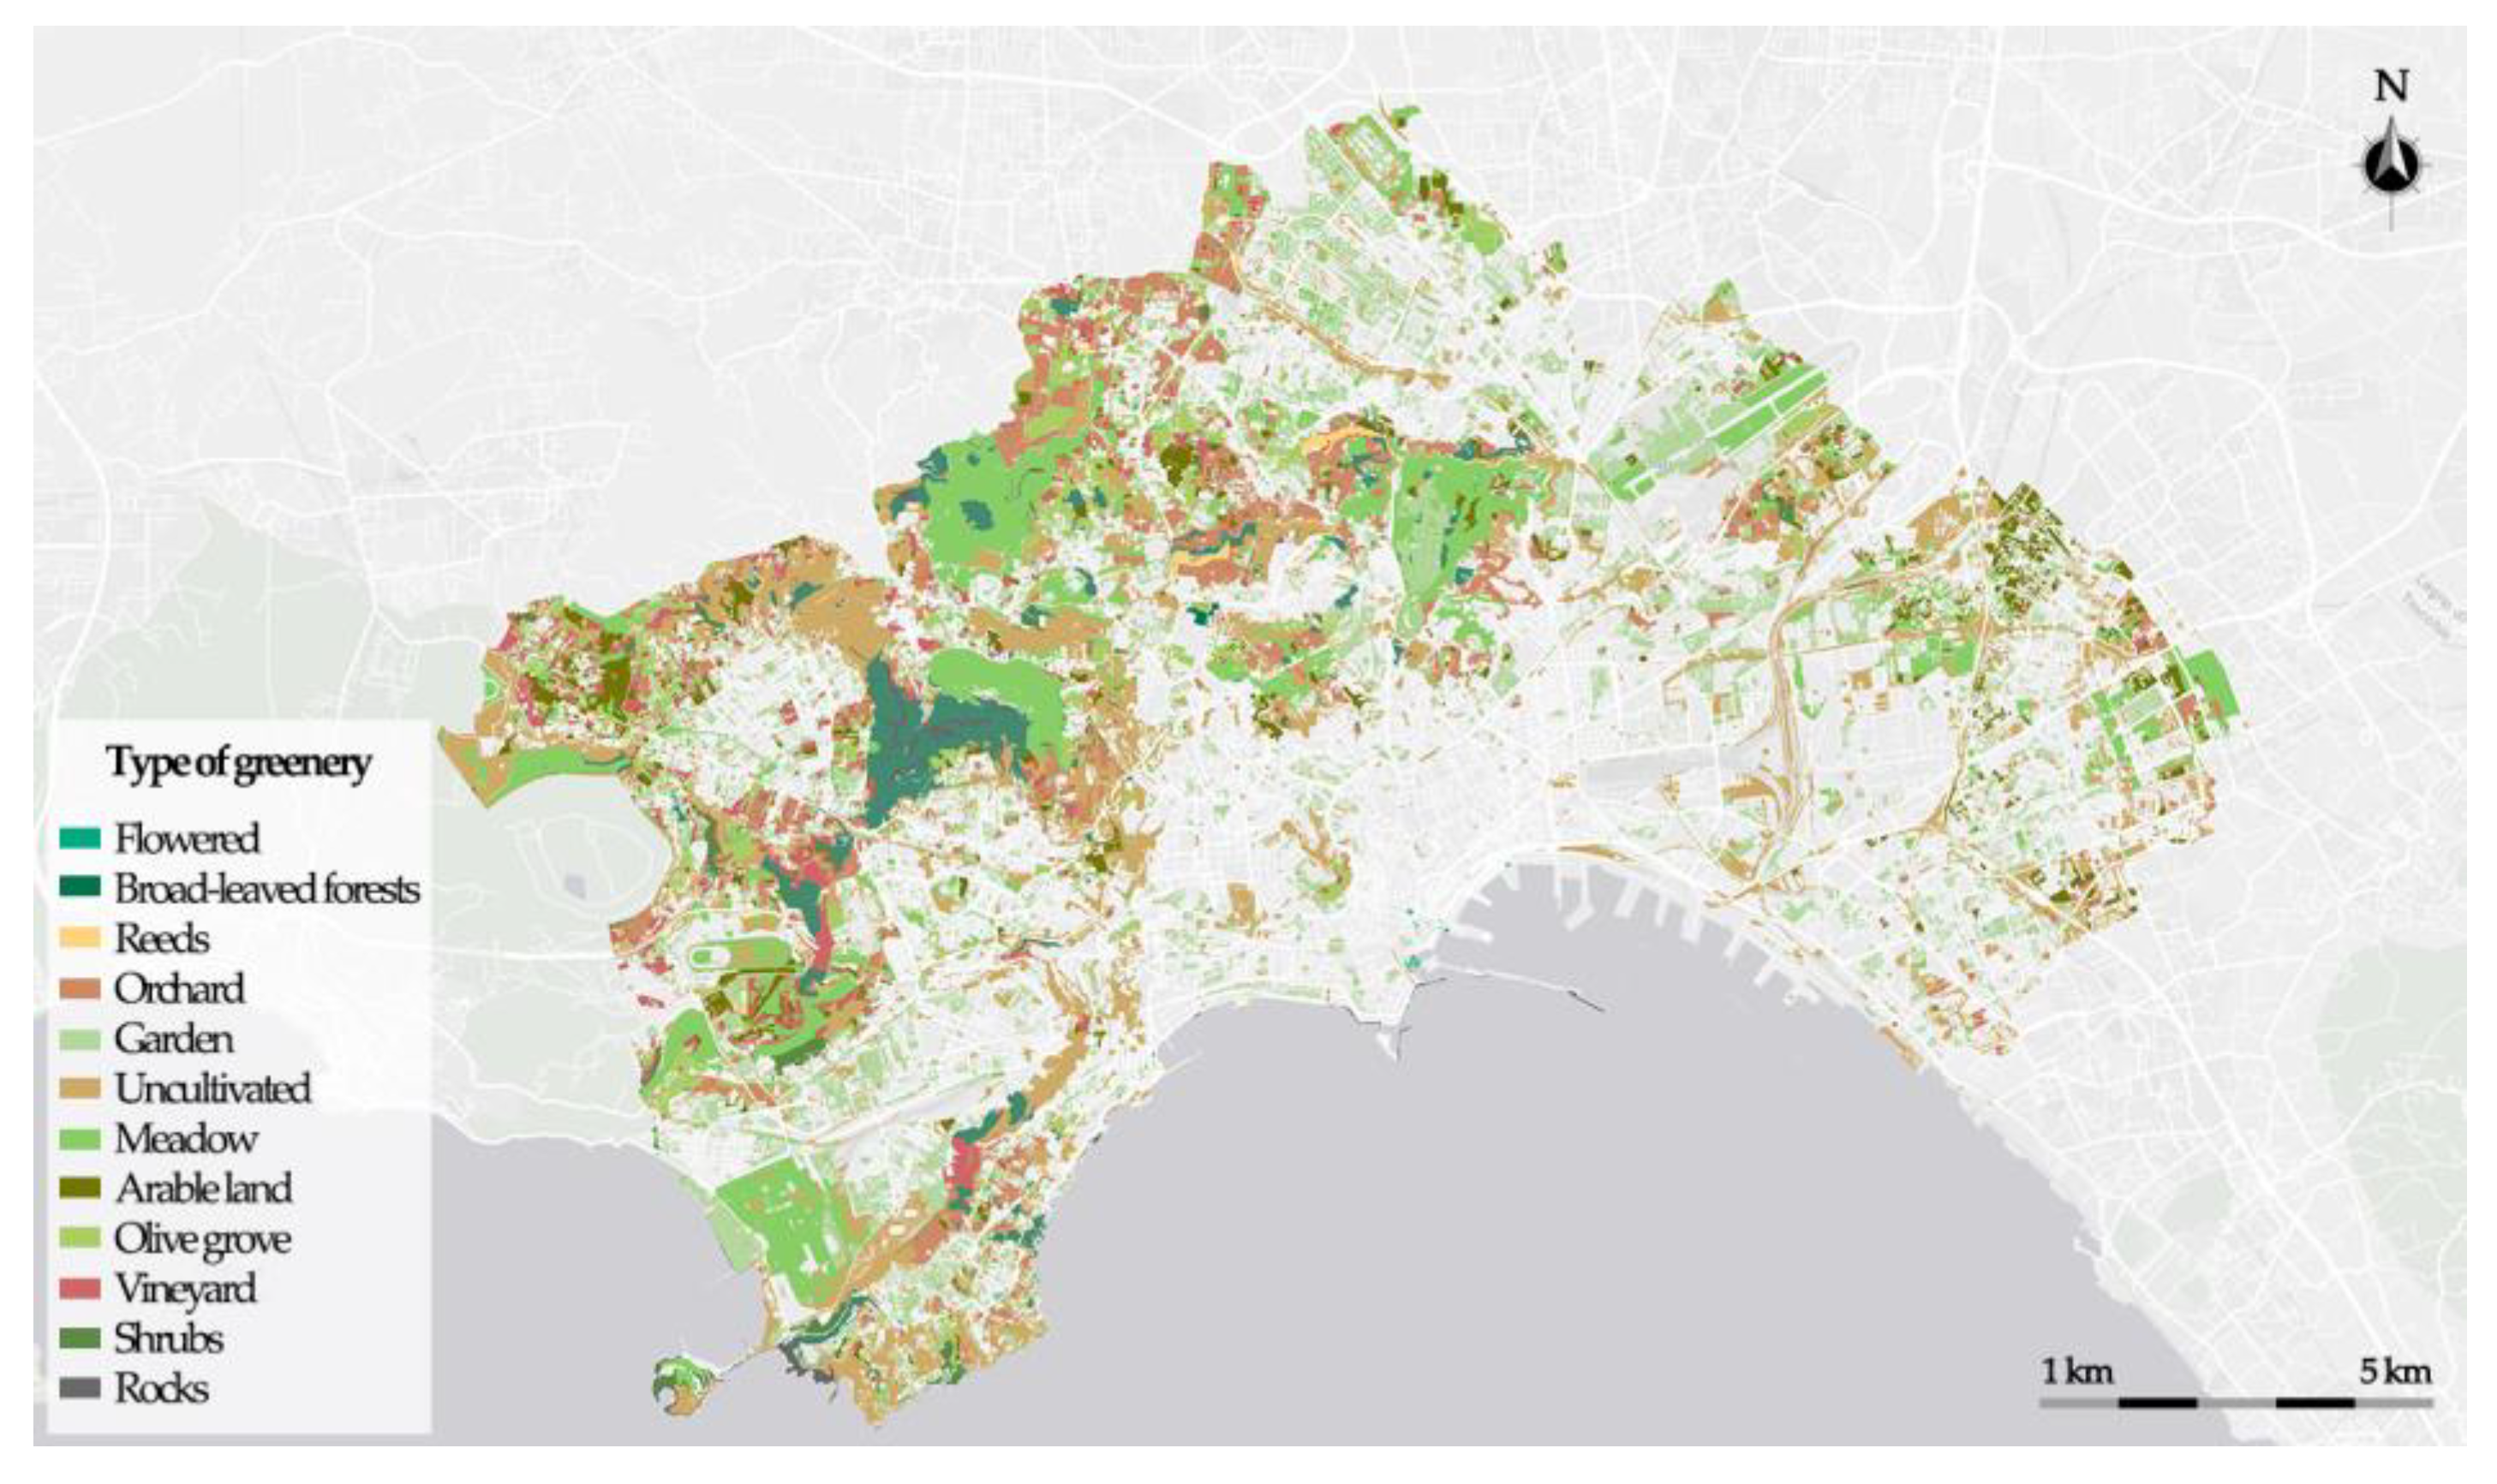
Figure 6.
NDVI index (a); Types of greenery classified by NDVI (b).
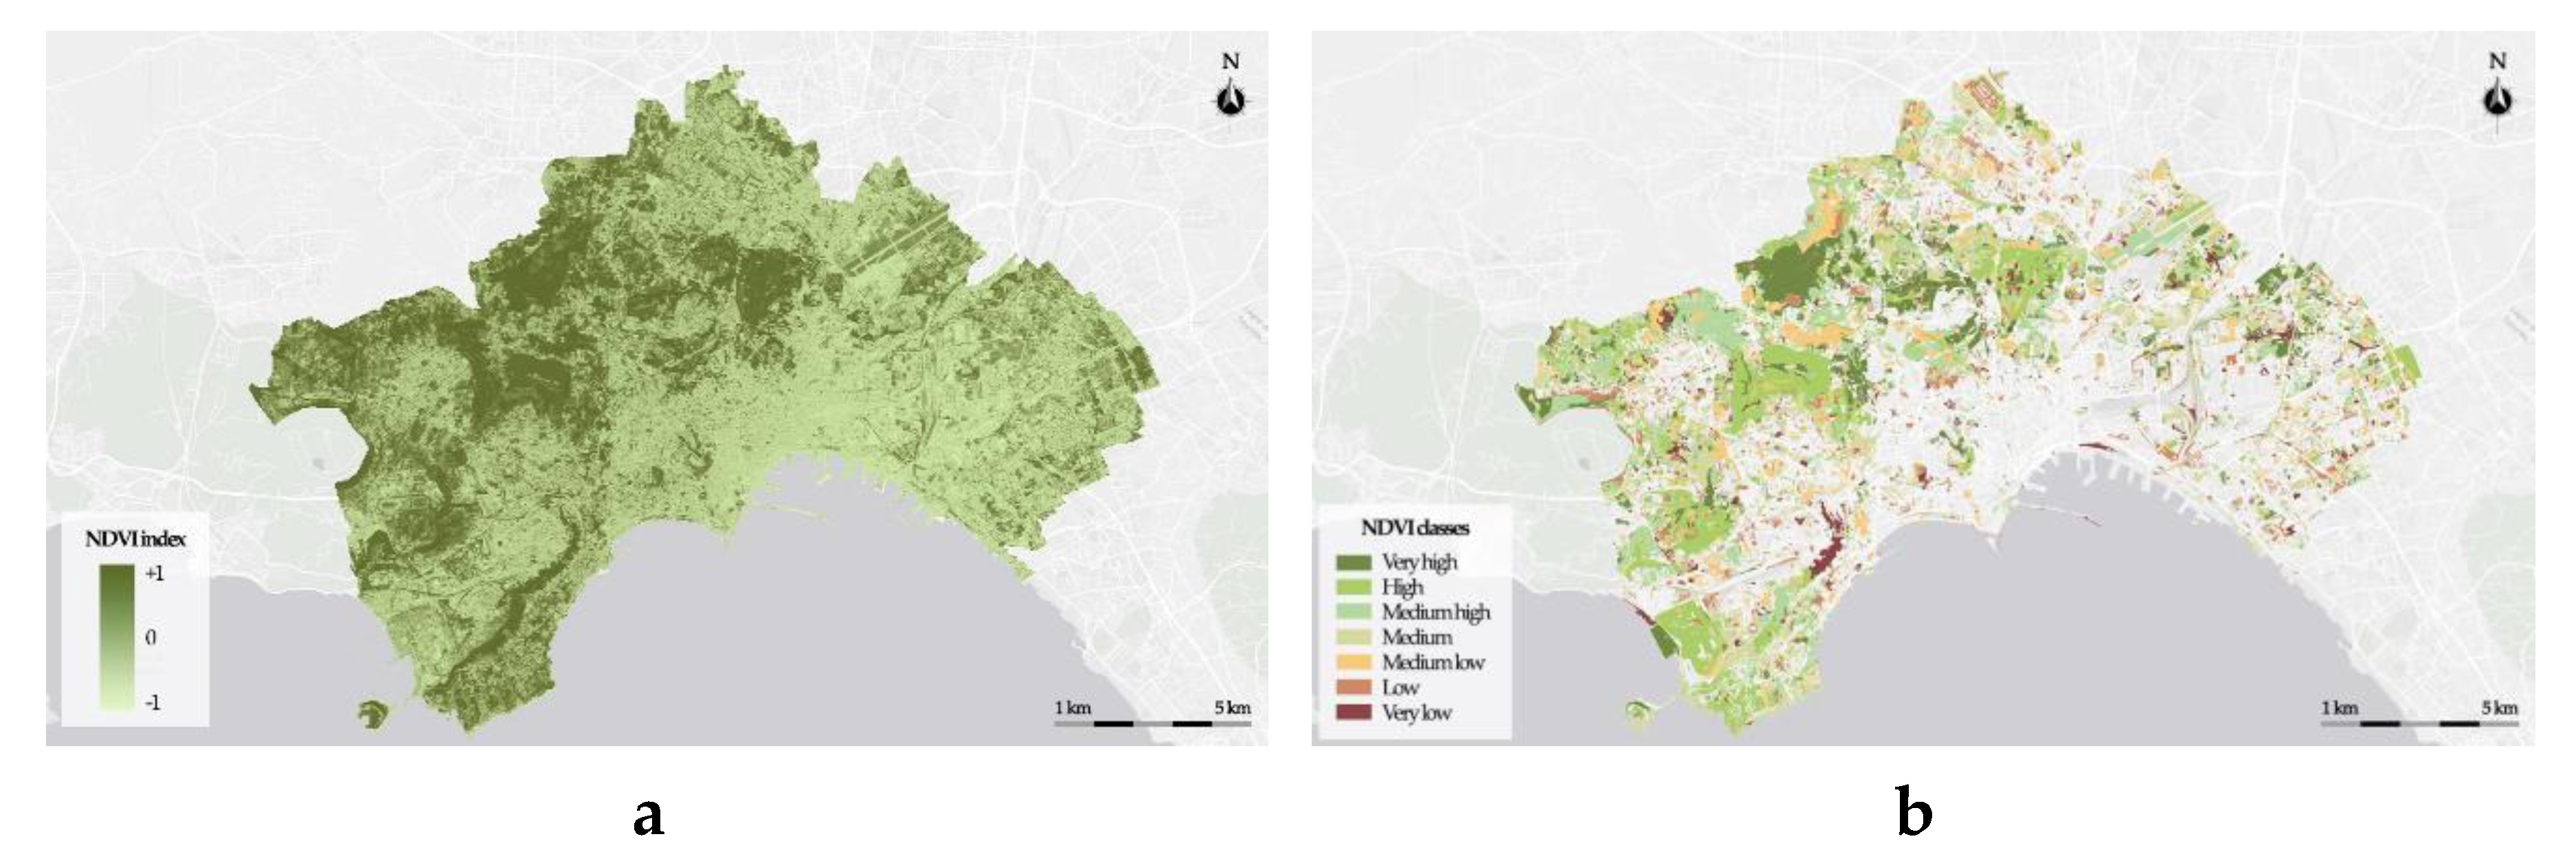
Figure 7.
NDMI index (a); Types of greenery classified by NDMI (b).
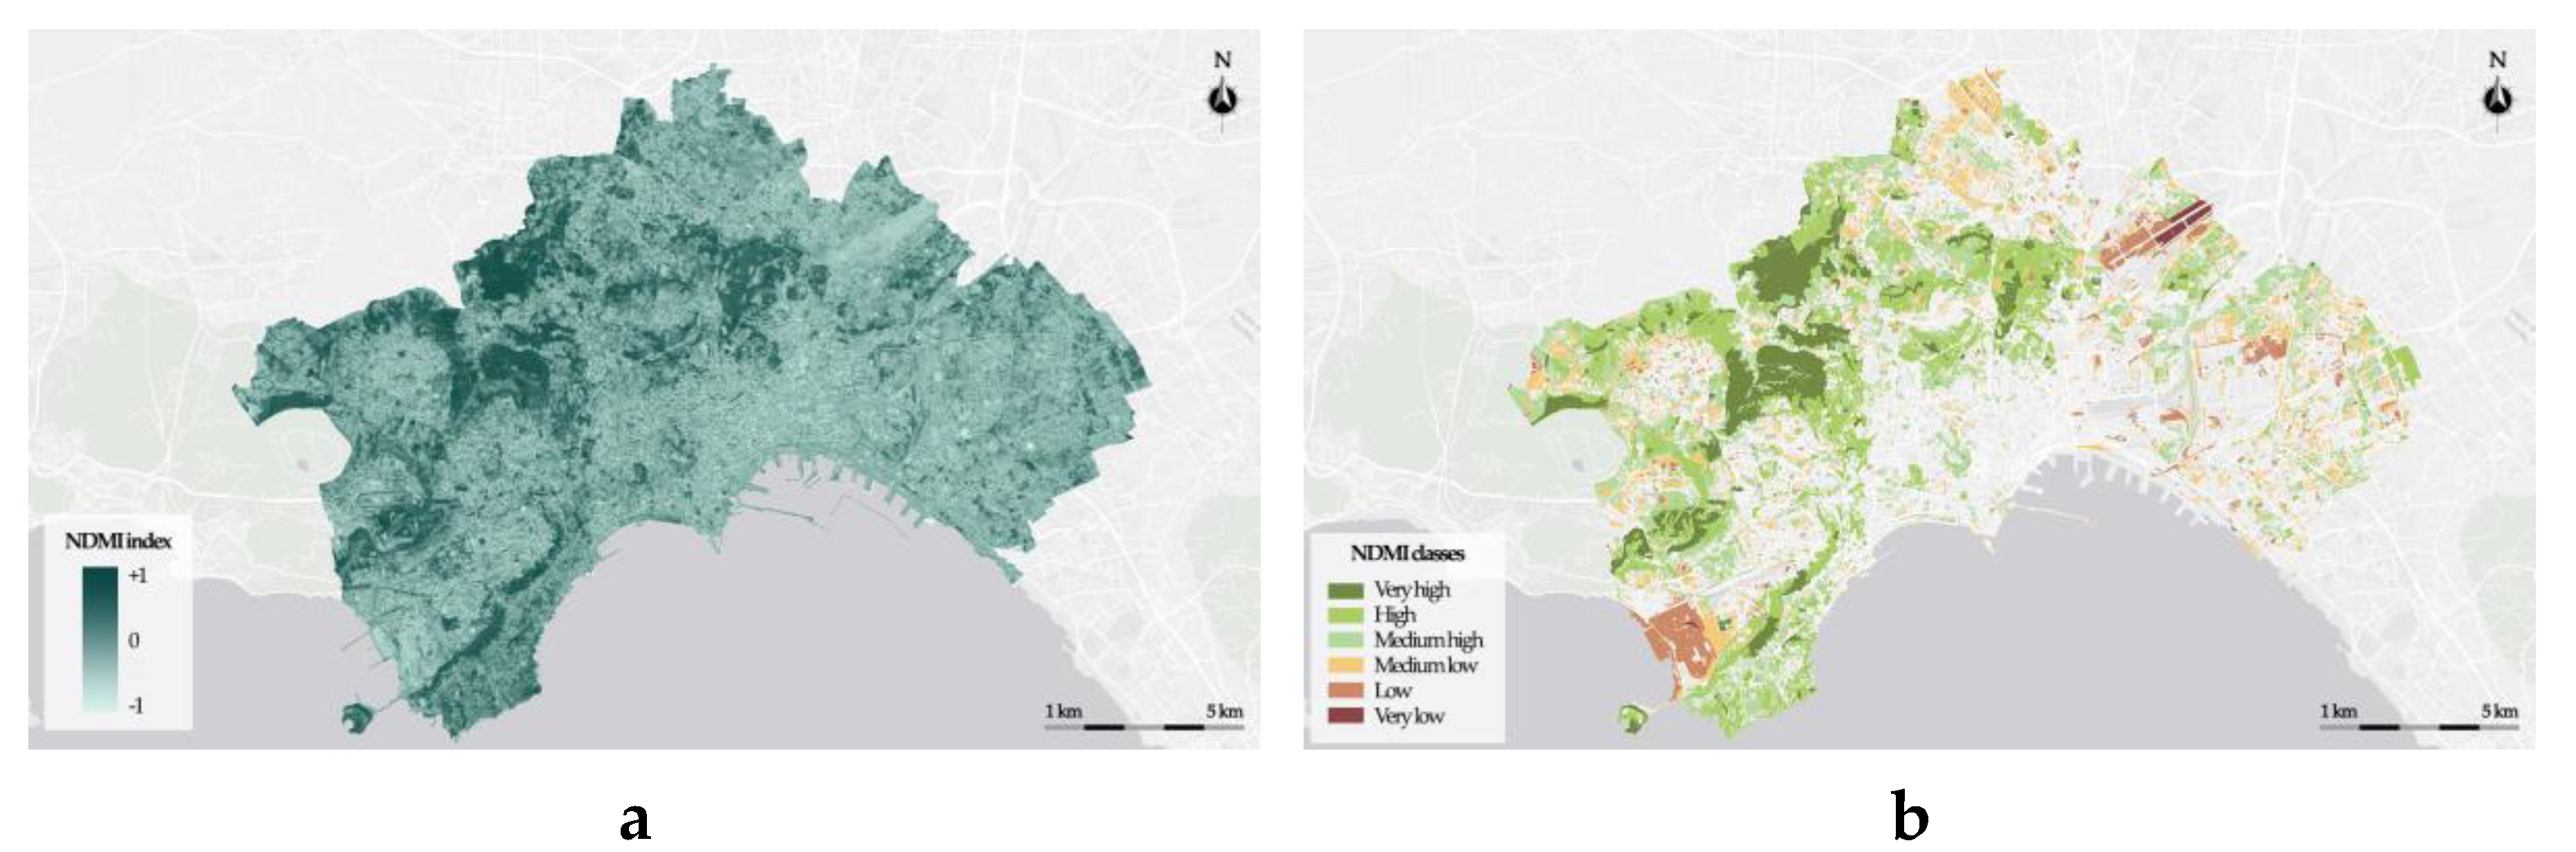
Figure 8.
LST Index (a); Types of greenery classified by LST (b).
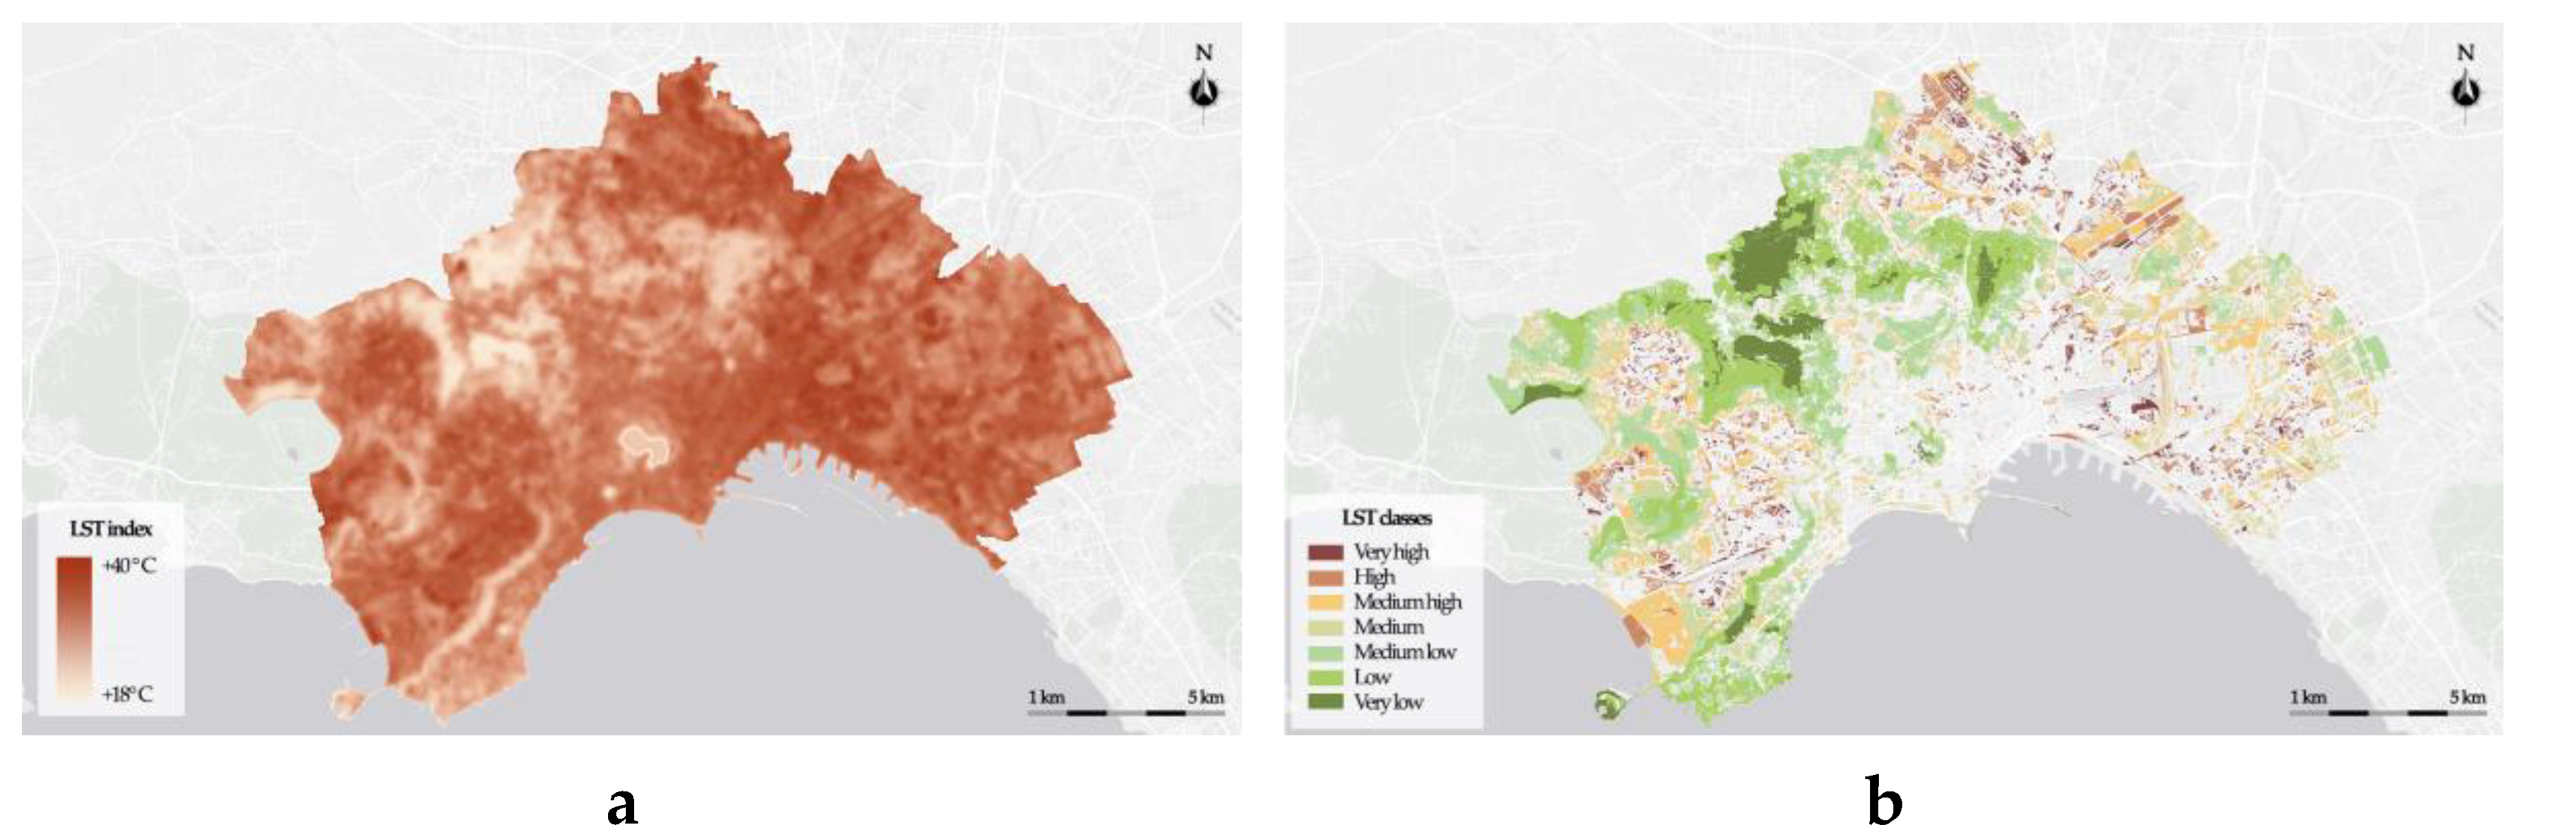
Figure 9.
Frequency distributions of predominantly broad-leveled forests for NDVI (a), NDMI (b) and LST (c) classes.
Figure 9.
Frequency distributions of predominantly broad-leveled forests for NDVI (a), NDMI (b) and LST (c) classes.
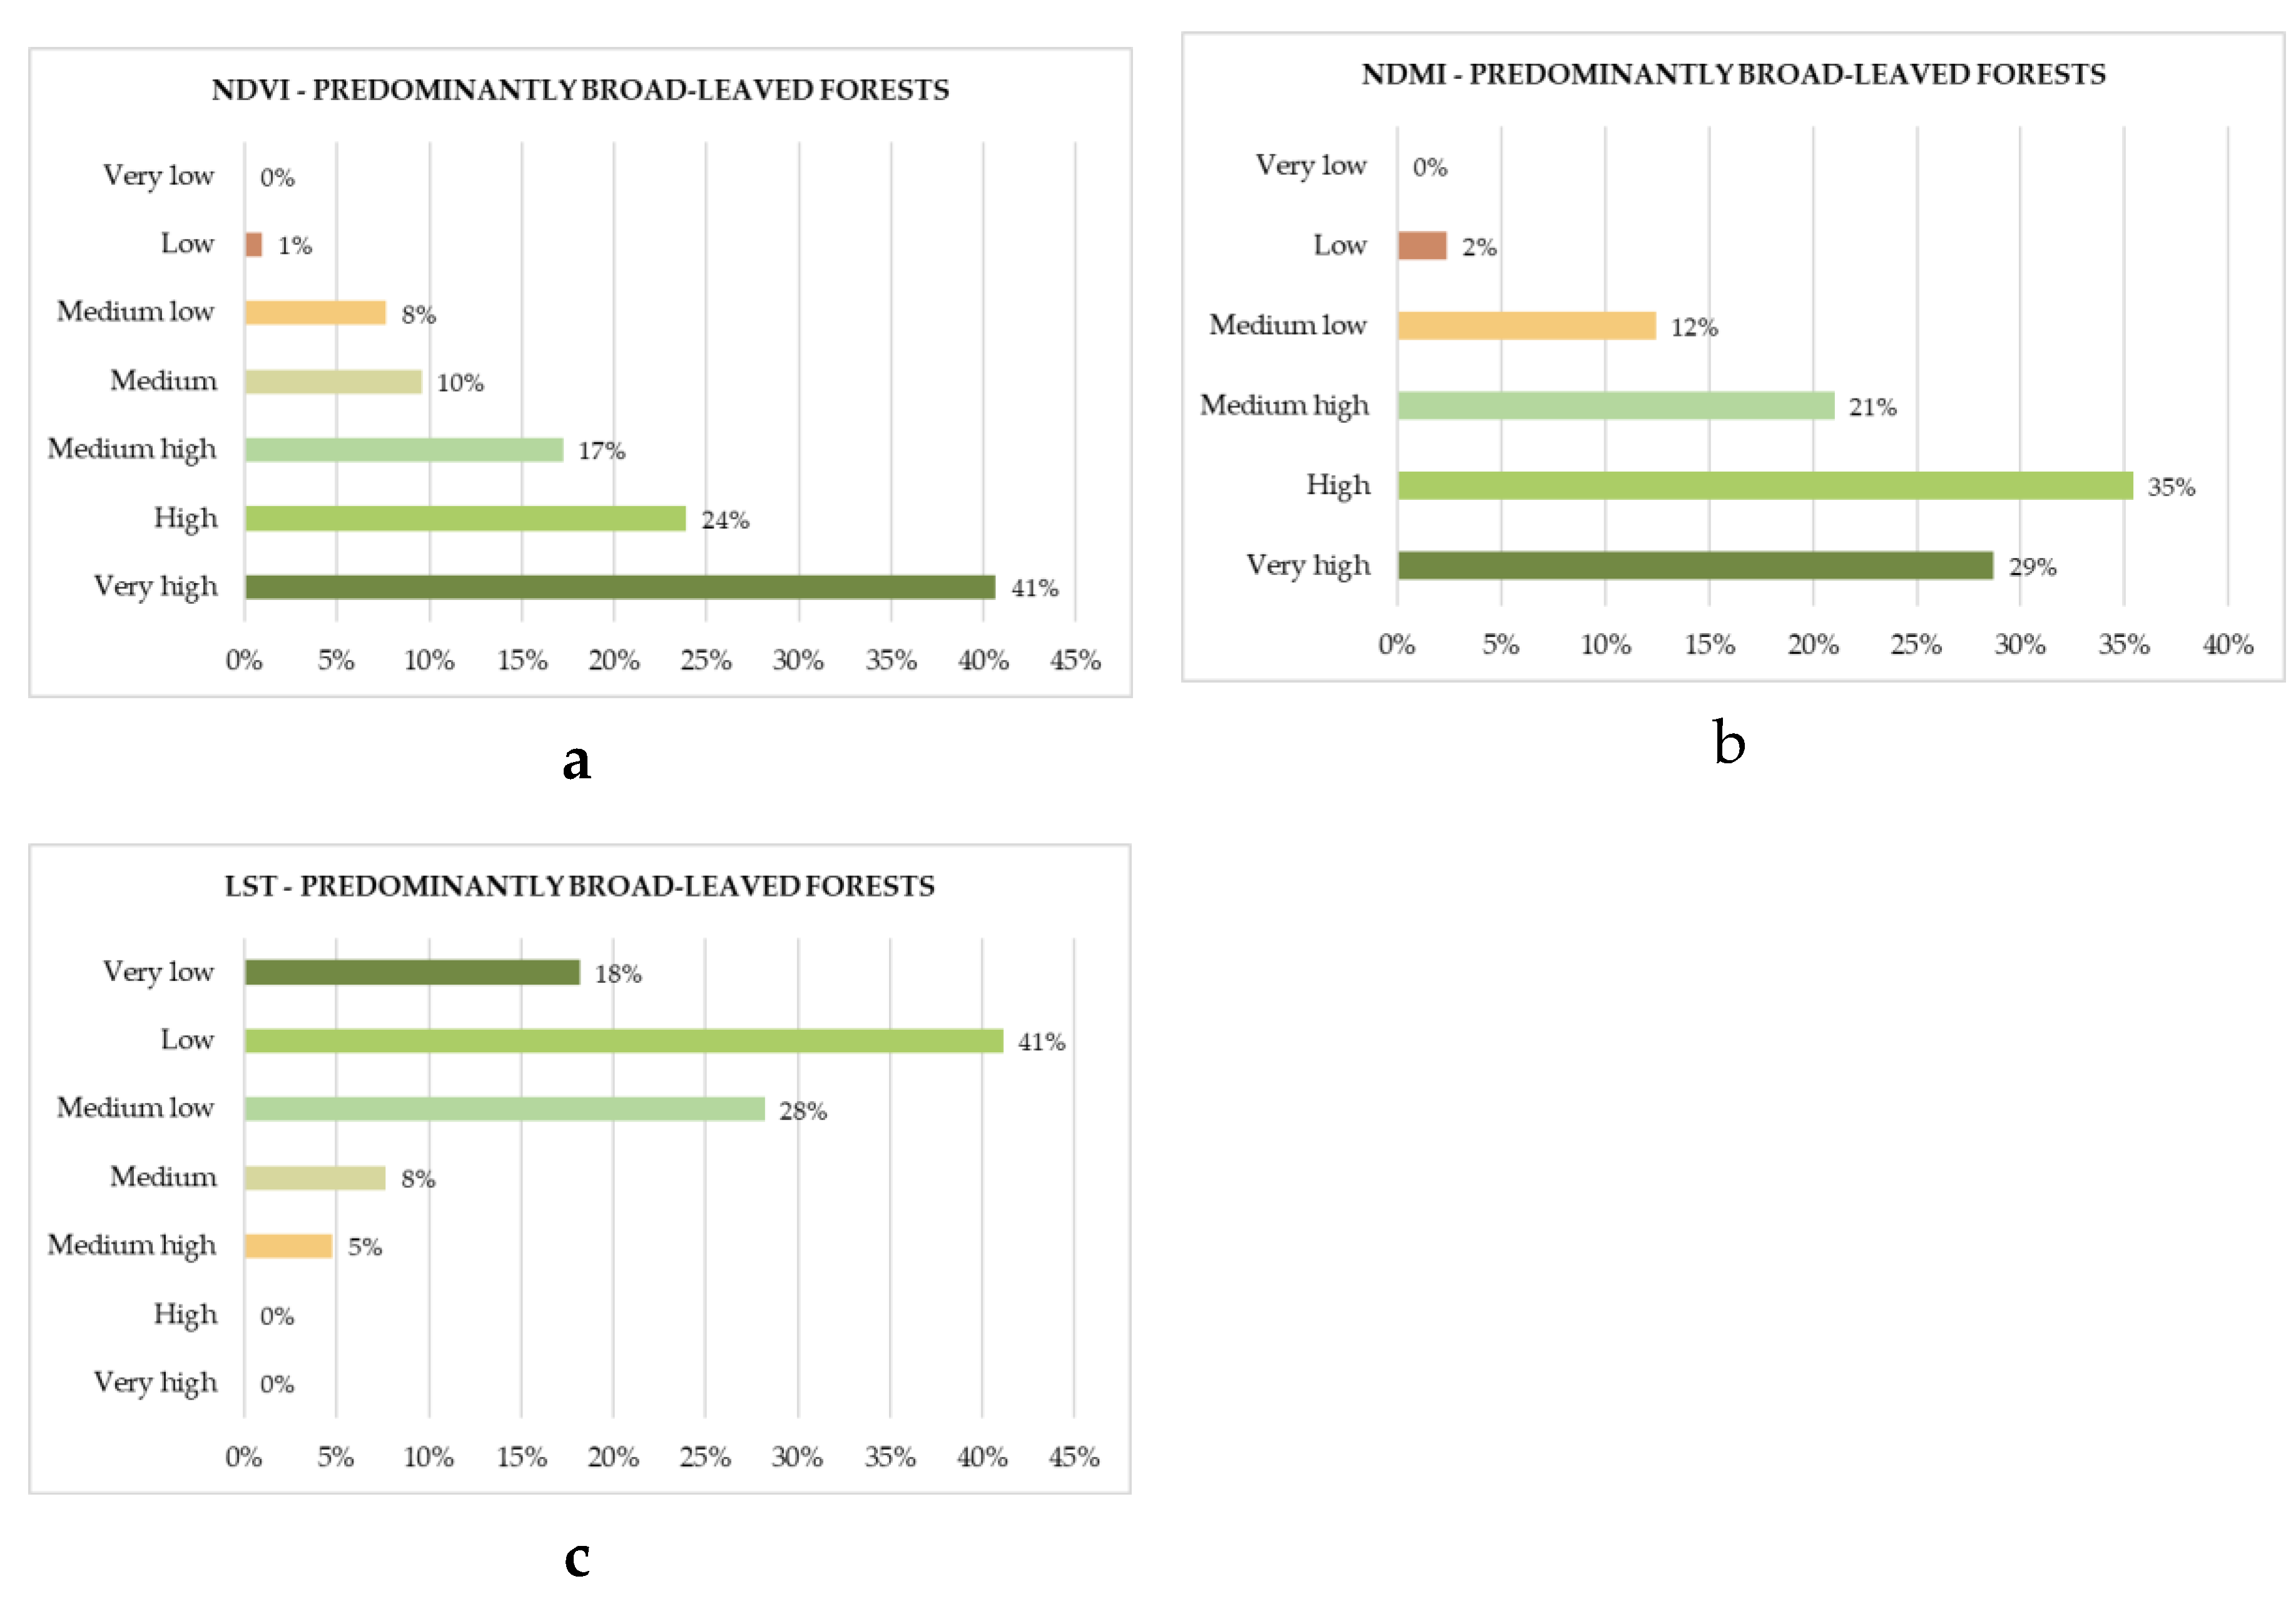
Figure 10.
Frequency distributions of olive groves for NDVI (a), NDMI (b) and LST (c) classes.
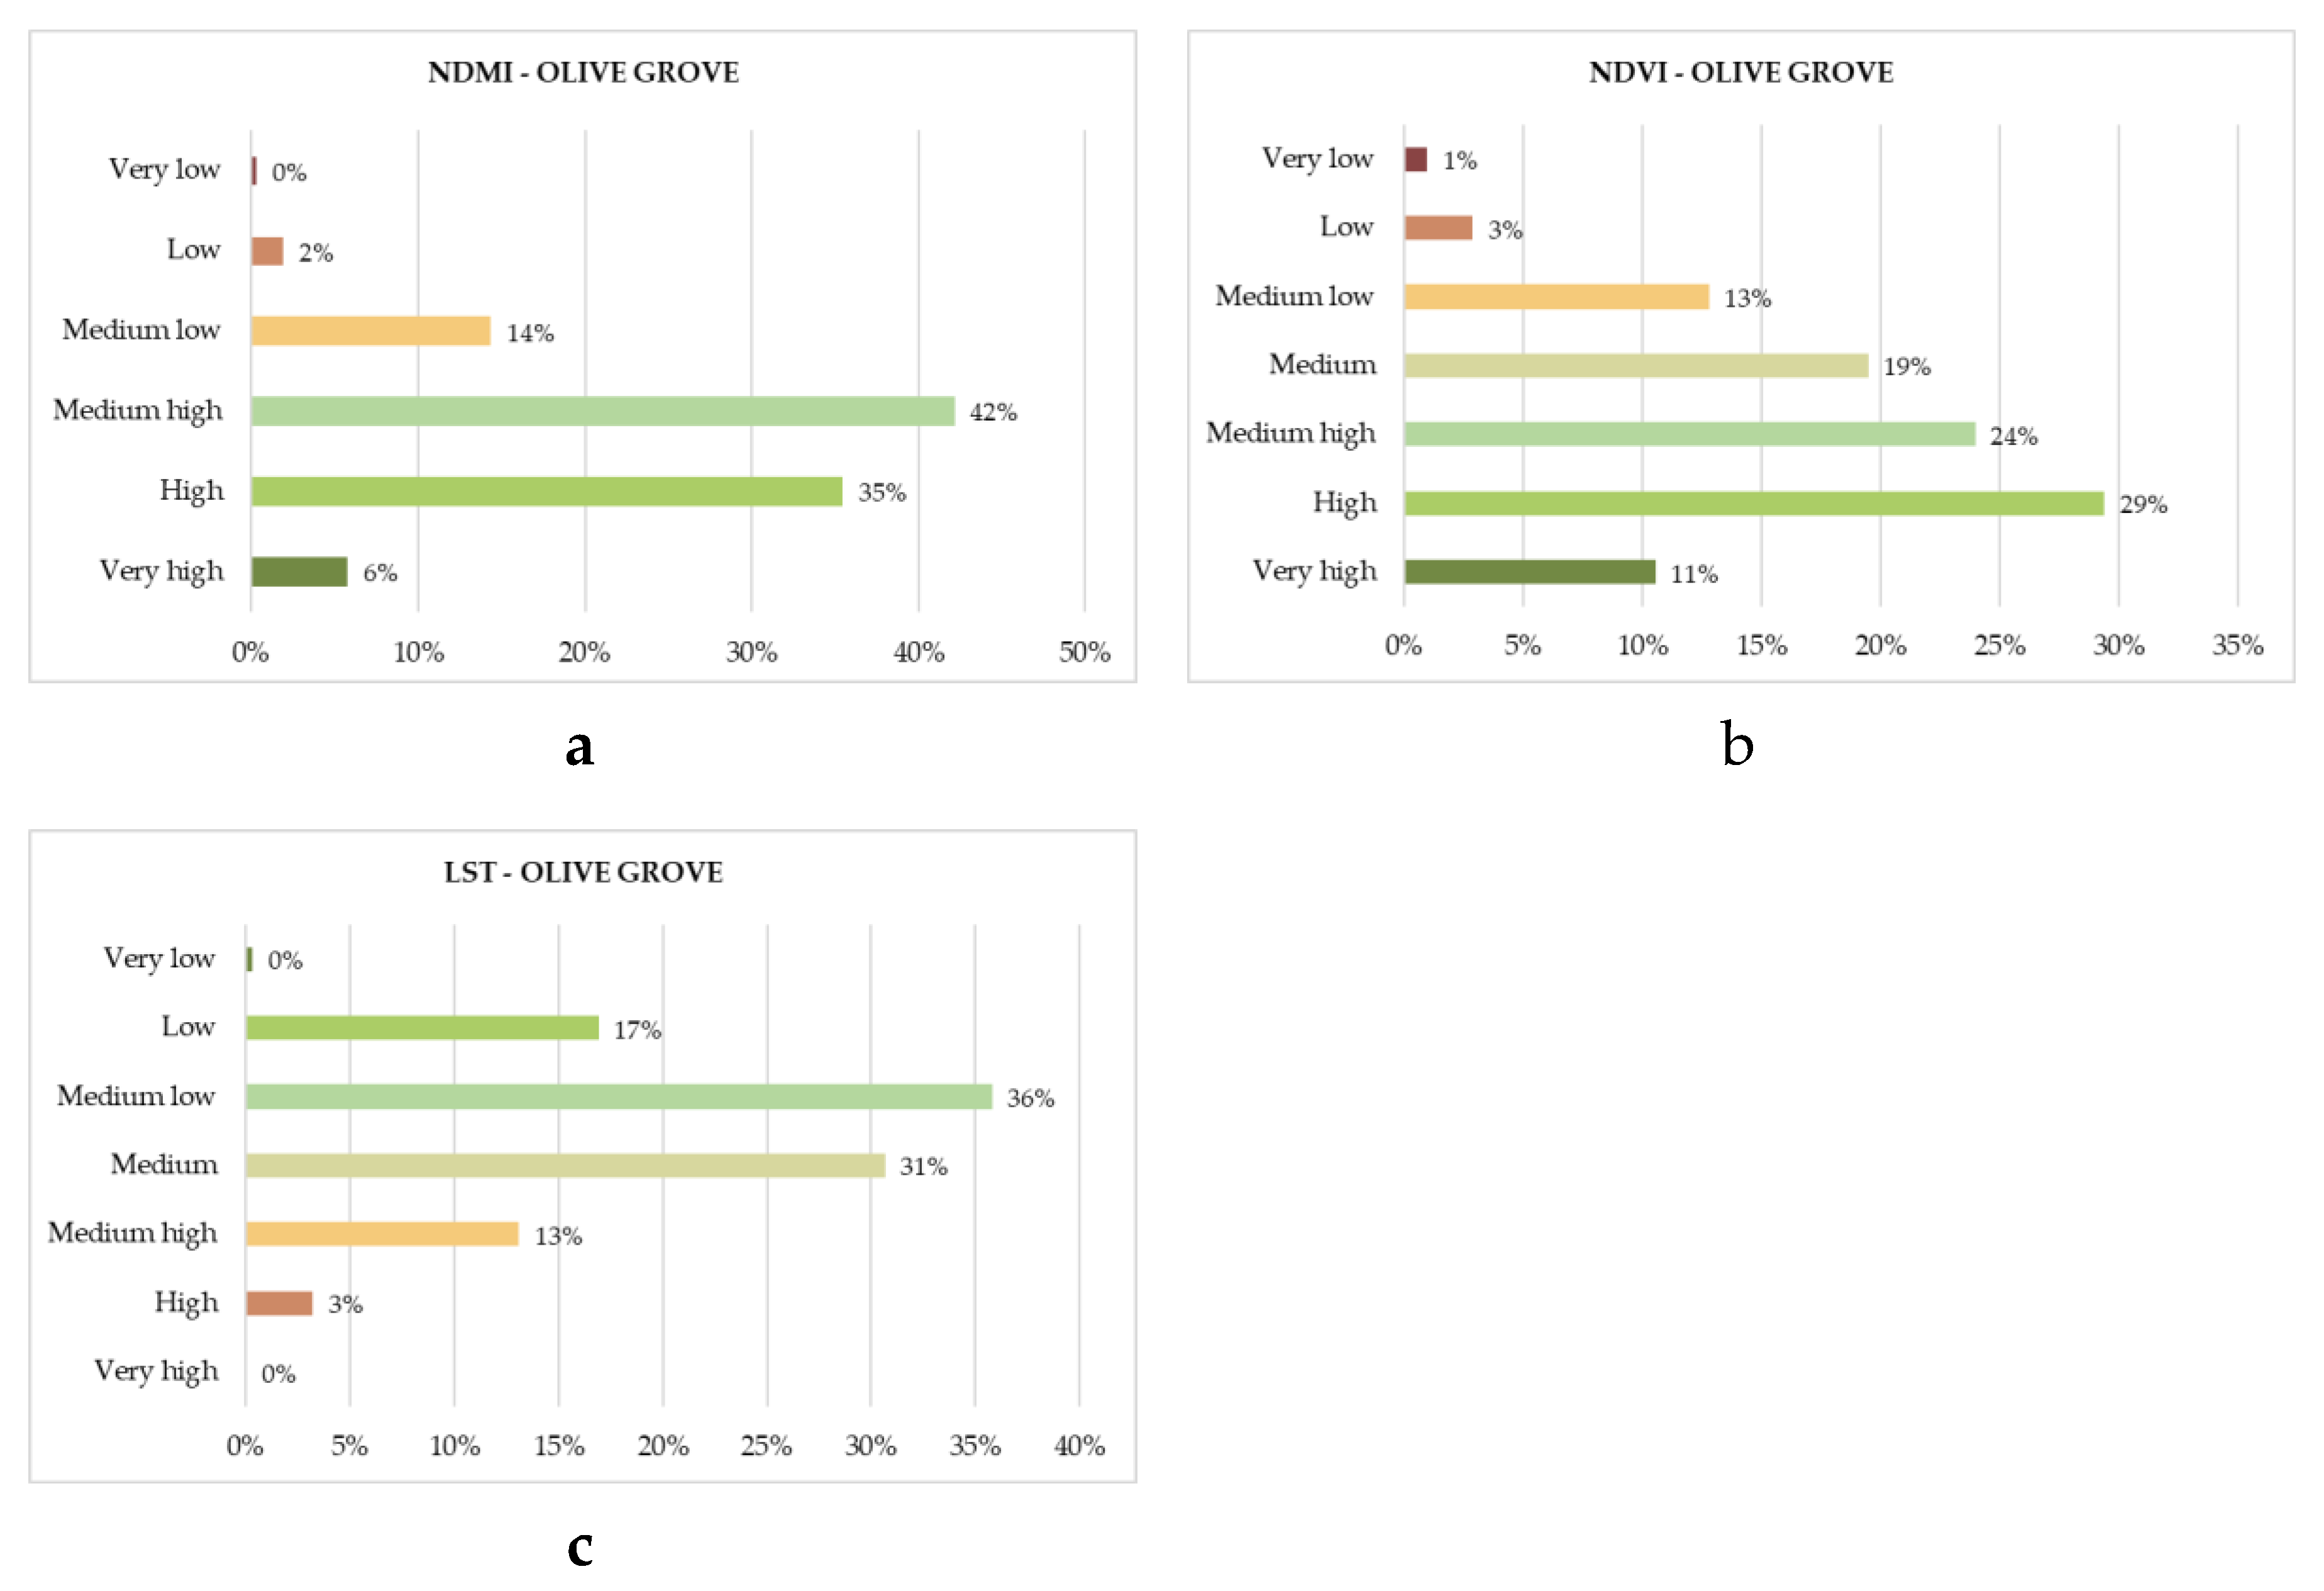
Figure 11.
Frequency distributions of uncultivated areas for NDVI (a), NDMI (b) and LST (c) classes.
Figure 11.
Frequency distributions of uncultivated areas for NDVI (a), NDMI (b) and LST (c) classes.
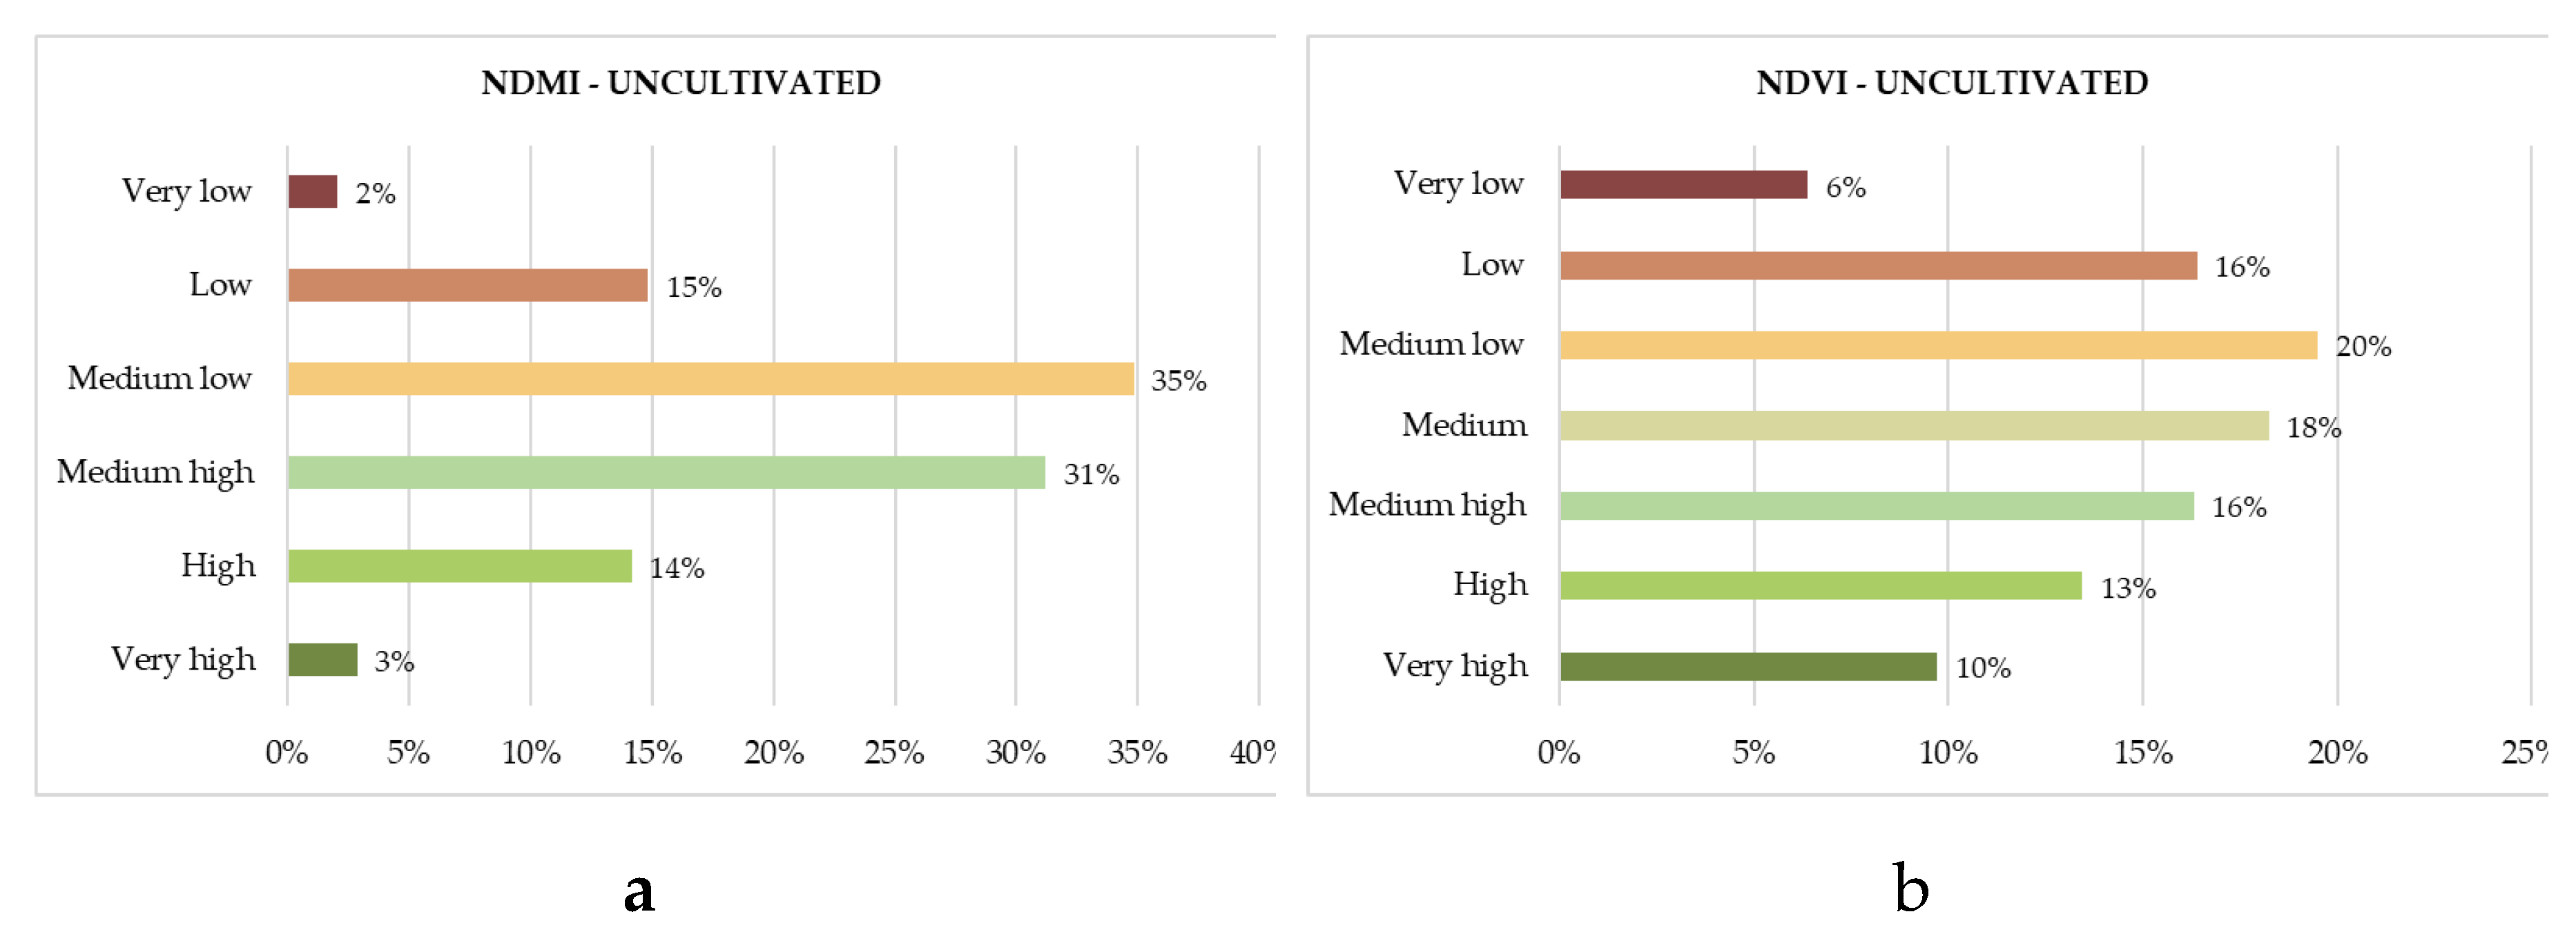
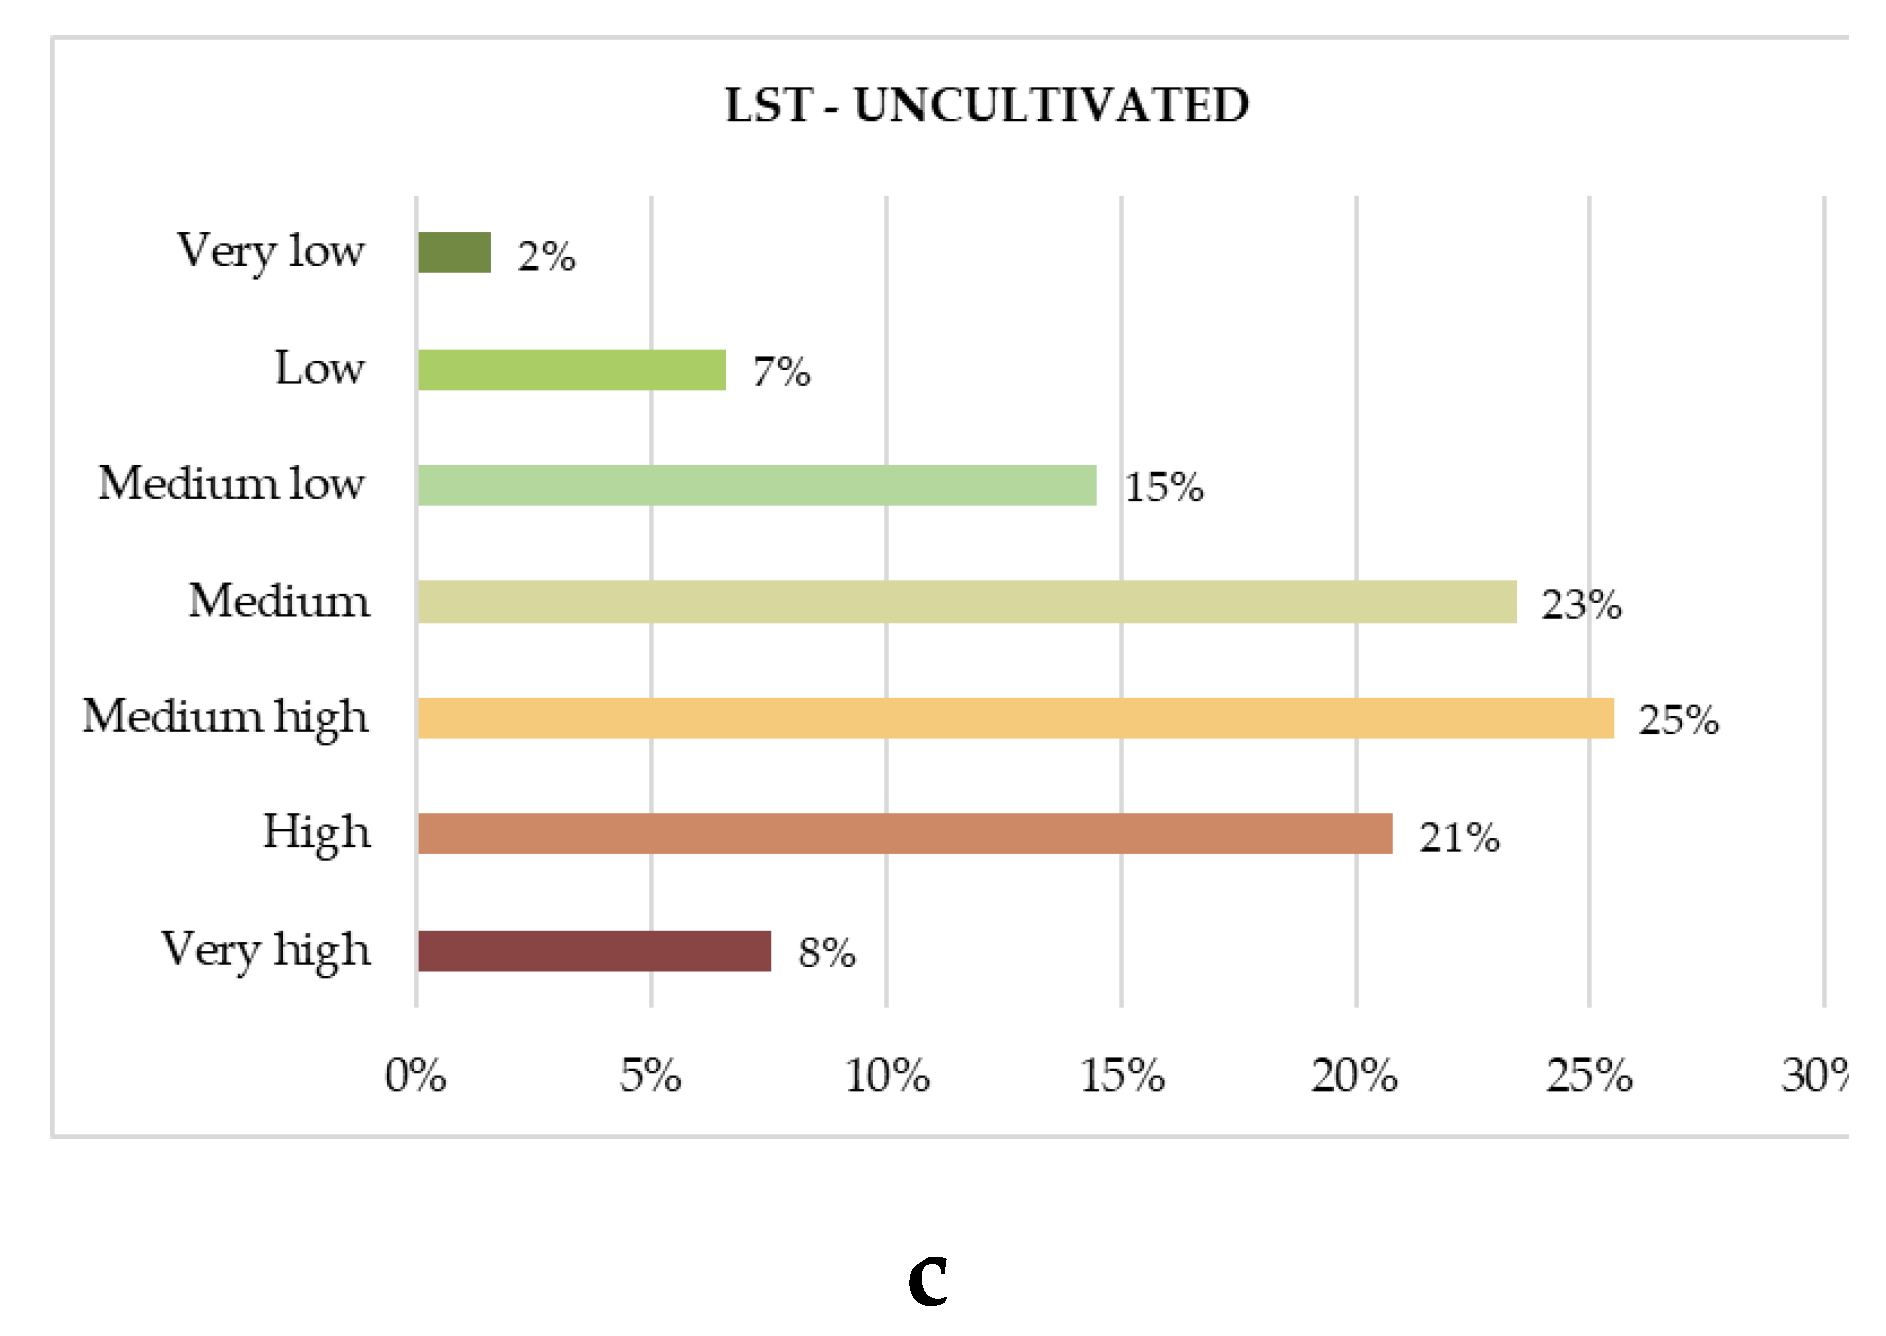

Table 1.
Example of pwsartitioning of NDMI in six thematic class.
| Thematic class | Average | Standard deviation |
|---|---|---|
| Very low | -0.48 | 0.06 |
| Low | -0.33 | 0.08 |
| Medium low | -0.11 | 0.08 |
| Medium high | 0.07 | 0.09 |
| High | 0.19 | 0.06 |
| Very high | 0.34 | 0.05 |
Table 2.
Example of frequency of vineyards distributed in the six NDMI classes.
| Thematic class | Frequency | Mean membership degree |
|---|---|---|
| Very low | 1 | 0.72 |
| Low | 16 | 0.65 |
| Medium low | 101 | 0.57 |
| Medium high | 192 | 0.57 |
| High | 161 | 0.53 |
| Very high | 34 | 0.60 |
Table 3.
Satellite and spatial resolution of the three indices acquired on July 15, 2023
| Index | Satellite/Bands | Resolution |
|---|---|---|
| NDVI | RapidEye bands RED and NIR | 7m x 7m |
| NDMI | Sentinel-2 bands B08 and B11 | 14.8m x 14.8m |
| LST | Landsat band 10 | 30m x 30m |
Table 4.
Types of urban green areas extracted from the topographic database.
| Type of greenery | Number of polygons |
|---|---|
| Flowered | 142 |
| Predominantly broad-leaved forests | 209 |
| Reeds | 29 |
| Orchard | 532 |
| Garden | 4247 |
| Uncultivated | 4404 |
| Meadow | 611 |
| Arable land | 784 |
| Olive grove | 313 |
| Vineyard | 505 |
| Shrubs | 40 |
| Rocks | 46 |
Table 4.
Label, mean and standard deviation of the classes in which are partitioned the domains of NDVI, NDMI and LST.
Table 4.
Label, mean and standard deviation of the classes in which are partitioned the domains of NDVI, NDMI and LST.
| Index | Label | Mean | Standard deviation |
|---|---|---|---|
| NDVI | Very low | 0.15 | 0.04 |
| Low | 0.25 | 0.03 | |
| Medium low | 0.35 | 0.03 | |
| Medium | 0.47 | 0.04 | |
| Medium high | 0.60 | 0.04 | |
| High | 0.74 | 0.04 | |
| Very high | 0.86 | 0.03 | |
| NDMI | Very low | -0.25 | 0.06 |
| Low | -0.13 | 0.03 | |
| Medium low | -0.03 | 0.03 | |
| Medium high | 0.07 | 0.03 | |
| High | 0.20 | 0.04 | |
| Very high | 0.36 | 0.05 | |
| LST | Very low | 22.09 | 0.83 |
| Low | 24.21 | 0.55 | |
| Medium low | 25.97 | 0.48 | |
| Medium | 27.56 | 0.42 | |
| Medium high | 28.91 | 0.38 | |
| High | 30.24 | 0.39 | |
| Very high | 31.63 | 0.62 |
Table 5.
Frequency distribution of types of urban greenery belonging to the NDVI classes.
| Type of greenery | Class | |||||||
| Very low | Low | Medium low | Medium | Medium high | High | Very high | ||
| Flowered | 11.97% | 17.61% | 14.08% | 20.42% | 21.83% | 13.38% | 0.70% | |
| Predominantly broad-leaved forests | 0.00% | 0.96% | 7.66% | 9.57% | 17.22% | 23.92% | 40.67% | |
| Reeds | 0.00% | 0.00% | 3.45% | 24.14% | 17.24% | 41.38% | 13.79% | |
| Orchard | 2.07% | 4.32% | 13.16% | 20.30% | 24.81% | 21.99% | 13.35% | |
| Garden | 7.28% | 19.00% | 23.00% | 19.73% | 13.85% | 10.03% | 7.11% | |
| Uncultivated | 6.38% | 16.39% | 19.50% | 18.23% | 16.33% | 13.44% | 9.72% | |
| Meadow | 2.78% | 10.31% | 19.31% | 22.91% | 22.09% | 15.06% | 7.53% | |
| Arable land | 3.06% | 7.02% | 15.69% | 20.28% | 19.52% | 18.49% | 15.94% | |
| Olive grove | 0.96% | 2.88% | 12.78% | 19.49% | 23.96% | 29.39% | 10.54% | |
| Vineyard | 0.73% | 2.38% | 10.26% | 18.68% | 23.81% | 24.91% | 19.23% | |
| Shrubs | 0.00% | 0.00% | 12.50% | 12.50% | 32.50% | 27.50% | 15.00% | |
| Rocks | 15.22% | 15.22% | 26.09% | 19.57% | 8.70% | 6.52% | 8.70% | |
Table 6.
Frequency distribution of types of urban greenery belonging to the NDMI classes.
| Type of greenery | Class | ||||||
| Very low | Low | Medium low | Medium high | High | Very high | ||
| Flowered | 0.70% | 4.93% | 33.10% | 42.25% | 17.61% | 1.41% | |
| Predominantly broad-leaved forests | 0.00% | 2.39% | 12.44% | 21.05% | 35.41% | 28.71% | |
| Reeds | 0.00% | 0.00% | 6.90% | 6.90% | 44.83% | 41.38% | |
| Orchard | 0.38% | 4.32% | 13.16% | 37.97% | 36.84% | 7.33% | |
| Garden | 0.82% | 13.40% | 40.24% | 33.60% | 9.65% | 2.28% | |
| Uncultivated | 2.07% | 14.85% | 34.85% | 31.20% | 14.17% | 2.86% | |
| Meadow | 1.15% | 9.49% | 28.97% | 33.88% | 21.28% | 5.24% | |
| Arable land | 0.38% | 8.04% | 24.36% | 38.52% | 22.70% | 5.99% | |
| Olive grove | 0.32% | 1.92% | 14.38% | 42.17% | 35.46% | 5.75% | |
| Vineyard | 0.18% | 3.11% | 21.43% | 43.41% | 27.11% | 4.76% | |
| Shrubs | 0.00% | 0.00% | 5.00% | 20.00% | 57.50% | 17.50% | |
| Rocks | 0.00% | 8.70% | 32.61% | 19.57% | 21.74% | 17.39% | |
Table 7.
Frequency distribution of types of urban greenery belonging to the LST classes.
| Type of greenery | Class | ||||||
| Very low | Low | Medium low | Medium | Medium high | High | Very high | |
| Flowered | 0.70% | 9.86% | 36.62% | 14.79% | 9.15% | 23.94% | 4.93% |
| Predominantly broad-leaved forests | 18.18% | 41.15% | 28.23% | 7.66% | 4.78% | 0.00% | 0.00% |
| Reeds | 17.24% | 37.93% | 31.03% | 6.90% | 6.90% | 0.00% | 0.00% |
| Orchard | 1.69% | 14.29% | 33.46% | 27.63% | 15.98% | 5.83% | 1.13% |
| Garden | 6.89% | 4.08% | 9.58% | 16.54% | 22.60% | 24.38% | 15.93% |
| Uncultivated | 1.59% | 6.61% | 14.51% | 23.43% | 25.50% | 20.80% | 7.56% |
| Meadow | 1.47% | 10.31% | 19.64% | 33.06% | 22.09% | 11.29% | 2.13% |
| Arable land | 2.42% | 13.90% | 26.40% | 34.06% | 17.35% | 5.10% | 0.77% |
| Olive grove | 0.32% | 16.93% | 35.78% | 30.67% | 13.10% | 3.19% | 0.00% |
| Vineyard | 2.01% | 5.86% | 13.37% | 25.64% | 33.15% | 17.22% | 2.75% |
| Shrubs | 12.50% | 27.50% | 40.00% | 15.00% | 5.00% | 0.00% | 0.00% |
| Rocks | 54.35% | 26.09% | 13.04% | 6.52% | 0.00% | 0.00% | 0.00% |
Table 8.
Reliability distribution of types of urban greenery belonging to the NDVI classes.
| Type of greenery | Class | ||||||
| Very low | Low | Medium low | Medium | Medium high | High | Very high | |
| Flowered | 0.864 | 0.798 | 0.748 | 0.643 | 0.642 | 0.768 | 0.655 |
| Predominantly broad-leaved forests | 0.601 | 0.674 | 0.640 | 0.571 | 0.703 | 0.697 | |
| Reeds | 0.572 | 0.769 | 0.708 | 0.671 | 0.679 | ||
| Orchard | 0.768 | 0.731 | 0.662 | 0.638 | 0.655 | 0.689 | 0.684 |
| Garden | 0.703 | 0.727 | 0.676 | 0.639 | 0.655 | 0.647 | 0.659 |
| Uncultivated | 0.727 | 0.694 | 0.670 | 0.633 | 0.645 | 0.649 | 0.712 |
| Meadow | 0.710 | 0.693 | 0.661 | 0.628 | 0.635 | 0.627 | 0.704 |
| Arable land | 0.725 | 0.680 | 0.666 | 0.610 | 0.672 | 0.637 | 0.670 |
| Olive grove | 0.564 | 0.790 | 0.627 | 0.661 | 0.662 | 0.639 | 0.650 |
| Vineyard | 0.610 | 0.766 | 0.680 | 0.685 | 0.681 | 0.649 | 0.704 |
| Shrubs | 0.680 | 0.728 | 0.610 | 0.555 | 0.666 | ||
| Rocks | 0.540 | 0.609 | 0.607 | 0.664 | 0.574 | 0.811 | 0.651 |
Table 9.
Reliability distribution of types of urban greenery belonging to the NDMI classes.
| Type of greenery | Class | ||||||
| Very low | Low | Medium low | Medium | Medium high | High | Very high | |
| Flowered | 0.715 | 0.667 | 0.643 | 0.654 | 0.659 | ||
| Predominantly broad-leaved forests | 0.633 | 0.587 | 0.602 | 0.725 | |||
| Reeds | 0.576 | 0.682 | 0.689 | 0.705 | 0.683 | 0.634 | 0.576 |
| Orchard | 0.660 | 0.684 | 0.698 | 0.679 | 0.617 | 0.618 | 0.660 |
| Garden | 0.687 | 0.700 | 0.692 | 0.675 | 0.653 | 0.644 | 0.687 |
| Uncultivated | 0.574 | 0.733 | 0.728 | 0.665 | 0.655 | 0.650 | 0.574 |
| Meadow | 0.528 | 0.596 | 0.663 | 0.670 | 0.626 | 0.642 | 0.528 |
| Arable land | 0.991 | 0.688 | 0.684 | 0.694 | 0.677 | 0.677 | 0.991 |
| Olive grove | 0.759 | 0.608 | 0.677 | 0.697 | 0.681 | 0.656 | 0.759 |
| Vineyard | 0.678 | 0.672 | 0.718 | 0.622 | |||
| Shrubs | 0.574 | 0.733 | 0.728 | 0.665 | 0.655 | 0.650 | 0.574 |
| Rocks | 0.715 | 0.667 | 0.643 | 0.654 | 0.659 | ||
Table 10.
Reliability distribution of types of urban greenery belonging to the LST classes.
| Type of greenery | Class | ||||||
| Very low | Low | Medium low | Medium | Medium high | High | Very high | |
| Flowered | 0.575 | 0.559 | 0.575 | 0.639 | 0.554 | 0.665 | 0.685 |
| Predominantly broad-leaved forests | 0.725 | 0.685 | 0.633 | 0.677 | |||
| Reeds | 0.644 | 0.692 | 0.551 | 0.848 | |||
| Orchard | 0.544 | 0.673 | 0.660 | 0.715 | 0.640 | 0.683 | 0.810 |
| Garden | 0.658 | 0.650 | 0.680 | 0.666 | 0.664 | 0.706 | 0.699 |
| Uncultivated | 0.620 | 0.652 | 0.663 | 0.685 | 0.670 | 0.692 | 0.721 |
| Meadow | 0.600 | 0.585 | 0.634 | 0.693 | 0.663 | 0.606 | 0.645 |
| Arable land | 0.622 | 0.719 | 0.653 | 0.702 | 0.656 | 0.757 | 0.877 |
| Olive grove | 0.855 | 0.699 | 0.608 | 0.699 | 0.685 | 0.650 | |
| Vineyard | 0.581 | 0.692 | 0.659 | 0.706 | 0.699 | 0.640 | 0.752 |
| Shrubs | 0.630 | 0.707 | 0.730 | 0.846 | 0.670 | 0.685 | |
| Rocks | 0.638 | 0.710 | 0.638 | 0.511 | |||
Disclaimer/Publisher’s Note: The statements, opinions and data contained in all publications are solely those of the individual author(s) and contributor(s) and not of MDPI and/or the editor(s). MDPI and/or the editor(s) disclaim responsibility for any injury to people or property resulting from any ideas, methods, instructions or products referred to in the content. |
© 2024 by the authors. Licensee MDPI, Basel, Switzerland. This article is an open access article distributed under the terms and conditions of the Creative Commons Attribution (CC BY) license (http://creativecommons.org/licenses/by/4.0/).
Copyright: This open access article is published under a Creative Commons CC BY 4.0 license, which permit the free download, distribution, and reuse, provided that the author and preprint are cited in any reuse.


