Submitted:
11 July 2024
Posted:
12 July 2024
You are already at the latest version
Abstract
The purpose of this study is to explore the effect of Environment, Social, and Governance (ESG) scores on Return on Assets (ROA), Risk-Adjusted Return on Capital (RAROC), and Tobin's Q on firm performance. This study used 37 non-financial companies listed on the IDX between 2018 and 2022 in Indonesia companies. Linear and nonlinear panel data regression methods were used on the ESG score and its pillars, resulting in eight different models. The study found a U-shaped impact of ESG scores and social and environmental pillars on ROA. There is a positive linear relationship between ESG scores and the environmental and governance pillars with RAROC, while the social pillar shows an inverted U-shaped effect. However, ESG and its environmental and social pillars have a negative linear relationship with Tobin's Q. The findings suggest the need to manage ESG initiatives strategically, aligning them with financial objectives and awareness of how ESG factors relate to profitability.
Keywords:
environment
; social
; and governance (ESG)
; firm performance
; return on assets (ROA)
; risk-adjusted return on capital (RAROC)
; tobin's Q
1. Introduction
Rapid changes in global trends and increasingly competitive markets are putting organizations under unparalleled pressure not just to expand but also to maintain their success moving forward. The company’s sustainability has received much attention in the past few years as companies, investors, and consumers have shifted their focus on the growing importance of corporate sustainability issues (Ameer & Othman, 2012). Companies must broaden their focus beyond narrow, short-term financial goals and embrace economic, environmental and social sustainability. Evolving a business strategy of “doing well by doing good” and converting the company into an accountable organization that cares about environmental, social, and governance (ESG) factors are a necessity, not just an option, for future market leadership (Cherney & Blair, 2015).
Company sustainability in the context of ESG/corporate social responsibility (CSR) can have positive or negative impacts on firm performance. Several theoretical studies focusing on the relationship between ESG and firm performance suggest that CSR can make a firm profitable (Benabou & Tirole, 2010), as it can be seen as an investment that allows firm to benefit from higher profit margin (Albuquerque et al., 2019). In the past decades, some meta-analyses demonstrate that the association that exists between ESG and company performance tends to be positive (Alshehhi et al., 2018; Friede et al., 2015; Whelan et al., 2015), although they suggest that there may be country-specific factors or a nonlinear relationship between ESG and firm performance.
Research on the topic of company sustainability and firm performance in developing economies is much lesser than in developed economies, implying that more study is required in developing economies (Alshehhi et al., 2018). In Indonesia, conducting such research remains challenging, particularly because of insufficient data. In 2017, the Indonesian Financial Services Authority (OJK) just started requiring public firms to produce sustainability reports. Some data providers have routinely published yearly ESG scores for Indonesian public corporations, although the data series are rather short and limited to a small number of companies. The problem is exacerbated by discrepancies in weighting and technique among different ESG data providers.
Consequently, empirical research focusing on the correlation between ESG factors and company financial performance in Indonesia which published in major peer-reviewed publications have been quite limited. (Trisnowati et al., 2022) is one such example, but their research focus differs. Their study examined the influence of ESG score, financial performance, and macroeconomic variables on stock returns in Indonesia during the COVID-19 period, utilizing 26 companies’ data from 2015 to 2020. They found that the debt-to-equity ratio positively affected stock returns, while ESG scores, return on assets, and firm size had no impact. However, this research did not specifically explore the relationship between ESG scores and firm performance.
Bridging the gap in existing literature, this research seeks to determine how ESG scores and their components affect the performance of businesses in Indonesia., drawing on data from 37 non-financial firms spanning from 2018 to 2022. This research is distinct in its analytical approach, encompassing a spectrum of firm performance indicators including ROA, Tobin’s Q, and the less frequently examined: RAROC. It also extends beyond linear analysis to explore nonlinear relationships, specifically probing for a U-shaped relationship between ESG scores and firm performance.
2. Literature Review
This study is conducted based on stakeholder theory, popularized by (Freeman & McVea, 2001), advocates that a company’s success is marked by its ability to meet and align the desires of all stakeholders. In an era where environmental risks and social responsibilities are escalating concerns among investors and the public, corporations are challenged to focus not only on financial profits but also on the management of non-financial risks, such as ESG aspects. This reflects the notion that sustainably operating companies prioritize not solely the interests of shareholders but also weigh broader stakeholder considerations. The theory of the firm also relevant, originating from Adam Smith’s work and refined through Coase’s concept of transaction costs, traditionally this theory aims for profit maximization. In a modern framework, as articulated by (Jensen, 2001), the long-term market value maximization of the firm becomes the primary objective, reflected through the company’s ability to generate cash flows. Hence, firm performance, viewed as the main indicator by shareholders for evaluating management, becomes paramount. Relationship between ESG scores and firm performance as cited by some theoretical studies by (Albuquerque et al., 2019; Baron, 2007; Benabou & Tirole, 2010; Fatemi et al., 2018) implied that greater ESG ratings can increase firm performance.
Gillan et al. (2021) gather research on the connection between ESG/CSR practices and company performance, analyzing the direction of this relationship. One study cited is (Friede et al., 2015) which note that since the 1970s, scholars have begun exploring the potential link between ESG and firm performance. After an extensive review of 2200 scholarly articles, they concluded that the research supports the rationale for investing in ESG initiatives. Interestingly, approximately 90% of the studies reviewed in this analysis show a positive link between ESG practices and the financial outcomes of companies. Likewise, a recent meta-analysis of 132 papers published in reputable academic journals revealed that 78% of them established a positive correlation between sustainability and firm performance (Alshehhi et al., 2018). A more recent meta-analysis conducted by (Whelan et al., 2015) which encompassed over 1000 scholarly articles published from 2015 to 2020, indicated that 58% of the studies discovered a positive association between ESG factors and financial success. Conversely, 8% of the studies identified a negative impact on performance, 13% found no discernible relationship, and 21% reported mixed results.
Giese et al. (2019) argued that ESG factors’ influence on financial risk and performance might be observed through three distinct channels: the cash flow channel, the idiosyncratic risk channel, and the valuation channel. The cash flow pathway backs the notion that firms with higher ESG ratings have typically shown improved profitability, more stable earnings, and improved dividend yields, all while controlling for other financial variables. The idiosyncratic risk channel suggests organizations that possess higher ESG ratings are frequently regarded as more capable in mitigating risks to their entity. Meanwhile, the valuation channel indicates that companies with high ESG ratings have historically experienced lower levels of systematic risk and reduced capital costs, and therefore, higher valuations (Giese et al., 2019; Hassan, 2023).
Numerous individual studies have also explored the specific influence of each ESG pillar on companies’ financial performance. The study conducted by (Aydoğan & Özbay, 2012) utilized a comprehensive dataset to understand the effect of ESG performance on both firm’s value and profitability. The findings indicate a statistically significant and positive correlation between the ESG composite score and firm value. However, no significant relationship was observed between the environmental score and the firms’ value. Meanwhile, a study conducted by (Atan et al., 2018) applied a dataset comprised of 54 enterprises in Malaysia to investigate the influence of the ESG aspect on profitability, company value, and cost of capital. The results suggest that there is no a statistically significant relationship between the individual or combined ESG aspects and companies’ profitability or value. However, the combined ESG score does have a positive and statistically significant effect on a company’s cost of capital. (Kim & Li, 2021) conducted a study to examine the correlation between each ESG pillar and firm financial performance. They found that there is a positive effect of ESG on firm profits, especially for larger firms. The governance pillar has the most significant relationship, especially for firms with weak management control. Moreover, ESG, in general, has a positive influence on credit rating, as the social pillar significantly impacts firms’ credit rating, although the environment pillar unexpectedly has a negative effect. Overall, this study supports ESG integration to maximize value and minimize risk.
Relatively limited studies reported that the connection between ESG factors and firm performance is not always formed in a linear model. Nonlinear relationship may exist (Ersoy et al., 2022; Fuente et al., 2022). In their study, (Ersoy et al., 2022) investigated the connection between ESG factors and firm performance, with a specific focus on the banking industry in the United States from 2016 to 2020. Linear and nonlinear panel regression models were employed to examine the data. This study employs market value as a metric to assess the value of banks and consider the impact of the COVID-19 pandemic. The findings indicate a curvilinear association between market value and both ESG and Social Pillar Score (SPS), characterized by an inverted U-shaped pattern. Moreover, a U-shaped relationship is shown between market value and Environmental Pillar Score (EPS). Furthermore, (Fuente et al., 2022) utilized U.S. corporation data from 2009 to 2018 and found a curvilinear relationship between the two variables. Specifically, this relationship offers novel perspectives on the correlation between ESG performance and companies’ overall value. Hence, this study also proved that the relationship between ESG factors and firm performance did not always have to be in linear form. It can be potentially U-shaped or inverted U-shaped.
Following the theoretical and empirical findings stated previously, this study aims at filling the identified gaps in literature and empirical evidence on the impact of ESG factors on Indonesian firm performance, both in linear and nonlinear relationships. This study examined the relationship between ESG and its pillars on some firms’ financial performance indicators. The hypothesis proposed in this study are:
H1.
The ESG and each of its pillars (E, S, and G) have a linear relationship with ROA, RAROC, and Tobin’s Q.
H2.
The ESG and each of its pillars (E, S, and G) have a nonlinear relationship with ROA, RAROC, and Tobin’s Q.
3. Data Sources and Methods
3.1. Data and Research Variables
This research applies a quantitative approach to explore the relationship between ESG scores and Indonesian companies’ firm financial performance indicators (ROA, RAROC, Tobin’s Q) in 2018-2022. The company selection involved screening all public companies in Indonesia listed in the database, excluding those in the financial sector. The financial sector was omitted due to its distinct business model, necessitating a different ESG measurement approach. After removing entries with incomplete data, only 37 companies remained in the final sample with 5 years of data, and 185 data in total. The companies consisted from nine distinct economic sectors, namely basic materials, consumer cyclical and non-cyclical, energy, healthcare, industrial, infrastructure, and properties and real estate. In retrieving the data from Indonesia’s financial market data, this study uses Refinitiv Eikon to ensure consistency across the sample and observations. Refinitiv’s ESG ratings categorize ESG scores into four A categories. Category A consists of scores that exceed 75, Category B includes scores of 51 to 75, category C includes scores ranging from 26 to 50, and Category D scores involve scores of 25 or lower (Appendix A).
In addition, three types of variables were used in this study: independent, dependent, and control variables. The dependent variables include accounting-based Return on Assets (ROA), Risk-Adjusted Return on Capital (RAROC), and market value-based Tobin’s Q (TQ). Then, the independent variable is ESG score which includes Environmental score (EPS), Social score (SPS), and Governance score (GPS). While control variable consisted of firm size (SIZE), firm debt (LEV), and the presence of financial crises, especially during the COVID-19 pandemic. In detail, the definitions of a variable are listed in Table 1.
In testing the formulated hypotheses, this study used linear and nonlinear panel data regression models that allow the analysis of data collected over time on the same entity, thus controlling for individual heterogeneity and observing dynamics over time. The linear model assumes a constant relationship over time between the dependent and independent variables. In contrast, nonlinear models account for more complex and variable relationships, thus capturing effects that may not be apparent under linear assumptions. As a result, this dual approach improves and understanding of the underlying dynamics of the data. Multiple models are used for each independent variable. The models used are shown in formulas (1) and (2).
Linear model:
Nonlinear model:
where represents the dependent variables (ROA, RAROC, Tobin’s Q), SIZE is transformed to natural logarithm, and is the error term for firm i in period t. Linear and nonlinear panel data regression models were employed for each dependent variable, which brought about a total of 24 different models. In order to analyse the variations occurred during COVID-19, this research adopts a panel data regression model emphasizing individual effects by introducing a dummy variable for COVID-19 in 2020. Considering the limited data periods used in this study, the panel regression only applies for the individual effects not the time effects. The individual effects allow us to control for unobserved heterogeneity specific to each individual, thereby focusing the analysis on time variations within the same entity as the pandemic unfolds.
3. Results
3.1. Descriptive Analysis of Dependent and Independent Variables
The evaluation of company performance through accounting measurements is based on the assumption that the data used is of high quality and reliability. This research uses two accounting metrics, namely ROA and RAROC. RAROC can be used to assess the financial performance and risk management of the company. Meanwhile, market value-based variables are estimated using Tobin’s Q. Tobin’s Q refers to a quantitative measure that represents the ratio between market value and intrinsic value of the company. The descriptive analysis of the dependent variables is shown in Table 2.
Descriptive analysis of the dependent variables from 2018 to 2022 was shown in Table 2. For ROA, LPKR.JK consistently recorded the lowest values in most years, while ITMG.JK emerged as the best performer, especially in 2021 and 2022. Interestingly, the average ROA showed a general increase over the period. When considering RAROC, WSKT.JK stood out twice for the lowest value. On average, there was a significant increase in RAROC across companies in 2021. For the Tobin’s Q ratio, which is a measure of market valuation, LPKR.JK and BMTR.JK showed the lowest values over the data period, while UNVR.JK consistently scored the highest ratio. However, the average Tobin’s Q ratio showed a gradual decline over time, suggesting a potential shift in market perception regarding the valuation of these companies.
Furthermore, the independent variables: ESG composite score (ESG), Environmental score (EPS), Social score (SPS), and Governance score (GPS). All the ESG scores are taken from the Refinitiv Eikon database. EPS covers emissions, innovation, and resource utilization; SPS covers human rights, labor, product responsibility, and community; GPS covers shareholders, management, and CSR strategy. The descriptive analysis of independent variables is shown in Table 3.
The independent variables’ descriptive analysis from 2018 to 2022 is displayed in Table 3. The ESG scores show some identifiable trends. MNCN.JK has the lowest ESG score over the past three years, while BUMI.JK has consistently achieved the highest score over the past four years. There is a noticeable upward trend in the average ESG score and its pillars over time. On the EPS pillar, MNCN.JK recorded the lowest score in 2020 and 2021, while BUMI.JK recorded the highest score in 2019-2021. On SPS, BMTR.JK shows the lowest scores from 2018-2020, while INCO.JK and PTBA.JK repeatedly appear as the highest scores. In GPS, INKP.JK and AALI.JK scored twice the lowest during the analysis period, while INCO.JK and BUMI.JK remained the leaders in this pillar. It is worth noting that certain energy companies have shown the highest ESG scores and some of its pillars relative to other companies in different sectors. Proving ESG credentials is important especially in the energy sector to maintain traction and support from relevant stakeholders.
3.2. Best Model Selection and Model Diagnostics
The most suitable model is then tested with the Hausman test, which is a test between Random Effects (RE) and Fixed Effects (FE), to determine the choice of modeling. If the Hausman test’s null hypothesis is accepted, then the RE model will be more efficient than the FE model, but the RE and FE models will remain consistent. If the null hypothesis of the Hausman test is rejected, then only the FE model is consistent (Wooldridge, 2010). Eight models were used to test each dependent variable (Appendix B). Specifically, the first four models used a linear approach, while the remaining four models used a nonlinear approach. The p-values represent the results of the Hausman test, and all models-both linear and nonlinear-produced p-values of 0.000 for ROA, RAROC, and Tobin’s Q. These results are significant at the 5% level, which is significant at the 5% level. These results are significant at the 5% level, which leads to the rejection of the null hypothesis, or the FE model is consistent. Therefore, the FE model is the right choice. This implies that inter-firm variations, such as sector differences and firm size, affect the dependent variables and should be accounted for in the modeling process. Following this interpretation, further model diagnostics or regression assumption tests, including heteroscedasticity and autocorrelation tests, are applied.
The findings of the heteroscedasticity and autocorrelation tests for the three dependent variables, ROA, RAROC, and Tobin’s Q are detailed in Appendix A. Diagnostic tests were conducted on the best panel data regression model. For the heteroscedasticity test, if the error variance remains constant, then the null hypothesis is homoscedasticity. P-value below 0.05, as observed in this study, indicates the presence of heteroscedasticity. This indicates the presence of non-constant error variability which may affect the robustness of the model and the accuracy of the coefficient estimates. Furthermore, the autocorrelation test is used to detect correlation of errors over time. The p-value of less than 0.05 indicates the presence of autocorrelation, and in this study, the p-value is below the threshold. Autocorrelation can affect the consistency and efficiency of parameter estimation.
Based on these diagnostic results, it is necessary to adjust all regression models to address the issues of heteroscedasticity and autocorrelation. One approach to address these issues is to use variance-covariance matrix estimators, specifically cluster-robust estimators. The cluster-robust method is designed to produce standard errors that are robust to heteroscedasticity and autocorrelation when estimating the error covariance matrix. In practical terms, the use of cluster-robust estimators can result in more precise standard error estimates (Stock & Watson, 2008). These estimators are immediately integrated into the selected optimal model. Through this implementation, the model is adjusted for these diagnostic issues, and as a result, the improved model can be considered free of heteroscedasticity and autocorrelation. In addition, this study also conducted robustness tests by building eight different models, and consistently including control variables in each model.
3.3. The Regression Results
The results of the eight regression models with ROA as the dependent variable are shown in Table 4. In the four linear models (1-4), the ESG, EPS, and SPS pillars negatively affect ROA. Meanwhile, the four nonlinear regression models (5-8) show a U-shaped relationship indicated by the negative influence of ESG, EPS, and SPS on ROA which is then offset by the positive influence of ESG2, EPS2, and SPS2. This finding implies that although initially ESG, EPS, and SPS may decrease ROA, after a certain point, they will contribute positively to ROA performance. In contrast, GPS is not significant for both linear and nonlinear models. However, all control variables are significant. Larger firm size may refer to higher ROA, although leverage may distort ROA. In addition, the Covid-19 pandemic will have a negative impact on ROA.
The results of the eight regression models with RAROC as the dependent variable are shown in Table 5. In four linear models (1-4), RAROC is positively influenced by ESG and the pillars of EPS and GPS. In addition, the four nonlinear models (5-8) indicate that the positive effects of ESG, EPS, and SPS on RAROC are offset by the negative effects of their quadratic forms (ESG2, EPS2, and SPS2), but only SPS is significant resulting in an inverted U-shaped relationship. However, contrary to the linear model, the regression shows that GPS is not significant in the nonlinear model. In general, these results depict a positive linear relationship between ESG and RAROC, with only SPS showing an inverted U-shaped nonlinear influence on RAROC. In addition, the size factor and the COVID-19 pandemic factor are also significant and have similar relationships with RAROC and all models on ROA. In both linear and nonlinear models, they all show that larger companies exhibit better RAROC, as company size on average exerts a positive influence. On the other hand, the impact of COVID-19 is negative, meaning that firms’ RAROC decreased during the pandemic period. However, unlike the models on ROA, the leverage factor in all types of models may not have a significant impact on RAROC performance.
Then, eight regression models with Tobin’s Q as the dependent variable are presented in Table 6. In the linear model (1-4), ESG and the pillars of EPS and SPS have a negative impact on Tobin’s Q, while GPS shows no relevance. On the quadratic form (5-8), however, all of them have no significant effect on Tobin’s Q. These findings suggest that ESG, EPS, and SPS only have a linear negative influence on Tobin’s Q metric. As for the control variables, Tobin’s Q is negatively affected by firm size. However, Tobin’s Q is not necessarily impacted by the pandemic and leverage, unlike the previous models on ROA and RAROC.
5. Discussion
This study investigates the effect of ESG scores on key financial metrics: ROA (Return on Assets), RAROC (Return on Risk Adjusted Capital), and Tobin’s Q. At first, the study observed a U-shaped impact of ESG scores on ROA, where companies initially experience a decline in profits when they start investing in ESG initiatives, but the return on assets improves as these efforts intensify. This U-shaped trend is evident in the overall ESG score and especially in the environmental and social pillar, but not in the governance pillar, in terms of RAROC. This finding suggests a positive linear relationship between the environmental and governance pillars of ESG and RAROC, indicating that good governance and environmental practices can enhance shareholder wealth through improved risk management. However, the results of this study show that an inverted U-shaped effect of the social pillar on RAROC, which implies a reduced rate of return on investment in social aspects of ESG/CSR. Conversely, the analysis also reveals a negative effect of ESG scores on Tobin’s Q, especially in the environmental and social pillars, which challenges the market’s assessment of ESG efforts and suggests potential limitations in the perception of these investments.
These findings are contextualized within the broader academic debate. The U-shaped impact on ROA aligns with studies like those of (Buallay et al., 2021; Nollet et al., 2016), but contrasts with (El Khoury et al., 2023). While (Di Giuli & Kostovetsky, 2014) suggest a potential negative effect of increasing ESG/CSR efforts on firm performance, (Benabou & Tirole, 2010; Giese et al., 2019) propose that heightened ESG/CSR performance could enhance firm value. Regarding RAROC, our findings echo (Albuquerque et al., 2019) and relate to research by (Korinth & Lueg, 2022; Lueg & Pesheva, 2021). Finally, our observations on Tobin’s Q diverge from studies like (Barbieri & Pellegrini, 2022; Buchanan et al., 2018; El Khoury et al., 2023; Sadiq et al., 2020), who highlight complexities in the relationship between ESG disclosures and firm value.
6. Conclusions
This research reveals the complex relationship between Environmental, Social and Governance (ESG) scores and firm performance. The findings showed that there is a U-shaped impact on Return on Assets (ROA) for both the ESG score as a whole and the environmental and social pillars, while there was a positive linear relationship between the ESG score as a whole and the environmental and governance pillars with Return Adjusted Risk-Adjusted Capital (RAROC), but an inverted U-shaped effect of the social pillar on RAROC. In addition, the findings also noted that there is a negative linear relationship between ESG scores and Tobin’s Q. Therefore, it is important to strategically manage ESG and align it with the financial objectives of the company. Recognizing the correlation between ESG factors and profitability and risk becomes clear, which can guide stakeholders in making investment, governance and operational decisions. Nevertheless, the limitations of the data in this study emphasize the significance of carrying out further study including the use of different data sets, more extended analysis and different time frames. More exploration of nonlinear relationships and interactions with other macroeconomic or regulatory factors is also crucial to explore the complexity of the relationship between ESG and firm performance.
Author Contributions
Conceptualization, K.NA.; Methodology, K.N.A. and N.A.A.; Data Curation, K.NA. and A.H.M.; Writing—original draft, K.N.A.; Writing—review & editing, T.N., and A.H.M.; Supervision, N.A.A., T.N., and A.H.M. All authors have read and agreed to the published version of the manuscript.
Funding
This research received no external funding.
Data Availability Statement
No new data were created or analyzed in this study. Data sharing is not applicable to this article.
Conflicts of Interest
The authors declare no conflict of interest.
Appendix A

Table A1.
ESG score of selected firms in 2018 2022.
| Sector | Firm | 2018 | 2019 | 2020 | 2021 | 2022 | Average | Category |
| Basic Materials | ANTM.JK | 69.4 | 64.32 | 70.72 | 69.28 | 70.87 | 68.92 | B |
| INCO.JK | 84.97 | 82.74 | 81.71 | 79.26 | 74.31 | 80.60 | A | |
| INKP.JK | 26.64 | 27.44 | 29.65 | 28.69 | 29.87 | 28.46 | C | |
| INTP.JK | 49.89 | 43.02 | 52.66 | 62.62 | 63.1 | 54.26 | B | |
| SMGR.JK | 46.94 | 43.47 | 54.15 | 54.02 | 70.25 | 53.77 | B | |
| TKIM.JK | 24.73 | 33.95 | 30.28 | 28.56 | 35.4 | 30.58 | C | |
| Consumer Cyclicals | LPPF.JK | 39.65 | 39.13 | 43.99 | 43.66 | 46.72 | 42.63 | C |
| MNCN.JK | 14.89 | 20.24 | 16.03 | 16.85 | 25.86 | 18.77 | D | |
| SCMA.JK | 48 | 54.01 | 39.48 | 44.01 | 62.62 | 49.62 | C | |
| Consumer Non-Cyclicals | AALI.JK | 32.93 | 30.48 | 36.12 | 35.3 | 45.55 | 36.08 | C |
| CPIN.JK | 10.68 | 20.55 | 22.49 | 22.72 | 29.26 | 21.14 | D | |
| GGRM.JK | 19.31 | 13.66 | 25.18 | 26.62 | 28.16 | 22.59 | D | |
| HMSP.JK | 58.72 | 76.13 | 71.49 | 75.95 | 77.74 | 72.01 | B | |
| ICBP.JK | 39.42 | 37.85 | 35.69 | 29.5 | 52.21 | 38.93 | C | |
| INDF.JK | 40.2 | 33.22 | 39.73 | 42.52 | 70.41 | 45.22 | C | |
| UNVR.JK | 72.08 | 74.16 | 73.9 | 74.74 | 82.84 | 75.54 | A | |
| Energy | ADRO.JK | 39.01 | 52.66 | 61.92 | 62.89 | 56.12 | 54.52 | B |
| AKRA.JK | 41.1 | 50.98 | 54.41 | 56.9 | 66.07 | 53.89 | B | |
| BUMI.JK | 63.74 | 83.77 | 83.7 | 85.39 | 85.23 | 80.37 | A | |
| BUMI.SI | 51.33 | 45.05 | 55.44 | 56.27 | 58.37 | 53.29 | B | |
| ITMG.JK | 79.75 | 76.55 | 77.51 | 81.87 | 84.8 | 80.10 | A | |
| PGAS.JK | 72.97 | 72.45 | 71.42 | 70.8 | 70.67 | 71.66 | B | |
| PTBA.JK | 61.17 | 61.73 | 64.54 | 65.62 | 80.27 | 66.67 | B | |
| Healthcare | KLBF.JK | 53.44 | 54.16 | 64.18 | 72.2 | 66.73 | 62.14 | B |
| Industrial | ASII.JK | 32.91 | 31.81 | 42.01 | 53.08 | 55.36 | 43.03 | C |
| BMTR.JK | 22.56 | 24.6 | 25.75 | 37.71 | 46.55 | 31.43 | C | |
| UNTR.JK | 60.63 | 65.98 | 66.11 | 66.03 | 72.66 | 66.28 | B | |
| Infrastructure | EXCL.JK | 64.28 | 71.15 | 65 | 57.27 | 56.89 | 62.92 | B |
| ISAT.JK | 50.96 | 46.32 | 47.31 | 49.4 | 38.57 | 46.51 | C | |
| JSMR.JK | 66.81 | 73.87 | 68.84 | 67.09 | 62.57 | 67.84 | B | |
| TBIG.JK | 17.5 | 17.66 | 24.93 | 28.33 | 29.77 | 23.64 | D | |
| TLKM.JK | 58.16 | 52.97 | 44.67 | 49.2 | 54.65 | 51.93 | B | |
| WSKT.JK | 28.19 | 36.75 | 41.56 | 44.67 | 38.65 | 37.96 | C | |
| Properties & Real Estate | BSDE.JK | 26.12 | 28.71 | 37.35 | 40.49 | 55.89 | 37.71 | C |
| LPKR.JK | 44.04 | 41.58 | 39.97 | 35.15 | 33.59 | 38.87 | C | |
| PWON.JK | 19.8 | 22.49 | 27.05 | 41.21 | 51.98 | 32.51 | C | |
| SMRA.JK | 29.55 | 26.89 | 30.82 | 29.63 | 44.54 | 32.29 | C |
Appendix B
Table B1.
The Hausman test and model diagnostic results.
| 1 | 2 | 3 | 4 | 5 | 6 | 7 | 8 | |
| Dependent Variable: ROA | ||||||||
| Hausman test | 0.000 | 0.000 | 0.000 | 0.000 | 0.000 | 0.000 | 0.000 | 0.000 |
| Results | Fixed | Fixed | Fixed | Fixed | Fixed | Fixed | Fixed | Fixed |
| Dependent Variable: RAROC | ||||||||
| Hausman test | 0.000 | 0.000 | 0.000 | 0.008 | 0.000 | 0.000 | 0.000 | 0.000 |
| Results | Fixed | Fixed | Fixed | Fixed | Fixed | Fixed | Fixed | Fixed |
| Dependent Variable: Tobin’s Q | ||||||||
| Hausman test | 0.000 | 0.000 | 0.000 | 0.000 | 0.000 | 0.000 | 0.005 | 0.000 |
| Results | Fixed | Fixed | Fixed | Fixed | Fixed | Fixed | Fixed | Fixed |
Source: Author calculations.
The table above presents the p-values from the Hausman test results. Columns 1-4 correspond to linear models, while columns 5-8 pertain to nonlinear models. Each dependent variable has 8 models, resulting in a total of 24 tested models.
Table B2.
The Hausman test and model diagnostic results.
| 1 | 2 | 3 | 4 | 5 | 6 | 7 | 8 | |
| Dependent Variable: ROA | ||||||||
| Heteroscedasticity test | 0.000 | 0.000 | 0.000 | 0.002 | 0.000 | 0.000 | 0.000 | 0.005 |
| Autocorrelation test | 0.000 | 0.000 | 0.000 | 0.000 | 0.000 | 0.000 | 0.000 | 0.000 |
| Dependent Variable: RAROC | ||||||||
| Heteroscedasticity test | 0.018 | 0.013 | 0.014 | 0.019 | 0.025 | 0.014 | 0.021 | 0.029 |
| Autocorrelation test | 0.004 | 0.003 | 0.004 | 0.004 | 0.004 | 0.003 | 0.004 | 0.004 |
| Dependent Variable: Tobin’s Q | ||||||||
| Heteroscedasticity test | 0.001 | 0.000 | 0.004 | 0.004 | 0.000 | 0.000 | 0.006 | 0.006 |
| Autocorrelation test | 0.000 | 0.000 | 0.000 | 0.000 | 0.000 | 0.000 | 0.000 | 0.000 |
Source: Author calculations.
The table above presents the p-values from heteroskedasticity tests using Breusch-Pagan test and autocorrelation tests with Breusch-Godfrey test. Columns 1-4 correspond to linear models, while columns 5-8 pertain to nonlinear models. Each dependent variable has 8 models, resulting in a total of 24 tested models.
Appendix C
RAROC is a unique risk-adjusted performance/profitability measuring tool that presents a risk-oriented view of the revenues from the perspective of the magnitude of risks taken to generate those revenues. The basic aim of the RAROC model is to adjust returns by expected losses and to provide an Unexpected Loss-based capital buffer. RAROC is seen as a substitute for other performance measurement tools, provided it is applied correctly (Padganeh, 2014).
Figure 1.
RAROC definitions Source: Padganeh (2014).
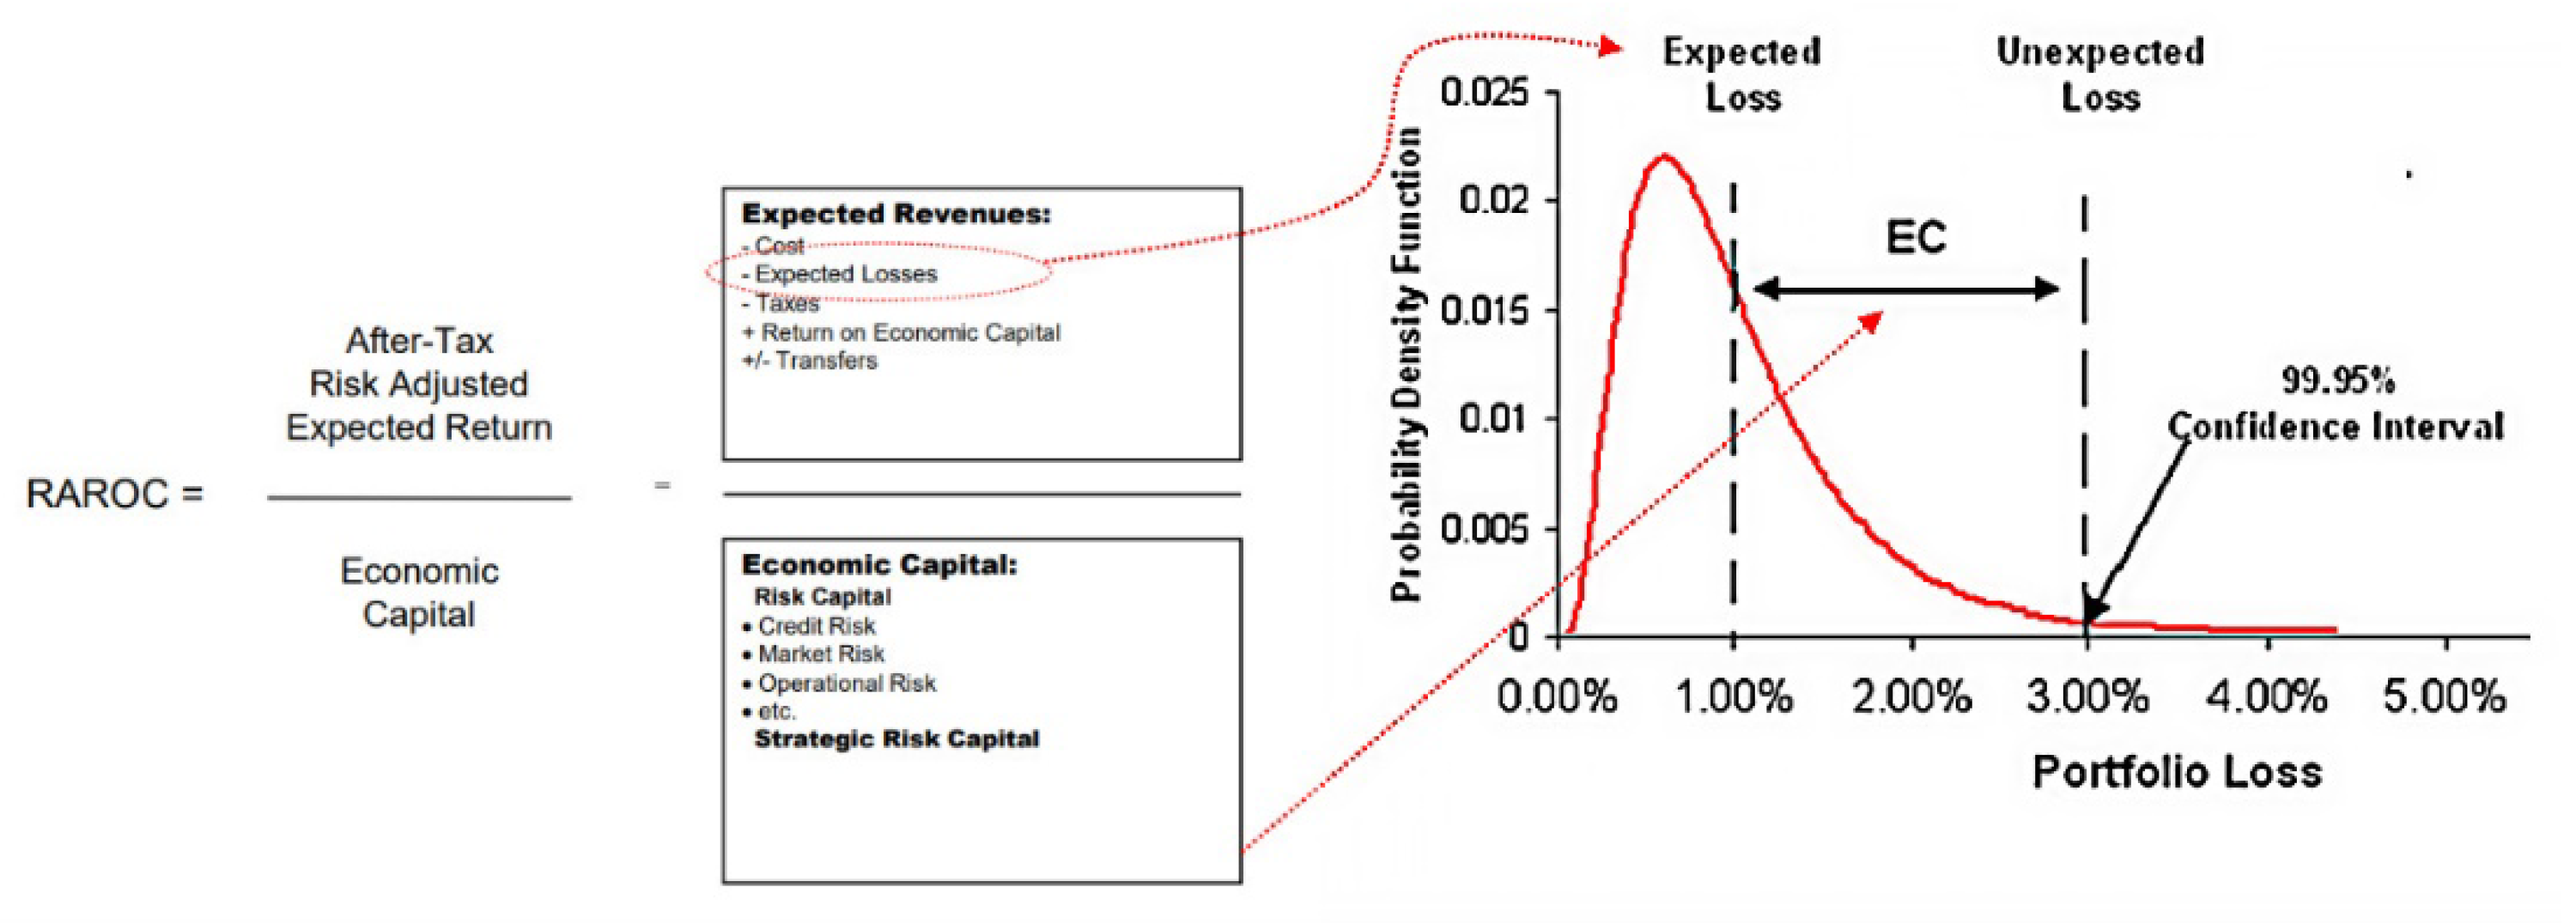
The Economic Capital is the amount of money needed to secure the banks’ survival in a worst-case scenario, i.e., it is a buffer against heavy shocks. It should capture all types of risk (market, credit and operational risk) and is often calculated by the Value at Risk (VaR). In this study, the risk that can be calculated for all companies is the market risk. In relation to this, we use the historical method to calculate VaR, which relies on historical data of assets or portfolios to predict potential future losses. By collecting and sorting historical returns, this method provides an empirical perspective on past return distributions and uses a specific percentile of that distribution in accordance with the desired confidence level to determine VaR. While this method has advantages in simplicity and interpretation, the full reliance on historical data assumes that past market conditions will continue in the future, a premise that may not always hold true. Finally, for the expected return (ER), we derive from the Capital Asset Pricing Model (CAPM) (Fama & French, 2004):
where:
- ER
- = Expected return on the investment.
- Rf
- = Risk-free rate of return (4%, Indonesia).
- β (Beta)
- = Beta of the investment. Unavoidable market risk.
- Rm
- = Average return of the market.
References
- Albuquerque, R., Koskinen, Y., & Zhang, C. (2019). Corporate Social Responsibility and Firm Risk: Theory and Empirical Evidence. Management Science, 65(10), 4451–4469. [CrossRef]
- Alshehhi, A., Nobanee, H., & Khare, N. (2018). The Impact of Sustainability Practices on Corporate Financial Performance: Literature Trends and Future Research Potential. In Sustainability (Vol. 10, Issue 2, pp. 1–25). MDPI. [CrossRef]
- Ameer, R., & Othman, R. (2012). Sustainability Practices and Corporate Financial Performance: A Study Based on the Top Global Corporations. Journal of Business Ethics, 108(1), 61–79. [CrossRef]
- Atan, R., Alam, M. M., Said, J., & Zamri, M. (2018). The Impacts of Environmental, Social, and Governance Factors on Firm Performance: Panel Study of Malaysian Companies. Management of Environmental Quality: An International Journal, 29(2), 182–194. [CrossRef]
- Aydoğan, D., & Özbay, Y. (2012). Explanation of academic procrastination from self-esteem, state anxiety, self-efficacy. In Pegem Eğitim ve Öğretim Dergisi (Vol. 2, Issue 3, pp. 1–10). Pegem Akademi Yayincilik Egitim Danismanlik Hizmetleri. [CrossRef]
- Barbieri, S. V., & Pellegrini, L. (2022). How Much Does Matter ESG Ratings in Big Pharma Firms Performances? (pp. 185–225). [CrossRef]
- Baron, D. P. (2007). Corporate Social Responsibility and Social Entrepreneurship. Journal of Economics & Management Strategy, 16(3), 683–717. [CrossRef]
- Benabou, R., & Tirole, J. (2010). Individual and Corporate Social Responsibility. Economica, 77(305), 1–19. [CrossRef]
- Buallay, A., Fadel, S. M., Alajmi, J., & Saudagaran, S. (2021). Sustainability Reporting and Bank Performance After Financial Crisis. Competitiveness Review: An International Business Journal, 31(4), 747–770. [CrossRef]
- Buchanan, B., Cao, C. X., & Chen, C. (2018). Corporate Social Responsibility, Firm Value, and Influential Institutional Ownership. Journal of Corporate Finance, 52, 73–95. [CrossRef]
- Cherney, A., & Blair, S. (2015). Doing Well by Doing Good: The Benevolent Halo of Corporate Social Responsibility. Journal of Consumer Research, 41(6), 1412–1425. [CrossRef]
- Di Giuli, A., & Kostovetsky, L. (2014). Are Red or Blue Companies More Likely to Go Green? Politics and Corporate Social Responsibility. Journal of Financial Economics, 111(1), 158–180. [CrossRef]
- El Khoury, R., Nasrallah, N., & Alareeni, B. (2023). ESG and Financial Performance of Banks in the MENAT Region: Concavity–Convexity Patterns. Journal of Sustainable Finance & Investment, 13(1), 406–430. [CrossRef]
- Ersoy, E., Swiecka, B., Grima, S., Özen, E., & Romanova, I. (2022). The Impact of ESG Scores on Bank Market Value? Evidence from the U.S. Banking Industry. Sustainability, 14, 1–14. [CrossRef]
- Fama, E. F., & French, K. R. (2004). The capital asset pricing model: Theory and evidence. Journal of Economic Perspectives, 18(3), 25–46.
- Fatemi, A., Glaum, M., & Kaiser, S. (2018). ESG Performance and Firm Value: The Moderating Role of Disclosure. Global Finance Journal, 38, 45–64. [CrossRef]
- Freeman, R. E., & McVea, J. (2001). A Stakeholder Approach to Strategic Management. SSRN Electronic Journal. [CrossRef]
- Friede, G., Busch, T., & Bassen, A. (2015). ESG and Financial Performance: Aggregated Evidence from more than 2000 Empirical Studies. Journal of Sustainable Finance and Investment, 5(4), 210–233. [CrossRef]
- Fuente, G. de la, Ortiz, M., & Velasco, P. (2022). The Value of a Firm’s Engagement in ESG Practices: Are We Looking at the Right Side? Long Range Planning, 55, 1–26. [CrossRef]
- Giannopoulos, G., Fagernes, R. V. K., Elmarzouky, M., & Hossain, K. A. B. M. A. (2022). The ESG Disclosure and the Financial Performance of Norwegian Listed Firms. Journal of Risk and Financial Management, 15(6), 1–16. [CrossRef]
- Giese, G., Lee, L.-E., Melas, D., Nagy, Z., & Nishikawa, L. (2019). Foundations of ESG Investing: How ESG Affects Equity Valuation, Risk, and Performance. The Journal of Portfolio Management, 45(5), 69–83. [CrossRef]
- Gillan, S. L., Koch, A., & Starks, L. T. (2021). Firms and Social Responsibility: A Review of ESG and CSR Research in Corporate Finance. Journal of Corporate Finance, 66. [CrossRef]
- Hassan, H. (2023). How Do Signs Indicate Identity or Meaning? An Analysis of Film/Novel Pinjar Using Pierce’s Semiotics Model. Journal Mairaj, 2(1), 1–11. https://www.mairaj.pk.
- Hult, G. T. M., Ketchen, D. J., Griffith, D. A., Chabowski, B. R., Hamman, M. K., Dykes, B. J., Pollitte, W. A., & Cavusgil, S. T. (2008). An assessment of the measurement of performance in international business research. Journal of International Business Studies, 39(6), 1064–1080. [CrossRef]
- Jensen, M. (2001). Value Maximisation, Stakeholder Theory, and the Corporate Objective Function. European Financial Management, 7(3), 297–317. [CrossRef]
- Kim, S., & Li, Z. (2021). Understanding the Impact of ESG Practices in Corporate Finance. Sustainability (Switzerland), 13(7). [CrossRef]
- Koji, K., Adhikary, B. K., & Tram, L. (2020). Corporate Governance and Firm Performance: A Comparative Analysis between Listed Family and Non-Family Firms in Japan. Journal of Risk and Financial Management, 13(9). [CrossRef]
- Korinth, F., & Lueg, R. (2022). Corporate Sustainability and Risk Management—The U-Shaped Relationships of Disaggregated ESG Rating Scores and Risk in the German Capital Market. Sustainability (Switzerland), 14(9). [CrossRef]
- Linsmeier, T. J., & Pearson, N. D. (2000). Value at Risk. Financial Analysts Journal, 56(2), 47–67. [CrossRef]
- Lueg, R., & Pesheva, R. (2021). Corporate Sustainability in the Nordic Countries – The Curvilinear Effects on Shareholder Returns. Journal of Cleaner Production, 315. [CrossRef]
- Manurung, A. H. (2018). Pengukuran Risiko (Risk Measurement). PT Adler Manurung Press.
- Naeem, N., & Çankaya, S. (2022). The Impact of ESG Performance over Financial Performance: A Study on Global Energy and Power Generation Companies. International Journal of Commerce and Finance, 8(1), 1–25.
- Nollet, J., Filis, G., & Mitrokostas, E. (2016). Corporate Social Responsibility and Financial Performance: A Non-Linear and Disaggregated approach. Economic Modelling, 52, 400–407. [CrossRef]
- Padganeh, Y. (2014). Risk-Adjusted Return on Capital (RAROC). GARP Working Paper.
- Prokopczuk, M., Rachev, S. T., Schindlmayr, G., & Trück, S. (2007). Quantifying Risk in the Electricity Business: A RAROC-Based Approach. Energy Economics, 29(5), 1033–1049. [CrossRef]
- Sadiq, M., Singh, J., Raza, M., & Mohamad, S. (2020). The Impact of Environmental, Social and Governance Index on Firm Value: Evidence from Malaysia. International Journal of Energy Economics and Policy, 10(5), 555–562. [CrossRef]
- Saygili, E., Arslan, S., & Birkan, A. O. (2022). ESG Practices and Corporate Financial Performance: Evidence from Borsa Istanbul. Borsa Istanbul Review, 22(3), 525–533. [CrossRef]
- Trisnowati, Y., Achsani, N. A., Sembel, R., & Andati, T. (2022). The Effect of ESG Score, Financial Performance, and Macroeconomics on Stock Returns during the Pandemic Era in Indonesia. International Journal of Energy Economics and Policy, 12(4), 166–172. [CrossRef]
- Whelan, T., Atz, U., Holt, T. Van, & Clark, C. (2015). ESG and Financial Performance: Uncovering the Relationship by Aggregating Evidence from 1,000 Plus Studies.
- Wooldridge, J. M. (2010). Econometric Analysis of Cross Section and Panel Data. MIT press.
Table 1.
The Definitions of Variables.
| Variable | Dimension / Proxied by |
Definitions of Variables |
| Dependent Variable | ||
| Accounting-based | Return on Assets (ROA) | Return on assets (ROA) serves as a metric for assessing profitability. Net income is divided by total assets. This financial indicator assesses how profitable a business is in relation to its total assets. (Giannopoulos et al., 2022; Naeem & Çankaya, 2022; Saygili et al., 2022). |
| Risk-Adjusted Return on Capital (RAROC) | RAROC is an effective method for assessing a business’s risk management and financial performance. (Manurung, 2018). The calculation of RAROC is carried out by following the theory of (Prokopczuk et al., 2007) which uses Value at Risk (VaR) as a proxy for Ecosnomic Capital. Value at Risk (VaR) is estimated using historical methods ((Linsmeier & Pearson, 2000). In addition, Expected Return is derived from the calculation of Fama & French (2004) using the Capital Asset Pricing Model (CAPM). Therefore, RAROC is more about market risk. Further details about RAROC can be seen in Appendix III. Furthermore, Tobin’s Q is calculated based on the research of (Koji et al., 2020). | |
| Market-value-based | Tobin’s Q (TQ) | Tobin’s Q refers to the quantitative measure that represents the ratio between the market value and intrinsic value of a given company (Atan et al., 2018; Hult et al., 2008). One way to determine if a company is overvalued or undervalued is to utilize Tobin’s Q. Market Capitalization is divided by Total Assets to get TQ. A measure in finance, this ratio compares the market value of an organization’s assets to that value. |
| Independent Variable | ||
| ESG score | ESG combined score (ESG) | ESG combine score from dimension EPS, SPS, and GPS |
| Environmental score (EPS) | EPS encompasses emissions, innovation, and resource utilization | |
| Social score (SPS) | SPS includes human rights, workforce, product responsibility, and community | |
| Governance score (GPS) | GPS takes in shareholders, management, and CSR strategy | |
| Control Variable | ||
| Firm Size | Total Assets (Size) | This variable represents the total assets of a company. It encompasses everything a company owns or controls that has economic value. The total assets are used as a measure of the size of the company |
| Firm debt | Leverage (LEV) | Leverage is the term for using debt or borrowed money to increase the return on investments or business ventures. It’s a financial strategy that involves using external funds for growth and expansion. |
| Financial crisis | COVID-19 | This variable specifically refers to the time frame of the COVID-19 pandemic in 2020. t is included in the study to assess the impact of the pandemic |
Source: Prepared by Author (2024).
Table 2.
Descriptive analysis of dependent variables.
| Variables | 2018 | 2019 | 2020 | 2021 | 2022 |
| ROA | |||||
| Min | -0.058 | -0.040 | -0.180 | -0.031 | -0.046 |
| EXCL.JK | LPKR.JK | LPKR.JK | LPKR.JK | LPKR.JK | |
| Max | 0.452 | 0.361 | 0.348 | 0.337 | 0.557 |
| UNVR.JK | UNVR.JK | UNVR.JK | ITMG.JK | ITMG.JK | |
| Mean | 0.098 | 0.084 | 0.047 | 0.091 | 0.109 |
| RAROC | |||||
| Min | -3.034 | -3.307 | -4.547 | 0.967 | 0.488 |
| WSKT.JK | TKIM.JK | WSKT.JK | UNVR.JK | BSDE.JK | |
| Max | 0.156 | 0.383 | 0.435 | 7.357 | 2.071 |
| ISAT.JK | AALI.JK | BUMI.JK | WSKT.JK | WSKT.JK | |
| Mean | -1.426 | -0.692 | -1.603 | 2.556 | 0.992 |
| Tobin’s Q | |||||
| Min | 0.758 | 0.789 | 0.770 | 0.732 | 0.644 |
| LPKR.JK | LPKR.JK | BMTR.JK | BMTR.JK | MNCN.JK | |
| Max | 17.678 | 16.263 | 14.415 | 8.996 | 10.570 |
| UNVR.JK | UNVR.JK | UNVR.JK | UNVR.JK | UNVR.JK | |
| Mean | 2.421 | 2.137 | 1.968 | 1.650 | 1.626 |
Source: Refinitiv Eikon database and author calculations (RAROC and Tobin’s Q); Prepared by author (2024).
Table 3.
Descriptive analysis of independent variables.
| 2018 | 2019 | 2020 | 2021 | 2022 | |
| ESG | |||||
| Min | 10.68 | 13.66 | 16.03 | 16.85 | 25.86 |
| CPIN.JK | GGRM.JK | MNCN.JK | MNCN.JK | MNCN.JK | |
| Max | 84.97 | 83.77 | 83.70 | 85.39 | 85.23 |
| INCO.JK | BUMI.JK | BUMI.JK | BUMI.JK | BUMI.JK | |
| Mean | 44.93 | 46.82 | 49.13 | 50.96 | 56.08 |
| EPS | |||||
| Min | 1.44 | 0.17 | 0.15 | 0.12 | 5.54 |
| TBIG.JK | SCMA.JK | MNCN.JK | MNCN.JK | BMTR.JK | |
| Max | 77.02 | 81.54 | 81.69 | 79.57 | 86.03 |
| ITMG.JK | BUMI.JK | BUMI.JK | BUMI.JK | UNVR.JK | |
| Mean | 33.77 | 36.04 | 41.14 | 42.64 | 48.65 |
| SPS | |||||
| Min | 7.97 | 8.83 | 10.16 | 23.86 | 22.48 |
| BMTR.JK | BMTR.JK | BMTR.JK | MNCN.JK | INKP.JK | |
| Max | 93.37 | 91.72 | 94.96 | 95.75 | 95.12 |
| INCO.JK | INCO.JK | PTBA.JK | PTBA.JK | PTBA.JK | |
| Mean | 51.93 | 53.28 | 54.24 | 55.71 | 59.87 |
| GPS | |||||
| Min | 10.61 | 10.64 | 9.58 | 2.98 | 8.61 |
| AALI.JK | AALI.JK | INKP.JK | CPIN.JK | INKP.JK | |
| Max | 89.68 | 91.06 | 90.32 | 94.01 | 93.60 |
| INCO.JK | INCO.JK | BUMI.JK | BUMI.JK | BUMI.JK | |
| Mean | 45.04 | 47.28 | 48.64 | 51.42 | 56.66 |
Source: Refinitiv Eikon database and author calculations (RAROC and Tobin’s Q) Prepared by author (2024).
Table 4.
The results of the fixed effects estimation of ROA.
| Model 1 | Model 2 | Model 3 | Model 4 | Model 5 | Model 6 | Model 7 | Model 8 | |
| ESG | -0.001*** | -0.007*** | ||||||
| (0.001) | (0.002) | |||||||
| EPS | -0.001*** | -0.004*** | ||||||
| (0.001) | (0.001) | |||||||
| SPS | -0.002*** | -0.005** | ||||||
| (0.001) | (0.002) | |||||||
| GPS | 0.0003 | 0.0003 | ||||||
| (0.000) | (0.001) | |||||||
| ESG2 | 0.0001** | |||||||
| (0.000) | ||||||||
| EPS2 | 0.00004** | |||||||
| (0.000) | ||||||||
| SPS2 | 0.00003* | |||||||
| (0.000) | ||||||||
| GPS2 | 0.0000 | |||||||
| (0.000) | ||||||||
| SIZE | 0.116* | 0.122** | 0.125** | 0.095 | 0.117** | 0.131** | 0.131** | 0.095* |
| (0.060) | (0.062) | (0.060) | (0.058) | (0.058) | (0.060) | (0.061) | (0.057) | |
| LEV | -0.331*** | -0.328*** | -0.350*** | -0.306*** | -0.357*** | -0.360*** | -0.370*** | -0.306*** |
| -0.082 | -0.081 | -0.087 | -0.08 | -0.09 | -0.087 | -0.092 | -0.081 | |
| COV | -0.038*** | -0.036*** | -0.038*** | -0.038*** | -0.036*** | -0.034*** | -0.038*** | -0.038*** |
| -0.011 | -0.012 | -0.01 | -0.011 | -0.011 | -0.012 | -0.01 | -0.011 | |
| Observations | 185 | 185 | 185 | 185 | 185 | 185 | 185 | 185 |
| R2 | 0.307 | 0.321 | 0.342 | 0.285 | 0.34 | 0.364 | 0.355 | 0.285 |
| F Statistic | 15.916*** | 17.028*** | 18.742*** | 14.315*** | 14.750*** | 16.391*** | 15.760*** | 11.373*** |
The symbols *p < 0.1; **p < 0.05; ***p < 0.01 show the relevance levels. Numbers in parentheses () represent the standard errors of the coefficients; Source: Prepared by author (2024).
Table 5.
The results of the fixed effects estimation of RAROC.
| Model 1 | Model 2 | Model 3 | Model 4 | Model 5 | Model 6 | Model 7 | Model 8 | |
| ESG | 0.062*** | 0.139** | ||||||
| (0.022) | (0.058) | |||||||
| EPS | 0.045*** | 0.044* | ||||||
| (0.013) | (0.023) | |||||||
| SPS | 0.021 | 0.191*** | ||||||
| (0.022) | (0.049) | |||||||
| GPS | 0.035*** | -0.001 | ||||||
| (0.014) | (0.041) | |||||||
| ESG2 | -0.001 | |||||||
| (0.001) | ||||||||
| EPS2 | 0.00001 | |||||||
| (0.000) | ||||||||
| SPS2 | -0.002*** | |||||||
| (0.001) | ||||||||
| GPS2 | 0.0004 | |||||||
| (0.000) | ||||||||
| SIZE | 2.454*** | 2.423*** | 2.968*** | 3.014*** | 2.441*** | 2.426*** | 2.628*** | 2.898*** |
| (0.749) | (0.720) | (0.836) | (0.703) | (0.716) | (0.725) | (0.776) | (0.692) | |
| LEV | -0.352 | -0.622 | -0.81 | -0.853 | 0.021 | -0.63 | 0.387 | -0.788 |
| (2.118) | (2.101) | (2.346) | (2.233) | (2.092) | (2.100) | (2.235) | (2.221) | |
| COV | -1.831*** | -1.900*** | -1.817*** | -1.783*** | -1.862*** | -1.900*** | -1.823*** | -1.769*** |
| (0.175) | (0.178) | (0.179) | (0.158) | (0.193) | (0.181) | (0.185) | (0.160) | |
| Observations | 185 | 185 | 185 | 185 | 185 | 185 | 185 | 185 |
| R2 | 0.338 | 0.336 | 0.296 | 0.329 | 0.345 | 0.336 | 0.344 | 0.333 |
| F Statistic | 18.378*** | 18.199*** | 15.160*** | 17.667*** | 15.071*** | 14.458*** | 14.983*** | 14.299*** |
The symbols *p < 0.1; **p < 0.05; ***p < 0.01 show the relevance levels. Numbers in parentheses () represent the standard errors of the coefficients; Source: Prepared by author (2024).
Table 6.
The results of the fixed effects estimation of Tobin’s Q.
| Model 1 | Model 2 | Model 3 | Model 4 | Model 5 | Model 6 | Model 7 | Model 8 | |
| ESG | -0.010*** | -0.015 | ||||||
| (0.003) | (0.010) | |||||||
| EPS | -0.008*** | -0.009 | ||||||
| (0.002) | (0.006) | |||||||
| SPS | -0.009*** | -0.011 | ||||||
| (0.003) | (0.008) | |||||||
| GPS | -0.0001 | 0.002 | ||||||
| (0.002) | (0.006) | |||||||
| ESG2 | 0.0001 | |||||||
| (0.000) | ||||||||
| EPS2 | 0.00001 | |||||||
| (0.000) | ||||||||
| SPS2 | 0.00002 | |||||||
| (0.000) | ||||||||
| GPS2 | -0.00002 | |||||||
| (0.000) | ||||||||
| SIZE | -0.350** | -0.319** | -0.351** | -0.475*** | -0.350** | -0.317** | -0.348** | -0.468*** |
| (0.139) | (0.140) | (0.140) | (0.145) | (0.139) | (0.139) | (0.138) | (0.143) | |
| LEV | -0.631 | -0.609 | -0.674* | -0.495 | -0.656* | -0.617* | -0.685* | -0.499 |
| (0.396) | (0.397) | (0.396) | (0.422) | (0.380) | (0.372) | (0.374) | (0.423) | |
| COV | 0.02 | 0.033 | 0.018 | 0.018 | 0.022 | 0.033 | 0.018 | 0.017 |
| (0.029) | (0.032) | (0.026) | (0.029) | (0.028) | (0.032) | (0.026) | (0.029) | |
| Observations | 185 | 185 | 185 | 185 | 185 | 185 | 185 | 185 |
| R2 | 0.265 | 0.297 | 0.273 | 0.185 | 0.268 | 0.297 | 0.273 | 0.186 |
| F Statistic | 13.000*** | 15.184*** | 13.502*** | 8.191*** | 10.447*** | 12.075*** | 10.743*** | 6.555*** |
The symbols *p < 0.1; **p < 0.05; ***p < 0.01 show the relevance levels. Numbers in parentheses () represent the standard errors of the coefficients; Source: Prepared by author (2024).
Disclaimer/Publisher’s Note: The statements, opinions and data contained in all publications are solely those of the individual author(s) and contributor(s) and not of MDPI and/or the editor(s). MDPI and/or the editor(s) disclaim responsibility for any injury to people or property resulting from any ideas, methods, instructions or products referred to in the content. |
© 2024 by the authors. Licensee MDPI, Basel, Switzerland. This article is an open access article distributed under the terms and conditions of the Creative Commons Attribution (CC BY) license (http://creativecommons.org/licenses/by/4.0/).
Copyright: This open access article is published under a Creative Commons CC BY 4.0 license, which permit the free download, distribution, and reuse, provided that the author and preprint are cited in any reuse.


