Submitted:
11 July 2024
Posted:
11 July 2024
You are already at the latest version
Abstract
Wave propagation in buildings analyzed from its response to earthquakes can be applied for tracking the dynamic characteristics changes based on impulse response functions. The velocity of traveling shear-waves and intrinsic attenuation in buildings can be retrieved for buildings. It is an approach of importance for system identification. The Factor Building at the University of California, Los Angeles campus (henceforth referred as the UCLA Factor Building), an instrumented 15-story steel-moment frame structure, are selected for dynamic response characteristics identification. They are inferred from wave propagation using seismic interferometry for recorded motions. The deconvolved waves are used to compute shear wave travel time and wave attenuation. The natural logarithm for the envelopes of the waveforms deconvolved with the signal at the basement constrains the attenuation. The waveforms from deconvolution with the motion at the basement suggest the fundamental mode of the building. The frequency and decay with time constrain the shear velocity and attenuation as well. The velocity are measured using arrival times picked from these deconvolved waves and the average velocity is 147.1 m/s. The quality factor is equal to 10.8 with the damping ratio at 5%. The shear wave velocity and damping ratio estimated from the deconvolved waves have a good match with these inferred from the waveforms deconvolved with the basement recording. This consistency suggests that wave deconvolution can be applied to extract the building response from the excitation and ground coupling. Based on the resonant frequencies and damping ratio, the finite element model of the building is updated. This study implies that wave deconvolution is powerful to extract the building dynamic characteristics. It helps to better the understanding of the dynamic response of buildings to earthquakes.
Keywords:
Wave deconvolution
; fundamental frequencies
; shear wave velocity
; finite element model calibration
1. Introduction
The response of a building to an earthquake has been worked on to improve the building seismic design, to mitigate earthquake hazards and to minimize casualties (Todorovska et al., 2001a; Snieder and Safak, 2006; Kohler et al., 2007). Wave Propagation in Buildings as Periodic Structures. Measuring building motions, modal frequencies, shear wave velocities and intrinsic attenuation has been leading to better understanding the response of the building (Trifunac et al., 2001a and 2001b;Todorovska et al., 2001b; Clinton et al., 2006; Newton and Snieder, 2012; Aydin et al., 2018). The motion of the building mainly depends on the excitation, the coupling of the building to the ground, the size and the mechanical properties of the building(Toshihide, 2017; Anna et al., 2021; Todorovska et al., 2021). The velocity of shear wave and intrinsic attenuation in the building are dominant parameters for the building response. They control the motion and the modal frequencies of the building under a given excitation. We need to separate the response of the building from the excitation and the coupling to the ground by measuring the shear wave velocity and damping ratio. Advancing the measurement of shear wave velocity and attenuation helps to accurately describe the response of the building.
Skolnik (2005) studied the response and system identification of the building using the vibration-based approach with the assumption that the responses are synchronous at different levels. It has been proved that seismic interferometry is a valid mathematical technique to reveal system parameters as well (Mordret et al., 2017; Wen and Kalkan, 2021). Wave deconvolution is frequently applied in system identification and damage detection (Wen and Kalkan, 2017; Nakata, et al., 2015).In fact, seismic responses are the result of wave propagation and there are wave phenomena playing an important role in understanding the building response and identification the structural characteristics (Zhang, et al., 2011; Cheng, et al, 2014; Ebrahimian and Todorovska, 2014 and 2015; Rahmani, et al, 2015a and 2015b). The focus of this work is to examine the validity of the wave deconvolution in building system identification.The response analysis of buildings indicates that wave deconvolution method is effective and it can be used to accurately extract the building response. It betters the understanding for the building dynamic response to earthquake shaking and explains the interpretation of wave propagation pattern in buildings.
2. Metrology
2.1. Analysis Procedure and Wave Deconvolution Theory
The response characteristics can be extracted from wave deconvolution (Rahmani and Todorovska, 2015;Wen et al.,2022). For buildings with health monitoring system, earthquake recordings are frequently obtained on different levels.The response of the buildings is derived by deconvolving the waves recorded at floor levels in the building either with recording on the basement or the signal recorded on the roof. The analysis procedure is demonstrated in the flowchart of Figure 1. With wave deconvolution, the impulse response between two signals is constructed to indicate the information on building response. The impulse response is utilized to identify the normal mode of the building and wave propagating in the building. Based on normal mode and wave propagation, shear wave velocity and damping ratio can be unraveled. The frequency and damping ratio extracted from wave deconvolution are adopted to calibrate and update the computer model of buildings. The simulated response of the updated model has a good match with actual recorded earthquake in displacement calibration.
The response of the buildings is extracted by deconvolving the waves recorded at all floors either using the signal recorded at the basement or the signal recorded at the roof (Nilgün and Şafak, 2019). For two signals and in the frequency domain, deconvolution is defined as:
Eq. (1) is unstable when approaches to zero. Thus, an estimatoris used to stabilize Eq. (1) and deconvolution is changed into:
where the asterisk denotes the complex conjugation. Whenis zero, this expression reduces to Eq. (1). In this study, the parameter ε was set to 5% of the average spectral power.
A one-dimensional shear wave propagation model is introduced with the assumption that the viscous damping ratio is independent of the frequency. The shear wave propagates from basement to the roof, and reflects back from roof downward to the basement. The waves attenuate during the propagation due to damping. With travel distance L and constant damping ratio, this attenuation model is described as:
In Eq. (3), Vs stands for the shear wave velocity. The damping ratio is where Q is the quality factor. In frequency domain, the deconvolution of the motion at the height z with the basement signal is denoted as:
The deconvolution with the signal at the roof is:
The wavenumber is defined by:
The motion at height z in time domain is defined as:
where H is the building height, s stands for the input ground motion at the basement, and r is the reflection coefficient of the basement. With the sum of the upward- and downward-traveling waves and the attenuation assumption, the motion at height z in frequency domain is expressed as:
In Eq. (8), denotes the input ground motion at the basement, and is the reflection coefficient of the basement. They are transformed from parameters s and r in the time domain. The reflection coefficient is the function of frequency. Eq. (8) suggests that the amplitudes and phases are altered when the upward and downward going waves cross from one floor to another due to reflections at the interface. These alterations are characterized by the reflection coefficient , and are different for upward- and downward-going waves. With Eq. (8), and are converted as:
When ,the deconvolved waveforms are changed into the sum of the damped modes:
with
In Eq. (12), the sum is exponentially damping. The fundamental mode with m = 0 has the smallest damping. That means for larger time (), the fundamental mode dominates. Hence,
and the resonance frequency becomes:
The period corresponding to the angular frequency is given by
From the Eq. (6) and (10), if there is no attenuation, the deconvolved waves with the roof recording in the time domain is given by a superposition of upward- and downward-propagating delta functions as in the following:
The aforementioned are the fundamental theory of wave deconvolution (Sneider and Safak, 2006), frequently applied for seismic-interferometry analysis. Based on the theory, dynamic response characteristic is analyzed for the UCLA Factor Building.
2.2. Building Instrumentation and Monitoring Data
The UCLA Factor Building, shown in Figure 2a), a 15-story high-instrumented steel moment resisting frame building with a basement is selected as an example to carry out the wave deconvolution analysis and finite element model calibration.This steel moment frame structure stands at 234 feet tall, and has 15 stories above ground with one full basement and one partial basement. Typical floors for floor one through floor nine, and floor ten through fifteen are shown in Figure 2b) and Figure 2c), respectively. Floors one through nine have a rectangular shape with protrusions in all four corners, and a wing that extends outwards in the west side. The dimensions of the rectangular portion are 126 ft-4 in by 74 ft-4 in, and dimensions of the wing on the east side are roughly 35 ft-6 in by 24-ft 5 in. From tenth floor to the roof, the main rectangular portion bulges outwards in both the east and west directions 4 ft-2 in and 13 ft-10 in, respectively. 35 columns support the building from first floor through ninth. Floors ten through the roof use 44 columns. Eight steel tube sections are used to support the protrusions in the corners of the building. All of the beams are assumed to be connected using moment resisting connections. With the exception of the steel tube sections, all of the steel sections used in this building are typical W-section. The building is supported by spread footings at its foundation.
The seismic array installed in the Factor Building consists of 72 force-balanced accelerometers (Kinemetrics FBA-11) that have been set up on every floor. The force-balance accelerometer sensors have a natural frequency of 50 Hz, normal damping at 70% of critical, and a dynamic range of 135 dB from 0.01 to 50 Hz. The output range scale is ±4 g. The locations of accelerometers are demonstrated in Figure 3a). Each floor is typically instrumented by four uniaxial sensors: One in the north, south, east, and west. The accelerometers installed in the north-south directions are parallel to each other, and similarly sensors in the east-west direction are parallel to each other. In both basements, two uniaxial sensors are installed orthogonally to measure horizontal motions, and two uniaxial sensors are aligned vertically to record vertical motions apart from each other in order to compute building’s rocking motion. In 2003 the U.S. Geological Survey’s National Strong Motion Project updated 18-bit data-loggers with 24-bit IP-based data loggers and fiber-optic data transmission to improve real-time seismic monitoring. In 2005, a 100-m-deep borehole and an overhead surface accelerometers were installed in the nearby Botanical Gardens approximately 25 m away from the building. They consist of a three-component shallow 1 g accelerometer at 100 m depth and a 2 g accelerometer at the surface. The accelerometer network in the Factor Building is continuously recording data, and the data is being archived for public use at the IRIS Data Management Center. The recorded motions during the 2004 M6.0 (M = moment magnitude) Parkfield Earthquake are chosen for this study. The epicentral distance of this earthquake is approximately 260 km away from the building. Figure 3b) and c) show the recorded waveforms in the east-west and north-south directions, and inferred torsion from first basement to fifteenth floor. The peak acceleration at the roof is about 0.25% g in the east-west direction, and about 0.20% g in the north-south direction. The building response was essentially linear-elastic at such low intensity. For this earthquake, the P waves arrive at about 10 sec. The S waves with strongest phase arrive at about 35 sec. The amplified long period surface waves due to basin structure in Los Angeles (Hatayama and Kalkan, 2011) that arrive at t = 75 sec excite a resonance in the building with an amplitude that increases with the floor level. The recordings are analyzed with wave deconvolution to obtain the dynamic characteristic parameters.
2.3. Wave Deconvolution Analysis
The motions in the east-west direction are deconvolved with motions recorded at different floor levels. Figure 4a) shows the waveforms through the height of the building deconvolved with the recorded signal at the basement in the east-west direction. Because a signal deconvolved with the signal itself is a delta function, the deconvolved wave at level B1 is a single spike. This impulse signal propagating upward is a fictitious input to excite the building. The deconvolved waves at all the floors are triggered by the input impulse, that is, there are no waves at all levels before the impulse appears. The first onset of the deconvolved waves starts with an upward-propagating wave. It is well observed that time delay between the peaks increase with levels. The wave travels upward to the roof and is reflected by the roof. The roof reflection generates the second peak in the deconvolved waves. The reflected wave propagates downward to level B1 and generates another upward-going impulsive wave. The cycle of upward- and downward-propagating waves goes on with time. As Eq. (9) and (11) indicated, an infinite number of cycles form the deconvolved waves. For the early time (0-3s), the deconvolved waves consist of the superposition of upward- and downward- propagating waves. It is difficult to identify the individual upward-going and downward-going waves due to the wave interference. The later part (>3s), however, consists of standing waves as the resonance of the building excited by the input impulse signal. This resonance grows in amplitude with the floor level and is fairly monochromatic.
When earthquake waves propagate to the building, the low frequency components are transmitted to the building, while the high-frequency components are blocked. With this low frequency, the reflection coefficients on the floors are small. Reflection coefficient for upward traveling waves on the free surface, however, approaches one (Safak, 1999) and is much bigger than that on each floor. Thus, the wave is reflected only by the roof and there is no reflection by the floors. Eq. (10) and (16), as well, indicate that the waveforms deconvolved with the signal at the roof consist of the superposition of one upward going wave and one downward traveling wave. The waveforms are much simpler than that deconvolved with the basement signal as shown in Figure 4b). The simplicity of the deconvolved waveforms suggests that the wave propagation is essentially one-dimensional for the employed frequencies. The reflection coefficient for elastic waves by a floor in the building depends on the product of the frequency and the mass of the floor. No reflection by the floors lies on the fact that the frequencies used for wave deconvolution analysis is relatively low. On the other hand, the dominant wavelength of the shear waves spans several floors and this further suppresses reflections generated by the individual floor. When the frequencies are higher than that employed here, wavelength is smaller than the height of the floors. The deconvolved wave may be complicated with the reflections by the individual floor during the wave propagating in the building.
The deconvolved waveforms in north-south direction and the torsion indicate the similar characteristics with that obtained in east-west direction. The size difference in east-west and north-south directions leads to different stiffness. Therefore, the shear waves in east-west and north-south directions travel in various velocities.
The normal modes in the deconvolved response indicated by Eq. (11) only depend on the characteristics of the building. Because the fundamental mode is dominant, Eq. (13), (14) and (15) are used to extract the response of the Factor Building with the deconvolved waveforms in two directions. Eq. (12) gives the deconvolved waves with the superposition of an upward going and a downward going wave. Based on the deconvolved waveforms with the signal at basement and that at roof, the shear wave velocity and damping ratio are determined to check the consistency of wave deconvolution.
The cross power spectra of the deconvolved waves in Figure 4a) indicate pronounced peaks at 0.468 Hz and 1.526 Hz in east-west direction, shown in Figure 5a). The frequencies are also inferred at 0.505 Hz and 1.624Hz in north-south direction and 0.521 Hz and 1.644 Hz for torsions. These frequencies are the first two-order modal frequencies for the Factor Building. The dominant frequencies obtained in wave deconvolution are reported in Column 2 in Table 1. These values reflect the monochromatic nature of the resonance in two horizontal directions and vertical direction. With the frequencies and the total height of the building measured to the second basement, 74.8 m, shear wave velocities in east-west and north-south directions are computed as 140.0 m/s and 151.1 m/s by using Eq. (15).
The arrival times of the upward and downward propagating waves are measured by picking the peak values of these waves, demonstrated by the circles in Figure 4 b) for east-west direction. For the upward-propagating wave, travel distances relative to the roof are given a negative value and for downward travelling wave, the distances are positive. Using arrival times and the distances, the measurements in east-west direction shown in Figure 5 b) display a fairly linear dependence of the travel time with distance. This indicates constant shear wave velocities in east-west direction. By fitting a straight line, the slope of the line for East-West direction is 0.0068 and the proximity of the shear wave velocity is inferred as 147.1 m/s. In north-south direction, the line is fitted and its slope is 0.0065. Therefore, the shear wave velocity is determined at 153.8 m/s. Shear wave velocities predicted by the wave propagating and the normal modes are practically identical. The differences are 5.1% in east-west direction and 1.8% in north-south direction individually. These differences are expected because the frequencies derived from wave deconvolution are based on the assumption of homogeneous medium with uniform mass and stiffness properties.
With arrival times a straight line is fitted to predict the shear wave velocity. The slope of the line for east-west direction is 0.0068 and the proximity of the shear wave velocity is inferred as 147.1 m/s. With the arrival times at different floors and the floor heights, the shear wave velocities in east-west direction and north-south direction are calculated at all floor. Shear wave velocity profiles in two directions are identified, demonstrated in Figure 6. The trend in two directions is similar. Because of the bulges outwards in plane size at the 10th floor and above, the shear wave velocities change at the identical level. The profile effectively indicates the stiffness variety throughout the building.
Expression (13) indicates the attenuation for the waveforms deconvolved with the signal at the bottom. For the deconvolved waveforms in east-west direction in Figure 4 a), envelopes are applied for the floor 9 to the roof and the natural logarithm of the envelopes are shown in Figure 7 a). Between the time 1 sec and 15 sec, the logarithm decay linearly with time. Therefore, straight lines are fitted for the top nine floors with the solid thick lines to extract the attenuation. Because the slopes depend on the attenuation, the floor number is added to each curve for clarity. This offset does not influence the result because the slopes do not change with the offset. The deconvolved waveforms in north-south direction are analyzed in a similar way with the time from 1 sec to 10 sec in the logarithm of the envelopes. The slopes in east-west and north-south directions are listed in Table 2. Average slopes in east-west and north-south directions are adopted to compute the damping ratios in the two directions. The slope is equal to (-ω0/2Q). With resonance frequency 0.468 Hz in east-west direction and 0.505 Hz in north-south direction, the quality factors in both directions are similar with the value of 10.8. Thus, the estimated damping ratio in the Factor Building is about 5%.
Eq. (10) indicates the propagating waves decay during travelling in the building for the waveforms deconvolved with the signals at the roof. As testified in Figure 4 b), the amplitudes of downward travelling waves are consistently smaller than these of the upward propagating ones. The propagating waves decay with distance as exp(-πfz/QV_s). To quantify the attenuation, the ratios of the amplitude of the downward going waves and the upward going ones are computed and the two-way distance is measured relative to the roof. The relation between the natural logarithm of the ratio and the two-way distance is also fitted by a straight line in east-west direction and north-south direction individually shown in Figure 7 b). The frequency of deconvolved waves is about 2.75 Hz in east-west direction and 3.25 Hz in north-south direction. With the shear wave velocities and quality factors in two directions, the fitted lines suggest the similar attenuation with distance in the Factor Building.
3. Results and Discussion
The fundamental frequencies of the Factor Building are also estimated directly from the power spectra of the building response during Parkfield Earthquake at various floors, and reported in Colum 3 in Table 1. Three-dimensional finite element model of the building was created in OpenSEES (2009). The model consists of 962 nodes, 1442 beams and 714 columns. Material parameters are defined as the uniaxial material steel with elasticity modulus 29000 lb /inch2, yield strength 60 lb /inch2, shear modulus 11154 lb/inch2 and the hardening ratio 0.02.The resonant frequency identified from wave deconvolution in east-west and north-south directions and the aforementioned first nine frequencies identified using power spectra were used to calibrate the computer model. The first nine modes are computed and demonstrated in Figure 8 a). They are in EW direction, NS direction and Torsion. Frequency calibrating is used for model updating. Mass and stiffness distribution is adjusted to revise the fundamental frequencies until they incline to the frequency identified from recordings. Mode shapes are simultaneously updated to eliminate the differences. The updated frequencies are listed in Column 4 in Table 1. The first and the second modes obtained from the earthquake data and simulated are compared and demonstrated in Figure 8 b).
After updating the model, the Rayleigh damping is applied in the model. By adopting the damping ratio 5% inferred from deconvolution, as indicated in Figure 9 a), the Rayleigh damping is applied and the mass coefficient in combination with stiffness coefficient is calculated with the values of 0.2537 and 0.0047. With these parameters, dynamic analysis is carried out for this updated model. The east-west and north-south recordings at basement one for the Parkfield Earthquake are used as input ground motions. Relative displacements are compared between the recorded data and the computed data in Figure 9 b). Displacement calibration indicates they have a good match and the model is satisfactory at least in linear state.
4. Conclusions
Wave deconvolution is applied to extract the normal mode and the wave propagating in the horizontal directions for the Factor Building. The deconvolved waves can be used to estimate the shear wave velocity and attenuation. The waves deconvolved with the motion at the roof indicate upward- and downward-going waves. The waveforms deconvolved with the motion at the basement imply the fundamental mode of the building. The frequency and decay with time constrain the shear velocity and attenuation. The velocity is measured using the arrival times picked from these propagating waves and computed directly by the expression 4Hf indicated by the normal mode. The natural logarithm of the envelopes for the deconvolved waves in the top nine floors constrains the damping ratio. The shear wave velocity estimated from the deconvolved waves with the roof signal have a good match with these inferred from the waveforms deconvolved with the basement recording. This consistency suggests that the wave deconvolution extracts the response of the building from the excitation and ground coupling. With the information acquired from the deconvolved waves, the model of the building is calibrated and updated in detail. The analysis validate the effectiveness of the wave deconvolution in building system identification.It can be used to accurately extract the building response. Wave deconvolution interprets the wave propagation pattern in buildings and helps improve the understanding for the building dynamic response to earthquake shaking.This study expands the application of building health monitoring data and suggests a new viewpoint to learn about the build dynamics characteristics. Comparing to the corresponding studies in seismic interferometry, based on the higher sample rate, the results are more accurate. It is suggested in practice that sampling rate is strictly restricted to obtain the ideal results.
Acknowledgments
We would like to thank the anonymous reviewers for thorough reviews, which helped to improve the technical quality and presentation of this article. Special thanks are extended to Skolnik Derek for providing the waveform data. We also thank Erol Kalkan for fruitful discussions on deconvolution and for sharing his computer codes, which we modified significantly for this study. The research is supported by the Scientific Research Fund of Multi-Functional Shaking Tables Laboratory of Beijing University of Civil Engineering and Architecture,the Program of Science for Earthquake Resilience, and the General Program of Science and Technology Programs (Grant KT1626&KT2303, No.XH23002A and No.BJMS-2022002, respectively).
References
- Anna Maria Skłodowska1, Caroline Holden,, Philippe Guéguen, John Finnegan, Geoff Sidwell, 2021. Structural change detection applying long-term seismic interferometry by deconvolution method to a modern civil engineering structure (New Zealand), Bull. Earthq. Eng., 19, 3551-3569. [CrossRef]
- Aydin Ozmutlu, Mahdi Ebrahimian, Maria I. Todorovska, 2018. Wave Propagation in Buildings as Periodic Structures: Timoshenko Beam with Rigid Floor Slabs Mode, Journal of Engineering Mechanics, 144, no.4, 04018010-04018010. [CrossRef]
- Cheng, M. H., M. D. Kohler, and T. H. Heaton, 2015. Prediction of wave propagation in buildings using data from a single seismometer, Bull. Seismol. Soc. Am. 105, no. 1, 107–119. [CrossRef]
- Clinton, J. F., S. C. Bradford, T. H. Heaton, and J. Favela, 2006. The observed wander of the natural frequencies in a structure, Bull. Seismol. Soc. Am., 96, 237–257. [CrossRef]
- Ebrahimian, M., and M. I. Todorovska, 2014. Wave propagation in a Timoshenko beam building model, J. Eng. Mech. 140, no. 5. [CrossRef]
- Ebrahimian, M., and M. I. Todorovska, 2015. Structural system identification of buildings by a wave method based on a nonuniform Timoshenko beam model, J. Eng. Mech. 141, no. 8. [CrossRef]
- Hatayama, K. and Kalkan, E., 2011. Long-Period (3 to 10 s) Ground Motions in and around the Los Angeles Basin during the Mw7.2 El-Mayor Cucapah Earthquake of April 4, 2010. Proc. of the 4th IASPEI / IAEE International Symposium, August 23–26, University of California Santa Barbara, 1-11.
- Kohler, M. D., T. H. Heaton, S. C. Bradford, 2007. Propagating waves in the steel, moment-frame Factor Building recorded during earthquakes: Bull. Seismol. Soc. Am., 97, 1334-1345. [CrossRef]
- Kohler, M. D., P. M. Davis, and E. Safak, 2005. Earthquake and ambient vibration monitoring of the steel frame UCLA Factor building, Earthquake Spectra, 21(3): 715–736. DOI:10.1193/1.1946707.
- Mordret A., Sun H., Prieto G. A., Toksöz M. N., Büyüköztürk O., 2017. Continuous Monitoring of High-Rise Buildings Using Seismic Interferometry. Bull. Seismol. Soc. Am. 107, no.6, 2759-2773. [CrossRef]
- Nakata, N., W. Tanaka, and Y. Oda, 2015 . Damage detection of a building caused by the 2011 Tohoku-Oki earthquake with seismic interferometry, Bull. Seismol. Soc. Am. 105, 2411–2419. [CrossRef]
- Newton, C., and Snieder, R., 2012. Estimating intrinsic attenuation of a building using deconvolution interferometry and time reversal, 102, 2200-2208. [CrossRef]
- Nilgün Çağlar , Şafak Erdal, 2019, Application of Travelling Wave Method for dynamic analysis of plane frame structures, Bulletin of Earthquake Engineering,17,no.3,1361-1377. [CrossRef]
- OpenSees, 2009.Open Source Finite Element Platform for Earthquake Engineering Simulations, University of California Berkeley, Pacific Earthquake Engineering Center, Available online at http://opensees.berkeley.edu/; last accessed on Oct. 2021.
- Rahmani, M., and M. I. Todorovska, 2015. Structural health monitoring of a 54-story steel-frame building using a wave method and earthquake records, Earthq. Spectra 31, no. 1, 501–525. [CrossRef]
- Rahmani, M., M. Ebrahimian, and M. I. Todorovska, 2015a. Wave dispersion in high-rise buildings due to soil-structure interaction, Earthq. Eng. Struct. Dynam. 44, 317–323. DOI:10.1002/eqe.2454.
- Rahmani, M., M. Ebrahimian, and M. I. Todorovska, 2015b. Time-wave velocity analysis for early earthquake damage detection in buildings:Application to a damaged full-scale RC building, Earthq. Eng. Struct. Dynam. 44, no. 4, 619–636. [CrossRef]
- Skolnik, D., 2005. Identification, Model Updating, and Response Prediction of the Louis Factor Building, master’s thesis, University of California, Los Angeles.
- Safak, E., 1999. Wave-propagation formulation of seismic response of multistory buildings, J. Struct. Eng. 125, 426–437. [CrossRef]
- Snieder, R., and Şafak E., 2006. Extracting the building response using seismic interferometry: Theory and application to the Millikan Library in Pasadena, California: Bull. Seismol. Soc. Am., 96, 586-598. [CrossRef]
- Todorovska, M. I., S. S. Ivanovic, and M. D. Trifunac, 2001a. Wave propagation in a seven-story reinforced concrete building, I. Theoretical models, Soil Dyn. Earthquake Eng. 21, 211–223. [CrossRef]
- Todorovska, M. I., S. S. Ivanovic, and M. D. Trifunac, 2001b. Wave propagation in a seven-story reinforced concrete building, II. Observed wavenumbers, Soil Dyn. Earthquake Eng. 21, no.3, 225–236. [CrossRef]
- Todorovska Maria, Girmay Eyerusalem, Wang Fangbo, Rahmani Mohammadtaghi, 2021.Wave propagation in a doubly tapered shear beam: Model and application to a pyramid-shaped skyscraper,Earthquake Engineering and Structural Dynamics,51,no.4,764-792. [CrossRef]
- Toshihide Kashima, 2017. Study on changes in dynamic characteristics of high-rise steel-framed buildings based on strong motion data, Procedia Engineering, 199, 194-199. [CrossRef]
- Trifunac, M. D., S. S. Ivanoviḉ, and M. I. Todorovska, 2001a, Apparent periods of a building. I: Fourier analysis: J. Struct. Eng., 127, 517–526. [CrossRef]
- Trifunac, M. D., S. S. Ivanoviḉ, and M. I. Todorovska, 2001b, Apparent periods of a building. II: Time frequency analysis: J. Struct. Eng., 127, 527–537. DOI:10.1061/(ASCE)0733-9445(2001)127:5(527).
- Wen W., and Kalkan E., 2017. System Identification Based on Deconvolution and Cross Correlation: An Application to a 20-Story Instrumented Building in Anchorage, Alaska, Bulletin of the Seismological Society of America, 107(2) , 718-740. [CrossRef]
- Wen Weiping, Kalkan Erol. 2021. Identifying Dynamic Response of a Twenty-Story Instrumented Building to 2018 M7.1 Anchorage, Alaska Earthquake and Its Aftershocks, Journal of Earthquake Engineering. [CrossRef]
- Wen Weiping, Li Xiulin, Ji Duofa, Zhai Changhai, 2022. Seismic damage detection of an instrumented RC frame structure with deconvolution interferometry, Soil Dynamics and Earthquake Engineering, 155, 107170-107170. [CrossRef]
- Zhang, R.,R., Snieder, R., Gargab, L., and Seibi, A., 2011. Modeling of seismic wave motion in high-rise buildings. Probabilistic Engineering Mechanics, 26, 520-527. [CrossRef]
Figure 1.
The flowchar for wave deconvolution analysis and model calibration.
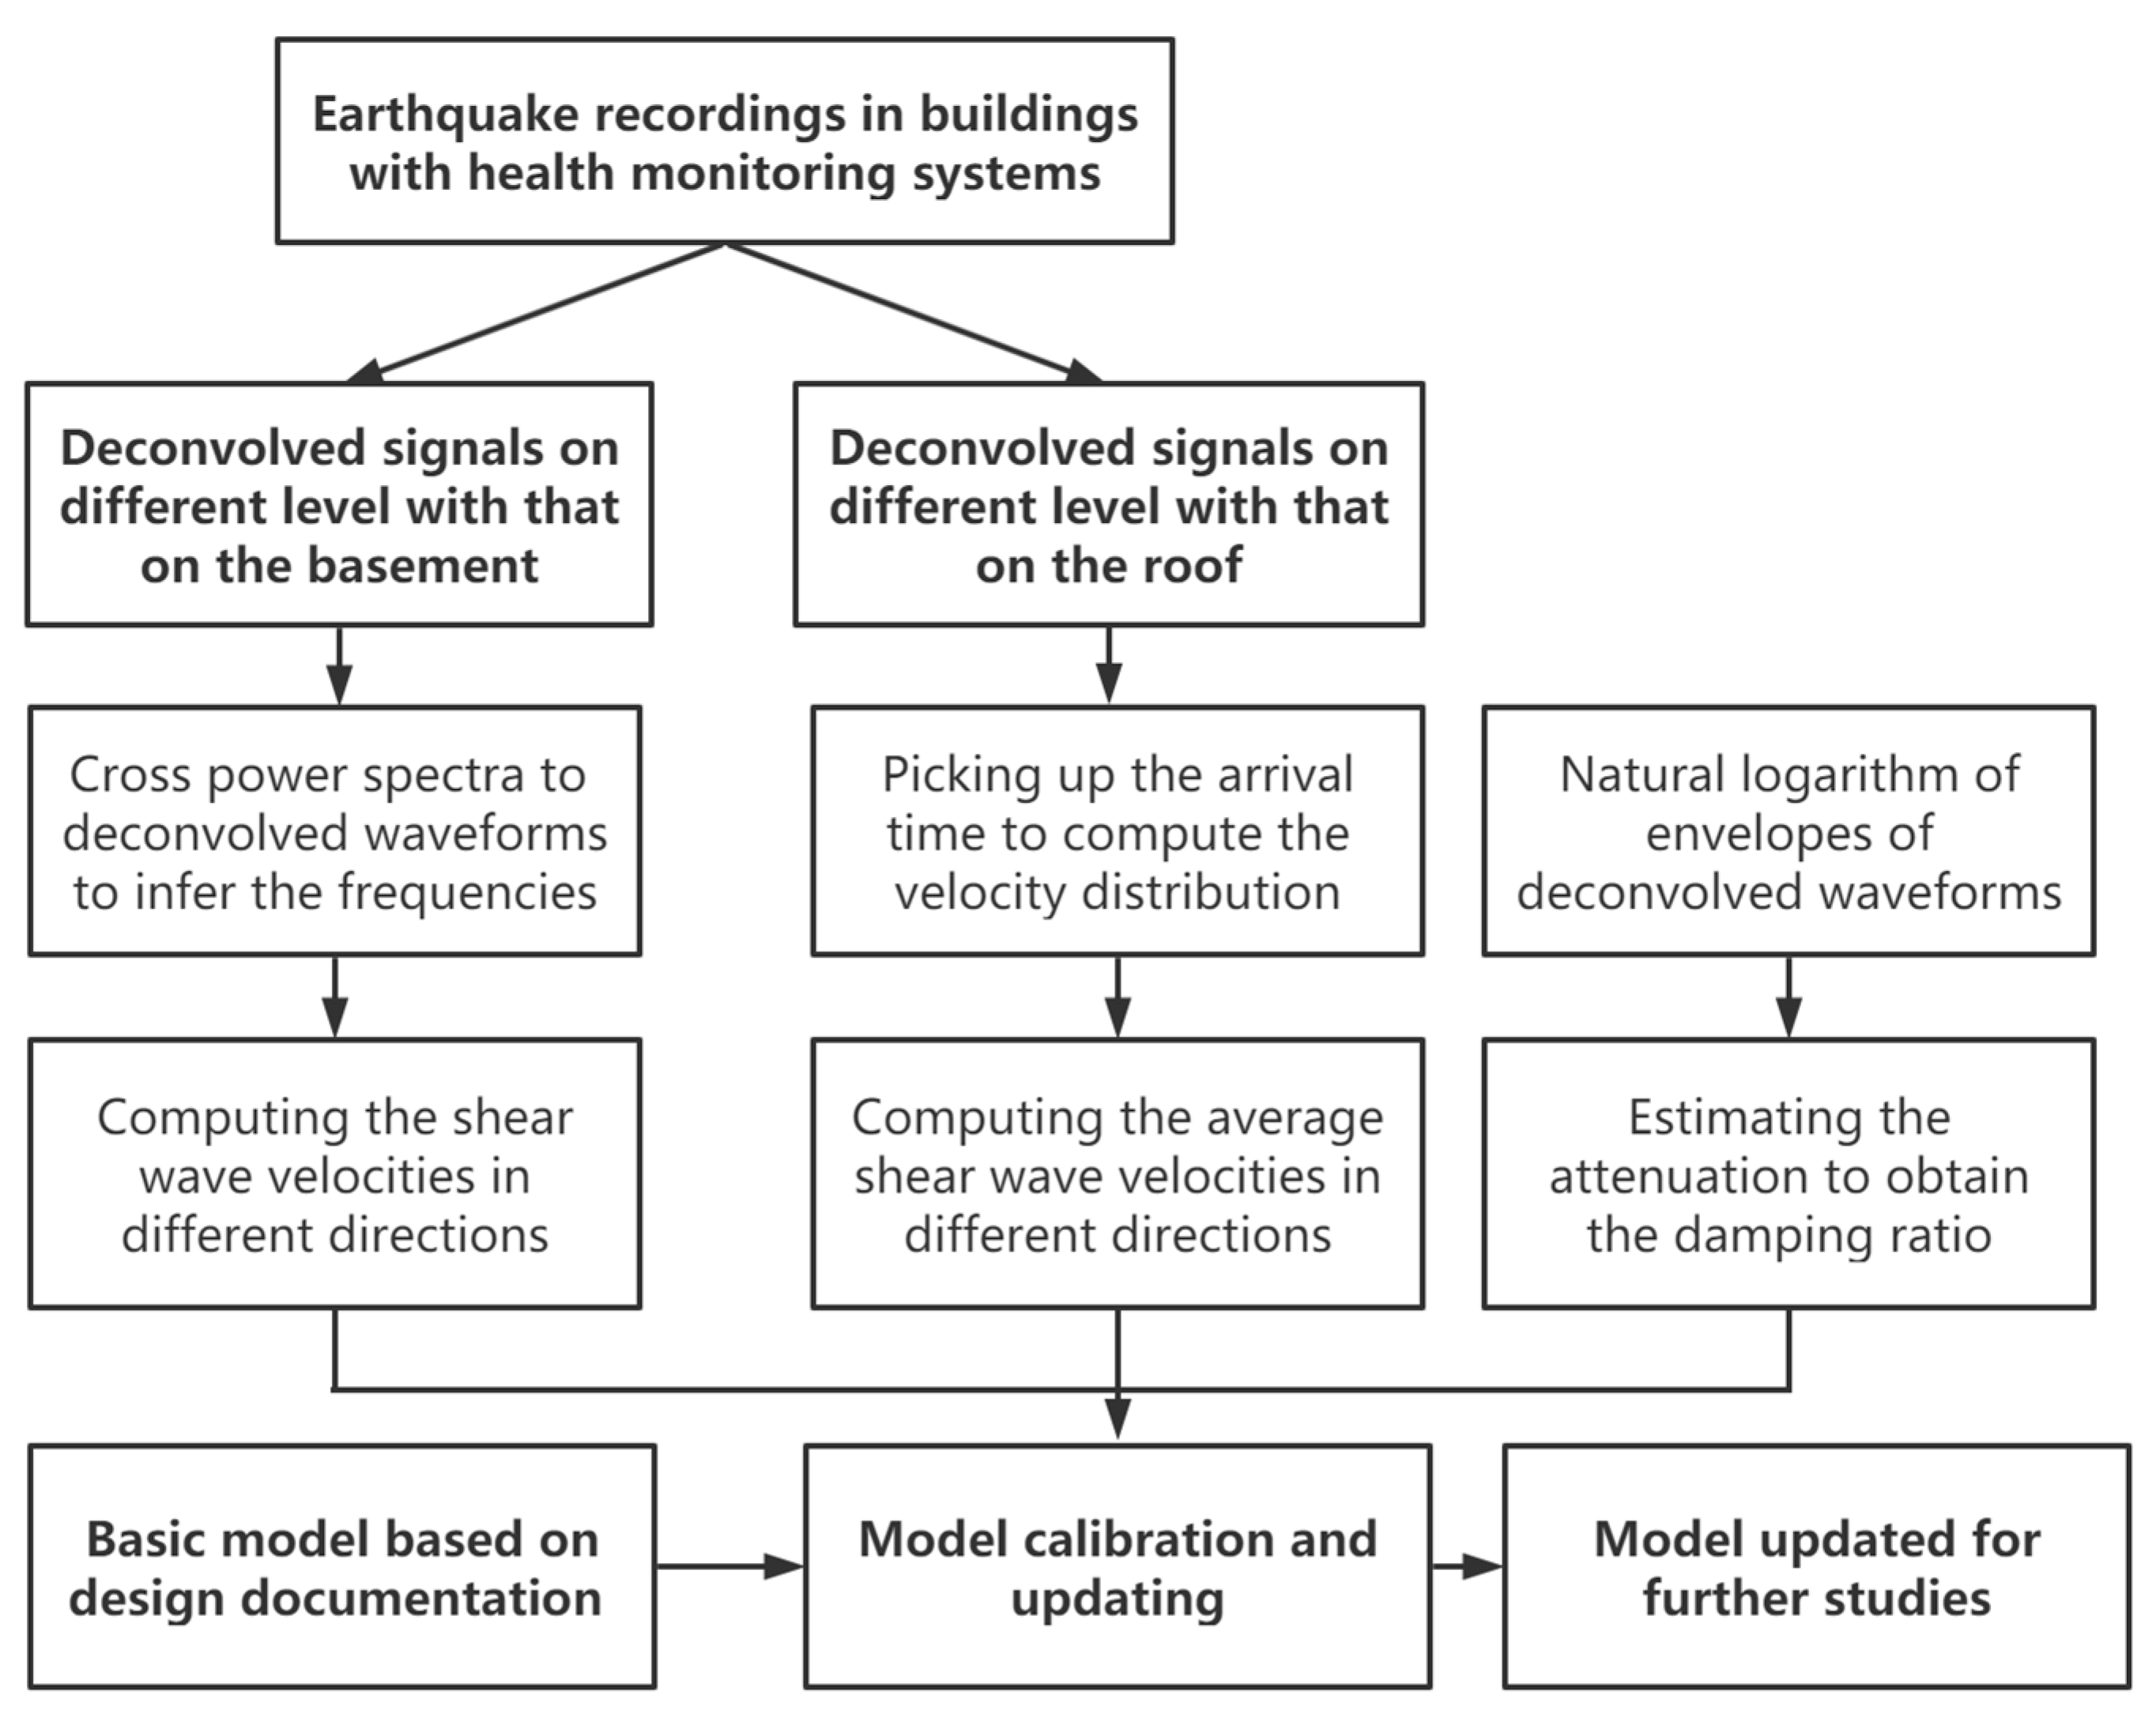
Figure 2.
a), Front Elevation of the Factor Building. b), Typical plan view for Floor B1 to 9. c), Typical plan view for Floor 10 to 15. The plane size changes on Floor 10.
Figure 2.
a), Front Elevation of the Factor Building. b), Typical plan view for Floor B1 to 9. c), Typical plan view for Floor 10 to 15. The plane size changes on Floor 10.
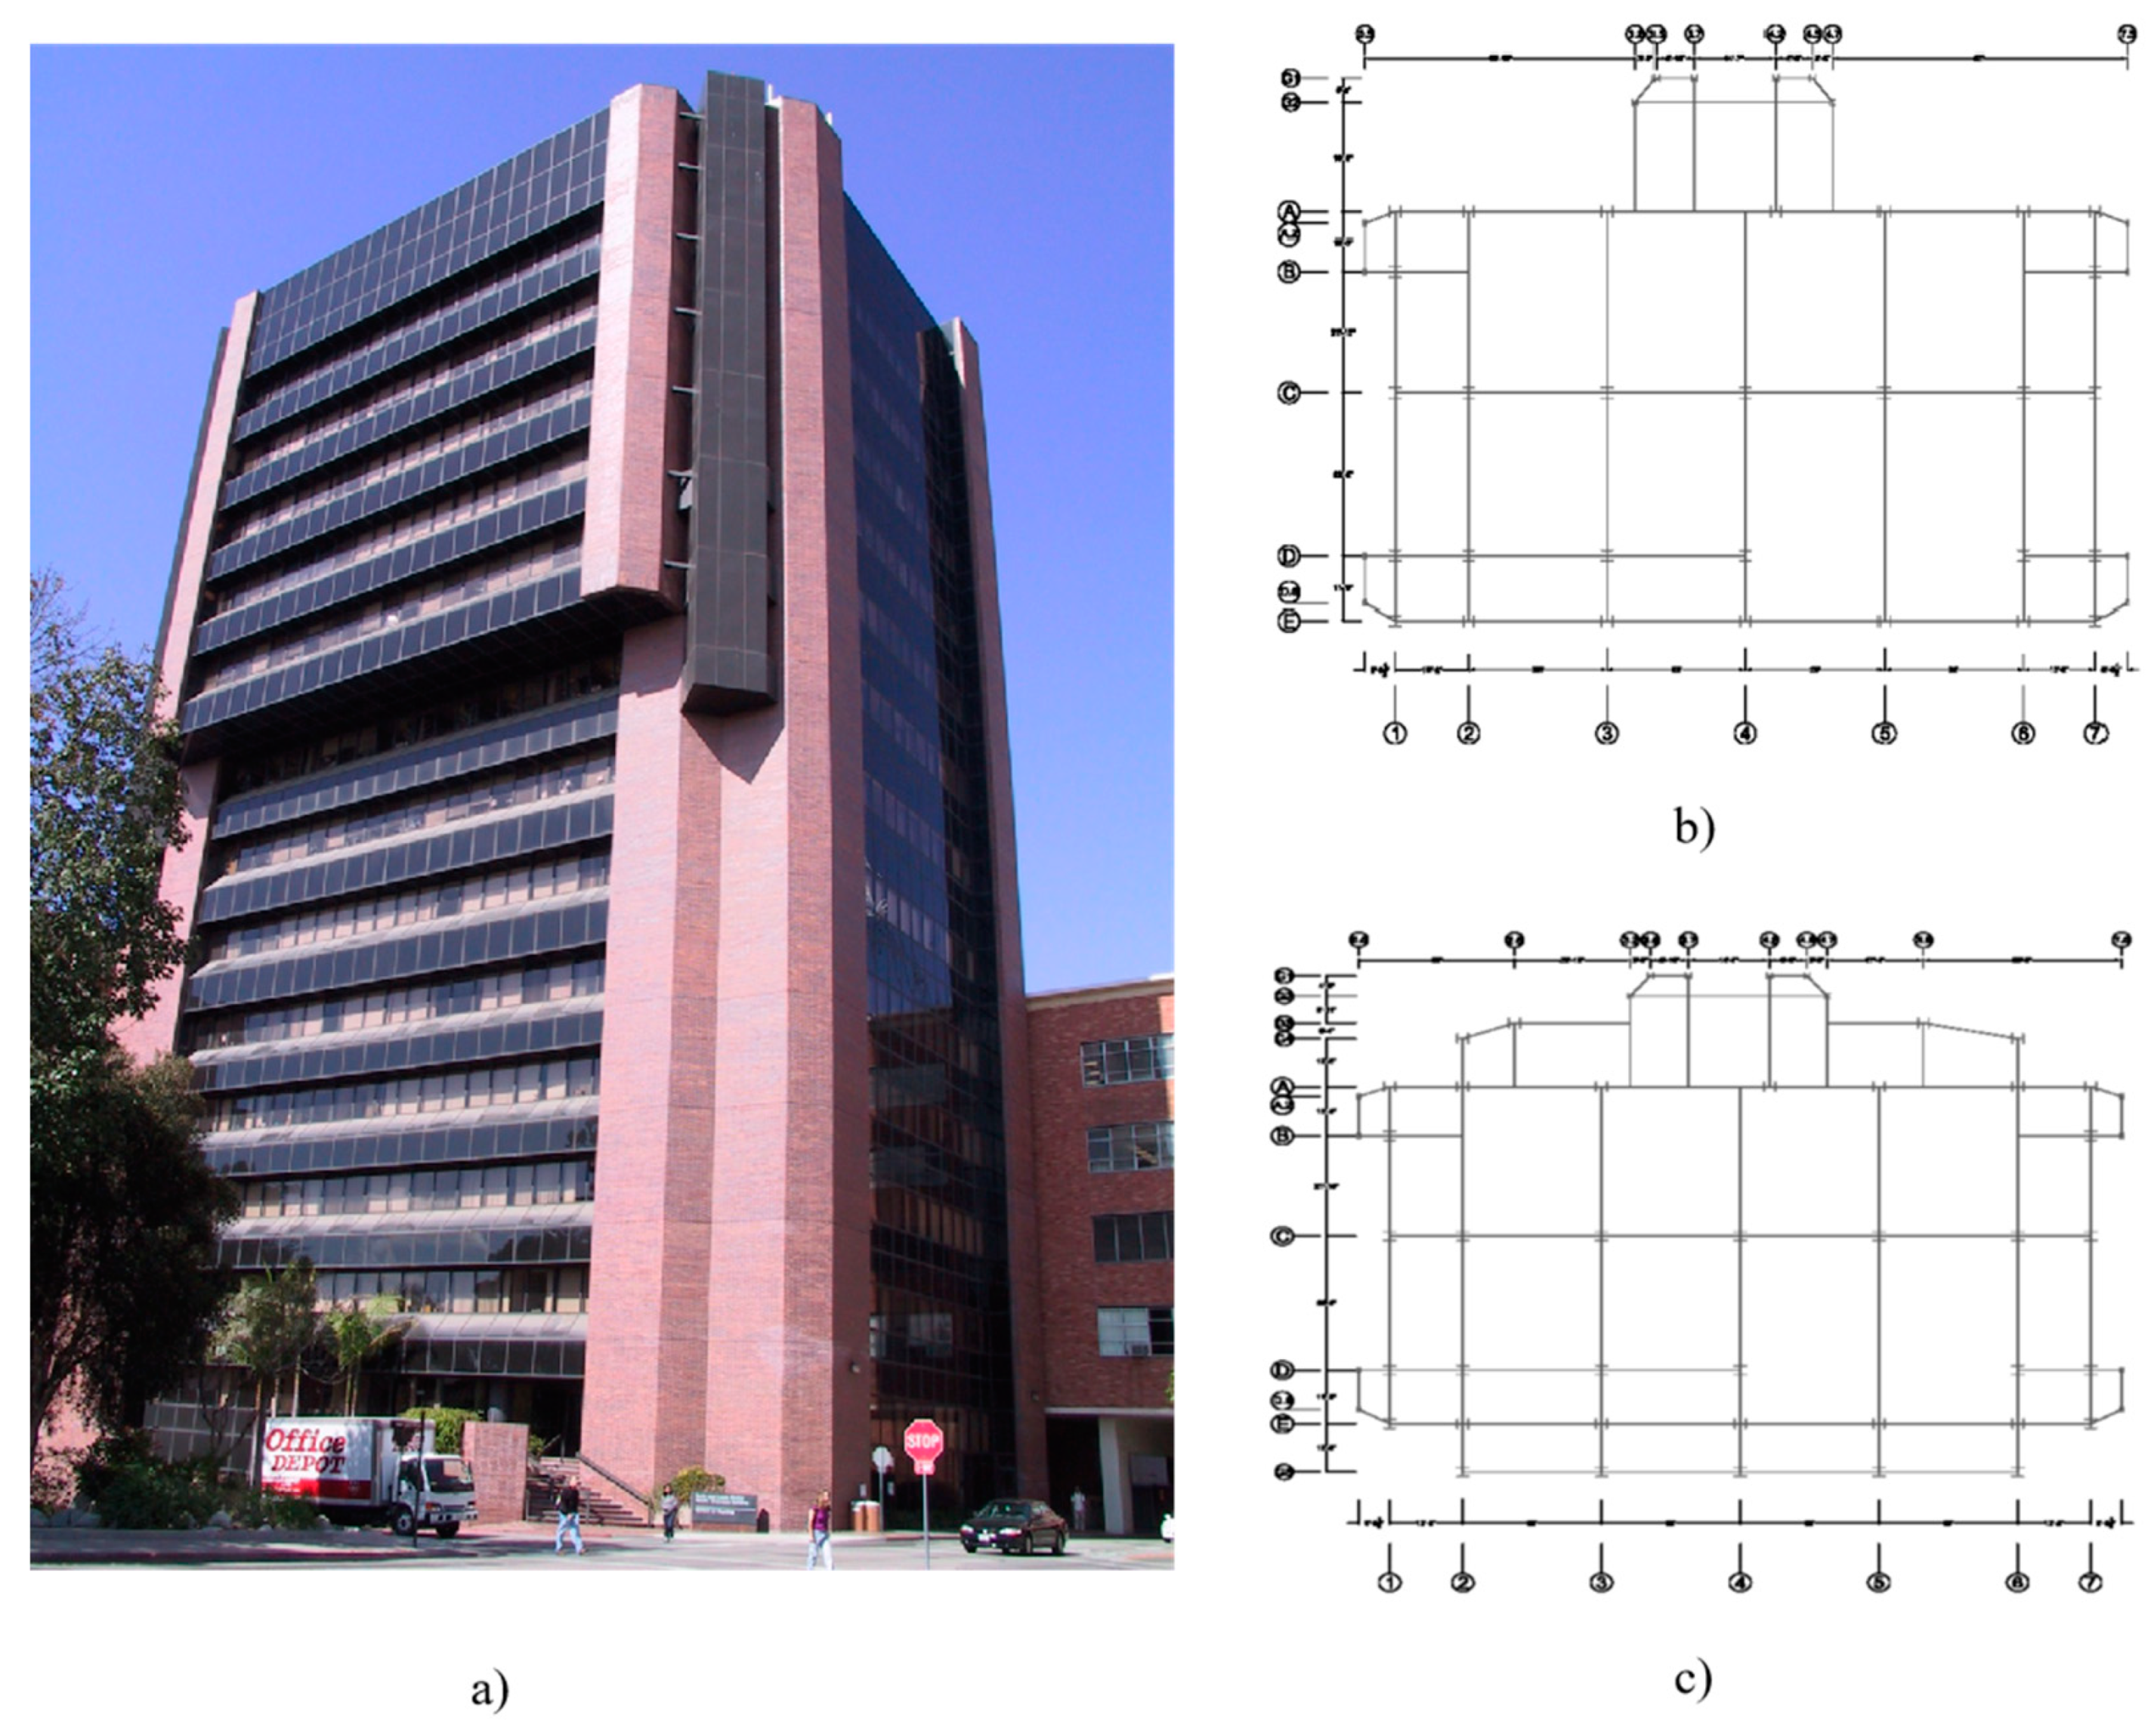
Figure 3.
a), Layout of sensors instrumented in the UCLA Factor Building; b), East–west (EW) direction acceleration waveforms recorded in Parkfield Earthquake; c), North-South (NS) direction acceleration waveforms.
Figure 3.
a), Layout of sensors instrumented in the UCLA Factor Building; b), East–west (EW) direction acceleration waveforms recorded in Parkfield Earthquake; c), North-South (NS) direction acceleration waveforms.
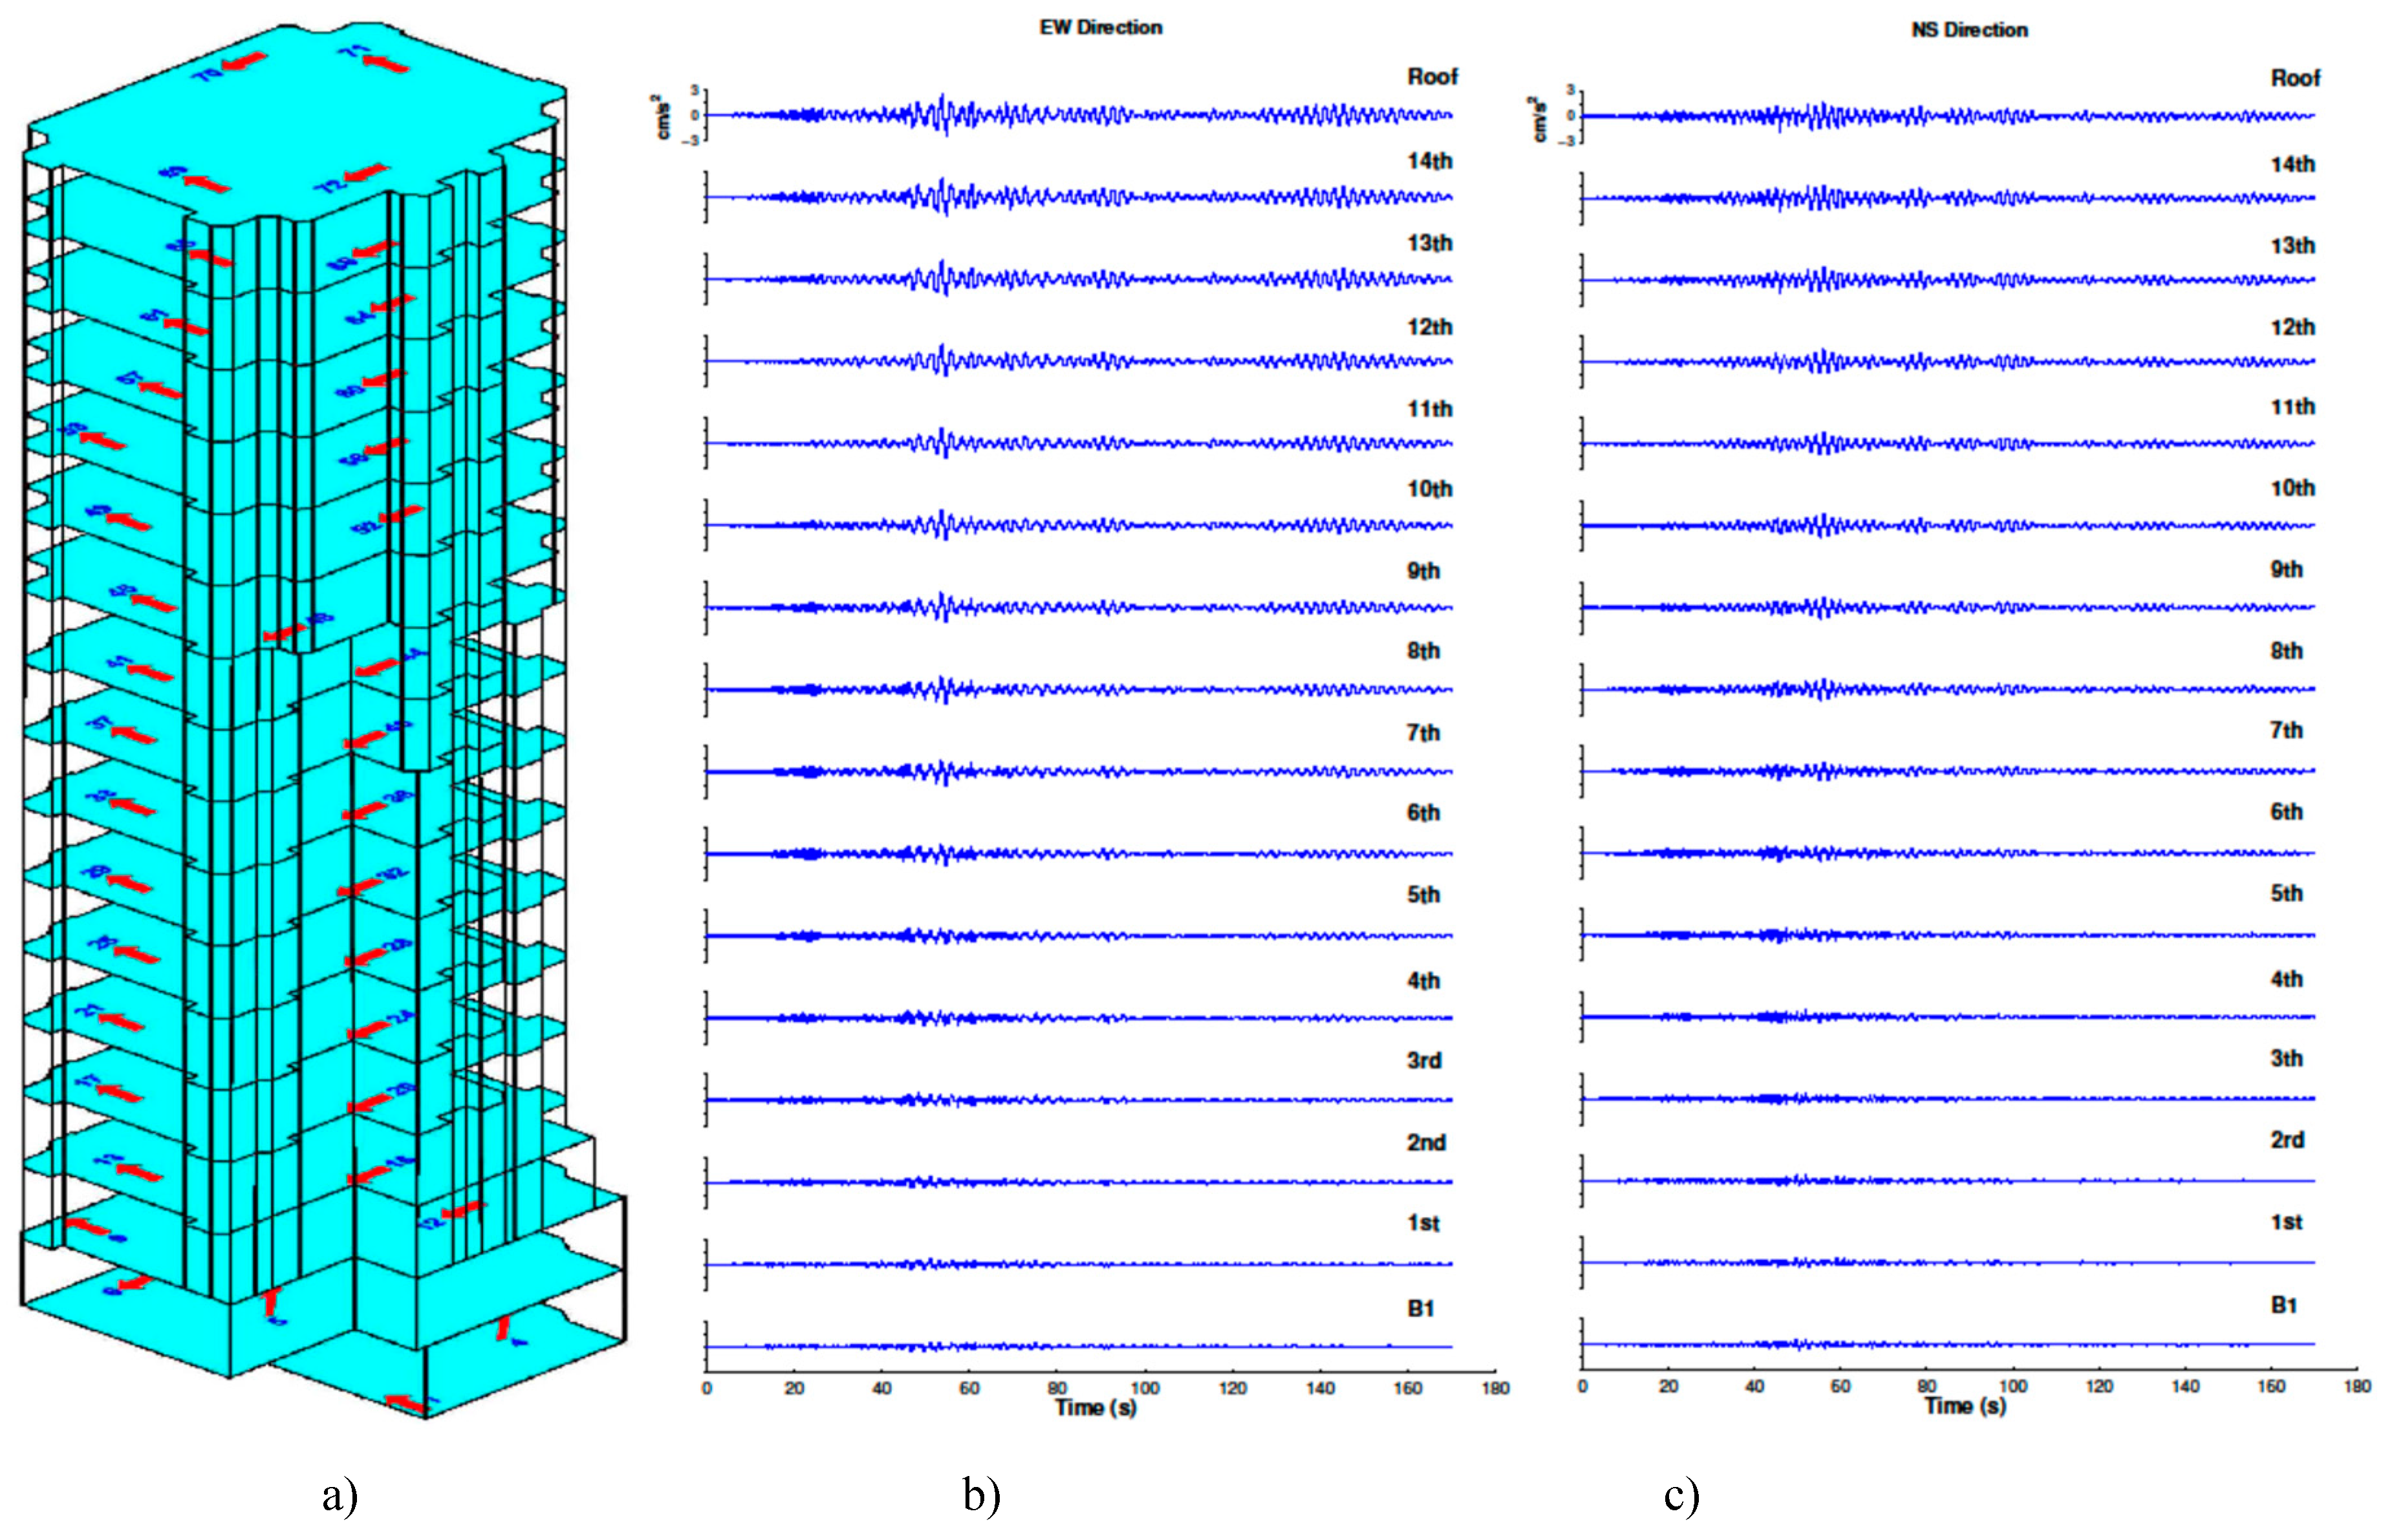
Figure 4.
a), Deconvolved waveforms with the signal recorded at the basement. b), Deconvolved waveforms with the signal recorded at the roof and peak values of upward and downward propagating waves picked with red circles for upward propagating waves and green circles for downward propagating waves.
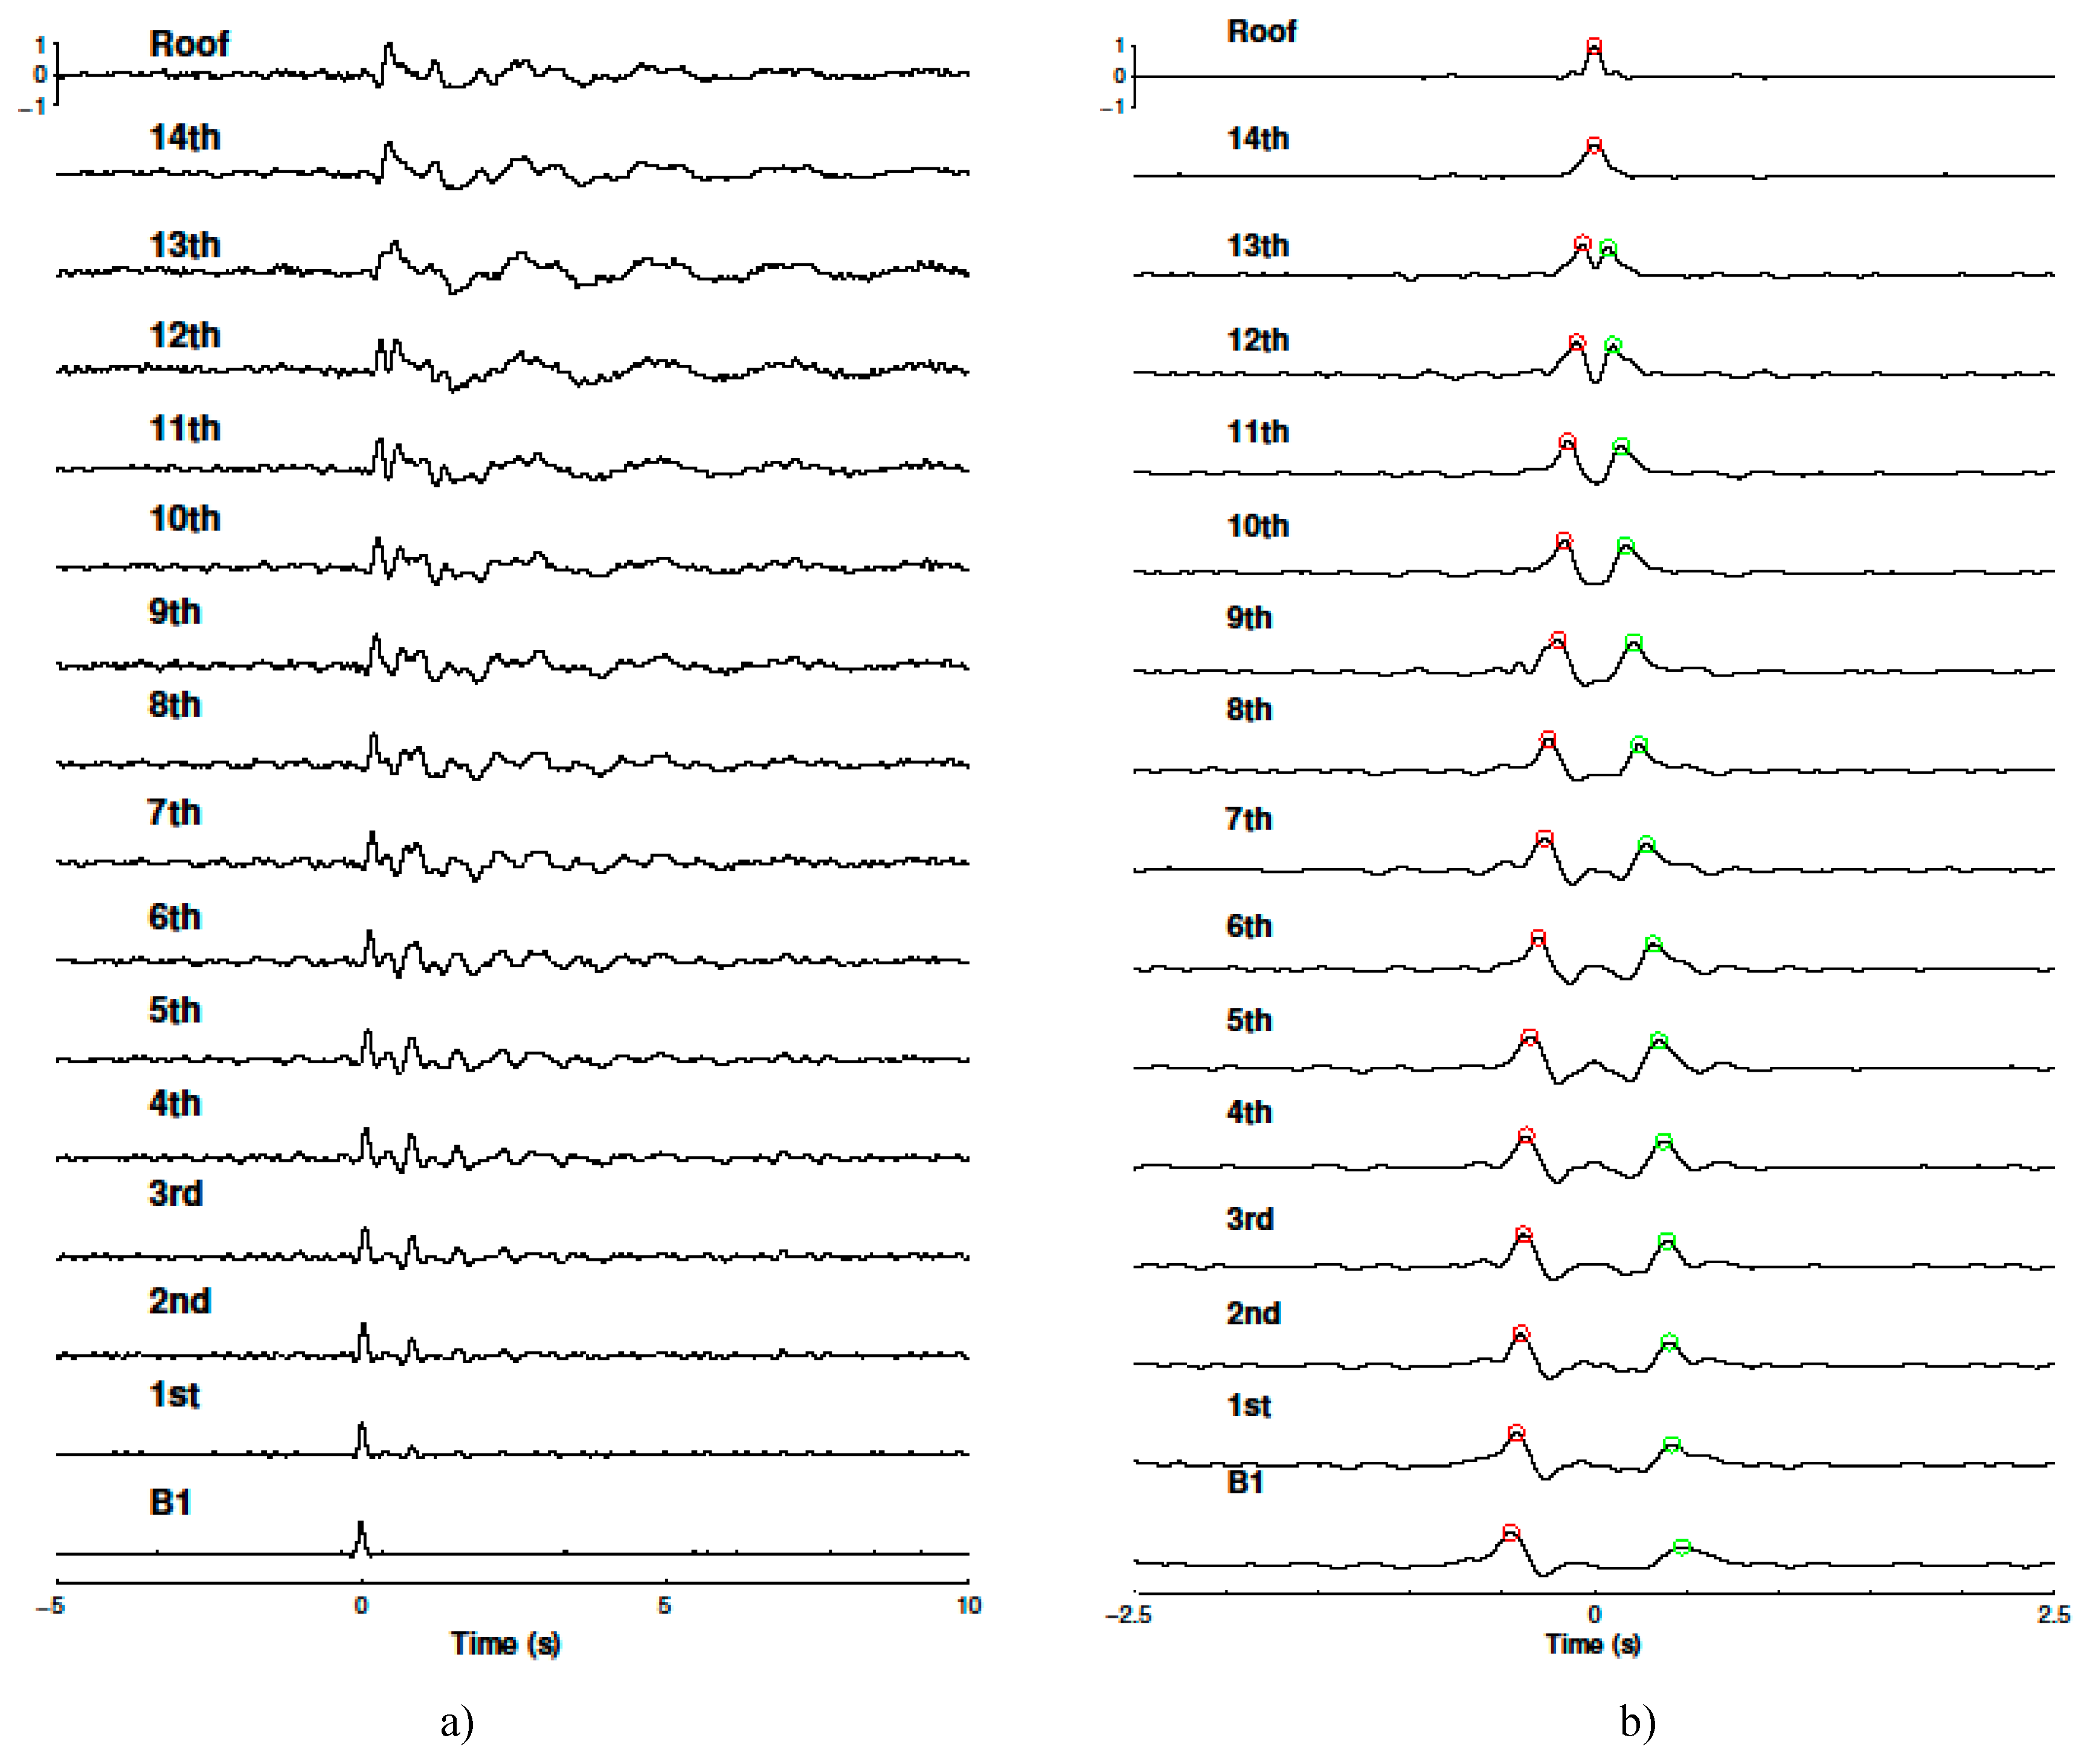
Figure 5.
a), Fourier spectra for deconvolved waveforms at all the floors in Figure 3a). b), The travel time with distance in East-West direction .
Figure 5.
a), Fourier spectra for deconvolved waveforms at all the floors in Figure 3a). b), The travel time with distance in East-West direction .
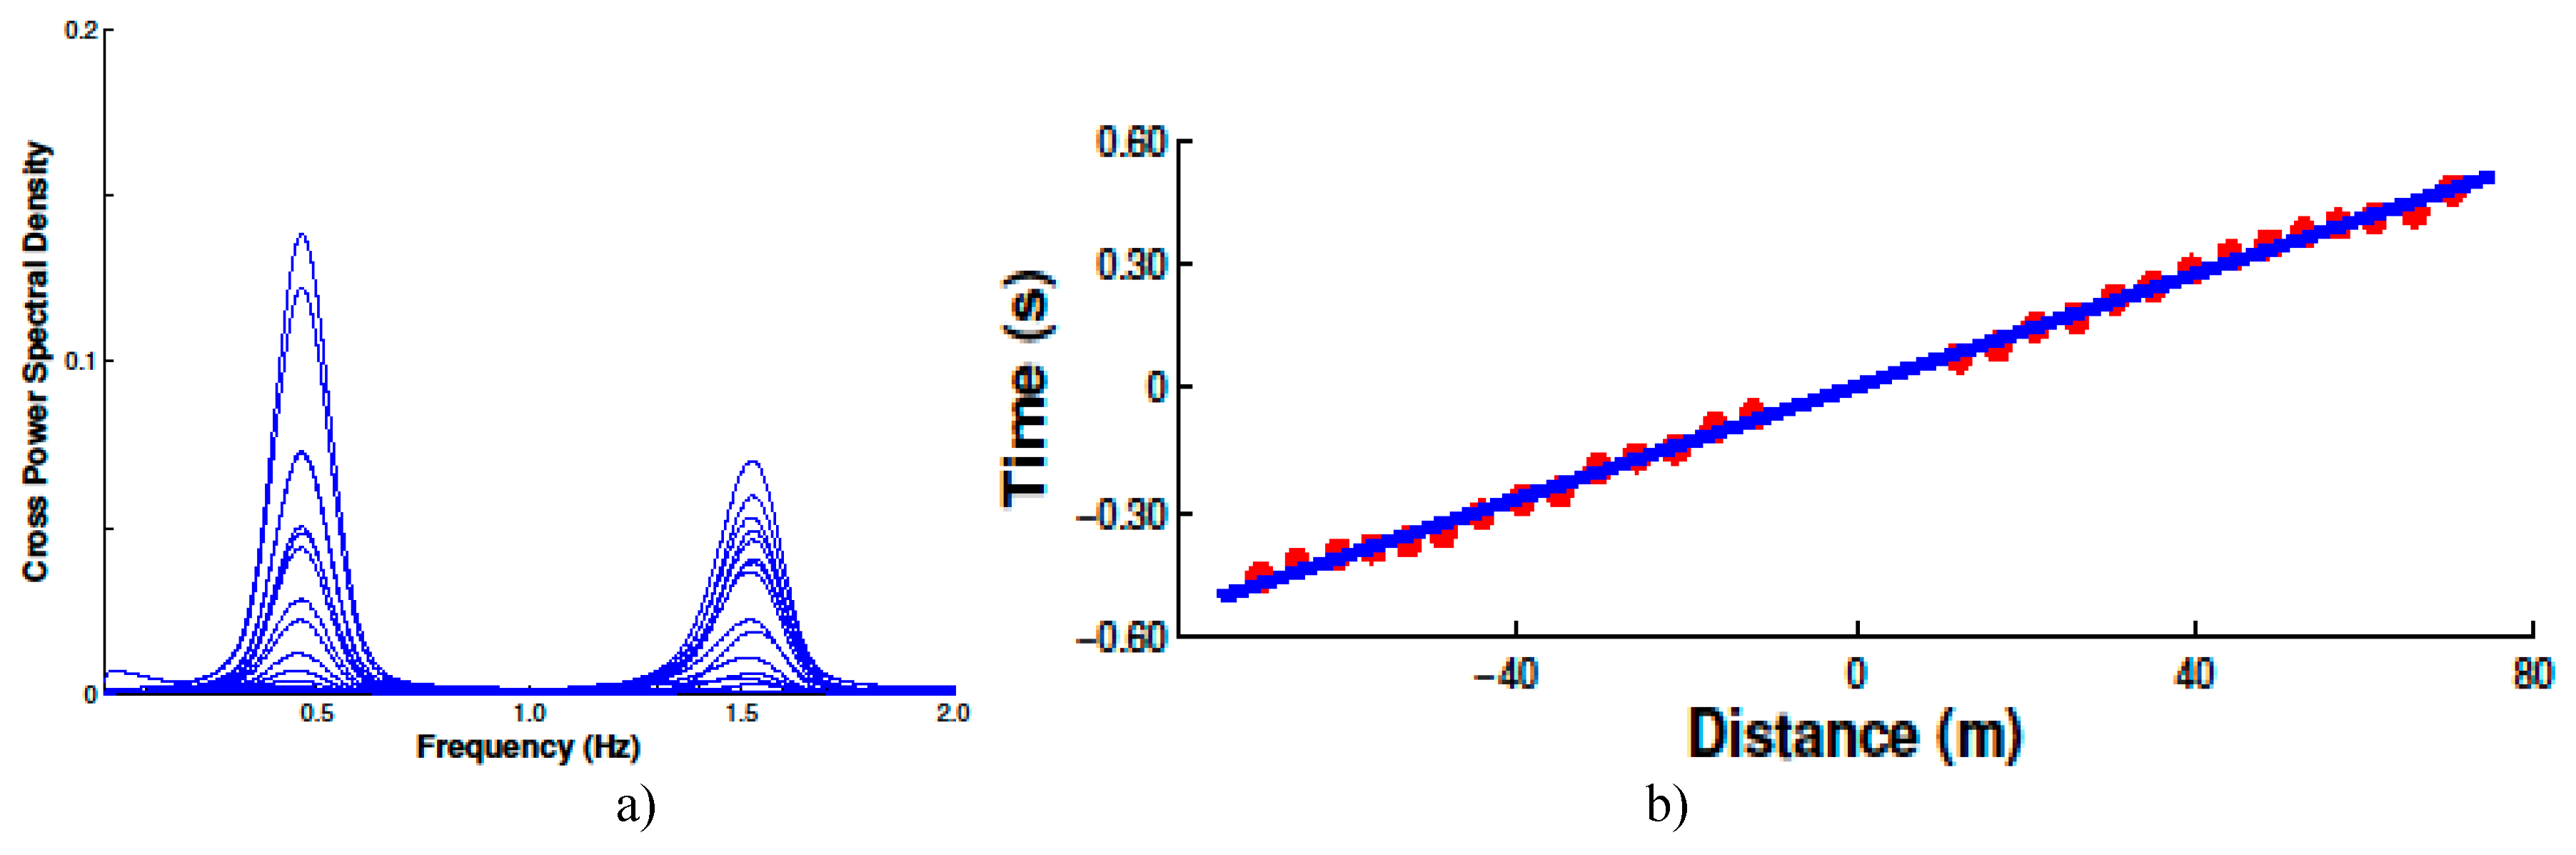
Figure 6.
Shear-wave velocities with floor number. Shear-wave velocity becomes larger at Floor 10 where the plane size extends outward.
Figure 6.
Shear-wave velocities with floor number. Shear-wave velocity becomes larger at Floor 10 where the plane size extends outward.
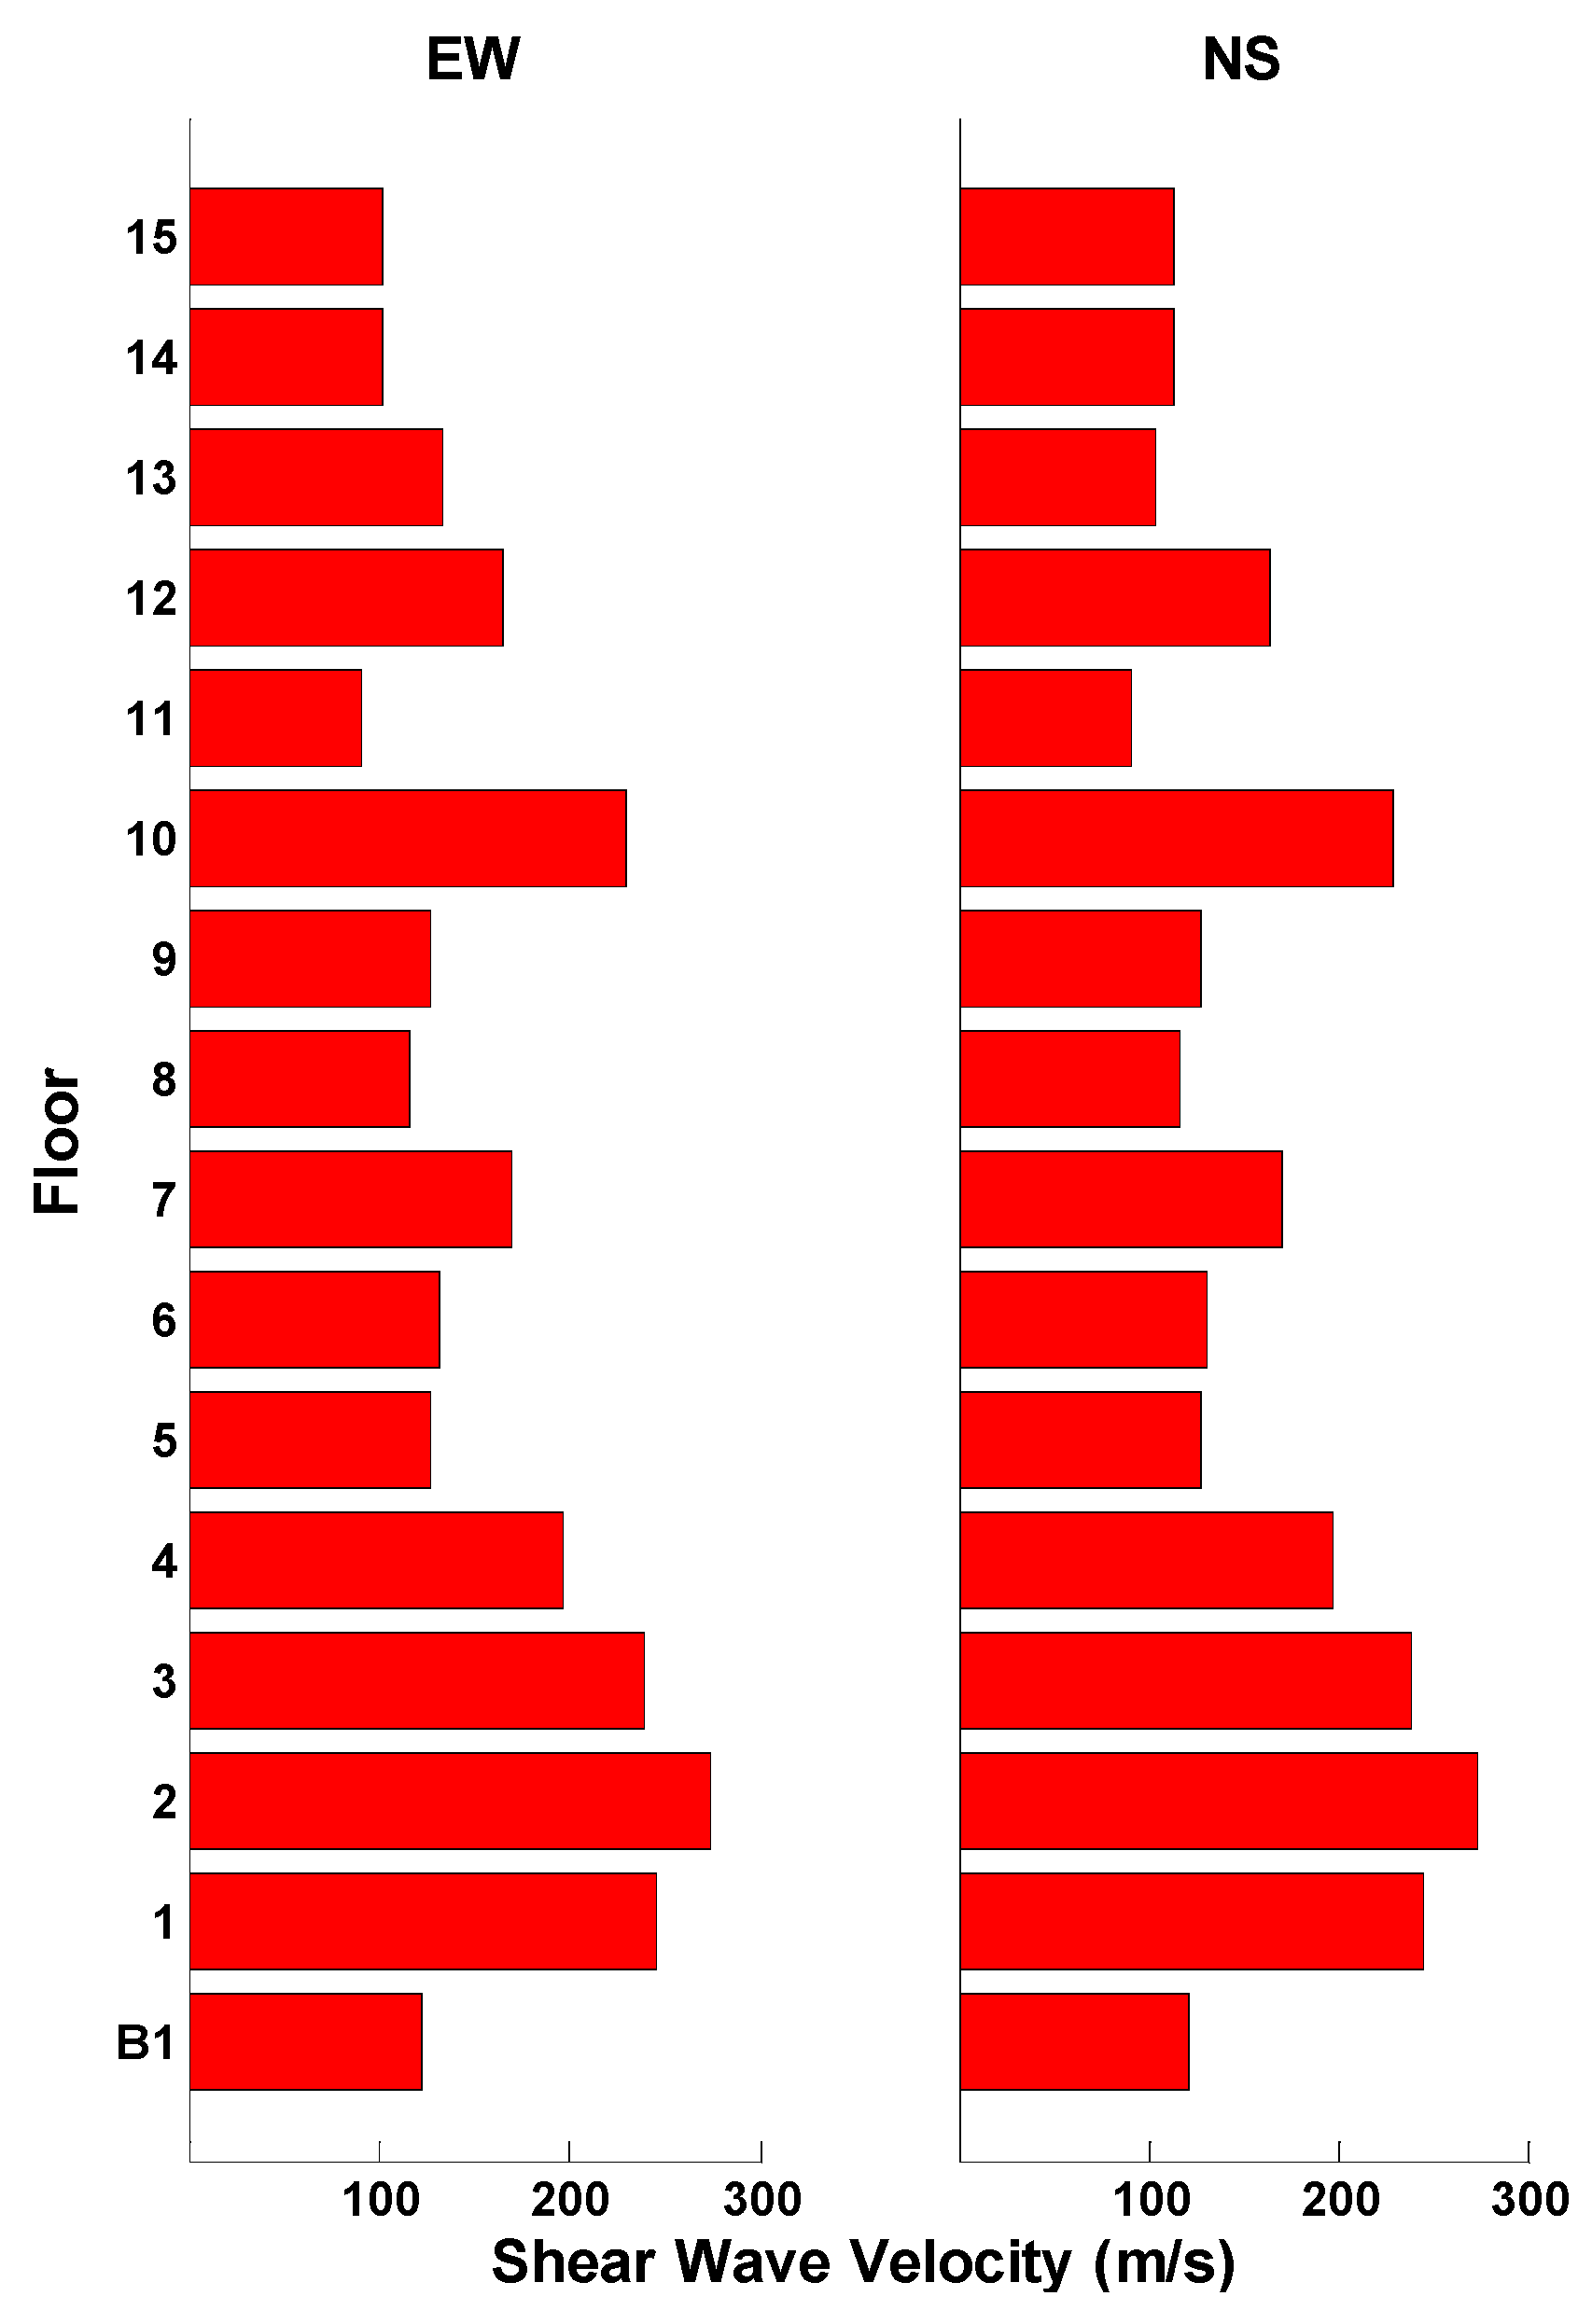
Figure 7.
a), Natural logarithm of these values is used to estimate the attenuation with a set of the best fitted lines. Between 1 and 13 sec, the logarithm decays linearly with time. b),Natural logarithm of the ratio of the amplitudes of the upward and downward going waves in EW direction in Figure 4 b) as a function of the two-way distance to the roof indicated with red solid circles.
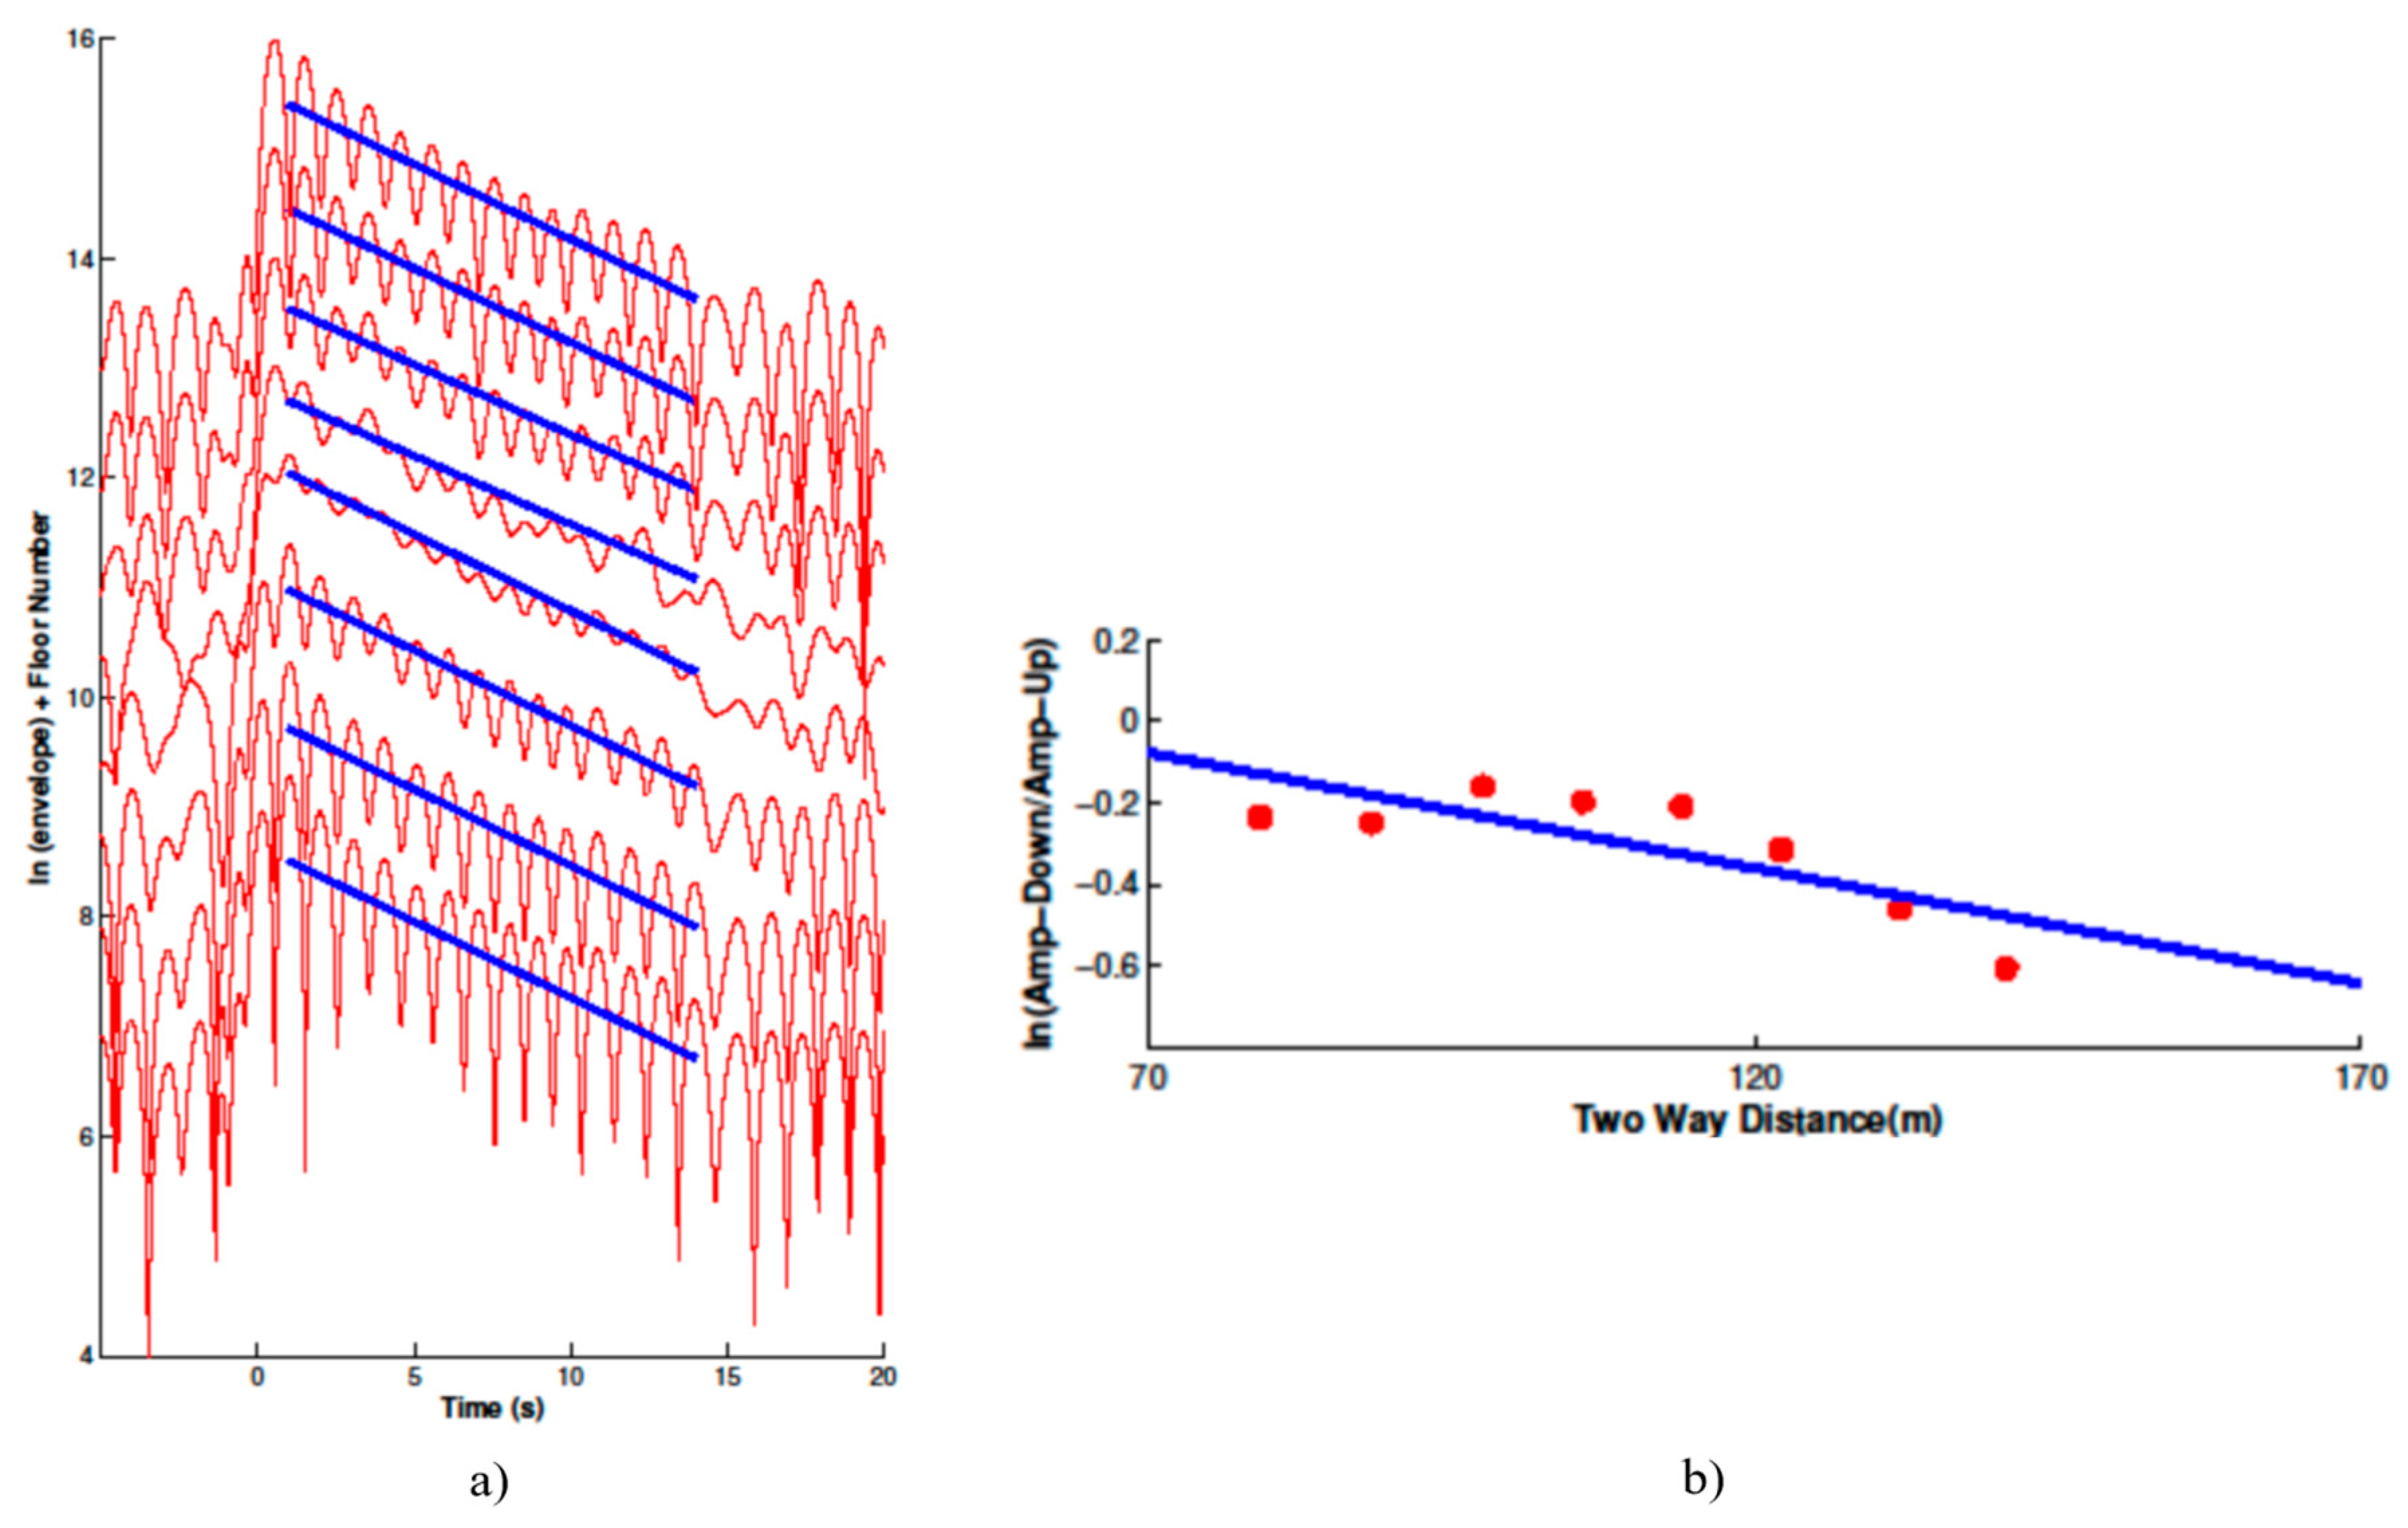
Figure 8.
a), The first nine modes for the Factor Building in two horizontal and vertical directions.b),Shapes for the 1st and 2nd mode obtained from recorded earthquake data and simulated data. The discrepancies are negligible.
Figure 8.
a), The first nine modes for the Factor Building in two horizontal and vertical directions.b),Shapes for the 1st and 2nd mode obtained from recorded earthquake data and simulated data. The discrepancies are negligible.
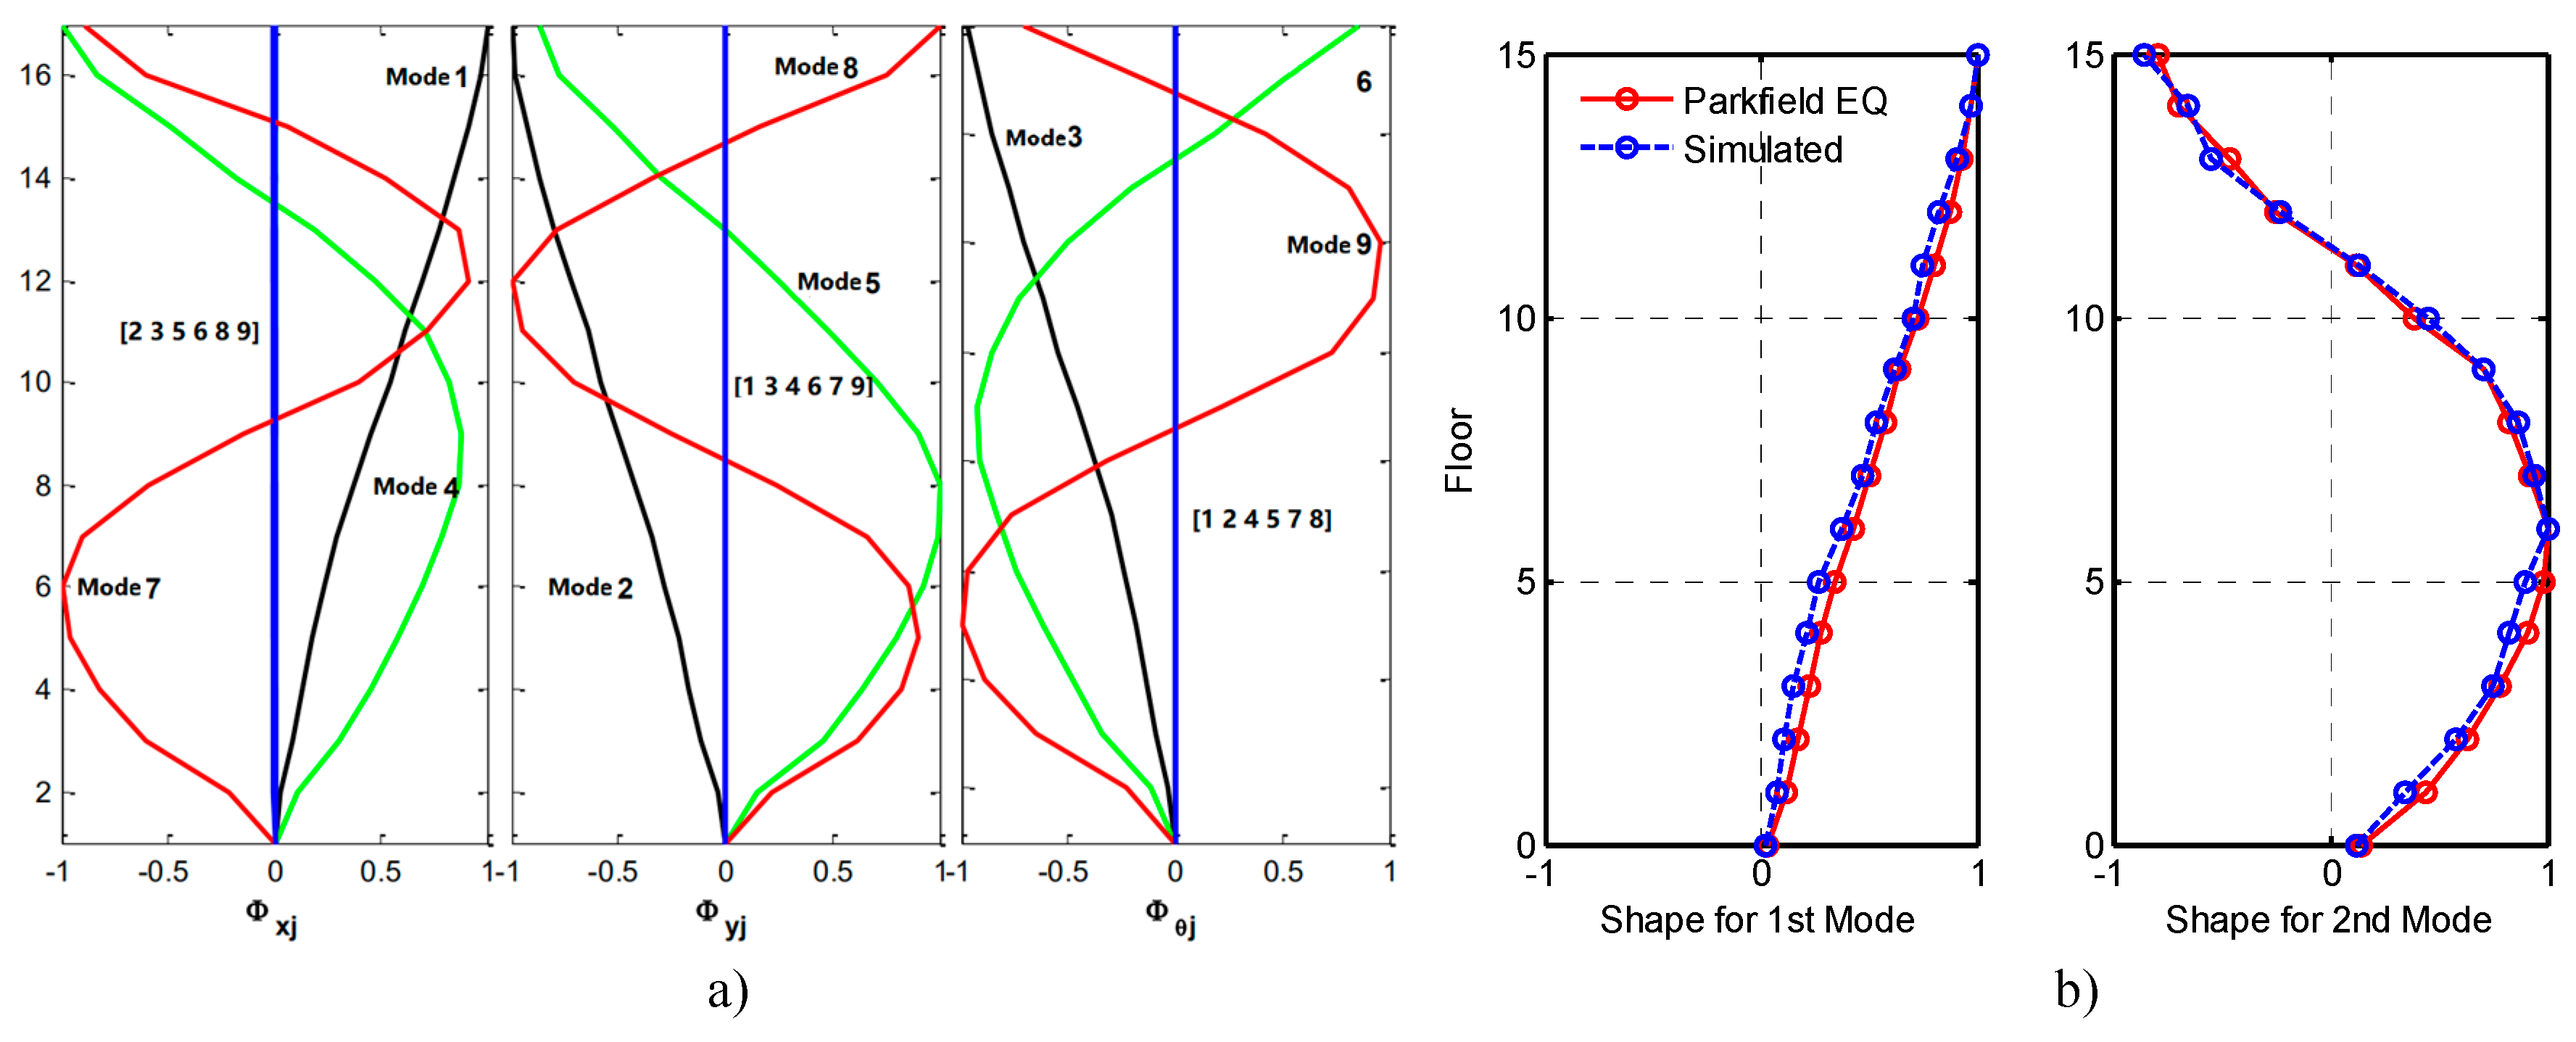
Figure 9.
a), The Rayleigh damping curves for the numerical model. b),Relative displacement calibration between the recorded data and the computed data. They are nearly consistent in frequencies and amplitudes.
Figure 9.
a), The Rayleigh damping curves for the numerical model. b),Relative displacement calibration between the recorded data and the computed data. They are nearly consistent in frequencies and amplitudes.
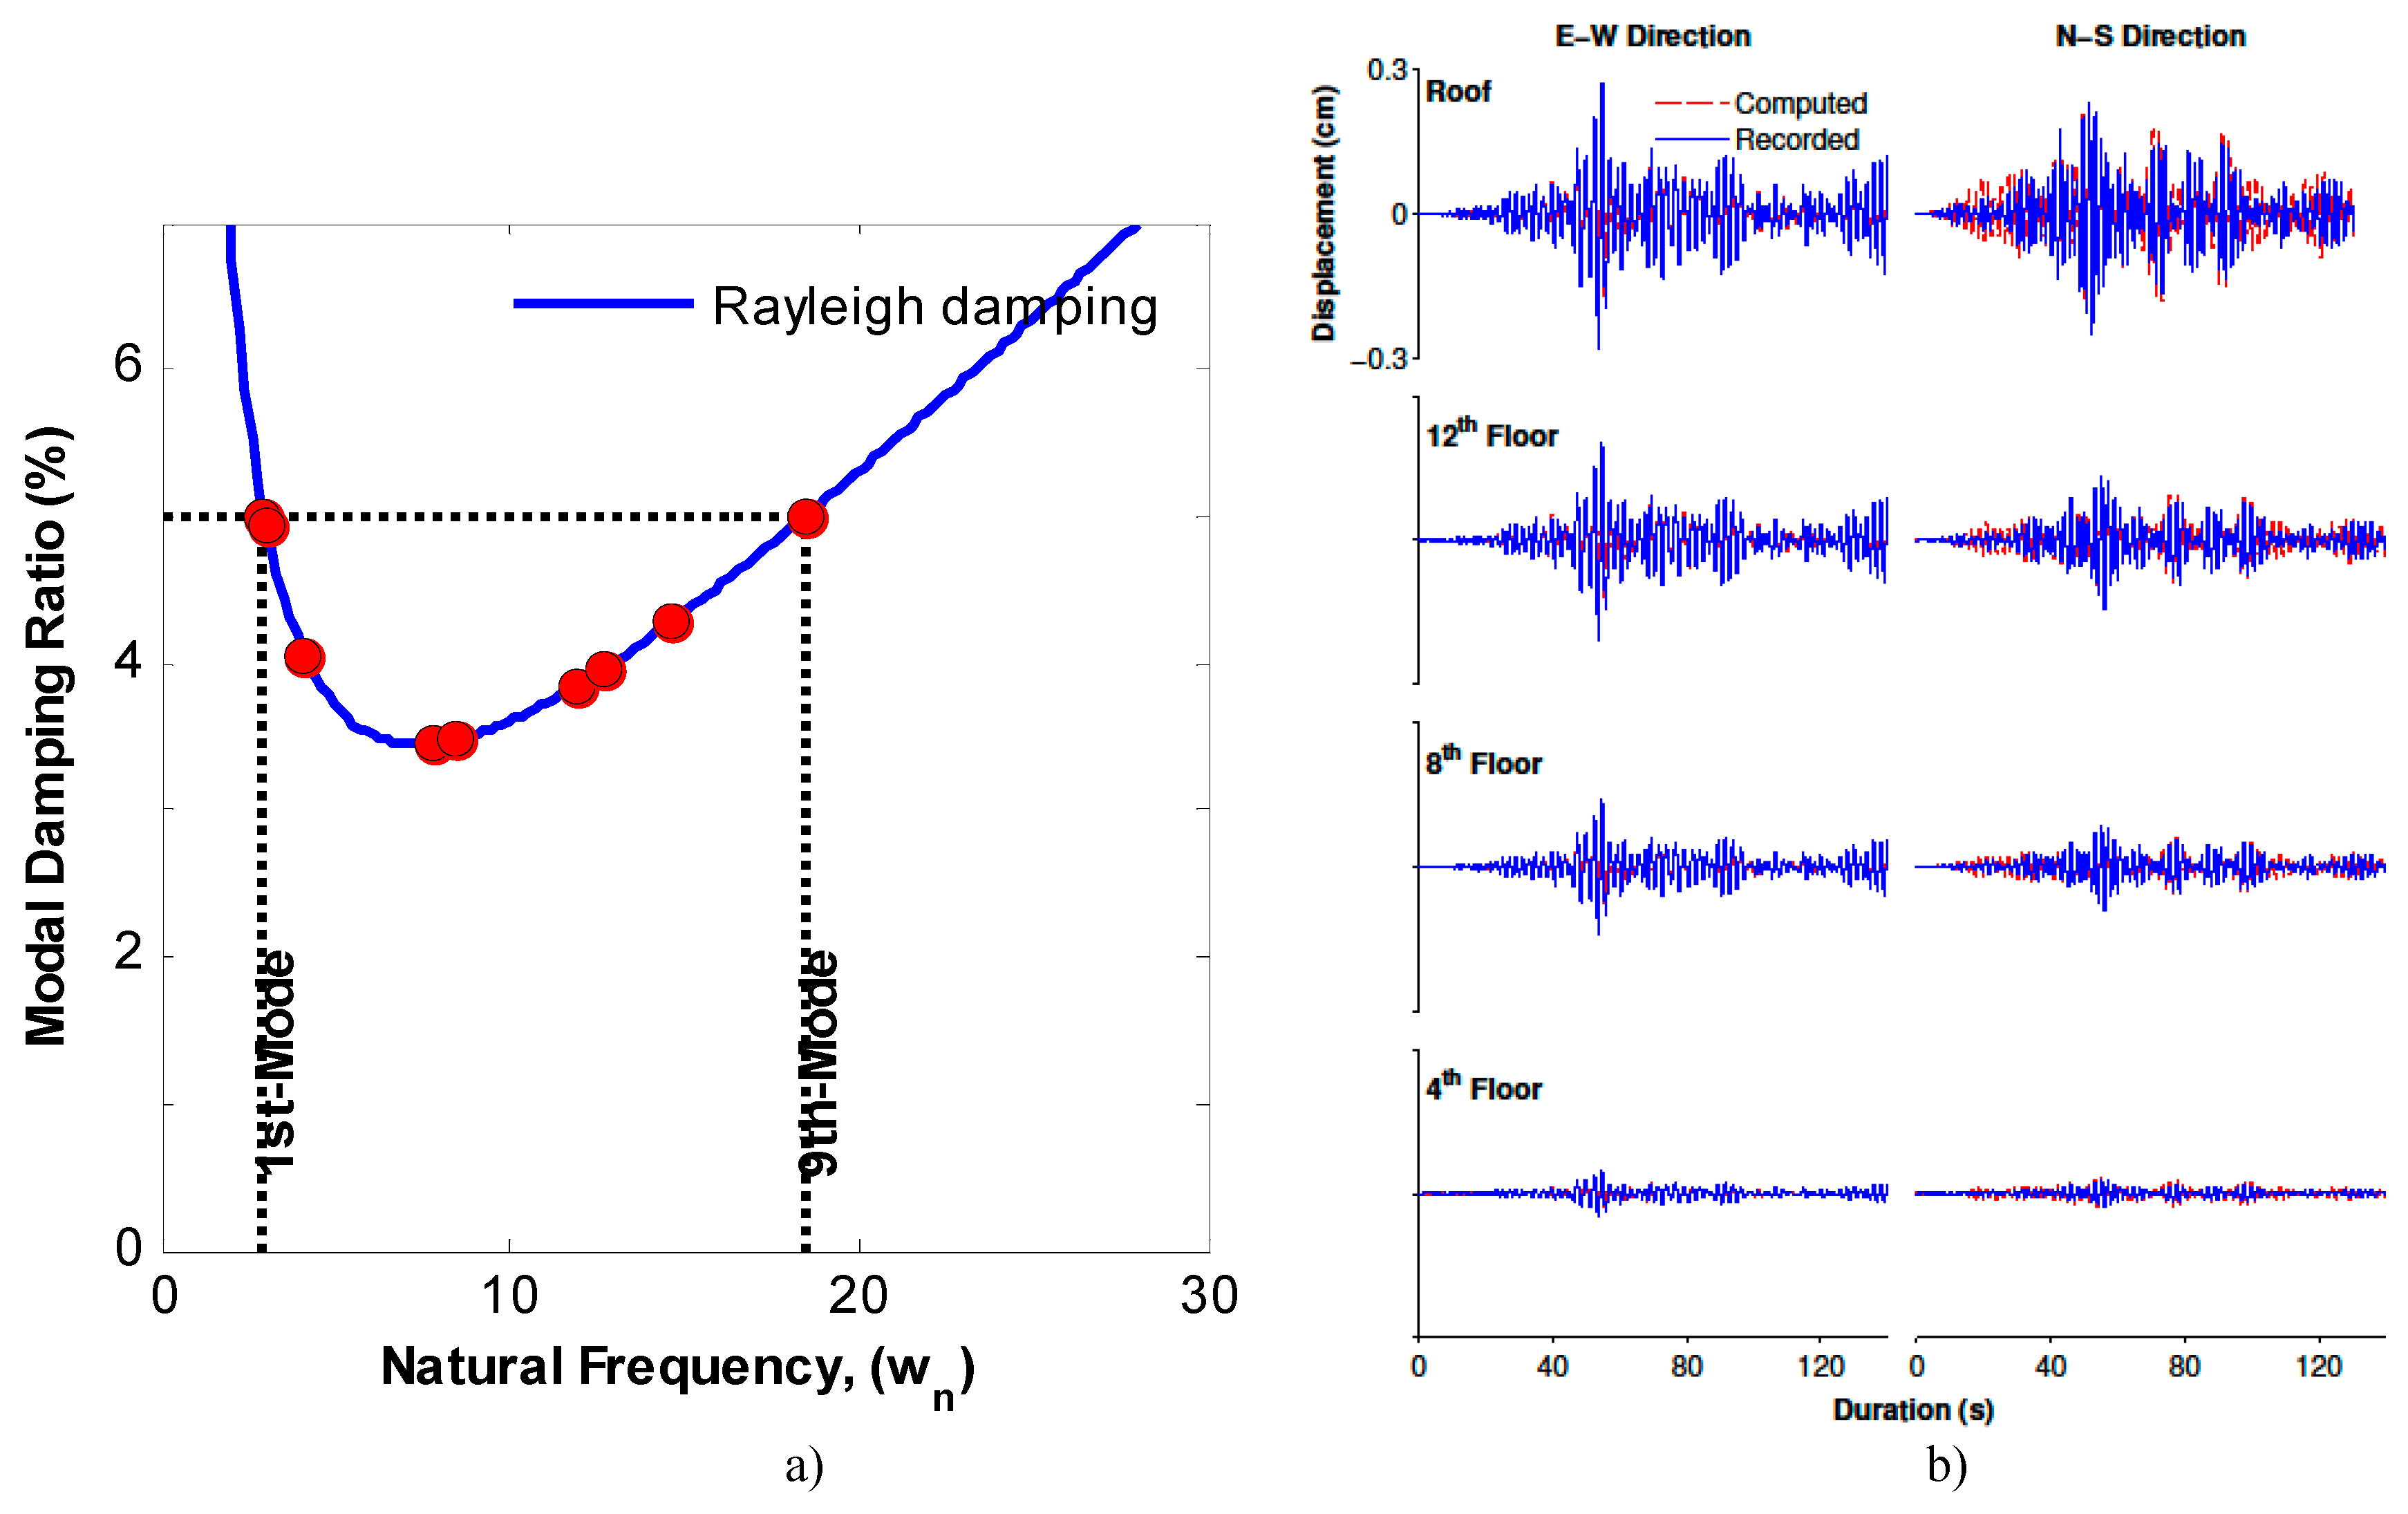

Table 1.
Building’s fundamental frequencies determined from deconvolution and system identification of the 2004 M6.0 Parkfield Earthquake data and those obtained from the OpenSEES model.
Table 1.
Building’s fundamental frequencies determined from deconvolution and system identification of the 2004 M6.0 Parkfield Earthquake data and those obtained from the OpenSEES model.
| Mode No. |
Frequency (Hz) | ||
|---|---|---|---|
| Deconvolution | Parkfield Data | OpenSEES | |
| 1 | 0.468 | 0.468 0.504 0.680 1.439 1.615 1.826 2.506 2.686 3.787 |
0.468 0.477 0.654 1.249 1.352 1.892 2.013 2.327 2.935 |
| 2 | 0.505 | ||
| 3 | 0.521 | ||
| 4 | 1.521 | ||
| 5 | 1.624 | ||
| 6 | 1.644 | ||
| 7 | N/A | ||
| 8 | N/A | ||
| 9 | N/A | ||
Table 2.
The slopes of the fitted lines for the natural logarithm of the envelopes from Floor 9 to Roof.
Table 2.
The slopes of the fitted lines for the natural logarithm of the envelopes from Floor 9 to Roof.
| Floor No. | Slope in EW | Slope in NS |
|---|---|---|
| 9 | -0.1384 | -0.1589 |
| 10 | -0.1398 | -0.1592 |
| 11 | 0.1406 | -0.1583 |
| 12 | -0.1420 | -0.1599 |
| 13 | -0.1306 | -0.1505 |
| 14 | -0.1286 | -0.1506 |
| 15 | -0.1343 | -0.1560 |
| Roof Average |
-0.1351 -0.1362 |
-0.1562 -0.1562 |
Disclaimer/Publisher’s Note: The statements, opinions and data contained in all publications are solely those of the individual author(s) and contributor(s) and not of MDPI and/or the editor(s). MDPI and/or the editor(s) disclaim responsibility for any injury to people or property resulting from any ideas, methods, instructions or products referred to in the content. |
© 2024 by the authors. Licensee MDPI, Basel, Switzerland. This article is an open access article distributed under the terms and conditions of the Creative Commons Attribution (CC BY) license (http://creativecommons.org/licenses/by/4.0/).
Copyright: This open access article is published under a Creative Commons CC BY 4.0 license, which permit the free download, distribution, and reuse, provided that the author and preprint are cited in any reuse.


