
Submitted:
09 July 2024
Posted:
11 July 2024
You are already at the latest version
Abstract
In the knowledge era, intellectual capital has been considered a key factor in creating value within organisations. This study examines the relationships and interactions between the components of intellectual capital and the profitability of Panamanian banking, and financial institutions listed on the Latin American Stock Exchange (LATINEX) from 2014 to 2020. Utilising the Valued-Added Intellectual Coefficient (VAIC)™ model, which evaluates the intellectual capital of organisations based on information from financial statements, the study constructs a regression model to examine the relationship between the Return on Equity (ROE) and the components of the VAIC™. The findings confirm the study’s hypothesis, demonstrating that the Structural Capital Efficiency (SCE) and company size (SIZE) variables explain 57% of the variance in ROE for the analysed institutions. The results suggest that the Intellectual Capital (IC) of financial sector institutions listed on LATINEX is significantly influenced by the SCE coefficient, which shows a negative relationship, suggesting that investment in structural capital does not enhance profitability. On the other hand, larger institutions exhibited higher profitability during the study period.
Keywords:
intellectual capital
; return on equity
; added value of intellectual capital
; Latin American Stock Exchange
1. Introduction
Currently, intellectual capital (IC), together with financial capital, are considered key factors for the profitability of companies (Alipour 2012). In the new knowledge-based economy proposed by Drucker (1993), knowledge ceases to be just another resource alongside traditional factors of production, such as capital and land, and instead becomes the most significant resource. This shift has brought the importance of intangible resources to the forefront, giving them the recognition they deserve (Tiwari 2022). Consequently, IC is now projected as a crucial component in creating value for companies, contributing through sustainable competitive advantage(Awwad and Qtaishat 2023; Bombiak 2023; Jardon 2015; Shah et al. 2023; Teece et al. 1997; William et al. 2019; Xu et al. 2019). The management of intellectual assets has become essential for generating organisational value (Bontis 1998), with companies increasingly relying on intellectual potential over physical capital (Pulic 1998). In this new economy, intangible assets such as IC are fundamental (Özer and Çam 2016). However, measuring these intangible resources remains a challenge for public administrations (Abdulsalam et al. 2011) since IC continues to be a critical concept for analysing and reflecting the real value of organisations (Arslan and Kızıl 2019). Financial statements have limitations in capturing the full value of companies, based on the fact that the source of economic value has shifted from the production of material goods to the creation of IC (M. Chen et al. 2005). Recognising IC as an important business asset is essential, as it can generate sustainable competitive advantages and superior financial results (Barney 1991).
IC is defined as the possession of knowledge, application of experiences, organisational technology, customer relationships, and professional skills (Edvinsson 1997). According to Stewart (1997), IC is an intellectual material that has been formalised, captured, and leveraged to create wealth through the production of higher-value goods. The IC dimensions comprise three harmonising groups: people, structures, and relationships (Pulic 1998).These intangibles consist of human capital (HC), structural capital (SC), and relational capital (RC) (Edvinsson and Malone 1997; Stewart 1997).These structures are based on the Intellect Model (EUROFORUM 1998). Based on this model, in the Intellectus model HC refers to the knowledge, whether explicit or tacit, individual or social, that people and groups possess. Additionally, it considers their ability to generate benefits for companies (Bueno et al. 2011) through a combination of knowledge, skills, experiences, competencies, creativity, and individual capabilities (Bontis 1999; J. Chen et al. 2004; Edvinsson and Malone 1997; Sveiby 1997). Thus, employees are the carriers of knowledge, which is the crucial substance of products and services (Pulic 2008). SC encompasses the knowledge embedded in the company’s internal processes and technological systems, differentiating it from other organisations (Larios Prado 2009). RC can be defined as the knowledge resulting from relationships with market agents and society in general (Bueno et al. 2011).
To enhance the value generated by IC, various measurement models exist. In this study, the Value-Added Intellectual Coefficient (VAIC)™ model is utilised(Pulic 1998, 2000, 2004, 2008),which aims at measuring the value created within the organisation. The VAIC™ model calculates IC based on financial data using the following three components: Human Capital Efficiency Coefficient (HCE), Structural Capital Efficiency Coefficient (SCE), and Capital Employed Efficiency Coefficient (CEE). The VAIC™ indicates the overall state of corporate intellectual capacity, making it possible to measure the performance of intellectual potential and enable management intervention (Pulic 1998).The VAIC™ formula, which uses financials and accounting reports, is considered a suitable tool for measuring IC value creation (Bykova and Molodchik 2012; Pardo-Cueva et al. 2018; Pulic 2000; Shaban and Vijayasundaram 2019; Śledzik 2012; Sumedrea 2013; Villegas González et al. 2017).
The VAIC™ indicators are relevant, useful, and informative for stakeholders as they identify trends and link with traditional financial indicators (Demuner Flores et al. 2017). In addition, this model allows for comparative analysis between companies in the same competitive sector by using standards that measure their effectiveness. Thus, it provides information on company value, performance, and competitiveness, enabling the measurement of IC efficiency (Śledzik 2012; Pardo-Cueva et al. 2018).
Various studies have used the banking and financial sector as samples to measure IC through the VAIC™ model (Abdulsalam et al. 2011; Al-Musali and Ismail 2014; Chen Goh 2005; Demuner Flores et al. 2017; Duho 2020; Duho and Onumah 2019; Faruq et al. 2023; García Castro et al. 2021; Mavridis 2004; Meles et al. 2016; Mollah and Rouf 2022; Oppong and Pattanayak 2019; Ozkan et al. 2017; Singh et al. 2016; Soewarno and Tjahjadi 2020; Tran and Vo 2018).This study uses the VAIC™ model to analyse the relationship between return on equity (ROE) and the components of the VAIC™ since this allows for the quantifiable and objective measurement of IC’s contribution to companies, particularly the banking sector, which is classified as knowledge-intensive(Oppong and Pattanayak 2019).
This work contributes to the literature on IC by contrasting the results offered by the VAIC™ model with a resource-based view (RBV). This theory is based on the premise of heterogeneity among companies, suggesting that organisations differ in their resources and capabilities, with some resources being more valuable than others. According to RBS, a company's ability to generate resources depends on establishing competitive advantages. For resources to be considered competitive advantages, they must be scarce and difficult to imitate. IC is considered a key element in creating and maintaining these competitive advantages (Barney 1991;Bueno et al. 2011; Grant, 1991).
Companies in the banking and financial sectors in Panama listed on the Latin American Stock Exchange (LATINEX) between 2014 and 2020 were studied. These sectors were analysed because they represent an important pillar in the Panamanian economy, demonstrating their resilience during global financial crises, such as the COVID-19 pandemic, by maintaining profitability levels similar to those obtained in previous periods. In the banking sector, IC is considered a key factor for achieving competitiveness(Van Nguyen and Lu 2023) since banks must continuously innovate and remain competitive to survive. Due to their participation in the stock market, the companies analysed are required to publish their financial reports on their websites, providing reliable data (Arslan and Kızıl 2019).
This study is divided into five parts. After the introduction, the literature review and formulation of hypotheses are presented. The third part outlines the model and variables used in the empirical study, as well as the sample and the methods of data collection and processing. The fourth part presents the statistical analysis, evidencing the different assumptions that validate the model. Next, the results obtained are discussed. Finally, the main conclusions of the study, its limitations and future lines of research are presented.
2. Literature Review and Hypotheses Development
2.1. Literature Review
The following is a review of studies that utilised the VAIC™ model to measure the efficiency of the IC in the banking sector.
Arslan and Kızıl (2019): They applied the VAIC™ model to measure and compare the IC of Turkey's banks listed on the Borsa Istanbul Banking Index (BIST XBANK). Using Pearson's correlation test, they found a moderate relationship between ROE and VAIC™, with no relationship between ROE and indebtedness. A strong correlation was found between the HCE coefficient and the SCE and CEE variables, as well as a very close correlation between HCE and VAIC™. There was also a strong correlation between SCE and VAIC™ and a moderate correlation between CEE and VAIC™. The HCE, SCE, and CEE variables maintained a moderate correlation with the Return on Assets (ROA) variable. The HCE and CEE variables showed a moderate relationship with indebtedness, while a low correlation was found between SCE and indebtedness. Finally, a close correlation was observed between VAIC™ and ROE, a strong correlation between VAIC™ and SCE, a moderate relationship between VAIC™ and the ROE and CEE variables, and a low relationship between the VAIC™ and indebtedness.
Al-Musali and Ismail (2014): This study examined the IC performance of listed banks in Saudi Arabia between 2008 and 2010 using the VAIC™ model and investigated the impact of IC on financial performance. The results indicated a positive and significant association between VAIC™ and ROE, as well as between HCE and ROE. However, SCE showed negligible associations with financial performance indicators. A significant positive relationship was observed between the CEE and ROE. In addition, they analysed the SIZE variable; however, no relationship was found.
Meles et al. (2016):This study evaluated the efficiency of IC in a large sample of 5,749 commercial banks in the US from 2005-2012 using the VAIC™ model through the Ordinary Least Squares (OLS) method. They found a statistically significant relationship between VAIC™ and ROE. Moreover, they discovered a significant relationship between HCE and ROE, indicating that efficiency in using human capital (HC) has a greater impact on financial performance than other components of IC efficiency. They also found a significant relationship between asset SIZE and ROE.
Soewarno and Tjahjadi (2020): This study used multiple regression analysis to examine the relationship between IC and the financial performance of banks listed on the Indonesian Stock Exchange between 2012 and 2017. They found a statistically significant relationship between the SCE, CEE, and indebtedness variables and the ROE variable. However, no relationship was found between the HCE and SIZE variables with the ROA variable.
Mollah and Rouf (2022): This study analysed the impact of IC on the financial performance of all listed commercial banks in Bangladesh between 2014 and 2018, using the VAIC™ model. The results showed that HCE and CEE have statistically significant relationships with bank performance.
2.2. Hypotheses Development
Table 1 summarises the results of the literature review.
Based on these results, the following hypotheses are formulated:
Ha
: There is a significant relationship between ROE and at least one of the variables VAIC, HCE, CEE, SCE, SIZE, and INDEBTEDNESS for banking and financial institutions listed on LATINEX between 2014 and 2020.
H0
: There is no significant relationship between ROE and any of the variables VAIC, HCE, CEE, SCE, SIZE, and INDEBTEDNESS for banking and financial companies listed on LATINEX between 2014 and 2020.
3. Methodology
The study is based on the VAIC™ model (Pulic 1998, 2000, 2004, 2008). This research aims to analyse the relationship between ROE and the components of the VAIC™ model for institutions in the banking and financial sectors in Panama listed on LATINEX between 2014 and 2020. The research has a correlational scope since it aims at "understanding the relationship or degree of association that exists between two or more concepts, categories, or variables in a particular sample or context" (Hernández Sampieri et al. 2014, p. 93).
Data for constructing the VAIC™ model was obtained from Balance Sheets, Income Statements, and Notes to the Financial Statements available on the websites of the companies analysed. These data were used to calculate the value-added coefficient and the coefficients related to IC and its components: HC, SC, and RC. This process enabled the calculation of VAIC™ for each company. The procedure for calculating VAIC™ is as follows:
Table 3 details the sources from which the necessary variables for constructing the VAIC™ model were collected.
A regression model was constructed to examine the relationship between ROE, the dependent variable of this research, and the components of the VAIC: CEE, HCE, and SCE (explanatory variables). The study also includes control variables such as indebtedness (total debt/total assets ratio) and company size (natural logarithm of total assets).
The linear regression model used is given by the equation:
The coefficients denote the magnitude of the effect that the (independent) explanatory variables have on the dependent Y. The coefficient represents the intercept or constant term of the model and is a constant term of the model; denotes the error or residual term of the model.

Table 5.
Hypotheses, variables, formulas, and units used.
| Hypothesis | Variables | Formulas | Units |
|---|---|---|---|
| Return on Equity | ROE | (Net Income/Net Worth) *100 | Percentage |
| VAICTM | Value Added Intellectual Coefficient | ICE + CEE | Percentage |
| ICE | Intellectual Capital Efficiency Coefficient | SCE + HCE | Percentage |
| SCE | Structural Capital Efficiency Coefficient | SC/VA | Percentage |
| CEE | Capital Employed Efficiency Coefficient | VA/EC | Percentage |
| SIZE | Total assets of the company | Logarithm of total assets | Logarithm of total assets |
| INDEBTEDNESS | END | (Total assets/Total liabilities) *100 | Percentage |
Source: Own elaboration.
4. Results
The descriptive statistics of the variables studied are presented in Table 6. The mean values obtained are as follows: ROE = 8.54, HCE = 5.14, SCE = 3.78, CEE = 0.08, VAIC = 9.00, INDEBTEDNESS = 0.91, and SIZE Ln_Assets = 19.82. The highest mean values were observed for SIZE, VAIC, and ROE. In terms of the standard deviation, the results for the variables were: ROE = 7.71, HCE = 2.72, SCE = 36.49, CEE = 0.07, VAIC = 36.16, INDEBTEDNESS = 0.69, and SIZE = 2.51. The variables that deviated most from the mean were SCE, VAIC, and ROE, while CEE, INDEBTEDNESS, and HCE were very close to the mean.
To determine the validity of the model, the assumptions of linearity, independence of errors, homoscedasticity, normality and non-collinearity were tested.
4.1. Linearity
Table 7 shows that there is a significant linear relationship between ROE and the explanatory variables SIZE (Ln_Assets), VAIC, and SCE (p < 0.05). The variables CEE, HCE, and INDEBTEDNESS did not show a significant linear relationship (p > 0.05) and were, therefore, not included in the model. The results indicate a significant linear correlation between the dependent variable (ROE) and the explanatory variables SCE and VAIC, as well as between CEE and INDEBTEDNESS and the logarithm of the SIZE of the assets.
4.2. Independence from Errors
The assumption of independence of errors means that the measurement errors of the explanatory variables are uncorrelated with each other. This is verified if the Durbin-Watson (D-W) statistic falls between 1.5 and 2.5. For the model of this research, the Durbin-Watson statistic was 2.065, indicating that the errors are independent. These results are shown in Table 8.
4.3. Homoscedasticity
Homoscedasticity implies that the errors have a constant variance. To verify this, a scatter plot was used with standardised predicted values (ZPRED) and standardised residuals (ZRESID). The scatter plot shows no clear pattern of association, linear or otherwise, indicating that the assumption of homoscedasticity is met, as illustrated in Figure 1.
To confirm this result, an analysis was conducted to calculate the correlation between the absolute values of the residuals and the predicted values. The results indicate no significant relationship between the residuals and the predicted values (p > 0.05), as shown in Table 9.
4.4. Normality
Normality implies that the variables follow a normal distribution. The Kolmogorov-Smirnov (K-S) test was used to assess normality, as shown in Table 10. The results indicate that the hypothesis that residuals have a normal distribution cannot be rejected (p = 0.200).
4.5. Non-Collinearity
This assumption implies that there should not be any strong linear dependence (high correlation) between the explanatory variables. To verify this assumption, the tolerance indicators and the Variance Inflation Factor (VIF) were used. In order for there to be no multicollinearity, tolerance values must be high (greater than or equal to 0.10). The VIF is the reciprocal of tolerance since lower VIF values indicate lower multicollinearity. VIF values greater than suggest serious collinearity problems. The results indicate that the assumption of non-collinearity is verified (Tolerance > 0.10 and VIF < 10 in all cases), as shown in Table 11.
4.6. Model Goodness of Fit
According to the model summary, the adjusted R2 is equivalent to 0.570 (Model 2), indicating that the SCE and SIZE variables (Ln_Assets) explain 57% of the variance in ROE, as shown in Table 12. On the other hand, the F- statistic value of 99.156 indicates that this linear relationship is significant (p < 0.05), according to the results of Table 13.
4.7. Multiple Linear Regression Model
This section presents the results of the estimated model. Based on the results shown in Table 14, the regression equation in raw scores is as follows:
4.8. Goodness of Prediction
To verify the goodness of the estimate, a Z-test was applied for the means of two samples, which were considered significant for p < 0.05 values. The mean values obtained for the ROE and its estimate were 8.54 and 8.60, respectively, as shown in Table 15. Additionally, there is a significant linear correlation (p < 0.05) between the means of these variables according to the values observed in Table 16. Finally, it can be observed that there are no statistically significant differences between the mean values of the ROE and its estimate (p = 0.94), as can be seen in Table 17.
5. Discussion
The results show, according to the non-standardised coefficients (Model 2) presented in Table 13, that if the Ln_Assets SIZE remains constant, an increase of one dollar in the SCE would cause a decrease of $0.15 in the ROE. Conversely, if the SCE remains constant, a 1% increase in the SIZE Ln_Assets would result in an approximate 1% (0.53/100%) increase in the ROE. These findings align with those of Meles et al. (2016).
The standardised coefficients (β) in Model 2 indicate that the variables providing significant information (p < 0.05) for explaining ROE, in order of their weight, are (from highest to lowest) βest.SCE = -0.72 and βest.SIZE Ln Assets = 0.17). This means that the SIZE Ln_Assets variable has a positive trend, and the SCE has a negative trend (Table 14). The positive trend suggests that a 1% increase in Asset Size increases ROE by approximately 1% (0.17/100≈0.01), regardless of the SCE. The results are consistent with the findings of Meles et al. (2016) and support Barney’s (1991) resource-based theory, as larger companies managed to maintain competitive advantages through greater profitability.
The negative trend, on the other hand, indicates that for every dollar invested in the SCE, the ROE decreases by an average of $0.72, regardless of the Asset Size. In other words, investment in structural capital does not contribute to the profitability of the analysed companies. Studies conducted by Al-Musali and Ismail (2014) in the United States found no relationship between ROE and SCE. In this study, a negative relationship was found between the VAIC variable and ROE, indicating that for banks and financial institutions listed on LATINEX, higher IC is associated with lower profitability. On the other hand, studies by Al-Musali and Ismail (2014), Arslan and Kızıl (2019), and Meles et al. (2016)found a positive relationship.
Based on the results of this research, the alternative hypothesis of this study is confirmed since the SCE, SIZE, and VAIC variables are related to the ROE of the banks and financial institutions listed on LATINEX between 2014 and 2020.
6. Conclusions, Limitations, and Future Perspectives
This article analyses the relationship between the components of IC and the profitability of Panamanian banking, and financial institutions listed on LATINEX between 2014 and 2020. Utilising the VAICTM model, this study examines how IC influences the financial performance of these companies. By including 22 financial institutions, this research makes significant contributions, enabling managers to identify variables that add value and competitive advantages to their organisations.
The alternative hypothesis of this study was confirmed since the SCE and SIZE variables explained 57% of the behaviour of ROE in the analysed companies. The results suggest that the IC of financial sector companies listed on LATINEX is mainly affected by the SCE, which has a negative relationship with ROE, indicating that investment in structural capital does not contribute to profitability. On the other hand, larger companies achieved higher profitability during the study period. These findings significantly contribute to the scientific community by reinforcing the assumptions of the resource-based theory proposed by Barney (1991).
This study is limited to a sample of companies in the banking and financial sectors listed on LATINEX. For future research, other sectors of companies listed on LATINEX could be considered. Additionally, comparisons could also be made among different sectors on LATINEX and companies listed on other stock exchanges globally, thus providing more robust conclusions. Extending the study period to analyse the effects before and after the COVID-19 pandemic would also be beneficial. It is suggested that future studies employ other IC measurement methods, such as Skandia, M-VAIC, and Intellect, and compare the results with different methods. In addition, other profitability metrics, such as market value and Tobin's Q, could also be considered. Finally, this study serves as an important reference point for the development of future research.
Author Contributions
Conceptualisation: O.P. and E.H.; methodology: O.P. and E.H.; software: O.P. and E.H.; validation: O.P. and E.H.; formal analysis: O.P. and E.H.; investigation: O.P. and E.H.; resources: O.P. and E.H.; data curation: O.P. and E.H.; writing—original draft preparation: O.P. and E.H.; writing—review and editing: E.H.; visualisation: O.P. and E.H.; supervision: E.H.; project administration: O.P. and E.H.; funding acquisition: E.H. All authors have read and agreed to the published version of the manuscript.
Funding
This research was made possible thanks to the support of the Sistema Nacional de Investigación (SNI) of the Secretaría Nacional de Ciencia, Tecnología e Innovación (Panamá), and by the Universidad de Panamá through the Office of the Provost for Research and Graduate Studies (Vicerrectoría de Investigación y Postgrado), with the call for research funds.
Data Availability Statement
Data are available from the authors upon reasonable request.
Acknowledgments
We extend our gratitude to the Universidad de Panamá. In addition, we thank Universidad del Istmo since this article is the product of a Doctoral thesis carried out at this institution.
Conflicts of Interest
The authors declare no conflict of interest. The funders had no role in the design of the study; in the collection, analyses, or interpretation of data; in the writing of the manuscript; or in the decision to publish the results.
References
- Abdulsalam, F., Al-Qaheri, H., & Al-Khayyat, R. (2011). The Intellectual Capital Performance of KuwaitiBanks: An Application of vaicTM1 Model. IBusiness, 03(01), 88–96. [CrossRef]
- Alipour, M. (2012). The effect of intellectual capital on firm performance: An investigation of Iran insurance companies. Measuring Business Excellence, 16(1), 53–66. [CrossRef]
- Al-Musali, M. A. K., & Ismail, K. N. I. K. (2014). Intellectual Capital and its Effect on Financial Performance of Banks: Evidence from Saudi Arabia. Procedia - Social and Behavioral Sciences, 164, 201–207. [CrossRef]
- Arslan, M. L., & Kızıl, C. (2019). Measuring Intellectual Capital of Turkish Banks Listed on Borsa Istanbul Banking Index (BIST XBANK) with the Market Value / Book Value Method and Value Added Intellectual Coefficient (VAIC) Model. EMAJ: Emerging Markets Journal, 9(1), 101–116. [CrossRef]
- Awwad, M. S., & Qtaishat, A. M. (2023). The impact of intellectual capital on financial performance of commercial banks: the mediating role of competitive advantage. International Journal of Learning and Intellectual Capital, 20(1), 47–69. [CrossRef]
- Barney, J. (1991). Firm Resources and Sustained Competitive Advantage. Journal of Management, 17(1), 99–120. [CrossRef]
- Bombiak, E. (2023). Effect of Green Intellectual Capital Practices on the Competitive Advantage of Companies: Evidence from Polish Companies. Sustainability (Switzerland), 15(5). [CrossRef]
- Bontis, N. (1998). Intellectual capital: an exploratory study that develops measures and models. Management Decision, 36(2), 63–76. [CrossRef]
- Bontis, N. (1999). Managing organisational knowledge by diagnosing intellectual capital: framing and advancing the state of the field. International Journal of Technology Management, 18(5/6/7/8), 433. [CrossRef]
- Bueno, E., Murcia Rivera, C., Longo, M., & Merino, C. (2011). Modelo Intellectus: Medición y Gestión del Capital Intelectual. Madrid, España: CIC, Universidad Autónoma de Madrid.
- Bykova, A., & Molodchik, M. (2012). Applying the VAIC Model to Russian Industrial Enterprises.
- Chen Goh, P. (2005). Intellectual capital performance of commercial banks in Malaysia. Journal of Intellectual Capital, 6(3), 385–396. [CrossRef]
- Chen, J., Zhu, Z., & Yuan Xie, H. (2004). Measuring intellectual capital: a new model and empirical study. Journal of Intellectual Capital, 5(1), 195–212. [CrossRef]
- Chen, M., Cheng, S., & Hwang, Y. (2005). An empirical investigation of the relationship between intellectual capital and firms’ market value and financial performance. Journal of Intellectual Capital, 6(2), 159–176. [CrossRef]
- Demuner Flores, M. del R., Saavedra García, M. L., & Camarena Adame, M. E. (2017). Medición del capital intelectual en el sector bancario: Aplicación de los modelos Skandia y VAIC. Innovar, 27(66), 75–89. [CrossRef]
- Post-Capitalist Society; Butterworth-Heinemann: Oxford.
- Duho, K. C. T. (2020). Intellectual capital and technical efficiency of banks in an emerging market: a slack-based measure. Journal of Economic Studies, 47(7), 1711–1732. [CrossRef]
- Duho, K. C. T., & Onumah, J. M. (2019). Bank diversification strategy and intellectual capital in Ghana: an empirical analysis. Asian Journal of Accounting Research, 4(2), 246–259. [CrossRef]
- Edvinsson, L. (1997). Developing intellectual capital at Skandia. Long Range Planning, 30(3), 320–373. [CrossRef]
- Edvinsson, L; Cómo Identificar y Calcular el Valor de Los Recursos Intangibles de su Empresa: , & Malone, M. S. (1997). El Capital Intelectual.
- EUROFORUM. (1998). <i>Modelo de medición del Capital Intelectual</i> (I.U. Euroforum Escorial (Ed.) EUROFORUM. (1998). Modelo de medición del Capital Intelectual.
- Faruq, M. O., Akter, T., & Mizanur Rahman, M. (2023). Does intellectual capital drive bank’s performance in Bangladesh? Evidence from static and dynamic approach. Heliyon, 9(7), e17656. doi:. [CrossRef]
- García Castro, J. P., Duque Ramírez, D. F., & Moscoso Escobar, J. (2021). The relationship between intellectual capital and financial performance in Colombian listed banking entities. Asia Pacific Management Review, 26(4), 237–247. [CrossRef]
- Grant, R. M. (1991). The Resource-Based Theory of Competitive Advantage: Implications for Strategy Formulation. California Management Review, 33(3), 114–135. [CrossRef]
- Jardon, C. M. (2015). The use of intellectual capital to obtain competitive advantages in regional small and medium enterprises. Knowledge Management Research & Practice, 13(4), 486–496. [CrossRef]
- Larios Prado, J. M. (2009). Capital Intelectual: un modelo de medición en las empresas del nuevo milenio. Criterio Libre, 7(11), 101–121.
- Mavridis, D. G. (2004). The intellectual capital performance of the Japanese banking sector. Journal of Intellectual Capital, 5(1), 92–115. [CrossRef]
- Meles, A., Porzio, C., Sampagnaro, G., & Verdoliva, V. (2016). The impact of the intellectual capital efficiency on commercial banks performance: Evidence from the US. Journal of Multinational Financial Management, 36, 64–74. [CrossRef]
- Mollah, Md. A. S., & Rouf, Md. A. (2022). The impact of intellectual capital on commercial banks’ performance: evidence from Bangladesh. Journal of Money and Business, 2(1), 82–93. [CrossRef]
- Oppong, G. K., & Pattanayak, J. K. (2019). Does investing in intellectual capital improve productivity? Panel evidence from commercial banks in India. Borsa Istanbul Review, 19(3), 219–227. [CrossRef]
- Özer, G., & Çam, İ. (2016). The Role of Human Capital in Firm Valuation: An Application on BIST. Procedia - Social and Behavioral Sciences, 235, 168–177. [CrossRef]
- Ozkan, N., Cakan, S., & Kayacan, M. (2017). Intellectual capital and financial performance: A study of the Turkish Banking Sector. Borsa Istanbul Review, 17(3), 190–198. [CrossRef]
- Pardo-Cueva, M., Armas Herrera, R., & Higuerey, A. (2018). La influencia del capital intelectual sobre la rentabilidad de las empresas manufactureras ecuatorianas. Espacios, 39, 14.
- Pulic, A. Pulic, A. (1998). Measuring the performance of intellectual potential in the knowledge economy.
- Pulic, A. (2000). VAICTM an accounting tool for IC management. International Journal of Technology Management, 20(5/6/7/8), 702. [CrossRef]
- Pulic, A. (2004). Intellectual capital – does it create or destroy value? Measuring Business Excellence, 8(1), 62–68. [CrossRef]
- Pulic, A. (2008). The Principles of Intellectual Capital Efficiency -A Brief Description.
- Shaban, M., & Vijayasundaram, K. (2019). ASSESSING THE RELATION BETWEEN INTELLECTUAL CAPITAL AND EXPORT PERFORMANCE AN EMPIRICAL EXPLORATION OF BSE 500 COMPANIES IN INDIA. 13, 38–49.
- Shah, S. Q. A., Lai, F.-W., & Shad, M. K. (2023). Moderating Effect of Managerial Ownership on the Association Between Intellectual Capital and Firm Performance: A Conceptual Framework. In M. Al-Emran, K. Shaalan, & M. A. Al-Sharafi (Eds.), Lecture Notes in Networks and Systems: Vol. 550 LNNS (pp. 477–489). Springer Science and Business Media Deutschland GmbH. [CrossRef]
- Singh, S., Sidhu, J., Joshi, M., & Kansal, M. (2016). Measuring intellectual capital Performance of Indian banks: A public and private sector comparison. Managerial Finance, 42(7), 635–655. [CrossRef]
- Śledzik, K. (2012). The Intellectual Capital Performance of Polish Banks: An Application of VAICTM Model. SSRN Electronic Journal. [CrossRef]
- Soewarno, N., & Tjahjadi, B. (2020). Measures that matter: an empirical investigation of intellectual capital and financial performance of banking firms in Indonesia. Journal of Intellectual Capital, 21(6), 1085–1106. [CrossRef]
- Stewart, T. (1997). Intellectual Capital: The New Wealth of Organizations. In Doubleday / Currency.
- Sveiby, K. E. (1997). The New Organizational Wealth: Managing & Measuring Knowledge-based Assets (Berrett-Koehler Publishers, Ed.).
- Teece, D. J., Pisano, G., & Shuen, A. (1997). Dynamic Capabilities and Strategic Management. Strategic Management Journal, 18(7), 509–533. http://www.jstor.org/stable/3088148.
- Tiwari, R. (2022). Nexus between intellectual capital and profitability with interaction effects: panel data evidence from the Indian healthcare industry. Journal of Intellectual Capital, 23(3), 588–616. [CrossRef]
- Tran, D. B., & Vo, D. H. (2018). Should bankers be concerned with Intellectual capital? A study of the Thai banking sector. Journal of Intellectual Capital, 19(5), 897–914. [CrossRef]
- Van Nguyen, T., & Lu, C. H. (2023). Financial intermediation in banks and the key role of intellectual capital: new analysis from an emerging market. Journal of Financial Services Marketing. [CrossRef]
- Villegas González, E., Hernández Calzada, M. A., & Salazar Hernández, B. C. (2017). La medición del capital intelectual y su impacto en el rendimiento financiero en empresas del sector industrial en México. Contaduría y Administración, 62(1), 184–206. [CrossRef]
- William, F., Gaetano, M., & Giuseppe, N. (2019). The impact of intellectual capital on firms financial performance and market value: Empirical evidence from Italian listed firms. African Journal of Business Management, 13(5), 147–159. [CrossRef]
- Xu, Haris, & Yao. (2019). Should Listed Banks Be Concerned with Intellectual Capital in Emerging Asian Markets? A Comparison between China and Pakistan. Sustainability, 11(23), 6582. [CrossRef]
Figure 1.
Scatter Plot (ZPRED = standardised predicted values and ZRESID = standardised residuals).
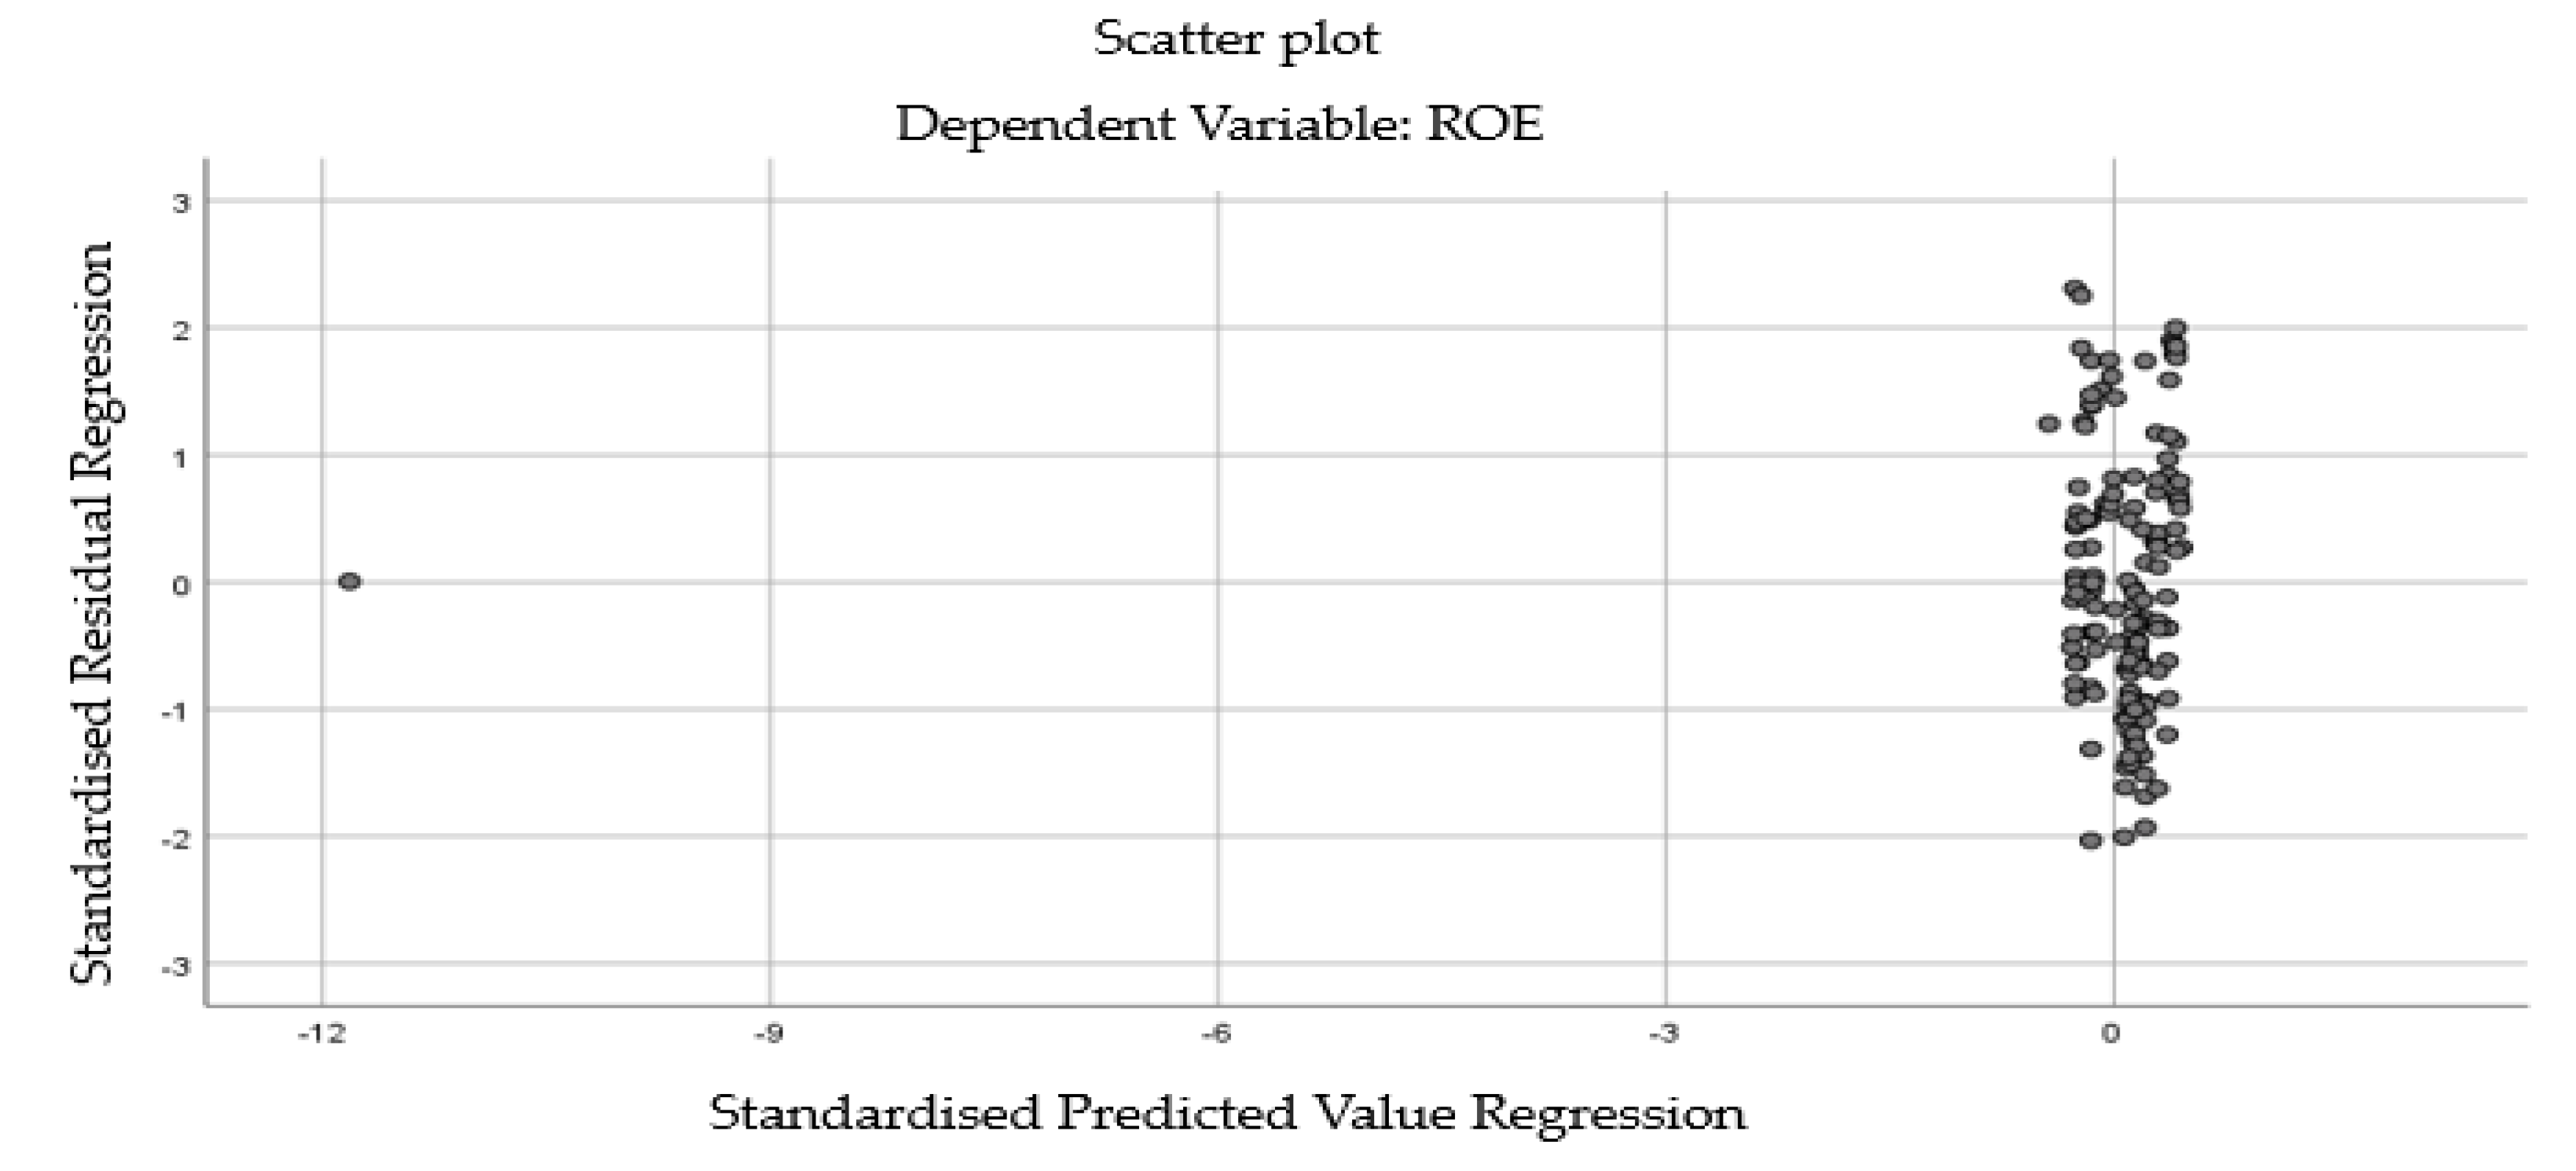
Table 1.
Literature review on the variables studied.
| Hypothesis | Relationship Found | ||
|---|---|---|---|
| Positive | Negative | No relationship | |
| Relationship between ROE and CEE | Al-Musali and Ismail (2014) Arslan and Kızıl (2019) Mollah and Rouf (2022) Soewarno and Tjahjadi 2020) |
||
| Relationship between ROE and HCE | Al-Musali and Ismail (2014) Arslan and Kızıl (2019) Meles et al. (2016) Mollah and Rouf (2022) |
Soewarno and Tjahjadi (2020) | |
| Relationship between ROE and SCE | Arslan and Kızıl (2019) Soewarno and Tjahjadi (2020) |
Al-Musali and Ismail (2014) | |
| Relationship between ROE and VAIC | Al-Musali and Ismail (2014) Arslan and Kızıl (2019) Meles et al. (2016) |
||
| Relationship between ROE and SIZE | Meles et al. (2016) | Soewarno and Tjahjadi (2020) | |
| Relationship between ROE and INDEBTEDNESS | Arslan and Kızıl (2019) Soewarno and Tjahjadi (2020) |
||
Note. Profitability is measured based on ROE.
Table 2.
Methodological Process for the Calculation of the Components of the VAIC™.
| Steps to calculate VAIC | Purpose of the calculation | Formula | Formula Components |
|---|---|---|---|
| Step 1 | To determine the extent to which a company creates Value Added (VA). VA is calculated based on the difference between income and expenses | VA = OUT–IN | VA = Added value OUT = Total Revenue IN = Expenses, excluding personnel costs |
| Step 2 | Calculate the Human Capital Efficiency Coefficient (HCE) | HCE = VA/HC | HCE = Human Capital efficiency coefficient VA = Added value HC = Total wages and salary commitments of the company |
| Step 3 | Calculate Structural Capital (SC), the second component of the IC | SC = VA–HC | SC = Structural Capital VA = Value added HC = Total wages and salary commitments of the company |
| Step 4 | Calculate the Structural Capital Efficiency Coefficient (SCE) | SCE = SC/VA | SCE = Structural Capital Efficiency Coefficient SC = Structural Capital VA = Added value |
| Step 5 | Intellectual Capital Efficiency (ICE) is determined by combining the Human Capital Efficiency (HCE) and the Structural Capital Efficiency (SCE) | ICE = HCE + SCE | ICE = Intellectual Capital Efficiency Coefficient HCE = Human Capital Efficiency Coefficient SCE = Structural Capital Efficiency Coefficient |
| Step 6 | Since IC alone cannot create value (Pulic 2004), it is essential to also consider financial and physical capital. This involves calculating the Capital Employed Efficiency (CEE) | CEE = VA/CE | CEE = Capital Employed Efficiency Coefficient VA = Added value CE = Book value of the company's net assets |
| Step 7 | To compare the overall efficiency of value creation, the three efficiency indicators are added together | VAIC™ = ICE + CEE | VAIC™ = Value Added Intellectual Coefficient ICE = Intellectual Capital Efficiency Coefficient CEE = Capital Employed Efficiency Coefficient |
Own elaboration based on Pulic (1998, 2000, 2004, 2008).
Table 3.
Sources of variable information collection.
| Identification | Description | Source of the data |
|---|---|---|
| OUT | Total Revenue | Income Statement |
| IN | Expenses | Income Statement |
| OP | Operational Costs | Income Statement |
| EC | Employee Costs | Income Statement |
| D | Depreciation | Income Statement |
| A | Amortisations | Income Statement |
| HC | Total Wages and Salary Commitments of the Company | Balance Sheet, Income Statement, Notes to Financial Statements |
| CE | Book value of the company's net assets | Balance Sheet, Notes to Financial Statements |
Note. The study population consisted of 43 companies: 26 companies in the banking sector and 17 in the financial sector. Companies that did not record the necessary data for variable construction were excluded, resulting in a sample of 22 companies: 14 from the banking sector and eight from the financial sector.
Table 4.
Study sample.
| Banking Sector | Financial Sector |
|---|---|
| Bac International Bank Inc. | Colfinanza, S.A. |
| Banco Centro Americano de Integración | Corporación Bellavista de Finanzas, S.A. |
| Banco General S.A. | Corporación Finanzas del País, S.A. (Panacredit) |
| Banco Internacional de Costa Rica | Financia Credit S.A. |
| Banco La Hipotecaria S.A. | Financiera Pacífico Internacional, S.A. |
| Banco Nacional de Panamá | Hipotecaria Metrocredit S.A. |
| Banistmo S.A. | Mi Financiera S.A. |
| BCT Bank International S.A. | Multi Financiamientos S.A. |
| Canal Bank | |
| Capital Bank Inc. | |
| MultiBank Inc. | |
| Tower Bank International Inc. | |
| Unibank S.A. | |
| Banesco S.A. |
Source: Own elaboration.
Table 6.
Descriptive statistics.
| Mean | Standard Deviation | N | |
|---|---|---|---|
| ROE | 8.54 | 7.71 | 148 |
| HCE | 5.14 | 2.72 | 148 |
| SCE | 3.78 | 36.49 | 148 |
| CEE | 0.08 | 0.07 | 148 |
| VAIC | 9.00 | 36.16 | 148 |
| INDEBTEDNESS | 0.91 | 0.69 | 148 |
| SIZE Ln_Assets | 19.82 | 2.51 | 148 |
Note. The initial database comprised 167 banking and financial institutions. However, after cleaning for outliers and missing data, the sample decreased to 148.
Table 7.
Correlation Analysis.
| ROE | HCE | SCE | CEE | VAIC | INDEBTEDNESS | SIZE Ln_Assets | ||
|---|---|---|---|---|---|---|---|---|
| ROE | Pearson correlation | 1 | 0.102 | -.740** | 0.144 | -.739** | 0.003 | .270** |
| Sig. (bilateral) | 0.215 | 0.000 | 0.080 | 0.000 | 0.966 | 0.001 | ||
| N | 148 | 148 | 148 | 148 | 148 | 148 | 148 | |
| HCE | Pearson correlation | 0.102 | 1 | -0.155 | -0.160 | -0.081 | -0.003 | -0.054 |
| Sig. (bilateral) | 0.215 | 0.060 | 0.052 | 0.327 | 0.967 | 0.514 | ||
| N | 148 | 148 | 148 | 148 | 148 | 148 | 148 | |
| SCE | Pearson correlation | -.740** | -0.155 | 1 | -0.091 | .997** | -0.006 | -0.133 |
| Sig. (bilateral) | 0.000 | 0.060 | 0.271 | 0.000 | 0.939 | 0.107 | ||
| N | 148 | 148 | 148 | 148 | 148 | 148 | 148 | |
| CEE | Pearson correlation | 0.144 | -0.160 | -0.091 | 1 | -0.102 | .558** | -.404** |
| Sig. (bilateral) | 0.080 | 0.052 | 0.271 | 0.218 | 0.000 | 0.000 | ||
| N | 148 | 148 | 148 | 148 | 148 | 148 | 148 | |
| VAIC | Pearson correlation | -.739** | -0.081 | .997** | -0.102 | 1 | -0.006 | -0.139 |
| Sig. (bilateral) | 0.000 | 0.327 | 0.000 | 0.218 | 0.947 | 0.091 | ||
| N | 148 | 148 | 148 | 148 | 148 | 148 | 148 | |
| INDEBTEDNESS | Pearson correlation | 0.003 | -0.003 | -0.006 | .558** | -0.006 | 1 | -0.014 |
| Sig. (bilateral) | 0.966 | 0.967 | 0.939 | 0.000 | 0.947 | 0.863 | ||
| N | 148 | 148 | 148 | 148 | 148 | 148 | 148 | |
| SIZE Ln_Activos | Pearson correlation | .270** | -0.054 | -0.133 | -.404** | -0.139 | -0.014 | 1 |
| Sig. (bilateral) | 0.001 | 0.514 | 0.107 | 0.000 | 0.091 | 0.863 | ||
| N | 148 | 148 | 148 | 148 | 148 | 148 | 148 |
** The correlation is significant at the 0.01 level (bilateral).
Table 8.
Model Summary and Error Independence Test (D-W).
| Model |
R | R² | Adjusted R² | Standard Estimate Error | Change statistics | Durbin-Watson |
|---|---|---|---|---|---|---|
| Change in R² | ||||||
| 1 | .740a | 0.547 | 0.544 | 5.19296 | 0.547 | |
| 2 | .759b | 0.576 | 0.570 | 5.04183 | 0.029 | 2.065 |
a. Predictors: (Constant), SCE; b. Predictors: (Constant), SCE, SIZE, Ln_Assets; c. Dependent variable: ROE.
Table 9.
Correlation between the absolute values of the residuals and the predicted values.
| Absresid | Unstandardised Predicted Value | ||
|---|---|---|---|
| Absresid | Pearson correlation | 1 | 0.156 |
| Sig. (bilateral) | 0.059 | ||
| N | 148 | 148 |
Source: Own elaboration.
Table 10.
Normality test Kolmogorov-Smirnov.
| Kolmogorov-Smirnov | Shapiro-Wilk | |||||
|---|---|---|---|---|---|---|
| Test | Statistic | df | Sig. | Statistic | df | Sig. |
| Unstandardised Residual | 0.059 | 149 | .200* | 0.981 | 149 | 0.042 |
*. This is a lower limit of true significance. a. Lilliefors correction of significance.
Table 11.
Collinearity Diagnostics for models.
| Model | Collinearity Statistics | ||
|---|---|---|---|
| Tolerance | VIF | ||
| 1 | (Constant) | ||
| SCE | 1.000 | 1.000 | |
| 2 | (Constant) | ||
| SCE | 0.982 | 1.018 | |
| SIZE Ln_Assets | 0.982 | 1.018 | |
a. Dependent variable: ROE.
Table 12.
Model Overview.
| Model | R | R² | Adjusted R² | Standard Error of Estimate | Change statistics |
|---|---|---|---|---|---|
| Change in R² | |||||
| 1 | .740a | 0.547 | 0.544 | 5.19296 | 0.547 |
| 2 | .759b | 0.576 | 0.570 | 5.04183 | 0.029 |
Source: Own elaboration.
Table 13.
ANOVA for models.
| ANOVA | ||||||
|---|---|---|---|---|---|---|
| Model | Sum of squares | df | Mean square | F statistic | Sig. | |
| 1 | Regression | 4788.318 | 1 | 4788.318 | 177.563 | .000b |
| Residual | 3964.119 | 147 | 26.967 | |||
| Total | 8752.437 | 148 | ||||
| 2 | Regression | 5041.113 | 2 | 2520.556 | 99.156 | .000c |
| Residual | 3711.324 | 146 | 25.42 | |||
| Total | 8752.437 | 148 | ||||
a. Dependent variable: ROE. b. Predictors: (Constant), SCE. c. Predictors: (Constant), SCE, SIZE Ln_Activos.
Table 14.
Multiple linear regression model.
| Coefficientsa | ||||||
|---|---|---|---|---|---|---|
| Model | Non-standardised coefficients | Standardised coefficients | T | Sig. | ||
| B | Std. Error | Beta | ||||
| 1 | (Constant) | 9.11 | 0.43 | 21.29 | 0.00 | |
| SCE | -0.16 | 0.01 | -0.74 | -13.33 | 0.00 | |
| 2 | (Constant) | -1.34 | 3.34 | -0.40 | 0.69 | |
| SCE | -0.15 | 0.01 | -0.72 | -13.18 | 0.00 | |
| SIZE Ln_Assets | 0.53 | 0.17 | 0.17 | 3.15 | 0.00 | |
Dependent variable: ROE.
Table 15.
Descriptive statistics.
| N | Minimal | Maximum | Media | Standard deviation | |
|---|---|---|---|---|---|
| ROE | 148 | -60.43 | 21.01 | 8.54 | 7.71 |
| ESTROE* | 148 | -59.69 | 11.27 | 8.60 | 5.80 |
*ROE estimate. Source: Own elaboration.
Table 16.
Correlation between ROE and estimation.
| N | Correlation | Sig. | |
|---|---|---|---|
| ROE & ESTROE* | 148 | 0.760 | 0.000 |
*ROE estimate. Source: Own elaboration.
Table 17.
Z-test for two-sample means.
| ROE | TROE | |
|---|---|---|
| Mean | 8.54 | 8.60 |
| Variance (known) | 59.45 | 33.68 |
| Observation | 148 | 148 |
| Hypothetical difference of the means | 0 | |
| Z value | -0.07 | |
| p-value (two-tailed) | 0.94 | |
| Critical Z value (two-tailed) | 1.96 |
Source: Own elaboration.
Disclaimer/Publisher’s Note: The statements, opinions and data contained in all publications are solely those of the individual author(s) and contributor(s) and not of MDPI and/or the editor(s). MDPI and/or the editor(s) disclaim responsibility for any injury to people or property resulting from any ideas, methods, instructions or products referred to in the content. |
© 2024 by the authors. Licensee MDPI, Basel, Switzerland. This article is an open access article distributed under the terms and conditions of the Creative Commons Attribution (CC BY) license (http://creativecommons.org/licenses/by/4.0/).
Copyright: This open access article is published under a Creative Commons CC BY 4.0 license, which permit the free download, distribution, and reuse, provided that the author and preprint are cited in any reuse.


