Submitted:
08 July 2024
Posted:
10 July 2024
You are already at the latest version
Abstract
Microalgae cultivation for biotechnological purposes is an expanding field. Their cultivation is usually performed on a liquid culture medium and require the presence of an energy source. Culture media are water-salt solutions containing nitrogen, sulfur, phosphate sources, with trace of transition metals. Light source supplies energy through photosynthesis process, resulting in metabolic reactions and cell growth. Thanks to the huge number of existing species and their diversity, it is possible to exploit alternative water sources with chemical and physical properties far from the commonly used freshwater media. Among these, oilfield or formation waters (AFW) are saline wastewater produced during oil drilling. They represent over 95 % of the total fluids collected from gas and oil wells during fuel extraction. This study exploits the adaptation capability of a Galdieria sulphuraria strain in different salinity conditions to build up a more feasible microalgae-based platform. Batch cultivation of G. sulphuraria was evaluated in a range from 0 to 20 g/L NaCl in terms of growth rate, metabolite content, photophysiology, and intracellular redox state. Moreover, the same strain has been tested for artificial formation water growth in semicontinuous cultivation mode. In these condition, NaCl preadaptation effect has been assessed too. Results clearly demonstrate that biomass composition is influenced from medium salinity. Strains preadapted in 0 to 20 g/L range of NaCl salinity show almost same cell growth profile and a slightly different ratio between lipids, carbohydrates, and proteins. Pigments content and photophysiology point out that variations of osmotic pressure and ionic strength in medium affect Photosystem II (PSII). Regulation of light harvesting is necessary to trigger metabolism shift toward synthesis of metabolites required in the adaptation process.
Keywords:
microalgae
; cyanidiophyceae
; extremophile
; halophile
; salinity
; adaptation
; halotolerance
; pigments
; light harvesting
; formation water
1. Introduction
Water is the solvent for life metabolic reactions [1]. Almost all human activities depend on water, but in most cases the hydric resource is not used wisely. During the last century, human activities have strongly interfered with the global water cycle, modifying the ratio between potable and non-potable water [2,3]. The World Health Organization (WHO) defines drinking water as water that is not harmful to human health [4]. Global and local criteria are established for the assessment and evaluation of microbial and chemical contamination [5,6]. Saline and hypersaline liquids are the most abundant source of water on Earth [7]. They are of natural and anthropic origin and are classified according to their chemical and physical properties. Seawater of marine origin is called thalassohaline (from ancient Greek θάλασσα thálassa, ‘sea’, and ἅλς háls, ‘saline’). Sodium chloride is the main salt, and the pH is between 7 and 8. Natural saline waters originated by leaching from underlying and surrounding minerals are said athalassohaline, magnesium and calcium are the principal ionic species, and their pH value varies widely from 5 to 11. Saline and hypersaline liquid streams are produced as byproduct in almost all human industrial activities. These wastes must be appropriately treated before their release into the environment [8,9]. Any exploitation of saline waters is strongly influenced by the high salt content and the field of potential application, i.e. agricultural, industry, human consumption.
Formation (or oilfield) waters are interstitial liquids originated by atmospheric, sea, and endogenous water infiltration in rocks. They are found with gas and oil underground reserves. Their global production is associated with fossil fuels extraction, representing over 95% of the total collected fluids. The chemical composition can change widely and is influenced by their biogeochemical origin [10]. Screening and classification of a high number of formation waters from different fuel extraction wells are reported for different areas of the planet [10,11,12,13]. Their salinity ranges between few grams to hundreds of grams per liter. Reported chemical and physical analysis identify sodium, calcium, magnesium, chloride, carbonate, bicarbonate, and sulfate as major ionic species. The estimated daily oil production is around 12 million m3 (80 million barrel) in 2024, consequently around 200 million m3 of oilfield waters are daily produced [14]. After some treatment, these waste fluid streams are disposed of in the environment or re-injected into abandoned production wells, resulting in high disposal costs. The large volume of formation water collected each year and the resulting high cost of managing it as waste has led to the need to find new uses for it. Salinity is a driver in the environmental selectivity of living species: ecological niches found in saline and hypersaline sites include superior plants, animals and microbes. Microorganisms able to survive in these conditions are classified as halophiles or halotolerant. They are a group of extremophile living organisms able to uptake salt and/or biosynthesize osmolytes to deal with high ionic strength and high osmotic pressure [15,16]. Among them, halotolerant microalgae are attractive candidate species because they are autotrophs, and are able to survive using salty water as substrate source and growth medium.
Salinity affects photosynthetic processes in higher plants, microalgae and cyanobacteria. In particular, variations in medium salinity show relevant effects on the concentration of ions across thylakoid membranes. This in turn affects the proton motive force (PMF), which drives electron transport between photosystems and ATP synthesis required for carbon dioxide fixation in the Calvin-Benson-Bassham cycle [17]. It is possible to detect salinity effect on light harvesting system monitoring chlorophyll a fluorescence variations [18].
In general, the use of microalgae for biotechnological purposes is an expanding field. Particularly attractive are those species capable of producing metabolites that are in high demand in the food, chemical and pharmaceutical markets. Their autotrophic cultivation is carried out in aqueous media containing nitrogen, sulfur, phosphorus, metal trace element sources [19]. Cultivation water footprint per kg of dry biomass produced has been estimated in 2.4 – 6.8 m3 range [20]. The growth of microalgae on wastewater streams of various origins has been widely reported in the scientific literature, showing their resilience to grow on different media, requiring only a few essential chemical species [21,22]. Strains that tolerate variations in salinity are of particular interest for large-scale cultivation, offering the possibility of using saline and brackish water as a medium. This could significantly reduce the overall impact of the cultivation phase. Increasing the salinity of the medium creates a selective environment capable of reducing the contamination associated with axenic culture. Furthermore, the excess of salt can trigger flocculation of the culture facilitating biomass harvesting [23]. Galdieria sulphuraria seems to be a good candidate for its saline resistance [24]. G. sulphuraria belongs to Cyanidiophytina subphylum, a taxon of unicellular microalgae found in thermo-acidic habitats, where can be found in liquid and on dry rock surface, under direct light and inside rock cracks. Acidic fumaroles, hot springs, acidic mine drainage are very frequently populated by a mixed microbial community of these rare eukaryotic phototrophic species [25]. Galdieria sulphuraria has been partially studied for its biotechnological applications, being a source of valuable chemicals, rich in phycocyanin and allophycocyanin, which can be used as eco-compatible colouring agents for applications in the food and chemical fields. [26]. In addition, its ability to selectively remove heavy metals from contaminated streams and recover precious metals from acidic industrial waste streams has attracted considerable interest. [27]. Pioneering studies on Cyanidiophytina conducted in the second half of the XX Century explored the maximum halo-tolerance of a high number of G. sulphuraria strains - formerly Cyanidium caldarium B forms, evidencing a widespread tolerance to different salinity concentrations [28]. The documented halotolerance of G. sulphuraria and its confirmed biotechnological value make it a suitable candidate for the implementation of its growth on formation water medium.
This study exploits the halotolerant properties of the poly-extremophilic red microalga Galdieria sulphuraria to establish a microalgae-based biorefinery platform using artificially reproduced saline formation water from oil and gas wells and culture media. ACUF_010 G. sulphuraria. The strain has been selected from The ACUF 010 Algal Collection at the University of Naples of Federico II (ACUF) [29] has been preadapted at different salinities of sodium chloride in Allen standard medium in batch mode until the growth stationary phase. The salinity preadapted cultures of strain 010 were used for subsequent growth in semi-continuous mode on artificially prepared brackish formation water (AFW) and the effects of salinity preadaptation on cell growth, metabolite content and photophysiology were monitored.
2. Results
2.1. Assessment of NaCl Effect on Galdieria sulphuraria
2.1.1. Growth, Metabolites Accumulation, and Intracellular Redox State
Batch test results have been reported in Figure 1. As shown in Figure 1a, maximum biomass concentration (1±0.1 g/L) was achieved at initial NaCl concentration between 5 and 10 g/L. As expected, specific growth rates followed a similar trend, stating that an optimal NaCl concentration can be estimated. Notably, further increase of initial NaCl concentration resulted in a critically reduction of biomass concentration (almost 20%). Figure 1.b reports the main metabolite mass fraction: protein content slightly decreases from 50% to 40 ± 3% when NaCl is added to Allen medium, but its amount has a negligible effect on protein losses. Similarly, lipid content is slightly higher when no NaCl is supplied to medium. Notably, carbohydrate content slightly increases at 20 g/L NaCl Allen medium. Chlorophyll a maximum content occurs at 5 g/L NaCl Allen medium, slightly higher than 0 g/L medium, but around 4 times larger than 10 and 20 g/L NaCl medium. Similar trends have been found for total carotenoids (Figure 1.c), however the maximum phycobiliprotein content has been reported for 5-10 g/L NaCl batch test, interestingly matching the higher specific biomass growth rate and the phycobiliprotein purity (Figure 1.f). A more detailed effect on pigments is reported in Figure 1.d-e: even if the ratio between photoactive to protective pigment is statistically comparable except for 10 g/L NaCl Allen medium (slightly higher), the ratio between chlorophyll a and phycobiliprotein is lower for 5-10 g/L NaCl Allen medium, pairing results of both phycobiliprotein purity and the biomass growth rate. However, the parabolic trend of abovementioned ratio let this variable alone unable to be linked to growth rate and photosystem efficiency. Moreover, the ratio between chlorophyll a and total carotenoids significantly drops down only at 20 g/L NaCl Allen medium, suggesting that increasing NaCl concentration should result in inefficient growth. According to Figure 1, liquid phase NaCl plays a significant role on metabolite accumulation and photosystem efficiency of G. sulphuraria, but only phycobiliprotein purity seems to be a significant variable to explain the enhanced growth at 5-10 g/L NaCl Allen medium. Clearly, better investigation on effect of sodium and chloride ions on synthesis of both phycobiliprotein and overall protein pool is required to assess the NaCl-related physiology of G. sulphuraria.
Figure 2. shows ROS content in Galdieria’s cell growth in 0-20 g/L salinity range. Results pointed out a higher concentration of oxidant species inside cell adapted at 0 g/L of NaCl (0NaCl). ROS species are produced as regulatory molecular signals during photosynthesis process [30]. They are also generated during respiration in mitochondria. It has been previously reported that higher ROS content is associated with increasing in lipid synthesis [31]. The same evidence has been noted in the current experiments associating Figure 1.b and Figure 2.
2.1.2. Dynamic of Light Harvesting System and Photosystem Efficiency
Figure 3 shows the dynamics along the batch test of chlorophyll a fluorescence per cell due to the contribution of antenna pigments. Graphs are normalized respect to 0NaCl (dashed black line). The profiles reported in graph Figure 3a correspond to chlorophyll a pigment. Chlorophyll a is a lipophilic molecule and is embedded into thylakoid membrane. Graphs 2.3.b-d show the curves of the hydrophilic phycobilins – phycoerythrin (b), phycocyanin (c), allophycocyanin (d). They are part of the phycobilisome complex that is suspended in the stroma and anchored to the thylakoids. From Figure 3 analysis it is possible to assess that salinity increase - from 0 to 20 g/L of sodium chloride – affects largely fluorescence intensity of phycobilins but has a smaller effect of chlorophyll a fluorescence. After an adaptation time, the fluorescence intensity reaches a stabilization that lasts throughout the entire batch test for all pigments.
The efficiency of Photosystem II (PSII) was tested using pulse amplitude modulation (PAM) experiments as the end point of the batch test. Figure 4 shows the efficiency of PSII for Galdieria sulphuraria cell cultures grown in 0-20 g/L salinity range. It can be assessed that 20 g/L salinity significantly affects PSII. This result correlates with the variation of the chlorophyll fluorescence intensity reported in Figure 3.a-d and support the growth rate decrease shown in Figure 1. The effects of the tested salinity are also noticeable from the relative parameter of the electron transfer rate (rETR) shown in Figure 5. The analysis of the graph reveals that for a light intensity between 200 and 400 µEinstein, the optimum salinity is in 5 - 10 g/L range. These results positively correlate with the steady-state biomass concentration and specific growth rate reported in Figure 1.a.
2.2. Artificial Formation Water (AFW) Cultivation Test
2.2.1. Dynamics of Cell Growth and Accumulation of Primary Metabolites and Pigments
The dynamic of G. sulphuraria in AFW autotrophic cultivation is reported in Figure 6 and can be summarized as follows: during the adaptation batch phase, G. sulphuraria has proved to be able to survive and grow in AFW with a comparable growth rate for both NaCl preadapted or not-preadapted cultures. The difference in terms of achievable biomass concentration can be linked to the higher starting biomass concentration of no-preadapted culture and its lag-phase minimization. However, starting from a specific time of -1, the biomass growth rates are comparable. During the transitory phase (semicontinuous), both culture systems aligned and any difference or effect of preadaptation is negligible, as expected since the liquid media (AFW) is replacing the overall PBR volume. This result is clearly demonstrated considering liquid phase conductibility that reach the AFW value after 1.5 specific time (Figure 6.b). Steady state can be reached after 1.5 specific time and its stability lasted up to 3 specific time. As expected, biomass concentration is unsensitive to NaCl preadaptation. The metabolite content has been assessed for biomass harvested in this phase. As shown in Figure 6.c-d, no significant difference has been observed from preadapted or not cultures, except for a slightly decrease of protein and an increase of carbohydrates. This metabolite mass fraction clearly paired batch test at 0 and 20 g/L NaCl Allen media, thus it’s apparently possible to preadapt biomass to tailor metabolite productivity: for example, the 20 NaCl preadapted cells can grant a 34 ± 3 % higher carbohydrate productivity, but with a 36 ± 2 % lower protein productivity. Moreover, lipid content is significantly increased (almost 2-fold) in AFW with respect to batch cultivation, while pigments are comparable to 5 g/L NaCl Allen medium batch culture (Figure 1). However, the steady state biomass concentration is far lower than what is achievable with fresh and optimized culture media. According to Figure 7, AFW has an iron concentration far larger than Allen medium and no magnesium, a structural element of chlorophyll a. After 3 specific time, a wash out condition occurred, as expected since magnesium is not fed to reaction system (Figure 7), thus the steady state can be preserved only until all the nutrients required are in liquid system. Switching from steady state to wash out, a significant decrease of FV/FM from 0.5 ± 0.02 to 0.3 ± 0.05 has been observed (results not shown) in both preadapted samples, supporting the speculation about the role of photosynthetic apparatus and its deficiency when no magnesium is supplied. After 4 specific times, the semicontinuous operation has been stopped to avoid complete wash out. The following batch phase showed a constant biomass concentration; thus, the biomass concentration drops in the wash out phase was not related to other operating conditions, but only to the continuous operation mode of the reactor.
The results of semi-continuous cultivation demonstrated that AFW can be used for G. sulphuraria mass cultivation since phosphorus content (buffer agent) is comparable to Allen medium, while nitrogen can be uptaken and metabolized as shown in both adaptation batch and steady state phase (Figure 6.a.). Moreover, both sodium and chloride concentrations are comparable to 5 – 10 g/L NaCl Allen medium, thus, no dilution is required to avoid biomass growth rate reduction, as regards NaCl. However, the high iron content and the absence of magnesium can suggest that some metals should be removed/supplied (Figure 7). Clearly, this strategy has to be optimized in terms of stability, but the higher lipid productivity in a low value media (thus, substrate) perfectly fits the large market demands of fatty acid for food supplement and energy.
2.2.2. Dynamic of Light Harvesting System: Artificial Formation Water Test
In vivo chlorophyll a fluorescence depends on light energy source, absorption cross sections of light harvesting system, and efficiency of photosynthesis process overall to fix light energy into carbohydrates [32]. Figure 8 shows the dynamics of in vivo chlorophyll a fluorescence per cell due to photosynthetic pigments along the semi-continuous AFW test. In particular, curves show the fluorescence intensities for 20NaCl normalized respect to 0NaCl sample (dashed black line). In case of 20NaCl, fluorescence decreases for all pigments, and no relevant differences were observed between chlorophyll a and phycobilins. Figure 9 shows absorption cross section dynamics for photosynthetic pigments normalized respect to cell number. The data are normalized with respect to 0NaCl (dashed black line). Despite the medium salinity difference - shown in Figure 6.b - 0NaCl and 20NaCl light harvesting systems have the same absorption cross section at day 0 of the AFW test. Absorption cross section variations are associated with light harvesting regulation process. Fluctuations are in some case almost symmetric respect to dashed black line, this means that similarly both preadapted samples – 0NaCl and 20NaCl - actuated regulation of light absorption.
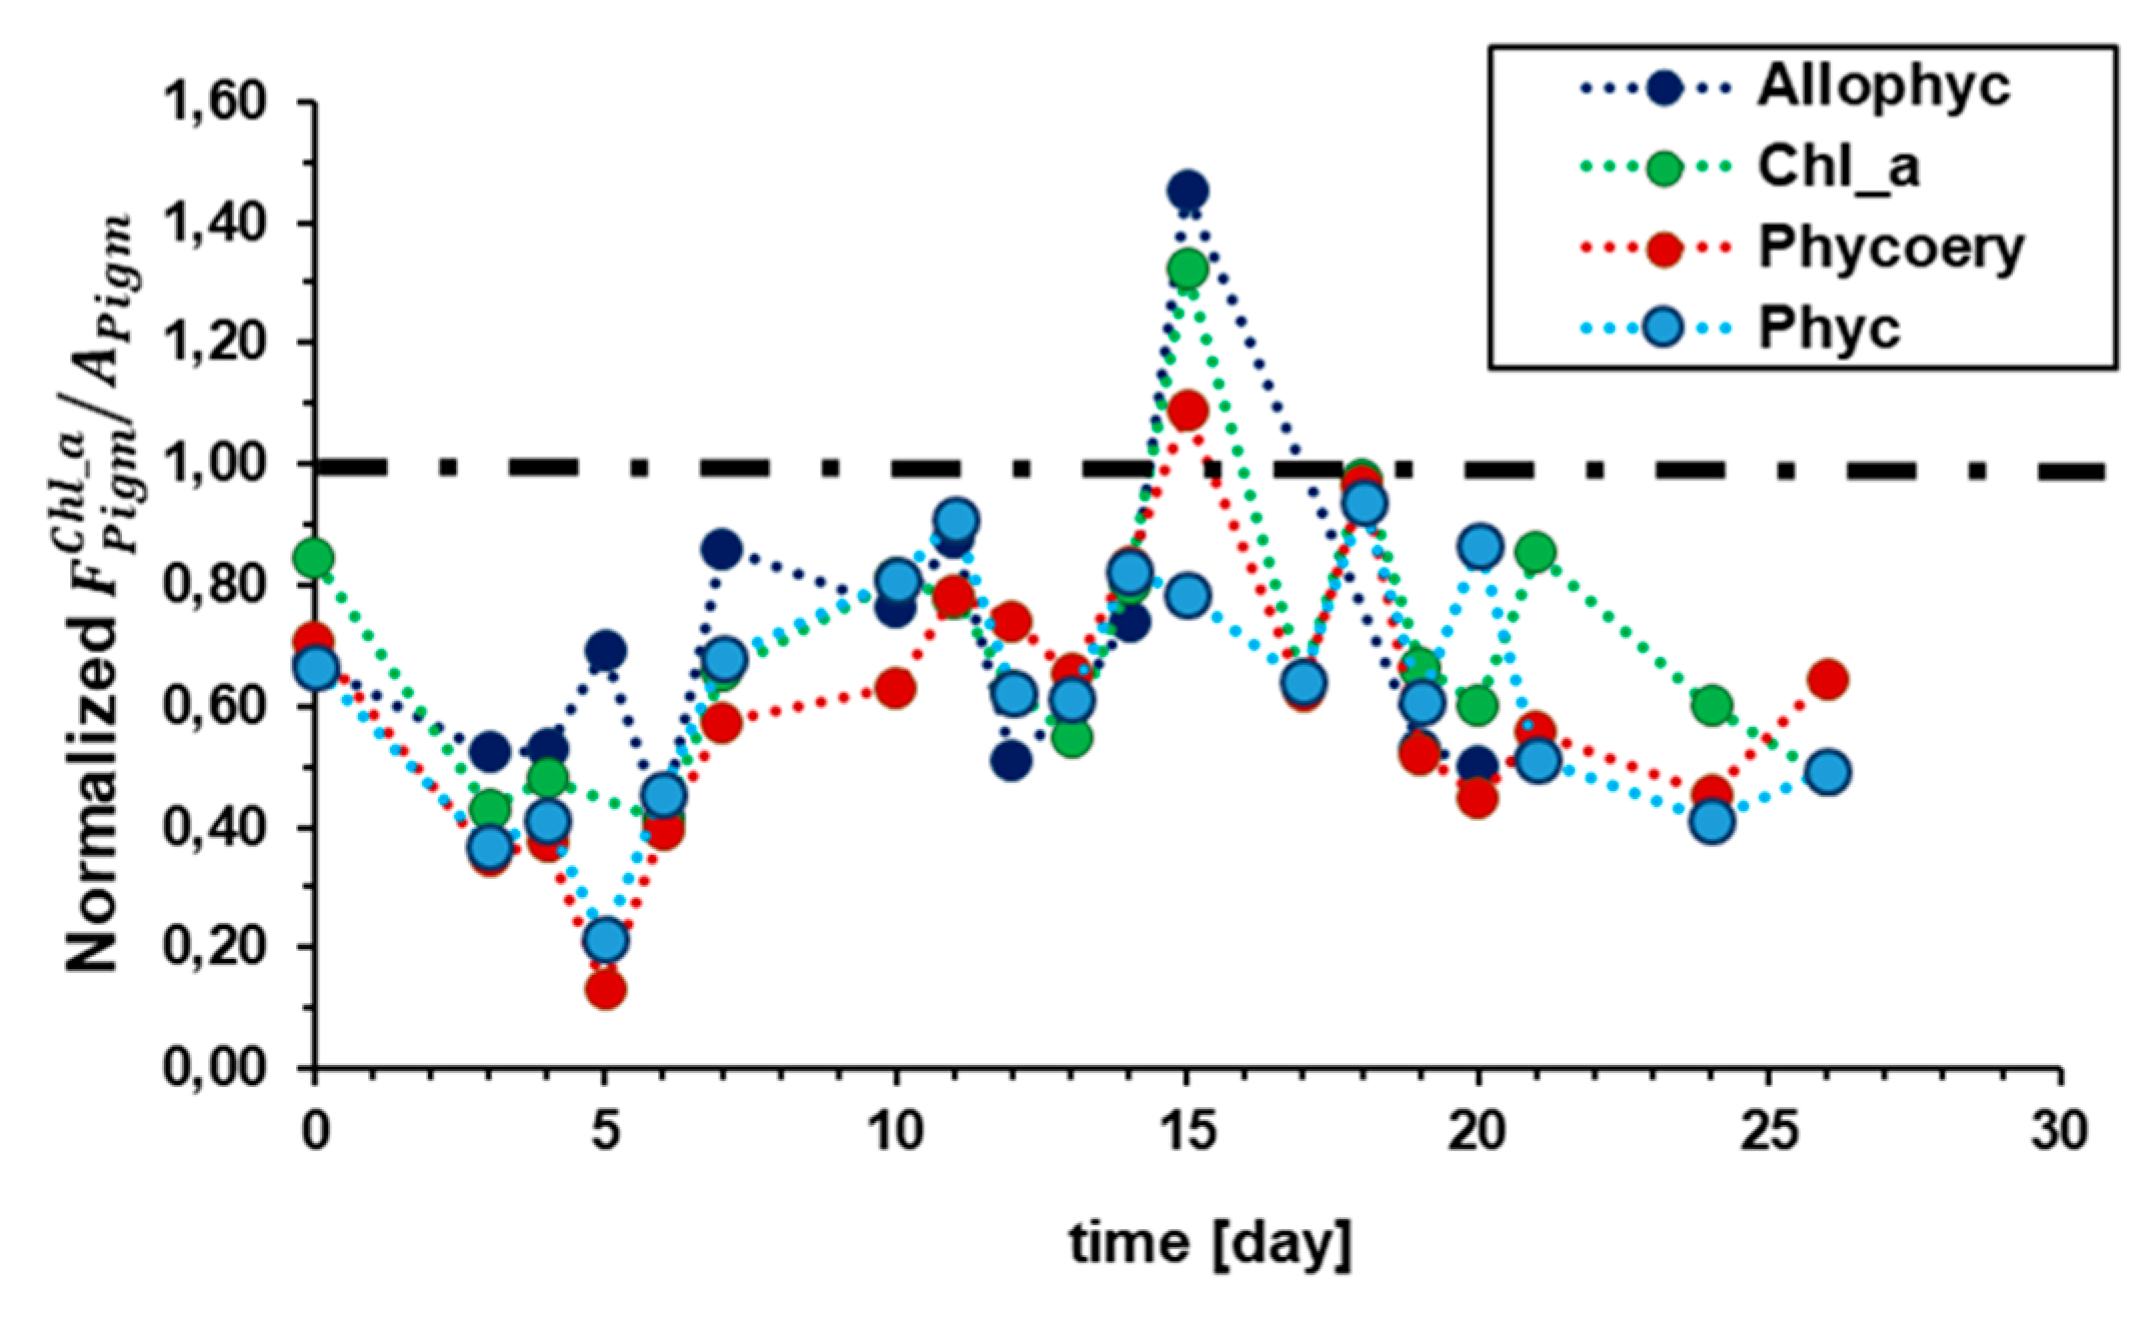
Figure 10 reports the dynamics of the chlorophyll a fluorescence to absorption cross section ratio for chlorophyll a and phycobilins. Data are represented as normalized respect to 0NaCl sample (dashed black line). The displacement between 0NaCl and 20NaCl is maximum in first six days, and then reduces up to reach stabilization, along all cultivation time. This reflects the dynamics of medium conductivity reported in Figure 6.b. It can be argued that the preadaptation to higher salinity remains imprinted in the PSII - and perhaps in the PSI - configuration throughout the AFW test. On the other hand, the differences between 0NaCl and 20NaCl for biomass yield disappeared after a certain time.
3. Discussion
This research is focused on exploitation of the saline wastewaters largely produced during fuel extraction as medium for microalgae cultivation. The salinity of these fluids span from few grams per liter to oversaturated salt solutions. In this specific case, an artificially prepared saline oilfield water with salinity of around 15 g/L was prepared, according to analysis report of formation water produced in Italy during fuel extraction [33]. Figure 7. shows the main chemical species content relative to standard Allen media. Underground waters represent a hydric resources widely distributed on the planet. The salinity of groundwater depends on the depth at which it is collected [34,35]. In oilfield waters case, high salinity does not allow human’s direct consumption, but these liquid streams could be applied in agriculture and industry. Microalgae are interesting for food, feed, pharmaceutical and chemical markets as rich sources of valued chemicals [26]. The polyextremophile red microalgae Galdieria sulphuraria thrives in habitats that are characterized by periodic hydration (wet) and desiccation (dry) processes along season alternation [36]. This means that cells are adapted to continuous variation of medium salinity. Halotolerant character is indeed reported by some previous screening [28], and confirmed through present tests. Decreasing of in vivo chlorophyll a fluorescence is among the well known facts reported from Barber in 1980 [37]. This aspect is confirmed along the entire batch and AFW tests. Adaptation to 20 g/L of sodium chloride affects both the photophysiology and the proportion between the accumulated metabolites –Figure 6.c – d and Figure 8, Figure 9 and Figure 10. No significant differences have been noticed in terms of biomass and growth rate as reported in Figure 6.a. This testify that G. sulphuraria readily adapts its metabolism to salinity variations. The variations of in vivo chlorophyll a fluorescence is related to electron transfer between PSII and PSI. In particular, the redox state of the electron carriers in electron transfer chain is related to photosystems efficiency to process light energy. The effect of salinity variation on photosynthetic processes is known for superior plants, green algae and cyanobacteria. Ions concentration on both sides of thylakoid determines a chemical potential that together with proton gradient are the principal parameters that contribute to the proton motive force (pmf) [18]. Pmf drives electron transport from PSII to PSI, and ATP synthesis [38]. From Figure 8. it is possible to notice that chlorophyll a fluorescence per cell is lower for the 20NaCl sample respect to 0NaCl sample. This is due to variation in absorption cross section for each photosynthetic pigment and variation in efficiency of photosynthetic process overall. From graph reported in Figure 9 it is possible to follow the absorption cross section dynamics during cultivation. It is so possible to verify that absorption of light radiation is continuously regulated during cell growth. The effects of light harvesting regulation on metabolism are shown in Figure 6.c-d as metabolites accumulation. As previously reported, carbohydrates are higher in case of 20NaCl adapted strain; probably, osmolytes production is of influence on this content [39]. Lipids are almost same for both preadapted strains. It is reported a higher value for protein content in 0NaCl case; the higher phycobilin content per cell surely contributes to this difference. This study focuses on the use of saline effluents, largely produced during fuel extraction, as a medium for microalgae cultivation. The salinity of these fluids ranges from a few grams per liter to supersaturated saline solutions. In this specific case, an artificially prepared saline oilfield water with a salinity of about 15 g/L was prepared according to the analysis report of formation water produced in Italy during fuel extraction [33]. Figure 7 shows the main chemical species content relative to standard Allen media. Underground waters represent a hydric resource widely distributed on the planet. The salinity of groundwater depends on the depth at which it is collected [34,35]. In oilfield waters case, high salinity does not allow human’s direct consumption, but these liquid streams could be employed in agriculture and industry. Microalgae are of interest to the food, feed, pharmaceutical and chemical markets as a rich source of valuable chemicals [26]. The polyextremophile red microalgae Galdieria sulphuraria thrives in habitats that are characterized by periodic hydration (wet) and desiccation (dry) processes along season alternation [36]. This means that cells are adapted to continuous variation of medium salinity. Halotolerant character is indeed reported by some previous screening [28], and confirmed through present tests. In vivo decreasing of chlorophyll a fluorescence associated with salinity increasing is among the well known facts reported from Barber since 1980 [37]. This aspect is confirmed along the entire batch and AFW tests. Adaptation to 20 g/L sodium chloride affects both the photophysiology and the ratio between the accumulated metabolites - Figure 6.c - d and Figure 8, Figure 9 and Figure 10. On the other hand, no significant differences were observed in biomass and growth rate, as shown in Figure 6.a. This indicates that G. sulphuraria readily adapts its metabolism to salinity changes. The variations of chlorophyll a fluorescence in vivo are related to the electron transfer between PSII and PSI. In particular, the redox state of the electron carriers in the electron transfer chain is related to the efficiency of photosystems to process light energy. The effect of salinity variation on photosynthetic processes is known for higher plants, green algae and cyanobacteria. The concentration of ions on either side of the thylakoid determines a chemical potential which, together with the proton gradient, is the main parameter contributing to the proton motive force (PMF) [18]. Pmf drives electron transport from PSII to PSI, and ATP synthesis [38]. From Figure 8. it can be seen that the chlorophyll a fluorescence per cell is lower for the 20NaCl sample than for the 0NaCl sample. This is due to variation in absorption cross section for each photosynthetic pigment and variation in overall efficiency of photosynthetic process. From Figure 9 it is possible to follow the dynamics of the absorption cross-section during cultivation. It is thus possible to verify that the absorption of light radiation is continuously regulated during cell growth. The effects of light harvesting regulation on metabolism are shown in Figure 6.c-d as metabolites accumulation. As previously reported, carbohydrates are higher in the 20NaCl adapted strain, probably influenced by osmolytes production [39]. Lipids are almost the same for both pre-adapted strains. A higher value for protein content is found in the 0NaCl case; the higher phycobilin content per cell certainly contributes to this difference.
The effect of NaCl on both growth rate, metabolite accumulation and photosystem efficiency has been reported for a large number of green freshwater microalgae in literature. At present author knowledge, poor data have been collected on Cyanidiales, expecially on G. sulphuraria. However, an optimal concentration of NaCl has been observed for both diatom Nitzschia laevis [40] and Scenedesmus sp. [41]: in both experimental works, a concentration of 5-10 g/L of NaCl granted the optimum of biomass growth rate, pairing present work contribution results. Moreover, Elloumi et al., (2020) observed that increasing the NaCl medium concentration resulted in a maximum of both chlorophyll a, chlorophyll b and total carotenoids at 10 g/L NaCl, similarly to phycobiliprotein purity, chlorophyll a and carotenoids trends reported in present work. These results granted that photosystem response to NaCl is the main driver of autotrophic microalgae growth optimization and in particular both chlorophyll a and accessories pigments are involved, depending on cell availability, clearly. Unfortunately, no data are available on Nitzschia laevis pigments, since growth tests were carried out heterotrophically: however, the 5-10 g/L optimal value found by G. Q. Chen et al., (2008),suggest that NaCl concentration affects metabolism of cells independently from the carbon source. However, detailed investigations are mandatory. For example, several works reported different conclusions: [42] has shown that increasing NaCl to 12 g/L results in lower achievable biomass concentrations, but the growth rate was unsensitive up to the reach of steady state phase in Chlamydomonas reinhardtii; they reported a drop of total chlorophyll but a constant carotenoid mass fraction in biomass collected at larger NaCl concentration. Notably, Fal et al., (2022) has demonstrated that carbohydrate content significantly increases (35-40 %) at the expense of protein content. These results may suggest that carbohydrate accumulation occurs when stress conditions are no longer negligible, as happened for G. sulphuraria at 20 g/L NaCl Allen medium in present work. Supporting data have been presented by [39], reporting that the carbohydrate content and the ratio between glycogen and fluoridoside can be optimized inducing NaCl osmotic stress in heterotrophic batch cultivation of G. sulphuraria. It is worth noting that a 2-fold higher glycogen and overall intracellular sugar productivity has been reported at NaCl concentration larger than 20 g/L, matching present work results. Interestingly, no lipid enhancement has been reported in present contribution: in green microalgae, osmotic stress is generally induced to enhance lipid accumulation and optimize their fraction and a poor effect can be found on Fv/Fm value [43]. It is mandatory to underline, however, that batch growth in present work were stopped during exponential phase and that it is well known that Cyanidiales lipid/sugar accumulation pathway significantly differs from other microalgae, including the uncoupling of intracellular sugar consumption and lipid accumulation [26]. However, detailed research into this aspect is needed. For example, several works reported different conclusions: [42] has shown that increasing NaCl to 12 g/L results in lower achievable biomass concentrations. In Chlamydomonas reinhardti, however, the growth rate was insensitive until the steady state phase was reached; the authors reported a decrease in total chlorophyll but a constant carotenoid mass fraction in biomass collected at higher NaCl concentrations. Notably, Fal et al., (2022) has demonstrated that carbohydrate content significantly increases (35-40%) at the expense of protein content. These results may suggest that carbohydrate accumulation occurs when stress conditions are no longer negligible, as happened for G. sulphuraria at 20 g/L NaCl Allen medium in present work. Supporting data was presented by Martinez-Garcia and van der Maare [37], who reported that the carbohydrate content and the glycogen to fluoridoside ratio can be optimised by inducing NaCl osmotic stress in heterotrophic batch cultivation of G. sulphuraria. It is worth noting that a 2-fold increase in glycogen and total intracellular sugar production was found at NaCl concentrations above 20 g/L, which is consistent with the results of the present work. Interestingly, we did not find any lipid enhancement: in green microalgae, osmotic stress is generally induced to enhance lipid accumulation and optimise its fractionation, and little effect on Fv/Fm value can be detected [41]. However, the batch growth in the present work was stopped during the exponential phase, and it is known that the lipid/sugar accumulation pathway of Cyanidiales is significantly different from that of other microalgae, including the uncoupling of intracellular sugar consumption and lipid accumulation [26].
4. Materials and Methods
4.1. Assessment of NaCl Effect on Galdieria sulphuraria Growth
The effect of NaCl on G. sulphuraria growth has been assessed testing several con-centrations of NaCl (0, 5, 10 and 20 g/L) in batch experiments in order to artificially re-produce some of the saline formation water salt concentrations obtained from fuel extraction plants [10]. Briefly, a bubble column photobioreactors (PBRs, 0.04 m ID, 0.8 m high) have been inoculated. Vertical and cylindrical glass bubble column photobioreactors (PBRs, 0.04 m ID, 0.8 m high) have been inoculated to achieve 0.36 ± 0.03 g/L initial biomass concentration of G. sulphuraria preadapted in Allen medium (see Section 4.1.1). The working volume was set at 0.8 L, and 0.2 µm filters were used to sterilize gas flow inlet. The photobioreactors were housed in a thermostatic chamber at constant white light intensity of 250 μmolPh/m2 s (one side) and a temperature of 35±2 °C. A constant flow of air (15 L/min) has been fed to photobioreactor bottom to provide mixing and carbon source for autotrophic growth. Batch growth tests lasted up to 15 days. Once the information on the NaCl resistance in batch mode was collected, a second step of the experiment using artificial formation water (AFW) as medium was carried out. AFW assessment as culture medium has been evaluated in dynamic test. Cells preadapted to NaCl (20 g/L batch culture) and not preadapted (0 g/L batch culture) has been used as inoculum. Briefly, a semicontinuous cultivation strategy has been exploited and biomass concentration monitored during time. The dynamic assessment included five phases: preadaptation batch (i) to prove that G. sulphuraria can survive and grow in AFW; transitory (ii) at start semicontinuous cultivation to reach the steady state phase (iii). Steady state has been monitored to assess the stability of AFW as culture medium and test if substrate supply was mandatory. After steady state phase, a wash out phase (iv) occurred, thus, semicontinuous cultivation was stopped and the reaction system was let in a batch mode (v). Results have been reported as a function of specific time t/τ, where τ is the hydraulic residence time of PBR liquid phase.
To ensure the viability of the cultures, they were monitored daily throughout the entire experiment in term of biomass concentration, conductivity, and photophysiology (Section 4.1.3.- Cultivation monitoring). At the end of the experiments - after the 15th day for the batch culture and in the steady state (iii) for the dynamic one -, evaluation on the photosystem efficiency (Section 4.1.7-PAM fluorimeter assay) and biomass quality (Section 4.1.7 -Proximate analysis) were performed.
The results of both tests have been reported in terms of specific biomass growth rate μ (equation 4.1), maximum achievable biomass concentration, metabolites mass fraction wMi, phycobiliprotein purity PB-P and pigments ratio (equation 4.2-4.3).
where Xfin and X0 and tfin and t0 are the biomass concentrations and time at start and after 15 days of batch tests, respectively; mi and mX are the mass of metabolite Mi (protein, carbohydrate, lipid, chlorophyll a, phycobiliprotein and total carotenoids) and biomass respectively.
4.1.1. Culture Media
In batch tests media have been prepared suppling NaCl to Allen medium. The recipe of Allen medium has been retrieved from UTEX collection (https://utex.org/): after mixing required salts, the solution has been acidified down to 1.5 pH according to the indication of ACUF (http://www.acuf.net) which provided and maintained the tested strain of G. sulphuraria (ACUF_010). The chosen concentrations of NaCl were set at 0, 5, 10 and 20 g/L. Each media has been prepared, then filtered through a 0.22 μm diameter filter in sterilized (autoclaved) flasks, thus stored at dark and at 4 °C. Before use, the temperature of media has been raised up to 37 ± 2 °C to avoid thermal stress to cells at inoculum.
In the semicontinuous tests, artificial formation water medium (AFW) was used. Medium was prepared referring to the analysis report of oilfield water produced during fuel extraction Italy [33], that we received as confidential document. Following is reported the list of its main chemical species content:
| Chemical species | Amount [mg/Kg] |
| NH4+ | 154 |
| NO3- | 7,48 |
| NO2- | <1,2 |
| SO42- | 652 |
| SO32- | 16 |
| S2- | 94 |
| PO42- | 18 |
| Ca2+ | 969 |
| Cl- | 6990 |
| Na+ | 4480 |
| Fe | 1,34 |
| F- | 6,44 |
Medium has been prepared through dissolution of reagent grade salts as source of the above listed chemical species in milli-Q water. So prepared media has been acidified to 1.5 pH value and sterilized by filtration on 0.22 µm membrane filter.
4.1.2. Cultivation Conditions
Batch and dynamic tests have been carried out in 800 mL bubble column photobioreactor (PBR) with a 15 L/min air supply fed from the bottom of the PBR. The autotrophic cultivation was ensured trough continuous white LED illumination, supplied only to one side of the PBR - approximately one half of surface enlighten - at 250 μmolPh m−2 s−1. The temperature was set at 35 ± 2 °C as reported to be the optimal growth temperature for G. sulphuraria (http://www.acuf.net). Operating variables were set according to batch tests. For semicontinuous cultivation, a dilution rate of 0.2 day−1 was set. This value was set according to preliminary data on G. sulphuraria semicontinuous cultivation in Allen medium, resulting in a stable steady state (results not shown).
4.1.3. Cultivation Monitoring
Biomass concentration was monitored throughout the entire experiment. Biomass concentration in g/L was measured spectrophotometrically at ONDA spectrophotometer at 550nm as wavelength. A calibration curve using the same strain was performed. Electrical conductivity has been measured daily by a Hanna HI8633 conductometer in each photobioreactors.
4.1.4. Intracellular Redox Equilibrium
Redox intracellular state has been assessed with 2,7-Dichlorodihydrofluorescein diacetate (H2DCF-DA) fluorescent probe (Sigma,USA). This fluorescence probe is able to generate a fluorescence emission once oxidated from the intracellular environment [34,35]. 10 µM solution of H2DCF-DA probe has been prepared in dimethyl sulfoxide (DMSO). Probe solution and cell culture have been mixed and incubated for 30 min in the dark at 37 °C. Fluorescence emission spectra have been recorded in 510-700 nm range after sample excitation at 490 nm by Perkin Elmer LS 50B fluorescence spectrophotometer. ROS parameters reported in Figure 2. have been obtained from data elaborated as the ratio between emission due to the probe at 530nm, and emission due to pigments autofluorescence at 680 nm. This has been normalized to same data collected from emission fluorescence spectrum of sample without the probe. Redox intracellular state has been assessed with 2,7-Dichlorodihydrofluorescein diacetate (H2DCF-DA) fluorescent probe (sigma,USA). This fluorescence probe is able to generate a fluorescence emission once oxidated from the intracellular environment [43-45]. 10 µM solution of H2DCF-DA probe has been prepared in dimethyl sulfoxide (DMSO). Probe solution and cell culture have been mixed and incubated for 30 min in the dark at 37°C. Fluorescence emission spectra have been recorded in 510-700 nm range after sample excitation at 490 nm by Perkin Elmer LS 50B fluorescence spectrophotometer. ROS Parameters reported in Figure 2. have been obtained from data elaborated as the ratio between emission due to the probe at 530nm, and emission due to pigments auto-fluorescence at 680 nm. This has been normalized to same data collected from emission fluorescence spectrum of sample without the probe.
4.1.5. Effect of Salinity on Dynamic of Light Harvesting System
Steady state fluorescence excitation spectra have been recorded in 400-660 nm range collecting emission at 680 nm by a Perkin Elmer LS 50B fluorescence spectrophotometer. Spectra have been collected daily in triplicate for each of the salinity tested. Fluorescence intensities relative to wavelengths corresponding to absorption maxima for all photosynthetic pigments have been sampled from the full spectra and applied for data elaboration. The sampled wavelengths and the corresponding pigment: 435 nm chlorophyll a; 570 nm phycoerythrin; 620 nm phycocyanin, 650 nm allophycocyanin. Data have been normalized for cell number. Results are shown in Figure 3 and 2.10 as normalized respect to 0NaCl sample. Data are reported as average of triplicate measurements.
Absorbance spectrum in 400 to 700 nm range has been collected daily. Absorbance values corresponding to absorption maxima wavelengths of photosynthetic pigments have been collected from the full spectrum. Absorption maxima have been selected in ±10 range respect to the following wavelengths: 435 nm for chlorophyll a, 570 nm for phycoerythrin, 620 nm for phycocyanin, and 650 for allophycocyanin. Data reported in Figure 9 have been elaborated as ratio of absorbance due to pigments to optical density (OD) at 750 nm. Before each measurements samples have been properly diluted in order to obtain OD lower than 0.8.
4.1.6. Error Propagation and Representation
Error propagation has been done applying the formula reported in equations (4.4-4.5) [46]:
For sums and differences: Z= X±Y; where X±∆X and Y±∆Y;
For products and ratio: Z= X/Y or X*Y; where X±∆X and Y±∆Y
4.1.7. PAM Fluorometry Assay
The photosynthetic performance of culture was evaluated at the end of each experiment using a FMS2 Hansatech PAM fluorometer. Specifically, the analysis of the batch culture was performed after 15 days, while the analysis of the dynamic was performed in their steady state phase (iii). Samples were adapted at dark for 30 min and were dispensed into a 4 mL quartz glass cuvette containing a magnetic micro-agitator to ensure homogeneity during tests [47]. Saturating light was applied to measure F0 (minimum fluorescence yield) and Fm (maximum fluorescence yield), thus maximum quantum efficiency of Photosystem II was calculated according to the equation 4.6:
A sequence of 9 increasing actinic irradiance, ranging from 36.56 µEin to 1213 µEin was set in order to evaluate Fs (Fluorescence yield in the steady-state in light-adapted samples), F’0 (Minimum fluorescence yield in light-adapted samples), F’m (Maximum fluorescence yield in light-adapted samples). Before each actinic irradiance, the samples were incubated at dark for 2 min. Relative electron transport rate (rETR) was calculated as reported in equation 4.7:
where F’m- F’0 represent the PS II operating efficiency and estimates the efficiency at which light absorbed by PS II is used, and PPFD is the photosynthetically active photon flux density (mol quanta m−2s−1) [47,48].
4.1.8. Proximate Analysis of Biomass
The biomass obtained at the end of each experiment were characterized in term of primary metabolites and pigments content. In order to assess carbohydrates, proteins and phycobiliproteins, a protocol for the extraction of polar lysate described by [49] was followed with some modifications. In brief, a sample was prepared suspending a known amount of wet biomass in phosphate buffer solution at pH=7.4. The samples were frozen on dry ice for 5 min, followed by 10 min at 65 °C. The freezing and thawing step was repeated 5 times to ensure cell breakdown. Once the samples reached room temperature, 1 mL of a solution of 25 % methanol in 1M NaOH and micrometric beads was added, then the samples were shaken for 15 min. From the lysate obtained it was possible to measure proteins phycobiliproteins and carbohydrates. Carbohydrates was assessed using the phenol-sulfuric acid method, as described by [49]. In summary, an Anthrone solution was prepared at a concentration of 2 g/L in prechilled 75 % H2SO4. Then, 0.2 mL of the sample was mixed with 0.4 mL of prechilled 75 % H2SO4 solution and 0.8 mL of the Anthrone solution. The sample tubes were heated at 100 °C for 15 min, and the absorbance of the samples was measured at 578 nm. Protein quantification was carried out using Bradford assay [50] using bovine serum albumin as standard. Total phycobiliproteins were calculated as the sum of phycocyanin and allophycocyanin. The phycobiliprotein concentrations were quantified spectrophotometrically using equations (4.8-4.9) [51].The biomass obtained at the end of each experiment were characterized in term of primary metabolites and pigments content. In order to assess carbohydrates, proteins and phycobiliproteins, a protocol for the extraction of polar lysate described by [49] was followed with some modifications. In brief, a sample was prepared suspending a known amount of wet biomass in phosphate buffer solution at pH=7.4. The samples were frozen on dry ice for 5 min, followed by 10 min at 65 °C. The freezing and thawing step was repeated 5 times to ensure cell breakdown. Once the samples reached room temperature, 1 mL of a solution of 25% methanol in 1M NaOH and micrometric beads was added, then the samples were shaken for 15 min. From the lysate obtained it was possible to measure proteins phycobiliproteins and carbohydrates. Carbohydrates was assessed using the phenol-sulfuric acid method, as described by [49]. In summary, an anthrone solution was prepared at a concentration of 2 g/L in prechilled 75% H2SO4. Then, 0.2 mL of the sample was mixed with 0.4 mL of prechilled 75% H2SO4 solution and 0.8 mL of the Anthrone solution. The sample tubes were heated at 100°C for 15 min, and the absorbance of the samples was measured at 578 nm. Protein quantification was carried out using Bradford assay [50] using bovine serum albumin as standard. Total phycobiliproteins were calculated as the sum of phycocyanin and allophycocyanin. The phycobiliprotein concentrations were quantified spectrophotometrically using equations (4.8-4.9) [51].
where CPC and CAPC represent respectively the concentration of phycocyanin and allophycocyanin.
For the extraction of lipids, the samples were subjected to an overnight solvent extraction in chloroform: methanol solution 1:2 v/v under gentle agitation [52]. Then the phase separation was induced adding distilled water. The lower phase was mainly composed of chloroform in which the lipids are dispersed. This fraction was collected and used to measure the amount of lipids using the sulfo-phospho-vanillin (SPV) assay with some modifications [53]. Briefly, the lipid containing sample was dried and then 100 μL of water and 2 mL of H2SO4 were added. The sample tubes were heated at 100 °C for 10 min and subsequently cooled in an ice bath for 5 min. Next, the phospho-vanillin reagent was prepared by dissolving 0.6 g of vanillin in 10 mL of absolute ethanol, 90 mL of deionized water, and 400 mL of concentrated phosphoric acid. A total of 60 μL of each sample and 150 μL of the reagent were added to a well in a 96-multiwell plate. The plate was then incubated at 37 °C for 15 min with orbital shaking, and the absorbance was measured at a wavelength of 530 nm.
The samples for the remaining pigments quantification (chlorophyll a and total carotenoids) was performed suspending 1gDW/L of biomass in pure methanol and incubate it at 37 °C overnight with gentle shaking in the dark. The pigments concentrations were quantified spectrophotometrically measuring the absorbance at 470 nm, 646 nm and 663 nm and using equations (4.10-4.11) [54]:The samples for the remaining pigments quantification (chlorophyll a and total carotenoids) was performed suspending 1gDW/L of biomass in pure methanol and incubate it at 37°C overnight with gentle shaking in the dark. The pigments concentrations were quantified spectrophotometrically measuring the absorbance at 470 nm, 646 nm and 663 nm and using equations (4.10-4.11) [54]:
Notably, the ratio of total photoactive (chlorophyll a and phycobiliprotein) and photoprotective (total carotenoids) has been estimated to assess the overall status of photosystem at different NaCl concentrations; more details have been provided through the ratio of single pigment classes. Each test to assess the mass fraction of metabolites has been repeated during exponential phase of cultures: since results were comparable, an average value has been reported in Section 2.1.
The extraction protocols and the measurements were performed in duplicate.
5. Conclusions
It has been demonstrated that Galdieria sulphuraria readily adapts its metabolism in a wide salinity range - 0-20 g/L NaCl. As expected for a phototroph, light harvesting system is affected by alteration in environmental chemical and physical parameters. Mean salinity variation is associated with the regulation of light harvesting. In order to maintain cell homeostasis, a metabolic shift is required to cope with salinity fluctuations. Higher salinity requires that the metabolite content of Galdieria sulphuraria cells increases in carbohydrates and decreases in proteins. Clearly, industrial-scale use of oilfield water requires further analysis and research, but here are some solid findings to work on.
Author Contributions
For research articles with several authors, a short paragraph specifying their individual contributions must be provided. The following statements should be used “Conceptualization, D.P., L.M., E.A., M.L., N.N., A.M. and A.P.; methodology, D.P., L.M., E.A., M.L., N.N.; software, D.P., L.M.; validation, D.P., L.M.; formal analysis, D.P., L.M.; investigation, D.P., L.M.; resources, A.M. and A.P.; data curation, D.P., L.M.; writing—original draft preparation, D.P., L.M., E.A.; M.L., N.N.; writing—review and editing, D.P., L.M., E.A., M.L., N.N., A.M. and A.P.; visualization, D.P., L.M., F.O., M.F.S.; supervision, A.M. and A.P.; project administration, A. M. and A. P.; funding acquisition, A.M. and A.P. All authors have read and agreed to the published version of the manuscript.
Funding
This research received no external funding.
Data Availability Statement
Data are available on request.
Acknowledgments
The authors acknowledge The Algal Collection at the University of Naples Federico II for providing tested strain.
Conflicts of Interest
The authors declare no conflicts of interest.
References
- M. Frenkel-Pinter, V. Rajaei, J. B. Glass, N. V. Hud, and L. D. Williams, “Water and Life: The Medium is the Message,” J. Mol. Evol., vol. 89, no. 1–2, pp. 2–11, 2021. [CrossRef]
- C. J. Vorosmarty and D. Sahagian, “Anthropogenic disturbance of the terrestrial water cycle,” Bioscience, vol. 50, no. 9, pp. 753–765, 2000. [CrossRef]
- UNESCO, Water in a Changing World. 2009.
- World Health Organization (WHO), Guidelines for drinking-water quality, vol. 21, no. 6. 2004.
- American Public Health Association, American Water Works Association, and Water Environment Federation, “Standard Methods for the Examination of Water and Waste Water,” Stand. Methods Exam. Water Waste Water, pp. 3–104, 1992.
- A. ISRA-CNR, Analytical Methods for Water. Agenzia per la protezione dell’ambiente e per i servizi tecnici (APAT) Istituto di Ricerca sulle Acque - Consiglio Nazionale delle Ricerche (ISRA-CNR). 2003.
- UNESCO; WMO; IAEA;, “The State of the Resource,” in Water: a shared responsibility; the United Nations world water development report 2, UNESCO-WWAP, Ed. 2006, pp. 130–172.
- United Nations World Water Assessment, “Wastewater The Untapped Resource,” Paris, 2017.
- A. Panagopoulos, “Study and evaluation of the characteristics of saline wastewater (brine) produced by desalination and industrial plants,” Environ. Sci. Pollut. Res., vol. 29, no. 16, pp. 23736–23749, 2022. [CrossRef]
- A. G. Collins, Geochemistry of oilfield waters, vol. $40. 1975.
- J. Wang et al., “Geochemistry of Formation Water and Its Implications for Petroleum Source Rocks in the Fengcheng Formation, Mahu Depression, Xinjiang, China,” Front. Earth Sci., vol. 9, no. March, pp. 1–14, 2022. [CrossRef]
- M. S. Shipaeva et al., “Geochemical analysis of formation water as a tool for better understanding of water flooding,” IOP Conf. Ser. Earth Environ. Sci., vol. 1087, no. 1, 2022. [CrossRef]
- K. L. Benko and J. E. Drewes, “Produced water in the Western United States: Geographical distribution, occurrence, and composition,” Environ. Eng. Sci., vol. 25, no. 2, pp. 239–246, 2008. [CrossRef]
- U.S. Energy Information Administration, “Crude oil including lease condensate production (Mb/d),” 2023.
- A. McGenity, T. J.; Oren, “Hypersaline environments,” in Life at Extremes: Environments, Organisms and Strategies for Survival, no. 9781402092114, ed. E.M. Bell, Ed. 2012, pp. 402–437.
- M. F. Edbeib, R. A. Wahab, and F. Huyop, “Halophiles: biology, adaptation, and their role in decontamination of hypersaline environments,” World J. Microbiol. Biotechnol., vol. 32, no. 8, pp. 1–23, 2016. [CrossRef]
- T. D. Sharkey, “Discovery of the canonical Calvin–Benson cycle,” Photosynth. Res., vol. 140, no. 2, pp. 235–252, 2019. [CrossRef]
- R. Kaňa and Govindjee, “Role of ions in the regulation of light-harvesting,” Front. Plant Sci., vol. 7, no. DECEMBER2016, pp. 1–17, 2016. [CrossRef]
- R. A. Andersen, Algal Culturing Techniques. Phycological Society of America, 2005.
- A. A, Martins et al., “Water footprint of microalgae cultivation in photobioreactor,” Energy Procedia, vol. 153, pp. 426–431, 2018. [CrossRef]
- E. Uggetti, J. García, J. A. Álvarez, and M. J. García-Galán, “Start-up of a microalgae-based treatment system within the biorefinery concept: From wastewater to bioproducts,” Water Sci. Technol., vol. 78, no. 1, pp. 114–124, 2018. [CrossRef]
- F. Wollmann et al., “Microalgae wastewater treatment: Biological and technological approaches,” Eng. Life Sci., vol. 19, no. 12, pp. 860–871, 2019. [CrossRef]
- Z. Y. Yang et al., “Improving sedimentation and lipid production of microalgae in the photobioreactor using saline wastewater,” Bioresour. Technol., vol. 347, no. July 2021, p. 126392, 2022. [CrossRef]
- G. Schönknecht et al., “Gene transfer from bacteria and archaea facilitated evolution of an extremophilic eukaryote,” Science (80-. )., vol. 339, no. 6124, pp. 1207–1210, 2013. [CrossRef]
- S. I. Park et al., “Revised classification of the Cyanidiophyceae based on plastid genome data with descriptions of the Cavernulicolales ord. nov. and Galdieriales ord. nov. (Rhodophyta),” J. Phycol., vol. 59, no. 3, pp. 444–466, 2023. [CrossRef]
- Lang, S. Bashir, M. Lorenz, S. Rader, and G. Weber, “Exploiting the potential of Cyanidiales as a valuable resource for biotechnological applications,” Appl. Phycol., vol. 3, no. 1, pp. 199–210, 2022. [CrossRef]
- M. Sirakov et al., “Cyanidiophyceae (Rhodophyta) tolerance to precious metals: Metabolic response to palladium and gold,” Plants, vol. 10, no. 11, pp. 1–8, 2021. [CrossRef]
- A. Musacchio, G. Pinto, S. Sabato, and R. Taddei, “Aloresistenza in diversi ceppi di Cyanidium caldarium forma A 3 forma B,” Delpinoa. Nuova Ser., 1978.
- L. D’Elia, A. Del Mondo, M. Santoro, A. De Natale, G. Pinto, and A. Pollio, “Microorganisms from harsh and extreme environments: A collection of living strains at ACUF (Naples, Italy),” Ecol. Quest., vol. 29, no. 3, pp. 63–74, 2018. [CrossRef]
- H. Foyer, “Reactive oxygen species, oxidative signaling and the regulation of photosynthesis,” Environ. Exp. Bot., vol. 154, no. May, pp. 134–142, 2018. [CrossRef]
- L. Wang, T. Yang, Y. Pan, L. Shi, Y. Jin, and X. Huang, “The Metabolism of Reactive Oxygen Species and Their Effects on Lipid Biosynthesis of Microalgae,” Int. J. Mol. Sci., vol. 24, no. 13, 2023. [CrossRef]
- H. L. Macintyre, E. Lawrenz, and T. L. Richardson, Chlorophyll a Fluorescence in Aquatic Sciences: Methods and Applications, no. January 1970. 2010.
- Ministero Dello Sviluppo Economico, “Crude oil production in Italy in 2018, by region,” 2018.
- Sherwood Lollar, O. Warr, and P. M. Higgins, “The Hidden Hydrogeosphere: The Contribution of Deep Groundwater to the Planetary Water Cycle,” Annu. Rev. Earth Planet. Sci., vol. 52, no. 1, pp. 1–24, 2024. [CrossRef]
- F. van Weert, J. van der Gun, and J. Reckman, “Global Overview of Saline Groundwater Occurrence and Genesis (Report number: GP 2009-1),” Utr. IGRAC - U. N. Int. Groundw. Resour. Assess. Cent., no. July, pp. 1–32, 2009.
- V. Reeb and D. Bhattacharya, “The Thermo-Acidophilic Cyanidiophyceae (Cyanidiales),” in Red Algae in the Genomic Age, J. Seckbach and D. J. Chapman, Eds. Dordrecht: Springer Netherlands, 2010, pp. 409–426.
- J. Barber, “An explanation for the relationship between salt-induced thylakoid stacking and the chlorophyll fluorescence changes associated with changes in spillover of energy from photosystem II to photosystem I,” FEBS Lett., vol. 118, no. 1, pp. 1–10, 1980. [CrossRef]
- Peter Mitchell, “Coupling of Phosphorylation to Electron and Hydrogen Transfer by a Chemi-Osmotic type of Mechanism,” Nature, vol. 191, pp. 144–148, 1944.
- M. Martinez-Garcia and M. J. E. C. van der Maarel, “Floridoside production by the red microalga Galdieria sulphuraria under different conditions of growth and osmotic stress,” AMB Express, vol. 6, no. 1, pp. 0–7, 2016. [CrossRef]
- G. Q. Chen, Y. Jiang, and F. Chen, “Salt-induced alterations in lipid composition of diatom Nitzschia laevis (Bacillariophyceae) under heterotrophic culture condition,” J. Phycol., vol. 44, no. 5, pp. 1309–1314, 2008. [CrossRef]
- W. Elloumi, A. Jebali, A. Maalej, M. Chamkha, and S. Sayadi, “Effect of mild salinity stress on the growth, fatty acid and carotenoid compositions, and biological activities of the thermal freshwater microalgae Scenedesmus sp.,” Biomolecules, vol. 10, no. 11, pp. 1–17, 2020. [CrossRef]
- S. Fal, A. Aasfar, R. Rabie, A. Smouni, and H. EL Arroussi, “Salt induced oxidative stress alters physiological, biochemical and metabolomic responses of green microalga Chlamydomonas reinhardtii,” Heliyon, vol. 8, no. 1, 2022. [CrossRef]
- X. Ji et al., “The effect of NaCl stress on photosynthetic efficiency and lipid production in freshwater microalga—Scenedesmus obliquus XJ002,” Sci. Total Environ., vol. 633, pp. 593–599, 2018. [CrossRef]
- A. Gomes, E. Fernandes, and J. L. F. C. Lima, “Fluorescence probes used for detection of reactive oxygen species,” J. Biochem. Biophys. Methods, vol. 65, no. 2–3, pp. 45–80, 2005. [CrossRef]
- G. G. Martinovich, I. V. Martinovich, S. N. Cherenkevich, and H. Sauer, “Redox Buffer Capacity of the Cell: Theoretical and Experimental Approach,” Cell Biochem. Biophys., vol. 58, no. 2, pp. 75–83, 2010. [CrossRef]
- G. Fantner, “A brief introduction to error analysis and propagation,” no. February, pp. 1–13, 2011.
- S. White, A. Anandraj, and F. Bux, “PAM fluorometry as a tool to assess microalgal nutrient stress and monitor cellular neutral lipids,” Bioresour. Technol., vol. 102, no. 2, pp. 1675–1682, 2011. [CrossRef]
- N. R. Baker, “Chlorophyll fluorescence: A probe of photosynthesis in vivo,” Annu. Rev. Plant Biol., vol. 59, pp. 89–113, 2008. [CrossRef]
- Y. Chen and S. Vaidyanathan, “Simultaneous assay of pigments, carbohydrates, proteins and lipids in microalgae,” Anal. Chim. Acta, vol. 776, pp. 31–40, 2013. [CrossRef]
- M. M. Bradford, “A rapid and sensitive method for the quantitation of microgram quantities of protein utilizing the principle of protein-dye binding.,” Anal. Biochem., 1976. [CrossRef]
- A. Bennett and L. Bogobad, “Complementary chromatic adaptation in a filamentous blue-green alga,” J. Cell Biol., vol. 58, no. 2, pp. 419–435, 1973. [CrossRef]
- W. J. Bligh, E.G. and Dyer, “Canadian Journal of Biochemistry and Physiology,” Can. J. Biochem. Physiol., vol. 37, no. 8, 1959.
- J. A. Knight, S. Anderson, and J. M. Rawle, “Chemical basis of the sulfo-phospho-vanillin reaction for estimating total serum lipids.,” Clin. Chem., vol. 18, no. 3, pp. 199–202, 1972. [CrossRef]
- A. R. Wellburn, “The Spectral Determination of Chlorophylls a and b, as well as Total Carotenoids, Using Various Solvents with Spectrophotometers of Different Resolution,” J. Plant Physiol., vol. 144, no. 3, pp. 307–313, 1994. [CrossRef]
Figure 1.
Results of batch cultivation of G. sulphuraria at different initial concentration of NaCl: specific growth rate and steady state biomass concentration (a), metabolite mass fraction of biomass during exponential phase (b-c), chlorophyll a to carotenoid and phycobiliprotein ratio (d), photoactive to photoprotective pigment ratio (e) and phycobiliprotein purity (f).
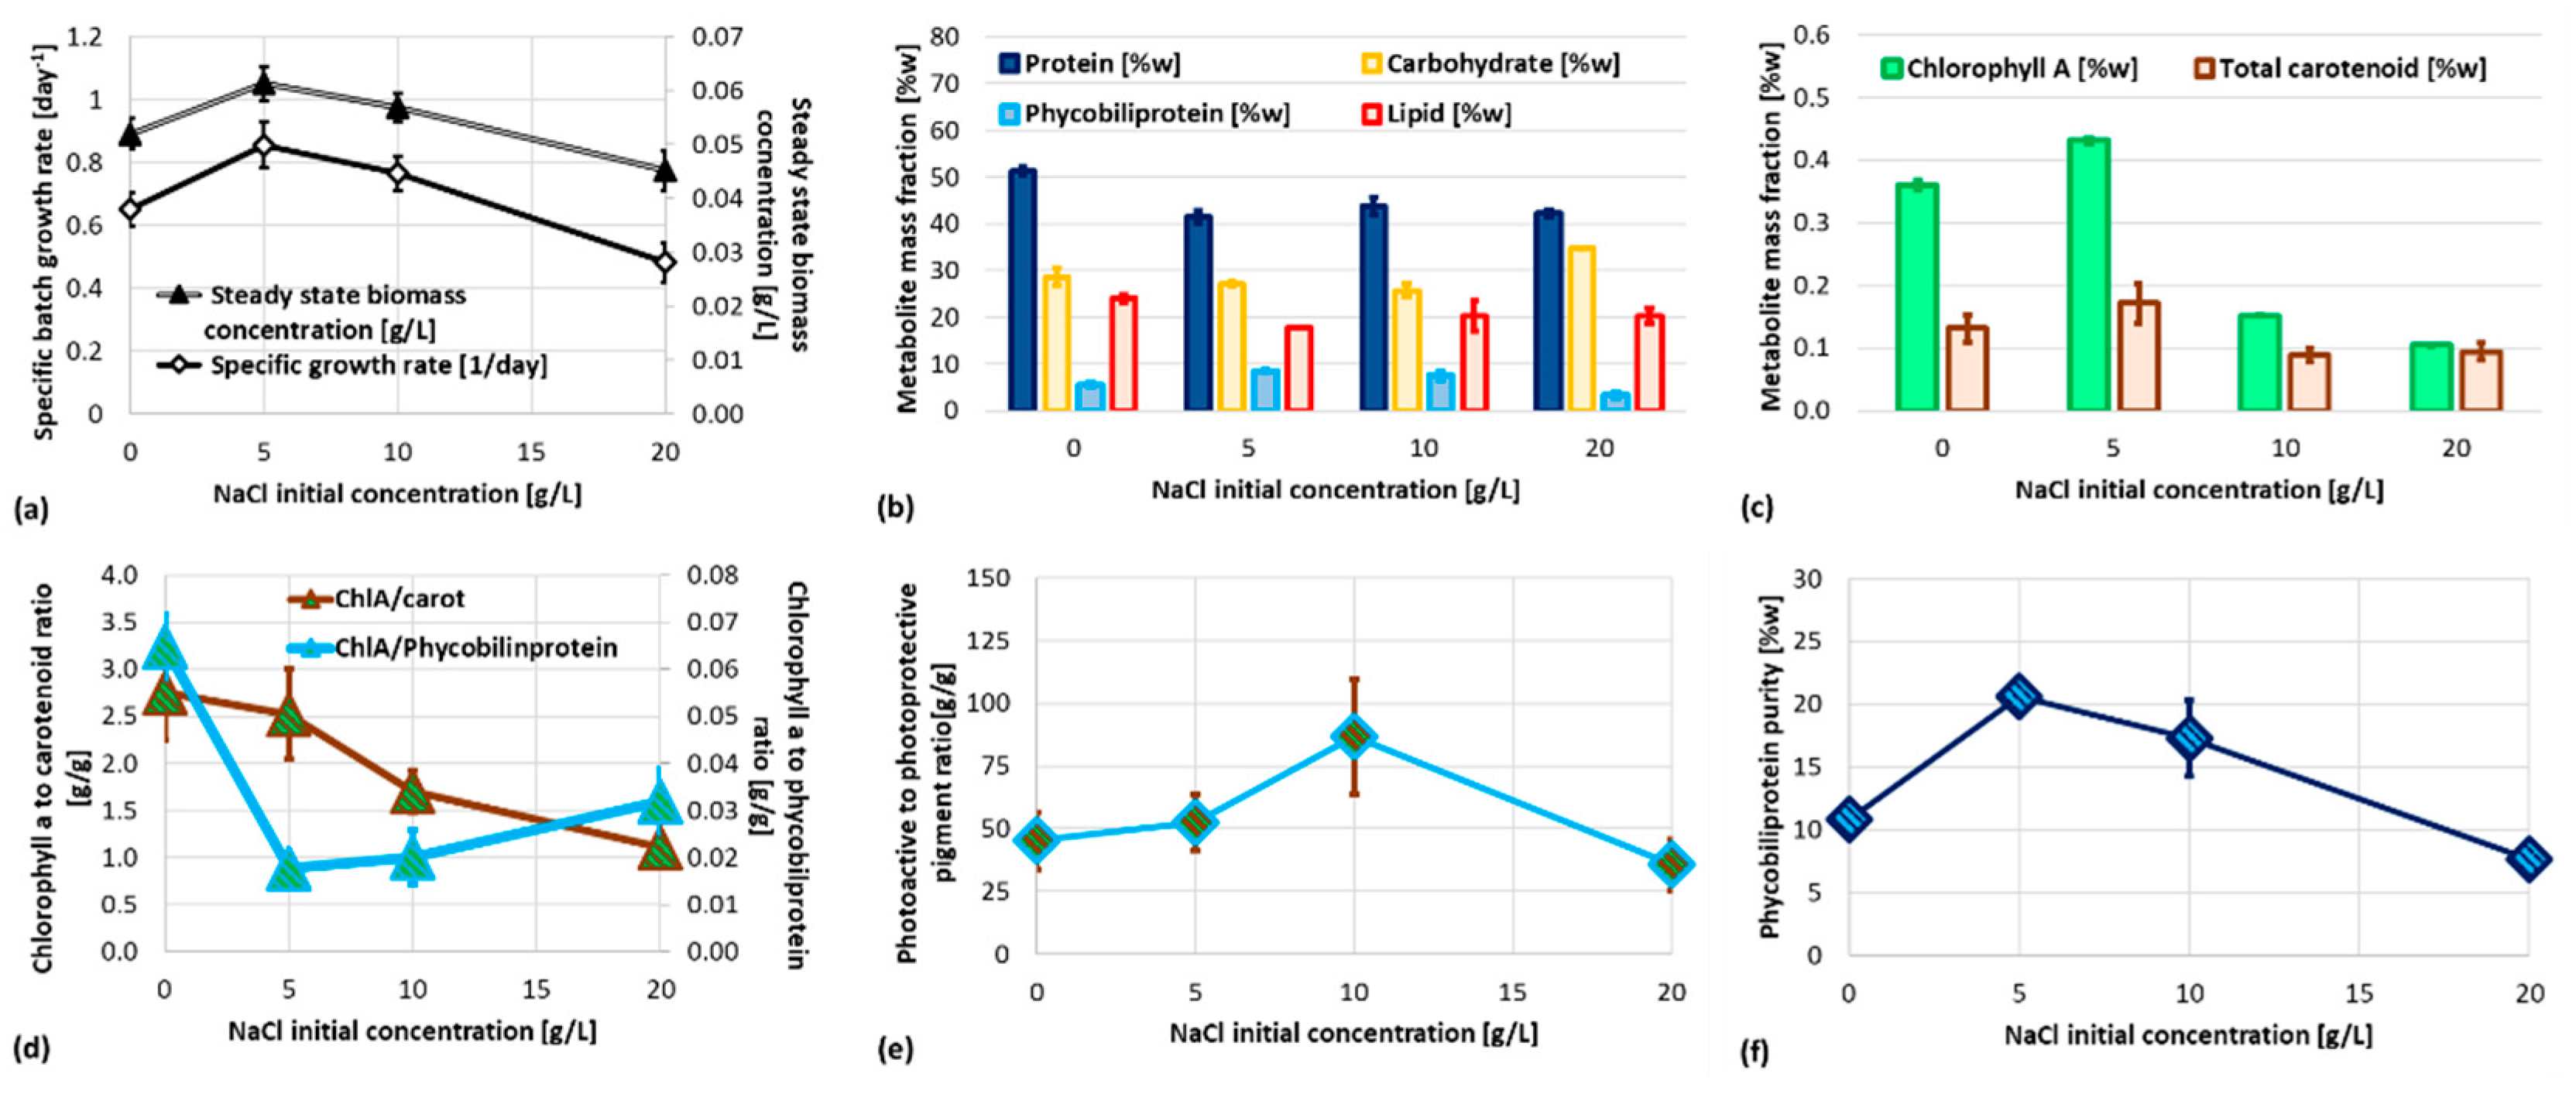
Figure 2.
ROS concentration inside of Galdieria sulphuraria cell exposed to salinity in 0-20 g/L range.
Figure 2.
ROS concentration inside of Galdieria sulphuraria cell exposed to salinity in 0-20 g/L range.
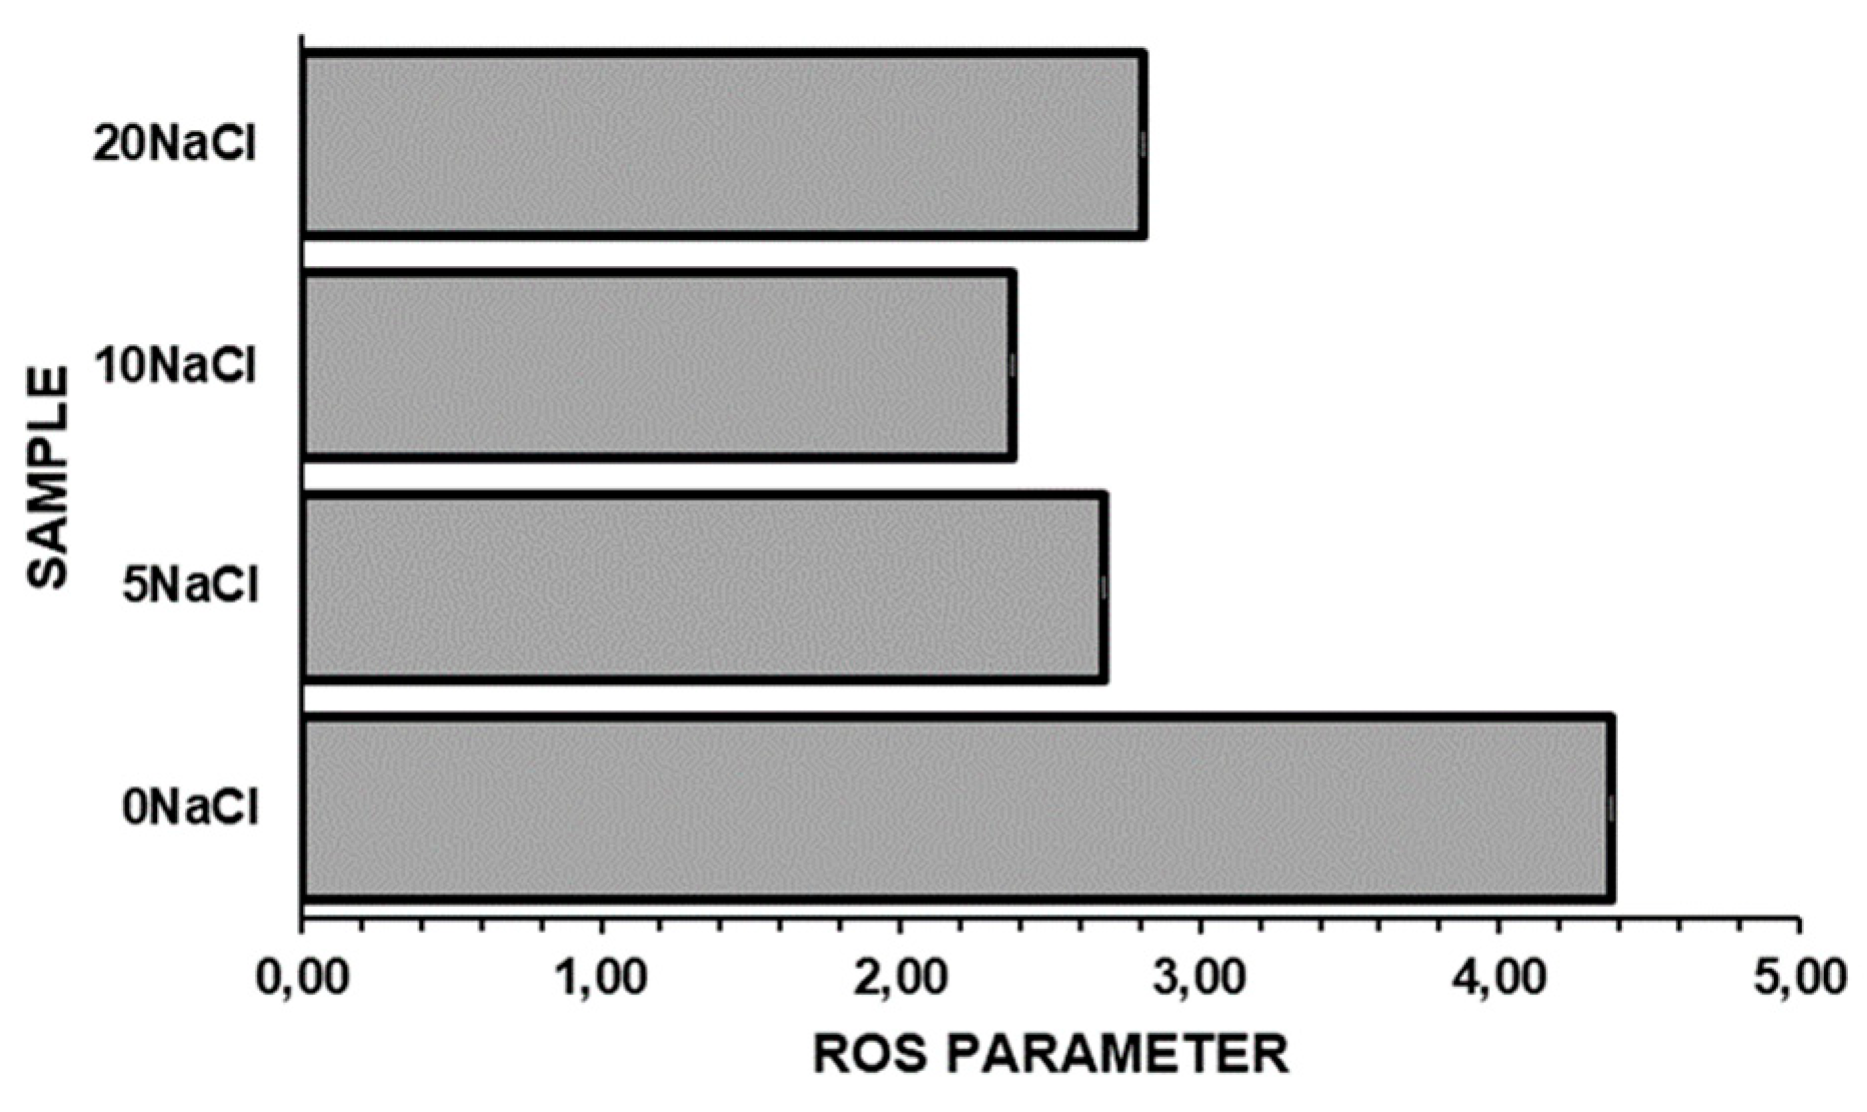
Figure 3.
Dynamic of chlorophyll a fluorescence (emission at 680 nm) due to: (a) chlorophyll a (excitation at 435 nm), (b) phycoerythrin (excitation at 570 nm), (c) phycocyanin (excitation at 620 nm), (d) allophycocyanin (excitation at 650 nm). Results are reported as normalized respect to 0NaCl sample (dashed black line).
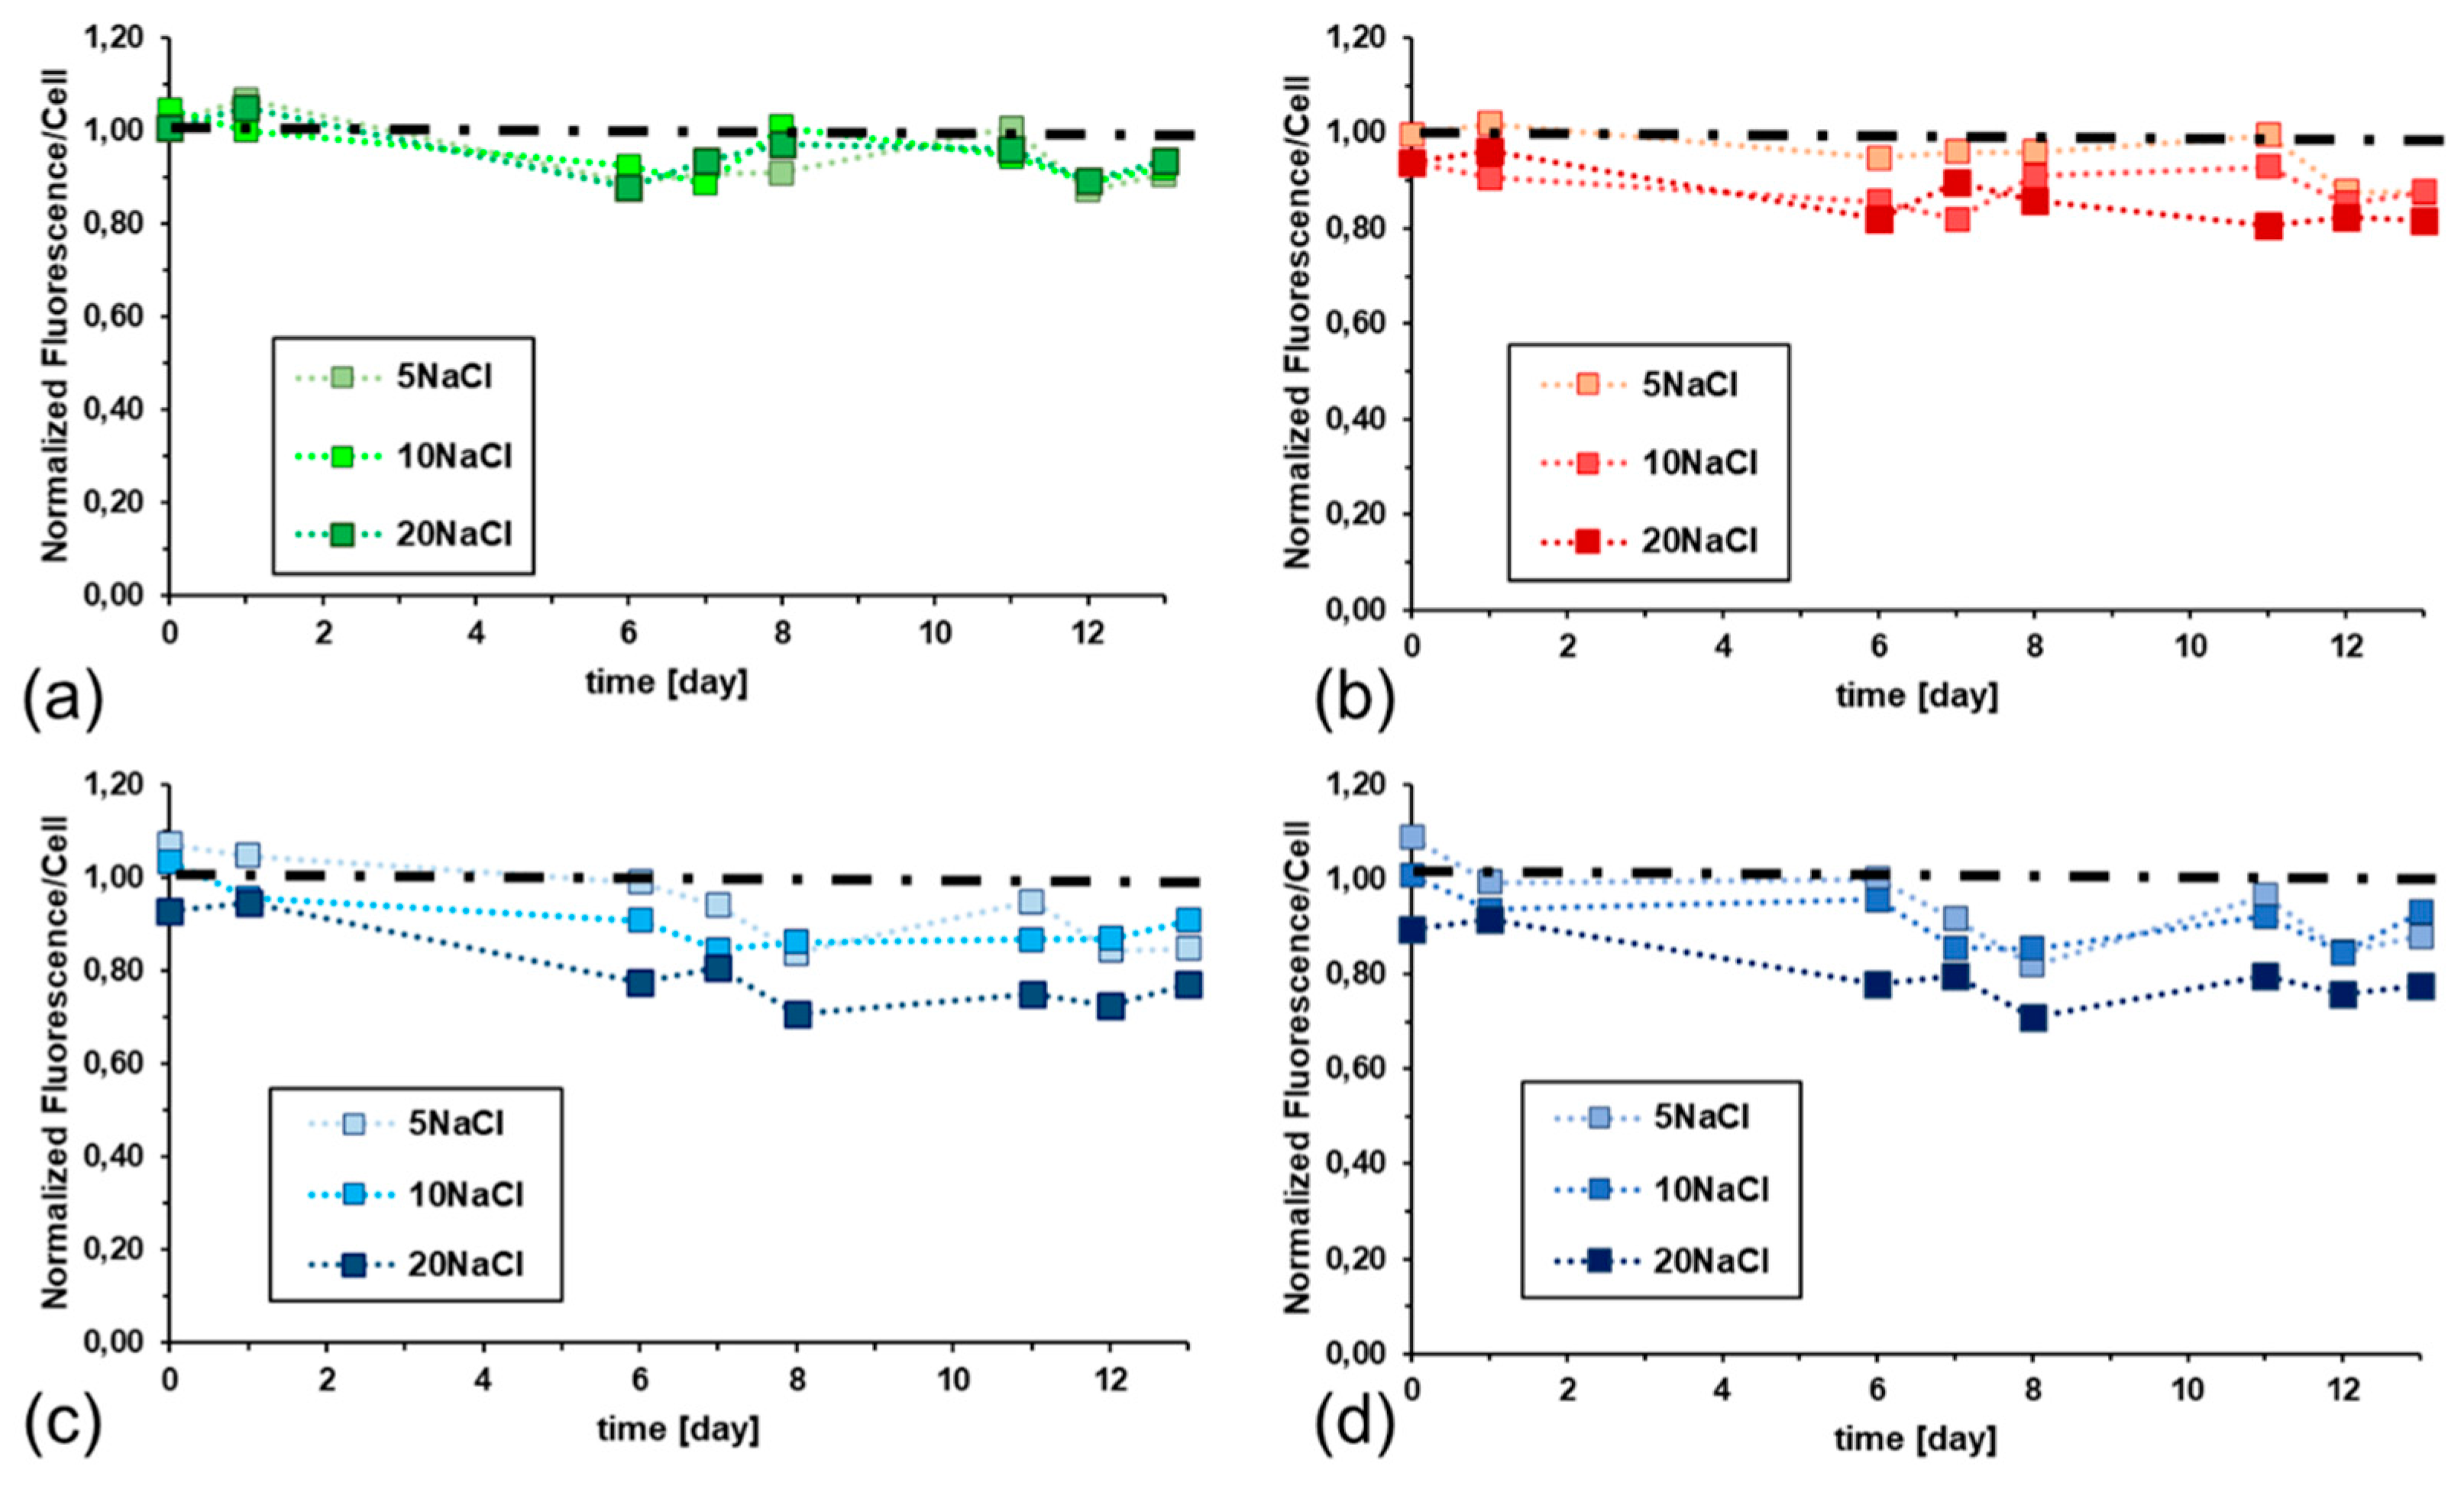
Figure 4.
Maximum quantum efficiency of Photosystem II as a function of initial NaCl concentration of the medium in batch cultivation test.
Figure 4.
Maximum quantum efficiency of Photosystem II as a function of initial NaCl concentration of the medium in batch cultivation test.
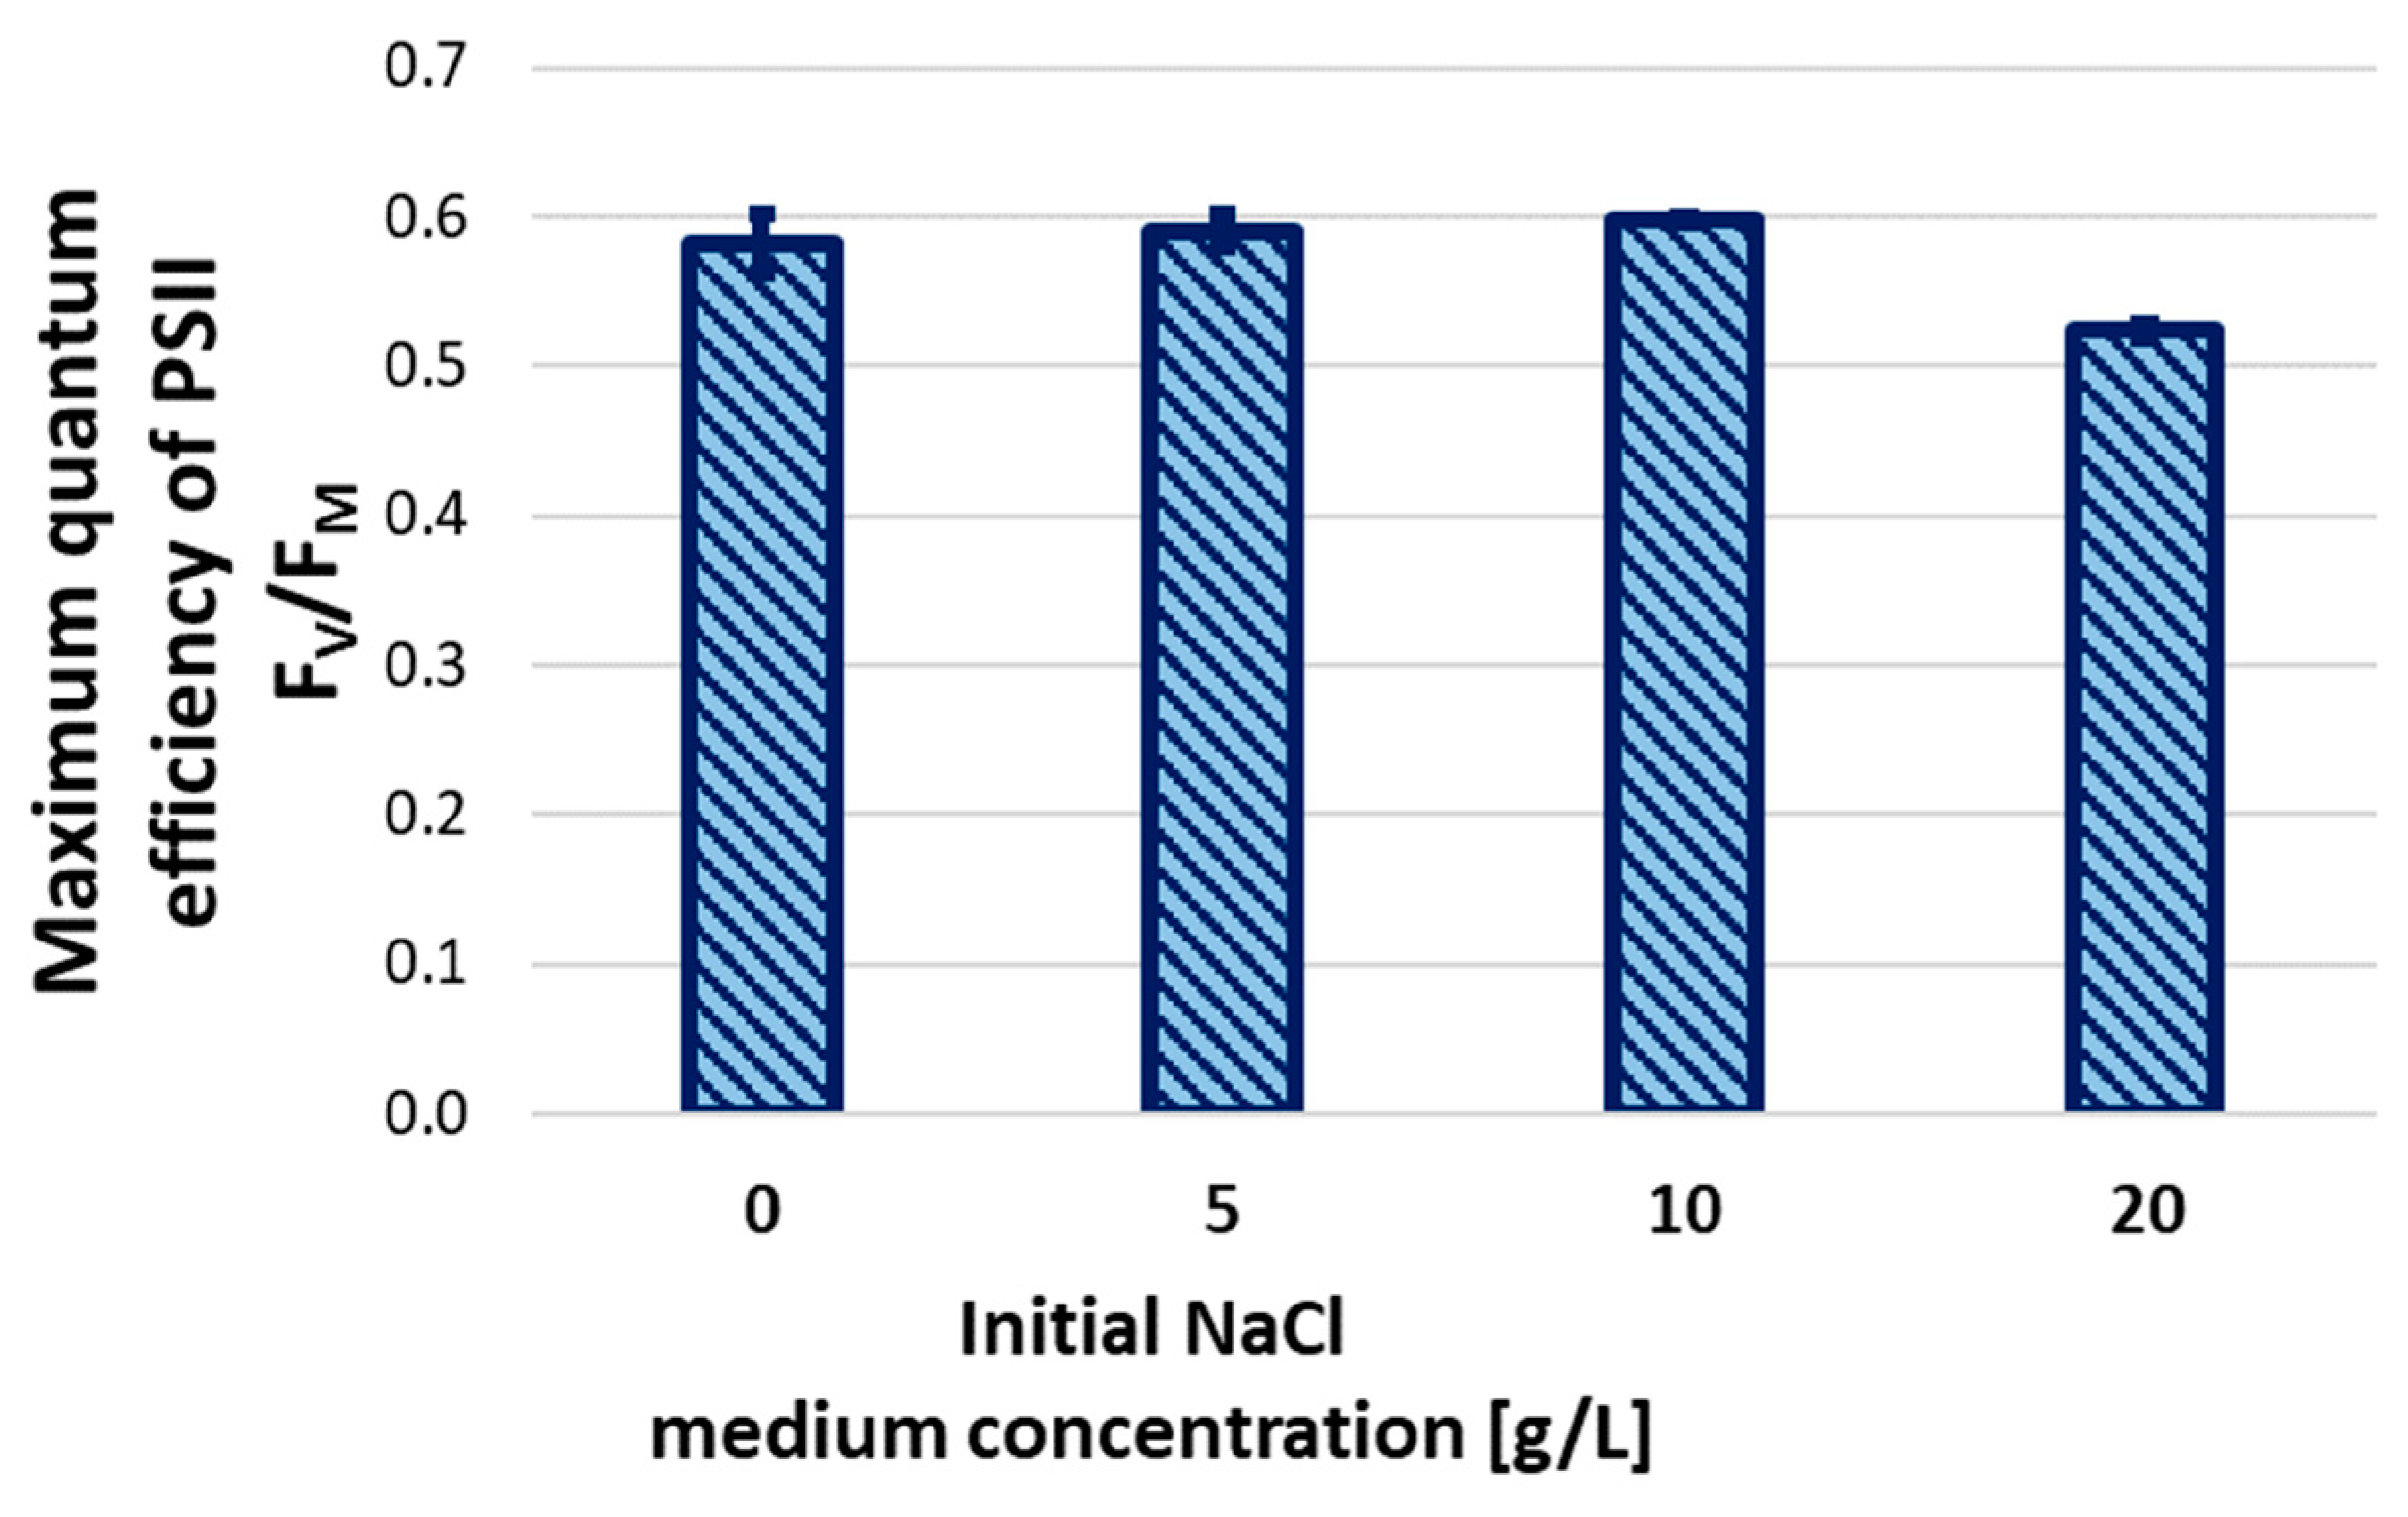
Figure 5.
Figure 5. Relative energy transfer at different light intensity PAM tests. Results are reported up to 443.5 µEin at different initial NaCl concentrations for batch test growth tests.
Figure 5.
Figure 5. Relative energy transfer at different light intensity PAM tests. Results are reported up to 443.5 µEin at different initial NaCl concentrations for batch test growth tests.
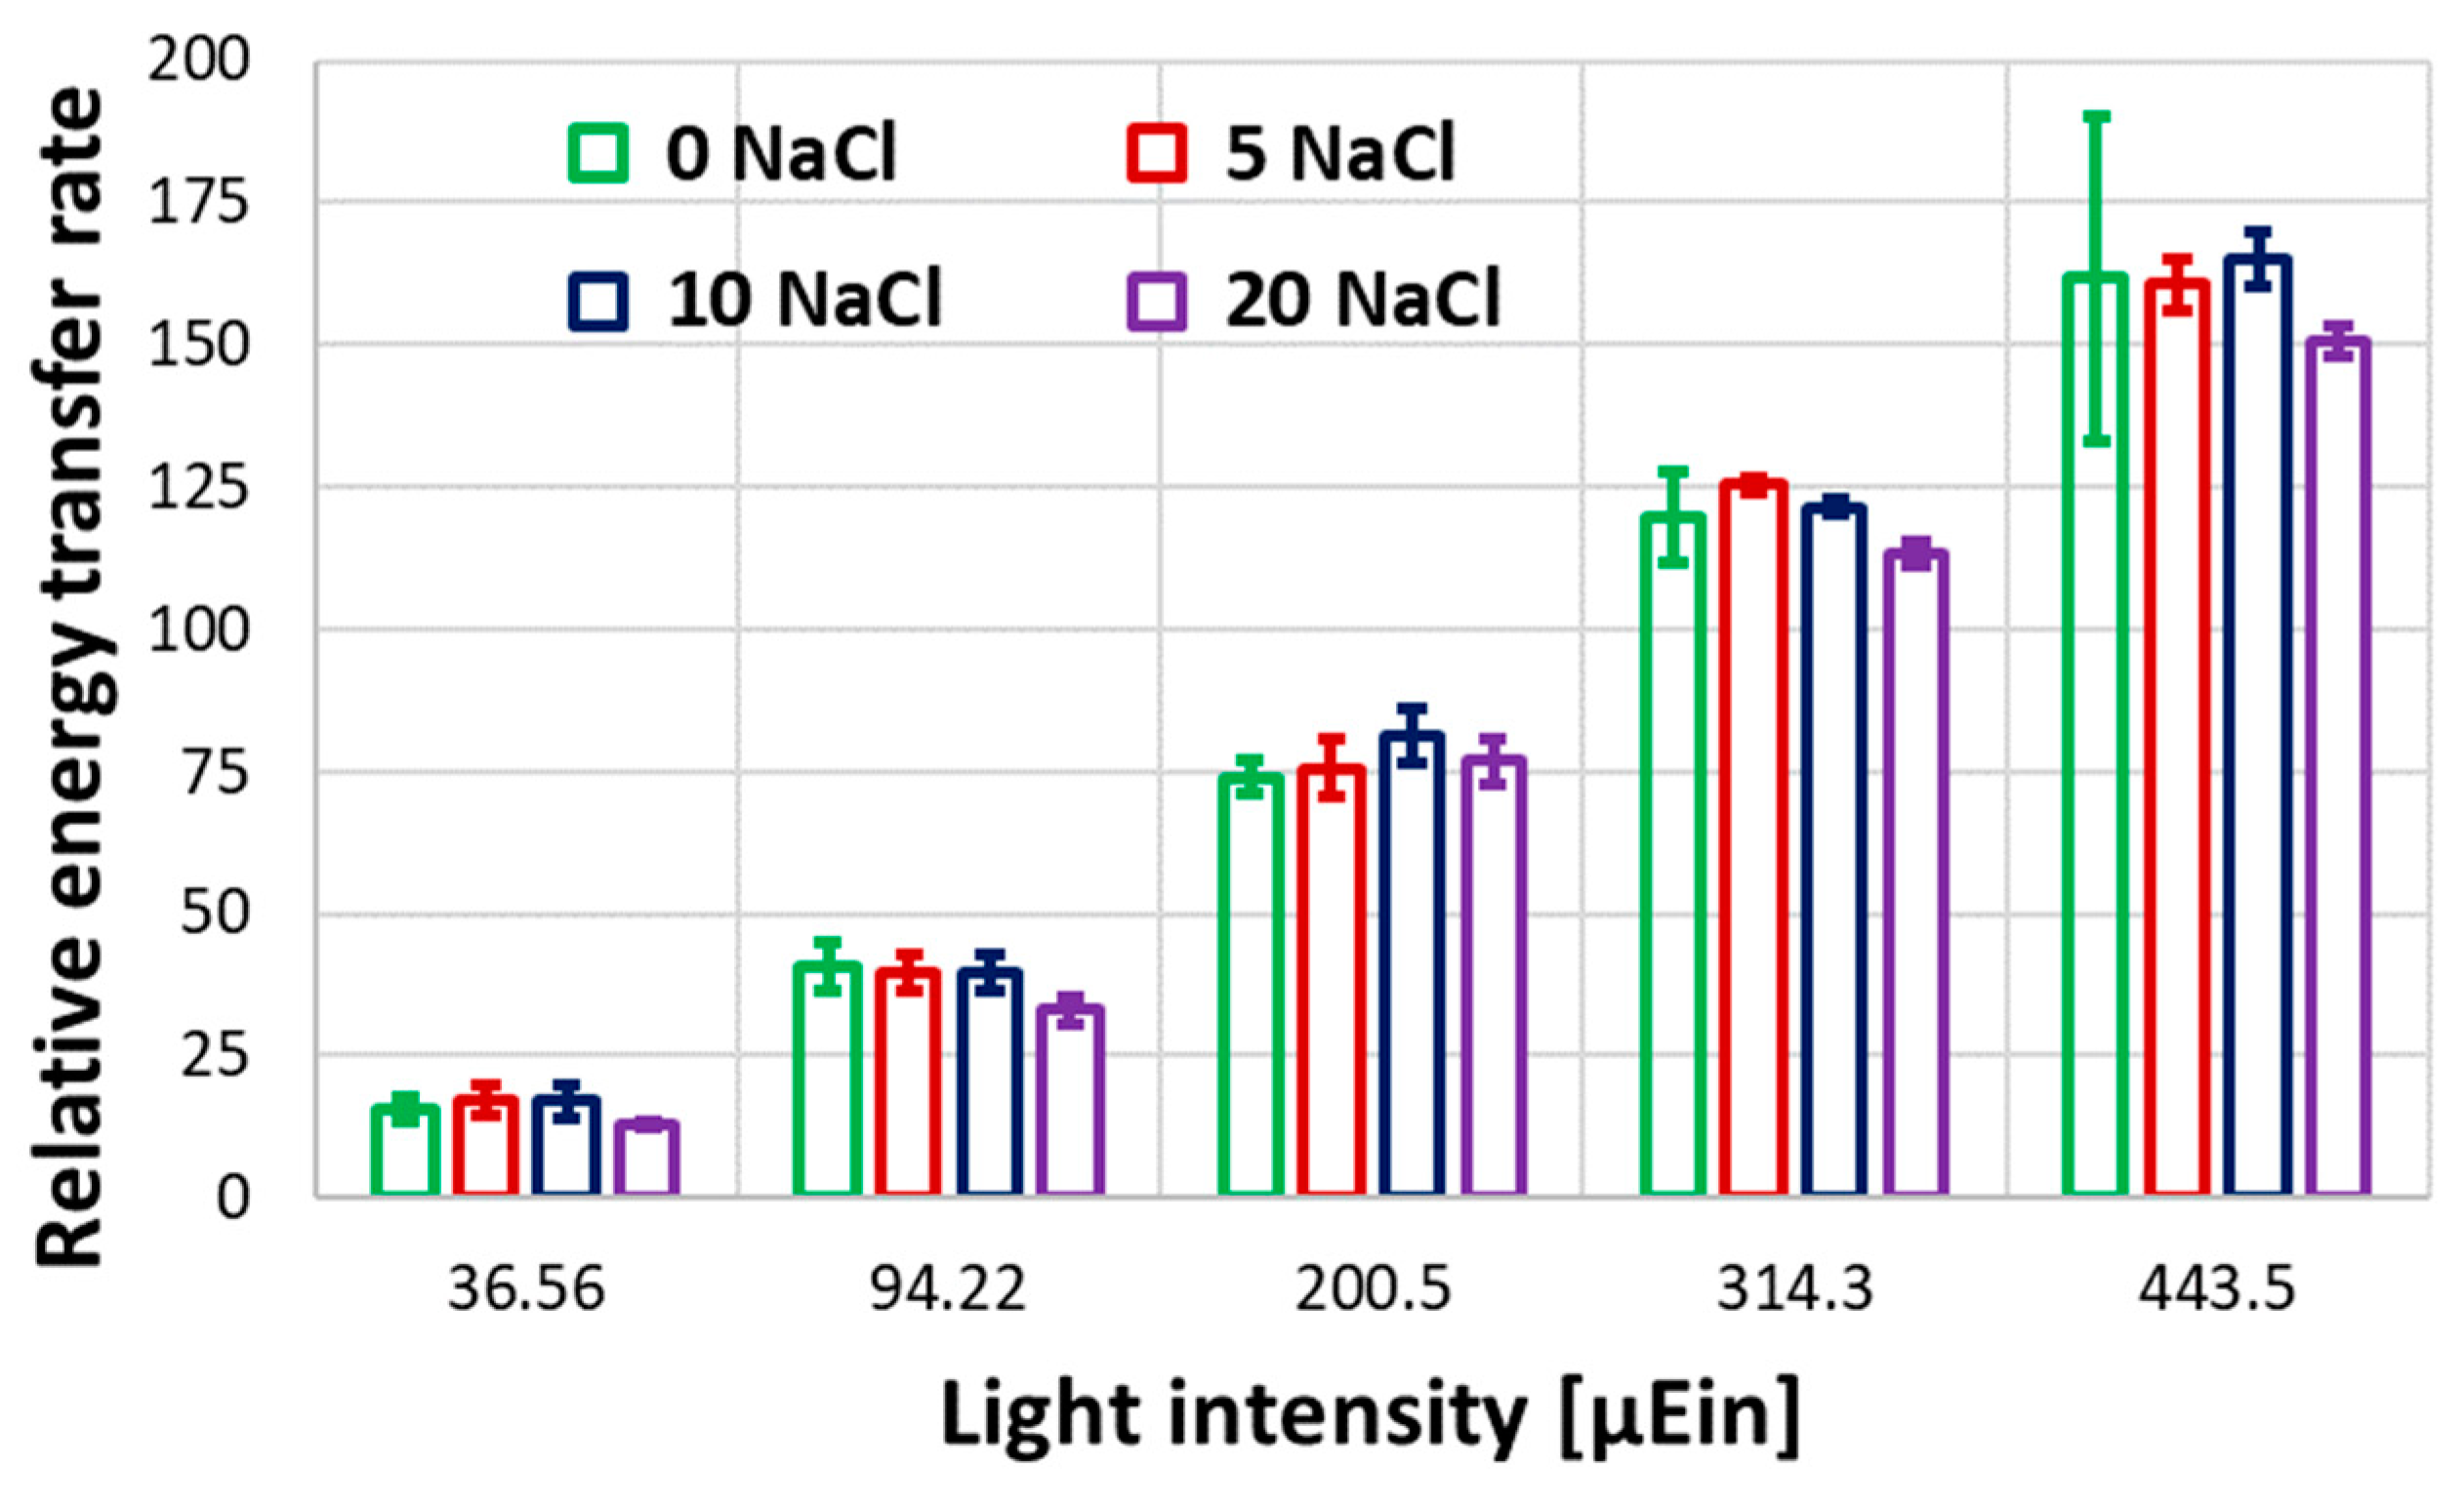
Figure 6.
Results of semi-continuous cultivation of G. sulphuraria in artificial formation water (AFW): biomass concentration (a) and liquid phase conductibility (b) profiles during batch adaptation, transitory, steady state, wash out and final batch of photobioreactor for both adapted (20 NaCl batch culture) and non-adapted (0 NaCl batch culture) G. sulphuraria. Metabolite mass fraction (c-d) of steady state harvested biomass.
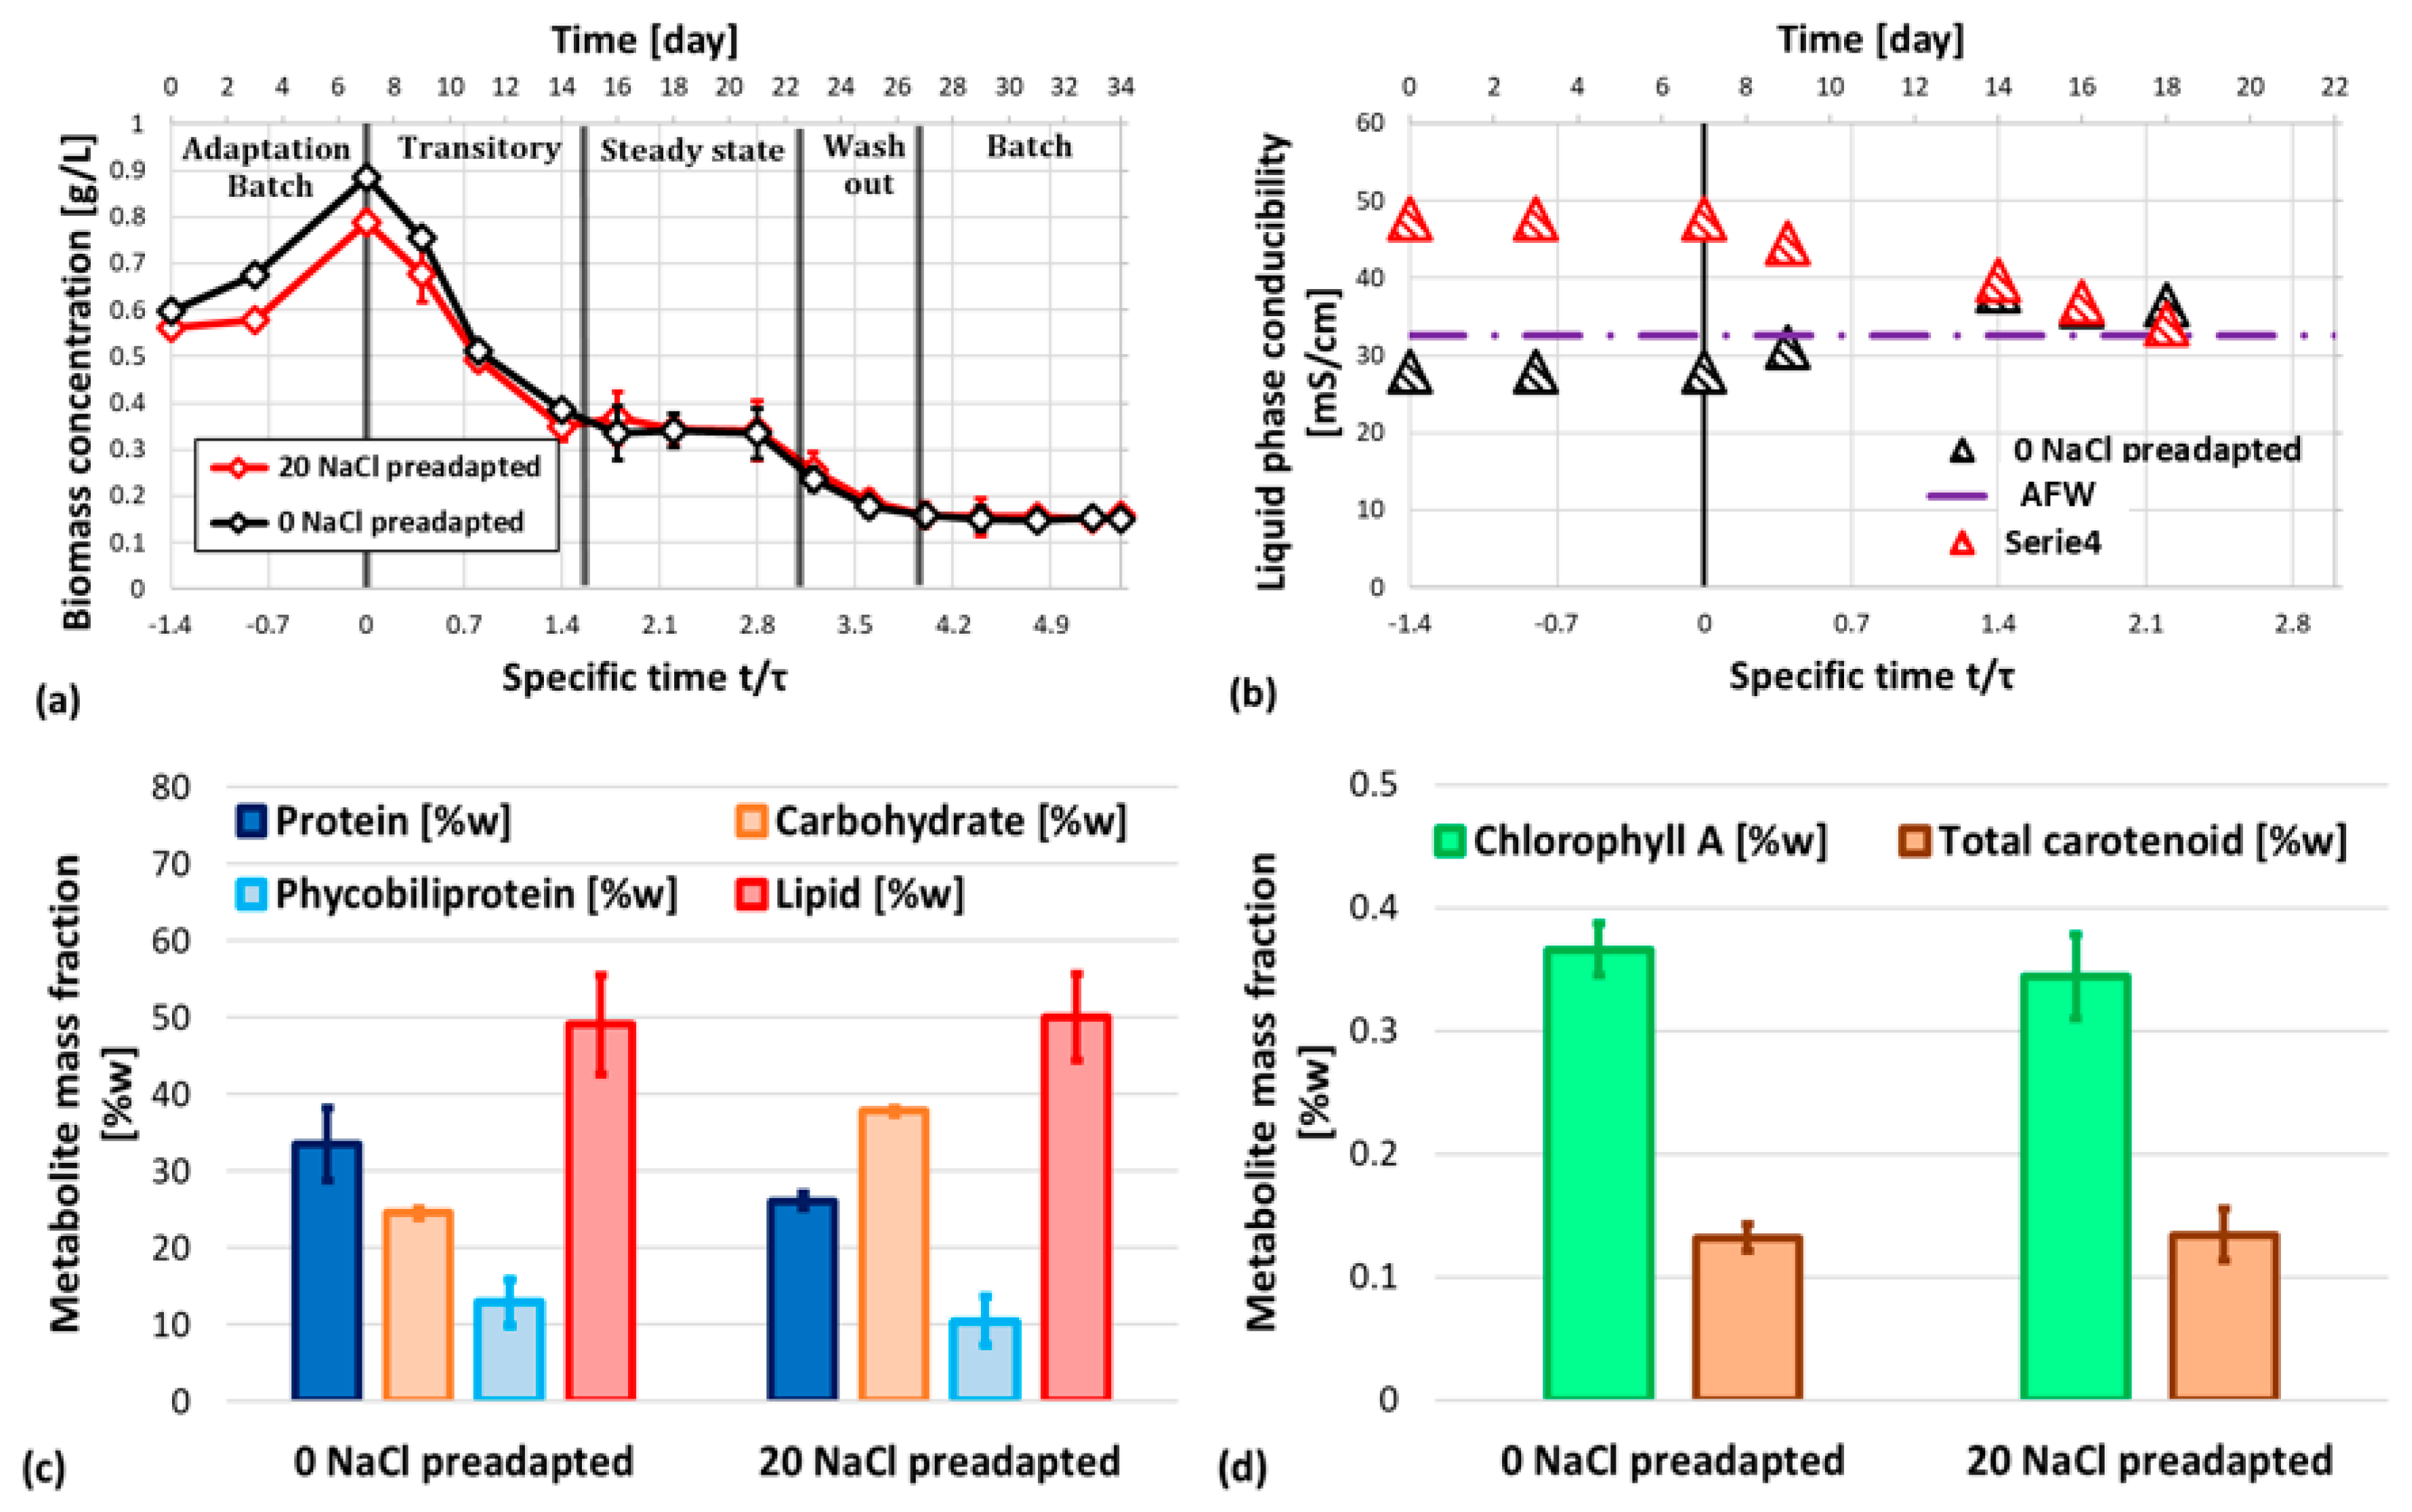
Figure 7.
Element relative abundance in tested culture media: artificial formation water (AFW) and NaCl enriched Allen media.
Figure 7.
Element relative abundance in tested culture media: artificial formation water (AFW) and NaCl enriched Allen media.
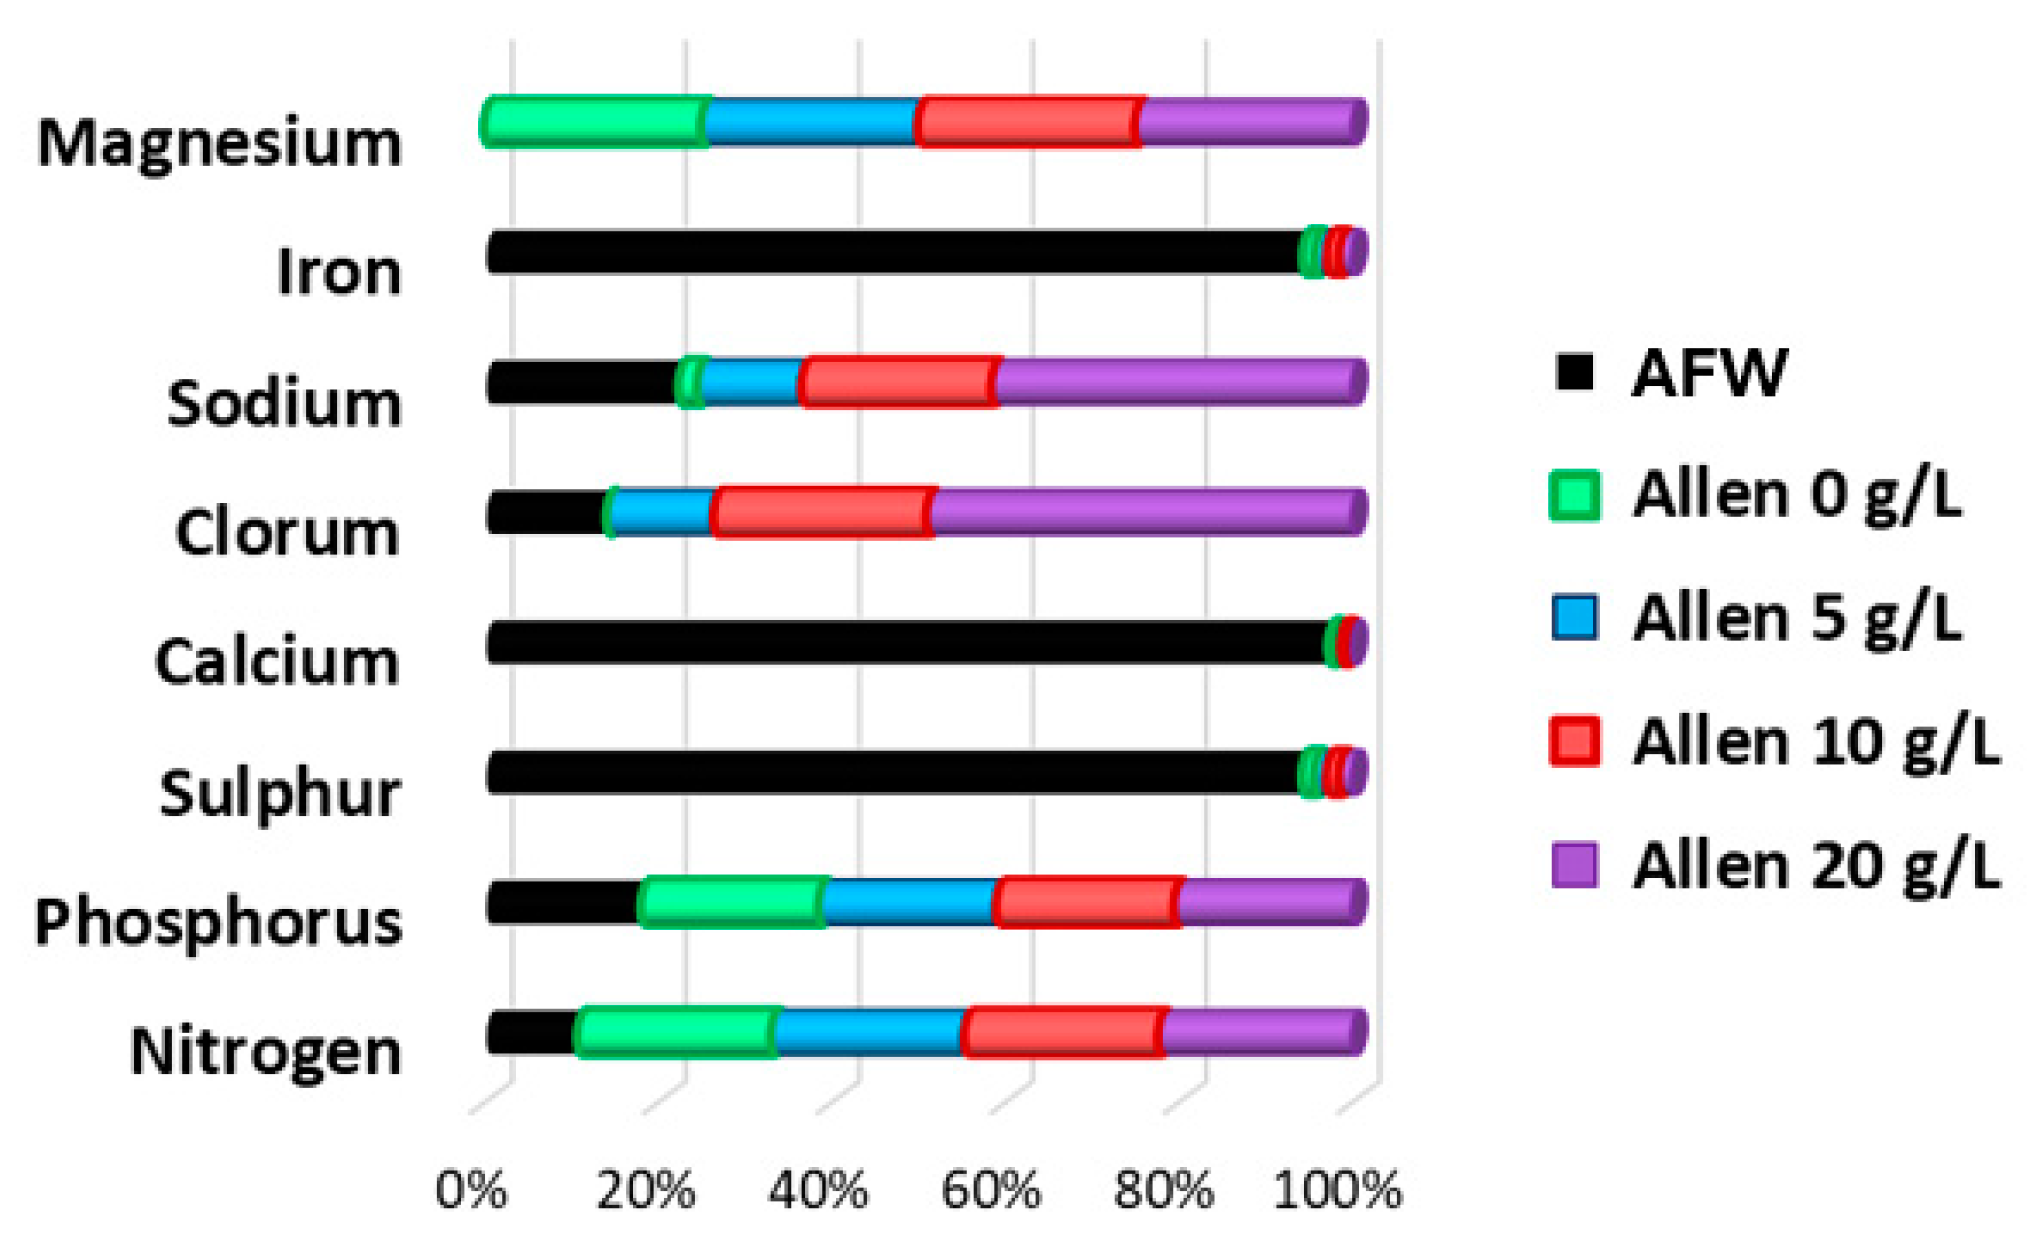
Figure 8.
Dynamics of chlorophyll a fluorescence due to phycoerythrin, phycocyanin, allophycocyanin, and chlorophyll a. Results are reported as normalized respect to 0NaCl (dashed black line).
Figure 8.
Dynamics of chlorophyll a fluorescence due to phycoerythrin, phycocyanin, allophycocyanin, and chlorophyll a. Results are reported as normalized respect to 0NaCl (dashed black line).
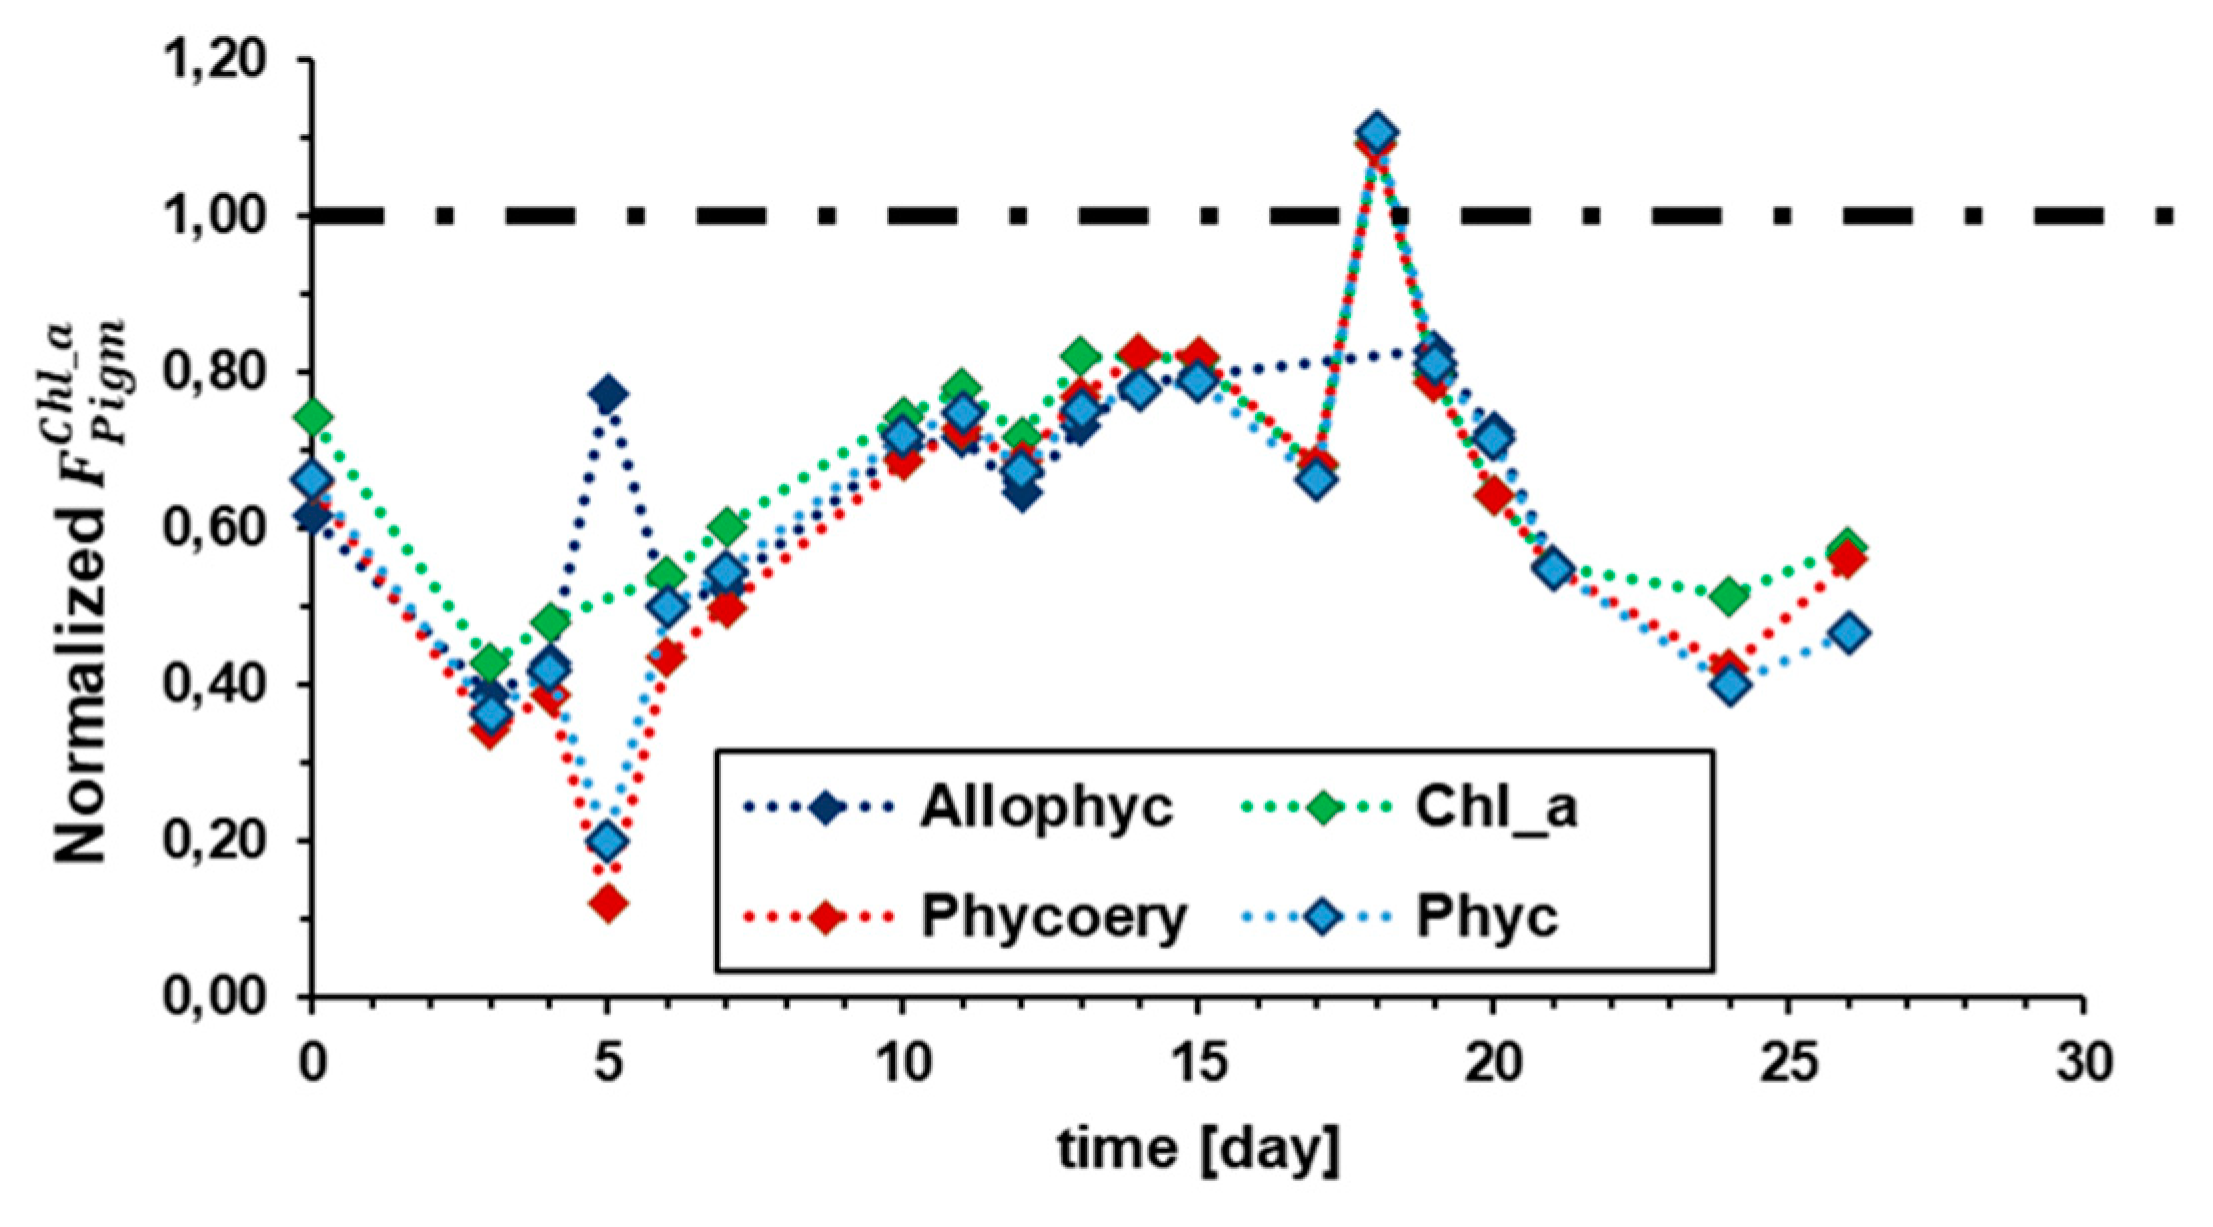
Figure 9.
Dynamics of absorbance per cell due to chlorophyll a, phycoerythrin, phycocyanin, and allophycocyanin. Results are reported as normalized respect to 0NaCl sample (dashed black line).
Figure 9.
Dynamics of absorbance per cell due to chlorophyll a, phycoerythrin, phycocyanin, and allophycocyanin. Results are reported as normalized respect to 0NaCl sample (dashed black line).
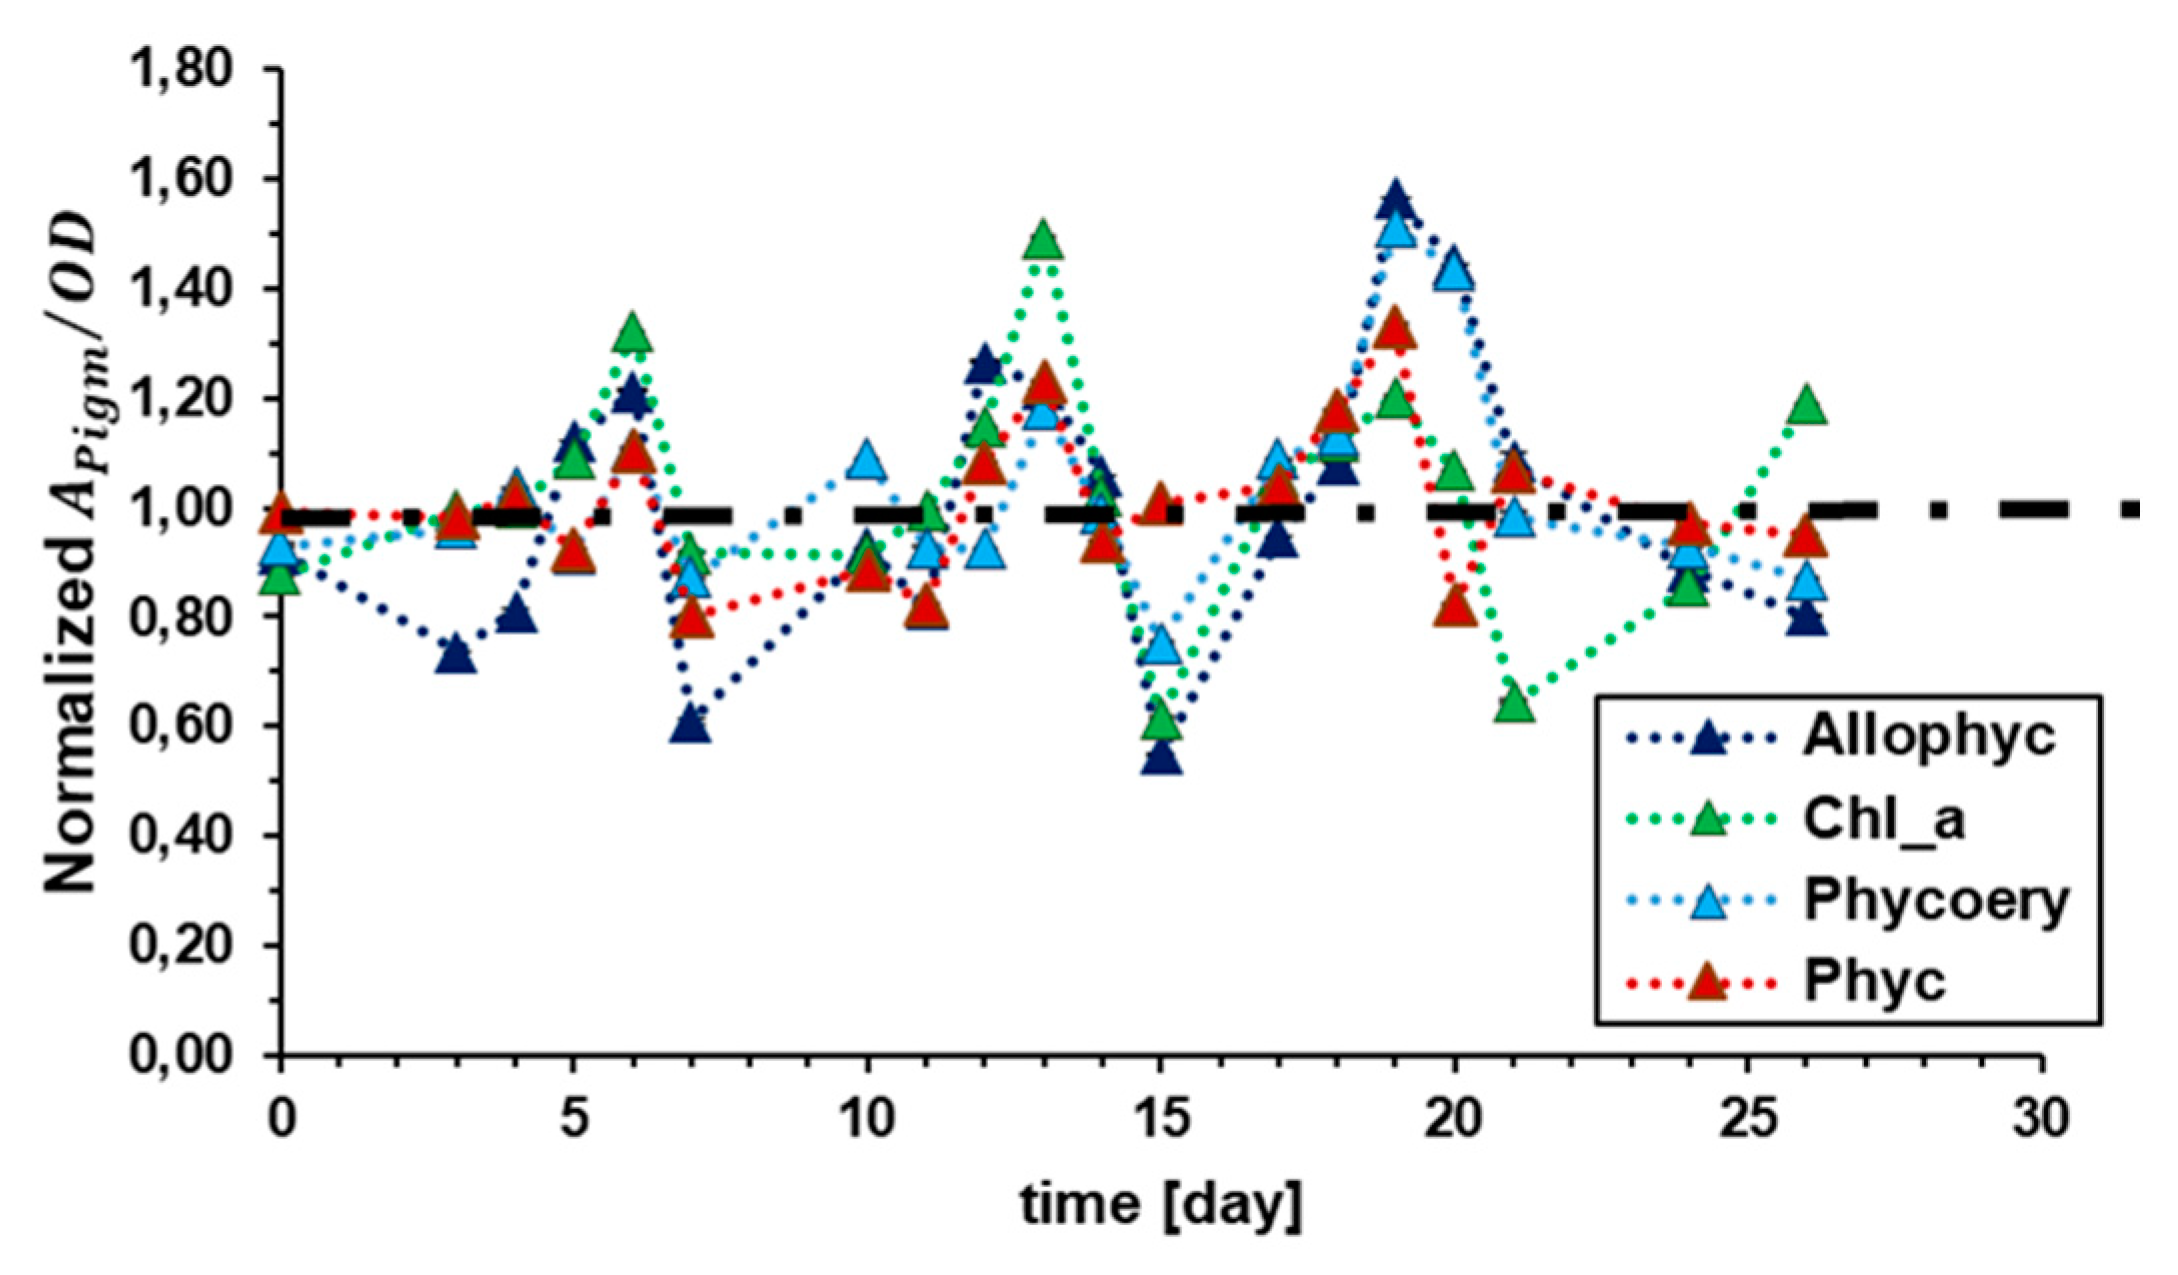
Figure 10.
Dynamics of the chlorophyll a fluorescence to absorption cross section ratio for allophycocyanin, phycocyanin, phycoerythrin, and chlorophyll a. Results are reported as normalized respect to 0NaCl sample (dashed black line).
Figure 10.
Dynamics of the chlorophyll a fluorescence to absorption cross section ratio for allophycocyanin, phycocyanin, phycoerythrin, and chlorophyll a. Results are reported as normalized respect to 0NaCl sample (dashed black line).
Disclaimer/Publisher’s Note: The statements, opinions and data contained in all publications are solely those of the individual author(s) and contributor(s) and not of MDPI and/or the editor(s). MDPI and/or the editor(s) disclaim responsibility for any injury to people or property resulting from any ideas, methods, instructions or products referred to in the content. |
© 2024 by the authors. Licensee MDPI, Basel, Switzerland. This article is an open access article distributed under the terms and conditions of the Creative Commons Attribution (CC BY) license (http://creativecommons.org/licenses/by/4.0/).
Copyright: This open access article is published under a Creative Commons CC BY 4.0 license, which permit the free download, distribution, and reuse, provided that the author and preprint are cited in any reuse.


