Submitted:
08 July 2024
Posted:
09 July 2024
Read the latest preprint version here
Abstract
Many risk-modifying factors affect cancer incidence and mortality rates. We present an ecological study of incidence and/or mortality rates for cancers during 2007–2016 of 17 anatomical sites with respect to solar ultraviolet-B (UVB) doses and obesity prevalence. Solar UVB reduces cancer risk by producing vitamin D, which has many mechanisms to reduce risk of cancer incidence, progression, and metastasis. Obesity increases cancer risk through several mechanisms, including increased systemic inflammation. Data were averaged for 12 geographical regions. Solar UVB doses were significantly inversely correlated with mortality rates for five cancers for males and four for females. Obesity prevalence was directly correlated with mortality rates for three cancers for males and seven for females. The population attributable fraction of cancer mortality rates ascribed to low solar UVB dose was 0.03 for both males and females, whereas that for obesity prevalence was 0.05 for males and 0.08 for females. Thus, cancer mortality rates in France could be reduced through vitamin D supplementation and reducing the prevalence of obesity. Doing so also could reduce risk of other adverse health outcomes.
Keywords:
cancer
; diet
; ecological study
; incidence rate
; mortality rate
; obesity
; risk
; solar UVB
; smoking
; vitamin D
1. Introduction
France’s population in 2010 was approximately 65 million, with 31.5 million males and 33.5 million females [1]. For males in 2010, the estimated all-cancer incidence rate was 363 per 100,000 person-years and the all-cancer mortality rate was 134 per 100,000 person-years [2]. For females, the values were 252 and 73, respectively. From 2005 to 2012, all-cancer incidence and mortality rates for males decreased each year by 1.3% and 2.9%, respectively, whereas for females, the all-cancer incidence rate increased by 0.2% and all-cancer mortality rates decreased by 1.4%. Standardized death rates per 100,000 people for France in 2010 were all causes, 684; cancer, 232; cardiovascular diseases, 156; other diseases, 124; violent deaths, 64; unspecified or ill-defined causes of death, 55; and infectious and parasitic diseases, respiratory diseases, 52 [3]. Thus, cancer was a leading cause of death.
To reduce cancer rates in France, trying to determine the causes of cancer there is worthwhile. A set of studies were conducted to estimate the causes of cancer related to lifestyle and environmental factors in France in 2015. The summary article from that set lists the top seven: tobacco smoking, 19.8% population attributable fraction (PAF); alcohol consumption, 8.0%; dietary factors, 6.8%; overweight and obesity, 5.4%; infectious agents, 4.9%; ultraviolet exposure, 3.6%; and occupational exposures, 3.6% [4].
Tobacco smoking has been a leading cause of cancer since the late 20th century. In the United States, lung and bronchus cancer was the leading cause of cancer death for males from 1955 to present and for females from 1988 to present [5]. For France in 2015, the PAF of cancer cases for active tobacco smoking was about 28% for males and 8% for females [6]. In addition, PAFs were 4.2% of lung cancers in nonsmoking males from smoking partners and 6.7% for females due to smoking partners.
Alcohol consumption is France’s second-leading cause of cancer. For 2015, light, moderate, heavy, and former alcohol drinking were responsible for 1.5%, 1.3%, 4.4%, and 0.6% of all new cancer cases, respectively [7]. Esophageal squamous cell carcinoma had the highest PAF (58%). An estimated 15,000 of all cancer deaths in France in 2009 were due to alcohol consumption [8].
High body mass index (BMI) had an estimated PAF for cancer of 4.1% for males and 6.7% for females [9]. The highest estimated PAFs were for esophageal adenosarcoma (37%) and corpus uteri cancer (34%).
Infectious agents, especially human papillomavirus (1.8% PAF) and Helicobacter pylori (1.3% PAF), are important risk factors for some cancers [10]. Cancers with the largest PAFs from human papillomavirus in descending order of PAF are anal, tonsils, oropharyngeal, penile, head and neck, and oral cavity.
Solar radiation’s effect on cancer incidence was limited to cutaneous melanoma [11]. Three data sets were used in the analysis: the 1903 South Thames birth cohort, a historical reference from France in 1980, and a geographical reference from France for 2003–2007. The PAFs for melanoma cases from solar UV radiation varied from 45% to 89% for males and 23% to 79% for females. The PAF for all-cancer incidence varied from 1.4% to 2.8% for males and from 0.9 to 3.2% for females.
In 2010, Grant published an ecological study of French cancer incidence and mortality rates between 1998 and 2000 with respect to latitude, an index of vitamin D production from solar ultraviolet-B (UVB) radiation [12]. Cancers with significant inverse correlations for both incidence and mortality rates included all, all less lung, breast, colorectal, esophageal, lung (males only), prostate, and uterine cervix and uterine corpus. Those results were similar to those from the United States [13]. However, that analysis did not include other important cancer risk factors, such as obesity. Thus, the findings could have been due to a latitudinal gradient in obesity rather than UVB for some of the cancers.
A study estimated that PM2.5 exposure in France in 2015 had a PAF for lung cancer of 3.6% [14]. The effect of PM2.5 exposure is not investigated directly in this study but is investigated indirectly in that lung cancer incidence and mortality rates are used as the index for smoking.
The present study uses the geographical ecological study approach to determine how solar UVB dose and obesity affect cancer incidence and mortality rates in France for 2007–2016. Cancer incidence and mortality rate data are averaged for geographical regions, as are obesity and UVB doses, and statistical analysis is used to determine the correlations. Other results applying this approach have been reported in several midlatitude countries, including the United States [15,16,17,18,19,20], China [21], Japan [22,23], and Russia [24], as discussed in a 2022 review [25].
2. Materials and Methods
Cancer incidence and mortality rates came from a publication of the Santé publique France, Institut national du cancer [26]. Tables 2-1 to 2-24 in that report included incidence and/or mortality rate data for cancers at 23 anatomical sites as well as for all cancers combined. National estimates of incidence for 2007–2016 and mortality for 2007–2014 included average annual population, crude rate, standardized rate on the age structure of the world population per 100,000 person-years accompanied by their prediction/95% confidence interval, distribution of estimated departmental rates (5th and 95th percentiles: Q5–Q95), and percentage of cases in the total number of incident cases or deaths. Data for 13 regions were available. Data for Corse were not used in that analysis because of the few cancer cases (960 for males, 842 for females) and cancer deaths (492 for males and 351 for females) compared with the other regions (>6000 cases and 2800 deaths).
Obesity data came from a 2012 report on prevalence of obesity in 22 French regions for 2007 and 2012 [27]. Data for 2012 were based on information for 25,714 people older than 18 years. Because the number of regions with obesity data is greater than the number of regions with cancer data, the obesity data for each region for cancer were averaged with respect to populations in the major cities and data combined for 2007 and 2012. Table 1 gives the values used in this study.
Serum 25-hydroxyvitamin D [25(OH)D] concentrations are used to determine the association between vitamin D and health outcomes. Exposure to solar UVB radiation is the main source of vitamin D. That relationship is apparent, for example, in the variations in serum 25(OH)D concentrations during the year as in the UK [29] and the United States [30]. In winter, concentrations fall to 60%–70% of peak summertime concentrations. When vitamin D is not being produced, 25(OH)D stored in skeletal muscle is returned to the serum [31,32].
A 2011 article reports values for annual mean UVB radiation for each Mutualité sociale agricole region in France [28]. The values were based on typical values determined for global UVB all-sky measurements from MeteoStats, Switzerland. The data were accessed from the Solar Radiation Data (SoDa) company from an apparently inactive website. However, maps are still available (www.soda-pro.com/maps/maps-for-pay; accessed June 10, 2024), but we did not pursue that line of inquiry further. Solar UVB doses do not change appreciably from year to year. The main cause of change is fluctuations in stratospheric ozone concentration. Measured solar UV index for Observatoire de Haute-Provence (44° N) from 1975 to 2017 showed an increase to about 1994, followed by relative stability albeit with year-to-year fluctuations [33]. More important, air pollution such as from aerosols as well as clouds also reduces the amount of UVB reaching Earth’s surface. Aerosol loading in France is highest in northern France [14,34]. However, ecological studies generally do not consider those factors.
Data for alcohol consumption in 21 regions came from a 2010 report in France [35]. To develop data for the 12 regions used in this study, we averaged data for each region for cancer with respect to populations in the major cities. Three measures were used in preliminary analyses: daily alcohol use, use at chronic risk or dependence, and repeated drunkenness. Because repeated drunkenness had the highest correlation with cancers such as esophageal cancer, we chose that as the index of alcohol consumption in the analyses.
Annual mean solar UVB doses for the regions vary from 5.45 Wh/m2 in Hauts-de-France to 8.7 Wh/m2 in Provence-Alpes-Côte d’Azur. Serum 25(OH)D concentrations were measured between January 2011 and February 2012 in 10 university hospitals involving 892 French white healthy adults [36]. Mean 25(OH)D concentrations in northern France were 22 ± 8 and 25 ± 8 ng/mL. Figure 1 in Souberbielle and colleagues [36] shows the 10 measurement sites. Using the data in Table 1, we estimate that the mean solar UVB dose in northern France was 6.0 Wh/m2, whereas that in southern France was 6.8 Wh/m2. The ratio of 25(OH)D concentrations is 25/22 = 1.14, whereas the ratio of solar UVB doses is 1.13, showing good agreement. Although those values are only approximations, they indicate that the UVB doses are reasonable indices for mean serum 25(OH)D concentrations in each region. The odds ratio for 25(OH)D <20 ng/mL in the north compared with the south was 1.91 (95% confidence interval [CI], 1.43–2.54).
Lung cancer incidence and mortality rate data also were included as an index of the cancer risk due to smoking. However, lung cancer also is affected by air pollution such as fine particulate matter (PM2.5) in France [14]. PM2.5 concentrations are much higher in northern France [14,34] and several smaller regions throughout France. Because smoking generally takes decades to result in lung cancer, data for smoking rates would not be useful.
Data were analyzed using SigmaStat 4.0 (Grafiti, Palo Alto, CA, USA). Data plots were made using KaleidaGraph 4.5.4 (Synergy Software, Reading, PA, USA).
Table 2 gives the cross-correlation coefficients for the risk-modifying factors used in this study. Factors with significant cross-correlation coefficients should not be used in the same regression analysis. In general, 10 independent pairs of data are needed to produce useful regression results. Because only 12 data sets are used, few useful results involving two risk-modifying factors would be expected.
3. Results
Table 3, Table 4, Table 5 and Table 6 show the regression results (all p < 0.10) for cancer incidence and mortality rates for males and females. The good agreement of the results for obesity with estimates in a model study for France [9] supports the findings in this ecological study for UVB dose in that the same analytic method was used. However, very little effect was found for smoking in using lung cancer incidence or mortality rates as the index of smoking. Also, no significant correlations were found for repeated drunkenness, the index of alcohol consumption.
The PAF of cancer incidence and mortality rates can be estimated from the regression results from the regression equation. It is essentially the area of the triangle for the regression fit to the data from low to high value of the risk-modifying factor divided by the rectangle for the mean value of the cancer rate times the difference between high and low values for the risk-modifying factor, then multiplied by adjusted r2 for the regression fit. For all-cancer mortality for females with respect to obesity, the PAF is:
| All-cancer mortality | 51 + 1.6 × Obes | 0.94, 0.86, <0.001 |
(1.6 × 8.8 × 8.8/2)/ [(51 + 1.6 × 16) × 8.8] × 0.86
= [1.6 × 8.8/2]/ [(51 + 1.6 × 16)] × 0.86
= [7.04/76.6] × 0.86 = 0.08
However, that estimate is a lower bound, based only on having obesity rates in all regions set to the lowest value. If the obesity rate were set to zero, the estimate would be that the rate would be 51 deaths/100,000 per year. However, such an extrapolation cannot be made because many relationships are nonlinear, often reaching a minimum or maximum value before the zero value of the independent variable is reached.
4. Discussion
Solar UVB dose was more strongly associated with reduced cancer risk for males than for females, possibly because, for example, males are more likely to be outdoors occupationally, such as in agriculture, construction, or public safety. An ecological study in Nordic countries showed that effect [37]. Also, cosmetics now generally include sunscreen [38,39], thereby reducing vitamin D production in women.
Solar UVB dose was not found associated with several types of cancer for which it was found in ecological studies of cancer mortality rates in the United States such as bladder and colorectal cancer [13,18]. The likely reason is that since people now have higher BMI, obesity becomes a more important risk factor, in part since serum 25(OH)D concentration tends to be inversely correlated with BMI and fat mass. For example, an observational study conducted in Italy involving 147 overweight and obese subjects, the regression fit for serum 25(OH)D concentration increased from 5 ng/mL for fat mass = 43 kg to 40 ng/mL for 26 kg [40]. In multiple regression analysis using two models, fat mass was the only significant factor correlated with 25(OH)D concentration (p < 0.01). In turn, systemic inflammation is inversely correlated with serum 25(OH)D concentration [41]. Systemic inflammation is associated with an increased risk of cancer. An observational study involving 8024 individuals in the Rotterdam Study followed found that over a ten-year period, cancer risk increased from 9.7% in the lowest quartile to 14.7% in the highest quartile (p = 0.009) [42].
This study’s results for obesity and solar UVB doses generally agree with those in the literature. Table 7 serves as a bibliography of articles and reviews supporting obesity’s role in cancer risk and those of serum 25(OH)D concentration and solar UVB in reducing cancer risk.
Solar UVB’s inverse correlation with several cancers indicates that vitamin D reduces risk of both incidence and mortality rates. Solar UV’s main effect on cancer risk is through vitamin D production. Vitamin D has many mechanisms to reduce cancer risk. The action is generally through the hormonal metabolite, 1,25-dihydroxvyitamin D [1,25-(OH)2D3, or calcitriol] binding to vitamin D receptors (VDRs) linked to chromosomes, leading to up- or downregulation of many genes [99]. Organs that need calcitriol, such as those afflicted with cancer cells, can convert circulating 25(OH)D to calcitriol [100]. Tumors with lower expression of VDRs tend to be more aggressive [101] and although that did not affect breast cancer survival over a 6-year period, higher VDR expression does reduce prostate cancer mortality rates [102]. Vitamin D increases cell differentiation, which is usually, but not necessarily, linked to an arrest in proliferation, and both processes inhibit slow tumorigenesis [25]. Calcitriol modulates the biology of stromal cells such as fibroblasts, endothelial, and immune cells in a way that interferes with metastasis.
A recent review recommended supplementation with 2000 IU/d of vitamin D3 for good health [103]. That would be a good recommendation for reducing cancer risk for people with BMI < 25 kg/m2 of body surface area. However, as reported in secondary analyses of the VITAL study, people with BMI < 25 kg/m2 had a 25% reduction in all-cancer incidence and those with higher BMI did not. Even though those below and above 25 kg/m2 increased serum 25(OH)D concentrations by the same amount, 12 ng/mL, those with higher BMI did not significantly reduce risk of all-cancer incidence [104]. The mean baseline 25(OH)D concentration of participants in that study’s vitamin D arm was near 31 ng/mL. However, 25(OH)D concentrations were not measured in those in the placebo arm or in all of the treatment group. Most likely, people with higher BMI require higher vitamin D doses as well as higher 25(OH)D concentrations to reduce cancer risk. However, vitamin D supplementation has not been shown to significantly reduce inflammatory markers in overweight and obese people, as shown in a meta-analysis of 11 randomized controlled trials with a total of 504 participants [105]. No significant change was apparent in either C-reactive protein or tumor necrosis factor concentrations related to either vitamin D dose or achieved serum 25(OH)D concentration.
Vitamin D supplementation should also be considered adjuvant treatment for people who develop cancer [25,106,107]. Vitamin D is more effective in reducing cancer mortality risk than incidence [104,108] because vitamin D is one of the few natural compounds in the body that reduce angiogenesis around tumors and metastasis [25].
Several reasons may explain researchers’ not having found more cancers linked to lung cancer:
- Lung cancer incidence or mortality rate may not be a good index for effects of smoking because lung cancer risk also is related to diet, as shown here by the high correlation between obesity and lung cancer mortality rate.
- Smoking rates may not vary much in France.
- Smoking may have been less important than before because of lower smoking rates.
As for alcohol consumption, it is likely that either the index, repeated drunkenness, is not suitable for the effect on cancer risk, or alcohol consumption does not vary much throughout France. Further speculation on reasons is beyond the scope of this study.
Many papers have discussed obesity’s role in risk of cancer incidence and mortality rates. Some findings are discussed here in the order they are listed in Table 1. A 2021 review estimated that 55% of cancers diagnosed in women and 24% in men were related to overweight/obesity [43]. The main mechanisms underlying that relationship include the insulin/insulin-like growth factor 1 (IGF-1) system, the effect of sex hormones, and adipocytokines. Obesity has a strong association with cancers related to female reproduction, whereas for cancers affecting both sexes, obesity is more important for males.
Higher BMI is associated with many cancers. For endometrial cancer, the relative risk (RR) per 5-unit increase in BMI is 1.54 (95% CI, 1.47–1.61) [44]. Central adiposity measured by waist circumference or waist-to-hip ratio has been suggested as a stronger predictor than BMI for several cancers, such as colorectal cancer. Metabolic syndrome has been consistently and positively associated with the risk of very common cancers such as colorectal (RR = 1.34 [95% CI, 1.24–1.44]), endometrial (RR = 1.62 [95% CI, 1.26–2.07]), and postmenopausal breast cancer (RR = 2.01 [95% CI, 1.55–2.60]).
A meta-analysis of 203 studies with 6,320,365 participants evaluated the association of obesity with overall survival (OS), cancer-specific survival (CSS), and progression-free survival (PFS) or disease-free survival (DFS) in cancer patients [45]. Overall, obesity was associated with a reduced OS (hazard ratio [HR] = 1.14 [95% CI, 1.09–1.19]) and CSS (HR = 1.17 [95% CI, 1.12–1.23]). Patients also were at increased risk of recurrence (HR = 1.13 [95% CI, 1.07–1.19]). Conversely, patients with obesity and lung cancer, renal cell carcinoma, or melanoma had better survival outcomes than nonobese patients with the same cancer (lung, HR = 0.86 [95% CI, 0.76–0.98]; renal cell, HR = 0.74 [95% CI, 0.53–0.89]; melanoma, HR = 0.74 [95% CI, 0.57–0.96]).
Metabolic abnormalities such as insulin resistance (IR) and dyslipidemia are associated with both obesity and type 2 diabetes mellitus (DM) and have been implicated in the obesity–cancer relationship [46]. Multiple mechanisms have been proposed to link obesity and DM with cancer progression, including an increase in insulin/IGF-1 signaling; lipid and glucose uptake and metabolism; alterations in the profile of cytokines, chemokines, and adipokines; and changes in the adipose tissue adjacent to cancer sites.
The interplay between obesity and the risk of cancer development or recurrence is not fully understood. The relation involves altered fatty acid metabolism, extracellular matrix remodeling, secretion of adipokines and anabolic and sex hormones, immune dysregulation, and chronic inflammation [47]. Treatment with glucagon-like peptide 1 analogues and bariatric surgery result in faster weight loss and can be considered in selected cancer survivors.
A study investigated BMI jointly and in interaction with metabolic health status in relation to obesity-related cancer risk (n = 23,630) among 797,193 Europeans [48]. Metabolically healthy and unhealthy status was defined by using a metabolic score comprising mid-blood pressure, plasma glucose, and triglycerides. Metabolically unhealthy obesity was, compared with metabolically healthy normal weight, associated with an increased RR of any obesity-related cancer and of colon, rectal, pancreatic, endometrial, liver, gallbladder, and renal cell cancer (p < 0.05), with the highest risk estimates for endometrial, liver, and renal cell cancer (HR = 2.55–3.00). Metabolically healthy obesity showed a higher RR for any obesity-related cancer and colon (in men), endometrial, renal cell, liver, and gallbladder cancer, though the risk relationships were weaker.
A review investigated the correlations between DM and obesity and bladder cancer risk from 25 retrospective articles [54]. Diabetic patients had significantly higher risk for all-cause mortality (HR = 1.24 [95% CI, 1.07–1.44]), cancer-specific mortality (HR = 1.67 [95% CI, 1.29–2.16]), disease progression (HR = 1.54 [95% CI, 1.15–2.06]), and recurrence (HR = 1.40 [95% CI, 1.32–1.48]) than in nondiabetics. No statistically significant risk change for all-cause mortality, cancer-specific mortality, disease progression, and recurrence was found for overweight patients. However, obese people were at higher risk for disease progression (HR = 1.88 [95% CI, 1.41–2.50]) and recurrence (HR = 1.60 [95% CI, 1.06–2.40]) than patients with healthful BMI.
A review stated that for obese women, factors that contribute to breast cancer include higher estrogen levels due to excessive aromatization activity of the adipose tissue, overexpression of proinflammatory cytokines, IR, hyperactivation of IGF pathways, adipocyte-derived adipokines, hypercholesterolemia, and excessive oxidative stress [55]. Moreover, increased plasma cholesterol hastens tumor formation and exacerbates their aggressiveness. In contrast to postmenopausal women, premenopausal women with high BMI are inversely associated with breast cancer risk. In addition, the impacts of obesity-related concentrations of estrogen, cholesterol, saturated fatty acid, leptin, and adiponectin; aromatase activity; leptin; and IR on breast cancer patients are evaluated.
Another review, from 2018, noted that poor dietary habits related to obesity risk modulate inflammation and thereby appear to be linked to higher risk of breast cancer and mortality [57]. Such habits are characterized by high intake of refined starches, sugar, and both saturated and trans-saturated fats, as well as low intake of omega-3 fatty acids, natural antioxidants, and fiber.
A 2019 review noted that visceral adipocytes are more metabolically active than subcutaneous adipocytes [58]. Such adipose tissue harbors multiple molecular entities that promote carcinogenesis: endocrine molecules/hormones, immunologic factors, inflammatory cytokines, metabolic alterations, and other components of the microenvironment. Expression of those culpable entities is regulated largely by epigenetic mechanisms. The relationship between those entities and drivers of epigenetic alteration are crucial to regulating pathways connecting obesity and cancer risk.
A 2023 review related obesity-associated risk of colorectal cancer to the Western diet [65]. That diet is characterized by high intake of red and processed meat and low consumption of whole grains, fruits, vegetables, and fiber, which increases risk of obesity. Moreover, the Western diet is associated with a proinflammatory profile diet, which may cause chronic low-grade inflammation. In fact, obese people often have gut dysbiosis, increased inflammation, and risk of colorectal cancer.
Endometrial cancer is the most often observed malignant gynecologic disease in developed countries [71]. Obesity is an important risk factor. Adipose tissue serves as an endocrine organ, involved with hyperglycemia, IR, and hyperestrogenemia, as well as interactions with a chronic proinflammatory microenvironment. Weight reduction, physical activity, and healthy nutrition can reduce its risk.
A randomized controlled trial was conducted to examine how reducing fat mass through diet affected endometrial or ovarian cancer patients [70]. Women were randomly assigned to a ketogenic diet (KD) (70:25:5 energy from fat, protein, and carbohydrate, respectively) or the American Cancer Society diet (ACS; high-fiber, low-fat). Body composition (dual x-ray absorptiometry) and fasting serum insulin, IGF-1, and β-hydroxybutyrate were obtained at baseline and at 12 weeks; urinary ketones also were measured continually. After 12 weeks, the KD group had lower adjusted total (35.3 vs. 38.0 kg; p < 0.05) and android (3.0 vs. 3.3 kg; p < 0.05) fat mass than the ACS group. Percent change in visceral fat was greater in the KD group than in the ACS group (−21.2% vs. −4.6%; p < 0.05). Adjusted total lean mass did not differ between the groups. The KD group had lower adjusted fasting serum insulin (7.6 vs. 11.2 µU/mL; p < 0.01) than the ACS group. A significant inverse association existed between the changes in serum β-hydroxybutyrate and IGF-1 concentrations (r = -0.57; p < 0.0001). The basis for that approach is the mitochondrial metabolic theory of cancer [109,110]. It is based on the Warburg effect: aerobic fermentation of glucose as a major phenotype of most cancers [111,112]. See also a discussion of the mechanisms whereby the mitochondria influence all steps of oncogenesis [113]. Seyfried and colleagues discussed how ketogenic metabolic therapy could be used as a complementary or alternative approach to manage breast cancer [114].
Increasing evidence suggests obesity’s role in the initiation and progression of cancers, including renal cell carcinoma (RCC) [77]. Because tumors require energy for their uncontrollable growth, it appears plausible that their initiation and development is associated with dysregulation of cell metabolism. Thus, intake of excessive energy and nutrients may favor development of cancers. Many factors promote development of RCC, such as hypoxia, inflammation, IR, and excessive adipose tissue and adipokines. Many obesity-related alterations in gene expression can promote RCC, such as DNA methylation, single-nucleotide polymorphisms, histone modification, and miRNAs.
Nonalcoholic fatty liver disease (NAFLD) is increasing and becoming one of the world’s most common causes of liver disease [81]. NAFLD is one of the new emerging risk factors for developing tumors of the gastrointestinal tract, particularly hepatocellular carcinoma. Visceral obesity is an important risk factor for NAFLD. Accumulating ectopic fat leads to dysfunctional adipose tissue with impaired production of adipocytokines which, in turn, can increase proinflammatory cytokines, leading to a microenvironment favorable to cancer development.
Lung cancer risk is inversely associated with obesity. To determine why, researchers analyzed tissue differences between lung neoplasms and healthful lungs in seven gene expression data sets [86]. Analysis showed significant enrichment of adipocytes and preadipocytes in healthful lungs compared with lung cancers. An understudied adipokine, omentin, was significantly and consistently lower in lung neoplasms than in healthful lungs. Omentin was consistently downregulated in lung cancers and exhibited a negative correlation with important transcription factors FOXA1, EN1, FOXC1, and ELK4. The authors suggested that omentin may serve as a prognostic factor in lung cancer and explain the “obesity paradox” in lung cancer.
A mechanism suggested to explain obesity’s role in ovarian cancer is related to leptin [88]. Leptin is an adipose tissue–derived hormone that can signal the body to reduce food intake. But leptin resistance can develop, leading to obesity and greater leptin production [115]. In 70 ovarian cancer patients, leptin exposure increased cancer cell migration/invasion through leptin-mediated activation of the JAK–STAT3, PI3–AKT, and RhoA–ROCK pathways and promoted new lamellipodial, stress fiber, and focal adhesion formation. Leptin also contributed to the maintenance of stemness and the mesenchymal phenotype in ovarian cancer cells.
The mechanisms proposed to explain the link between DM and cancer risk include obesity, inflammation and oxidative stress, hyperglycemia, and hyperinsulinemia [116]. A large-scale prospective study of 162,667 women and 43,185 men in health care during a median follow-up of 26 years was used to determine how dietary patterns affected chronic diseases [117]. Two empirical dietary patterns were derived: reversed empirical dietary index for hyperinsulinemia and reversed empirical dietary inflammatory pattern, both associated with a 10% reduction in total cancer, or 5% when adjusted for BMI. They were associated with a 17% reduction in obesity-related cancers and with a 62%‒64% reduction in DM, or 43% when adjusted for BMI. The patterns reduced risk of chronic disease better than several other touted dietary patterns such as the Alternate Mediterranean dietary pattern. Food groups with highest risk for chronic diseases were red meat, processed meat, french fries, and energy drinks. Food groups with lowest risk include coffee, wine, whole grains, nuts, fruit, dark-yellow vegetables, low-fat dairy products, salad dressing (possibly olive oil), and leafy green vegetables. A low-fat vegan diet can quickly reverse DM [118,119]. The mechanisms of DM reversal include removing excess fat from various organs to normalize hepatic insulin responsiveness and β-cell recovery [120]. Weight loss of ~15 kg achieved through caloric restriction also has led to remission of DM of patients with obesity and DM in an intensive management [121].
Among this ecological study’s strengths are that it includes cancer data for geographical regions across continental France. The approach yielded good results for obesity and solar UVB radiation. The method works well for risk-modifying factors that have reasonable geographical variation as well as important impacts on cancer risk.
Weaknesses include that data for some important cancer risk–modifying factors, such as diet, were not available. In addition, the data used were representative, not inclusive. Also, because data for individual people were not used, the interaction between risk-modifying factors such as obesity and serum 25(OH)D concentrations could not be assessed. Data for obesity were for adults and not just older adults with higher cancer risk. Data for alcohol consumption were not ideal. In addition, the study used no information on cancer screening, such as for breast, colorectal, and prostate cancer, or treatment.
5. Conclusions
This ecological study shows that solar UVB reduces risk of some cancers in France, whereas obesity increases risk. Cancer rates in France could be reduced through more solar UVB exposure and vitamin D supplementation as well as taking steps to reduce the rate of overweight, obesity, and DM, preferably through dietary measures.
Author Contributions
Conceptualization, W.B.G.; obtaining French datasets, P.M.; analytic method, W.B.G.; formal analysis, W.B.G.; writing—original draft preparation, W.B.G.; writing—review and editing, W.B.G. and P.M.; visualization, W.B.G.; supervision, W.B.G. All authors have read and agreed to the published version of the manuscript.
Funding
This research received no external funding.
Institutional Review Board Statement
Not applicable.
Data Availability Statement
The original contributions presented in the study are included in the article or in the references provided. Further inquiries can be directed to the corresponding author.
Conflicts of Interest
W.B.G. has had funding from Bio-Tech Pharmacal, Inc., (Fayetteville, AR, USA). The funder had no role in the design of the study; in the collection, analyses, or interpretation of data; in the writing of the manuscript; or in the decision to publish the results. P.M. has no conflicts of interest to declare.
References
- Population, France. Availabe online: https://data.worldbank.org/indicator/SP.POP.TOTL.MA.IN?locations=FR (accessed on June 30, 2024).
- Binder-Foucard, F.; Bossard, N.; Delafosse, P.; Belot, A.; Woronoff, A.S.; Remontet, L.; French network of cancer, r. Cancer incidence and mortality in France over the 1980-2012 period: solid tumors. Rev Epidemiol Sante Publique 2014, 62, 95–108. [Google Scholar] [CrossRef] [PubMed]
- France, Causes of Death. Availabe online: https://www.ined.fr/en/everything_about_population/data/france/deaths-causes-mortality/deaths-causes/ (accessed on 30 June, 2024).
- Soerjomataram, I.; Shield, K.; Marant-Micallef, C.; Vignat, J.; Hill, C.; Rogel, A.; Menvielle, G.; Dossus, L.; Ormsby, J.N.; Rehm, J. , et al. Cancers related to lifestyle and environmental factors in France in 2015. Eur J Cancer 2018, 105, 103–113. [Google Scholar] [CrossRef] [PubMed]
- Siegel, R.L.; Giaquinto, A.N.; Jemal, A. Cancer statistics, 2024. CA Cancer J Clin 2024, 74, 12–49. [Google Scholar] [CrossRef] [PubMed]
- Cao, B.; Hill, C.; Bonaldi, C.; Leon, M.E.; Menvielle, G.; Arwidson, P.; Bray, F.; Soerjomataram, I. Cancers attributable to tobacco smoking in France in 2015. Eur J Public Health 2018, 28, 707–712. [Google Scholar] [CrossRef] [PubMed]
- Shield, K.D.; Marant Micallef, C.; Hill, C.; Touvier, M.; Arwidson, P.; Bonaldi, C.; Ferrari, P.; Bray, F.; Soerjomataram, I. New cancer cases in France in 2015 attributable to different levels of alcohol consumption. Addiction 2018, 113, 247–256. [Google Scholar] [CrossRef] [PubMed]
- Guerin, S.; Laplanche, A.; Dunant, A.; Hill, C. Alcohol-attributable mortality in France. Eur J Public Health 2013, 23, 588–593. [Google Scholar] [CrossRef] [PubMed]
- Arnold, M.; Touillaud, M.; Dossus, L.; Freisling, H.; Bray, F.; Margaritis, I.; Deschamps, V.; Soerjomataram, I. Cancers in France in 2015 attributable to high body mass index. Cancer Epidemiol 2018, 52, 15–19. [Google Scholar] [CrossRef] [PubMed]
- Shield, K.D.; Marant Micallef, C.; de Martel, C.; Heard, I.; Megraud, F.; Plummer, M.; Vignat, J.; Bray, F.; Soerjomataram, I. New cancer cases in France in 2015 attributable to infectious agents: a systematic review and meta-analysis. Eur J Epidemiol 2018, 33, 263–274. [Google Scholar] [CrossRef] [PubMed]
- Arnold, M.; Kvaskoff, M.; Thuret, A.; Guenel, P.; Bray, F.; Soerjomataram, I. Cutaneous melanoma in France in 2015 attributable to solar ultraviolet radiation and the use of sunbeds. J Eur Acad Dermatol Venereol 2018, 32, 1681–1686. [Google Scholar] [CrossRef]
- Grant, W.B. An ecological study of cancer incidence and mortality rates in France with respect to latitude, an index for vitamin D production. Dermatoendocrinol 2010, 2, 62–67. [Google Scholar] [CrossRef]
- Grant, W.B.; Garland, C.F. The association of solar ultraviolet B (UVB) with reducing risk of cancer: multifactorial ecologic analysis of geographic variation in age-adjusted cancer mortality rates. Anticancer Res 2006, 26, 2687–2699. [Google Scholar] [PubMed]
- Kulhanova, I.; Morelli, X.; Le Tertre, A.; Loomis, D.; Charbotel, B.; Medina, S.; Ormsby, J.N.; Lepeule, J.; Slama, R.; Soerjomataram, I. The fraction of lung cancer incidence attributable to fine particulate air pollution in France: Impact of spatial resolution of air pollution models. Environ Int 2018, 121, 1079–1086. [Google Scholar] [CrossRef]
- Garland, C.F.; Garland, F.C. Do sunlight and vitamin D reduce the likelihood of colon cancer? Int J Epidemiol 1980, 9, 227–231. [Google Scholar] [CrossRef] [PubMed]
- Garland, F.C.; Garland, C.F.; Gorham, E.D.; Young, J.F. Geographic variation in breast cancer mortality in the United States: a hypothesis involving exposure to solar radiation. Prev Med 1990, 19, 614–622. [Google Scholar] [CrossRef]
- Lefkowitz, E.S.; Garland, C.F. Sunlight, vitamin D, and ovarian cancer mortality rates in US women. Int J Epidemiol 1994, 23, 1133–1136. [Google Scholar] [CrossRef]
- Grant, W.B. An estimate of premature cancer mortality in the U.S. due to inadequate doses of solar ultraviolet-B radiation. Cancer 2002, 94, 1867–1875. [Google Scholar] [CrossRef] [PubMed]
- Boscoe, F.P.; Schymura, M.J. Solar ultraviolet-B exposure and cancer incidence and mortality in the United States, 1993-2002. BMC Cancer 2006, 6, 264. [Google Scholar] [CrossRef]
- Grant, W.B. Cancer Incidence Rates in the US in 2016-2020 with Respect to Solar UVB Doses, Diabetes and Obesity Prevalence, Lung Cancer Incidence Rates, and Alcohol Consumption: An Ecological Study. Nutrients 2024, 16, 1450. [Google Scholar] [CrossRef]
- Chen, W.; Clements, M.; Rahman, B.; Zhang, S.; Qiao, Y.; Armstrong, B.K. Relationship between cancer mortality/incidence and ambient ultraviolet B irradiance in China. Cancer Causes Control 2010, 21, 1701–1709. [Google Scholar] [CrossRef]
- Mizoue, T. Ecological study of solar radiation and cancer mortality in Japan. Health Phys 2004, 87, 532–538. [Google Scholar] [CrossRef]
- Fukuda, Y.; Nakaya, T.; Nakao, H.; Yahata, Y.; Imai, H. Multilevel analysis of solar radiation and cancer mortality using ecological data in Japan. Biosci Trends 2008, 2, 235–240. [Google Scholar] [PubMed]
- Borisenkov, M.F. Latitude of residence and position in time zone are predictors of cancer incidence, cancer mortality, and life expectancy at birth. Chronobiol Int 2011, 28, 155–162. [Google Scholar] [CrossRef] [PubMed]
- Muñoz, A.; Grant, W.B. Vitamin D and Cancer: An Historical Overview of the Epidemiology and Mechanisms. Nutrients 2022, 14, 1448. [Google Scholar] [CrossRef] [PubMed]
- Chatignoux, E.; Billot-Grasset, A.; Cariou, M. Estimations régionales et départementales d’incidence et de mortalité par cancers en France, 2007-2016; Annexes aux profils regiionaux; Santé publique France, Institut national du cancer.: 2019, 2019. [Google Scholar]
- Eschwege, E.; Charles, M.A.; Basdevant, A. Enquête épidémiologique nationale sur le surpoids et l’obésité; INSERM, Kantar Health and Roche: 2012.
- Orton, S.M.; Wald, L.; Confavreux, C.; Vukusic, S.; Krohn, J.P.; Ramagopalan, S.V.; Herrera, B.M.; Sadovnick, A.D.; Ebers, G.C. Association of UV radiation with multiple sclerosis prevalence and sex ratio in France. Neurology 2011, 76, 425–431. [Google Scholar] [CrossRef]
- Hypponen, E.; Power, C. Hypovitaminosis D in British adults at age 45 y: nationwide cohort study of dietary and lifestyle predictors. Am J Clin Nutr 2007, 85, 860–868. [Google Scholar] [CrossRef] [PubMed]
- Kroll, M.H.; Bi, C.; Garber, C.C.; Kaufman, H.W.; Liu, D.; Caston-Balderrama, A.; Zhang, K.; Clarke, N.; Xie, M.; Reitz, R.E. , et al. Temporal relationship between vitamin D status and parathyroid hormone in the United States. PLoS One 2015, 10, e0118108. [Google Scholar] [CrossRef]
- Mason, R.S.; Rybchyn, M.S.; Abboud, M.; Brennan-Speranza, T.C.; Fraser, D.R. The Role of Skeletal Muscle in Maintaining Vitamin D Status in Winter. Curr Dev Nutr 2019, 3, nzz087. [Google Scholar] [CrossRef] [PubMed]
- Rybchyn, M.S.; Abboud, M.; Puglisi, D.A.; Gordon-Thomson, C.; Brennan-Speranza, T.C.; Mason, R.S.; Fraser, D.R. Skeletal Muscle and the Maintenance of Vitamin D Status. Nutrients 2020, 12, 3270. [Google Scholar] [CrossRef]
- Zerefos, C.; Fountoulakis, I.; Eleftheratos, K.; Kazantzidis, A. Long-term variability of human health-related solar ultraviolet-B radiation doses for the 1980s to the end of the 21st century. Physiol Rev 2023, 103, 1789–1826. [Google Scholar] [CrossRef]
- Tchicaya, A.; Lorentz, N.; Omrani, H.; de Lanchy, G.; Leduc, K. Impact of long-term exposure to PM(2.5) and temperature on coronavirus disease mortality: observed trends in France. Environ Health 2021, 20, 101. [Google Scholar] [CrossRef]
- Beck, F.; Guignard, R.; Léon, C.; Richard, J.R. Atlas des usages de substances psychoactives 2010; Institut national de prévention et d’éducation pour la santé: Saint-Denis Cedex France, 2013. [Google Scholar]
- Souberbielle, J.C.; Massart, C.; Brailly-Tabard, S.; Cavalier, E.; Chanson, P. Prevalence and determinants of vitamin D deficiency in healthy French adults: the VARIETE study. Endocrine 2016, 53, 543–550. [Google Scholar] [CrossRef] [PubMed]
- Grant, W.B. Role of solar UVB irradiance and smoking in cancer as inferred from cancer incidence rates by occupation in Nordic countries. Dermatoendocrinol 2012, 4, 203–211. [Google Scholar] [CrossRef] [PubMed]
- Shanbhag, S.; Nayak, A.; Narayan, R.; Nayak, U.Y. Anti-aging and Sunscreens: Paradigm Shift in Cosmetics. Adv Pharm Bull 2019, 9, 348–359. [Google Scholar] [CrossRef] [PubMed]
- Couteau, C.; Philippe, A.; Galharret, J.M.; Metay, E.; Coiffard, L. UV filters in everyday cosmetic products, a comparative study. Environ Sci Pollut Res Int 2024, 31, 2976–2986. [Google Scholar] [CrossRef] [PubMed]
- De Pergola, G.; Martino, T.; Zupo, R.; Caccavo, D.; Pecorella, C.; Paradiso, S.; Silvestris, F.; Triggiani, V. 25 Hydroxyvitamin D Levels are Negatively and Independently Associated with Fat Mass in a Cohort of Healthy Overweight and Obese Subjects. Endocr Metab Immune Disord Drug Targets 2019, 19, 838–844. [Google Scholar] [CrossRef] [PubMed]
- Bellia, A.; Garcovich, C.; D’Adamo, M.; Lombardo, M.; Tesauro, M.; Donadel, G.; Gentileschi, P.; Lauro, D.; Federici, M.; Lauro, R. , et al. Serum 25-hydroxyvitamin D levels are inversely associated with systemic inflammation in severe obese subjects. Intern Emerg Med 2013, 8, 33–40. [Google Scholar] [CrossRef] [PubMed]
- Fest, J.; Ruiter, R.; Mulder, M.; Groot Koerkamp, B.; Ikram, M.A.; Stricker, B.H.; van Eijck, C.H.J. The systemic immune-inflammation index is associated with an increased risk of incident cancer-A population-based cohort study. Int J Cancer 2020, 146, 692–698. [Google Scholar] [CrossRef] [PubMed]
- Argyrakopoulou, G.; Dalamaga, M.; Spyrou, N.; Kokkinos, A. Gender Differences in Obesity-Related Cancers. Curr Obes Rep 2021, 10, 100–115. [Google Scholar] [CrossRef] [PubMed]
- Mili, N.; Paschou, S.A.; Goulis, D.G.; Dimopoulos, M.A.; Lambrinoudaki, I.; Psaltopoulou, T. Obesity, metabolic syndrome, and cancer: pathophysiological and therapeutic associations. Endocrine 2021, 74, 478–497. [Google Scholar] [CrossRef]
- Petrelli, F.; Cortellini, A.; Indini, A.; Tomasello, G.; Ghidini, M.; Nigro, O.; Salati, M.; Dottorini, L.; Iaculli, A.; Varricchio, A. , et al. Association of Obesity With Survival Outcomes in Patients With Cancer: A Systematic Review and Meta-analysis. JAMA Netw Open 2021, 4, e213520. [Google Scholar] [CrossRef]
- Scully, T.; Ettela, A.; LeRoith, D.; Gallagher, E.J. Obesity, Type 2 Diabetes, and Cancer Risk. Front Oncol 2020, 10, 615375. [Google Scholar] [CrossRef] [PubMed]
- Pati, S.; Irfan, W.; Jameel, A.; Ahmed, S.; Shahid, R.K. Obesity and Cancer: A Current Overview of Epidemiology, Pathogenesis, Outcomes, and Management. Cancers (Basel) 2023, 15. [Google Scholar] [CrossRef] [PubMed]
- Sun, M.; Fritz, J.; Haggstrom, C.; Bjorge, T.; Nagel, G.; Manjer, J.; Engeland, A.; Zitt, E.; van Guelpen, B.; Stattin, P. , et al. Metabolically (un)healthy obesity and risk of obesity-related cancers: a pooled study. J Natl Cancer Inst 2023, 115, 456–467. [Google Scholar] [CrossRef]
- Sha, S.; Chen, L.J.; Brenner, H.; Schottker, B. Associations of 25-hydroxyvitamin D status and vitamin D supplementation use with mortality due to 18 frequent cancer types in the UK Biobank cohort. Eur J Cancer 2023, 191, 113241. [Google Scholar] [CrossRef] [PubMed]
- Bai, Y.; Wen, Y.Q.; Ma, X. Association between the Serum Vitamin D Concentration and All-Cause and Cancer-Specific Mortality in Individuals with Cancer. Nutr Cancer 2024, 76, 89–97. [Google Scholar] [CrossRef] [PubMed]
- Mo, X.; He, C.; Han, F.; Yan, H.; Chen, X.; Wang, Y.; Zhou, M. Association of serum 25-hydroxy-vitamin D concentration and risk of mortality in cancer survivors in the United States. BMC Cancer 2024, 24, 545. [Google Scholar] [CrossRef] [PubMed]
- Sun, J.W.; Zhao, L.G.; Yang, Y.; Ma, X.; Wang, Y.Y.; Xiang, Y.B. Obesity and risk of bladder cancer: a dose-response meta-analysis of 15 cohort studies. PLoS One 2015, 10, e0119313. [Google Scholar] [CrossRef] [PubMed]
- Zhao, L.; Tian, X.; Duan, X.; Ye, Y.; Sun, M.; Huang, J. Association of body mass index with bladder cancer risk: a dose-response meta-analysis of prospective cohort studies. Oncotarget 2017, 8, 33990–34000. [Google Scholar] [CrossRef]
- Lu, Y.; Tao, J. Diabetes Mellitus and Obesity as Risk Factors for Bladder Cancer Prognosis: A Systematic Review and Meta-Analysis. Front Endocrinol (Lausanne) 2021, 12, 699732. [Google Scholar] [CrossRef]
- Engin, A. Obesity-associated Breast Cancer: Analysis of risk factors. Adv Exp Med Biol 2017, 960, 571–606. [Google Scholar] [CrossRef]
- Picon-Ruiz, M.; Morata-Tarifa, C.; Valle-Goffin, J.J.; Friedman, E.R.; Slingerland, J.M. Obesity and adverse breast cancer risk and outcome: Mechanistic insights and strategies for intervention. CA Cancer J Clin 2017, 67, 378–397. [Google Scholar] [CrossRef] [PubMed]
- Seiler, A.; Chen, M.A.; Brown, R.L.; Fagundes, C.P. Obesity, Dietary Factors, Nutrition, and Breast Cancer Risk. Curr Breast Cancer Rep 2018, 10, 14–27. [Google Scholar] [CrossRef] [PubMed]
- Agurs-Collins, T.; Ross, S.A.; Dunn, B.K. The Many Faces of Obesity and Its Influence on Breast Cancer Risk. Front Oncol 2019, 9, 765. [Google Scholar] [CrossRef] [PubMed]
- LeVee, A.; Mortimer, J. The Challenges of Treating Patients with Breast Cancer and Obesity. Cancers (Basel) 2023, 15. [Google Scholar] [CrossRef]
- Dehesh, T.; Fadaghi, S.; Seyedi, M.; Abolhadi, E.; Ilaghi, M.; Shams, P.; Ajam, F.; Mosleh-Shirazi, M.A.; Dehesh, P. The relation between obesity and breast cancer risk in women by considering menstruation status and geographical variations: a systematic review and meta-analysis. BMC Womens Health 2023, 23, 392. [Google Scholar] [CrossRef] [PubMed]
- Chlebowski, R.T.; Aragaki, A.K.; Pan, K.; Simon, M.S.; Neuhouser, M.L.; Haque, R.; Rohan, T.E.; Wactawski-Wende, J.; Orchard, T.S.; Mortimer, J.E. , et al. Breast cancer incidence and mortality by metabolic syndrome and obesity: The Women’s Health Initiative. Cancer, 1002. [Google Scholar] [CrossRef]
- Li, C.; Li, H.; Zhong, H.; Li, X. Association of 25-hydroxyvitamin D level with survival outcomes in female breast cancer patients: A meta-analysis. J Steroid Biochem Mol Biol 2021, 212, 105947. [Google Scholar] [CrossRef]
- Hiller, T.W.R.; O’Sullivan, D.E.; Brenner, D.R.; Peters, C.E.; King, W.D. Solar Ultraviolet Radiation and Breast Cancer Risk: A Systematic Review and Meta-Analysis. Environ Health Perspect 2020, 128, 16002. [Google Scholar] [CrossRef] [PubMed]
- Loosen, S.H.; Roderburg, C.; Jordens, M.S.; Fluegen, G.; Luedde, T.; Kostev, K. Overweight and Obesity Determine the Risk for Gastrointestinal Cancer in a Sex-Dependent Manner: A Retrospective Cohort Study of 287,357 Outpatients in Germany. Cancers (Basel) 2022, 14. [Google Scholar] [CrossRef]
- Rychter, A.M.; Lykowska-Szuber, L.; Zawada, A.; Szymczak-Tomczak, A.; Ratajczak, A.E.; Skoracka, K.; Kolan, M.; Dobrowolska, A.; Krela-Kazmierczak, I. Why Does Obesity as an Inflammatory Condition Predispose to Colorectal Cancer? J Clin Med 2023, 12. [Google Scholar] [CrossRef]
- Mandic, M.; Li, H.; Safizadeh, F.; Niedermaier, T.; Hoffmeister, M.; Brenner, H. Is the association of overweight and obesity with colorectal cancer underestimated? An umbrella review of systematic reviews and meta-analyses. Eur J Epidemiol 2023, 38, 135–144. [Google Scholar] [CrossRef]
- Saeed, U.; Myklebust, T.A.; Robsahm, T.E.; Kielland, M.F.; Moller, B.; Skalhegg, B.S.; Mala, T.; Yaqub, S. Risk and survival in colorectal cancer with increasing body mass index: A nationwide population-based cohort study. Colorectal Dis 2023, 25, 375–385. [Google Scholar] [CrossRef] [PubMed]
- Ulanja, M.B.; Ntafam, C.; Beutler, B.D.; Antwi-Amoabeng, D.; Rahman, G.A.; Ulanja, R.N.; Mabrouk, T.; Governor, S.B.; Djankpa, F.T.; Alese, O.B. Race, age, and sex differences on the influence of obesity on colorectal cancer sidedness and mortality: A national cross-sectional study. J Surg Oncol 2023, 127, 109–118. [Google Scholar] [CrossRef] [PubMed]
- Wu, G.; Xue, M.; Zhao, Y.; Han, Y.; Zhang, S.; Zhang, J.; Li, C.; Xu, J. Low circulating 25-hydroxyvitamin D level is associated with increased colorectal cancer mortality: a systematic review and dose-response meta-analysis. Biosci Rep 2020, 40. [Google Scholar] [CrossRef] [PubMed]
- Cohen, C.W.; Fontaine, K.R.; Arend, R.C.; Alvarez, R.D.; Leath, C.A., III; Huh, W.K.; Bevis, K.S.; Kim, K.H.; Straughn, J.M., Jr.; Gower, B.A. A Ketogenic Diet Reduces Central Obesity and Serum Insulin in Women with Ovarian or Endometrial Cancer. J Nutr 2018, 148, 1253–1260. [Google Scholar] [CrossRef] [PubMed]
- Kiesel, L.; Eichbaum, C.; Baumeier, A.; Eichbaum, M. Obesity Epidemic-The Underestimated Risk of Endometrial Cancer. Cancers (Basel) 2020, 12. [Google Scholar] [CrossRef] [PubMed]
- Kokts-Porietis, R.L.; Elmrayed, S.; Brenner, D.R.; Friedenreich, C.M. Obesity and mortality among endometrial cancer survivors: A systematic review and meta-analysis. Obes Rev 2021, 22, e13337. [Google Scholar] [CrossRef] [PubMed]
- Donkers, H.; Fasmer, K.E.; McGrane, J.; Pijnenborg, J.M.A.; Bekkers, R.; Haldorsen, I.S.; Galaal, K. Obesity and visceral fat: Survival impact in high-grade endometrial cancer. Eur J Obstet Gynecol Reprod Biol 2021, 256, 425–432. [Google Scholar] [CrossRef] [PubMed]
- Wang, L.; Wang, C.; Wang, J.; Huang, X.; Cheng, Y. Longitudinal, observational study on associations between postoperative nutritional vitamin D supplementation and clinical outcomes in esophageal cancer patients undergoing esophagectomy. Sci Rep 2016, 6, 38962. [Google Scholar] [CrossRef] [PubMed]
- O’Sullivan, F.; van Geffen, J.; van Weele, M.; Zgaga, L. Annual Ambient UVB at Wavelengths that Induce Vitamin D Synthesis is Associated with Reduced Esophageal and Gastric Cancer Risk: A Nested Case-Control Study. Photochem Photobiol 2018, 94, 797–806. [Google Scholar] [CrossRef]
- Kovesdy, C.P.; Furth, S.; Zoccali, C.; World Kidney Day Steering, C. Obesity and kidney disease: Hidden consequences of the epidemic. Physiol Int 2017, 104, 1–14. [Google Scholar] [CrossRef]
- Gluba-Brzozka, A.; Rysz, J.; Lawinski, J.; Franczyk, B. Renal Cell Cancer and Obesity. Int J Mol Sci 2022, 23. [Google Scholar] [CrossRef] [PubMed]
- Fanidi, A.; Muller, D.C.; Midttun, O.; Ueland, P.M.; Vollset, S.E.; Relton, C.; Vineis, P.; Weiderpass, E.; Skeie, G.; Brustad, M. , et al. Circulating vitamin D in relation to cancer incidence and survival of the head and neck and oesophagus in the EPIC cohort. Sci Rep 2016, 6, 36017. [Google Scholar] [CrossRef] [PubMed]
- Pu, Y.; Zhu, G.; Xu, Y.; Zheng, S.; Tang, B.; Huang, H.; Wu, I.X.Y.; Huang, D.; Liu, Y.; Zhang, X. Association Between Vitamin D Exposure and Head and Neck Cancer: A Systematic Review With Meta-Analysis. Front Immunol 2021, 12, 627226. [Google Scholar] [CrossRef] [PubMed]
- Marengo, A.; Rosso, C.; Bugianesi, E. Liver Cancer: Connections with Obesity, Fatty Liver, and Cirrhosis. Annu Rev Med 2016, 67, 103–117. [Google Scholar] [CrossRef] [PubMed]
- Divella, R.; Mazzocca, A.; Daniele, A.; Sabba, C.; Paradiso, A. Obesity, Nonalcoholic Fatty Liver Disease and Adipocytokines Network in Promotion of Cancer. Int J Biol Sci 2019, 15, 610–616. [Google Scholar] [CrossRef] [PubMed]
- Sohn, W.; Lee, H.W.; Lee, S.; Lim, J.H.; Lee, M.W.; Park, C.H.; Yoon, S.K. Obesity and the risk of primary liver cancer: A systematic review and meta-analysis. Clin Mol Hepatol 2021, 27, 157–174. [Google Scholar] [CrossRef] [PubMed]
- Yi, Z.; Wang, L.; Tu, X. Effect of Vitamin D Deficiency on Liver Cancer Risk: A Systematic Review and Meta-Analysis. Asian Pac J Cancer Prev 2021, 22, 991–997. [Google Scholar] [CrossRef] [PubMed]
- Yu, D.; Zheng, W.; Johansson, M.; Lan, Q.; Park, Y.; White, E.; Matthews, C.E.; Sawada, N.; Gao, Y.T.; Robien, K. , et al. Overall and Central Obesity and Risk of Lung Cancer: A Pooled Analysis. J Natl Cancer Inst 2018, 110, 831–842. [Google Scholar] [CrossRef] [PubMed]
- Brock, J.M.; Billeter, A.; Muller-Stich, B.P.; Herth, F. Obesity and the Lung: What We Know Today. Respiration 2020, 99, 856–866. [Google Scholar] [CrossRef]
- Parida, S.; Siddharth, S.; Sharma, D. Role of Omentin in Obesity Paradox in Lung Cancer. Cancers (Basel) 2021, 13. [Google Scholar] [CrossRef]
- Nagle, C.M.; Dixon, S.C.; Jensen, A.; Kjaer, S.K.; Modugno, F.; deFazio, A.; Fereday, S.; Hung, J.; Johnatty, S.E.; Australian Ovarian Cancer Study, G. , et al. Obesity and survival among women with ovarian cancer: results from the Ovarian Cancer Association Consortium. Br J Cancer 2015, 113, 817–826. [Google Scholar] [CrossRef] [PubMed]
- Kato, S.; Abarzua-Catalan, L.; Trigo, C.; Delpiano, A.; Sanhueza, C.; Garcia, K.; Ibanez, C.; Hormazabal, K.; Diaz, D.; Branes, J. , et al. Leptin stimulates migration and invasion and maintains cancer stem-like properties in ovarian cancer cells: an explanation for poor outcomes in obese women. Oncotarget 2015, 6, 21100–21119. [Google Scholar] [CrossRef]
- Walentowicz-Sadlecka, M.; Grabiec, M.; Sadlecki, P.; Gotowska, M.; Walentowicz, P.; Krintus, M.; Mankowska-Cyl, A.; Sypniewska, G. 25(OH)D3 in patients with ovarian cancer and its correlation with survival. Clin Biochem 2012, 45, 1568–1572. [Google Scholar] [CrossRef] [PubMed]
- Webb, P.M.; de Fazio, A.; Protani, M.M.; Ibiebele, T.I.; Nagle, C.M.; Brand, A.H.; Blomfield, P.I.; Grant, P.; Perrin, L.C.; Neale, R.E. , et al. Circulating 25-hydroxyvitamin D and survival in women with ovarian cancer. Am J Clin Nutr 2015, 102, 109–114. [Google Scholar] [CrossRef] [PubMed]
- Paternoster, S.; Falasca, M. The intricate relationship between diabetes, obesity and pancreatic cancer. Biochim Biophys Acta Rev Cancer 2020, 1873, 188326. [Google Scholar] [CrossRef] [PubMed]
- Eibl, G.; Rozengurt, E. Obesity and Pancreatic Cancer: Insight into Mechanisms. Cancers (Basel) 2021, 13. [Google Scholar] [CrossRef] [PubMed]
- Cui, F.; Qiu, Y.; Xu, W.; Zou, C.; Fan, Y. Association Between Pretreatment Blood 25-Hydroxyvitamin D Level and Survival Outcomes in Patients With Clinically Localized Prostate Cancer: An Updated Meta-Analysis. Nutr Cancer 2024, 76, 395–403. [Google Scholar] [CrossRef] [PubMed]
- Biggar, R.J.; Baade, P.D.; Sun, J.; Brandon, L.E.; Kimlin, M. Germ Cell Testicular Cancer Incidence, Latitude and Sunlight Associations in the United States and Australia. Photochem Photobiol 2016, 92, 735–741. [Google Scholar] [CrossRef] [PubMed]
- Tulchiner, G.; Staudacher, N.; Fritz, J.; Hackl, M.; Pichler, M.; Seles, M.; Shariat, S.F.; D’Andrea, D.; Gust, K.; Albrecht, W. , et al. Seasonal Variations in the Diagnosis of Testicular Germ Cell Tumors: A National Cancer Registry Study in Austria. Cancers (Basel) 2021, 13. [Google Scholar] [CrossRef]
- Schmid, D.; Ricci, C.; Behrens, G.; Leitzmann, M.F. Adiposity and risk of thyroid cancer: a systematic review and meta-analysis. Obes Rev 2015, 16, 1042–1054. [Google Scholar] [CrossRef]
- Kitahara, C.M.; Pfeiffer, R.M.; Sosa, J.A.; Shiels, M.S. Impact of Overweight and Obesity on US Papillary Thyroid Cancer Incidence Trends (1995-2015). J Natl Cancer Inst 2020, 112, 810–817. [Google Scholar] [CrossRef] [PubMed]
- Hu, Y.; Xue, C.; Ren, S.; Dong, L.; Gao, J.; Li, X. Association between vitamin D status and thyroid cancer: a meta-analysis. Front Nutr 2024, 11, 1423305. [Google Scholar] [CrossRef] [PubMed]
- Shirvani, A.; Kalajian, T.A.; Song, A.; Holick, M.F. Disassociation of Vitamin D’s Calcemic Activity and Non-calcemic Genomic Activity and Individual Responsiveness: A Randomized Controlled Double-Blind Clinical Trial. Sci Rep 2019, 9, 17685. [Google Scholar] [CrossRef] [PubMed]
- Hobaus, J.; Thiem, U.; Hummel, D.M.; Kallay, E. Role of calcium, vitamin D, and the extrarenal vitamin D hydroxylases in carcinogenesis. Anticancer Agents Med Chem 2013, 13, 20–35. [Google Scholar] [CrossRef] [PubMed]
- Al-Azhri, J.; Zhang, Y.; Bshara, W.; Zirpoli, G.; McCann, S.E.; Khoury, T.; Morrison, C.D.; Edge, S.B.; Ambrosone, C.B.; Yao, S. Tumor Expression of Vitamin D Receptor and Breast Cancer Histopathological Characteristics and Prognosis. Clin Cancer Res 2017, 23, 97–103. [Google Scholar] [CrossRef]
- Hendrickson, W.K.; Flavin, R.; Kasperzyk, J.L.; Fiorentino, M.; Fang, F.; Lis, R.; Fiore, C.; Penney, K.L.; Ma, J.; Kantoff, P.W. , et al. Vitamin D receptor protein expression in tumor tissue and prostate cancer progression. J Clin Oncol 2011, 29, 2378–2385. [Google Scholar] [CrossRef]
- Pludowski, P.; Grant, W.B.; Karras, S.N.; Zittermann, A.; Pilz, S. Vitamin D Supplementation: A Review of the Evidence Arguing for a Daily Dose of 2000 International Units (50 microg) of Vitamin D for Adults in the General Population. Nutrients 2024, 16, 391. [Google Scholar] [CrossRef]
- Manson, J.E.; Cook, N.R.; Lee, I.M.; Christen, W.; Bassuk, S.S.; Mora, S.; Gibson, H.; Gordon, D.; Copeland, T.; D’Agostino, D. , et al. Vitamin D Supplements and Prevention of Cancer and Cardiovascular Disease. N Engl J Med 2019, 380, 33–44. [Google Scholar] [CrossRef] [PubMed]
- Gouveia, H.J.C.B.; da Dilva, M.M.; de Castro, F.M.; da Silva, L.K.T.M.; da Silva-Calado, C.M.S.; da Silva-Araujo, E.R.; Silva, M.d.C.; Toscano, A.E. Vitamin D supplementation does not alter inflammatory markers in overweight and obese individuals: A systematic review and meta-analysis of randomized controlled trials. Nutrition Research, 2024. [Google Scholar] [CrossRef]
- El-Sharkawy, A.; Malki, A. Vitamin D Signaling in Inflammation and Cancer: Molecular Mechanisms and Therapeutic Implications. Molecules 2020, 25. [Google Scholar] [CrossRef]
- Negri, M.; Gentile, A.; de Angelis, C.; Monto, T.; Patalano, R.; Colao, A.; Pivonello, R.; Pivonello, C. Vitamin D-Induced Molecular Mechanisms to Potentiate Cancer Therapy and to Reverse Drug-Resistance in Cancer Cells. Nutrients 2020, 12, 1798. [Google Scholar] [CrossRef]
- Chandler, P.D.; Chen, W.Y.; Ajala, O.N.; Hazra, A.; Cook, N.; Bubes, V.; Lee, I.M.; Giovannucci, E.L.; Willett, W.; Buring, J.E. , et al. Effect of Vitamin D3 Supplements on Development of Advanced Cancer: A Secondary Analysis of the VITAL Randomized Clinical Trial. JAMA Netw Open 2020, 3, e2025850. [Google Scholar] [CrossRef] [PubMed]
- Seyfried, T.N. Cancer as a mitochondrial metabolic disease. Front Cell Dev Biol 2015, 3, 43. [Google Scholar] [CrossRef] [PubMed]
- Seyfried, T.N.; Chinopoulos, C. Can the Mitochondrial Metabolic Theory Explain Better the Origin and Management of Cancer than Can the Somatic Mutation Theory? Metabolites 2021, 11. [Google Scholar] [CrossRef] [PubMed]
- Warburg, O.; Wind, F.; Negelein, E. The Metabolism of Tumors in the Body. J Gen Physiol 1927, 8, 519–530. [Google Scholar] [CrossRef] [PubMed]
- Warburg, O. On the origin of cancer cells. Science 1956, 123, 309–314. [Google Scholar] [CrossRef] [PubMed]
- Porporato, P.E.; Filigheddu, N.; Pedro, J.M.B.; Kroemer, G.; Galluzzi, L. Mitochondrial metabolism and cancer. Cell Res 2018, 28, 265–280. [Google Scholar] [CrossRef] [PubMed]
- Seyfried, T.N.; Mukherjee, P.; Iyikesici, M.S.; Slocum, A.; Kalamian, M.; Spinosa, J.P.; Chinopoulos, C. Consideration of Ketogenic Metabolic Therapy as a Complementary or Alternative Approach for Managing Breast Cancer. Front Nutr 2020, 7, 21. [Google Scholar] [CrossRef] [PubMed]
- Myers, M.G.; Cowley, M.A.; Munzberg, H. Mechanisms of leptin action and leptin resistance. Annu Rev Physiol 2008, 70, 537–556. [Google Scholar] [CrossRef] [PubMed]
- Zhu, B.; Qu, S. The Relationship Between Diabetes Mellitus and Cancers and Its Underlying Mechanisms. Front Endocrinol (Lausanne) 2022, 13, 800995. [Google Scholar] [CrossRef]
- Wang, P.; Song, M.; Eliassen, A.H.; Wang, M.; Fung, T.T.; Clinton, S.K.; Rimm, E.B.; Hu, F.B.; Willett, W.C.; Tabung, F.K. , et al. Optimal dietary patterns for prevention of chronic disease. Nat Med 2023, 29, 719–728. [Google Scholar] [CrossRef]
- Esselstyn, C.B., Jr. Updating a 12-year experience with arrest and reversal therapy for coronary heart disease (an overdue requiem for palliative cardiology). Am J Cardiol 1999, 84, 339–341. [Google Scholar] [CrossRef] [PubMed]
- Barnard, N.D.; Cohen, J.; Jenkins, D.J.; Turner-McGrievy, G.; Gloede, L.; Jaster, B.; Seidl, K.; Green, A.A.; Talpers, S. A low-fat vegan diet improves glycemic control and cardiovascular risk factors in a randomized clinical trial in individuals with type 2 diabetes. Diabetes Care 2006, 29, 1777–1783. [Google Scholar] [CrossRef] [PubMed]
- Taylor, R.; Al-Mrabeh, A.; Sattar, N. Understanding the mechanisms of reversal of type 2 diabetes. Lancet Diabetes Endocrinol 2019, 7, 726–736. [Google Scholar] [CrossRef] [PubMed]
- Lean, M.E.J.; Leslie, W.S.; Barnes, A.C.; Brosnahan, N.; Thom, G.; McCombie, L.; Peters, C.; Zhyzhneuskaya, S.; Al-Mrabeh, A.; Hollingsworth, K.G. , et al. Durability of a primary care-led weight-management intervention for remission of type 2 diabetes: 2-year results of the DiRECT open-label, cluster-randomised trial. Lancet Diabetes Endocrinol 2019, 7, 344–355. [Google Scholar] [CrossRef]
Figure 1.
Plot of all-cancer mortality rate for females vs. obesity prevalence (%), 2009‒2012 [27].
Figure 1.
Plot of all-cancer mortality rate for females vs. obesity prevalence (%), 2009‒2012 [27].
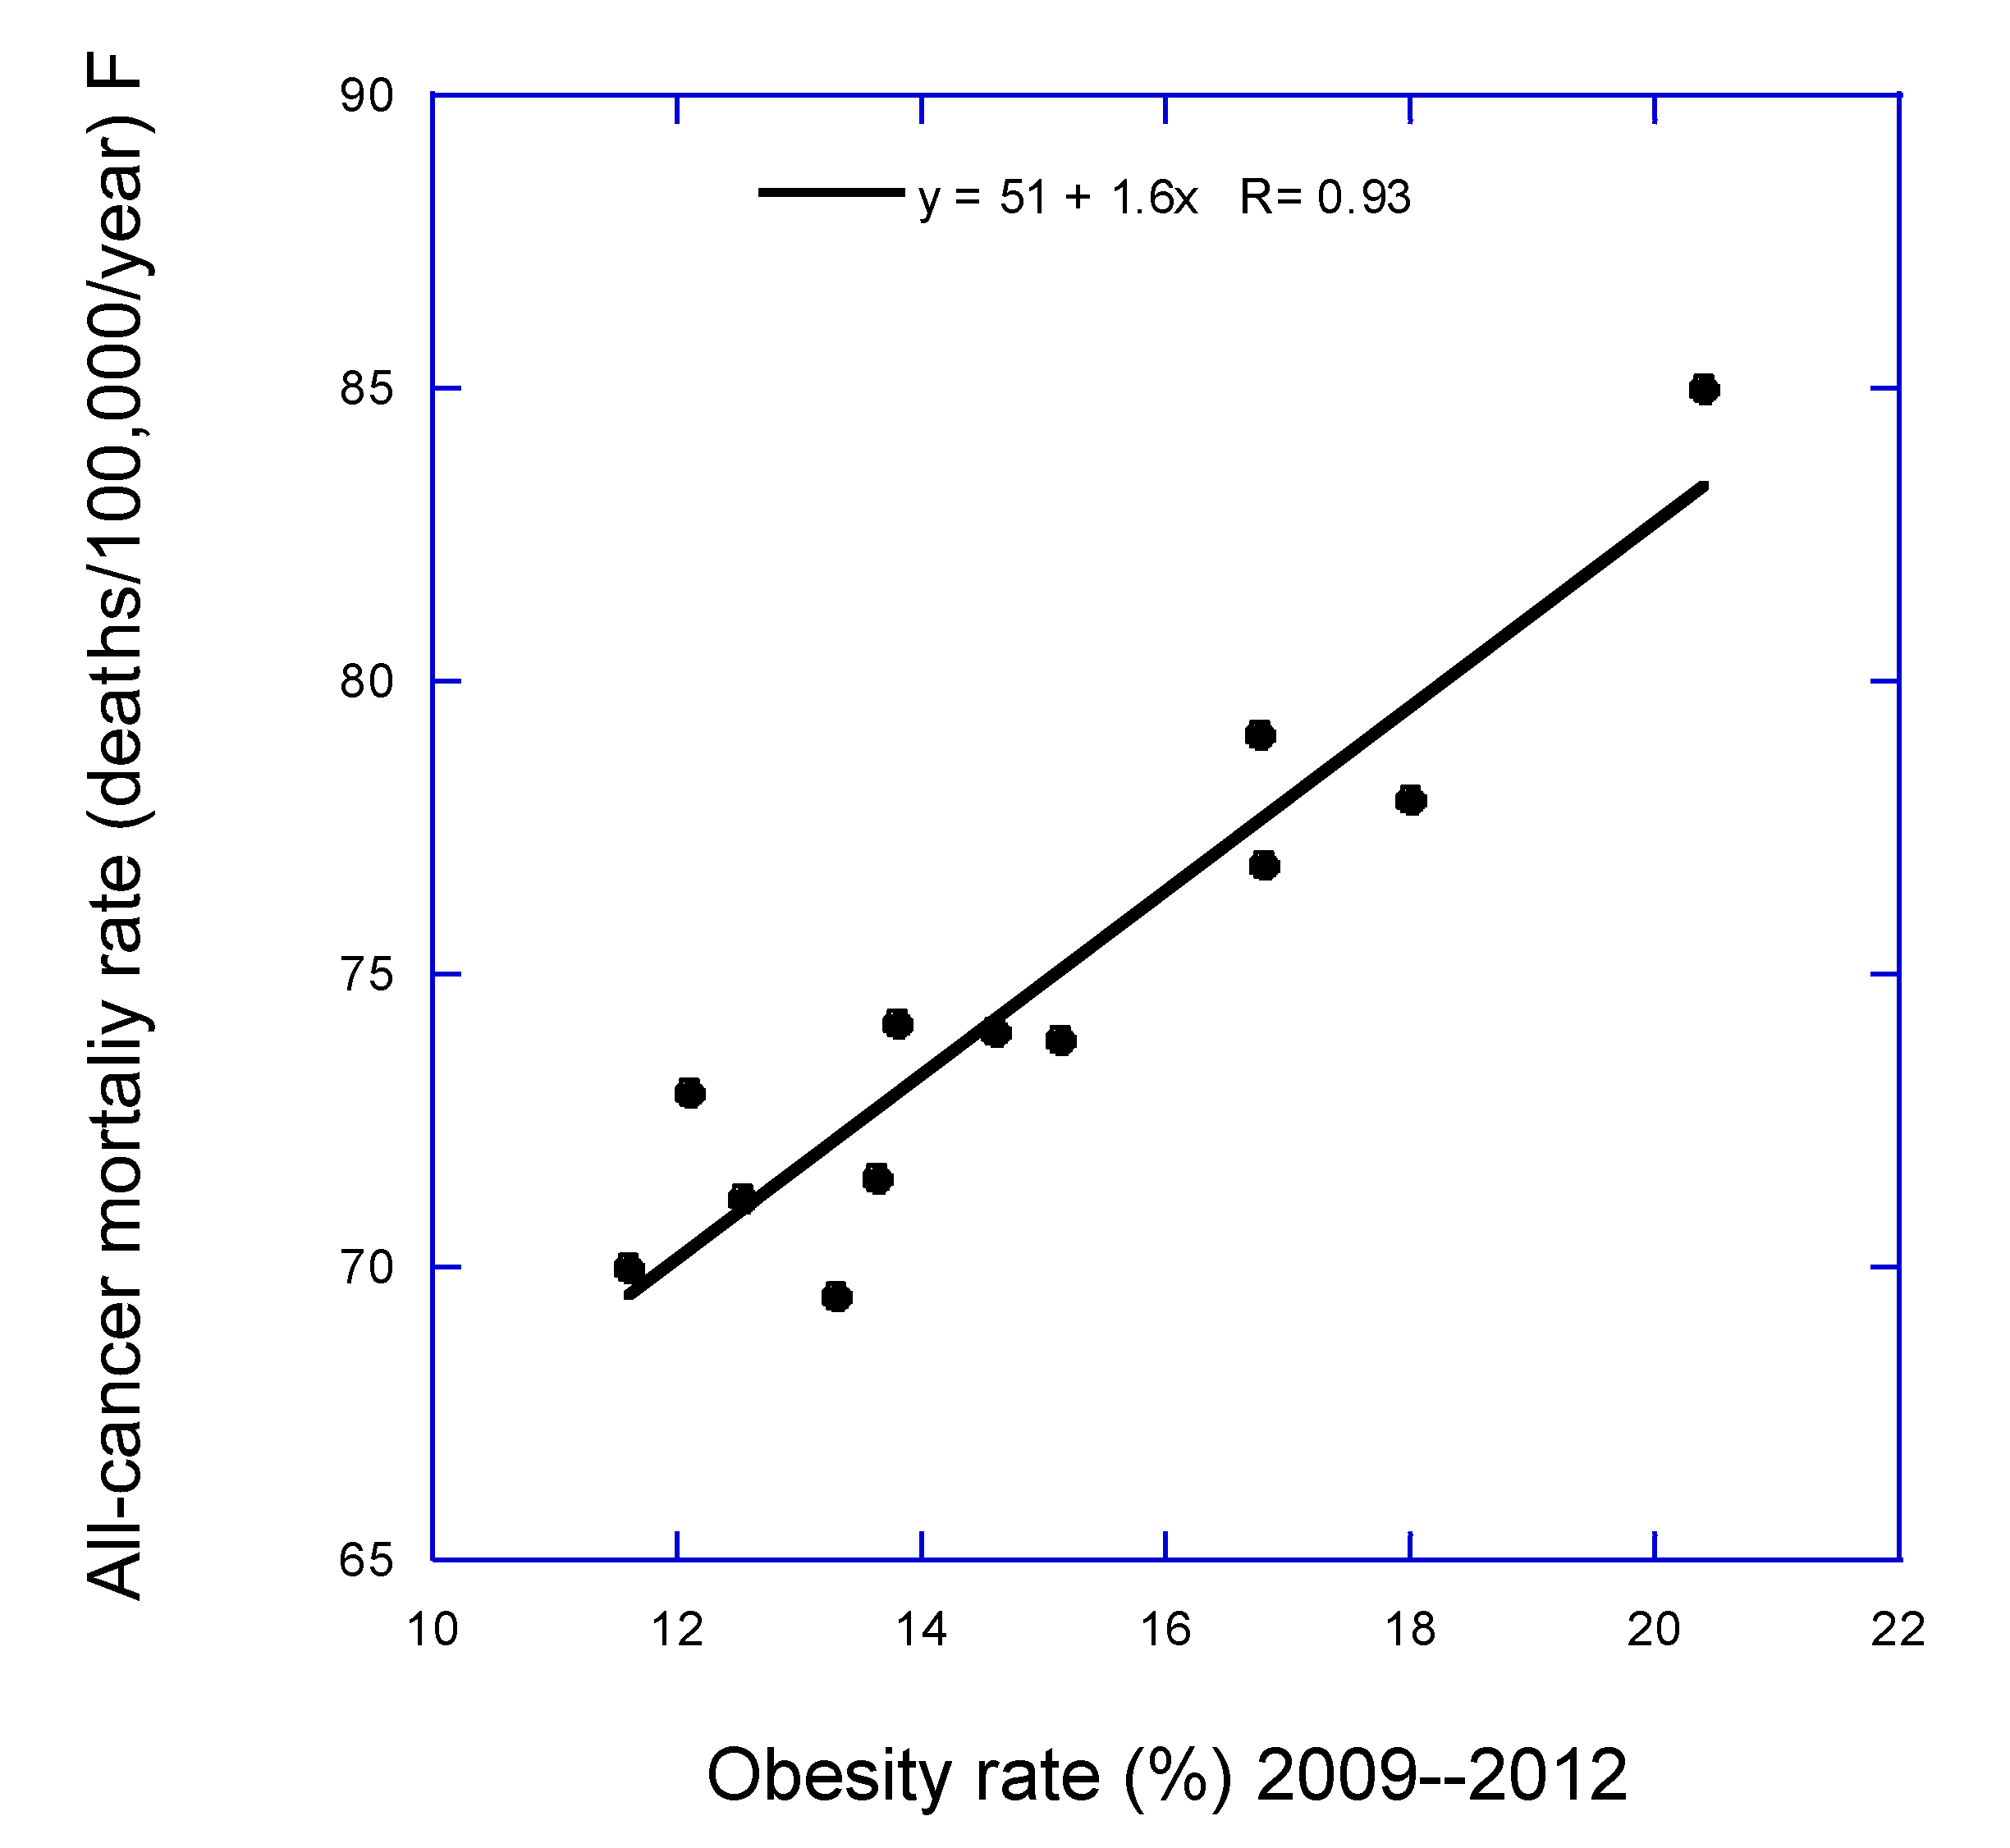
Figure 2.
Plot of stomach cancer mortality rates vs. annual mean solar UVB doses [28].
Figure 2.
Plot of stomach cancer mortality rates vs. annual mean solar UVB doses [28].
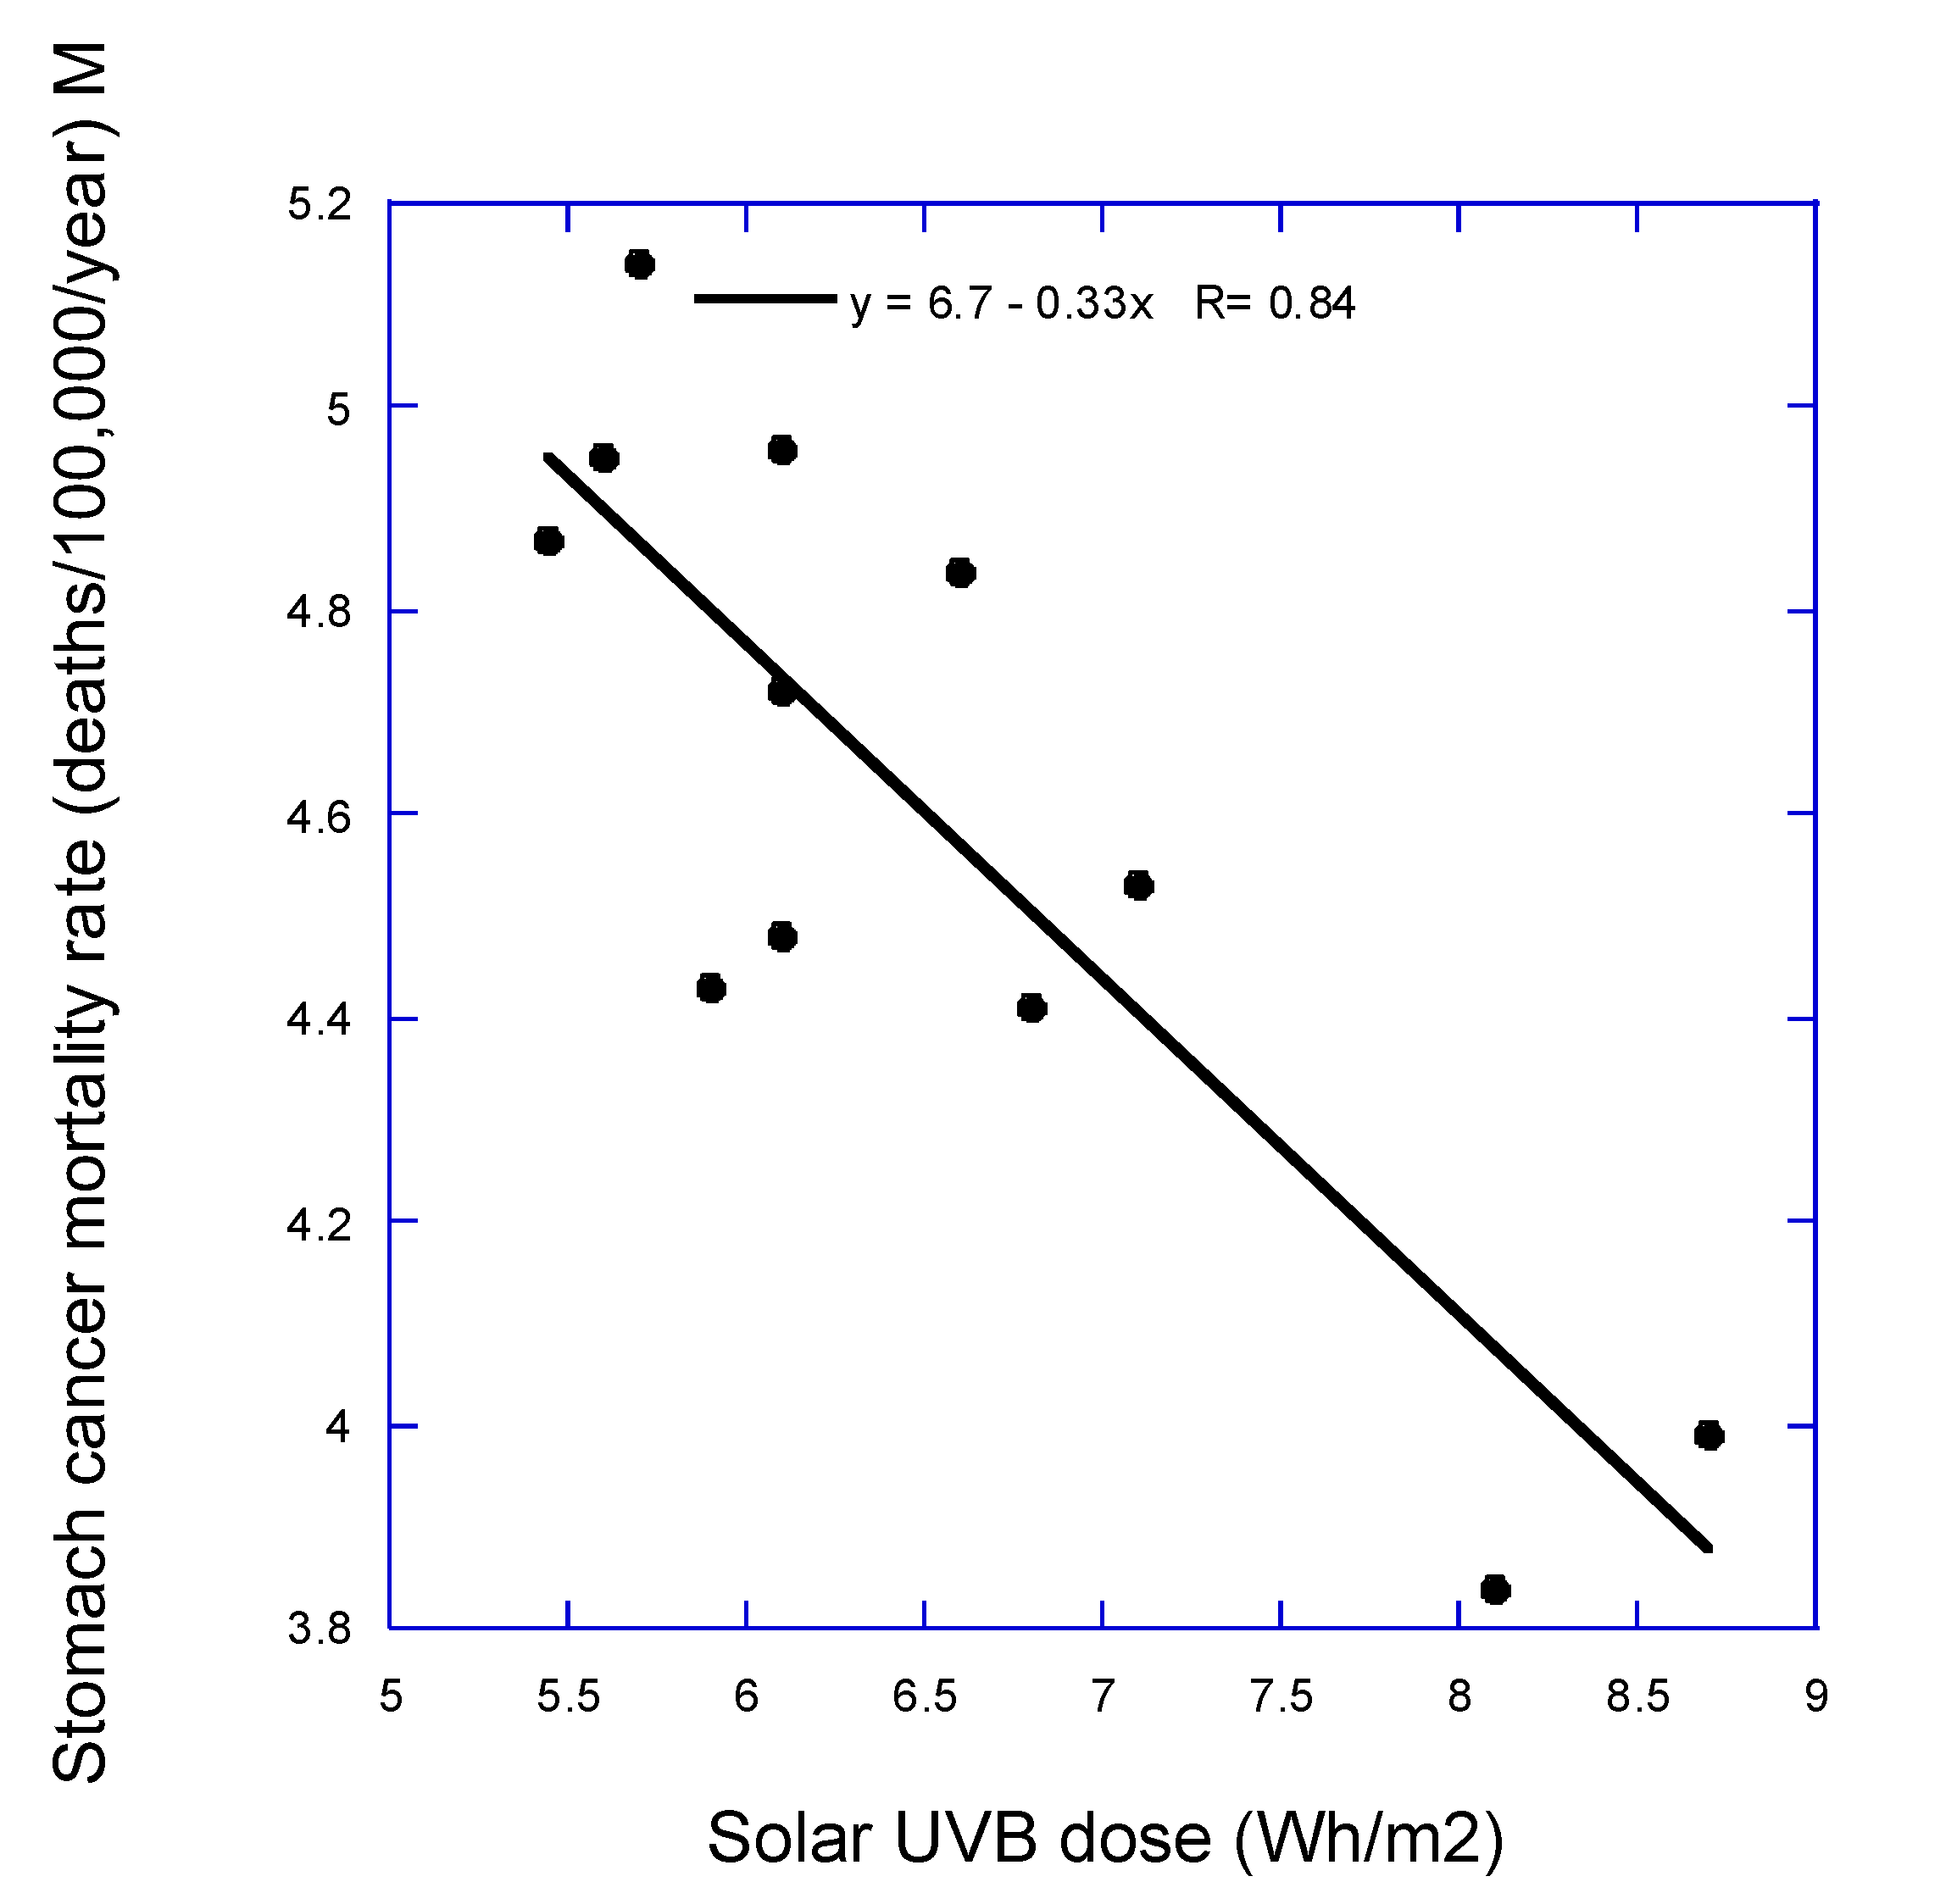

Table 1.
Values for obesity prevalence, solar UVB dose, and all-cancer incidence and mortality rates in ascending order by annual mean solar UVB doses.
Table 1.
Values for obesity prevalence, solar UVB dose, and all-cancer incidence and mortality rates in ascending order by annual mean solar UVB doses.
| Region | Annual mean solar UVB (Wh/m2) [28] | Obesity prevalence (%)** [27] |
|---|---|---|
| Hauts-de-France | 5.45 | 20.4 |
| Grand Est | 5.6 | 18.0 |
| Normandie | 5.7 | 16.8 |
| Île-de-France | * | 13.8 |
| Bretagne | * | 12.1 |
| Centre-Val de Loire | * | 16.8 |
| Bourgogne-Franche-Comté | 6.1 | 15.1 |
| Pays de la Loire | * | 12.6 |
| Auvergne-Rhône-Alpes | 6.8 | 13.3 |
| Nouvelle-Aquitaine | 7.1 | 14.6 |
| Occitanie | 8.1 | 13.6 |
| Provence-Alpes-Côte d’Azur | * | 11.6 |
Table 2.
Cross-correlation regression results (r, adjusted r2, p) for the risk-modifying factors used in this analysis.
Table 2.
Cross-correlation regression results (r, adjusted r2, p) for the risk-modifying factors used in this analysis.
| Factor | Obesity | LCi, males | LCi, females | LCm, males | LCm, females |
|---|---|---|---|---|---|
| Solar UVB | 0.67, 0.40, 0.02 | 0.48, 0.15, 0.11 | NS | 0.53, 0.20, 0.08 | NS |
| Obesity | 0.83, 0.69, <0.001 | 0.34, 0.03, 0.28 | 0.87, 0.76, <0.001 | NS | |
| LCi, males | 0.95, 0.90, <0.001 | NS | |||
| LCi, females | 0.85, 0.70, <0.001 |
LCi, lung cancer incidence rate; LCm, lung cancer mortality rate; NS, not significant; UVB, ultraviolet-B.
Table 3.
Regression results for cancer incidence rates for males.
| Cancer | Equation | r, Adjusted r2, p | PAF, obesity | PAF, UVB |
|---|---|---|---|---|
| All | 316 + 3.3 × Obes | 0.57, 0.26, 0.052 | 0.01 | |
| Bladder | 5.2 + 0.18 × LCi | 0.50, 0.18, 0.08 | ||
| Colorectal | 32 + 0.43 × Obes | 0.55, 0.23, 0.06 | 0.01 | |
| Esophageal | 14 − 0.97 × UVB | 0.58, 0.26, 0.051 | 0.06 | |
| Lips, mouth, pharynx | −5.9 + 0.23 × LCi | 0.67, 0.40, 0.01 | ||
| Lips, mouth, pharynx | 34 − 2.9 × UVB | 0.53, 0.20, 0.07 | 0.07 | |
| Lips, mouth, pharynx | 9.9 + 0.74 × Obes | 0.52, 0.20, 0.09 | 0.03 | |
| Lung | 29 + 1.5 × Obes | 0.83, 0.66, <0.001 | ||
| Thyroid | −0.80 + 0.85 × UVB | 0.84, 0.68, <0.001 |
LCi, lung cancer incidence; Obes, obesity; PAF, population attributable fraction; UVB, ultraviolet-B.
Table 4.
Regression results for cancer mortality rates for males.
| Cancer | Equation | r, Adjusted r2, p (p, p) | PAF, obesity | PAF, UVB |
|---|---|---|---|---|
| All | 84 + 3.9 × Obes | 0.70, 0.45, 0.01 | 0.05 | |
| All | 200 − 6.9 × UVB | 0.63, 0.35, 0.03 | 0.03 | |
| All-lung | 29 + 2.0 × LCm | 0.78, 0.49, 0.007 | ||
| All-lung | 150 − 6.8 × UVB | 0.64, 0.35, 0.03 | 0.04 | |
| All-lung | 66 + 2.5 × Obes | 0.60, 0.30, 0.04 | 0.03 | |
| Bladder | −0.02 + 0.13 × LCm | 0.67, 0.40, 0.01 | ||
| Bladder | 2.5 + 0.17 × Obes | 0.67, 0.39, 0.02 | 0.06 | |
| Colorectal | 2.6 + 0.27 × LCm | 0.81, 0.62, 0.001 | ||
| Colorectal | 6.9 + 0.41 × Obes | 0.81, 0.62, 0.001 | 0.08 | |
| Esophageal | 4.3 − 0.8 × UVB + 0.16 × LCm | 0.77, 0.50, 0.01 (0.03, 0.10) | ||
| Esophageal | 7.1 + 0.43 × LCm − 0.028 × Obes | 0.72, 0.41, 0.04 (0.048, 0.35) | ||
| Esophageal | 12 − 0.99 × UVB | 0.63, 0.33, 0.03 | 0.11 | |
| Esophageal | −3.7 + 0.23 × LCm | 0.56, 0.26, 0.045 | ||
| Laryngeal | −0.64 + 0.085 × LCm − 0.050 × Obes | 0.73, 0.43, 0.04 (0.048, 0.40) | ||
| Laryngeal | −0.28 + 0.056 × LCm | 0.70, 0.45, 0.01 | ||
| Lips, mouth, Pharynx | −12 + 1.1 × LCm − 0.79 × Obes | 0.79, 0.54, 0.01 (0.02, 0.22) | ||
| Lips, mouth, Pharynx | 5.9 + 0.31 × LCm | 0.78, 0.58, 0.003 | ||
| Lips, mouth, Pharynx | 13 − 1.1 × UVB | 0.70, 0.43, 0.01 | 0.15 | |
| Liver | 16 − 0.92 × UVB | 0.54, 0.22, 0.07 | 0.15 | |
| Lung | 19 + 1.5 × Obes | 0.87, 0.74, <0.001 | ||
| Melanoma | 1.5 − 0.20 × Obes + 0.043 × LCm | 0.73, 0.43, 0.03 (0.02, 0.09) | ||
| Melanoma | 2.3 − 0.043 × Obes | 0.58, 0.27, 0.048 | ||
| Pancreatic | 4.3 + 0.066 × LCi | 0.69, 0.43, 0.01 | ||
| Pancreatic | 6.1 + 0.11 × Obes | 0.64, 0.34, 0.03 | 0.02 | |
| Prostate | 15 − 0.77 × UVB | 0.68, 0.40, 0.02 | 0.14 | |
| Stomach | 6.7 − 0.32 × UVB | 0.83, 0.65, <0.001 | 0.08 | |
| Testicular | 0.55 − 0.045 × UVB | 0.61, 0.31, 0.04 | 0.10 |
LCi, lung cancer incidence; LCm, lung cancer mortality; Obes, obesity; PAF, population attributable fraction; UVB, ultraviolet-B.
Table 5.
Regression results for cancer incidence rates for females.
| Cancer | Equation | r, Adjusted r2, p | PAF, obesity | PAF, UVB |
|---|---|---|---|---|
| Esophageal | 1.8 − 0.13 × UVB | 0.59, 0.29, 0.04 | 0.07 | |
| Kidney | 4.4 + 0.13 × Obes | 0.76, 0.54, 0.004 | 0.05 | |
| Thyroid | −2.1 + 2.5 × UVB | 0.85, 0.70, <0.001 |
Obes, obesity; PAF, population attributable fraction; UVB, ultraviolet-B.
Table 6.
Regression results for cancer mortality rates for females.
| Cancer | Equation | r, Adjusted r2, p (p, p) | PAF, obesity | PAF, UVB |
|---|---|---|---|---|
| All | 51 +1.6 × Obes | 0.94, 0.86, <0.001 | 0.08 | |
| All | 58 + 1.4 × Obes − 0.69 × UVB | 0.94, 0.81, <0.001 (<0.001, 0.32) | ||
| All | 95 − 3.1 × UVB | 0.71, 0.46, 0.009 | 0.03 | |
| All-lung | 49 + 1.4 × Obes − 0.85 × UVB | 0.92, 0.81, <0.001 (0.002, 0.32) | ||
| All-lung | 40 + 1.6 × Obes | 0.91, 0.81, <0.001 | 0.11 | |
| All-lung | 85 − 3.2 × UVB | 0.71, 0.46, 0.009 | 0.04 | |
| Bladder | 0.56 + 0.026 × Obes | 0.85. 0.69, <0.001 | 0.08 | |
| Breast | 11 + 0.42 × Obes − 0.33 × UVB | 0.86, 0.68, 0.002 (0.01, 0.37) | ||
| Breast | 8.0 + 0.51 × Obes | 0.85, 0.69, <0.001 | 0.10 | |
| Breast | 23 − 1.1 × UVB | 0.69, 0.42, 0.01 | 0.05 | |
| Corpus uteri | 7.2 + 0.22 × Obes | 0.68, 0.41, 0.02 | 0.04 | |
| Colorectal | 4.6 + 0.20 × Obes | 0.88, 0.77, <0.001 | 0.09 | |
| Esophageal | 1.8 − 0.13 × UVB | 0.59, 0.29, 0.04 | 0.07 | |
| Kidney | 0.97 + 0.035 × Obes | 0.49, 0.16, 0.11 | 0.02 | |
| Liver | 1.1 + 0.081 × Obes | 0.75, 0.52, 0.005 | 0.08 | |
| Ovarian | 5.1 − 0.19 × UVB + 0.047 × Obes | 0.89, 0.75, <0.001 (0.02, 0.10) | ||
| Ovarian | 6.3 − 0.27 × UVB | 0.85, 0.69, <0.001 | 0.07 | |
| Ovarian | 3.1 + 0.10 × Obes | 0.78, 0.56, 0.003 | 0.05 | |
| Stomach | 2.5 − 0.13 × UVB | 0.70, 0.43, 0.01 | 0.05 | |
| Thyroid | 0.068 + 0.012 × Obes | 0.57, 0.26, 0.054 | 0.05 |
Obes, obesity; PAF; population attributable fraction; UVB, ultraviolet-B.
Table 7.
References supporting this study’s findings. (Will put author’s last name, year, in font of each reference. May eliminate some of them.
Table 7.
References supporting this study’s findings. (Will put author’s last name, year, in font of each reference. May eliminate some of them.
| Cancer Site | Obesity | Serum 25(OH)D | Solar UVB |
|---|---|---|---|
| All | Argyrakopoulou (2021) [43], Mili (2021) [44], Petrelli (2021) [45], Scully (2020) [46], Pati (2023) [47], Sun (2023) [48] | Sha (2023) [49], Bai (2024) [50], Mo (2024) [51] | Grant (2006) [13] |
| Bladder | Sun (2015) [52], Zhao (2017) [53], Lu (2021) [54] | Grant (2006) [13] | |
| Breast | Engin (2017) [55], Picon-Ruiz (2017) [56], Seiler (2018) [57], Agurs-Collins (2019) [58], LeVee (2023) [59], Dehesh, 2023) [60], Chlebowski (2024) [61] | Li (2021) [62] | Grant (2006) [13] [63] |
| Colorectal | Loosen (2022) [64], Rychter (2023) [65], Mandic (2023) [66], Saeed, 2023) [67], Ulanja (2023) [68] | Sha (2023) [49], Wu (2020) [69] | Grant (2006) [13] |
| Corpus uteri | Cohen (2018) [70], Kiesel (2020) [71], Kokts-Porietis (2021) [72], Donkers (2021) [73] | Grant (2006) [13] | |
| Esophageal | Wang (2016) [74] | O’Sullivan (2018) [75] | |
| Kidney | Petrelli (2021) [45], Kovesdy (2017) [76], Gluba-Brzozka (2023) [77] | ||
| Laryngeal | |||
| Lips, mouth, pharynx | Fanidi (2016) [78], Pu (2021) [79] | ||
| Liver | Marengo (2016) [80], Divella (2019) [81], Sohn (2021) [82] | Sohn (2021) [83] | Grant (2012) [37] |
| Lung | Petrelli (2021) [45], Yu (2018) [84], Brock (2020) [85], Parida (2021) [86] | Sha (2023) [49] | |
| Melanoma | Petrelli (2021) [45] | ||
| Oral | Grant (2012) [37] | ||
| Ovarian | Cohen (2018) [70], Nagle (2015) [87], Kato (2015) [88] | Walentowicz-Sadlecka (2012) [89], Webb (2015) [90], | Grant (2006) [13] |
| Pancreatic | Paternoster (2020) [91], Eibl (2021) [92] | Grant (2006) [13] | |
| Prostate | Sha (2023) [49], Cui (2024) [93] | ||
| Stomach | Sha (2023) [49] | Grant (2006) [13], O’Sullivan (2018) [75] | |
| Testicular | Biggar (2016) [94], Tulchiner (2021) [95] | ||
| Thyroid | Schmid (2015) [96], Kitahara (2020) [97] | Hu (2024) [98] |
25(OH)D, 25-hydroxyvitamin D; UVB, ultraviolet-B.
Disclaimer/Publisher’s Note: The statements, opinions and data contained in all publications are solely those of the individual author(s) and contributor(s) and not of MDPI and/or the editor(s). MDPI and/or the editor(s) disclaim responsibility for any injury to people or property resulting from any ideas, methods, instructions or products referred to in the content. |
© 2024 by the authors. Licensee MDPI, Basel, Switzerland. This article is an open access article distributed under the terms and conditions of the Creative Commons Attribution (CC BY) license (http://creativecommons.org/licenses/by/4.0/).
Copyright: This open access article is published under a Creative Commons CC BY 4.0 license, which permit the free download, distribution, and reuse, provided that the author and preprint are cited in any reuse.


