Submitted:
06 July 2024
Posted:
08 July 2024
You are already at the latest version
Abstract
The evaluation of Eco-Environmental Quality (EEQ) is important to maintain the quality of ecology and is crucial for the protection of the environment and promote sustainable development. In the past 30 years, Rupandehi district has gone into rapid urbanization and population growth due to the migration of people causing drastic changes in Land use. This study takes Rupandehi district as a study area and analyses the land use change dynamics and its impact on the ecological environment from 1993 to 2023. The study utilizes the cloud computing capability of Google Earth Engine (GEE) to extract multiple indices using Landsat remote sensing data. We also applied the Thresholding approach to various spectral indices to extract land use information in GEE. The Remote Sensing Ecological Indices (RSEI) was constructed using Principal Component Analysis (PCA) to monitor the ecological quality and the effect of Land Use Land Cover (LULC) change on the quality of ecology was analysed. The result shows that the overall ecological quality of the Rupandehi district is good ranging from 0.59 in 1993 to 0.67 in 2023 with a significant impact of land use change. The eco-environmental quality of the study area is deteriorating because of a sharp increase in built-up areas and deforestation as well as the loss of agricultural land. Meanwhile, the spatial and temporal distribution of land use change collides with the change in the ecological quality of the study area. This study provides an accurate and rapid assessment of ecological quality and monitors the impact of land use change on it providing a scientific basis for researchers, government, and others to preserve the ecology and promote sustainable and eco-friendly development.
Keywords:
Remote Sensing Ecological Index (RSEI)
; Land Use Land Cover Change
; Ecological Quality
; Principal Component Analysis (PCA)
; Google Earth Engine (GEE)
1. Introduction
Ecological Environmental Quality (EEQ) refers to the degree ecological environment affects human survival and socioeconomic development within a certain time and space[1,2,3]. EEQ contributes to balancing the activities of humans and the quality of the environment at specific temporal and spatial scales [4]. With rapid population growth, global climate change, and economic and urban development the quality of the ecological environment is changing significantly leading to various ecological problems and disasters such as the heat island effect, water-logging, and air pollution [5,6].
Based on the report of World Population Prospects of 2022 by the United Nations, it is estimated that the global population could reach 8.5 billion in 2030, 9.7 billion in 2050 and 10.4 billion in 2100 [7]. With the growing population, the regional EEQ is expected to change for which Ecological Quality (EQ) assessment guides to systematically understand the current ecological environment status and how it is changing along with time[4,8]. Therefore, it is important to study the patterns of ecological environment changes, and dynamics and monitor the variation of EEQ in both time and space to promote regional sustainable ecological development [9,10].
In recent years, with the development of Remote Sensing (RS) technology, there has been quite remarkable research done to assess Ecological Environmental Quality [11]. Remote sensing imagery can be useful for monitoring different ecosystem phenomena on a large scale and near real-time such as soil, vegetation, and geology wetness and dryness based on reflected radiation from the surface of the earth [12,13,14]. Various single-element indicators have been widely used by researchers for dynamically monitoring and quantitatively evaluating urban, grassland, forest, wetland, and other ecosystems [5,9]. For example, NDVI has been used as an indicator to evaluate the change in vegetation health and forest change [15,16,17], and Leaf Area Index (LAI) indicating vegetation growth status [18] is used for variation ecological and remote sensing implications [19,20], Land Surface Temperature (LST) was used to study urban heat island effect for ecological implications [21,22,23], Enhanced Vegetation Index (EVI) was used to access regional ecological vulnerability[24]. However, due to complex ecosystems, these single indicators are not sufficient to quantitatively and accurately characterize regional eco-environmental quality and do not consider the combined effect of all the factors on the environment [3,18,25,26,27].
To overcome this issue, in 2013, Xu et al. [28] proposed a new remote sensing ecological index (RSEI), which provides long-term, accurate and comprehensive regional EEQ based on multiple natural ecological factors. RSEI uses four remote ecological indicators i.e., greenness, wetness, dryness and heat to create an index to access EEQ at various scales, solving conventional single-indicator-based evaluation [18,25,28]. RSEI has the great advantage of offering scalability, visualization and comparability using multiple remote-sensing satellite images at various temporal and spatial resolutions [29,30]. Therefore, it is obvious that it has been used in various domains to evaluate and monitor the regional EEQ such as city [11,27,31,32,33], river basin [4,10,34], lake basin [35], mining region [2], etc.
However, extraction of RSEI through traditional remote sensing data analysing software like ArcGIS and ENVI is quite tedious and time-consuming, because huge data are produced and it is difficult to manage, store and statistically analyse those data while working on long-term time series [4,26,35,36]. Google Earth Engine (GEE) is a cloud computing platform, consisting of vast amounts of remote sensing data and allowing the extraction, analysis, processing and performing of various operations on earth observation data in a time and cost-efficient way with its supercomputing power ability [4,36,37,38]. This is because it has been widely seen in various applications from analysing Land use changes (LUC) [38] to evaluating temporal and spatial changes in regional EEQ [4,26,35,37].
Land use/cover (LULC) is a factor that directly showcases human activity and socio-economic development and plays a great role in maintaining the regional ecosystem. The increase in population and urbanization have caused over-exploitation of natural resources causing LUCC and converting a natural landscape into haphazard and unmanaged built-up areas [39]. The series of human activities like industrialization, building construction, making roads and many more is causing the urban heat island effect leading to a serious impact on the region's ecological quality [40]. Although LUCC has a great impact on ecology, there are very few researches that have correlated it with regional ecological environmental quality.
Nepal is one of the least developed countries (LDCs) in the world according to the United Nations [41] facing the problem of rapid urbanization. In Nepal, population growth and rural-to-urban migration are the major causes of urbanization and it is seen that the urban population has increased to more than 50% which was around 2.9% in 1952/54 which is mainly due to the migration of people from hill to Terai and Kathmandu valley [42,43]. The people are leaving their native place in search of better livelihood and employment opportunities. The rapid change in the land use/cover in urban areas through various human activities has declined the agricultural land and increased the pattern of ecological imbalance [44,45]. Rupandehi district has been facing a major problem in managing the urban population. The migration of the people from the hilly region and open border of Nepal and India to major cities like Butwal and Hirahara for trade and employment is causing the district to be populated and is increasing unmanaged urbanization [38]. For the past two decades, the forest and agricultural land in the district has been degraded and converted into buildings and roads due to the lack of proper land use and sustainable planning. These careless human activities are spoiling the environment and are highly impacting the eco-environmental quality in this region.
Taking Rupandehi district as the study area, this research will (1) utilize various ecological indicators based on remote sensing data to monitor the long-term spatiotemporal regional ecological environmental quality in the region, (2) find out the driving force for the regional ecological quality and (3) to find out how land use/cover have changed in this region and has impacted the regional RSEI. The result of this study will be crucial for the land use planner and can provide scientific evidence for the conservation of the environment and support in achieving a sustainable ecosystem and development of the region.
2. Materials and Method
2.1. Study Area
Rupandehi district is taken as the study area in this research which is shown in Figure 1. Rupandehi district lies in the south-west part of the Terai region of Lumbini province of Nepal. Geographically it lies between 25°35′18″ N and 26°42′53″ N latitude and 86°8′47″ E and 86°16′17″ E longitude with an area of 1360 km2. Rupandehi district has a border with Nawalparasi in the east, Palpa in the north, Kapilvastu in the west and India in the south. The elevation of this district ranges from 79m to 1153m from the sea level. The northern part of the district is covered with Chure Range Forest while the southern part is flat land which has been mostly used for cultivation and farming. The transportation of this district is very convenient as it has two major highways crossing each other. Siddhartha Highway from Belahiya to Pokhara and Mahendra Highway from Mechi-Mahakali crosses at Butwal. Rupandehi is one of the major districts in Nepal with rapid population growth and urbanization. The population of this district has grown from 880,196 in 2011 to 1,121,957 in 2021 with 2.33% of the annual population growth rate [46]. There are two major cities: Butwal and Bhairahawa in Rupandehi which are the trade centres for the people living in this district. According to census 2021, Rupandehi district is the third most populated district in Nepal with a population of 1121957 [47]. With the population being maximum in this region, there has been tremendous change in the pattern of land use causing maximum limitation of urbanization causing the eco-environmental quality to deteriorate. Therefore, it is important to study the Eco-Environment Quality, its driving force, and its relationship with Land Use Land Cover Changes.
2.2. Datasets
For this study, we used Tier 1(T1) level datasets of 30m resolution Landsat 5 TM and Landsat 8 OLI/TIRS image data that were provided by the United States Geological Survey (USGS) and obtained from Google Earth Engine Repository (https://developers.google.com/earth-engine/datasets/catalog/landsat). These datasets have already been geometrically, atmospherically, and radiometrically corrected to meet the requirements of the study. The surface reflectance data of the Landsat 5 TM satellite were accessed for 2004 and 2008 and Landsat 8 OLI/TIRS satellite for 2016 and 2023.
Usually, the summer season occurs in June-August, which receives monsoon in Nepal. This is the growing period of vegetation and to monitor the RSEI, it requires leaf-on seasons [12]. In this period, it was difficult to obtain images with less cloud coverage, so we extended the period to November, which also receives an adequate amount of rain and has good vegetation coverage. The attribute information of the data has been listed in Table 1.
2.3. Construction of RSEI
RSEI, a recently developed comprehensive ecological index, is specifically used to evaluate ecological status using remote sensing data, as it is directly correlated with the quality of the ecological environment [28]. It is a newly developed aggregated index to detect ecological conditions solely using remotely sensed data that immediately affects the quality of the ecological environment and is perceptible to humans [12]. To characterize the ecological quality of a specific area, the Principal Component Analysis (PCA) transformation is used to create the RSEI, which combines four important natural indicators of ecosystem quality: the greenness index (NDVI), the wet index (Wet), the dry index (NDBSI), and the land surface temperature index (LST) [34,48,49,50].
2.3.1. Greenness Index
NDVI (Normalized Difference Vegetation Index) is extensively employed for tracking various vegetation characteristics, including fractional vegetation coverage, plant biomass, and leaf area. Serving as a valuable metric, NDVI effectively mirrors the indicator of vegetation growth and stands as a crucial ecological parameter. It is generated using a near-infrared band and red band by following the relationship [16,51].
Where, represent the near-infrared band and the red band, respectively.
2.3.2. Wetness Index
WET is another important index that depicts the moisture/wetness condition of the surface and is calculated using the following relationship. WET index (WI) can show significant sensitivity to vegetation and soil moisture after the Kauth–Thomas transition, and it is associated with the EEQ. The WI can be explained by the WET component. The WET can be calculated based on the TM and OLI image data using the following equation [29,52,53].
Where correspond to the reflectance of TM and OLI remote sensing images in the blue, green, red, near-infrared, short-wave infrared 1, and short-wave infrared 2 bands, respectively.
2.3.3. Dryness Index
Urban surface desiccation in the EE requires both bare soils and buildings. The soil index (SI) and the index-based built-up index (IBI) add up to half of the normalized difference built-up and soil index (NDBSI).[54]. The NDBSI can be calculated based on the TM and OLI image data using the following equation [14,29,55].
Where correspond to the reflectance of TM and OLI remote sensing images in the blue, green, red, near-infrared, and short-wave infrared 1, bands, respectively.
2.3.4. Heat Index
Land Surface Temperature (LST) is directly influenced by several variables, such as environmental ecology, urbanization, and human activity. It is the indication of the temperature of the earth's surface. There are several techniques for calculating LST, but the atmospheric correction approach is the most dependable and straightforward. First, radiometric calibration was used to translate the original image's DN value into radiance values (L). Secondly, the above Greenness Index equation was utilized to compute the land surface emissivity (ε) based on the fractional vegetation covering (FVC). Finally, the black body radiance (B(TS)) and LST values were computed. The L, FVC, ε, B(TS), and LST were determined using equations [56,57,58].
2.3.5. Normalization of Indicators
The scale of the above formula is not uniform, a direct PCA calculation would lead to an imbalance weight of the indicator so, the scale must be normalized as per the following formula.
Where NIi is the value of a metric after regularization, Ii is the value of the indicator in pixel i, Imax is the maximum value of this indicator, and Imin is the minimum value of the indicator.
2.3.6. Calculation of RSEI
The Principal Component Analysis of four indicators were done in ArcGIS Pro to obtain the RSEI. PCA is a statistical procedure that assigns weight to variables based on the contribution of each principal component meanwhile avoiding the alteration caused by human beings. Since the location where we are working has a large area of water bodies, that might alter the result of the RSEI calculation, we removed the pixel of water bodies on each indicator through water masking using Formula 5 before conducting the PCA. Then the initial RSEI value was calculated using PCA with the formula 6 [2,29,39,59].
Where and are the reflectance of the green and near-infrared bands, respectively.
RSEI0= 𝑃𝐶1[𝑓(𝑁𝐷𝑉𝐼, 𝑊𝐸𝑇, NDBSI, 𝐿𝑆𝑇)
The final RSEI value is obtained by normalizing RSEI0, as shown in equation 6, whose value ranges from 0-1. Lower value represents low eco-environmental quality and vice-versa.
2.4. Spatial Auto-Correlation
Spatial Auto-correlation is an important indicator to find out whether the adjacent elements are correlated to each other [14,26]. The correlation analysis can be useful in indicating the homogeneity distribution of RSEI over the study area [35]. We employed global spatial auto-correlation (Global Moran’s I) and local indicators of spatial auto-correlation (Local Moran’s I) to find out the spatial correlation of RSEI. The Global Moran’s I show whether RSEI is clustered or dispersed for the overall area or entire dataset. The value ranges from -1 to +1. The value near to -1 means higher negative autocorrelation and near to +1 means higher positive correlation.
Local Moran’s I decomposes the Moran’s I into regional level i.e., local indicators of spatial association (LISA). Local Moran’s I look after the individual features in the layers and compare them with the neighbours for cluster/dispersion. These maps thus produced as a LISA cluster have five types of spatial aggregation: high-high (HH) cluster, low-low (LH) cluster, low-high (LH) outliers, high-low (HL) outliers, and insignificant[14].
2.4. Land Use/Cover Classification and Accuracy Assessment
Various spectral indices have been developed and these can be used to detect different land cover types [60,61,62]. We used multiple spectral indices to create a LULC map as each of the spectra can be used to extract a single class [61]. We utilized different spectral indices such as the Enhanced Vegetation Index (EVI) for vegetation health monitoring [63], Modified Normalized Difference Water Index (MNDWI) to identify open water features [64], Normalized Difference Built-Up Index (NDBI) to highlight built-up areas [65], and Normalized Difference Bareness Index (NBRI) for burned areas and bare land [66]. Each index serves a unique purpose and captures specific land cover characteristics. However, no single index can effectively extract all land use and land cover (LULC) classes comprehensively. To address this, we apply appropriate threshold values to each index to isolate specific land cover classes. By combining the outputs of these indices and merging them into a unified framework, we generate a comprehensive land use land cover map for our study area [61,62]. This integrated approach maximizes the effectiveness of spectral indices in mapping diverse LULC classes accurately. Moreover, to maximize the accuracy of our LULC map, we use slightly different threshold values of the spectral index for different years as well as we creatively use certain spectral indices in novel ways beyond their original purposes. For instance, the EVI, initially intended for vegetation monitoring by highlighting vegetation and suppressing water features, is repurposed. We take advantage of its ability to effectively identify water areas by utilizing its feature that depresses water presence. This adaptation leads to exceptional performance in accurately classifying water bodies within our study area. The hierarchy of the indices used is shown in Figure 2.
We used the same Landsat images that were used to extract different indices of RSEI which is given in Table 1. We applied an optimized threshold to each of the spectral indices that developed from the images to automatically classify the images into different land cover classes. All the extraction, processing, thresholding, classification, and combination of all the extracted classes were done in Google Earth Engine.
For accuracy assessment, we employed two different methods. Firstly, we gathered ground sample points and verified whether these points were correctly classified. Conversely, the second method involved generating sample points for each class at random locations and then validating the outcomes against a base map. The land use and land cover map of 2023 reflects the present state of the land, so we verified the LULC of 2023 with ground samples and we applied a second method for 2013, 2004 and 1993. Parameters like producer’s accuracy (PA), user’s accuracy (UA), Overall Accuracy (OA), and Kappa statistics (Kappa), were calculated to quantify the accuracy of LULC using those randomly collected points via a confusion matrix [38] and the result is represented in Table 2.
The table shows that the overall accuracy of the result was highest in 2023 (0.938) and lowest in 2013(0.871), with corresponding Kappa coefficients of 0.923 and 0.798., respectively. Producers’ and Users’ accuracies of various land cover types varied across the years. Forest had higher accuracies throughout the study period. Agriculture land had a high PA of 0.967 in 2013 but lower in other years. Built-up areas showed significant improvement in 2023 with PA and UA of 0.971 and 0.942. Dry Breland had lower accuracies in 2013 but higher values in other years, while water bodies consistently showed high accuracy, peaking in 2023 with PA of 0.989 and UA of 0.950.
3. Results
3.1. Principal Component Analysis Results of RSEI Model
Using Google Earth Engine and Landsat image datasets, we extracted four ecological indicators: Greenness (NDVI), Humidity (WET), Heat (LST) and Dryness (NDBSI) (Figure 3) and used Principal Component functionality in ArcGIS Pro to produce Remote Sensing Ecological Index (RSEI) based on Principal Component Analysis (PCA). The contribution of eigenvalues for PC1 was found to be more than 80% i.e., PC1 was 90.33%, 86.09%, 91.07% and 91.85% in 1993, 2004, 2013 and 2023 respectively showing that PC1 concentrated most of the characteristics among all the four indices [35,67]. In PC1, NDVI and WET show positive eigenvalues while LST and NDBSI show negative values which shows the actual scenario shown by the previous studies as opposed to PC2-PC4 which shows abnormal variable loads [67,68]. The positive and negative value of each indicator in PC1 shows they have contributed and inhibitory effects on ecological improvement respectively [27].

Table 3.
Results of Principal Component Analysis of RSEI in 1993, 2004, 2013, and 2023, respectively.
Table 3.
Results of Principal Component Analysis of RSEI in 1993, 2004, 2013, and 2023, respectively.
| Year | Indicators | Eigen Value | |||
|---|---|---|---|---|---|
| PC1 | PC2 | PC3 | PC4 | ||
| 1993 | LST | -0.21389 | -0.12906 | 0.94163 | 0.22567 |
| NDBSI | -0.63029 | 0.13879 | -0.29319 | 0.70535 | |
| NDVI | 0.53844 | 0.73551 | 0.12958 | 0.39028 | |
| WET | 0.51679 | -0.65047 | -0.10286 | 0.54703 | |
| Percent of Eigen Values (%) | 90.3268 | 6.8639 | 1.7145 | 1.0948 | |
| 2004 | LST | -0.24808 | 0.00072 | 0.93768 | 0.24334 |
| NDBSI | -0.67904 | 0.31503 | -0.32925 | 0.57554 | |
| NDVI | 0.61093 | 0.69297 | 0.06311 | 0.37760 | |
| WET | 0.32268 | -0.64850 | -0.09147 | 0.68334 | |
| Percent of Eigen Values (%) | 86.0878 | 9.5212 | 3.4507 | 0.9403 | |
| 2013 | LST | -0.39460 | 0.91818 | -0.03278 | 0.01250 |
| NDBSI | -0.61529 | -0.25373 | 0.50821 | 0.54659 | |
| NDVI | 0.64861 | 0.29824 | 0.64757 | 0.26648 | |
| WET | 0.21216 | 0.06014 | -0.56684 | 0.79377 | |
| Percent of Eigen Values (%) | 91.0715 | 5.1642 | 3.4978 | 0.2665 | |
| 2023 | LST | -0.32008 | 0.90064 | 0.29393 | 0.00072 |
| NDBSI | -0.64211 | -0.31398 | 0.26124 | 0.64874 | |
| NDVI | 0.62795 | -0.00621 | 0.70204 | 0.33582 | |
| WET | 0.30152 | 0.30038 | -0.59371 | 0.68291 | |
| Percent of Eigen Values (%) | 91.8492 | 4.5203 | 3.3144 | 0.3161 | |
3.2. Spatial Changes in RSEI of Rupandehi
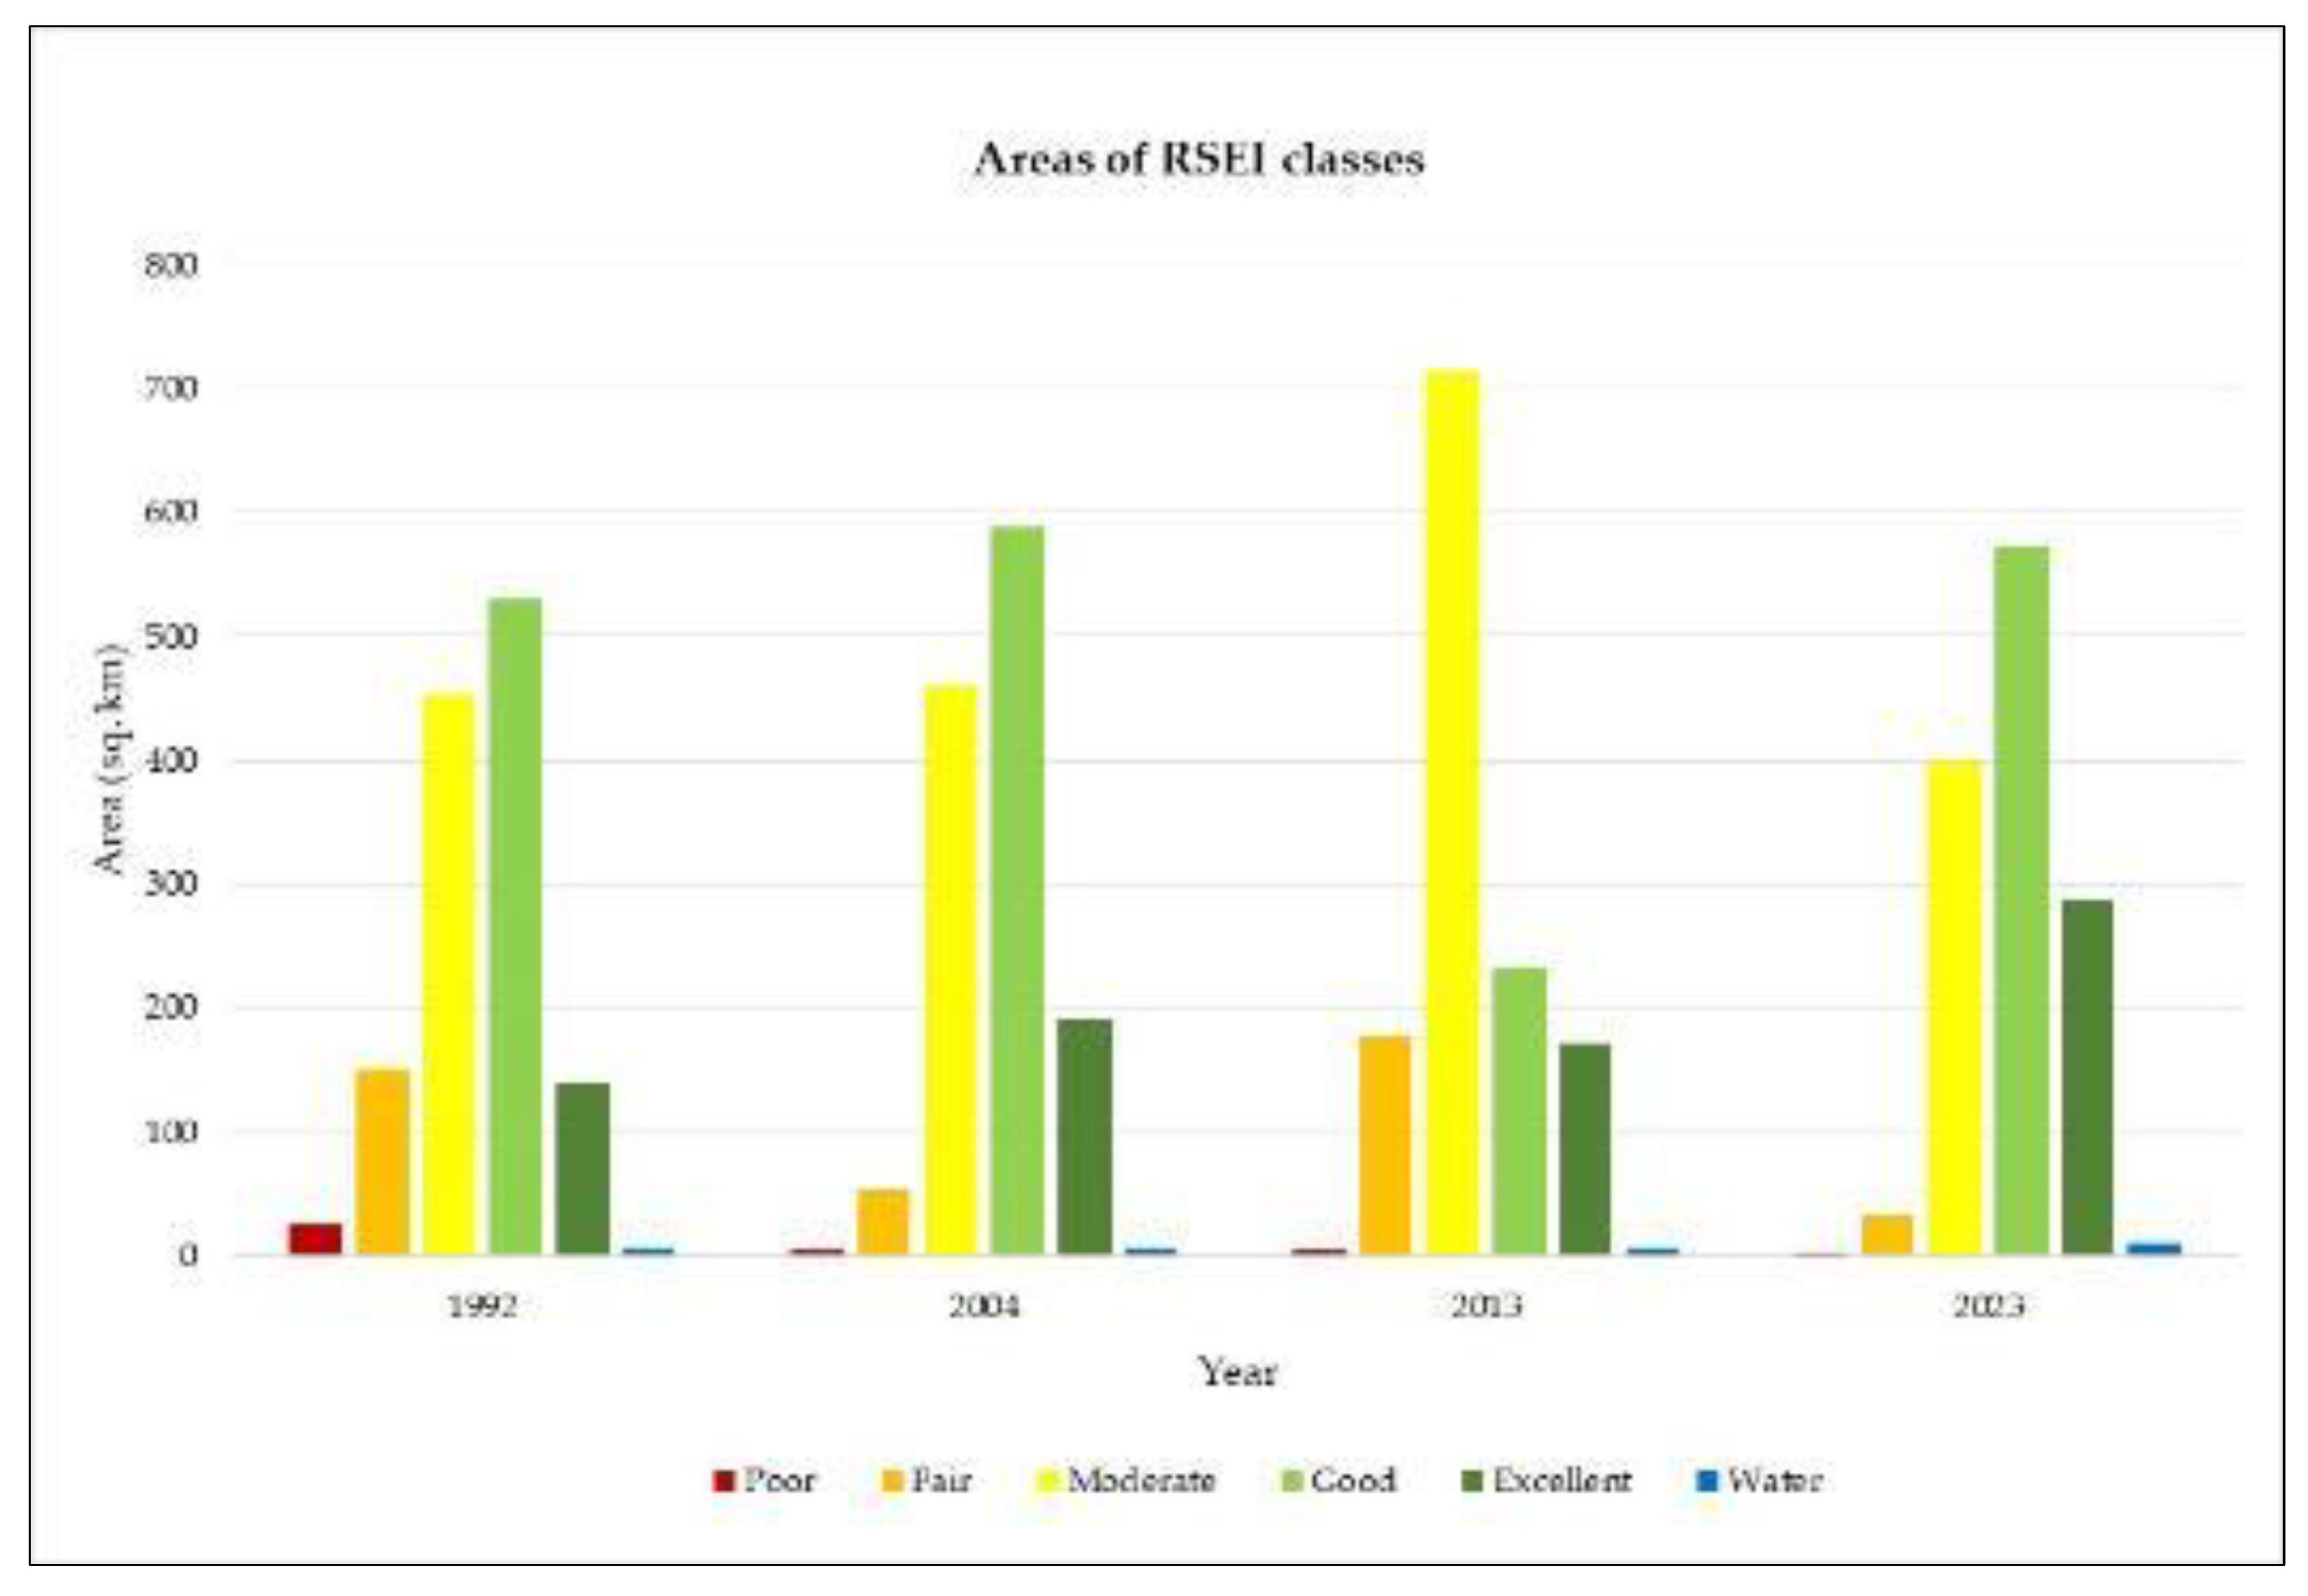
Figure 4 shows the spatial distribution of RSEI in Rupandehi district over the 30-year time frame. The RSEI Value ranges from 0-1 representing the eco-environmental quality from poor to excellent. The RSEI value is further divided into five classes split with an interval of 0.2 which are: Poor (0-0.2), Fair (0.2-0.4), Moderate (0.4-0.6), Good (0.6-0.8) and Excellent (0.8-1). The overall ecological quality over the area was found to be good with high quality in the northern part and comparatively lower in the southern part. The RSEI value in Rupandehi district is seen to be increasing trend with some fluctuation at the mid-time. The good and excellent RSEI are more concentrated in the region with dense forest and village areas while the poor, fair and moderate at the city areas. It was seen that the RSEI value can be higher in areas with high vegetation and lower mostly at two economic hubs: Butwal and Siddharthanagar in central northern and southern parts of Rupandehi and was particularly less in 1993 and 2014.
Table 4 and Figure 4 show the area of each of the RSEI classes and the percentage. In 1993 and 2004 most of the area was covered with good (529.054 and 588.392 sq. km respectively) and moderate (453.619 and 460.436 sq. km respectively) RSEI value, while the good area decreased while the moderate area increased in 2013 to 714.06 sq. km. The reason for the decrease in the quality is due to the flow of people from different districts of hilly regions like Palpa, Gulmi and Syangja to Rupandehi increasing the population and building in the areas. Also, the expansion of roads and other major developmental activities and deforestation increased the impervious surfaces causing the quality to decrease. There was a change seen on the EEQ in 2023 where the poor class was almost negligible and the excellent and good class was seen increasing. This shows in the overall quality to increase in 2023. Overall, from 1993 to 2023, the area of Good and Excellent class has increased from 529.054 to 574.0175 km2 and 140.188 to 288.5381 km2, respectively.
Figure 5.
Area of each RSEI class and masked water body.
3.3. Temporal Changes in RSEI of Rupandehi
Table 5 contains the statistical result of each of the indicators used and the final RSEI obtained through these indicators in the study area within the allocated period from 1993-2023. The highest and lowest value of LST was found to be 0.46 and 0.25 in 2023 and 1993 respectively, with an average of 0.34 over the study period. Similarly, for NDBSI, the highest and lowest were 0.52 and 0.37 in 2013 and 2023 respectively with an average value of 0.46. For NDVI, the highest and lowest were 0.70 and 0.63 in 2004 and 2023 respectively with an average of 0.66. Also, for WET, the highest and lowest were 0.85 and 0.71 in 2013 and 1993 respectively with an average of 0.80. From Figure 4, we can see that the RSEI has a positive relation with NDVI and WET and a negative with LST and NDBSI. It is seen that the RSEI value is increasing when the value of NDVI and WET is increasing and LST and NDBSI are decreasing and decreasing when the value of NDVI and WET is decreasing and LST and NDBSI is increasing. The overall average RSEI over the 30 years was found to be 0.61, showing that Rupandehi had a good overall EEQ. The average RSEI value is found to be increasing from 0.59 in 1993 to 0.635 in 2004, decreasing to 0.55 in 2013 and increasing to 0.67 in 2013 showing the improvement-deterioration-improvement trend of EE in Rupandehi. Overall, the RSEI value was seen to have increased by 13% from 0.59 in 1993 to 0.67 in 2023, highlighting an improvement in the overall quality of the ecosystem in the area.
Table 5.
Statistical Result of each indicator used in RSEI.
| Year | Index | Mean | Standard Deviation |
|---|---|---|---|
| 1993 | LST | 0.25 | 0.063 |
| NDBSI | 0.50 | 0.160 | |
| NDVI | 0.64 | 0.145 | |
| WET | 0.71 | 0.138 | |
| RSEI | 0.59 | 0.167 | |
| 2004 | LST | 0.28 | 0.061 |
| NDBSI | 0.45 | 0.136 | |
| NDVI | 0.71 | 0.130 | |
| WET | 0.818 | 0.078 | |
| RSEI | 0.635 | 0.138 | |
| 2013 | LST | 0.39 | 0.103 |
| NDBSI | 0.52 | 0.143 | |
| NDVI | 0.67 | 0.152 | |
| WET | 0.851 | 0.055 | |
| RSEI | 0.55 | 0.156 | |
| 2023 | LST | 0.46 | 0.086 |
| NDBSI | 0.37 | 0.148 | |
| NDVI | 0.63 | 0.147 | |
| WET | 0.82 | 0.075 | |
| RSEI | 0.67 | 0.14 |
3.4. Trend Analysis of Ecological Environmental Quality in Rupandehi
To better understand and compare the eco-environmental quality of Rupandehi over various periods, the study did various calculations to calculate the RSEI from 1993-2023. The RSEI values were classified into five different categories based on the values. The classes were compared for different periods. There are usually three trends in the value: Improvement, Deterioration and Unchanged and the spatial distribution of these trends are shown in Figure 6. The obtained value was used to find out the area and the area ratios of each of the grades. From 1993 to 2004, it was seen that there was a high area getting its EEQ value deteriorated which is 592.05 sq. km (45% of the total area), 384.67 sq. km (29% of the total area) got its EEQ value improved and remaining 338.10 sq. km (26% of the total area) remained unchanged. The trend of deterioration remained the same from 2004-2013 with 700.82 sq. km (53%) which is more than double the area which got its EEQ improved i.e., 321.50 sq. km (24%) and remained unchanged i.e., 292.25 sq. km (22%). The trend in the increased deterioration of the EEQ is a result of the developmental activities and urbanization that have occurred within this period of 20 years. Despite those years of rapid decrease in EEQ, from 2013- 2023, it was seen that the EEQ remained quite in balance with a slight increase in the areas with improvement. 462.96 sq. km (35%) of the area got improved, 428.63 sq. km (33%) of the area got deteriorated and 423.02 sq. km (32%) remained unchanged. The area of each of the EEQ grade changes can be seen from the Table and the Sankey graph shows the graphical flow of the grade from each of the years in Figure 6.
From Figure 7, in the northern region where mostly the forest lies, the RSEI is seen to be almost unchanged from 1993 to 2023. In the southwest region, the improved RSEI area increased from 1993 to 2004, 2004 to 2013 and 2013 to 2023. The middle portion of the region the region near Bhalwari and Butwal has seen a deterioration in RSEI from 1993 to 2004. The region is because of an increasing trend of people moving from the hilly region to Butwal and making houses as a part of urbanization and industrialization in the Bhalwari area. From 2004 to 2013, the southern region near the border of India saw a slight deterioration in the ecological quality of the environment.
3.5. Spatial Autocorrelation of RSEI
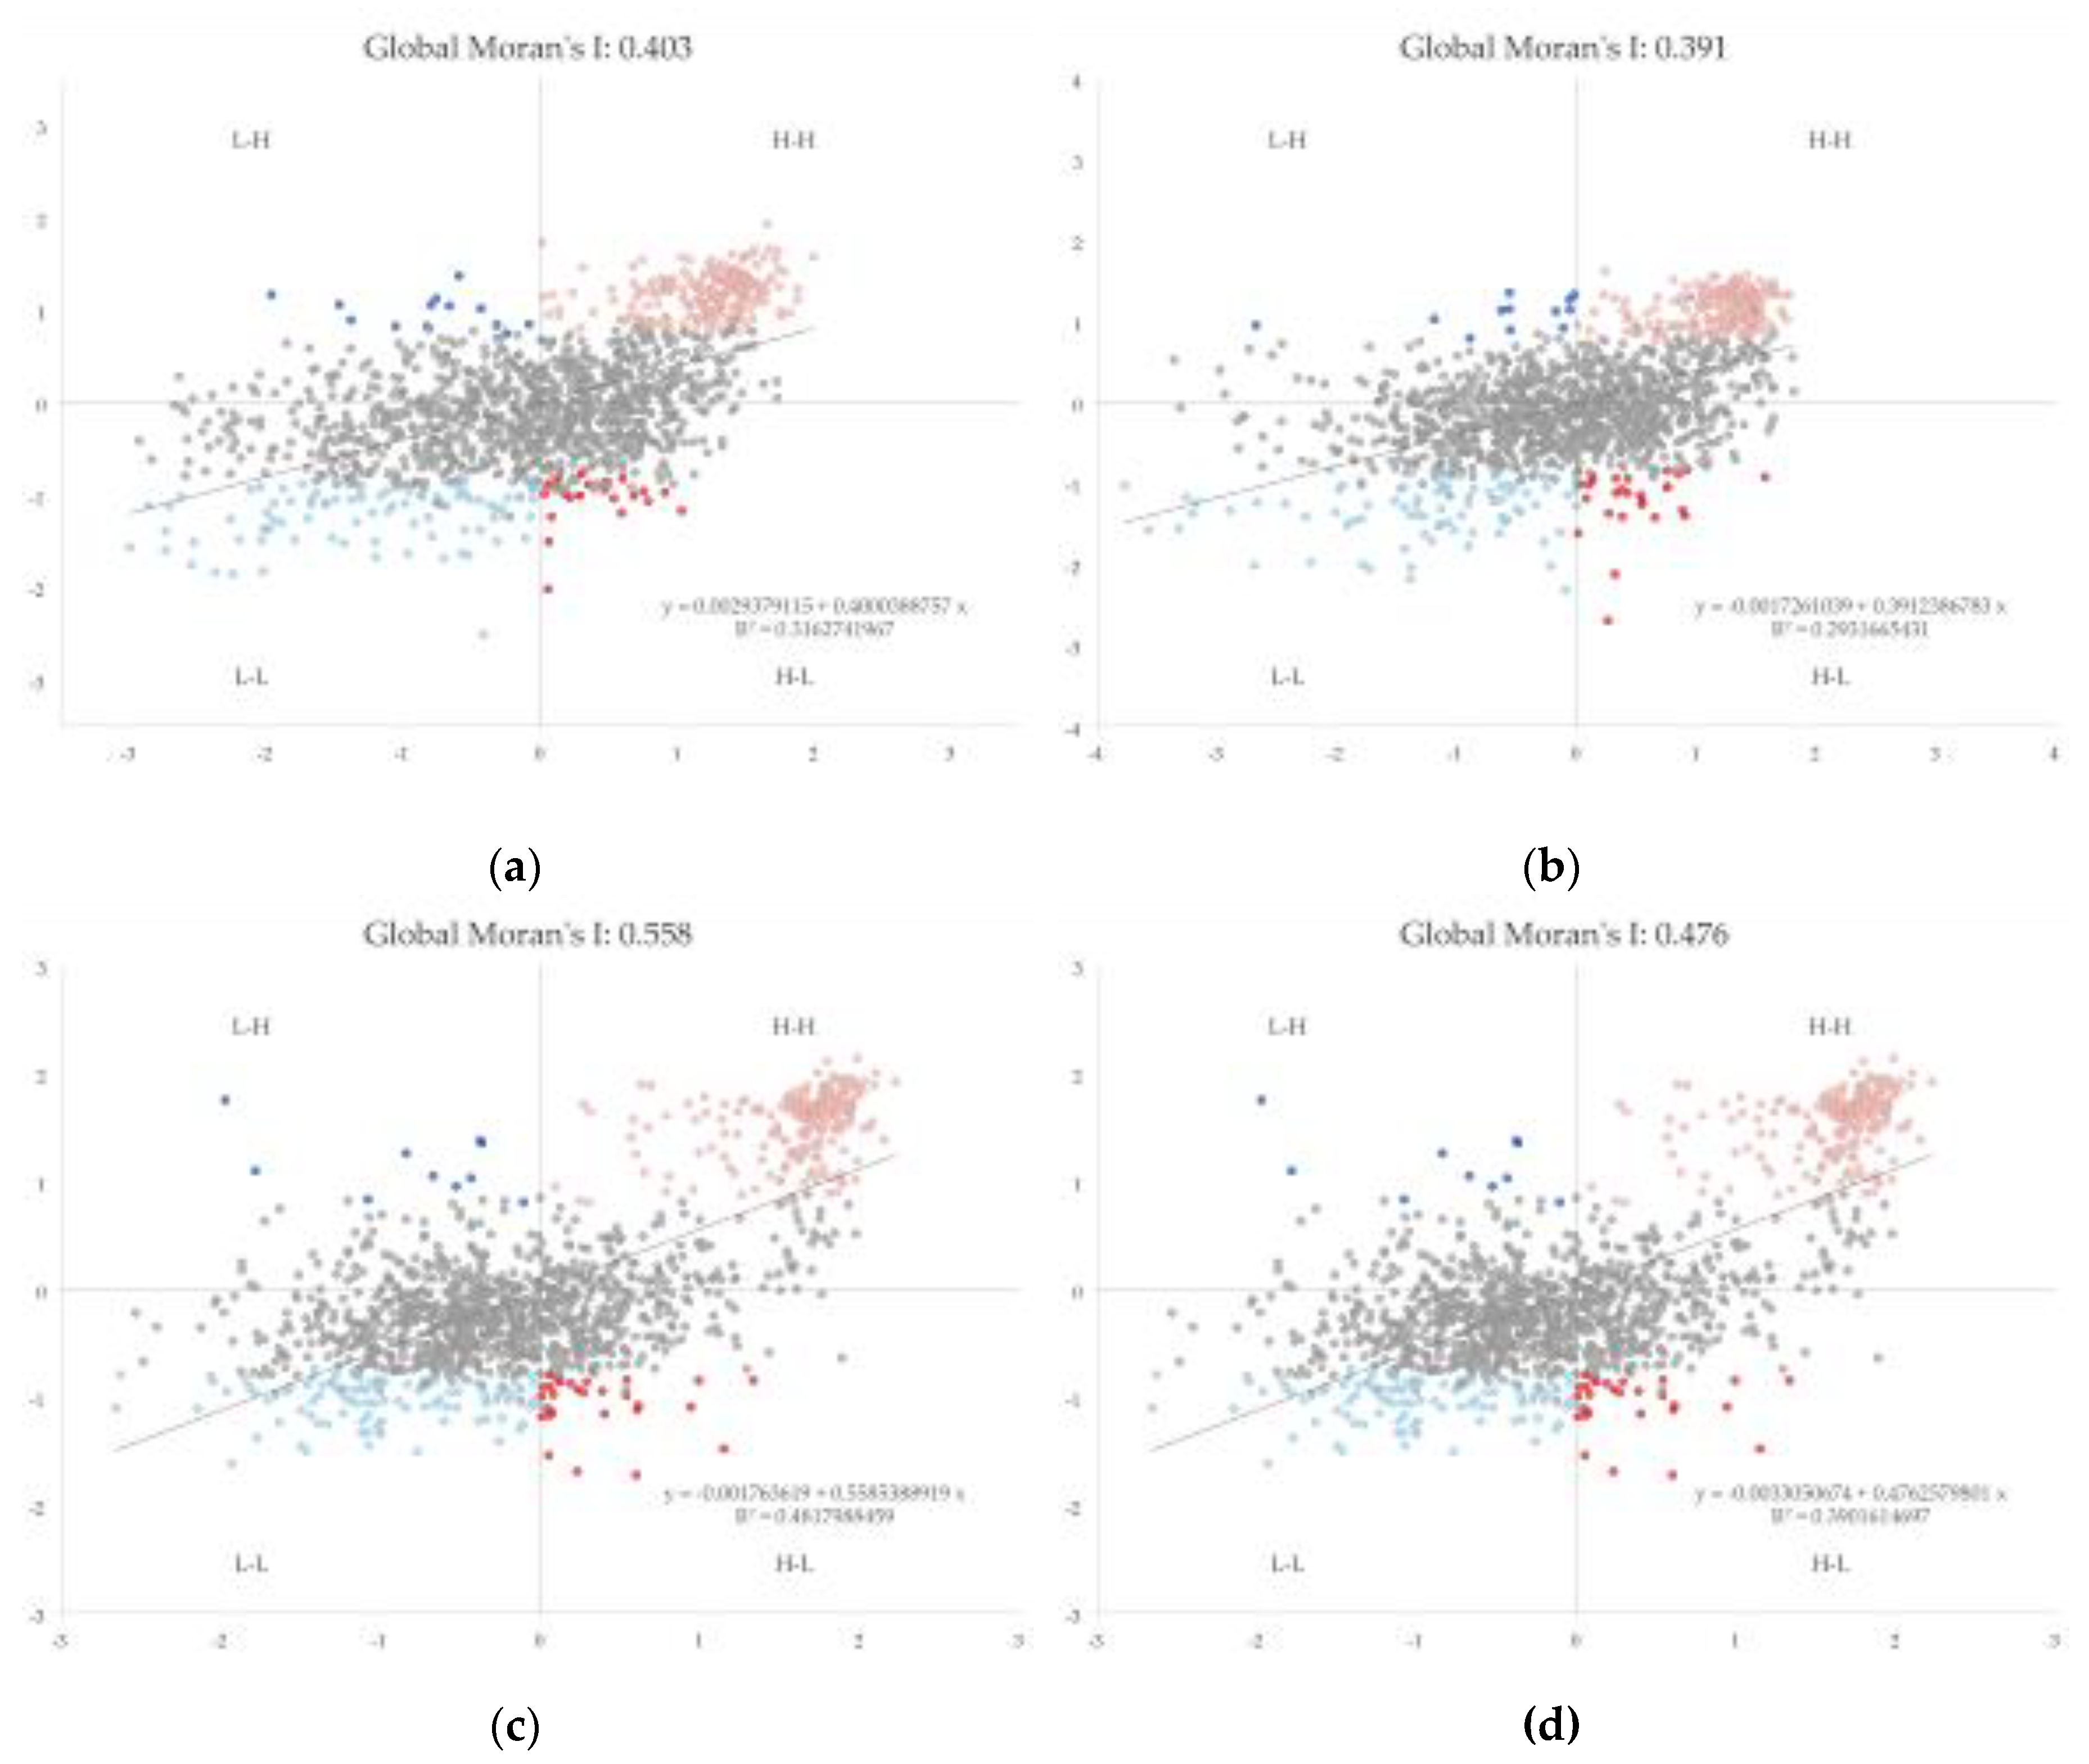
To analyse the spatial correlation of RSEI and to ensure the integrity of the information, the RSEI distribution in each of the years was first resampled into a 1000×1000 grid from which 1302 sampling points were collected in the Rupandehi district. The spatial autocorrelation was performed on the sampling point using ArcGIS Pro for each year and Moran’s I indices in the years 1993, 2004, 2013 and 2023 were 0.403, 0.391, 0.558 and 0.476 respectively, showing the significance of the RSEI.
Figure 9.
Global Moran’s I scatterplot of RSEI in Rupandehi district in (a) 1993; (b) 2004, (c) 2013; and (d) 2023. H-H, L-L, H-L and L-H represent the high-high clusters, low-low clusters, high-low outliers and low-high outliers, respectively.
Figure 9.
Global Moran’s I scatterplot of RSEI in Rupandehi district in (a) 1993; (b) 2004, (c) 2013; and (d) 2023. H-H, L-L, H-L and L-H represent the high-high clusters, low-low clusters, high-low outliers and low-high outliers, respectively.
3.6. Local Indicator of Spatial Autocorrelation of RSEI
The LISA clustering maps for the years 1993, 2004, 2013 and 2023 were generated using ArcGIS Pro to explore the spatial characteristics of RSEI as shown in Figure 10. The extent of not significant decreases from 1993 to 2013 and slightly increases in 2023 and these are mostly in the agricultural lands seen in Figure 6 of LULC classification. The H-H cluster is mostly seen in the northern areas that consist of a Chure Range and are almost covered with forest areas with slight changes throughout these years. Similarly, The L-L cluster gradually increased from 1993 to 2023 and is mostly concentrated in the areas that faced rapid urbanization with time focused around the areas touching Siddhartha highway like Butwal and Bhairahawa. The H-L outlier means the area with high RSEI surrounded by low RSEI and is seen mostly in the area in the central-west part where the forest area lies within the settlement and has many ponds surrounded by houses and buildings. Likewise, the L-H outlier means the area with low RSEI value surrounded by high RSEI value and is seen around the southern part where the settlement lies within the forest areas. Overall, the clusters are seen to be distributed from high in the northern part to low in the southern part showing the overall quality of RSEI decreases while going from North to South.
3.7. Spatio-Temporal Change of Land Use Types in Rupandehi
The spatial distribution of LULC in the Rupandehi district can be seen in Figure 5 for the years 1993, 2004, 2013 and 2023, respectively. The vegetation is mostly dominant in the northern part while agricultural land is situated all around the district; built-up areas are distributed over the whole district but mostly dominant in the central part where the Siddhartha highway passes through i.e. around Butwal and Bhairahawa. Rivers and ponds (mostly used for fish farming) represent the water bodies in the region and barren land is scattered around the agricultural areas.
The area of agriculture is seen to be reduced while the built-up area continuously increased from 1993 to 2023, which can be seen in Table 6 and visualized graphically in Figure 11. The Agricultural land covered around 946.36 sq. km (64% of total land) in 1993 which decreased to 887/20 sq. km (60% of total land) in 2023 while the built-up area increased from 19.20 sq. km (1.31 % of total land) in 1993 to 177.19 sq. km (12.08% of the total land) in 2023. The area covered by water was 28.62 sq. km (1.95% of total land) in 1993 which decreased to 23.72 sq. km (1.61% of total land) in 2023. Barren land seems to decrease gradually from 1993 to 2023 i.e., 131.10 sq. km (8.94% of total land) to 29.754 sq. km (2.02% of total land). While all the classes seem to either increase or decrease, forest area remains the same throughout these years with slight increases and decreases in-between years. The forest area was 340.77 sq. km (23.24% of total land) in 1993 and 348 sq. km (23.75% of total land), which is in the same range.
3.8. Effect of Land Use Change on Eco-Environmental Quality of Rupandehi
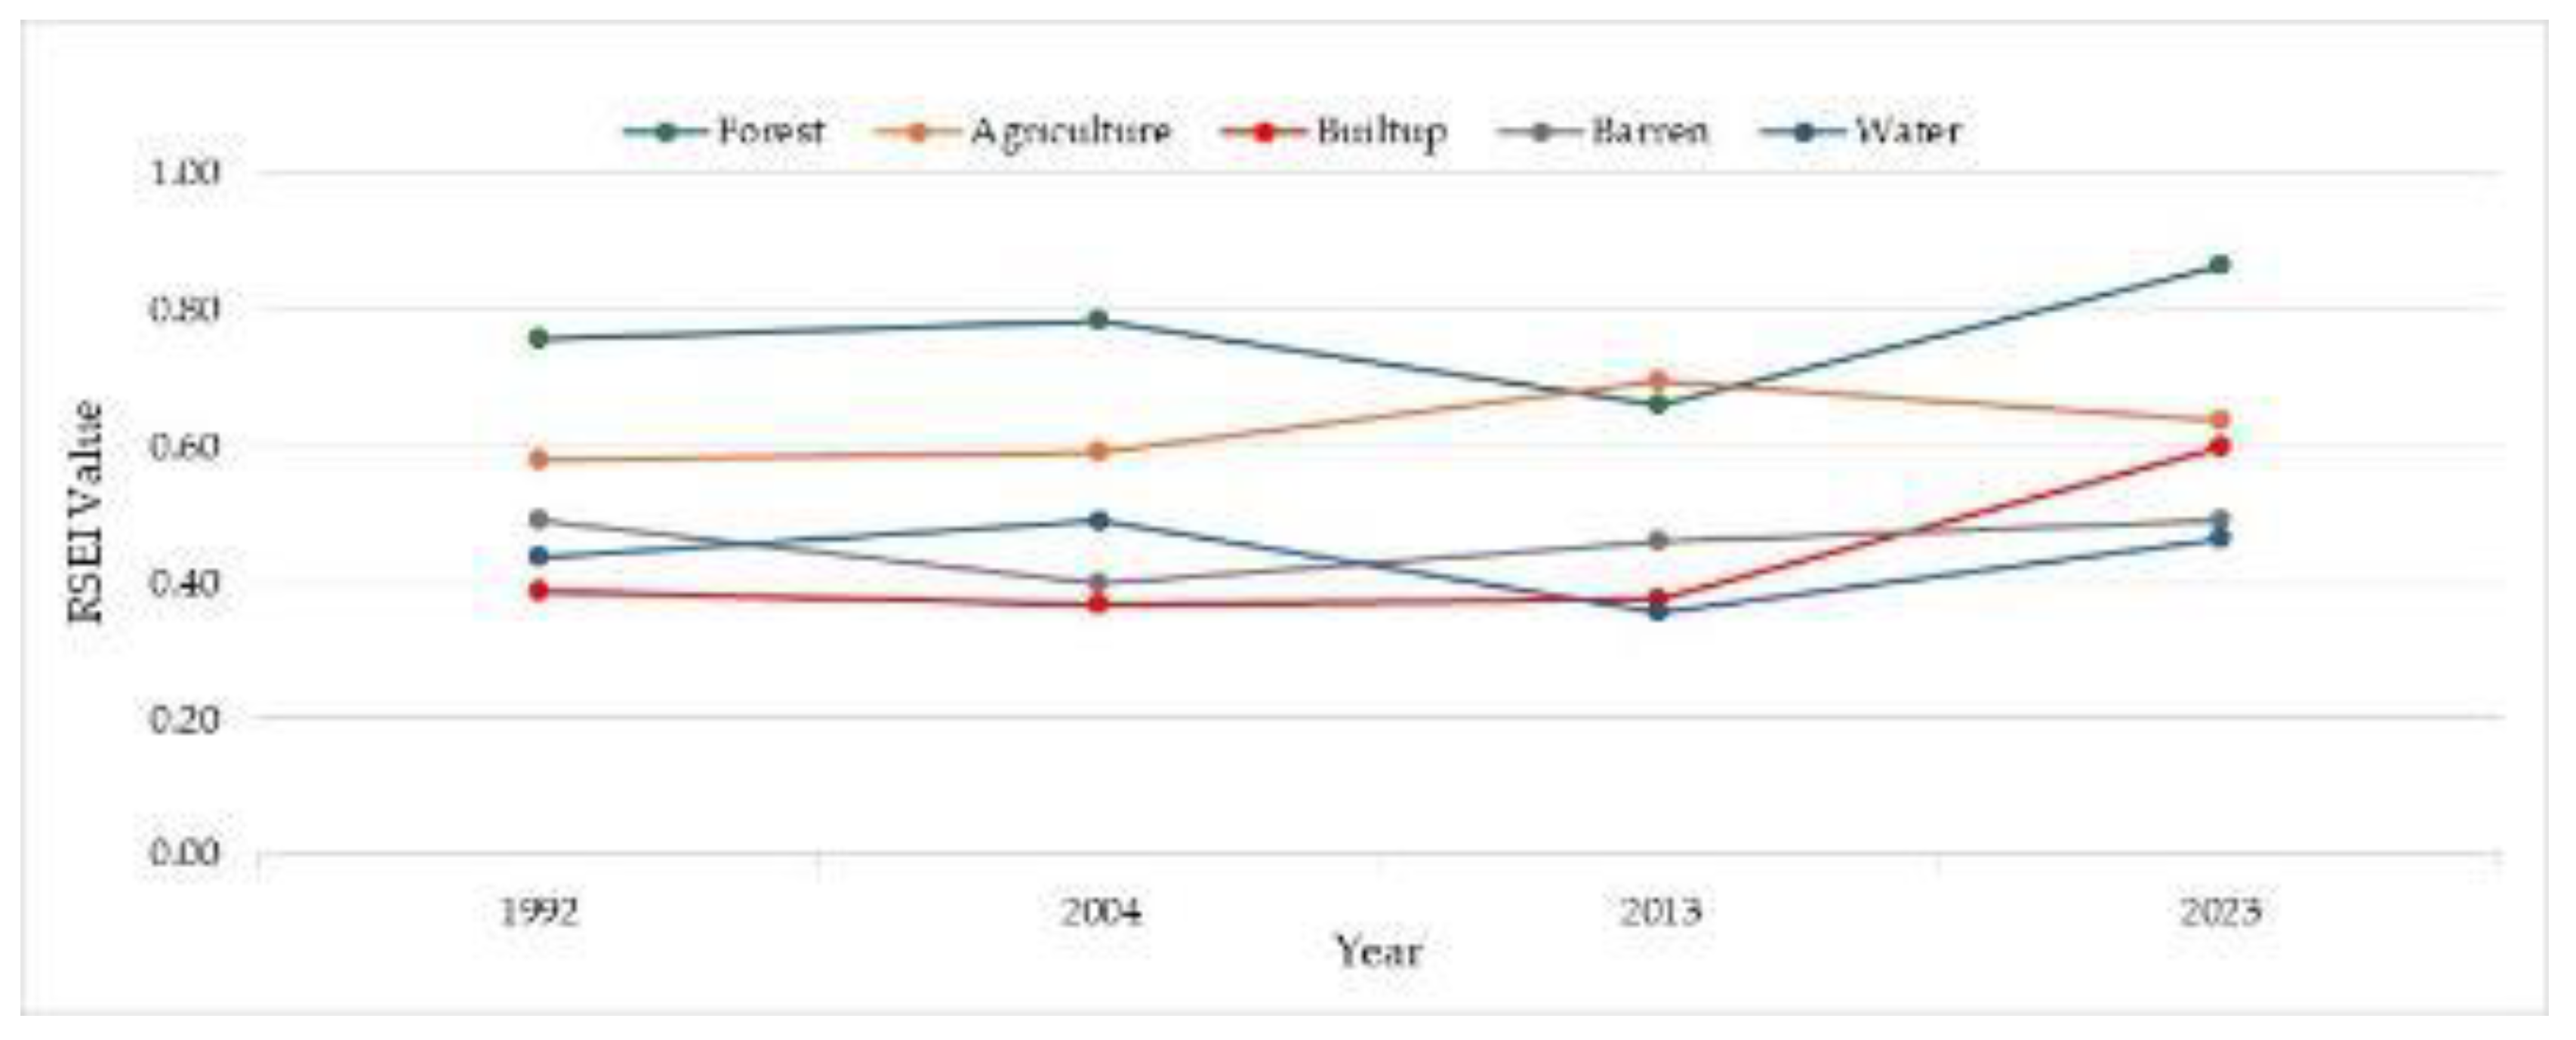
To explore the relationship between Land use classes and RSEI, we extracted the average value of RSEI for each of the land use types which is shown in Figure 10. The average RSEI value for Forest increased from 0.76 in 1993 to 0.87 in 2023 with an increase of 14.5%, showing a strong positive correlation with the RSEI and playing a vital role in maintaining the sound ecosystem in the region. The average RSEI value of agricultural land was good through the period from 1993 to 2023. The eco-environmental quality was mostly poor within the time of the built-up area.
Figure 13.
Average RSEI value of Land use class from 1993 to 2023.
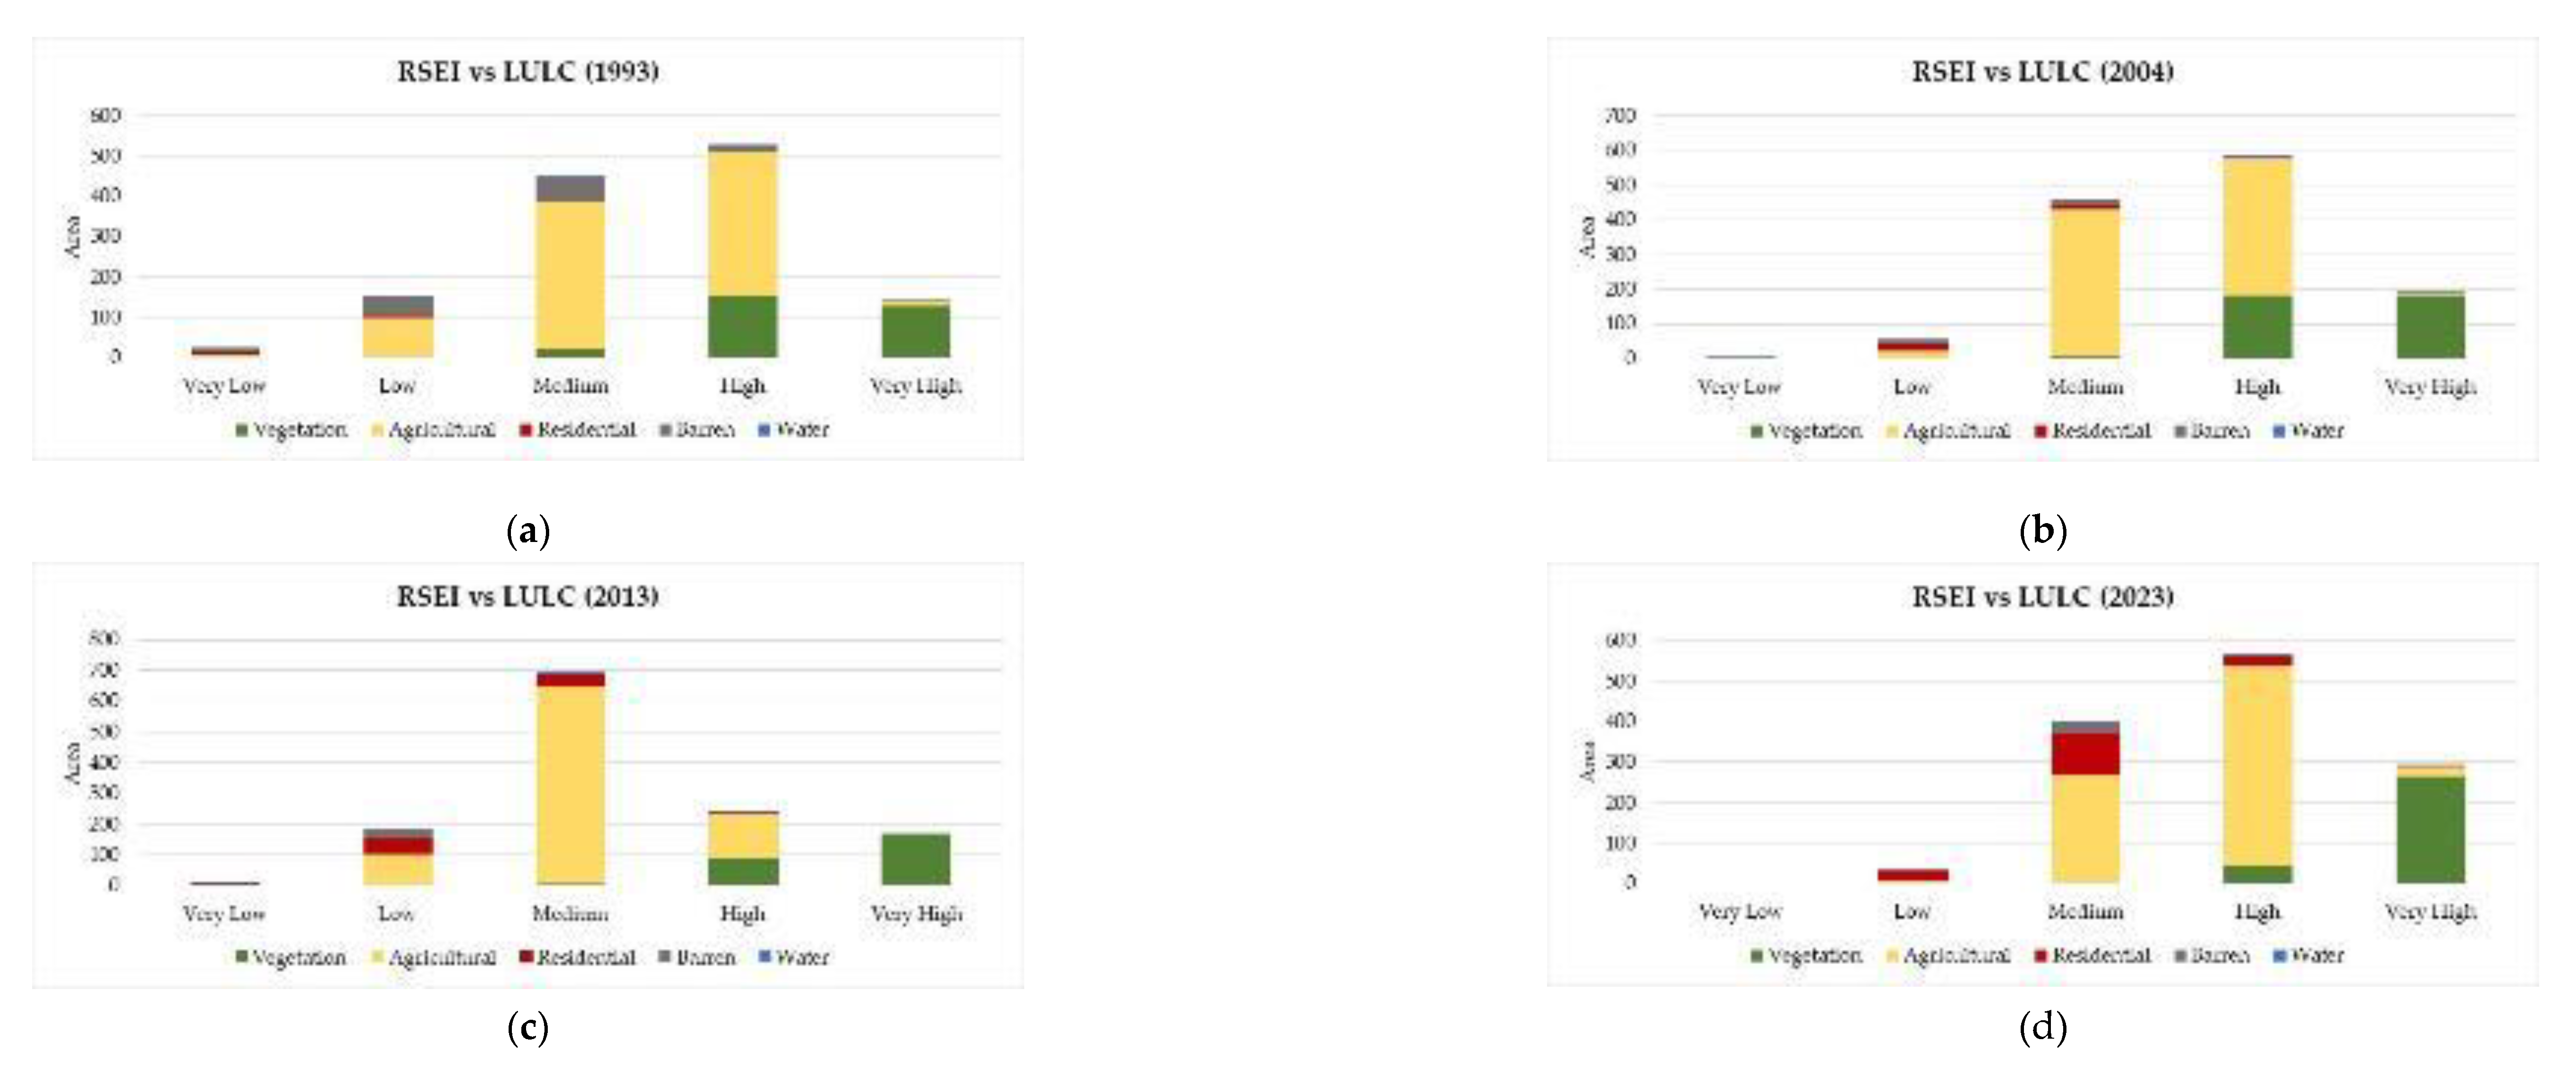
We also explored the quantitative relationship between RSEI and Land Use type in the region from 1993 to 2023 in the respective years which is seen in Figure 11. Out of the total area of the forest, the maximum of the area lies in a remarkably high value of RSEI for the years 2004 (182.36 sq. km), 2013 (167.32 sq. km) and 2023 (264.34 sq. km) and high value of RSEI for the year 1993 (153.07 sq. km). So, with an increase in forest area from 1993 to 2023, the RSEI value has also increased in those regions. Similarly, for forests, most of the area lies in medium and high RSEI grades for all four years: 1993 (366.93 + 358.75 sq. km), 2004 (424.89 + 395.97 sq. km), 2013 (640.32 + 142.30 sq. km) and 2023 (266.90 +491.54 sq. km). However, for built-up, most of them fall in the medium and low RSEI grade as shown in Figure 11, degrading the overall eco-environmental quality in the particular year. Also, we can see most of the area of agricultural land lies in medium and high RSEI grades demonstrating positive effects while most of the barren land lies in medium and low RSEI grades showing negative effects on the eco-environmental quality.
Figure 14.
Land Use Land Cover classification of Rupandehi district for the years (a) 1993; (b) 2004, (c) 2013; and (d) 2023.
Figure 14.
Land Use Land Cover classification of Rupandehi district for the years (a) 1993; (b) 2004, (c) 2013; and (d) 2023.
4. Discussion
4.1. Potential Reasons for Ecological Quality Change
Rupandehi district has experienced massive and rapid urbanization during the 30 years from 1993-2023. Rapid urbanization has been one of the major causes of the deterioration of environmental quality in the region. We tried to look at the pixel level of RSEI, LULC and Satellite image (latest Maxar imagery) at two major cities of Butwal and Bhairahawa to see the impact of LULC/Urbanization in RSEI and found that the area with high urban density/built-up area has quite low RSEI value than the area that has vegetation and agricultural land. The comparison can be seen in Figure 15 and Figure 16.
The built-up area has increased from 13.32 sq. km to 156.16 sq. km which is around 1000%. It is quite interesting on the fact that although the built-up area has increased at the maximum rate, the eco-environmental quality of the district is maintained at a high level (RSEI≈0.67) as opposed to the deterioration.
Moreover, the forest area has increased in 2023 as compared to 1993 while the agricultural area has decreased but the average RSEI of each of the classes have increased throughout this time: Forest – 0.76 to 0.87 and Agricultural Land – 0.58 to 0.64. This has also some connection with the massive decrease in barren land from 1993 (122 sq. km) to 2023 (26.474 sq. km). The massive decrease in barren land is because most of them have been converted into built-up areas throughout this time. Similarly, some afforestation has been done in these areas which has increased the quality of the environment. Also, in recent years, the government have strictly advised the people in the district not to leave any land unused or barren which has increased the quality of the environment.
While we explore the spatial and temporal distribution of RSEI in response to LULC change, we can also see that there is less spatial correlation at most of the part of the region. The region behind this is mostly because of the lack of spatial zoning in the district and due to haphazard and unmanaged urbanization. The built-up areas are almost distributed around the region and are made without any planning mostly in agricultural areas. Therefore, we can see multiple RSEI grade distributions at the small spatial locations.
4.2. Challenge/Limitations and Future Work
- The spatial resolution of a Landsat image is only 30m which is comparatively low and will limit the exploration of each of the indices within a minute level. Therefore, future studies can explore the combination of Sentinel-2 images which have comparatively high resolution to that of Landsat.
- We used just 4 indicators based on different literature review, that plays an immense role in affecting the ecological quality. More exploration of multiple indicators is required to optimize the monitoring and evaluation of the EEQ in future.
- We used LULC changes as a driving factor for the EEQ, but there are many other factors like changes in GDP, population, temperature, precipitation, etc. that have an equal impact on the EEQ. Therefore, further study can explore more driving factors to achieve a more accurate EEQ and support policymakers in controlling it.
- Since forest and agricultural land play vital roles in maintaining the eco-environmental quality in the region and it is obvious that in the coming days, there will be less land available for afforestation as well as the agricultural land will decrease due to urbanization, the local government should look after effective measure to balance between urbanization and ecological protection by controlling the massive and haphazard urbanization ongoing on the region and bring proper land use planning and land management system.
- Also, the government should discourage deforestation and land degradation while encouraging people to bring greenery around their surroundings by planting more trees promoting a low-carbon economy by reducing greenhouse gas emissions[18] and making sure that their agricultural land does not go barren by planting any crops available.
5. Conclusion
The study focused mainly on monitoring the long-term spatial and temporal variation in the eco-environmental quality of the Rupandehi district based on the Remote Sensing Ecological Index (RSEI) from 1993 to 2023 utilizing the Landsat Image and leveraging the capability of Google Earth Engine (GEE) to do spatial analysis and explained the impact of LULC change on the eco-environmental quality. The following conclusions can be derived from the study:
- The overall quality of the Rupandehi district has remained within the range of medium and high throughout time showing an overall rising trend in 30 years, having the maximum value (0.67) of RSEI in 2023 and a minimum value (0.554) in 2013.
- The spatial distribution of the higher RSEI is concentrated in the Forest area in the northern hilly regions, while low RSEI is concentrated in two major cities: Butwal and Bhairahawa as shown in Figure 10 which are densely populated areas with more impervious surfaces and are subjected to urban heat island effect.
- The different land use land cover types and their changes to each other throughout the time of 30 years have a direct impact on the eco-environmental quality of the district. The conversion of barren land and built-up land to forest and agricultural have a positive impact on the quality. Meanwhile, forest and agricultural land were mostly converted to built-up areas which had a negative impact on the quality and was the main reason for the deterioration of the eco-environmental quality.
This paper provides a scientific basis for the local government as well as environmental conservationists in monitoring and maintaining sound ecological quality, proper utilization of natural resources and planning and promoting sustainable and eco-friendly socio-economic development in the region.
Author Contributions
Conceptualization, Gaurav Parajuli and Tri Dev Acharya; Data curation, Gaurav Parajuli and Yogesh Regmi; Formal analysis, Gaurav Parajuli, Yogesh Regmi and Tri Dev Acharya; Investigation, Gaurav Parajuli; Methodology, Gaurav Parajuli, Yogesh Regmi, Bimal Pokhrel and Tri Dev Acharya; Resources, Tri Dev Acharya; Software, Gaurav Parajuli; Supervision, Tri Dev Acharya; Validation, Gaurav Parajuli and Bimal Pokhrel; Visualization, Gaurav Parajuli; Writing – original draft, Gaurav Parajuli; Writing – review & editing, Yogesh Regmi, Bimal Pokhrel and Tri Dev Acharya. All authors have read and agreed to the published version of the manuscript.
Funding
This research received no external funding.
Data Availability Statement
All data are available in the Google Earth Engine Data Catalogue. For code and training data, we will provide it upon request.
Acknowledgements
We acknowledge the free availability of data via USGS and GEE. The work is a result of the #Mentor4Nepal Initiative (https://github.com/trydave/Mentor4Nepal) which supports recent graduates and early career professionals focusing on the enhancement of one’s skill set, support for a research project, and a collaborative publication.
Conflicts of Interest
The authors declare no conflict of interest.
References
- Helili, P.; Zan, M. Coupling Coordination Development of Urbanization and Ecological Environment in the Urban Agglomeration on the Northern Slope of the Tianshan Mountains, China. Sustainability (Switzerland) 2023, 15. [CrossRef]
- Tang, H.; Fang, J.; Xie, R.; Ji, X.; Li, D.; Yuan, J. Impact of Land Cover Change on a Typical Mining Region and Its Ecological Environment Quality Evaluation Using Remote Sensing Based Ecological Index (RSEI). Sustainability 2022, 14, 12694. [CrossRef]
- Ren, W.; Zhang, X.; Peng, H. Evaluation of Temporal and Spatial Changes in Ecological Environmental Quality on Jianghan Plain From 1990 to 2021. Front Environ Sci 2022, 10, 1–14. [CrossRef]
- Zhou, S.; Li, W.; Zhang, W.; Wang, Z. The Assessment of the Spatiotemporal Characteristics of the Eco-Environmental Quality in the Chishui River Basin from 2000 to 2020. Sustainability 2023, 15, 3695. [CrossRef]
- Yan, T.; Zhao, W.; Zhang, G.; Dong, L.; Lu, F.; Lv, Z.; Miao, X. Evaluation of the Ecological Quality of the Taishan Region Based on Landsat Series of Satellite Images. Tehnicki vjesnik - Technical Gazette 2023, 30, 1308–1314. [CrossRef]
- Liu, H.; Wang, Q.; Liu, N.; Zhang, H.; Tan, Y.; Zhang, Z. The Impact of Land Use / Cover Changes on the Ecological Envi- Ronment Quality in Suburban Open-Pit Mine Concentration Areas. 2022, 1–25.
- United Nations Department of Economic and Social Affairs, P.D. World Population Prospects 2022: Summary of Results; 2022;
- Liu, P.; Ren, C.; Yu, W.; Ren, H.; Xia, C. Exploring the Ecological Quality and Its Drivers Based on Annual Remote Sensing Ecological Index and Multisource Data in Northeast China. Ecol Indic 2023, 154, 110589. [CrossRef]
- Ma, D.; Huang, Q.; Liu, B.; Zhang, Q. Analysis and Dynamic Evaluation of Eco-Environmental Quality in the Yellow River Delta from 2000 to 2020. Sustainability 2023, 15, 7835. [CrossRef]
- Wang, X.; Zhang, S.; Zhao, X.; Shi, S.; Xu, L. Exploring the Relationship between the Eco-Environmental Quality and Urbanization by Utilizing Sentinel and Landsat Data: A Case Study of the Yellow River Basin. Remote Sens (Basel) 2023, 15, 743. [CrossRef]
- Gou, R.; Zhao, J. Eco-Environmental Quality Monitoring in Beijing, China, Using an RSEI-Based Approach Combined with Random Forest Algorithms. IEEE Access 2020, 8, 196657–196666. [CrossRef]
- Xu, H.; Wang, Y.; Guan, H.; Shi, T.; Hu, X. Detecting Ecological Changes with a Remote Sensing Based Ecological Index (RSEI) Produced Time Series and Change Vector Analysis. Remote Sens (Basel) 2019, 11, 2345. [CrossRef]
- Liao, W.; Jiang, W. Evaluation of the Spatiotemporal Variations in the Eco-Environmental Quality in China Based on the Remote Sensing Ecological Index. Remote Sens (Basel) 2020, 12. [CrossRef]
- Geng, J.; Yu, K.; Xie, Z.; Zhao, G.; Ai, J.; Yang, L.; Yang, H.; Liu, J. Analysis of Spatiotemporal Variation and Drivers of Ecological Quality in Fuzhou Based on RSEI. Remote Sens (Basel) 2022, 14, 4900. [CrossRef]
- Eckert, S.; Hüsler, F.; Liniger, H.; Hodel, E. Trend Analysis of MODIS NDVI Time Series for Detecting Land Degradation and Regeneration in Mongolia. J Arid Environ 2015, 113, 16–28. [CrossRef]
- Peng, W.; Kuang, T.; Tao, S. Quantifying Influences of Natural Factors on Vegetation NDVI Changes Based on Geographical Detector in Sichuan, Western China. J Clean Prod 2019, 233, 353–367. [CrossRef]
- Pettorelli, N.; Vik, J.O.; Mysterud, A.; Gaillard, J.M.; Tucker, C.J.; Stenseth, N.C. Using the Satellite-Derived NDVI to Assess Ecological Responses to Environmental Change. Trends Ecol Evol 2005, 20, 503–510. [CrossRef]
- Li, H.; Jing, H.; Yan, G.; Guo, H.; Luan, W. Long-Term Ecological Environment Quality Evaluation and Its Driving Mechanism in Luoyang City. Sustainability (Switzerland) 2023, 15. [CrossRef]
- Liang, L.; Huang, T.; DI, L.; Geng, D.; Yan, J.; Wang, S.; Wang, L.; Li, L.; Chen, B.; Kang, J. Influence of Different Bandwidths on LAI Estimation Using Vegetation Indices. IEEE J Sel Top Appl Earth Obs Remote Sens 2020, 13, 1494–1502. [CrossRef]
- Asner, G.P.; Scurlock, J.M.O.; Hicke, J.A. Global Synthesis of Leaf Area Index Observations: Implications for Ecological and Remote Sensing Studies. Global Ecology and Biogeography 2003, 12, 191–205. [CrossRef]
- Singh, P.; Kikon, N.; Verma, P. Impact of Land Use Change and Urbanization on Urban Heat Island in Lucknow City, Central India. A Remote Sensing Based Estimate. Sustain Cities Soc 2017, 32, 100–114. [CrossRef]
- Jiang, J.; Tian, G. Analysis of the Impact of Land Use/Land Cover Change on Land Surface Temperature with Remote Sensing. Procedia Environ Sci 2010, 2, 571–575. [CrossRef]
- Zhang, X.; Estoque, R.C.; Murayama, Y. An Urban Heat Island Study in Nanchang City, China Based on Land Surface Temperature and Social-Ecological Variables. Sustain Cities Soc 2017, 32, 557–568. [CrossRef]
- Wang, X.D.; Zhong, X.H.; Liu, S.Z.; Liu, J.G.; Wang, Z.Y.; Li, M.H. Regional Assessment of Environmental Vulnerability in the Tibetan Plateau: Development and Application of a New Method. J Arid Environ 2008, 72, 1929–1939. [CrossRef]
- Zhang, T.; Yang, R.; Yang, Y.; Li, L.; Chen, L. Assessing the Urban Eco-Environmental Quality by the Remote-Sensing Ecological Index: Application to Tianjin, North China. ISPRS Int J Geoinf 2021, 10, 475. [CrossRef]
- Yao, K.; Halike, A.; Chen, L.; Wei, Q. Spatiotemporal Changes of Eco-Environmental Quality Based on Remote Sensing-Based Ecological Index in the Hotan Oasis, Xinjiang. J Arid Land 2022, 14, 262–283. [CrossRef]
- Zhang, Y.; She, J.; Long, X.; Zhang, M. Spatio-Temporal Evolution and Driving Factors of Eco-Environmental Quality Based on RSEI in Chang-Zhu-Tan Metropolitan Circle, Central China. Ecol Indic 2022, 144, 109436. [CrossRef]
- Xu, H.Q. A Remote Sensing Urban Ecological Index and Its Application. Shengtai Xuebao/ Acta Ecologica Sinica 2013, 33, 7853–7862. [CrossRef]
- Fang, G.; Pablo, R.D.A.; Zhang, Y. Eco-Environmental Quality Assessment Using the Remote Sensing Ecological Index in Suzhou City, China. Sustainability 2023, 15, 13158. [CrossRef]
- Cui, J.; Zhu, M.; Mi, H.; Liu, Y. Evaluation of Eco-Environmental Quality and Analysis on Spatio-Temporal Variation in Jinan, China. Pol J Environ Stud 2022, 31, 1061–1072. [CrossRef]
- Zhang, J.; Zhou, Q.; Cao, M.; Liu, H. Spatiotemporal Change of Eco-Environmental Quality in the Oasis City and Its Correlation with Urbanization Based on RSEI: A Case Study of Urumqi, China. Sustainability (Switzerland) 2022, 14. [CrossRef]
- Hu, C.; Song, M.; Zhang, A. Dynamics of the Eco-Environmental Quality in Response to Land Use Changes in Rapidly Urbanizing Areas: A Case Study of Wuhan, China from 2000 to 2018. Journal of Geographical Sciences 2023, 33, 245–265. [CrossRef]
- Xu, H.; Wang, M.; Shi, T.; Guan, H.; Fang, C.; Lin, Z. Prediction of Ecological Effects of Potential Population and Impervious Surface Increases Using a Remote Sensing Based Ecological Index (RSEI). Ecol Indic 2018, 93, 730–740. [CrossRef]
- Gao, W.; Zhang, S.; Rao, X.; Lin, X.; Li, R. Landsat TM/OLI-Based Ecological and Environmental Quality Survey of Yellow River Basin, Inner Mongolia Section. Remote Sens (Basel) 2021, 13. [CrossRef]
- Xiong, Y.; Xu, W.; Lu, N.; Huang, S.; Wu, C.; Wang, L.; Dai, F.; Kou, W. Assessment of Spatial–Temporal Changes of Ecological Environment Quality Based on RSEI and GEE: A Case Study in Erhai Lake Basin, Yunnan Province, China. Ecol Indic 2021, 125, 107518. [CrossRef]
- Yang, Y.; Li, H. Spatiotemporal Dynamic Decoupling States of Eco-Environmental Quality and Land-Use Carbon Emissions: A Case Study of Qingdao City, China. Ecol Inform 2023, 75, 101992. [CrossRef]
- Chang, M.; Meng, S.; Zhang, Z.; Wang, R.; Yin, C.; Zhao, Y.; Zhou, Y. Analysis of Eco-Environmental Quality and Driving Forces in Opencast Coal Mining Area Based on GWANN Model: A Case Study in Shengli Coalfield, China. Sustainability 2023, 15, 10656. [CrossRef]
- KC, A.; Wagle, N.; Acharya, T.D. Spatiotemporal Analysis of Land Cover and the Effects on Ecosystem Service Values in Rupandehi, Nepal from 2005 to 2020. ISPRS Int J Geoinf 2021, 10, 635. [CrossRef]
- Yu, G.; Liu, T.; Wang, Q.; Li, T.; Li, X.; Song, G.; Feng, Y. Impact of Land Use/Land Cover Change on Ecological Quality during Urbanization in the Lower Yellow River Basin: A Case Study of Jinan City. Remote Sens (Basel) 2022, 14, 6273. [CrossRef]
- Pan, W.; Wang, S.; Wang, Y.; Yu, Y.; Luo, Y. Dynamical Changes of Land Use/Land Cover and Their Impacts on Ecological Quality during China’s Reform Periods: A Case Study of Quanzhou City, China. PLoS One 2022, 17, e0278667. [CrossRef]
- Conference, United Nations Development, on T. and UN List of Least Developed Countries Available online: https://unctad.org/topic/least-developed-countries/list.
- Rimal, B.; Sloan, S.; Keshtkar, H.; Sharma, R.; Rijal, S.; Shrestha, U.B. Patterns of Historical and Future Urban Expansion in Nepal. Remote Sensing 2020, Vol. 12, Page 628 2020, 12, 628. [CrossRef]
- Rijal, S.; Rimal, B.; Stork, N.; Sharma, H.P. Quantifying the Drivers of Urban Expansion in Nepal. Environ Monit Assess 2020, 192. [CrossRef]
- Ning, C.; Subedi, R.; Hao, L. Land Use/Cover Change, Fragmentation, and Driving Factors in Nepal in the Last 25 Years. Sustainability (Switzerland) 2023, 15, 1–19. [CrossRef]
- Gartaula, H.N.; Niehof, A. Migration to and from the Nepal Terai: Shifting Movements and Motives. The South Asianist 2013, 2, 29–51.
- National Statistics Office National Population and Housing Census 2021 Available online: https://censusnepal.cbs.gov.np/results.
- Office, N.S. National Population and Housing Census 2021; 2023;
- Zhang, W.; Zhang, W.; Ji, J.; Chen, C. Urban Ecological Quality Assessment Based on Google Earth Engine and Driving Factors Analysis: A Case Study of Wuhan City, China. Sustainability 2024, 16, 3598. [CrossRef]
- Xu, H.; Wang, Y.; Guan, H.; Shi, T.; Hu, X. Detecting Ecological Changes with a Remote Sensing Based Ecological Index (RSEI) Produced Time Series and Change Vector Analysis. Remote Sens (Basel) 2019, 11, 2345. [CrossRef]
- Xu, H.; Wang, M.; Shi, T.; Guan, H.; Fang, C.; Lin, Z. Prediction of Ecological Effects of Potential Population and Impervious Surface Increases Using a Remote Sensing Based Ecological Index (RSEI). Ecol Indic 2018, 93, 730–740. [CrossRef]
- Huang, S.; Tang, L.; Hupy, J.P.; Wang, Y.; Shao, G. A Commentary Review on the Use of Normalized Difference Vegetation Index (NDVI) in the Era of Popular Remote Sensing. J For Res (Harbin) 2021, 32, 1–6. [CrossRef]
- Crist, E.P. A TM Tasseled Cap Equivalent Transformation for Reflectance Factor Data. Remote Sens Environ 1985, 17, 301–306. [CrossRef]
- Baig, M.H.A.; Zhang, L.; Shuai, T.; Tong, Q. Derivation of a Tasselled Cap Transformation Based on Landsat 8 At-Satellite Reflectance. Remote Sensing Letters 2014, 5, 423–431. [CrossRef]
- Fang, G.; Pablo, R.D.A.; Zhang, Y. Eco-Environmental Quality Assessment Using the Remote Sensing Ecological Index in Suzhou City, China. Sustainability (Switzerland) 2023, 15. [CrossRef]
- Hu, X.; Xu, H. A New Remote Sensing Index for Assessing the Spatial Heterogeneity in Urban Ecological Quality: A Case from Fuzhou City, China. Ecol Indic 2018, 89, 11–21. [CrossRef]
- Hou, X.; Xie, X.; Bagan, H.; Chen, C.; Wang, Q.; Yoshida, T. Exploring Spatiotemporal Variations in Land Surface Temperature Based on Local Climate Zones in Shanghai from 2008 to 2020. Remote Sens (Basel) 2023, 15, 3106. [CrossRef]
- Jimenez-Munoz, J.C.; Sobrino, J.A.; Skokovic, D.; Mattar, C.; Cristobal, J. Land Surface Temperature Retrieval Methods From Landsat-8 Thermal Infrared Sensor Data. IEEE Geoscience and Remote Sensing Letters 2014, 11, 1840–1843. [CrossRef]
- Estoque, R.C.; Murayama, Y.; Myint, S.W. Effects of Landscape Composition and Pattern on Land Surface Temperature: An Urban Heat Island Study in the Megacities of Southeast Asia. Science of The Total Environment 2017, 577, 349–359. [CrossRef]
- Xu, H.Q. A Remote Sensing Index for Assessment of Regional Ecological Changes. Zhongguo Huanjing Kexue/China Environmental Science 2013, 33, 889–897.
- Szabó, S.; Gácsi, Z.; Balázs, B. Specific Features of NDVI, NDWI and MNDWI as Reflected in Land Cover Categories. Landscape & Environment 2016, 10, 194–202. [CrossRef]
- Faridatul, M.I.; Wu, B. Automatic Classification of Major Urban Land Covers Based on Novel Spectral Indices. ISPRS Int J Geoinf 2018, 7, 453. [CrossRef]
- Li, E.; Du, P.; Samat, A.; Xia, J.; Che, M. An Automatic Approach for Urban Land-Cover Classification from Landsat-8 OLI Data. Int J Remote Sens 2015, 36, 5983–6007. [CrossRef]
- Wardlow, B.D.; Egbert, S.L. A Comparison of MODIS 250-m EVI and NDVI Data for Crop Mapping: A Case Study for Southwest Kansas. Int J Remote Sens 2010, 31, 805–830. [CrossRef]
- Xu, H. Modification of Normalised Difference Water Index (NDWI) to Enhance Open Water Features in Remotely Sensed Imagery. Int J Remote Sens 2006, 27, 3025–3033. [CrossRef]
- Kebede, T.A.; Hailu, B.T.; Suryabhagavan, K.V. Evaluation of Spectral Built-up Indices for Impervious Surface Extraction Using Sentinel-2A MSI Imageries: A Case of Addis Ababa City, Ethiopia. Environmental Challenges 2022, 8, 100568. [CrossRef]
- Alcaras, E.; Costantino, D.; Guastaferro, F.; Parente, C.; Pepe, M. Normalized Burn Ratio Plus (NBR+): A New Index for Sentinel-2 Imagery. Remote Sens (Basel) 2022, 14, 1–19. [CrossRef]
- Zhao, B.; Han, J.; Li, P.; Li, H.; Feng, Y.; Hu, B.; Zhang, G.; Li, J. Evidence for Urbanization Effects on Eco-Environmental Quality: A Case Study of Guyuan City, China. Sustainability (Switzerland) 2023, 15. [CrossRef]
- Xu, H.; Wang, M.; Shi, T.; Guan, H.; Fang, C.; Lin, Z. Prediction of Ecological Effects of Potential Population and Impervious Surface Increases Using a Remote Sensing Based Ecological Index (RSEI). Ecol Indic 2018, 93, 730–740. [CrossRef]
Figure 1.
Location map of the study area: Rupandehi District, Nepal with ESRI’s Topographic base map.
Figure 1.
Location map of the study area: Rupandehi District, Nepal with ESRI’s Topographic base map.
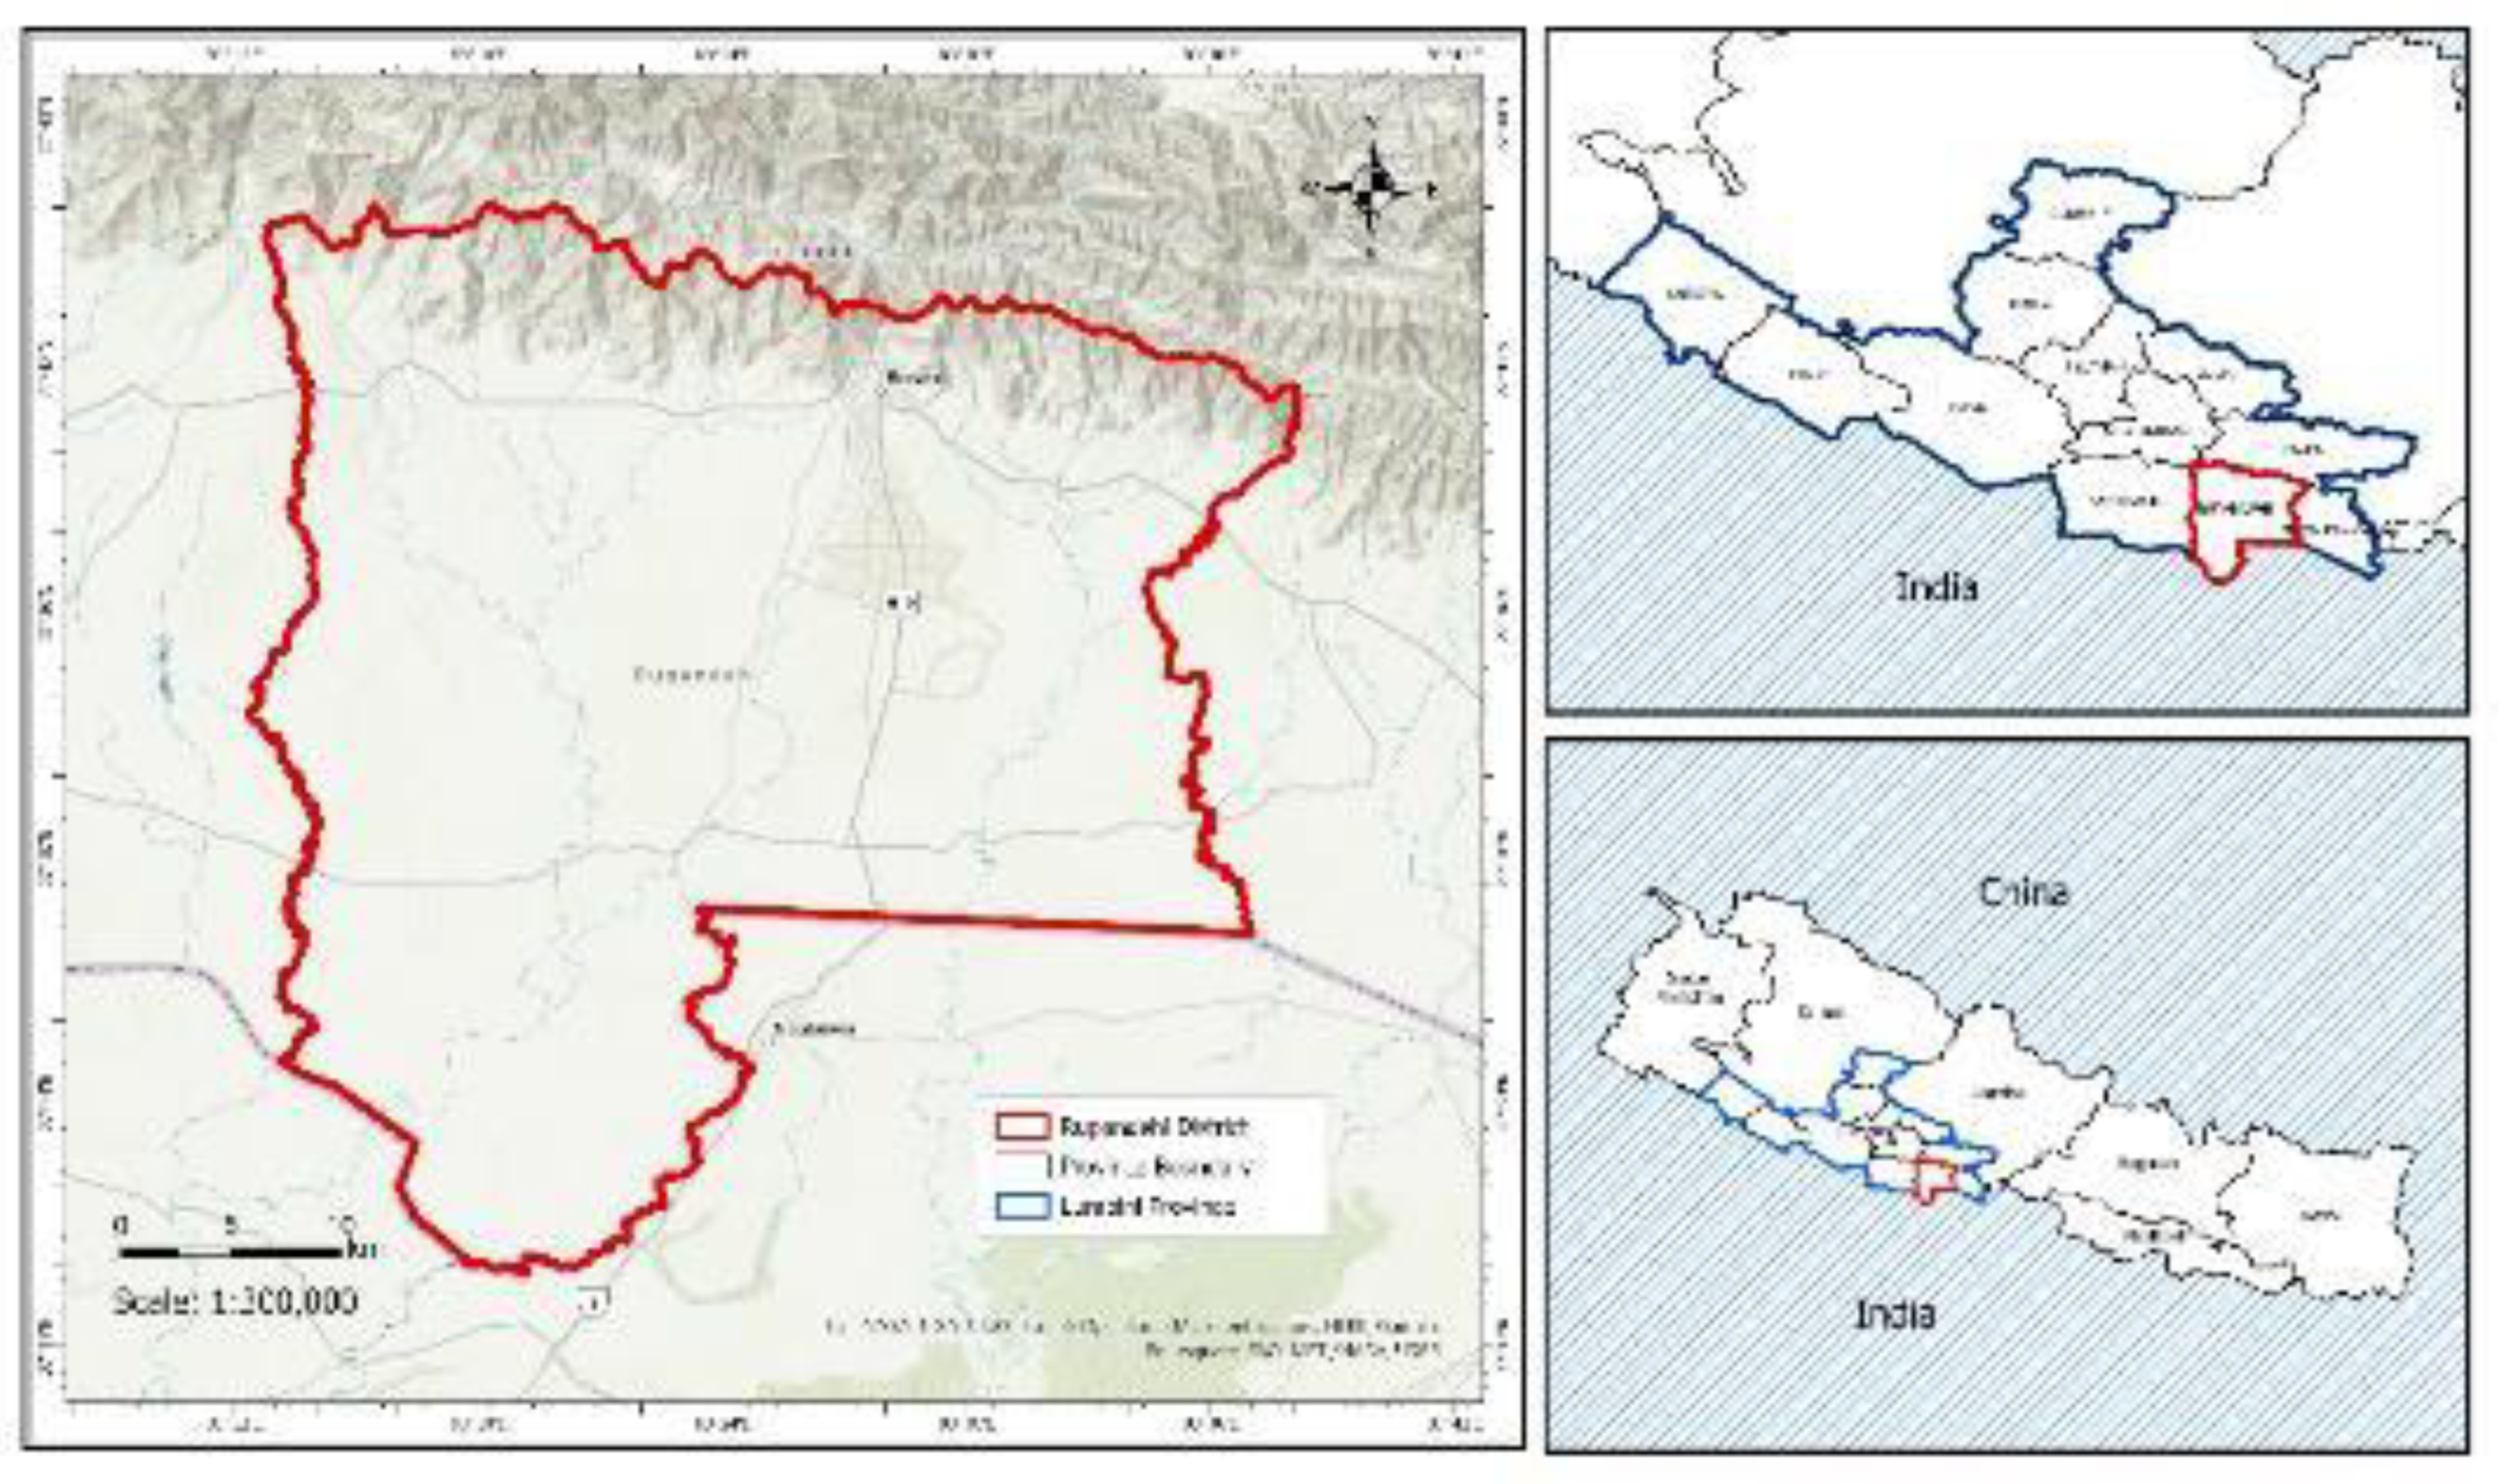
Figure 2.
Hierarchy and threshold of spectral indices for land use land cover classification.
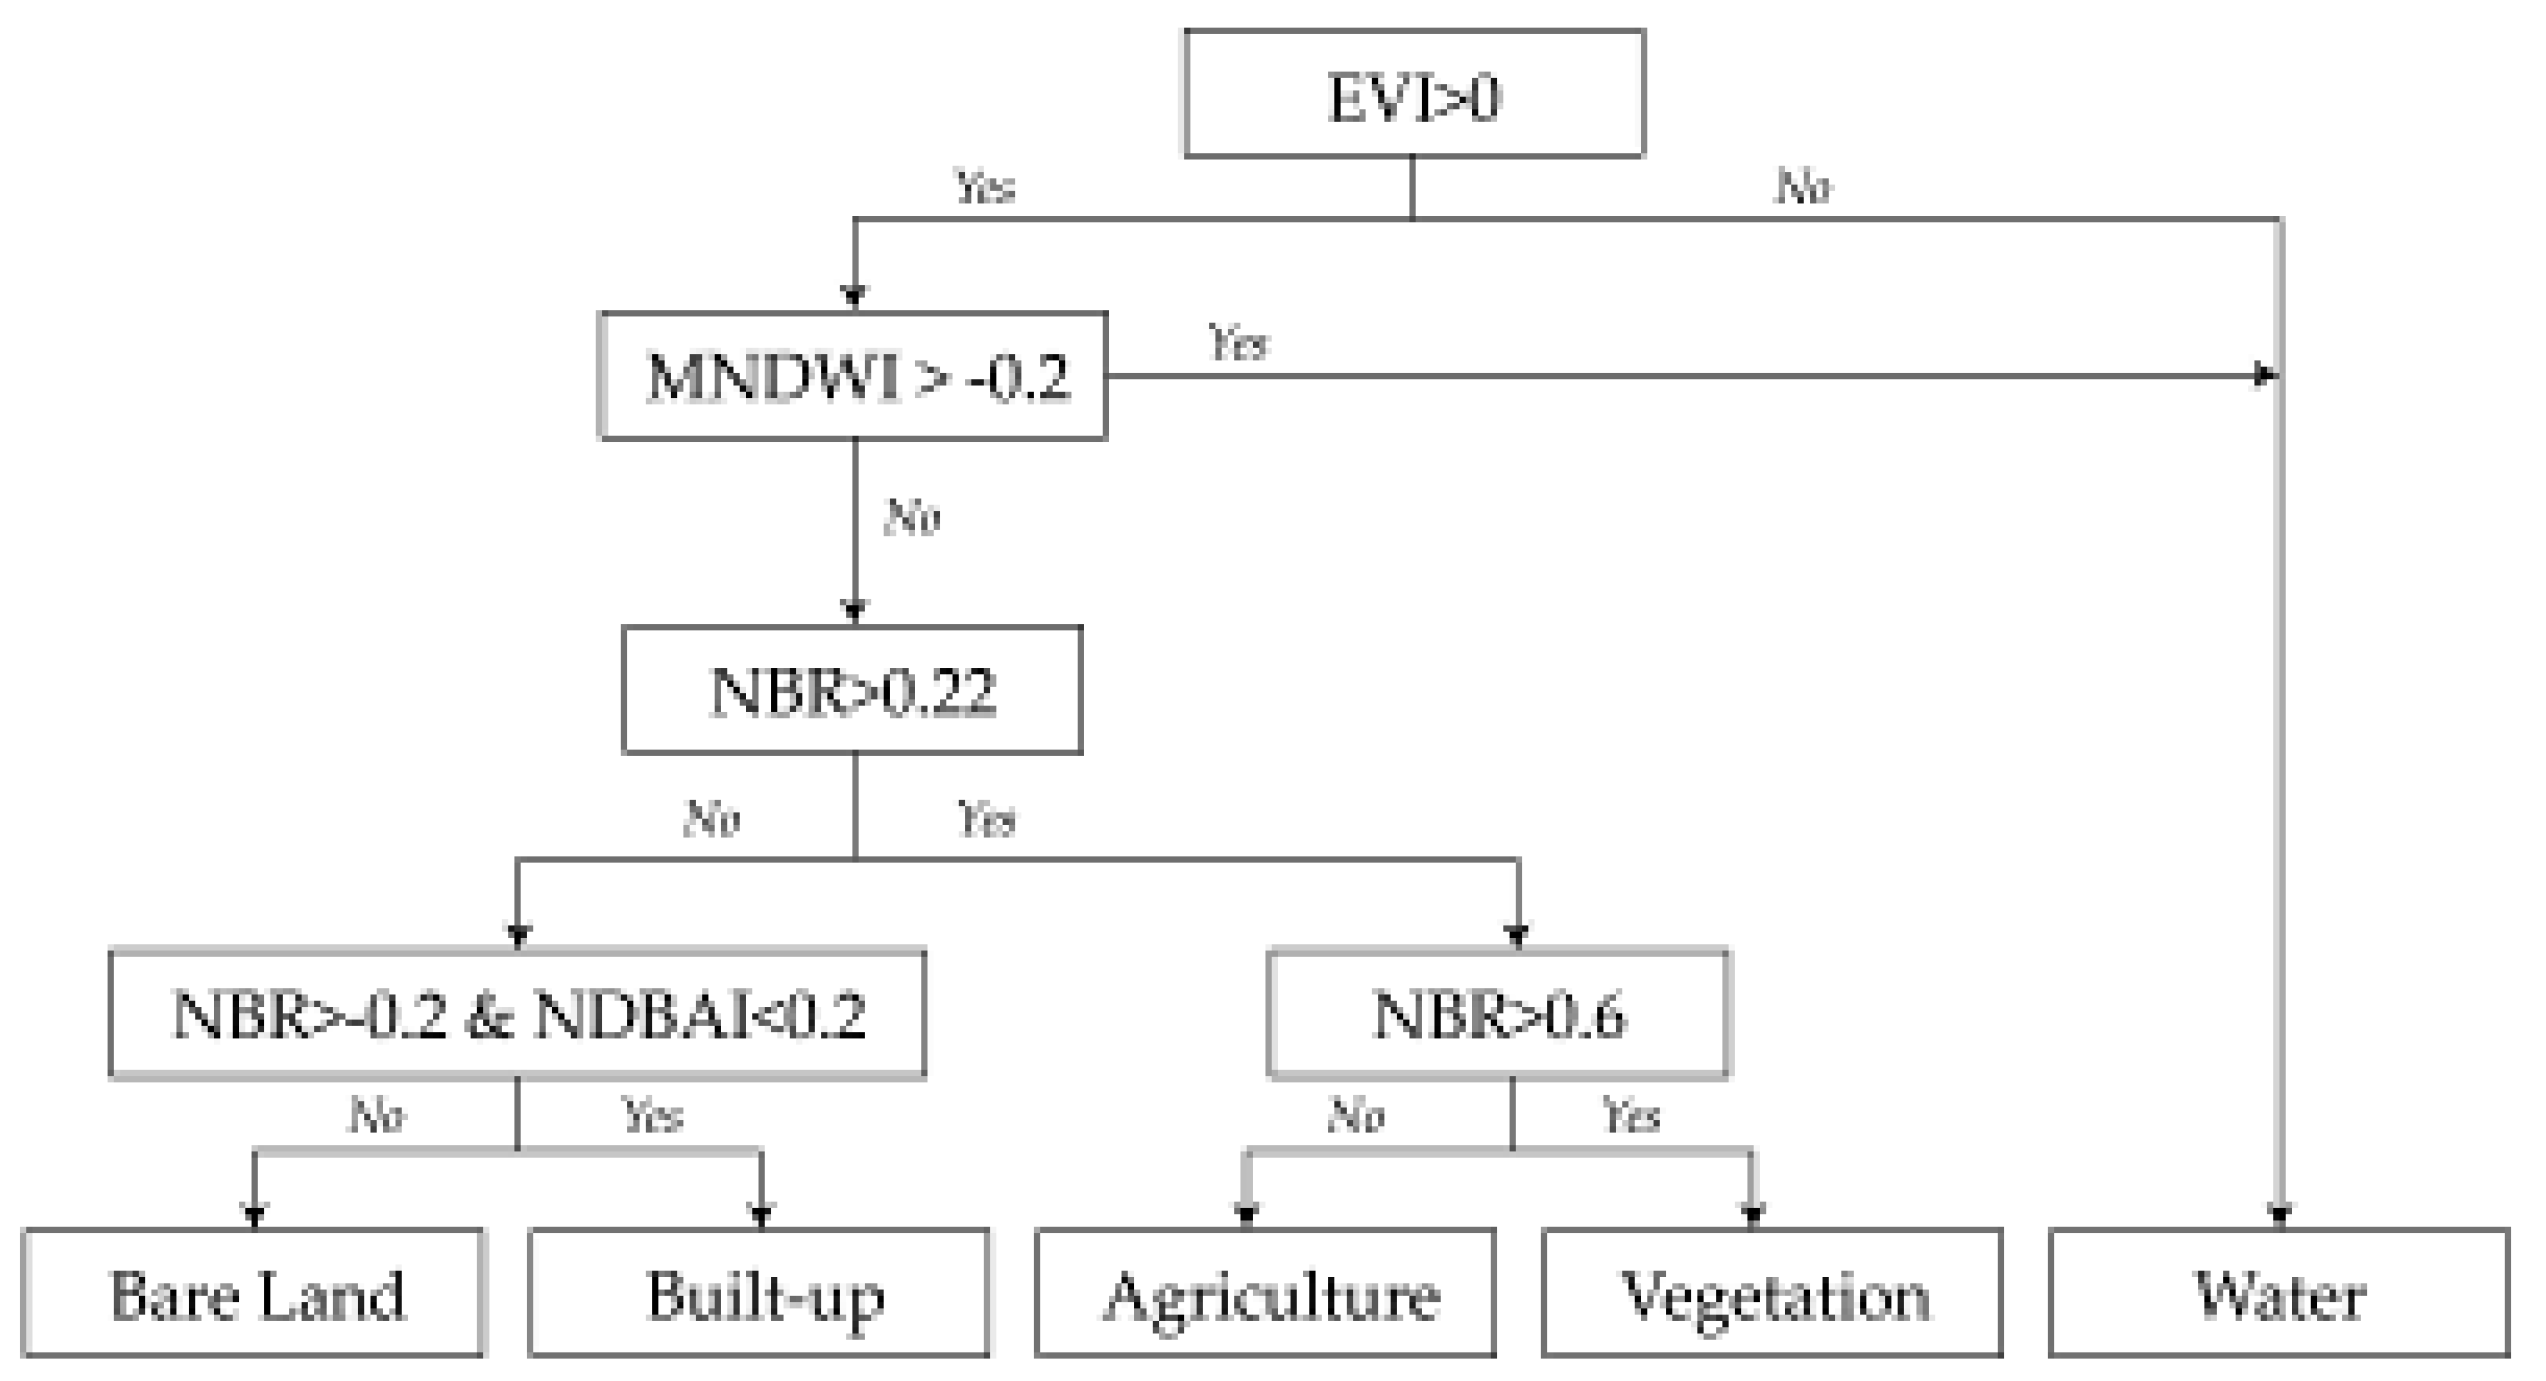
Figure 3.
Spatial and Temporal Distribution of Indicators: (a,b,c,d) NDVI from 1993 -2023, (e,f,g,h) WET from 1993 -2023, (i,j,k,l) LST from 1993 -2023, (m,n,o,p) NDBSI from 1993 -2023.
Figure 3.
Spatial and Temporal Distribution of Indicators: (a,b,c,d) NDVI from 1993 -2023, (e,f,g,h) WET from 1993 -2023, (i,j,k,l) LST from 1993 -2023, (m,n,o,p) NDBSI from 1993 -2023.
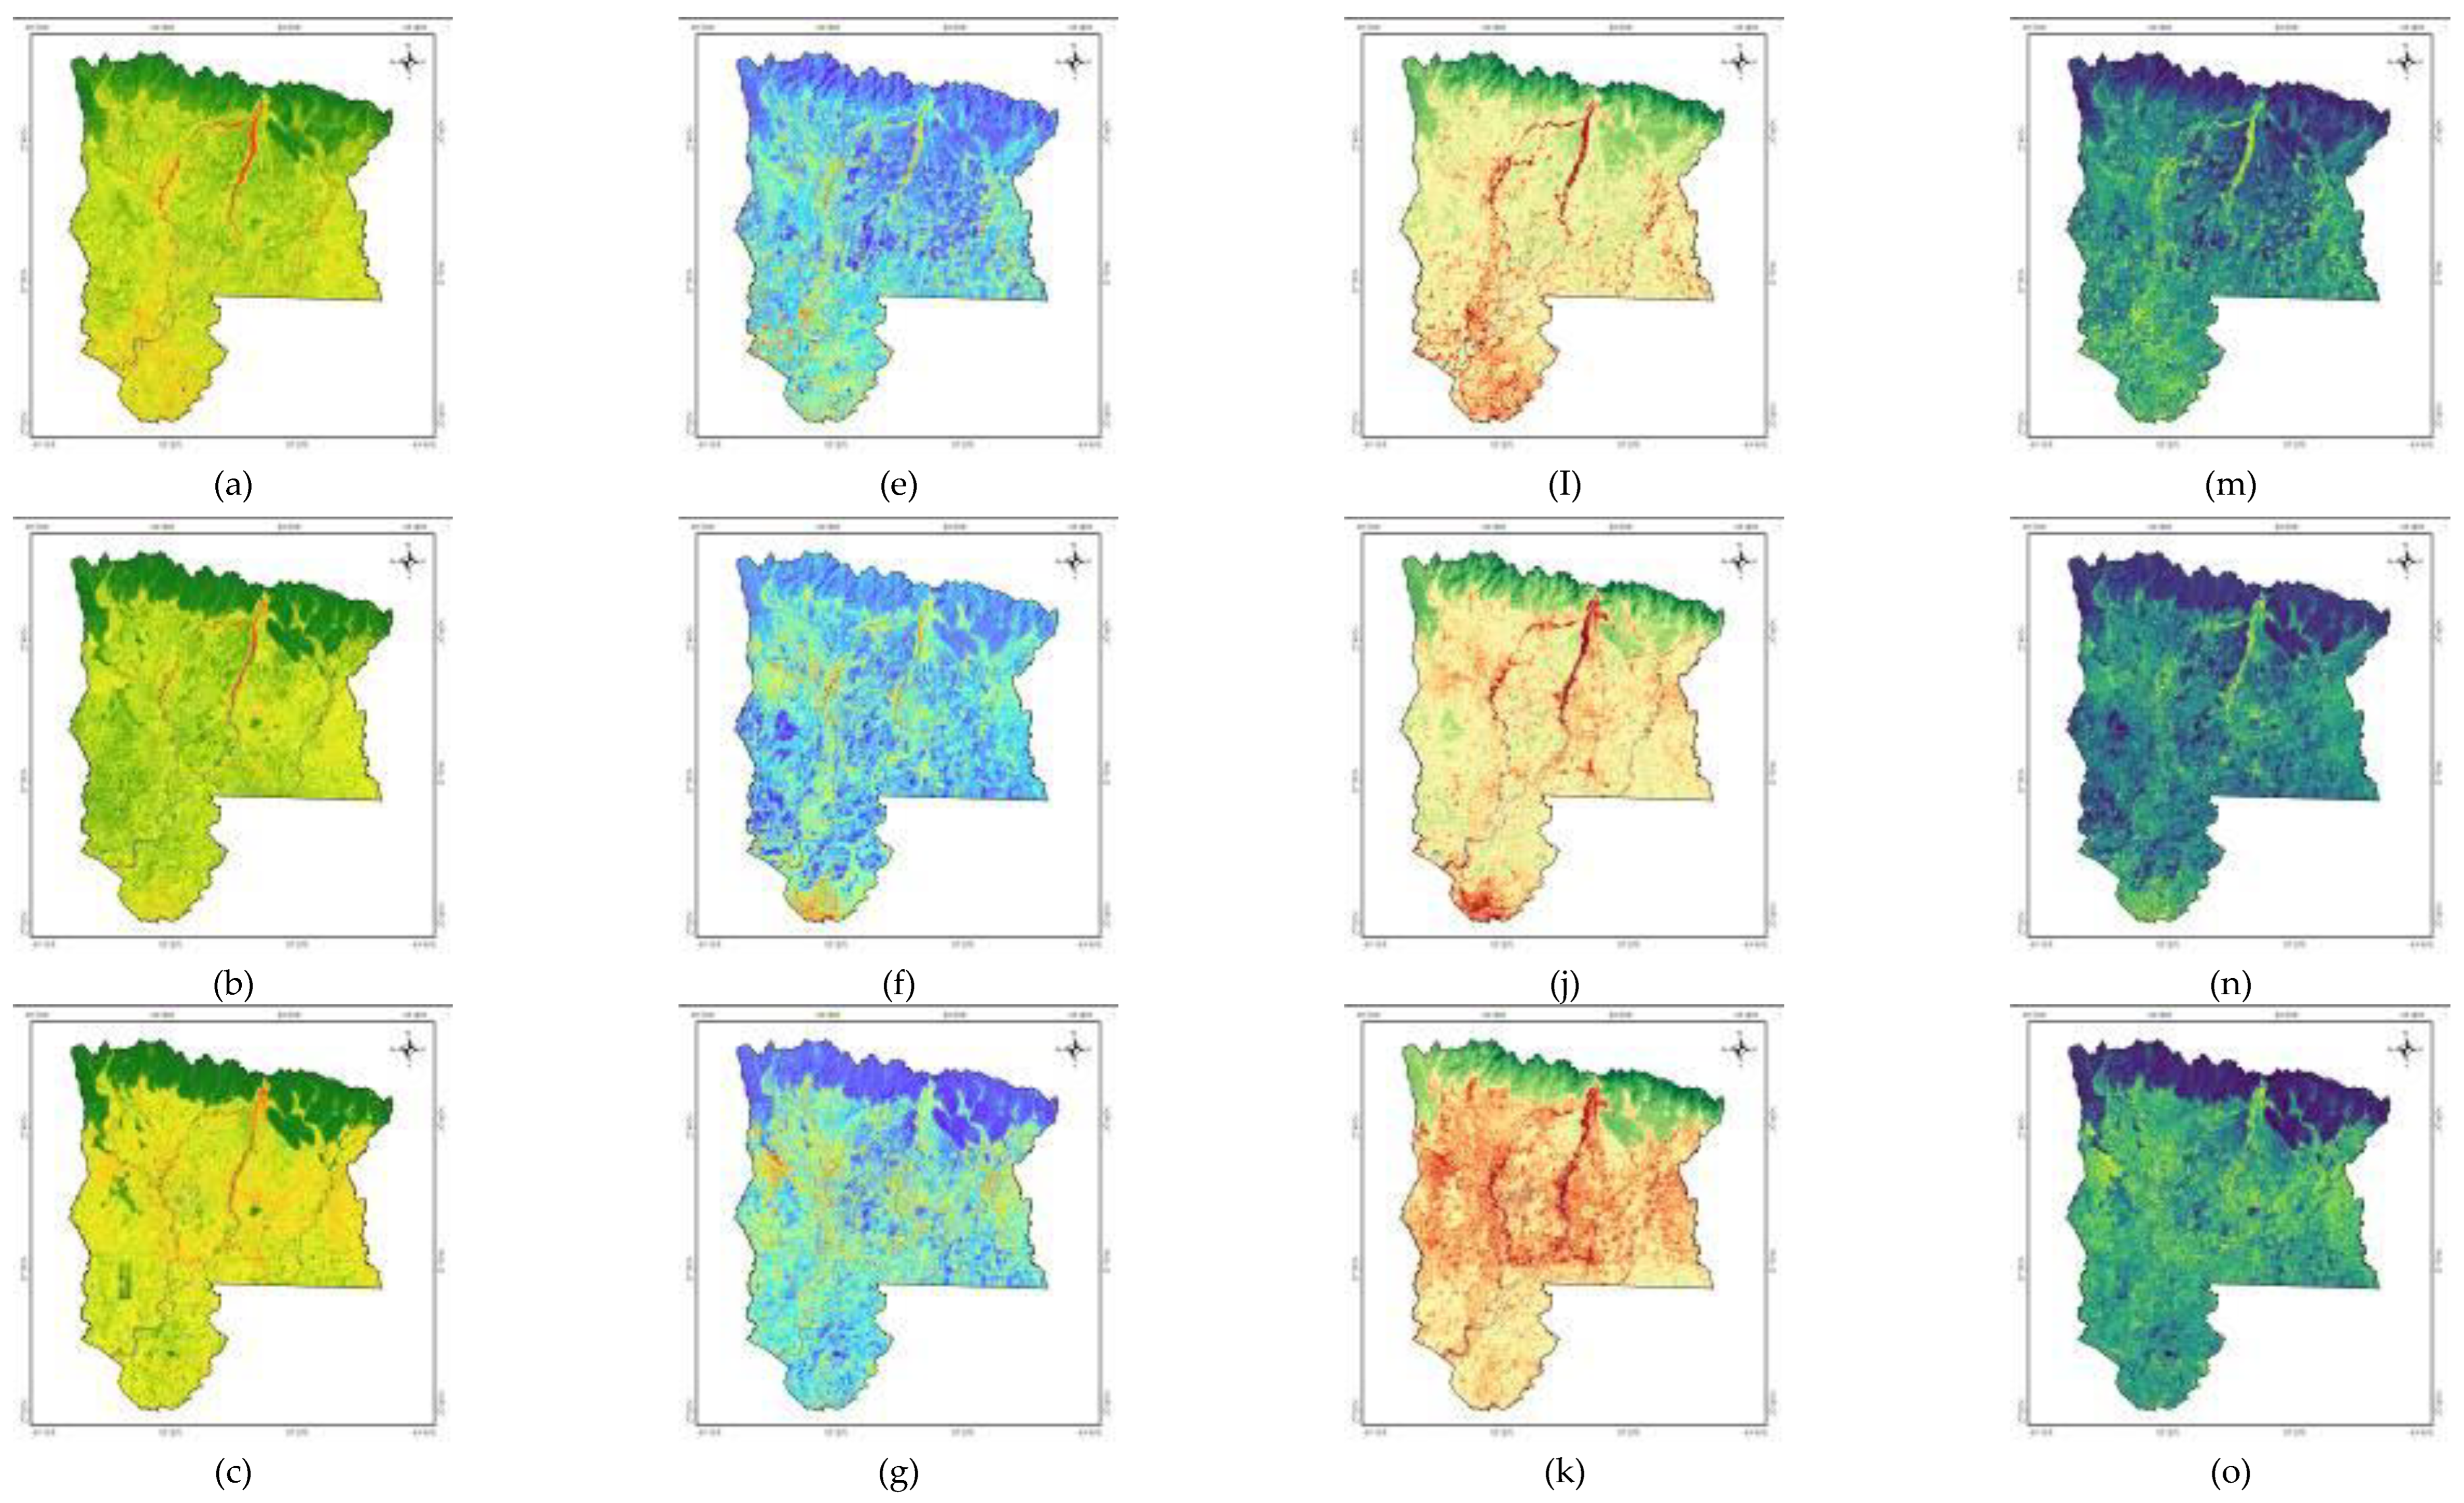
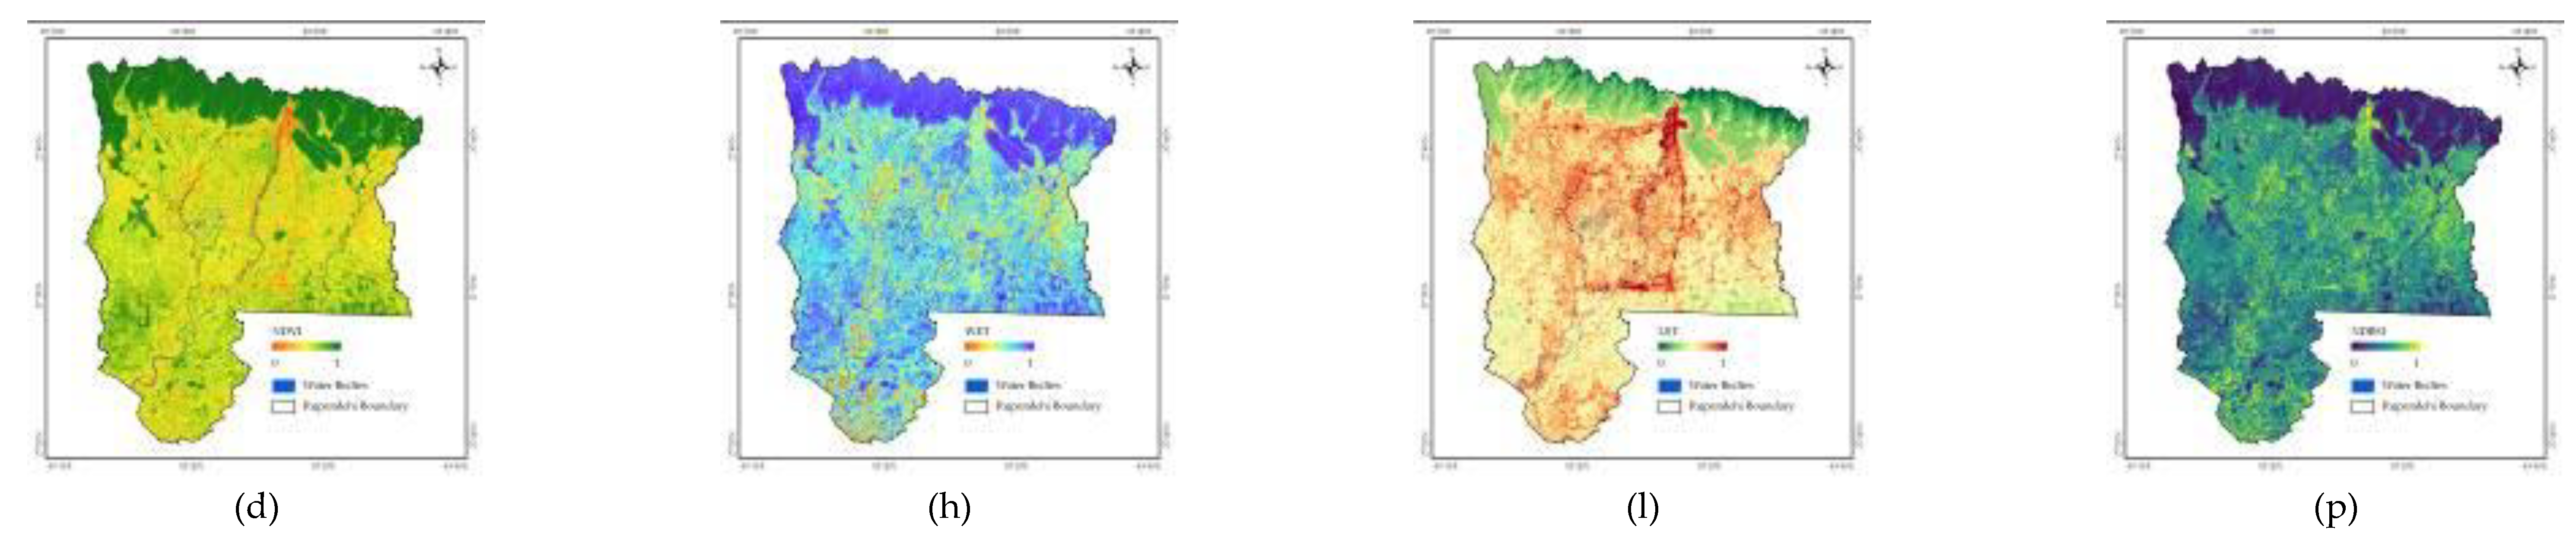
Figure 4.
Spatial Distribution of RSEI (a) 1993; (b) 2004, (c) 2013; (d) 2023.
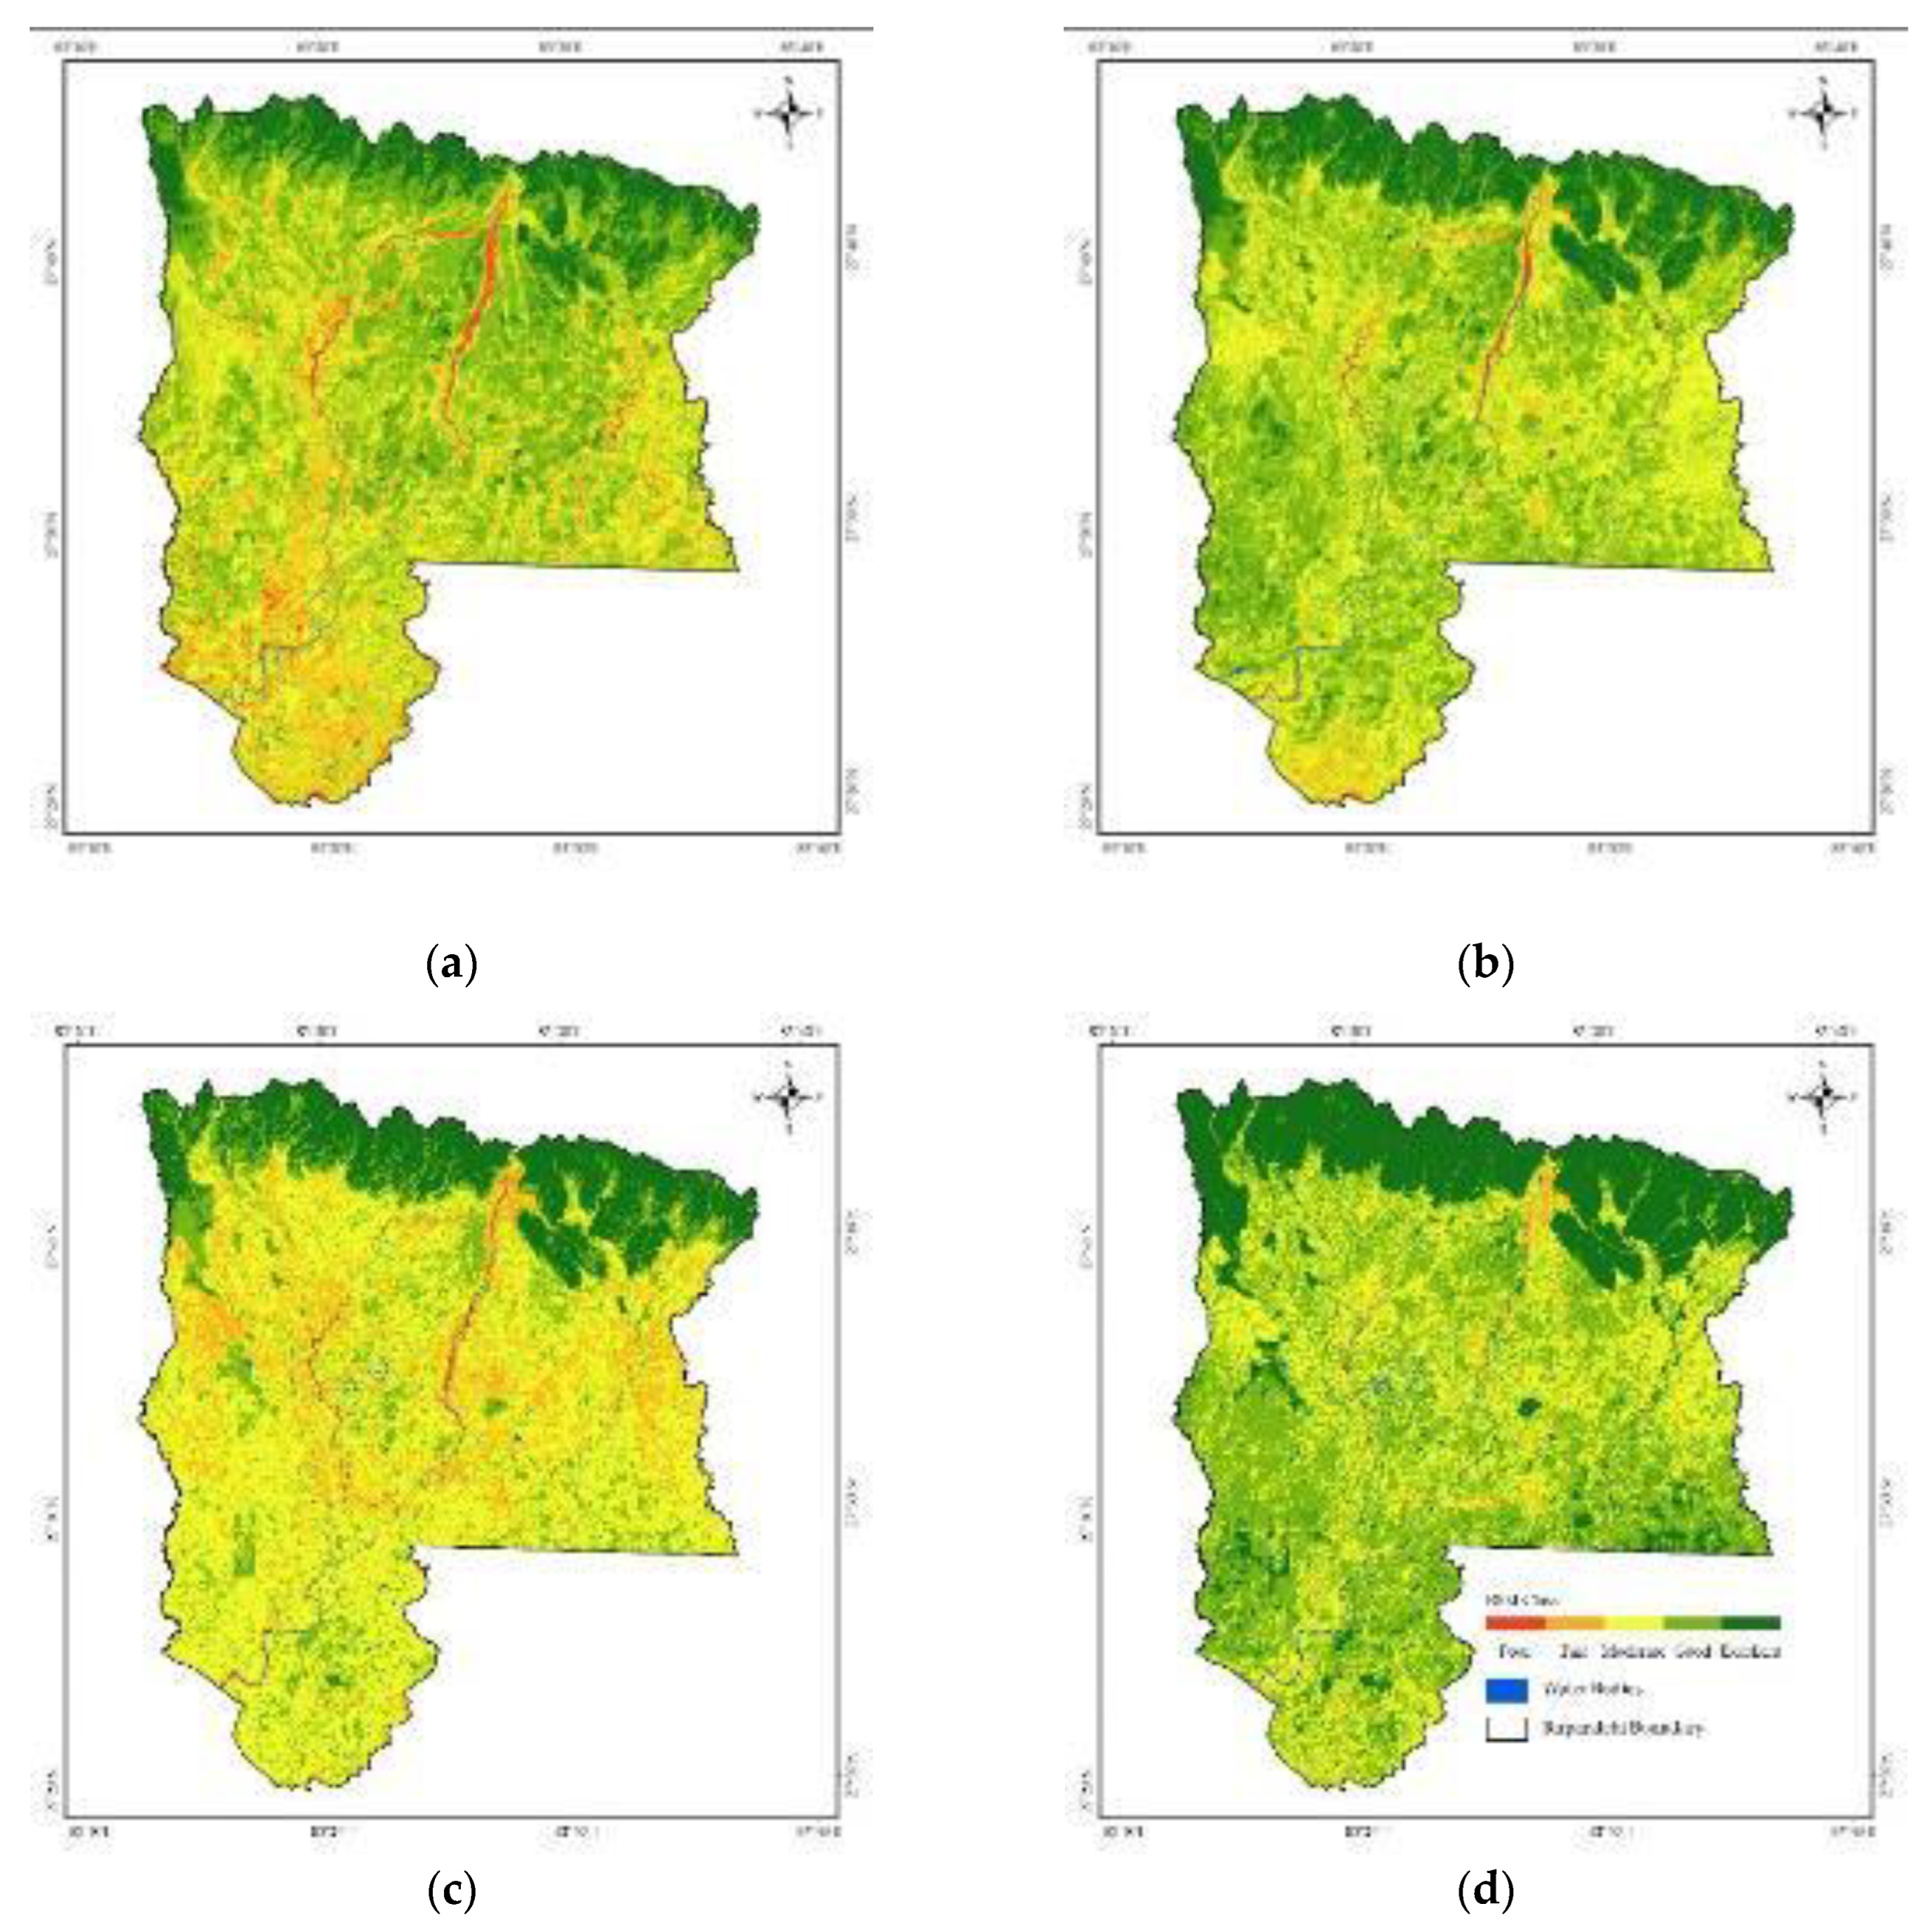
Figure 6.
Time series of average indicator value and RSEI.
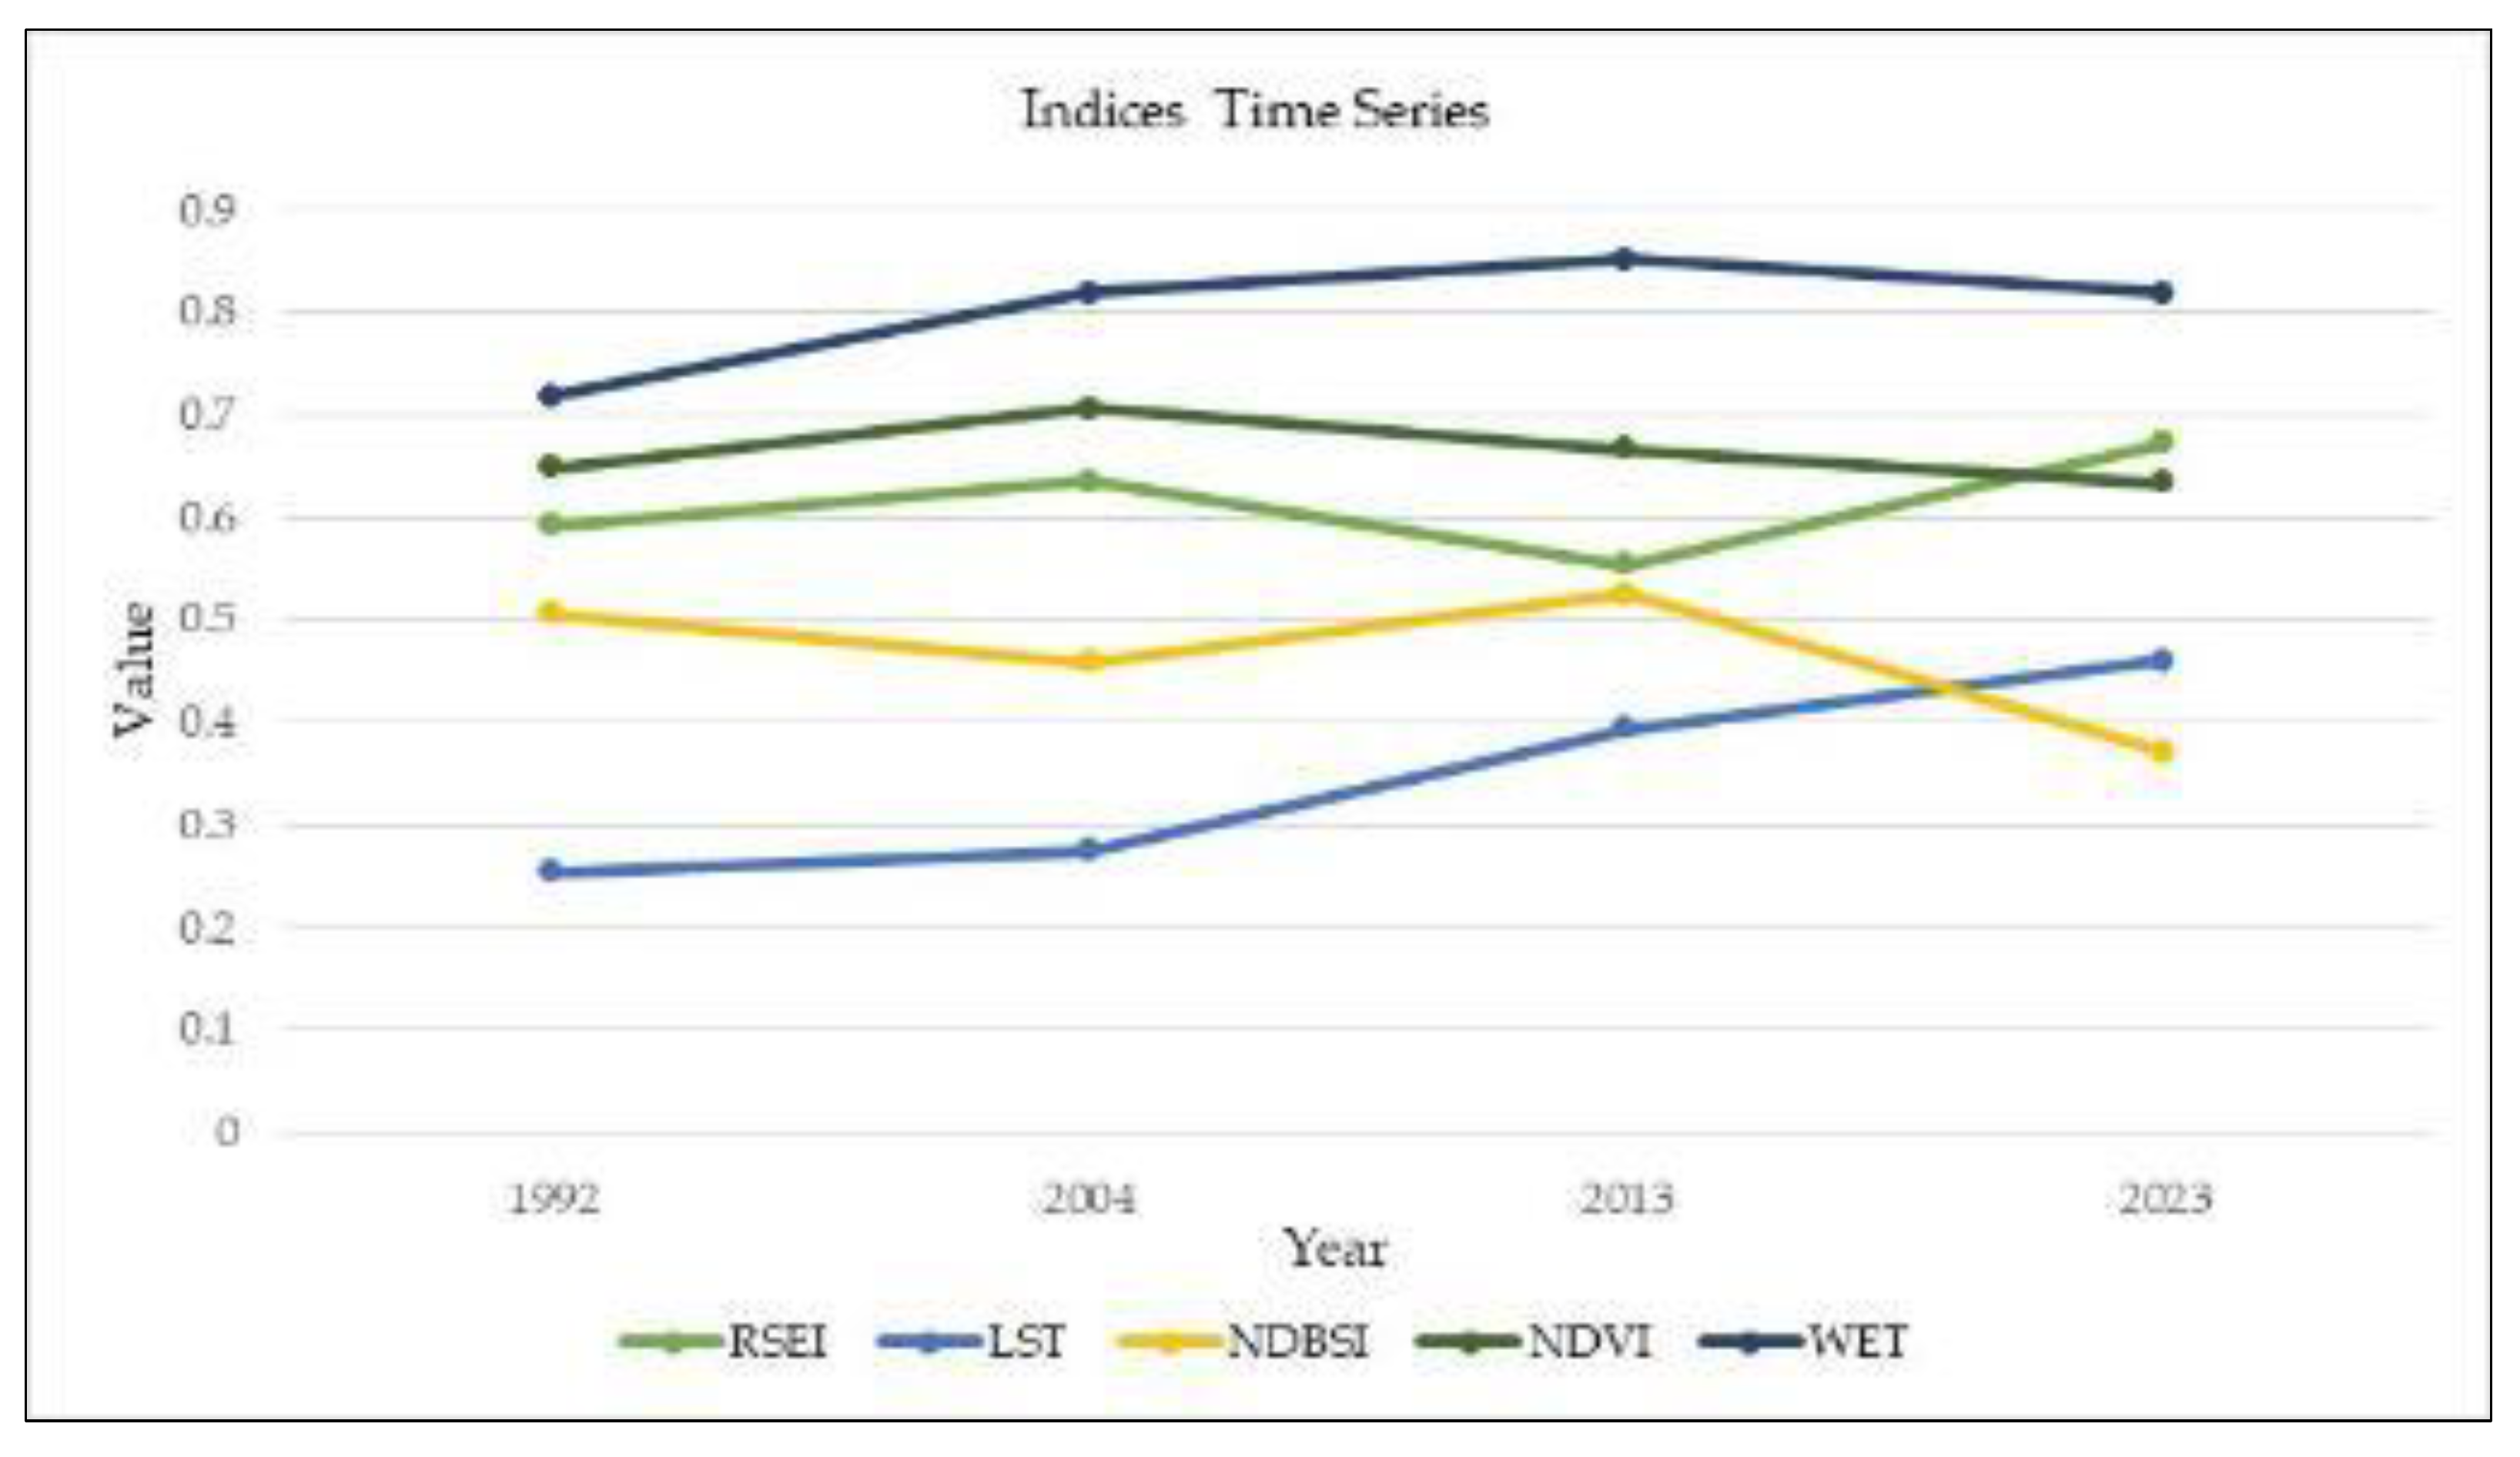
Figure 7.
Eco-Environmental Quality Change Distribution: (a) 1993-2004; (b) 2004-2013; (c) 2013-2023.
Figure 7.
Eco-Environmental Quality Change Distribution: (a) 1993-2004; (b) 2004-2013; (c) 2013-2023.
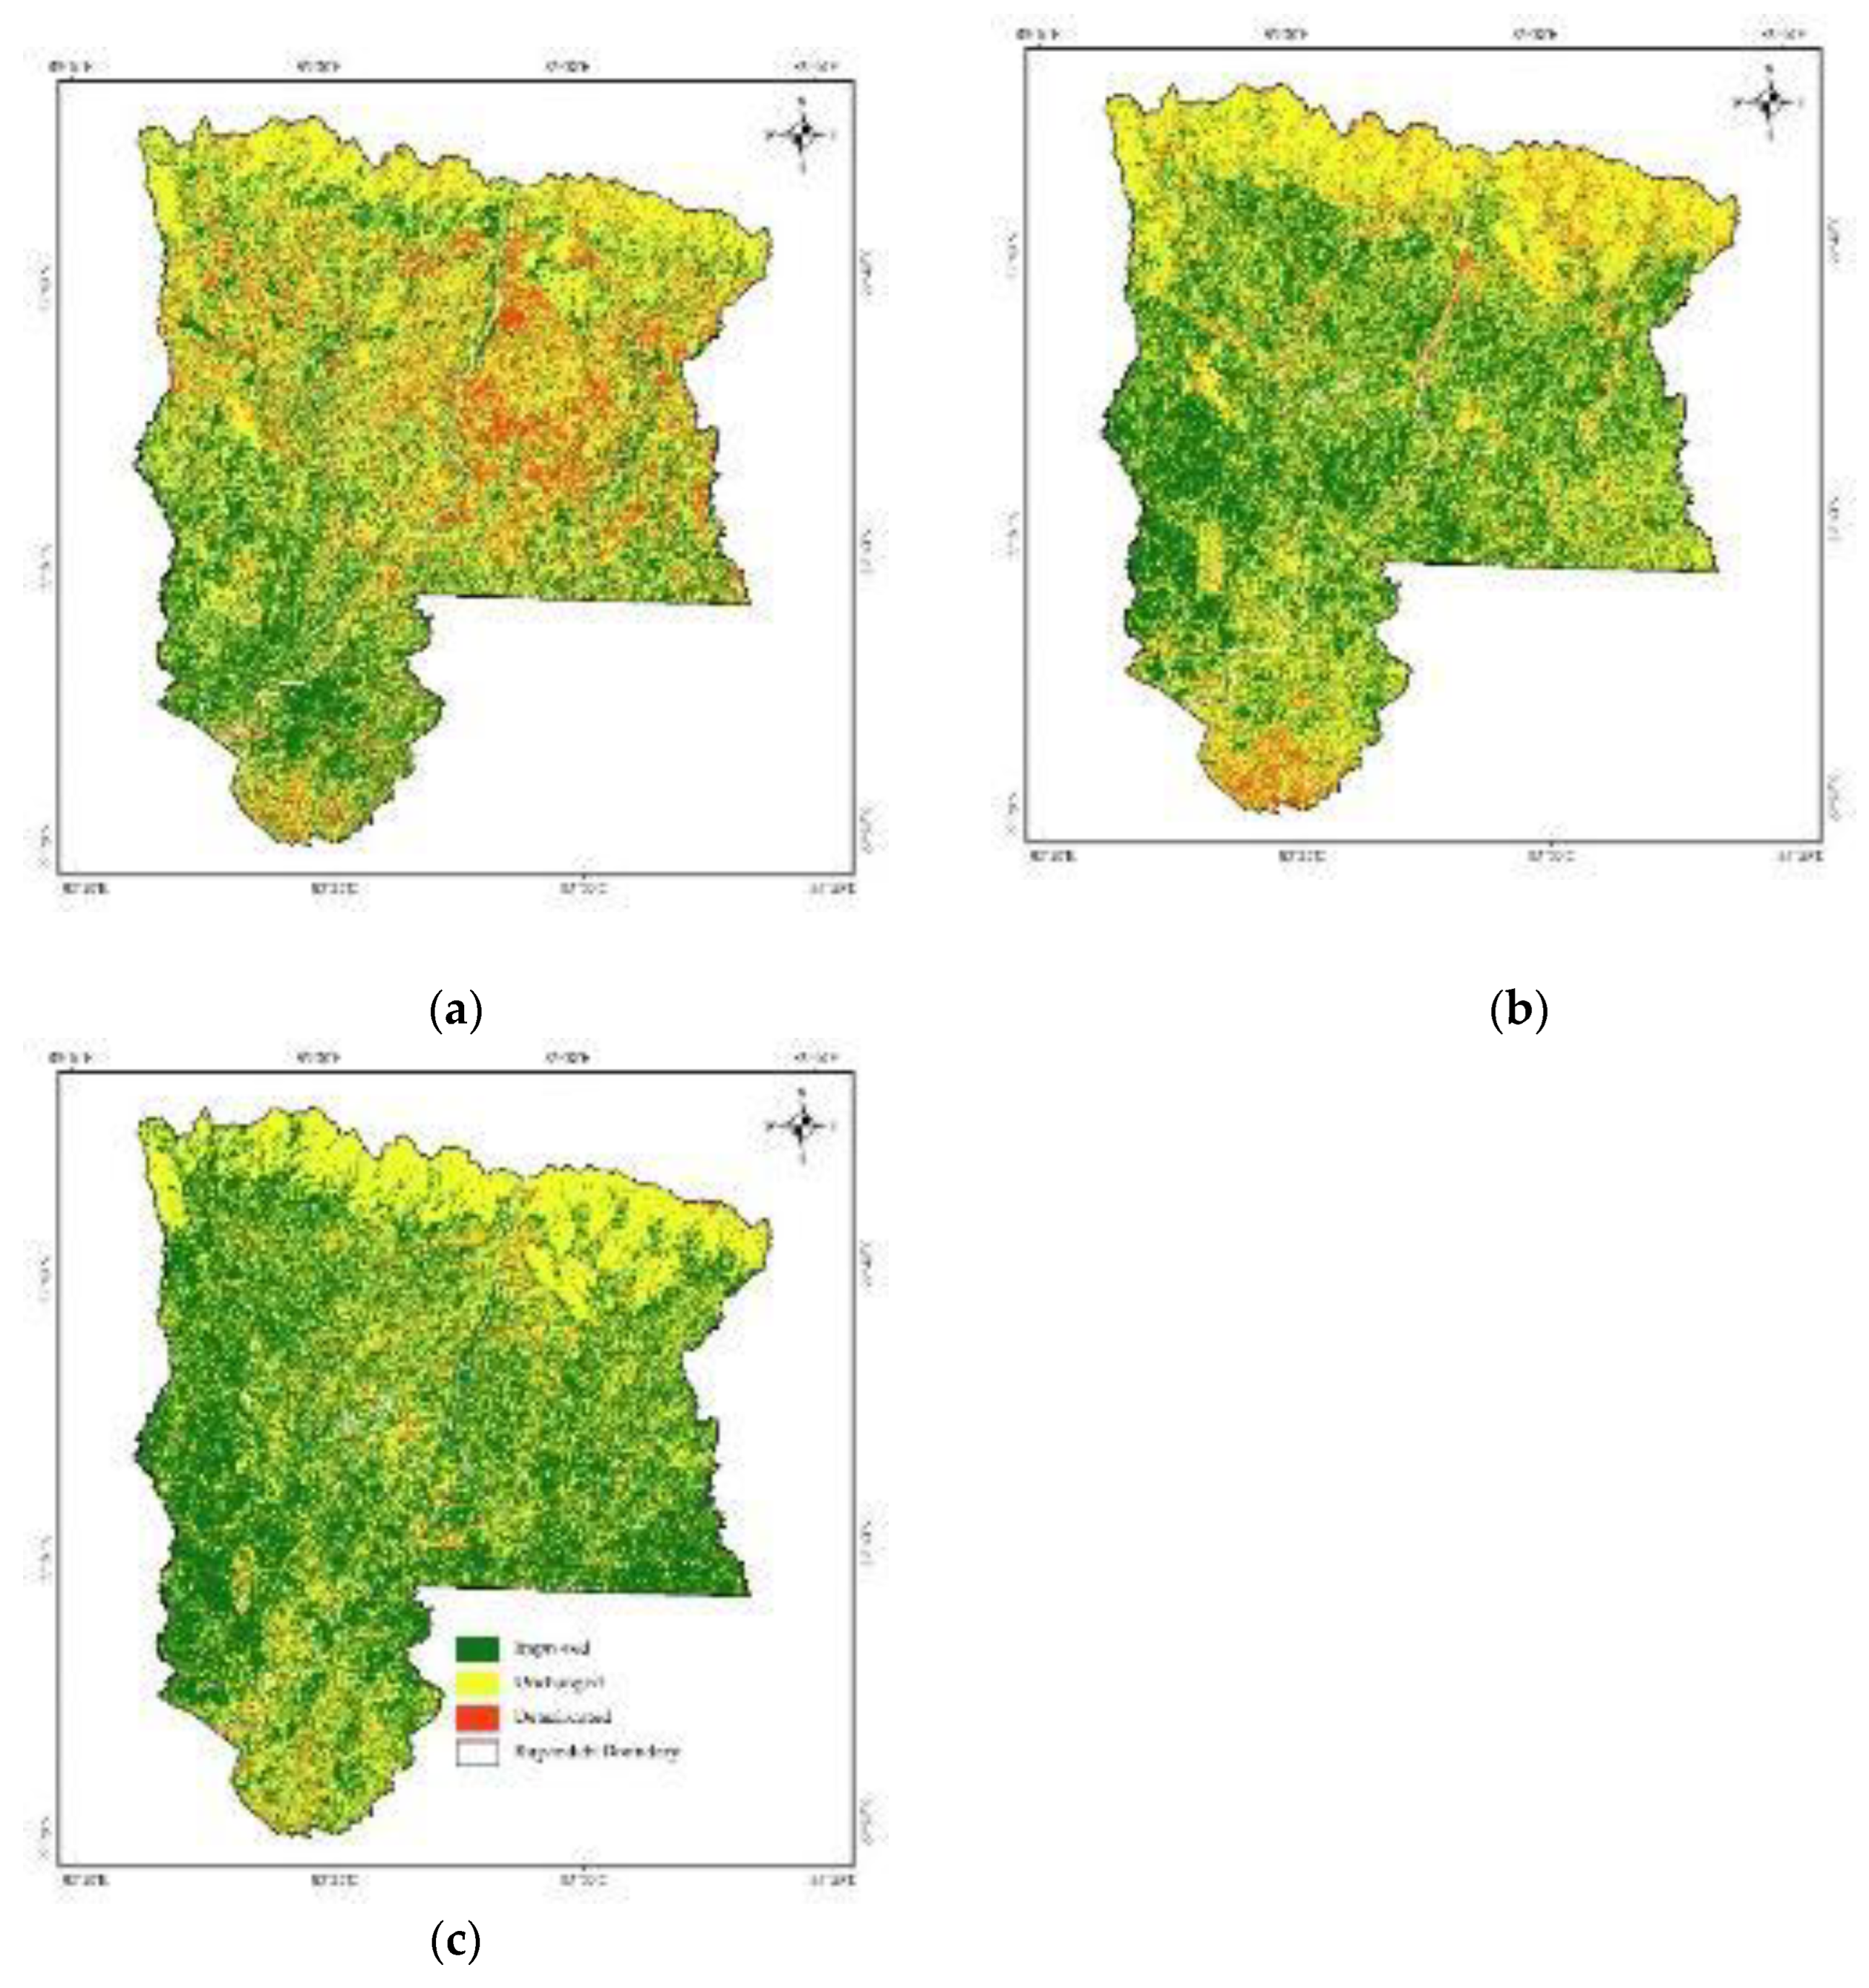
Figure 8.
Eco-environmental Quality Change Distribution: (a) 1993-2004; (b) 2004-2013; (c) 2013-2023.
Figure 8.
Eco-environmental Quality Change Distribution: (a) 1993-2004; (b) 2004-2013; (c) 2013-2023.
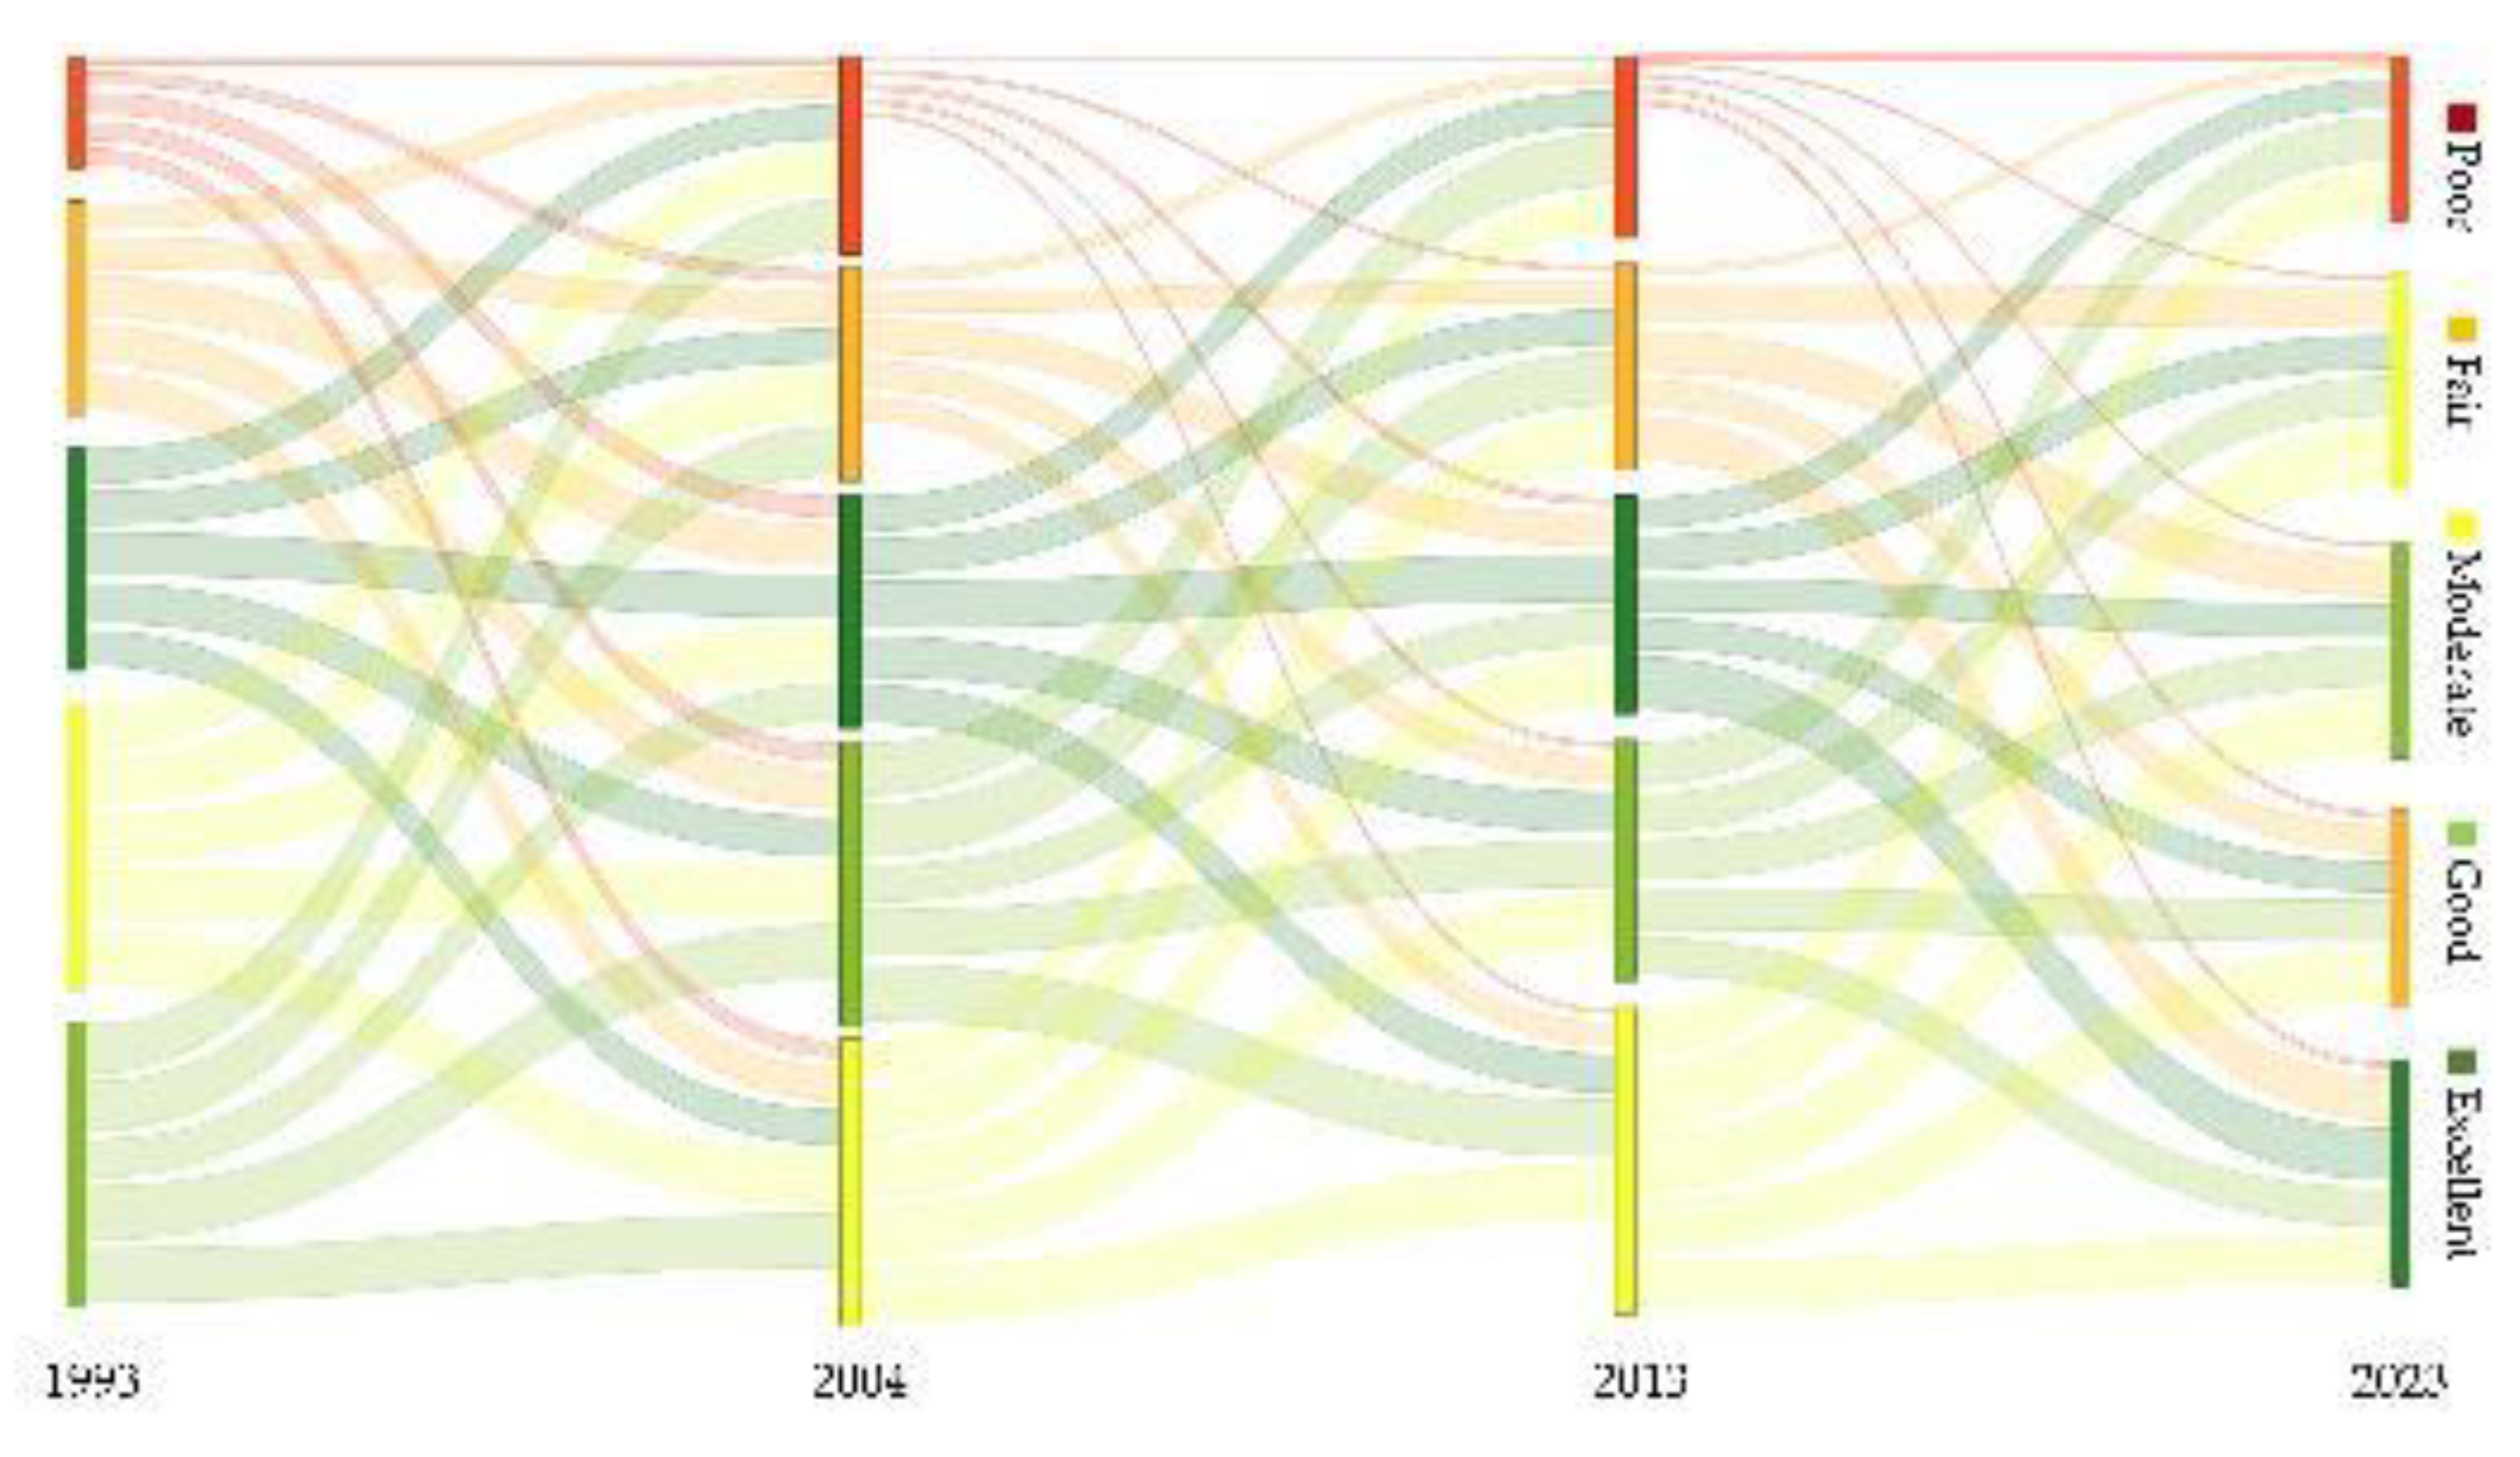
Figure 10.
LISA (local indicators of spatial autocorrelation) clustering map of RSEI in Rupandehi in 1993 (a), 2004 (b), 2013 (c) and 2024 (d).
Figure 10.
LISA (local indicators of spatial autocorrelation) clustering map of RSEI in Rupandehi in 1993 (a), 2004 (b), 2013 (c) and 2024 (d).
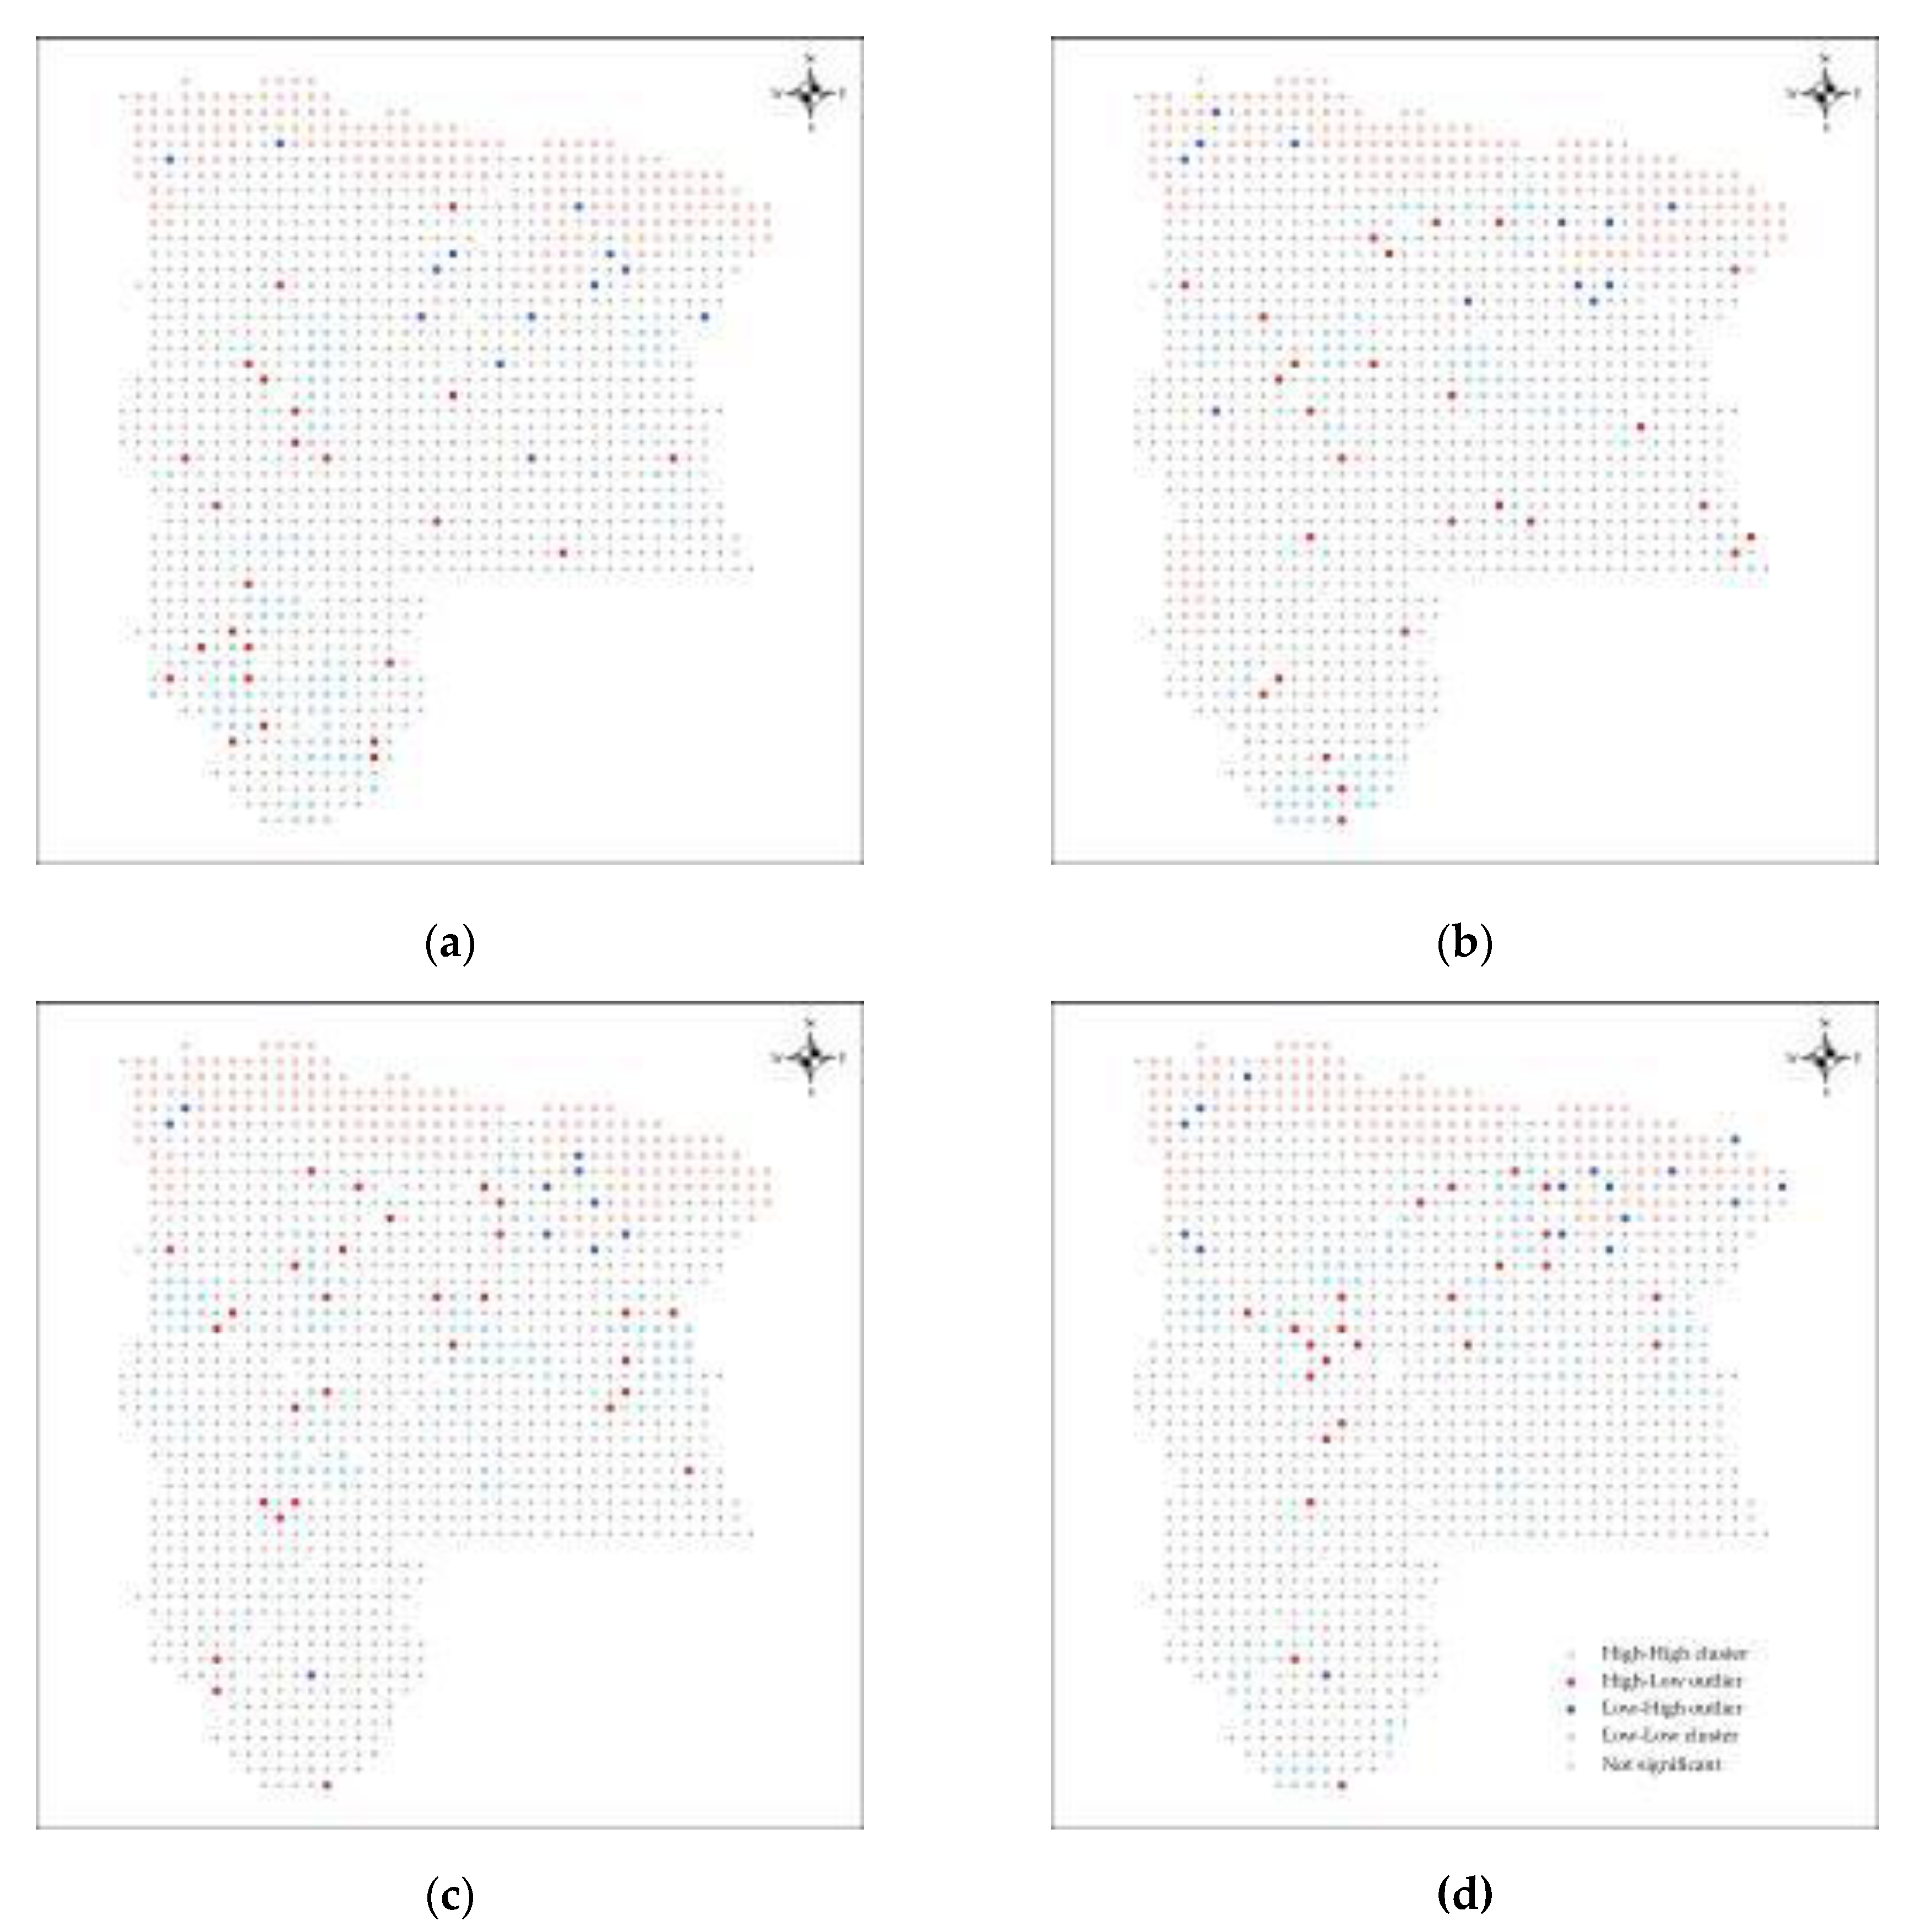
Figure 11.
Land Use Land Cover classification of Rupandehi district for the years (a) 1993; (b) 2004, (c) 2013; and (d) 2023.
Figure 11.
Land Use Land Cover classification of Rupandehi district for the years (a) 1993; (b) 2004, (c) 2013; and (d) 2023.
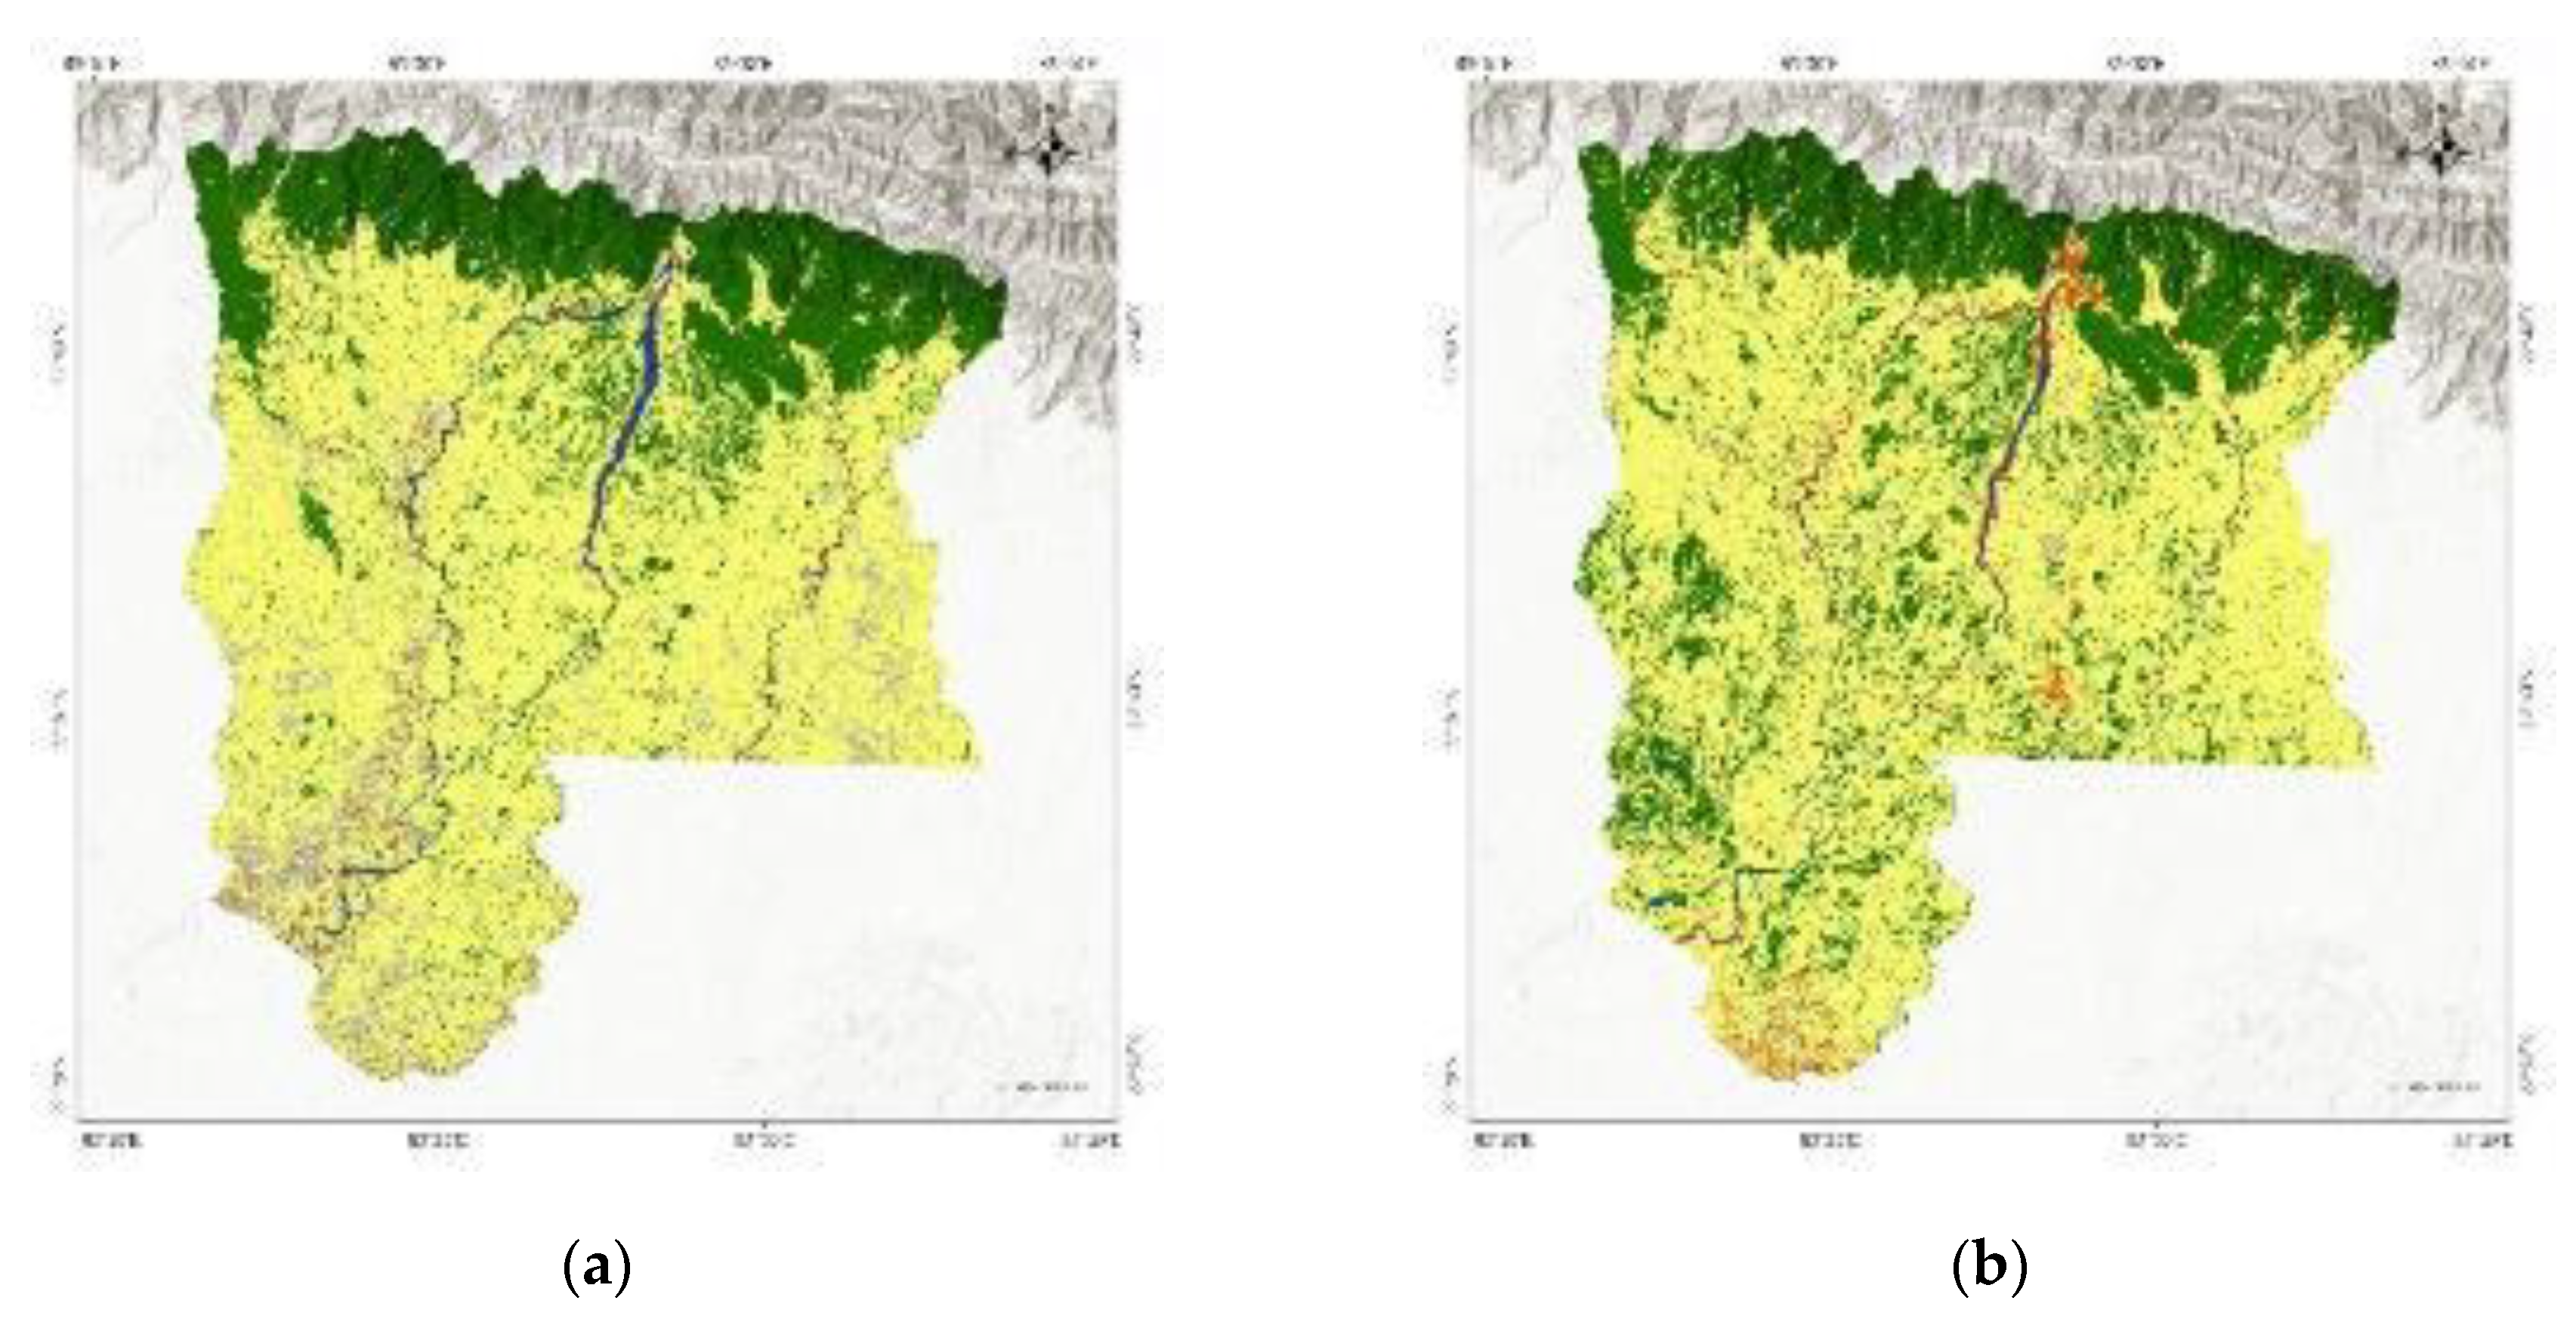
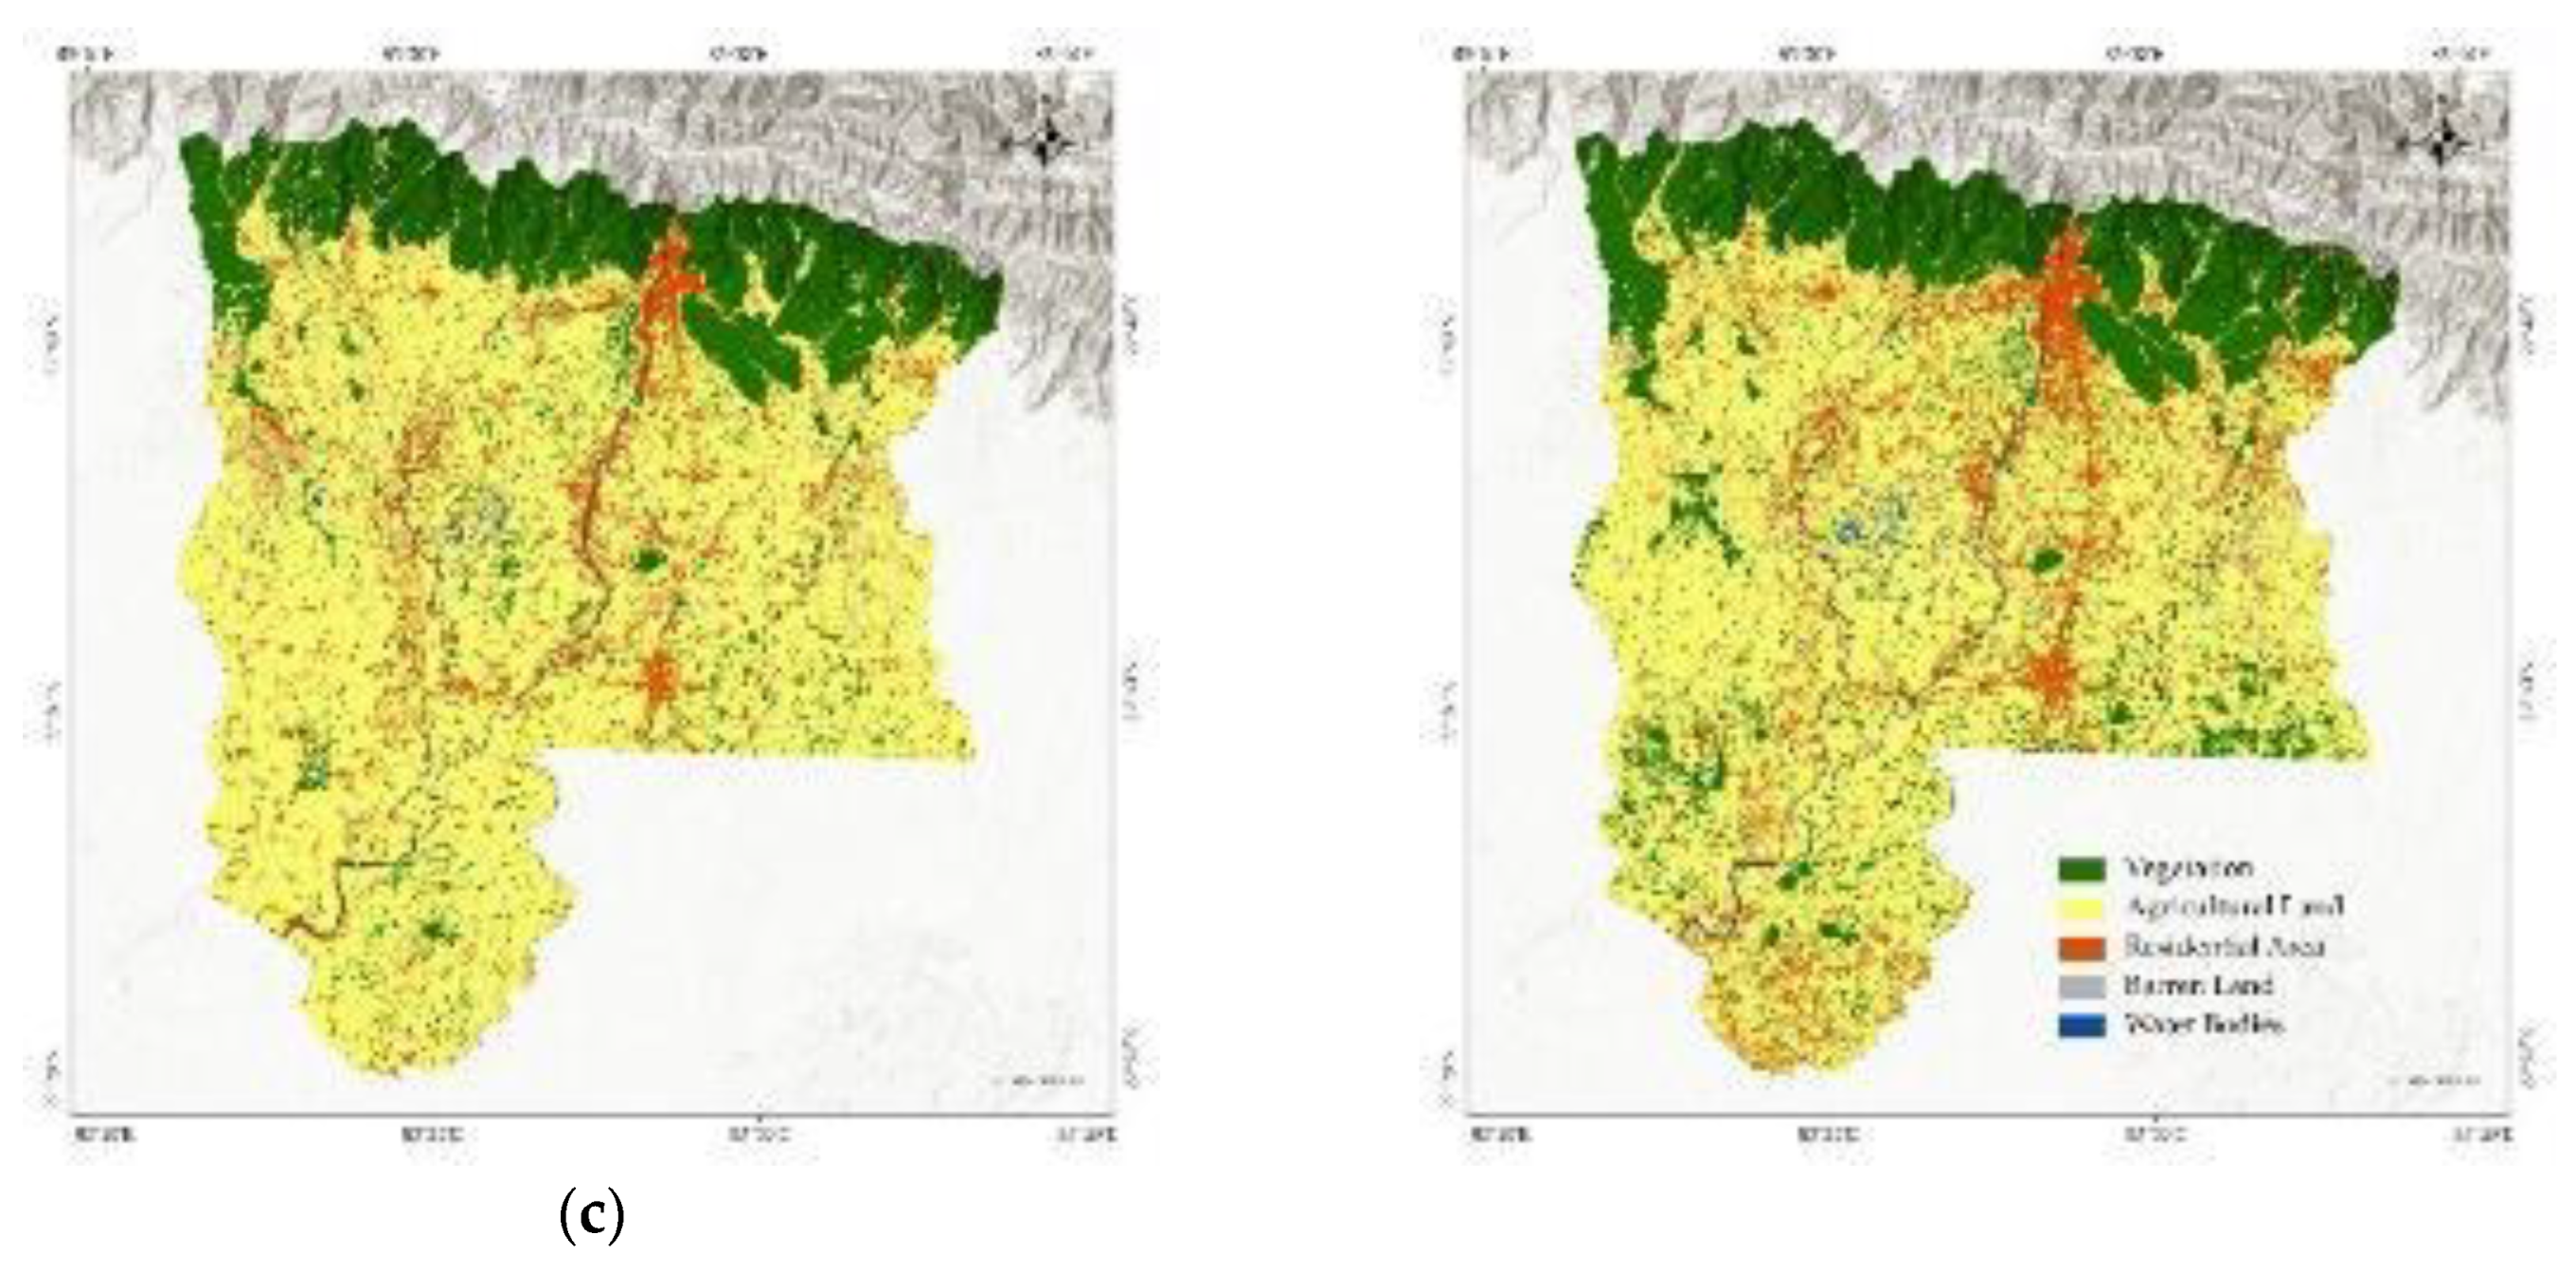
Figure 12.
Temporal change of Area of each LULC class from 1993 to 2023.
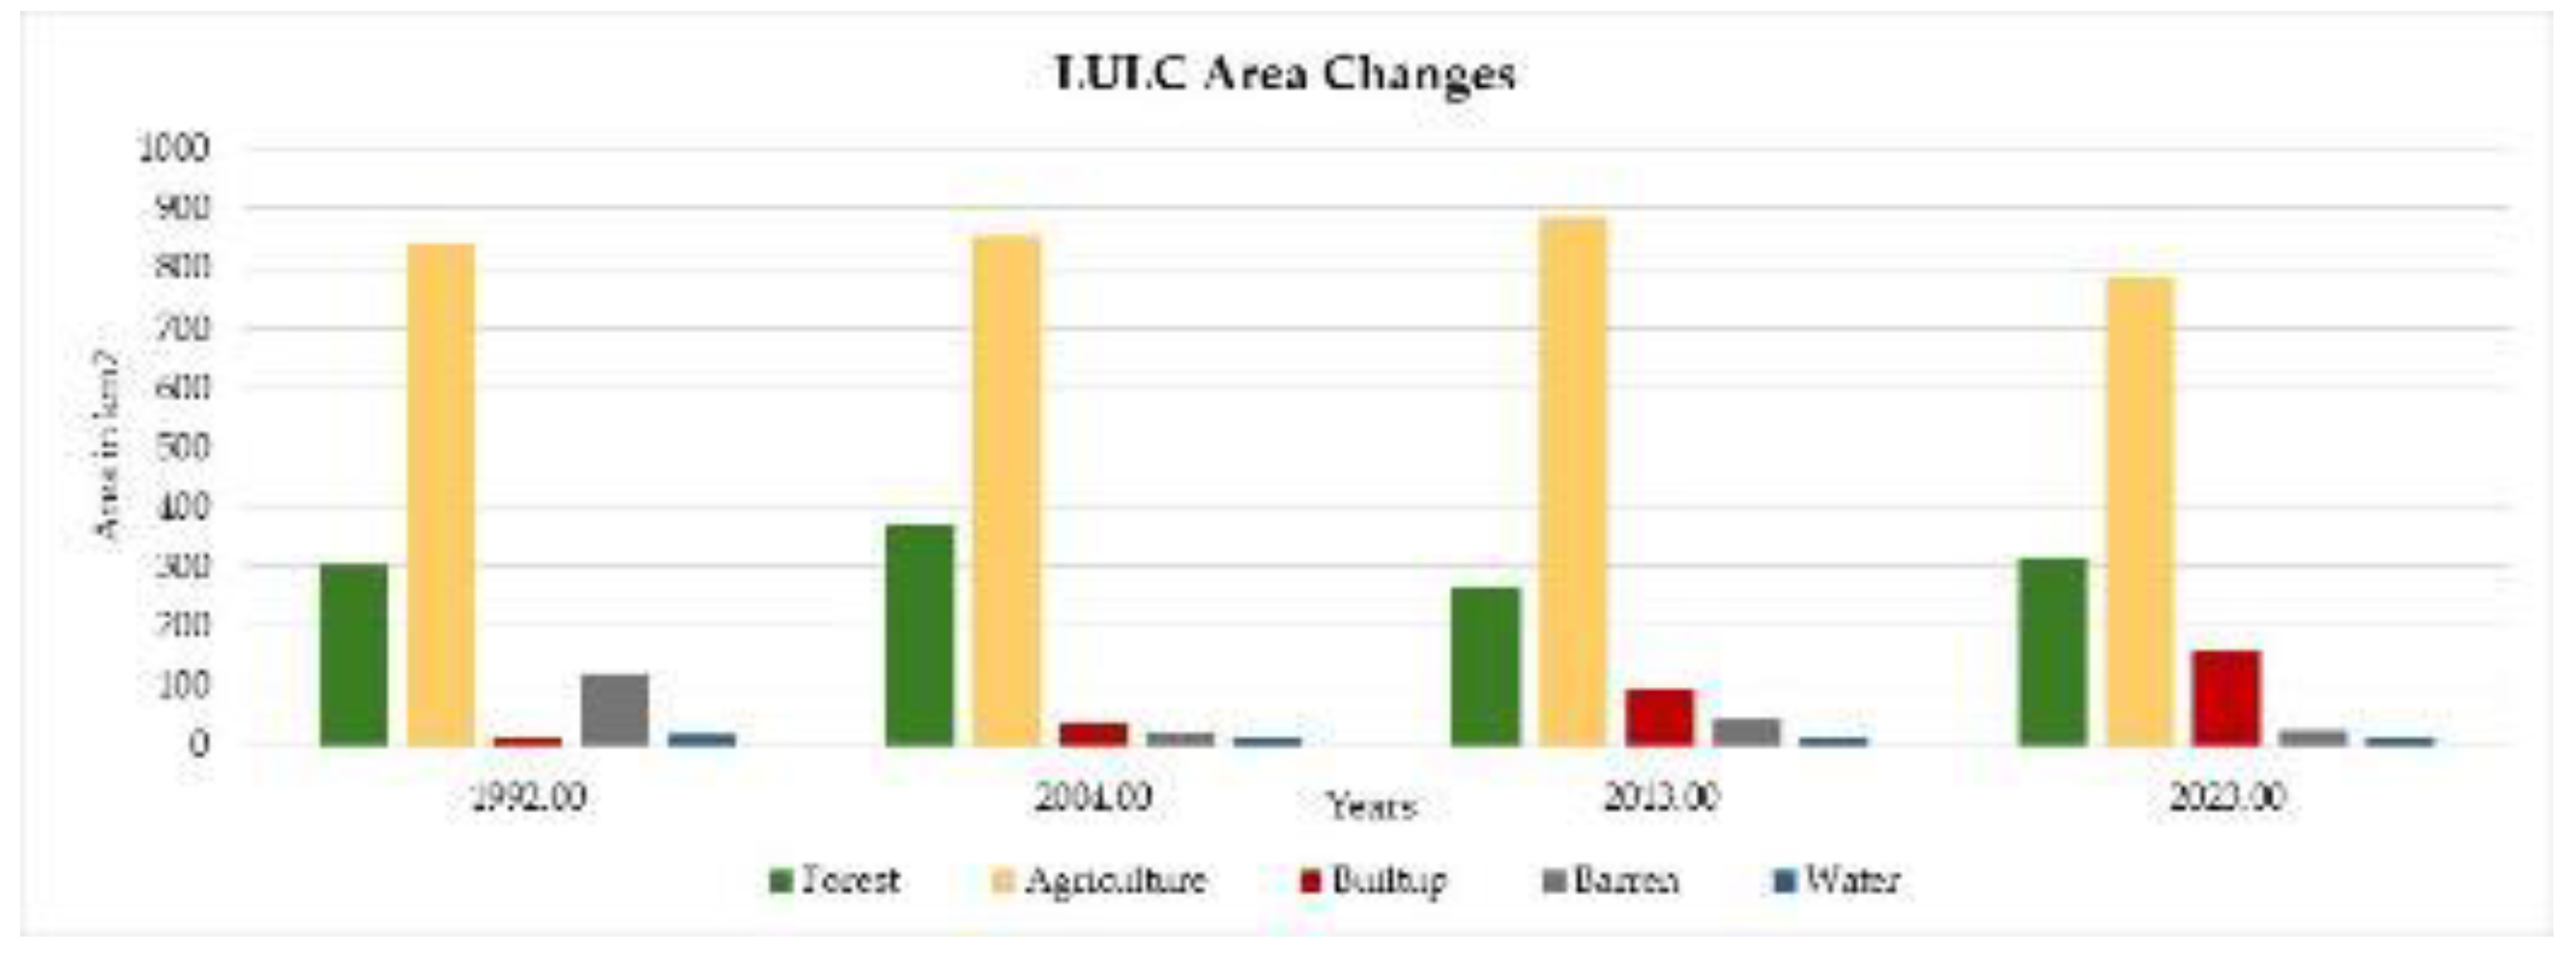
Figure 15.
Comparison of LULC, Satellite image and RSEI at Butwal for the year 2023 from top to bottom to see and validate the impact of LULC in RSEI.
Figure 15.
Comparison of LULC, Satellite image and RSEI at Butwal for the year 2023 from top to bottom to see and validate the impact of LULC in RSEI.
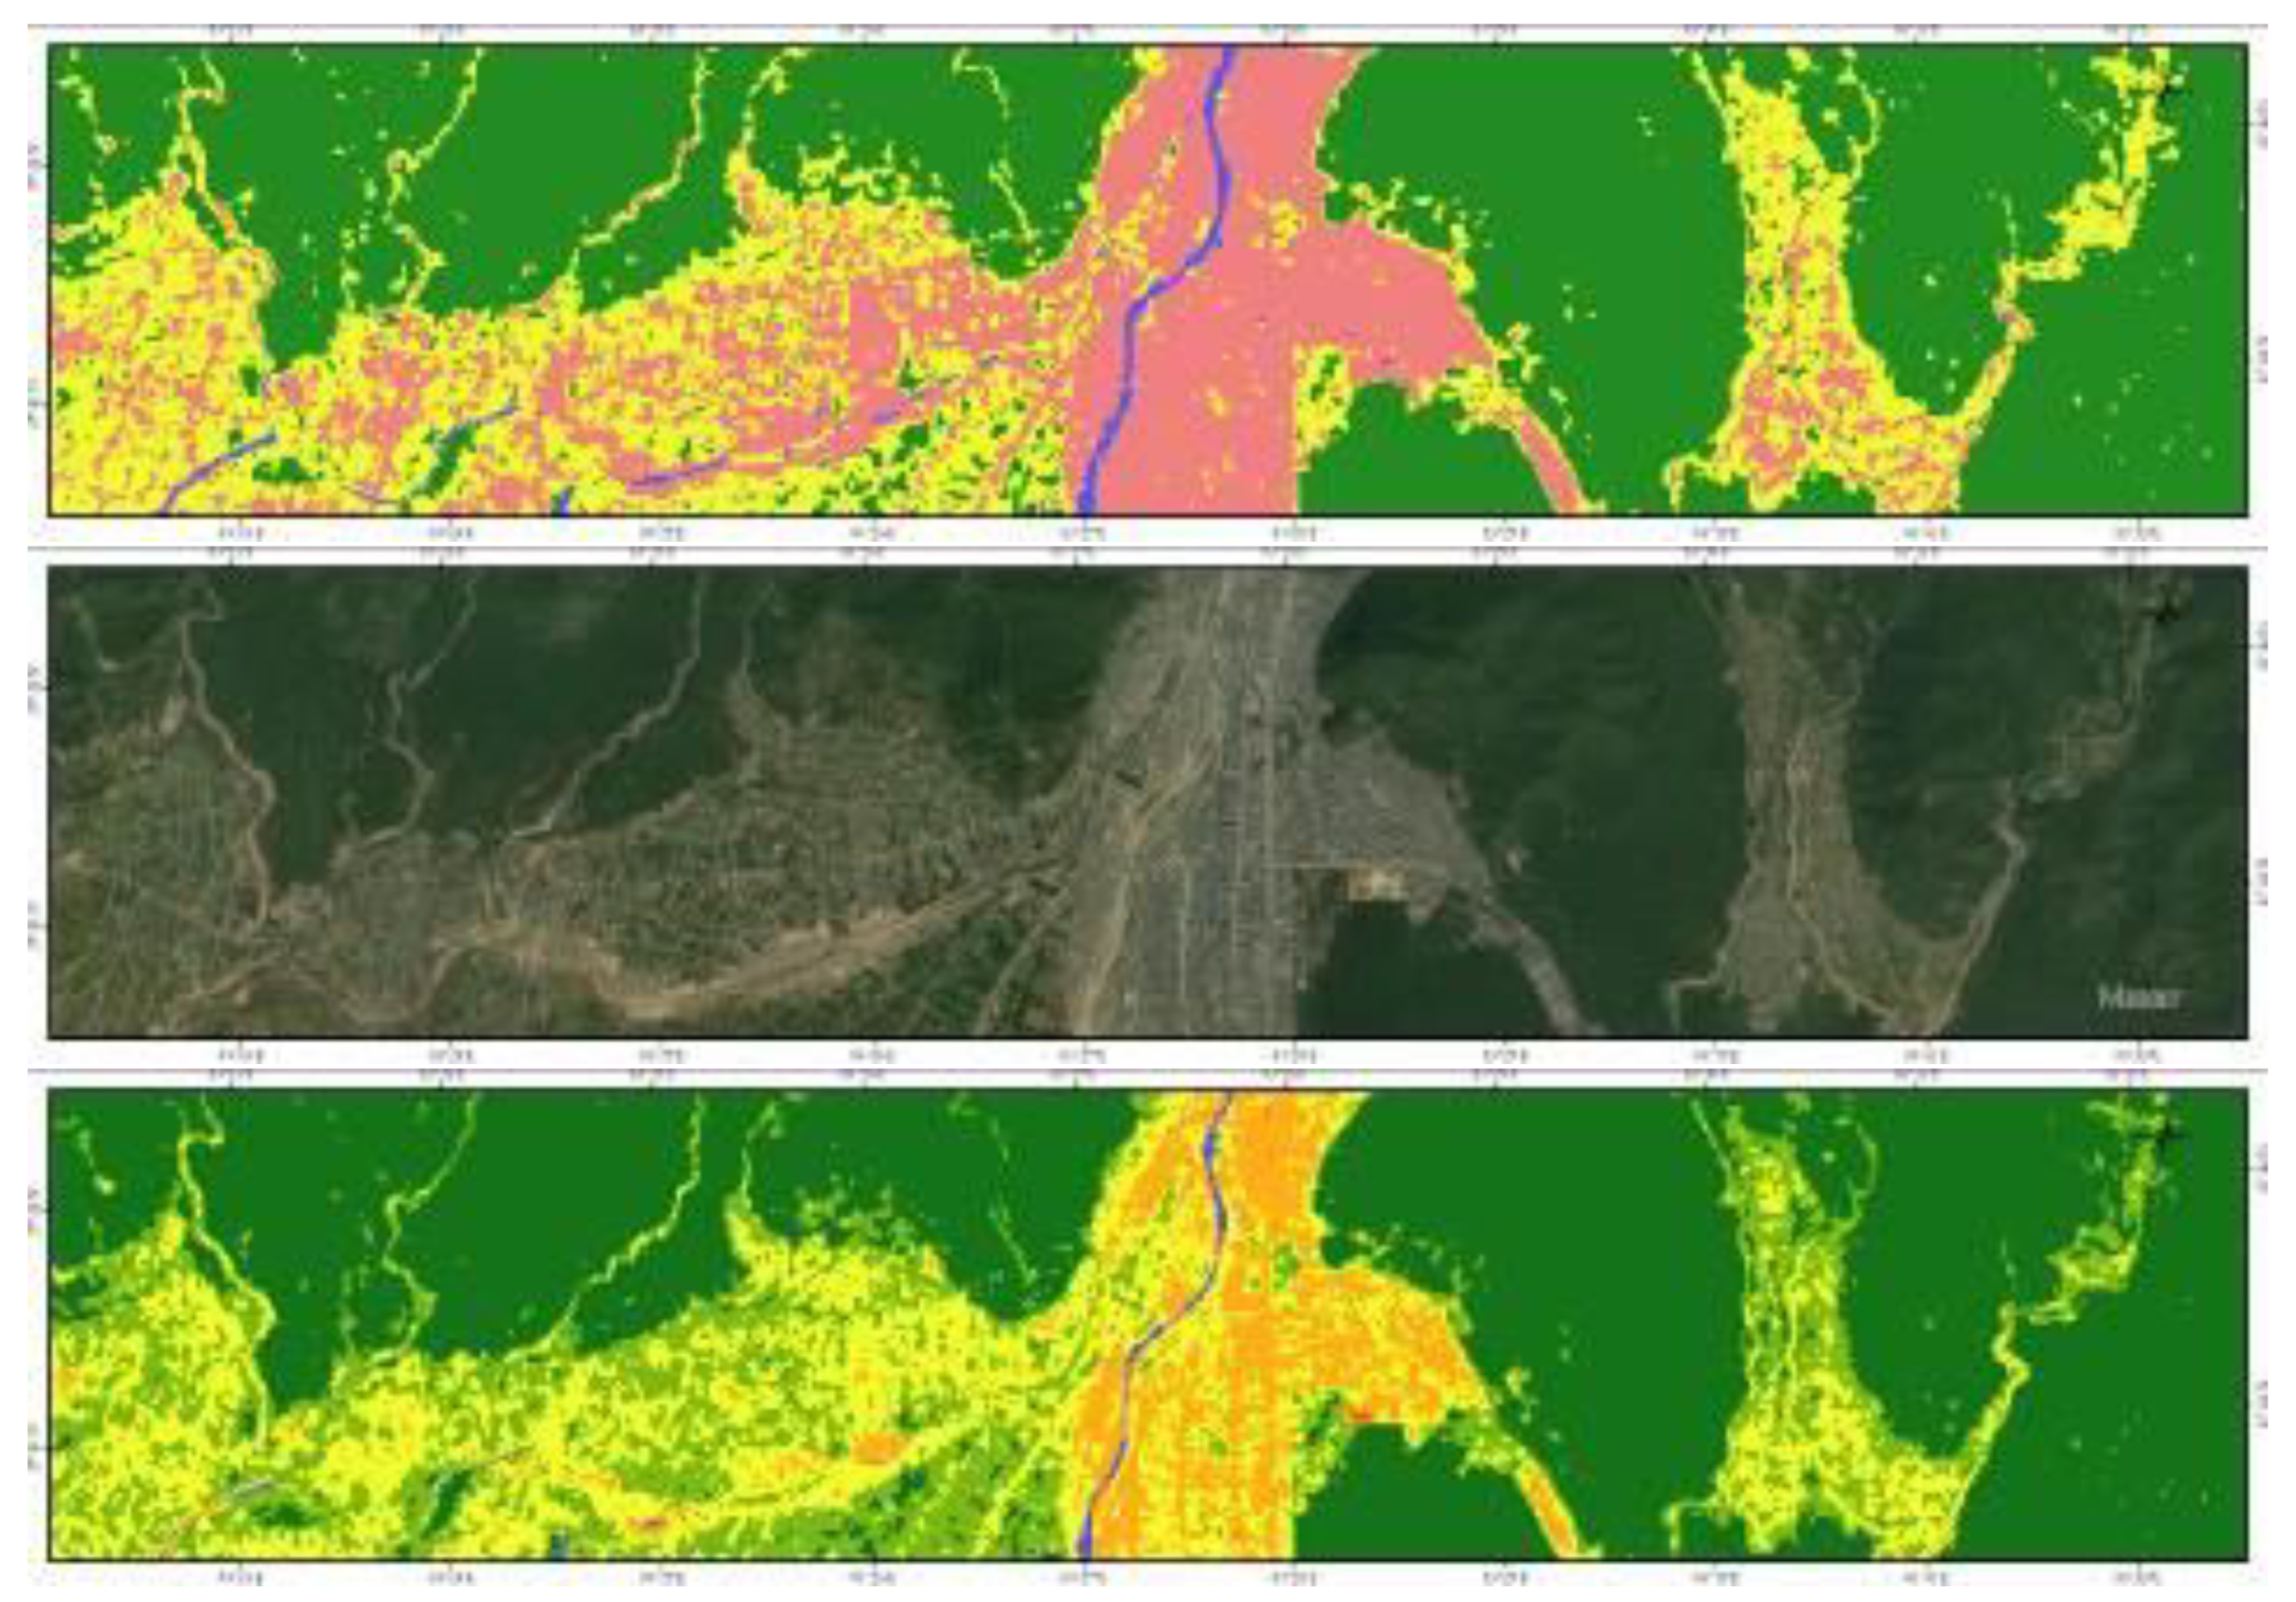
Figure 16.
Comparison of LULC, Satellite image and RSEI at Bhairahawa for the year 2023 from top to bottom to see and validate the impact of LULC in RSEI.
Figure 16.
Comparison of LULC, Satellite image and RSEI at Bhairahawa for the year 2023 from top to bottom to see and validate the impact of LULC in RSEI.
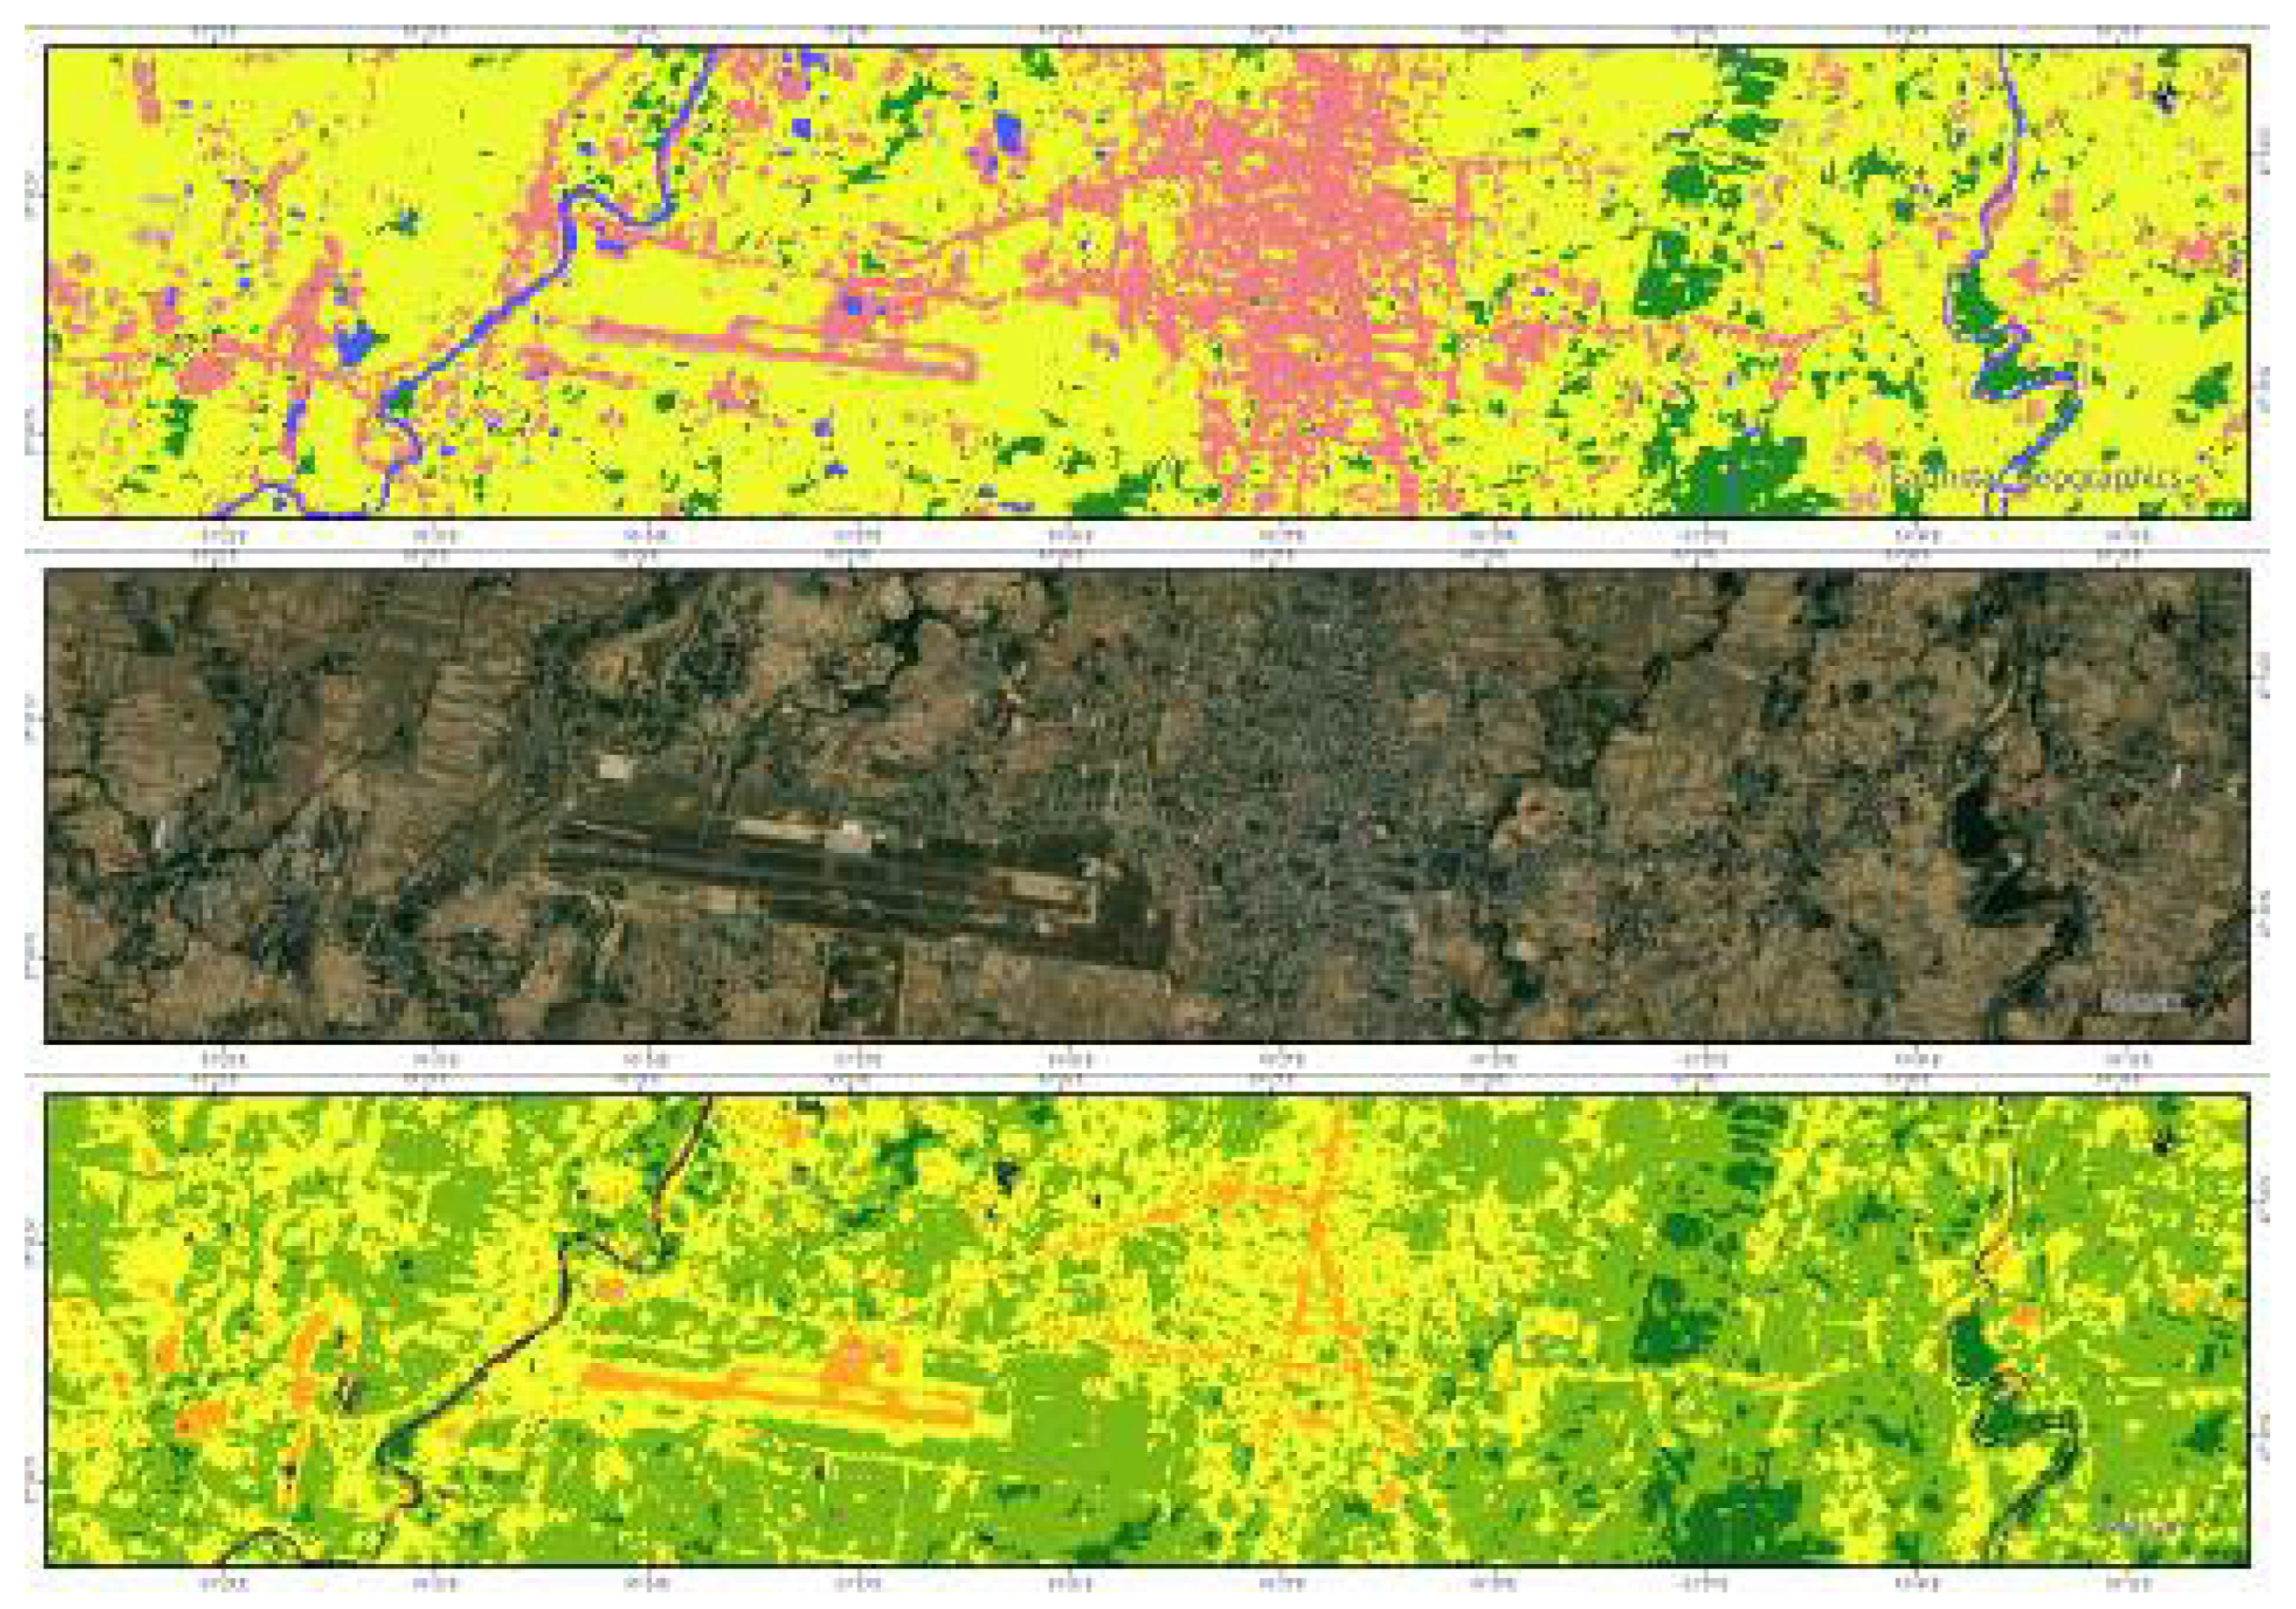
Table 1.
Description of satellite image used in the study to extract different indices.
| Year | Sensor | Path | WRow | Date | Cloud Cover (Percentage) |
|---|---|---|---|---|---|
| 1993 | Landsat 5 TM | 142 | 41 | 2004-10-04 | 3 |
| 2004 | 2008-10-15 | 0 | |||
| 2013 | Landsat 8 OLI/TIRS | 2013-10-24 | 0.12 | ||
| 2023 | 2023-10-20 | 2.41 |
Table 2.
Results of accuracy assessment for different land cover types and years.
| Year | 2023 | 2013 | 2004 | 1993 | ||||
|---|---|---|---|---|---|---|---|---|
| Overall Accuracy | 0.938 | 0.871 | 0.912 | 0.88 | ||||
| Kappa coefficient | 0.923 | 0.798 | 0.891 | 0.854 | ||||
| Accuracy (Producer’s and User’s) | PA | UA | PA | UA | PA | UA | PA | UA |
| Forest | 0.932 | 0.96 | 0.947 | 0.90 | 0.911 | 0.93 | 0.9 | 0.9 |
| Agriculture Land | 0.873 | 0.905 | 0.967 | 0.88 | 0.853 | 0.877 | 0.841 | 0.849 |
| Built-up Area | 0.971 | 0.942 | 0.778 | 0.77 | 0.924 | 0.933 | 0.870 | 0.895 |
| Dry Breland | 0.933 | 0.933 | 0.50 | 0.80 | 0.905 | 0.914 | 0.846 | 0.895 |
| Water | 0.989 | 0.950 | 0.90 | 0.90 | 0.978 | 0.910 | 0.978 | 0.883 |
Table 4.
Area of Each RSEI class in sq. km and percentage.
| Year | Grading | Area | Percentage (%) |
|---|---|---|---|
| 1993 | Poor | 23.9013 | 1.83 |
| Fair | 151.051 | 11.59 | |
| Moderate | 453.619 | 34.81 | |
| Good | 529.054 | 40.60 | |
| Excellent | 140.188 | 10.76 | |
| Water Body | 5.3767 | 0.41 | |
| 2004 | Poor | 4.69631 | 0.36 |
| Fair | 53.6893 | 4.12 | |
| Moderate | 460.436 | 35.33 | |
| Good | 588.392 | 45.15 | |
| Excellent | 189.278 | 14.52 | |
| Water Body | 6.69839 | 0.51 | |
| 2013 | Poor | 4.49065 | 0.34 |
| Fair | 176.478 | 13.54 | |
| Moderate | 714.06 | 54.79 | |
| Good | 231.279 | 17.75 | |
| Excellent | 170.697 | 13.10 | |
| Water Body | 6.18535 | 0.47 | |
| 2023 | Poor | 0.072406 | 0.01 |
| Fair | 32.61161 | 2.50 | |
| Moderate | 398.9699 | 30.61 | |
| Good | 574.0175 | 44.05 | |
| Excellent | 288.5381 | 22.14 | |
| Water Body | 8.980484 | 0.69 |
Table 6.
Area changes (sq. km) of each RSEI grade from 1993 to 2023.
| From | To | Area (1993-2004) | Area (2004-2013) | Area (2013-2023) |
|---|---|---|---|---|
| 1 | 1 | 1.28 | 0.93 | 0.01 |
| 1 | 2 | 3.26 | 1.29 | 1.41 |
| 1 | 3 | 4.92 | 1.23 | 0.94 |
| 1 | 4 | 5.84 | 1.39 | 1.02 |
| 1 | 5 | 7.62 | 1.79 | 1.46 |
| 2 | 1 | 10.79 | 3.31 | 2.10 |
| 2 | 2 | 18.79 | 8.36 | 15.01 |
| 2 | 3 | 30.25 | 10.51 | 38.67 |
| 2 | 4 | 38.89 | 14.60 | 46.71 |
| 2 | 5 | 47.86 | 22.59 | 60.70 |
| 3 | 1 | 60.81 | 38.03 | 81.88 |
| 3 | 2 | 79.34 | 109.62 | 124.84 |
| 3 | 3 | 129.06 | 137.72 | 248.69 |
| 3 | 4 | 114.32 | 120.15 | 193.95 |
| 3 | 5 | 94.83 | 116.03 | 82.84 |
| 4 | 1 | 91.67 | 122.49 | 56.95 |
| 4 | 2 | 100.17 | 126.73 | 45.68 |
| 4 | 3 | 132.67 | 169.98 | 34.94 |
| 4 | 4 | 138.20 | 69.00 | 42.75 |
| 4 | 5 | 36.89 | 31.94 | 35.28 |
| 5 | 1 | 25.61 | 26.38 | 17.23 |
| 5 | 2 | 23.40 | 25.54 | 17.75 |
| 5 | 3 | 27.47 | 35.48 | 25.09 |
| 5 | 4 | 40.13 | 43.26 | 22.16 |
| 5 | 5 | 50.76 | 76.23 | 116.55 |
Table 7.
Statistical table of LULC area (km2) in Rupandehi District, Nepal from 1993 to 2023.
| Year | Agriculture | Built-up | Water bodies | Forest | Barren | |
|---|---|---|---|---|---|---|
| 1993 | 838.91 | 13.32 | 18.02 | 303.87 | 122.45 | |
| 2004 | 852.02 | 36.69 | 15.42 | 368.99 | 22.36 | |
| 2013 | 885.35 | 94.05 | 9.76 | 265.21 | 41.43 | |
| 2023 | 787.00 | 156.16 | 11.80 | 311.44 | 26.47 |
Disclaimer/Publisher’s Note: The statements, opinions and data contained in all publications are solely those of the individual author(s) and contributor(s) and not of MDPI and/or the editor(s). MDPI and/or the editor(s) disclaim responsibility for any injury to people or property resulting from any ideas, methods, instructions or products referred to in the content. |
© 2024 by the authors. Licensee MDPI, Basel, Switzerland. This article is an open access article distributed under the terms and conditions of the Creative Commons Attribution (CC BY) license (http://creativecommons.org/licenses/by/4.0/).
Copyright: This open access article is published under a Creative Commons CC BY 4.0 license, which permit the free download, distribution, and reuse, provided that the author and preprint are cited in any reuse.


