
Submitted:
04 July 2024
Posted:
04 July 2024
You are already at the latest version
Abstract
The nutritional composition of food for animal production can be completed using olive tree and plant by-products due to their high contents of bioactive compounds, such as pentacyclic triterpenes. Here, we present a novel application of near-infrared spectroscopy (NIRS) for the prediction of the total or individual [maslinic acid (MA), oleanolic acid (OA), and uvaol (UO)] pentacyclic triterpene concentrations in a feed additive obtained from a plant mixture. The oxygen radical absorbance capacity of these types of samples demonstrated the existence of a high antioxidant capacity. The conventional determination methods of pentacyclic triterpenes concentration are costly, labor-intensive, and not practical for analyzing several lines within a limited timeframe at the factory level. The optimal regression model developed in our work demonstrated high correlation values for the calibration and validation sets, along with a high residual prediction deviation value. The NIRS method can be applied directly to dried powder and avoids extraction and high-performance liquid chromatography (HPLC) analysis. Our results also demonstrate that NIRS can accurately quantify pentacyclic triterpenes even at low concentrations in food additives. It can be used at the factory level to directly determine the concentrations in the additive powder obtained at the same time that the powder is produced.
Keywords:
Triterpenoids
; maslinic acid
; oleanolic acid
; uvaol
; near-infrared spectroscopy
; NIRS
; ORAC
1. Introduction
Pentacyclic triterpenes are secondary metabolites widely distributed in plants that have a nutraceutical role and important biological properties related to health and disease prevention [1]. They are found in high concentrations in Olea europaea organs, such as the fruits, leaves, stems, roots, and seeds [2,3]. Maslinic acid (MA), oleanolic acid (OA), ursolic acid (UO), betulinic acid (BA), erythrodiol (EO), and uvaol (UO) are the main pentacyclic triterpenoids found in this species [2,4]. In addition to health properties, several works have demonstrated that MA can be used as a feed additive in fish food [5,6,7,8]. The dietary addition of this compound produces increases in the growth and protein-turnover rates in the liver and white muscle trout and gilthead sea bream cultured in laboratory or under farm conditions. In general, supported by the lack of adverse effects, the results obtained with purified molecules led us to consider these compounds as nutraceuticals [9].
The use of feed additives based on olive by-products has been the aim of many companies producing animal meat as a form of natural supplementation of pentacyclic triterpenoids. When the triterpenes studied are used as part of the plant matrix of the substrates that contain them (leaves, stems, roots, and seeds), instead of pure molecules, their nature determines that their content is highly variable depending on the biological conditions and environmental challenges to which they are subjected. Therefore, the detection and quantification of the different triterpene contents in each of the plant substrates used is necessary to formulate mixtures with the desired content. Having this information to formulate mixtures and confirm their efficacy, once prepared, is a requirement for their study and evaluation as an additive in food for animal production. NIRS spectroscopy is a non-destructive method that is easy to use. This methodology has several applications in the agricultural and olive sectors [10] related to quality control [11] and nutrient analysis [12,13]. In this context, an easy method to determine the concentrations of these compounds in the feed additive at the factory level at the same time that it is produced is essential for these companies. Therefore, the aim of this study was the application of near-infrared spectroscopy (NIRS) for the prediction of the concentrations of total or individual triterpenoids in feed additives obtained from a mixture of olive by-products and other plants. The samples used as feed additives were analyzed using ultraviolet-visible high-performance liquid chromatography (HPLC-UV–Vis) to identify and determine the concentrations of these compounds following previously published works [2,3,14]. The same samples were analyzed using NIRS and the obtained NIRS spectra. The NIRS spectra are related to the pentacyclic triterpenoid concentrations, and an NIRS equation for the estimation of each triterpenoid was developed. Previously, with the aim to the determination of the antioxidant capacity of these samples, the oxygen radical absorbance capacity (ORAC) was determined.
Previously, regression models based on NIRS spectroscopy were developed for the rapid determination of phenolic compounds in several types of samples [15]. NIRS methods are more effective than other methods for screening purposes when a large number of samples needs to be analyzed. To our knowledge, this is the first study to develop and report an NIRS method that directly uses olive by-products to effectively predict the total or individual pentacyclic triterpenoid contents in feed additive.
2. Materials and Methods
2.1. Food Additive Samples and Chemicals
Plant samples of the Mediterranean ecosystem with industrial availability and abundant cultural and scientific information regarding their biological action in animal production were used. The tested product was a mixture of four plant samples from the leaves and seeds of lentiscus (Pistacia lentiscus), wild olive (Olea europaea), winemaking derivatives (Vitis vinifera), and thyme (Thymus vulgaris). After a selection and drying process at a low temperature, the different samples were weighed according to their formulation in batches of 500 kg. They were subsequently mixed, ground, and micronized with an air classifier mill, obtaining a median granule lower than 400 micrometers and a particle size (geometric mean diameter—GMD) lower than 200 micrometers. Three identified samples of 250 g were taken from each batch: one for shipment to Nutega S.L. (CCPA Group, Madrid, Spain) for the NIRS study, another to the University of Jaén for analysis of the triterpenoid concentration, and the third to the Agroloma (Agropecuaria Loma de Los Donceles, Úbeda, Jaén) sample library.
2.2. Extraction of Triterpenoids
We followed the procedure described in [2] for extraction and analysis of the triterpene’s compounds in the samples. Initially, the water contents of 5 samples were determined by weighing 3 g of pulverized powder and drying this in an oven at 55 ◦C for 2 days to a constant weight. After cooling, the samples were reweighed. The water content was 3.31±0.02%, so the following analysis was conducted on wet samples.
For each sample, for the extraction of the triterpenoids, 0.125 g of dried powder was mixed with 1.5 mL of methanol/ethanol (1:1, v/v) and vigorously vortexed for 1 min. The samples were centrifuged at 7700×g for 5 min at 4 ◦C. The supernatants were collected with the residue re-extracted three times with the same volume of methanol/ethanol. All supernatants obtained after three extractions were mixed and evaporated using a SpeedVac. The residue was dissolved with 1 mL of methanol. These methanolic samples were filtered, and analysis of the triterpenoids was carried out using an HPLC-UV–Vis chromatographic system.
2.2. Analysis and Determination of the Triterpenoid Content
Reverse-phase chromatography was applied using a Spherisorb ODS-2 (Waters Corporation, Milford, CT, USA) column (2.5–4.6 mm, 5 µm). A Shimadzu HPLC system including two pumps, a column-heater module, and a UV–Vis detector was used and operated with LC-Solutions software (Shimadzu Corporation, Kyoto, Japan). An isocratic elution was applied using methanol/water with acetic acid (pH = 3.1) (92:8, v/v) for 20 min, with a flow rate of 0.8 mL min−1. The absorbance at 210 nm was recorded during elution. The chromatogram for the mixture is shown in Figure 1. The triterpenoids were identified and quantified using the external standard method, as indicated in [2,3]. Table 1 shows the average concentrations of these compounds found in all the experimental samples.
2.2. Collection of NIR Spectra, NIRS Model, and Equation Development
All the samples were analyzed in triplicate using the NIR DS2500 equipment from 400 nm to 2500 nm with increases of 2 nm. The spectra obtained are plotted in Figure 2. The samples used for the development of the NIRS model had the concentrations of pentacyclic triterpenes shown in Table 2. Figure 3 shows the intervals at which each parameter was distributed.
For calibration, principal component analysis (PCA) was first carried out with all the spectral values (Figure 4), using the CENTER algorithm and WinISI software [16], and aiming at the center of the population. The standard H distance was determined as a variant of the Mahalanobis distance [17]. In this analysis, the dimensionality of a population was reduced with the aim of evaluating the presence of anomalous spectra samples. Thus, the spectral distance of the library could be tested to obtain the global distance to the center of the population (GH). These data were used as indicators if the number of samples used in the calibration was sufficient. Moreover, with WinISI software, the information on the NIR spectra can be improved by minimizing the variations in the physical origins. Particle size, packing pressure, dispersion effects, variations in the path light, and other physical effects can disturb the relationship between the NIRS spectra and the reference values. These errors can be minimized by applying mathematical treatments to the spectra. In general, these chemometric methods are used for the correction of dispersion or scatter.
For this calibration, the following approaches were used:
- Standard normal variate (SNV) correction was used for the correction of variations in the baseline produced by the particle size and the dispersion. The spectra were transformed to log(1/R). This consisted of subtracting the mean of the spectrum from each original absorbance value and dividing this result by its standard deviation (Barnes et al., 1989).
- Detrend (DT) correction. The application of this second-grade polynomic function to the absorbance values in log(1/R) and the lambda allows for removal of the linear or quadratic curve in the baseline of the spectra due to the different packing pressures [18].
- SNV and DT (SNVD) correction. This is a combination of both previous corrections, SNV and DT. It corrects the baseline and removes the differences between the spectra corresponding to samples of a similar chemical composition but with different particle sizes [18].
After defining the pool of samples used, calibration of the model was carried out with the aim to predict the concentrations of the chemical components of the samples using their spectral information.
The development of the NIR equation consisted of obtaining an appropriate mathematical relation between the spectral information and the concentration values of the selected samples. Table 2 shows the results obtained in the calibration of the product. The calibration was carried out with the same mathematical treatment applied to the center of the population.
Table 3 shows the results obtained for the validation of the selected samples.
2.2. Oxygen Radical Absorbance Capacity (ORAC) Assay
ORAC assay was carried out following the procedure described by Ou et al. [19] and Hua et al. [20] with modifications.
Sample preparation. In Eppendorf tubes, 0.1 g of fine powder of the sample was accurately weighed and 1.5 ml of acetone/water (50:50, p:v) extraction solvent was added. The mixture was shaken at 400 rpm in a circular rotatory shaker at room temperature for 1 h. Each 10 min it were shacked by vortex. The mixtures were centrifuged at 14000xg for 15 min and the supernatant was used for the analysis.
Assay. All samples and reagents were dissolved and diluted with phosphate buffer (0.075 M, pH 7.4). For the experimental samples, 5, 10 and 20 µL of supernatants were added to complete 40 µL phosphate buffer and then mixed with 20 µL 63 nM sodium fluorescein solution in a clear, 96-well microplate and incubated at 37ºC for 15 min. Then 140 µL 18.28 mM 2,2’-azobis(2-amidinopropane) dihydrochloride (AAPH) solution was rapidly added to each well. Also, the fluorescence intensity of each sample was determined without the effect of AAPH in wells in which the AAPH solution was replaced by the same amount of phosphate buffer. A calibration curve for the trolox standards, at concentrations of 0, 2.5, 5, 10, 20 and 30 µg/mL was made.
After the 15 min incubation and vigorous shaking, the microplate was placed in the multifunctional BioTeK Synergy HR microplate reader (ThermoFisher Scientific Inc, US). The system was set in the fluorescence mode and the fluorescence intensity of each well was read 60 times at 1-min intervals. The fluorescence intensity emitted at 535 nm was read at 37ºC after excitation at 485 nm.
The fluorescence intensity area under the curve for AAPH and no-AAPH wells was used for the determination of the fluorescence inhibition percentage induced by trolox or by the experimental sample. The ORAC values of the samples were obtained for interpolation against trolox calibration curve.
2.6. Statistical Analysis
The results are expressed as the mean ± standard error of the mean (SEM). Linear correlations were determined by least-squares regression analysis. The criterion of significance was taken as p < 0.05.
3. Results and Discussion
In this work, we describe the development of an NIRS equation that relates the concentrations of pentacyclic triterpenoids to the NIRS spectra in samples made from the leaves and seeds of traditional plants found in a Mediterranean forest. Lentiscus (Pistacia lentiscus), wild olive (Olea europaea), wine (Vitis vinifera), and thyme (Thymus vulgaris) were the four plant types used. A total of 63 samples of these four plant types with different compositions and particle sizes were made and used for two analyses. The first analysis was the determination of the compositions of pentacyclic triterpenes in these mixtures. We applied the same techniques of extraction and analysis previously used for olive samples. A typical HPLC-UV–Vis chromatogram of these samples is shown in Figure 1. As shown in this chromatogram, maslinic acid (MA), an isomer of betulinic acid (iBA), oleanolic acid (OA), and uvaol (UO) were identified using the external standard method. The concentration of each compound was determined based on the area of each peak, and the results are shown in Table 1. The chromatogram profiles and positions of the different identified compounds have been previously described for olive leaf samples [2]. The concentrations of the total pentacyclic triterpenoids found in these samples represent 6.19% of their wet weight, with 4.13% MA and 1.42% OA. These are high percentages with respect to the total weights of the samples and validate the procedure used for making this additive.
The second determination was the NIR spectra of the same samples. Figure 2 shows the spectra obtained. After the application of a mathematical approach for the creation of the CENTER, the spectral database became quite homogeneous, showing clear absorption peaks, which could facilitate good calibration. The calibration was carried out using the mathematical treatments SNV +D 1,4,4,1, as previously mentioned. The same mathematical treatment was carried out for all parameters. The statistics obtained in the calibration are shown in Table 2.
To analyze these values, the guide values described by Williams [21] were used. Following this author, when the R2 values are higher than 0.90, an excellent calibration is obtained; when the R2 values are between 0.82 and 0.90, the calibration is good; and when the R2 values are between 0.66 and 0.81, a possible quantitative prediction can be made. When the R2 values are between 0.50 and 0.65, the calibration distinguishes between high and low values.
With the spectral values, PCA was conducted using WINISI software with the aim of developing a quality control standard of the samples used for the model. The results show that acceptable calibration was carried out for each of the determined compounds: MA, iBA, OA, UO, and total. This implies that the model predicted the concentrations of each one.
These results and the models were validated in a comparison of the values obtained for six samples with the two different analysis methods. These samples were not included in the calibration, and the results are shown in Table 3. Good regression (R2) and an acceptable relative Sep value were observed for MA, OA and TOTAL. The iBA and UO statistics show a worse response in the NIRS, probably because their ranges and deviations were smaller.
Moreover, the antioxidant capacity of the plants mix samples was determined by the ORAC assay. The results obtained are shown in Table 4. Comparing with other types of samples, the values found are high and likely to different juices [19].
NIRS has been increasingly used for the safety inspection and quality assessment of agricultural products [22,23]. It has also been applied to olive oil production as a method to monitor and control olive quality parameters [24] or for the detection of herbicides [25]. NIRS models have been developed to estimate the polyphenolic compound [26] and relative water [27] contents in olive leaves and to predict the quality of intact olives [28]. Here, we describe another application of this methodology: its use in the quantification of pentacyclic triterpenes, bioactive compounds present in Mediterranean plant leaves that have important applications in health. These compounds are highly abundant in olive by-products, such as pruned leaves, and can be used as additives in the production of animal meat. This application would permit the use of these by-products for animal alimentation. This is an important use at this time, when the availability of primary material is low. In this sense, our results also demonstrated the high antioxidant capacity of these samples when it was used as additives for animal food.
The method described here has many advantages compared to the traditional method. It can be applied directly to dried powder, avoiding the extraction process and HPLC analysis. This makes the assay easier and cheaper. Moreover, it can be used at the factory level to directly determine the concentrations of MA, iBA, OA, and UO and the total concentrations of pentacyclic triterpenes in food additives at the same time as their production.
Author Contributions
C.S-P. and R. S-S. conceptualized the idea, made the samples, and promoted this study. M.L-G. and S.M-V. carried out the NIRS analyses and model. D.M-M. S.C-J, and J.P-S. conducted the analytical determinations of the pentacyclic triterpenes concentrations and ORAC assays. J.P-S., M.L-G., and S.M-V. wrote the manuscript.
Funding
This research was funded by a contract between the University of Jaén and Agroloma, Grant: 2022_145, and by Junta de Andalucía (Plan Andaluz de Investigación, Junta de Andalucía, Spain), Grant BIO-341 “Enzymes and Metabolism”.
Institutional Review Board Statement
In this section, you should add the Institutional Review Board Statement and approval number, if relevant to your study. You might choose to exclude this statement if the study did not require ethical approval. Please note that the Editorial Office might ask you for further information. Please add “The study was conducted in accordance with the Declaration of Helsinki, and approved by the Institutional Review Board (or Ethics Committee) of NAME OF INSTITUTE (protocol code XXX and date of approval).” for studies involving humans. OR “The animal study protocol was approved by the Institutional Review Board (or Ethics Committee) of NAME OF INSTITUTE (protocol code XXX and date of approval).” for studies involving animals. OR “Ethical review and approval were waived for this study due to REASON (please provide a detailed justification).” OR “Not applicable” for studies not involving humans or animals.
Informed Consent Statement
Any research article describing a study involving humans should contain this statement. Please add “Informed consent was obtained from all subjects involved in the study.” OR “Patient consent was waived due to REASON (please provide a detailed justification).” OR “Not applicable.” for studies not involving humans. You might also choose to exclude this statement if the study did not involve humans. Written informed consent for publication must be obtained from participating patients who can be identified (including by the patients themselves). Please state “Written informed consent has been obtained from the patient(s) to publish this paper” if applicable.
Data Availability Statement
We encourage all authors of articles published in MDPI journals to share their research data. In this section, please provide details regarding where data supporting reported results can be found, including links to publicly archived datasets analyzed or generated during the study. Where no new data were created, or where data is unavailable due to privacy or ethical restrictions, a statement is still required. Suggested Data Availability Statements are available in section “MDPI Research Data Policies” at https://www.mdpi.com/ethics.
Acknowledgments
The authors thank the Unit of Chromatography of the Scientific and Technical Instrumentation Center, University of Jaén, for their technical and instrumental assistance.
Conflicts of Interest
The authors declare no conflicts of interest.
References
- Rufino-Palomares EE, Pérez-Jiménez A, García-Salguero L, Mokhtari K, Reyes-Zurita FJ, Peragón-Sánchez J, Lupiáñez JA. (2022). Nutraceutical role of polyphenols and triterpenes present in the extracts of fruits and leaves of Olea europaea as antioxidants, anti-infectives and anticancer agents on healthy growth. MOLECULES. 27, 2341, 2022.
- Peragón, J. (2013). Time course of pentacyclic triterpenoids from fruits and leaves of olive tree (Olea europaea L.) cv. Picual and cv. Cornezuelo during ripening. JOURNAL OF AGRICULTURAL AND FOOD CHEMISTRY, 61, 6671-6678.
- Jiménez-Herrera R, Pacheco-López B, Peragón J. (2019). Water stress, irrrigation and concentrations of pentacyclic triterpenes and phenols in Olea europaea L. cv. Picual olive trees. ANTIOXIDANTS. 8, 294; 14 pages.
- Hernández-Yera M, Peragón J. (2020). Time course profile of pentacyclic triterpenes from stem and root of cv. Picual olive tree (Olea europaea, L.) along ripening. JOURNAL OF PLANT SCIENCE. 4: 186-193.
- Fernández-Navarro M, Peragón J, Esteban FJ, de la Higuera M, Lupiáñez JA. (2006). Maslinic acid as a feed additive to stimulate growth and hepatic protein-turnover rates in rainbow trout (Oncorhynchus mykiss). COMPARATIVE BIOCHEMISTRY & PHYSIOLOGY, PART C: TOXICOLOGY & PHARMACOLOGY, 144: 130-140.
- Fernández-Navarro M, Peragón J, Amores V, de la Higuera M, Lupiáñez JA. (2008). Maslinic acid added to the diet increases growth and protein-turnover rates in the white muscle of rainbow trout (Oncorhynchus mykiss). COMPARATIVE BIOCHEMISTRY & PHYSIOLOGY, PART C: TOXICOLOGY & PHARMACOLOGY, 147: 158-167.
- Rufino-Palomares E, Reyes-Zurita F, García-Salguero L, Peragón J, De La Higuera M, Lupiáñez J.A. (2012a). Maslinic acid, a natural triterpene, added to diet stimulates growth and protein turnover of white muscle in gilthead sea bream (Sparus aurata) cultured in farmed conditions. AQUACULTURE NUTRITION, 18, 568-580.
- Rufino-Palomares E, Reyes-Zurita F, Fuentes-Almagro C, De La Higuera M, Lupiáñez J.A, Peragón J. (2012b). Proteomics in the liver of gilthead sea bream (Sparus aurata) to elucidate the cellular response induced by the intake of maslinic acid. PROTEOMICS, 11, 3312–3325.
- Rufino-Palomares E, Pérez-Jiménez A, García-Salguero L, Mokhtari K, Reyes-Zurita FJ, Peragón-Sánchez J, Lupiáñez JA. (2022). Nutraceutical role of polyphenols and triterpenes present in the extract of fruits and leaves of Olea europaea as antioxidants, anti-infectives and anticancer agents on healthy growth. MOLECULES, 27, 2341.
- Torrecilla JS, Cancilla JC, Perez-Calabuig A, Pradana-Lopez, S. (2021). Spectroscopy to evaluate the quality control of extra-virgin olive oils. In: Olives and olive oil in health and disease prevention. Second Edition. Edited by VR Preedy and RR Watson. Academic Press, London, United Kingdom.
- Mustorgi E, Malegori C, Oliveri P, Hooshyary M, Bounneche H, Mondello L, Oteri M, Casale M. (2020). A chemometric strategy to evaluate the comparability of PLS models obtained from quartz cuvettes and disposable glass vials in the determination of extra virgin olive oil quality parameters by NIR spectroscopy. CHEMOM. INTELL. LAB. SYST. 199, 103974.
- Casson A, Beghi R, Giovenzana V, Riorind I, Tugnolo A, Guidetti R. (2020). Environmental advantages of visible and near infrared spectroscopy for the prediction of intact olive ripeness. BIOSYST. ENG. 180:1-10.
- Altieri G, Matera A, Genovese F, Di Renzo GC. (2020). Models for the rapid assessment of water and oil content in olive pomace by near-infrared spectrometry. J. SCI. FOOD AGRIC. 2020:100.
- Peragón J, Rufino-Palomares EE, Muñoz-Espada I, Reyes-Zurita FJ, Lupiáñez JA (2015). A new HPLC method for measuring maslinic acid and oleanolic acid in HT29 and HepG2 human cancer cells. INTERNATIONAL JOURNAL OF MOLECULAR SCIENCES, 16, 21681-21694.
- Tian W, Chen G, Zhang G, Wang D, Tilley M, Li Y. (2021). Rapid determination of total phenolic content of whole wheat flour using near-infrared spectroscopy and chemometrics. FOOD CHEMISTRY. 344: 128633, 7 pages.
- Shenk JS, Waterhaus MO (1991). Population Definition, Sample Selection and Calibration Procedures for Near Infrared Reflectance Spectroscopy. Crop Science, 31, 469-474.
- Mahalanobis, PC. (1936). On the generalised distance in statistics. PROC. NATL INST. SCI. INDIA, 2,49-55.
- Barnes RJ, Dhanoa MS, Lister SJ. (1989). Standard normal variate transformation and de-trending of near-infrared diffuse reflectance spectra. APPLIED SPECTROSCOPY, 43, 772-777.
- Ou B, Hampsch-Woodill M, Prior RL. (2001). Development and validation of an improved oxygen radical absorbance capacity assay using fluorescein as the fluorescent probe. JOURNAL OF AGRICULTURAL AND FOOD CHEMISTRY, 49, 4619-4626.
- Mu, TH, Sun HN. (2019). Sweet potato leaf polyphenols: Preparation, individual phenolic compound composition and antioxidant activity. In: Polyphenols in Plants. 2nd. Edition. pp 365-380. Edited by Academic Press, Elsevier, London, UK.
- Williams, P. (2007). Near – infrared technology – getting the best out of light. PDK Projects, Inc., Nanaimo, British Columbia, and Winnipeg, Manitoba, Canada.
- Nicolai BM, Beullens K, Bobelyn E, Peirs A, Saeys W, Theron KI, Lammertyn J. (2007). Nondestructive measurement of fruit and vegetable quality by means of NIR spectroscopy: A review. POSTHAVERST BIOLOGY AND TECHNOLOGY, 46, 99-118.
- Mouazen A, Saeys W, Xing J, De Baerdemaeker JDe, Ramon H. (2005). Near infrared spectroscopy for agricultural materials: an instrument comparison. J. NEAR INFRARED SPECTROSC., 13: 87-98.
- Salguero-Chaparro L, Baeten V, Fernández-Pierna JA, Peña-Rodríguez F. (2013a). Near infrared spectroscopy (NIRS) for on-line determination of quality parameters in intact olives. FOOD CHEM. 139-1121-1126.
- Salguero-Chaparro L, Gaitán-Jurado AJ, Ortiz-Somovilla V, Peña-Rodriguez F. (2013b). Feasibility of using NIR spectroscopy to detect herbicide residues in intact olives. FOOD CONTROL, 30, 504-509.
- Valinger D, Kusen M, Tusek AJ, Panic M, Jurina T, Benkovic M, Redovnikovic IR, Kljusuric JG. (2018). Development of near infrared spectroscopy models for quantitative prediction of the content of bioactive compounds in olive leaves. CHEM. BIOCHEM. ENG. Q., 32, 535-543.
- Torres I, Sánchez MT, Belloch-Gozález M, Pérez-Marín D. (2019). Irrigation decision support base don leaf relative water content determination in olive grove using near infrared spectroscopy. BIOSYSTEMS ENGINEERING, 180, 50-58.
- Grassi S, Jolayemi OS, Giovenzana V, Tugnolo A, Squeo G, Conte P, De Bruno A, Flamminii F, Casiraghi E, Alamprese C. (2021). Near infrared spectroscopy as a green technology for the quality prediction of intact olives. FOODS, 10, 1042.
Figure 1.
HPLC-UV–Vis chromatogram of plant additive. Twenty microliters of sample were subjected to HPLC with a Spherisorb ODS-2 column that was eluted with methanol/water. The Y axis shows the absorbance at 210 nm. MA: maslinic acid; OA: oleanolic acid; UO: uvaol; iBA: betulinic acid isomer.
Figure 1.
HPLC-UV–Vis chromatogram of plant additive. Twenty microliters of sample were subjected to HPLC with a Spherisorb ODS-2 column that was eluted with methanol/water. The Y axis shows the absorbance at 210 nm. MA: maslinic acid; OA: oleanolic acid; UO: uvaol; iBA: betulinic acid isomer.
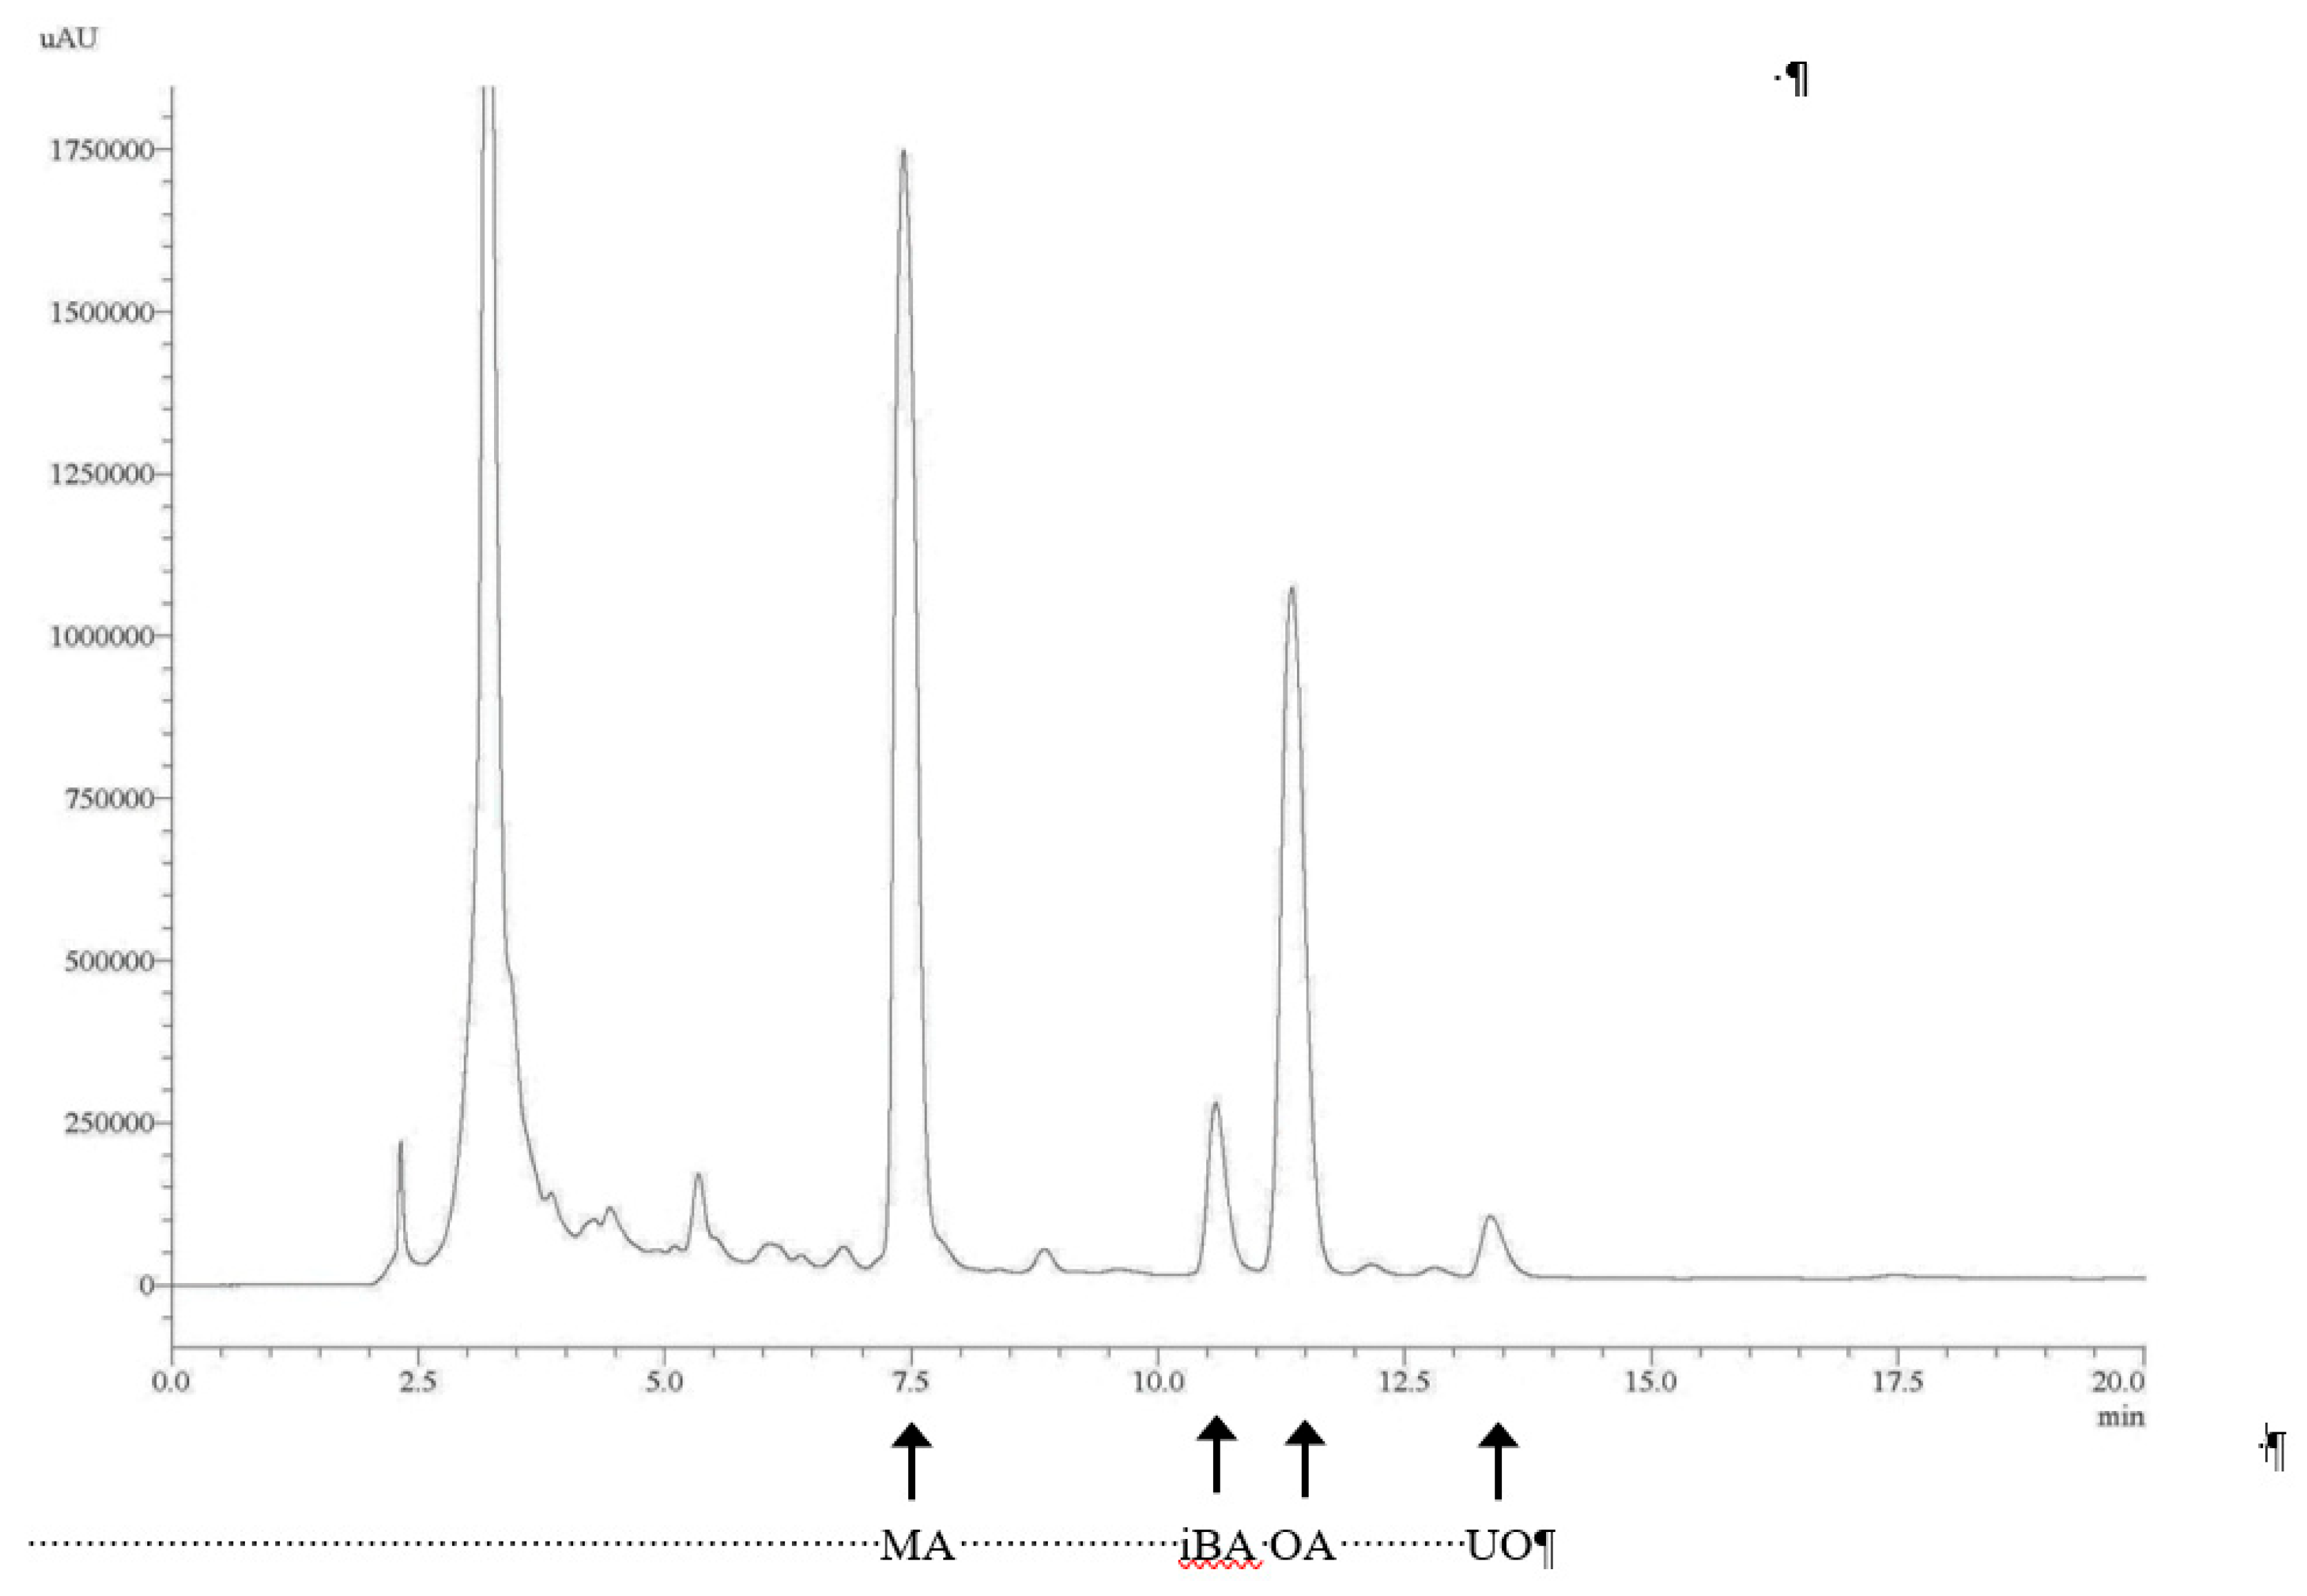
Figure 2.
NIR spectra of plant additive samples ranging from 400 to 2500 cm-1 at a resolution of 2 cm-1.
Figure 2.
NIR spectra of plant additive samples ranging from 400 to 2500 cm-1 at a resolution of 2 cm-1.
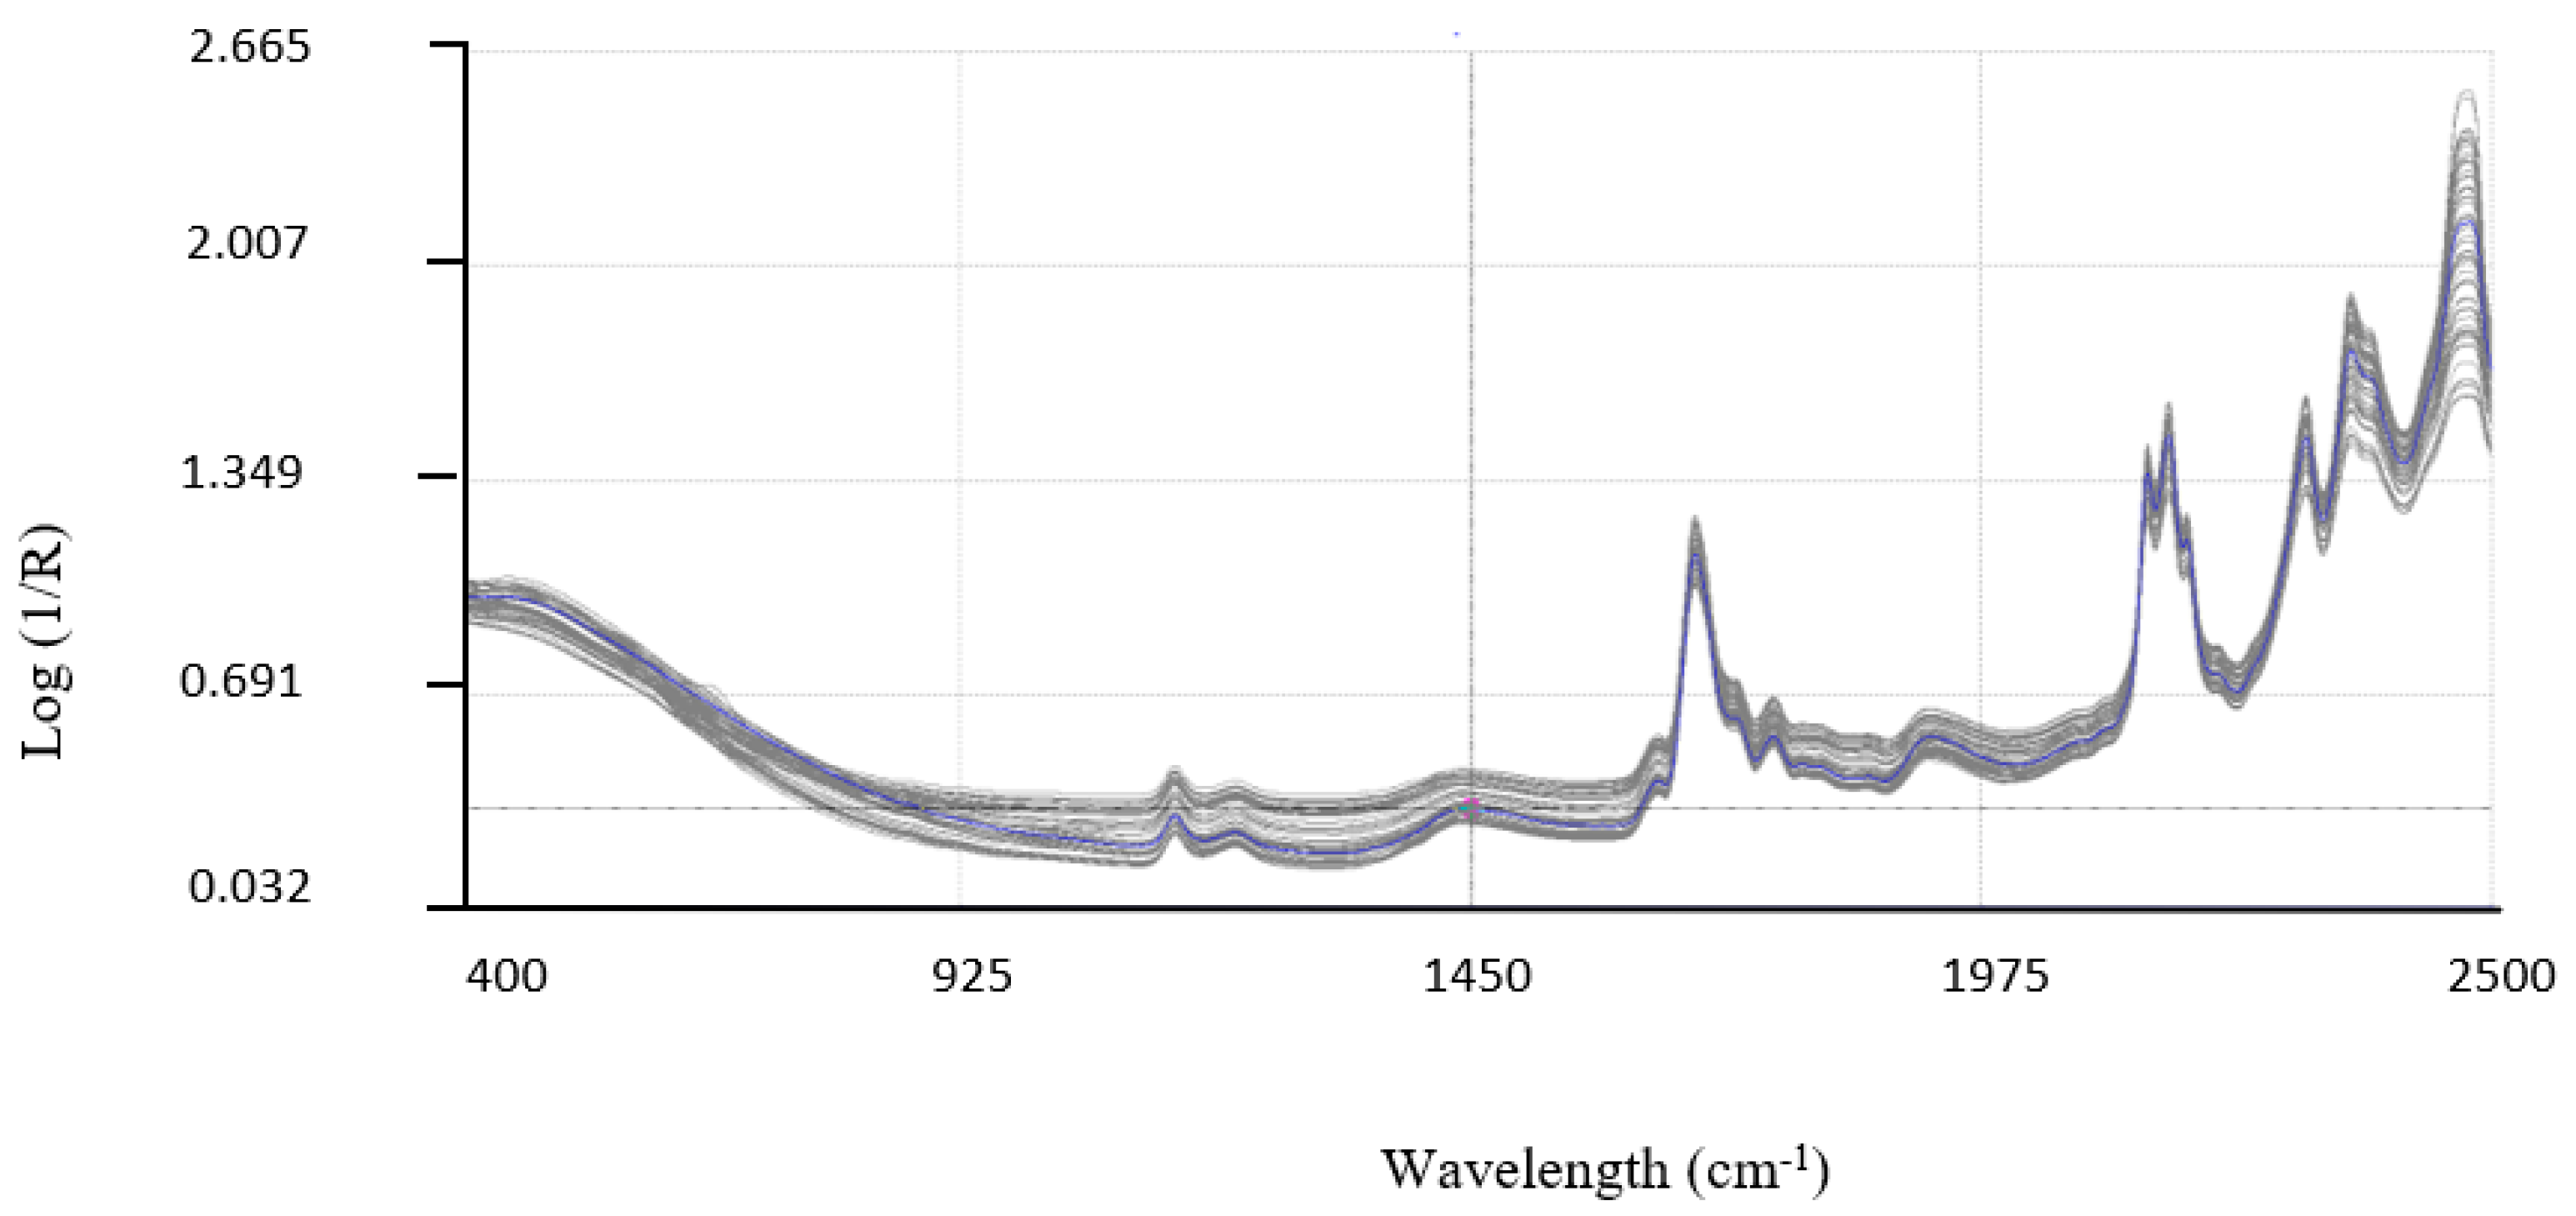
Figure 3.
Principal component analysis of the complete spectra. Points circled in red correspond to the outlier’s samples.
Figure 3.
Principal component analysis of the complete spectra. Points circled in red correspond to the outlier’s samples.
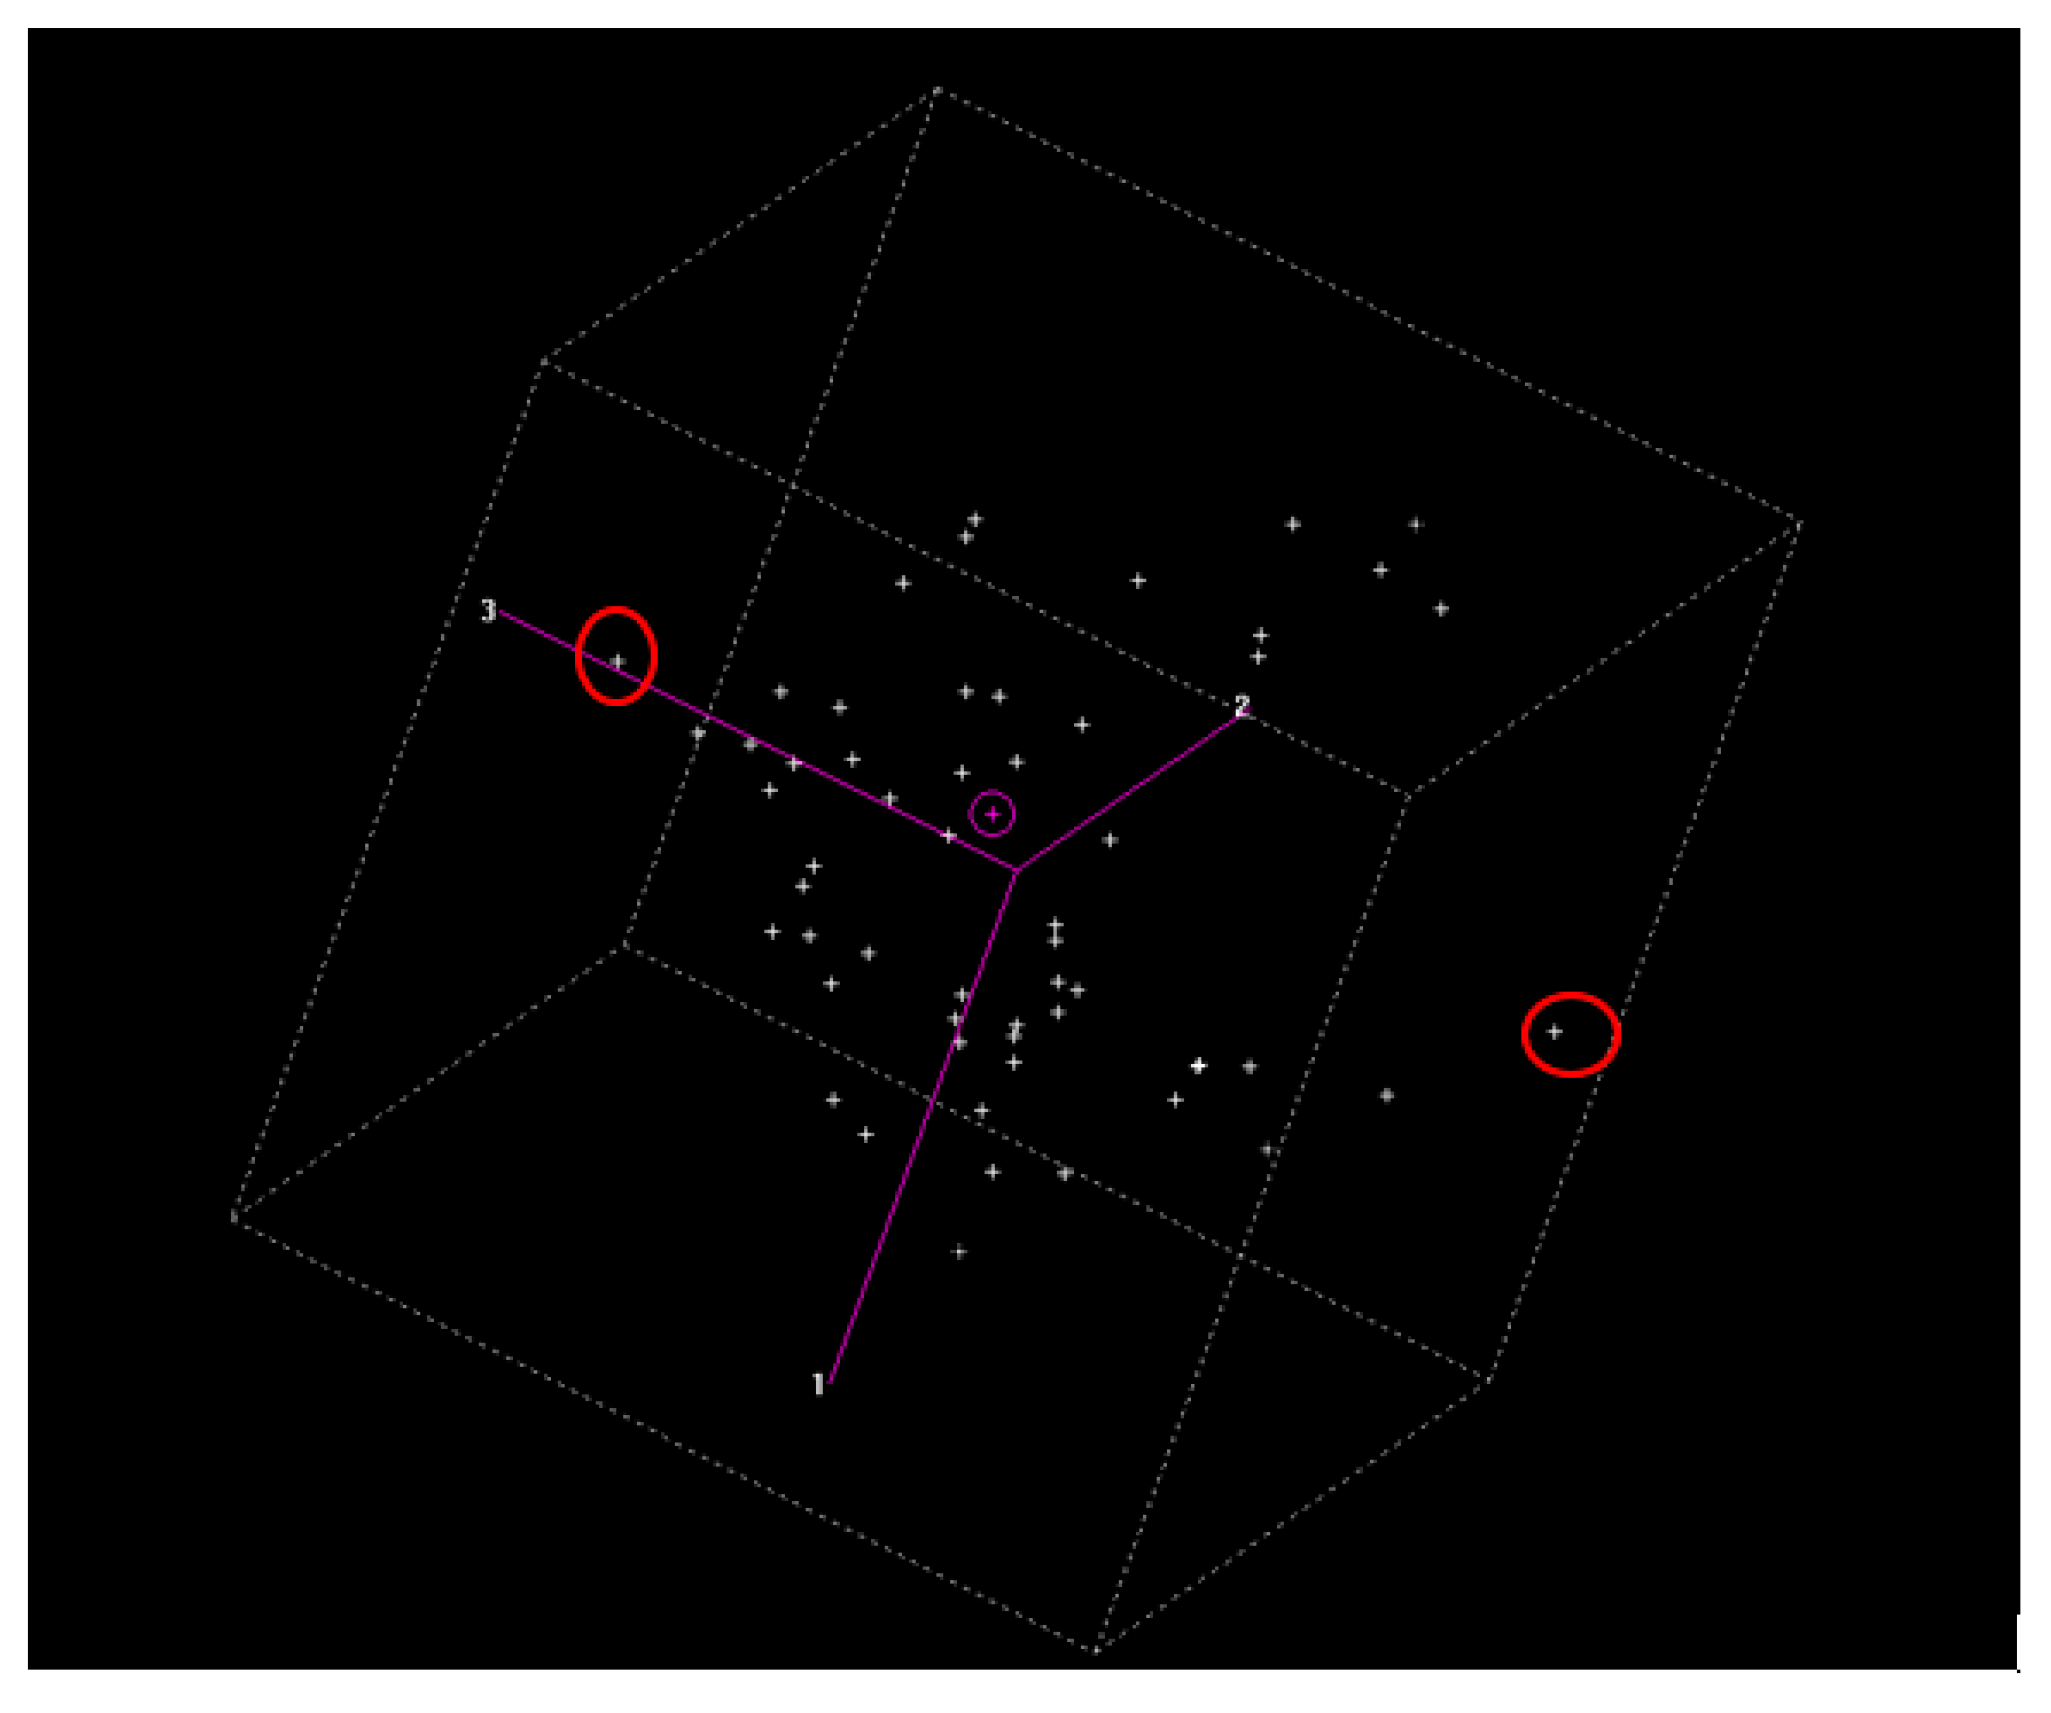
Figure 4.
Frequency histograms of the analyzed compounds. Panel A: MA; Panel B: iBA; Panel C: OA; Panel D: UO; Panel E: Total.
Figure 4.
Frequency histograms of the analyzed compounds. Panel A: MA; Panel B: iBA; Panel C: OA; Panel D: UO; Panel E: Total.
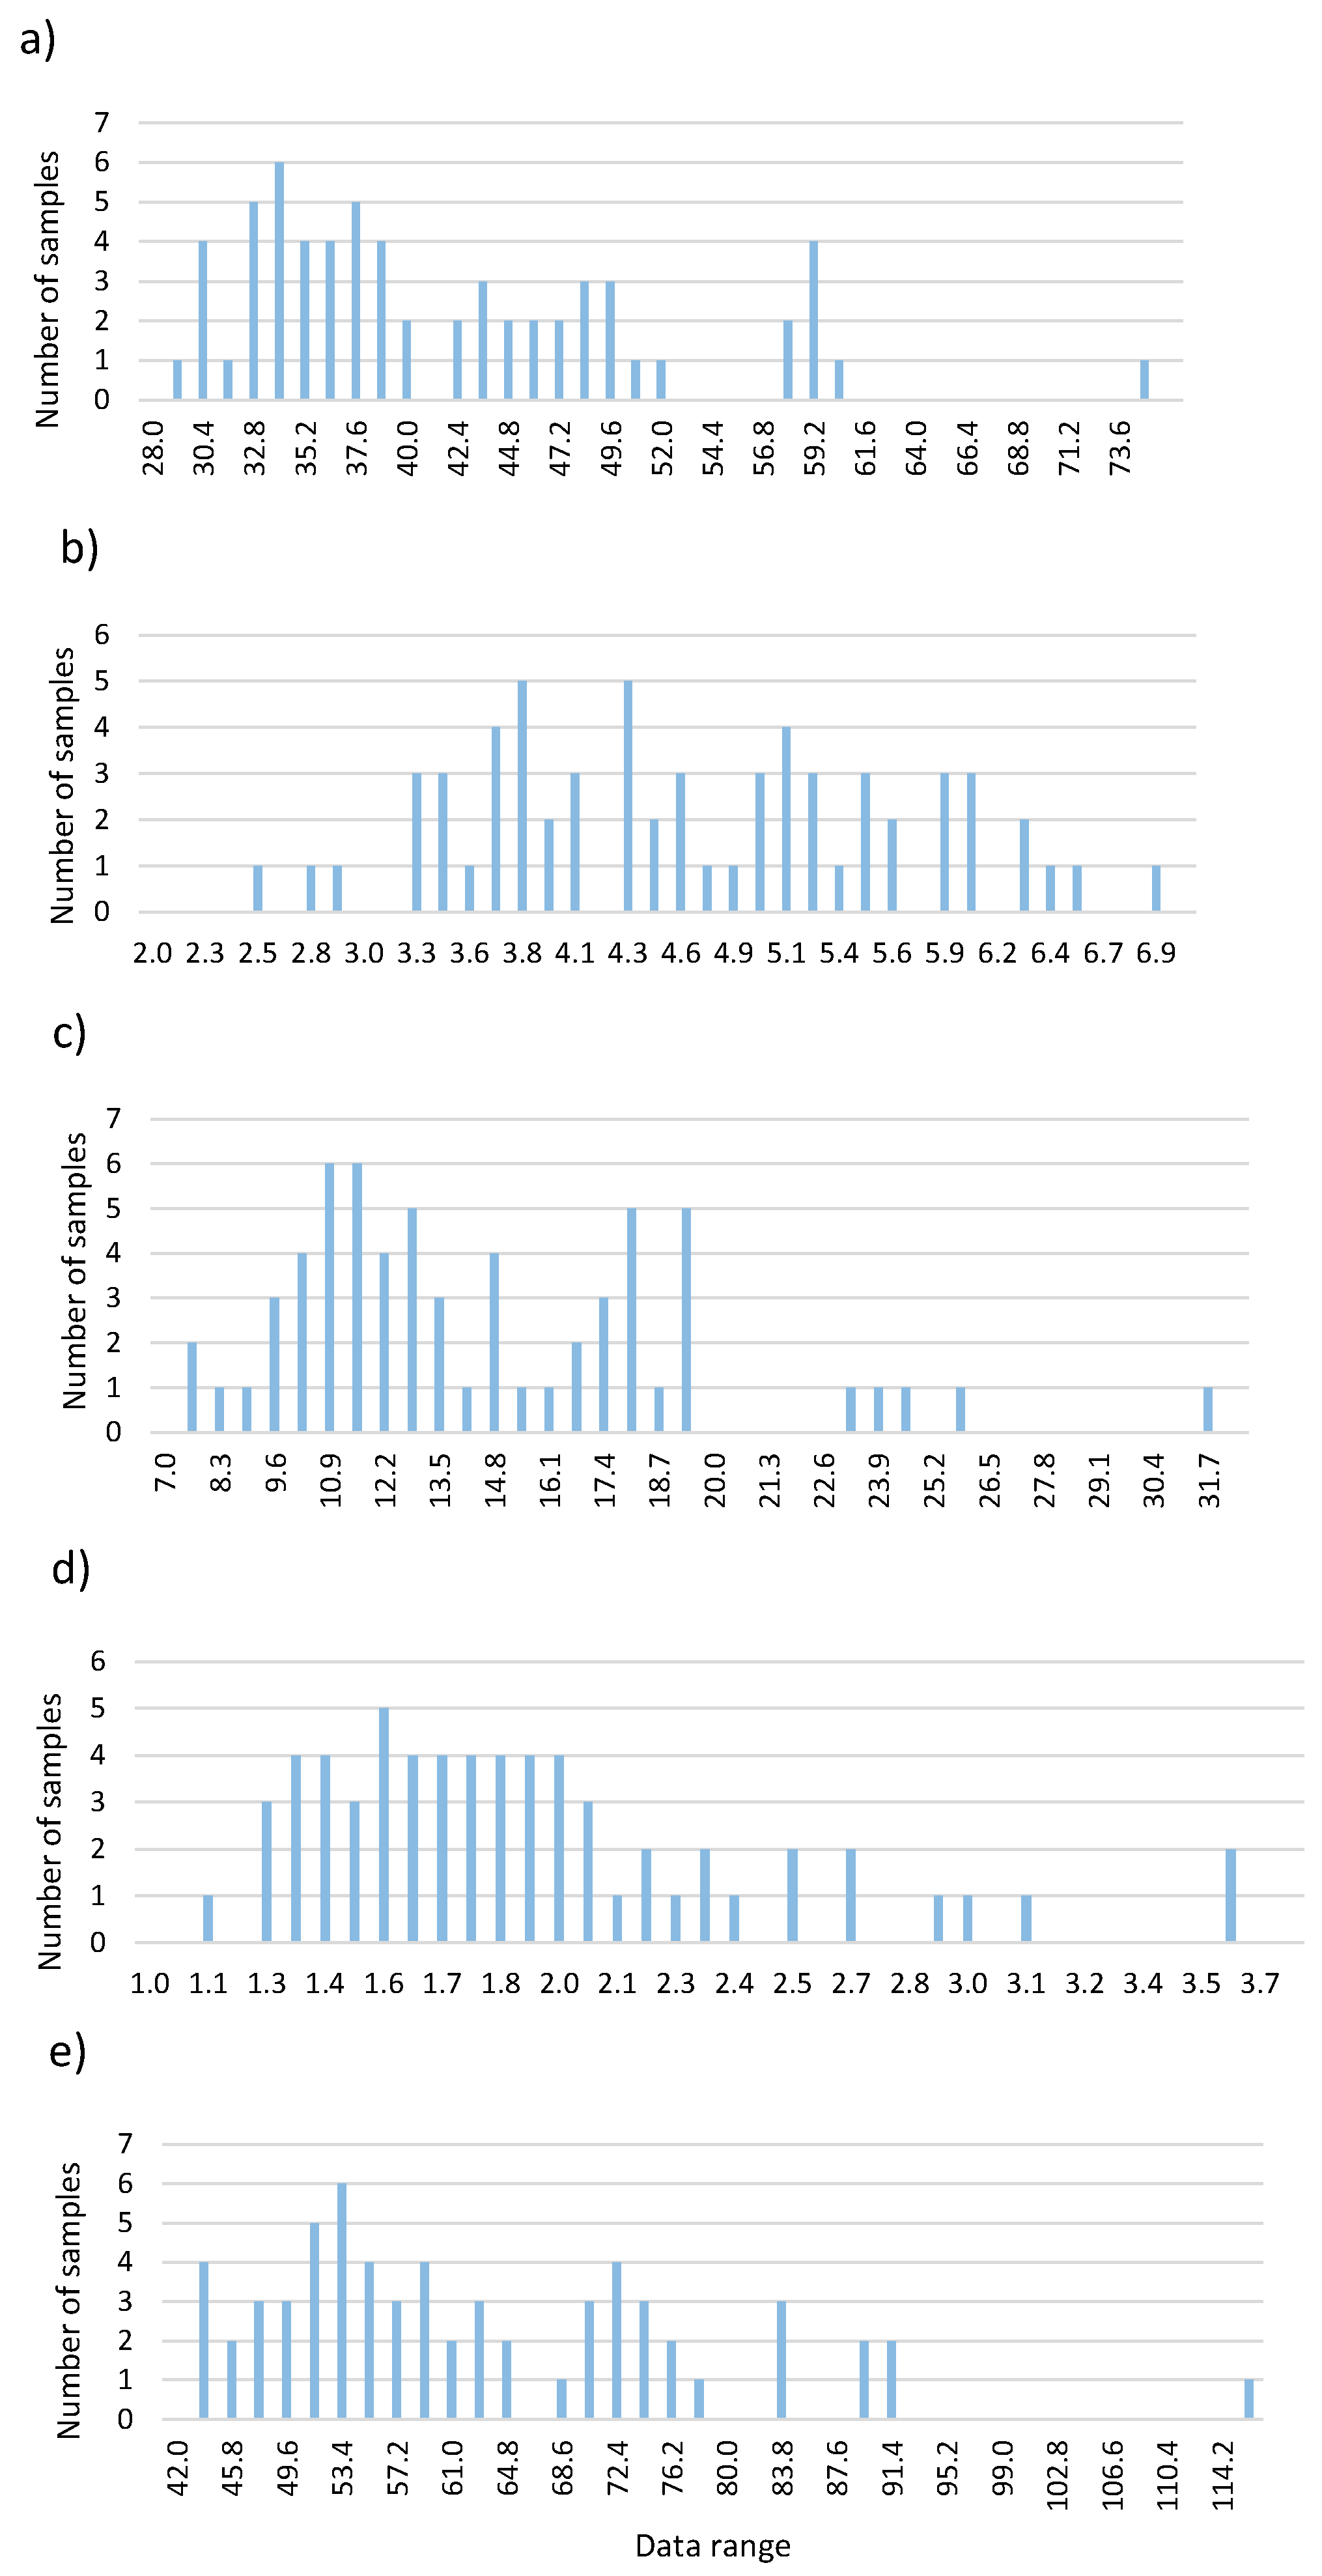

Table 1.
Concentrations of pentacyclic triterpenoids found in plant mixture samples.
| MA | iBA | OA | UO | Total | |
|---|---|---|---|---|---|
| Minimum | 28.89 | 2.40 | 10.08 | 1.10 | 42.47 |
| Maximum | 74.08 | 6.83 | 29.75 | 3.60 | 114.26 |
| Mean | 41.27 | 4.57 | 14.19 | 1.87 | 61.90 |
| SD | 9.59 | 1.03 | 2.13 | 0.54 | 14.68 |
| Total Values | 63 | 63 | 63 | 63 | 63 |
The concentration of each compound is expressed as mg per g of wet weight. MA: maslinic acid; OA: oleanolic acid; UO: uvaol; iBA: isomer of betulinic acid. The results are expressed as the mean. SD: standard deviation.
Table 2.
Results obtained in the calibration of the products.
| Mean | Minimum | Maximum | R2 | SECV | |
|---|---|---|---|---|---|
| MA | 39.85 | 16.28 | 63.43 | 0.75 | 4.97 |
| iBA | 4.59 | 1.48 | 7.69 | 0.77 | 0.78 |
| OA | 13.76 | 0.90 | 26.62 | 0.76 | 2.49 |
| UO | 1.78 | 0.66 | 2.89 | 0.75 | 0.28 |
| Total | 60.35 | 21.83 | 98.87 | 0.77 | 7.40 |
The data are the mean of all the experimental values. Abbreviations: R2, R-square; SECV: standard error of cross-validation.
Table 3.
Validation data.
| MA | iBA | OA | UO | Total | |
|---|---|---|---|---|---|
| N | 6 | 6 | 6 | 6 | 6 |
| Sep | 4.61 | 0.70 | 1.32 | 0.44 | 2.91 |
| R2 | 0.90 | 0.76 | 0.99 | 0.54 | 0.97 |
| BIAS | 1.75 | 0.10 | -0.66 | 0.12 | 0.73 |
MA: maslinic acid; iBA: isomer of betulinic acid; OA: oleanolic acid; UO: uvaol. The results are expressed as the mean. Sep: standard error of prediction; R2: R-square; BIAS: systematic error in the prediction.
Table 4.
Oxygen radical absorbance capacity (ORAC) value for the plant mixture samples.
| mg trolox equivalents/g of wet sample | 9877.62 ± 466.5 (9) |
| mmol trolox equivalents/100 g of wet sample | 3944.90 ± 186.3 (9) |
Results are expressed as the mean ± standard error of the mean with the number of determinations between parentheses.
Disclaimer/Publisher’s Note: The statements, opinions and data contained in all publications are solely those of the individual author(s) and contributor(s) and not of MDPI and/or the editor(s). MDPI and/or the editor(s) disclaim responsibility for any injury to people or property resulting from any ideas, methods, instructions or products referred to in the content. |
© 2024 by the authors. Licensee MDPI, Basel, Switzerland. This article is an open access article distributed under the terms and conditions of the Creative Commons Attribution (CC BY) license (http://creativecommons.org/licenses/by/4.0/).
Copyright: This open access article is published under a Creative Commons CC BY 4.0 license, which permit the free download, distribution, and reuse, provided that the author and preprint are cited in any reuse.


