Submitted:
02 July 2024
Posted:
03 July 2024
You are already at the latest version
Abstract
Ionizing radiation exposure can cause damage to diverse tissues and organs, with the hematopoietic system being the most sensitive. However, limited information is available regarding the radiosensitivity of various hematopoietic cell populations in the bone marrow due to the high heterogeneity of the hematopoietic system. In this study, we observed that granulocyte-macrophage progenitors, hematopoietic stem/progenitor cells and B cells within the bone marrow showed the highest sensitivity, exhibiting a rapid decrease in cell numbers following irradiation. Nonetheless, neutrophils, natural killer (NK) cells, T cells, and dendritic cells demonstrated a certain degree of radioresistance, with neutrophils exhibiting the most pronounced resistance. By employing single-cell transcriptome sequencing, we investigated the early responsive genes in various cell types following irradiation, revealing that distinct gene expression profiles emerged between radiosensitive and radioresistant cells. In B cells, radiation exposure led to a specific upregulation of genes associated with mitochondrial respiratory chain complexes, suggesting a connection between these complexes and cell radiosensitivity. In neutrophils, radiation exposure resulted in fewer gene alterations, indicating their potential for distinct mechanisms in radiation resistance. Collectively, this study provides insights into the molecular mechanism for the heterogeneity of radiosensitivity among the various bone marrow hematopoietic cell populations.
Keywords:
irradiation
; single-cell transcriptome sequencing
; bone marrow mononuclear cells
; radiosensitivity
Introduction
People are frequently exposed to various radiation environments such as natural background radiation, radiological examinations, and even nuclear disasters like the Chernobyl and Fukushima nuclear power plant accidents. Ionizing radiation can cause damage to diverse tissues and organs, with the hematopoietic system being the most sensitive[1]. Studies have previously investigated the damage patterns of white blood cells in peripheral blood after exposure [2,3]. It was found that radiation doses exceeding 2 Gy can result in a significant reduction in the number of blood cells. After exposure to 5-10 Gy, the number of lymphocytes can decrease by 50% within 24 hours, with a more severe decline within 48 hours[4]. In fact, there are numerous cell types in the hematopoietic system, which exhibit strong heterogeneity, and different cell types vary greatly in their sensitivity to radiation. It is reported that B cells are the most sensitive to radiation, while T cells exhibit intermediate sensitivity in peripheral blood. Natural killer cells, neutrophils, monocytes, and platelets demonstrate some degree of radiation resistance[5]. However, limited information is available regarding the radiosensitivity of the cell populations in bone marrow. Furthermore, the molecular mechanism underlying the differences in cellular radiosensitivity remains unclear.
In this study, by employing single-cell RNA-Seq, we investigated the early responsive genes in various cell types in bone marrow following irradiation, revealing that distinct gene expression profiles emerged between radiosensitive and radioresistant cells. The results of this study will enhance our comprehension of the molecular mechanisms underlying the heterogeneity of radiosensitivity in hematopoietic cell populations.
Materials and Methods
2.1. Mice
Male C57BL/6J mice were obtained from SPF (Beijing) and used at 8 to 10 weeks of age. Mice were housed under specific pathogen-free conditions. All experiment protocols were approved by the Institutional Animal Care and Use Committee of the Beijing Institute of Radiation Medicine (Beijing, China).
2.2. Isolation of Bone Marrow Mononuclear Cells
The bone marrow cells were flushed from intact femurs and tibias and then mashed with a 2mL disposable syringe plunger to generate a single-cell suspension. Collection of the cells was performed in 1640 media with 2% FBS and filtered through a 40-μm strainer. After centrifugation at 800g for 5 minutes at 4°C, the cell pellet were resuspended in 2 mL of RBC lysis buffer for 5 minutes. Centrifuge again to obtain the bone marrow mononuclear cells.
2.3. Flow Cytometry
Anti-CD45-PE, anti-CD3-APC, anti-CD11b-BV605, anti-B220-Pecy7, anti-NK1.1-APCH7, anti-CD11c-ef450, anti-F4/80-FITC, Ly6g-APC, Ly6c-Pecy7, APCH7-streptavidin, anti-Sca1-BV605, anti-cKit-Pecy7, anti-CD150-BV421, anti-CD48-AF700, anti-CD34-BV421, anti-CD16/32-AF700, RBC Lysis Buffer (420301) and biotin-conjugated mouse lineage cocktails were purchased from BioLegend (San Diego, CA, USA). Bone marrow mononuclear cells were stained with indicated antibodies for 15min. FACS analysis was performed on LSR-Fortessa, and data was analyzed using FlowJo 10.8.1 software.
2.4. Single-Cell Transcriptomic Analysis
The bone marrow single-cell suspension was adjusted to a concentration of 1×10⁶/mL, then the quality control was performed before scRNA-Seq. Library preparation involved the use of the 10× Genomics Chromium Controller machine and Chromium Next GEM Single Cell 3ʹ Reagent Kits v3.1 (Dual Index). Each sample was processed for oil-water emulsion generation with 16,000 cells, followed by RT-PCR amplification, cDNA amplification, and library construction. Sequencing was carried out using the Qubit 4.0 machine with Qubit™ 1× dsDNA Assay Kits, high sensitivity kit for library quality and concentration assessment, StepOnePlus™ Real-Time PCR System for library molar concentration determination, LabChip Touch for library insert size detection, and Illumina's NovaSeq 6000 sequencing platform for PE150 sequencing. Data analysis included using Cell Ranger 6.0.1 to generate matrix files from the raw data, Seurat for cell expression quantification and clustering analysis, SingleR for cell annotation, and clusterProfiler for GO enrichment analysis and KEGG analysis.
2.6. Statistical Analysis
The experimental data was presented as mean ± standard deviation, with statistical significance indicated by P < 0.05. Statistical analysis was performed using GraphPad Prism 9.0 software. FlowJo 10.8.1 software was used to analyze and graph the data values.
Results
3.1. Radiosensitivity Analysis of Multiple Cellular Populations in Bone Marrow (BM)
To evaluate the radiosensitivity of diverse bone marrow cell types, the mice were exposed to 6 Gy ionizing radiation (IR), and the cell populations' frequencies and counts in BM were monitored at different time points. It was observed that at 6 hours post-IR, there was a significant decrease in the number of B cells, hematopoietic stem progenitor cells (HSPCs), and granulocyte-macrophage progenitors (GMPs), with a noticeable decline in monocytes count at 12 hours post-IR (Figure 1A-B). However, the numbers of neutrophils, NKs, T cells, and dendritic cells (DCs) did not exhibit significant changes at 12 hours post-IR (Figure 1C-D). These results indicate that in the bone marrow, GMP, B cells, and HSPCs exhibit higher sensitivity to radiation, with monocytes showing moderate radiosensitivity, while neutrophils, NK cells, T cells, and dendritic cells exhibit a degree of radiation resistance.
3.2. Single-Cell Transcriptomes of Murine BM Mononuclear Cells after IR
To gain a comprehensive understanding of the heterogeneous impact of irradiation on the hematopoietic cellular composition in the mouse bone marrow, scRNA-Seq was conducted in normal control mice (NC) and irradiated mice (IR) (Figure 2A). After rigorous quality control, filter and removal of cell doublets, we obtained 9438 cells and 3188 genes. Based on the differential expression of marker genes, We identified and visualized 20 clusters using a uniform manifold approximation and projection (UMAP) (Figure 2B). Each cluster was then annotated using the CellMarker database and Cell Taxonomy database and marker genes reported in previous literature[6,7,8] (Figure 2C). We identified a total of 11 cell populations, including HSPCs, GMP, Monocyte/Monocyte Derived Macrophage (Mo/MoDM), Neutrophil, Basophil, Eosinophil, T cells, B cells, NKs, DCs and Erythrocytes (Ery) (Figure 2D).
We further analyzed the effects of IR on cell populations in BM. The splitted UMAPs showed that in IR mice BM, B cells were dramatically decreased (Figure 2E). The percentage of B cells decreased significantly from 21.62% before irradiation to a mere 2.05% after irradiation. In contrast, the percentages of neutrophils, T cells, and NK showed remarkable increase after irradiation (Figure 2F).
Analysis of the deferentially expressed genes (DEGs) in these cell populations suggested that radiation exposure was able to induce significant transcriptional differences across all cell populations (Figure 2G). B cells demonstrated the most drastic transcriptome alterations, whereas neutrophils, NK cells and GMP exhibited fewer DEGs with radiation exposure (Figure 2H), indicating that there was significant heterogeneity in the response to ionizing radiation among different cell subtypes in the bone marrow, both at the cellular and transcriptional levels.
3.3. Early Response Genes in Radiosensitive Cells
The above results show that GMP, HSPCs, and B cells exhibit obvious sensitivity to IR. We first analyzed the early response genes in HSPCs following IR. HSPCs were defined (Figure 3A) and 88 DEGs, including 66 upregulated genes and 22 downregulated genes were identified (Table S1, Figure 3B). It was not feasible for downregulated genes to enrich relevant biological processes due to the limited number. The upregulated genes were significantly enriched in apoptotic process, DNA damage response, inflammatory response, negative regulation of cell growth, and positive regulation of reactive oxygen species metabolic process (Figure 3C). In GMPs (Figure 3D), 30 upregulated genes and 9 downregulated genes were identified (Table S2, Figure 3E). GO analysis of the upregulated genes primarily reveals enrichment in positive regulation of intrinsic apoptotic signaling pathway, inflammatory response, and positive regulation of reactive oxygen species (ROS) metabolic process (Figure 3F).
It's interesting to note that, compared to other mature cells, B cells in the bone marrow exhibit the most pronounced sensitivity to IR. In B cells (Figure 3G), 116 upregulated genes and 179 downregulated genes (Table S3, Figure 3H) were identified. GO and KEGG analysis indicated that the upregulated genes were significantly enriched in negative regulation of cell growth, apoptotic process, response to DNA damage, and inflammatory response, and the downregulated genes were primarily associated with B cell receptor signaling pathway, AMPK signaling pathway, and NF-κB signaling pathway (Figure 3I).
In Mo/MoDM (Figure 3J), 72 upregulated genes and 19 downregulated genes were identified (Table S4, Figure 3K). The upregulated genes were primarily enriched in inflammatory response, apoptotic process, and positive regulation of reactive oxygen species metabolic process (Figure 3L).
Based on the above results, the upregulated genes in these radiosensitive cells were primarily enriched in pathways related to apoptosis, inflammatory response, and ROS regulation. In addition, the common upregulated genes in these radiosensitive cells were further analyzed, and a total of 11 genes were obtained, including Exoc4, Mgmt, Gm42047, Ccng1, Chil3, Cox6b2, Bax, Rps27l, Dcxr, S100a8, Lcn2 (Figure 3M). Among these, Rps27l, Bax, S100a8, Lcn2, and Mgmt are involved in the regulation of cell apoptosis. Notably, in B cells, several mitochondrial respiratory chain complex associated genes were specifically increased, including mt-Atp6, mt-Nd4, mt-Co2, mt-Cytb, mt-Co3, mt-Nd2, Cox6b2, mt-Nd3, and mt-Nd1 (Figure 3N).
3.4. Early Response Genes in Radioresistant Cells
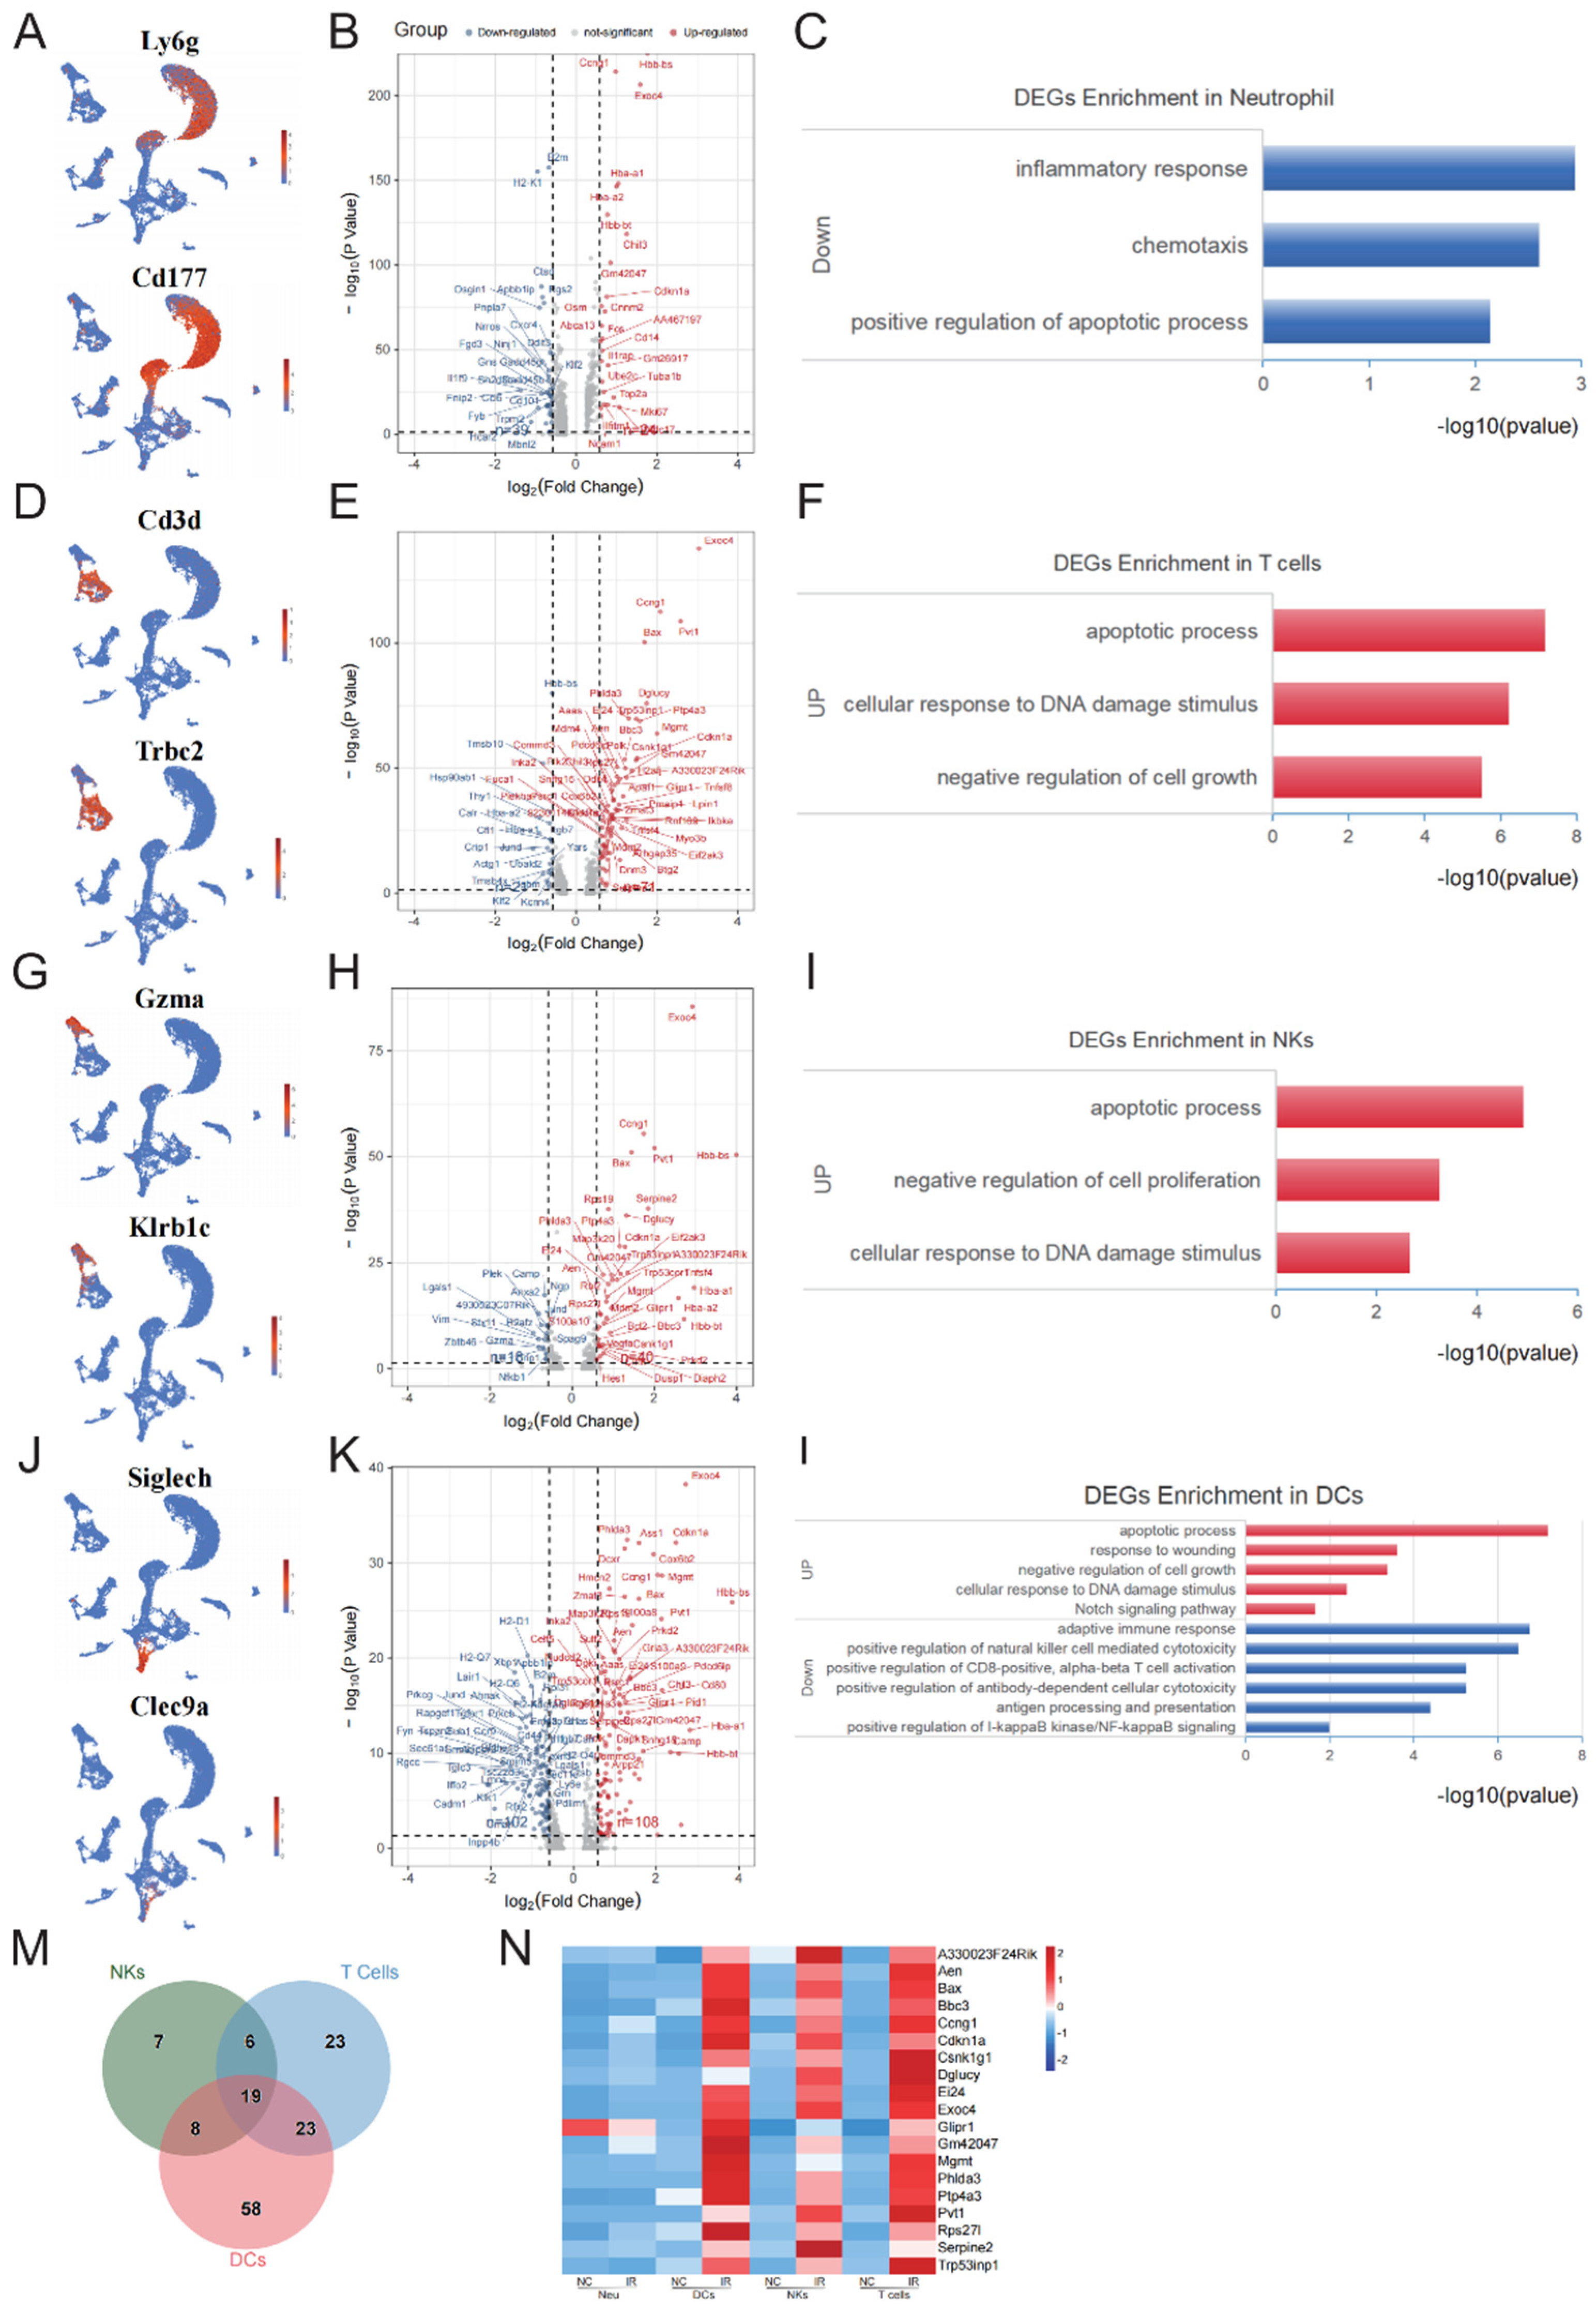
Flow cytometry analysis suggested that neutrophils, NKs, T cells, and DCs exhibited a lower sensitivity to IR. Analysis of early response genes within neutrophils revealed a limited number of DEGs, with 24 upregulated genes and 39 downregulated genes (Table S5, Figure 4B). The upregulated genes did not exhibit significant GO enrichment, while the downregulated genes were primarily enriched in inflammatory response, chemotaxis, and positive regulation of apoptotic process (Figure 4C).
Analysis of the DEGs in T cells (Figure 4D) revealed 71 upregulated genes and 21 downregulated genes (Table S6, Figure 4E). GO analysis indicated that the upregulated genes were primarily enriched in apoptotic process, cellular response to DNA damage stimulus, and negative regulation of cell growth (Figure 4F).
Analysis of the DEGs in NKs (Figure 4G) revealed 40 upregulated genes and 18 downregulated genes (Table S7, Figure 4H). The upregulated genes were primarily enriched in negative regulation of apoptotic process, negative regulation of cell proliferation, and cellular response to DNA damage stimulus (Figure 4I).
Interestingly, compared to other radioresistant cell types, DCs exhibited much more DEGs at the early stage after radiation exposure, although the cell number of DCs was not affected obviously (Figure 4J). Specifically, 102 upregulated genes and 108 downregulated genes were identified (Table S8, Figure 4K). GO analysis revealed that the upregulated genes were primarily enriched in positive regulation of apoptotic process, response to wounding, negative regulation of cell growth, Notch signaling pathway, and cellular response to DNA damage stimulus. The downregulated genes were primarily enriched in adaptive immune response including positive regulation of natural killer cell mediated cytotoxicity, positive regulation of CD8-positive, alpha-beta T cell activation, positive regulation of antibody-dependent cellular cytotoxicity, and antigen processing and presentation. Additionally, genes related to positive regulation of NF-κB signaling were also downregulated (Figure 4L)。
Due to the limited number of upregulated genes in neutrophils, we analyzed the common upregulated genes in NKs, T cells, and DCs. A total of 19 were obtained (Figure 4M), including Exoc4, Phlda3, Cdkn1a, Ccng1, Mgmt, Bax, Pvt1, Aen, A330023F24Rik, Ei24, Bbc3, Ptp4a3, Glipr1, Rps27l, Gm42047, Serpine2, Dglucy, Csnk1g1, and Trp53inp1. Among these genes, Cdkn1a, Mgmt, Bax, Aen, and Bbc3 are involved in regulating DNA damage response, while Ei24, Bax, Aen, Phlda3, Bbc3, and Trp53inp1 are implicated in the regulation of apoptosis. Furthermore, we noticed that in neutrophils, the majority of the DEGs were downregulated and there were relatively few common DEGs in neutrophils compared to other three cell populations. This suggested that neutrophils might possess unique mechanisms in resisting irradiation.
Discussion
Despite the widespread use of ionizing radiation in therapy and diagnostics and the inevitable exposure to external radiation, our understanding of radiation sensitivity in human blood cell populations remains limited, and the published data on this subject are inconsistent and varied. No comprehensive study has been conducted to systematically investigate the sensitivity of various bone marrow cell populations to IR. Additionally, the molecular mechanism for cell heterogeneity in radiation sensitivity remains unclear. In this study, we found that GMP, HSPCs and B cells in the bone marrow to be the most radiosensitive cells, and neutrophils, NKs, T cells, and DCs demonstrated a certain degree of radiation resistance. Single-cell RNA-Seq analysis revealed that distinct gene expression profiles emerged between radiosensitive and radioresistant cells, indicating distinct responses to radiation exposure. This study provides insights into the molecular mechanism for the heterogeneity of radiosensitivity among the bone marrow cells.
Previous studies have confirmed that bone marrow hematopoietic progenitors are extremely sensitive to IR. Due to their presence in the cell cycle, HSPCs are susceptible to radiation damage. However, it is intriguing that B cells, as mature blood cells, which are not typically in the cell cycle, exhibit significant radiosensitivity. This study reveals that the number of B cells in the bone marrow decreases significantly at 6 hours following irradiation and 295 DEGs in B cells were identified. Among these DEGs, various radioresistant genes were downregulated, such as NF-κB signaling pathway related genes including Nfkbia, Lyn, Traf3, Traf6, Blnk, Tnfrsf13c, Bcl2l1, Relb, and Birc3. Studies have demonstrated that the constitutive activation of NF-κB associated genes in tumor cells can enhance their resistance to radiation[9]. For example, the BCL2L1 gene plays a crucial role in cell survival following radiation exposure and inhibition of BCL2L1 combined with radiotherapy significantly hindered tumor growth in vitro and in vivo[10]. In addition, genes associated with the AMPK signaling pathway are also significantly downregulated, including Pfkfb3, Tbc1d1, Eef2k, Pik3ca, Rps6kb1, Ppp2r2d, Akt3, Ppp2r5a, Pik3r1, Foxo3, Foxo1, etc. Research indicates that pharmacological PFKFB3 inhibition induces radiosensitization in transformed cells[11]. Overexpression of eEF2K led to radioresistance and silencing eEF2K promoted radiosensitivity and apoptosis [12]. More interestingly, among the upregulated genes, genes related to mitochondrial respiratory chain complexes were also enriched, such as mt-Atp6, mt-Nd4, mt-Co2, mt-Cytb, mt-Co3, mt-Nd2, Cox6b2, mt-Nd3, mt-Nd1. These proteins are components of mitochondrial complex Ⅰ, Ⅲ, Ⅳ, and Ⅴ. Research has shown that mt-ATP6, mt-Nd1, mt-Nd5, and mt-Nd6 are upregulated in cells directly exposed to IR, suggesting that the mitochondrial gene expression response is part of a complex stress response operating in radiation-treated cells[13]. The upregulation of mitochondrial complex-related genes suggests that there may be higher levels of oxidative phosphorylation in B cells after irradiation. Although there is no evidence yet to demonstrate the association between mitochondrial complex activity with radiosensitivity, some studies have shown that anti-tumor compounds like chrysin can induce apoptosis in chronic lymphocytic leukemia B-lymphocytes by targeting mitochondrial complexes II and V, and abnormal activation of mitochondrial complexes may render B cells more susceptible to exogenous toxins[14]. To illustrate the association between mitochondrial complexes and radiation sensitivity, further detailed investigations are necessary.
Our research demonstrates that neutrophils in the bone marrow exhibit significant radioresistance. Neutrophils, the most abundant cell type among white blood cells, possess a short lifespan and strong regenerative capacity[15]. Studies have reported that peripheral blood neutrophils lack DNA damage repair responses following IR, such as the upregulation of γH2AX and the co-localization of MDC1, NBS1, MRE11, RAD50, ATM kinase, and 53BP1 with γH2AX[16]. DNA damage repair proteins such as DNA-PKCs, ATR, and MGMT are barely detectable in neutrophils. Correspondingly, neutrophils do not undergo radiation-induced cell death within 24 hours post-IR. Our results showed that neutrophils only exhibited few DEGs in the early stage post-IR. The genes associated with apoptosis such as Gadd45b, Inpp5d, Ddit3, Ctsd, and Gadd45g were downregulated. Some research suggests that the high degree of chromatin condensation in neutrophils might play a significant role in their resistance to DNA damage induced by radiation. This could explain why these cells do not exhibit significant changes in DEGs following IR. Elucidating the molecular mechanisms underlying the radioresistance of neutrophil will contribute to the development of novel strategies to facilitate the rapid recovery of neutrophils following IR.
In our study, a high degree of responsiveness of DCs to IR was observed at the transcriptome level. DCs are the most potent professional antigen-presenting cells and inducers of T cell-mediated immunity. Analysis of the DEGs revealed upregulated genes were enriched in the Notch signaling pathway, including Notch1, Ptp4a3, Rps19, Bloc1s2, and Maml3. Notch1 expression was reported to be induced by high-dose IR [17], while inhibiting Notch1 can enhance the radiosensitivity of tumor cells[18]. In addition, genes related to response to wounding were also upregulated, such as Serpine2, Snhg15, Zfp36, Pvt1, Bax, and Sulf2. Previous studies reported that SERPINE2 can regulate the DNA damage response induced by IR in lung cancer and knocking down SERPINE2 leads to abnormal DNA damage repair, resulting in radiation-induced cell death[19]. Furthermore, it was observed that several genes related to adaptive immune response were downregulated. It is crucial to elucidate the role of these genes in enabling DCs to resist radiation damage.
Conclusions
In summary, our study revealed the radiosensitivity heterogeneity of bone marrow cell populations. The results of this study contribute to a better understanding of the biological response mechanisms of bone marrow cells to IR and provide important insights for radiation protection against IR damage.
Supplementary Materials
The following supporting information can be downloaded at the website of this paper posted on Preprints.org.
Funding
This study was supported in part by grants from the Ministry of Science and Technology of the People’s Republic of China (Grant No. 2022YFA1103502), and the State Key Laboratory of Proteomics (Grant No. SKLP-K202201).
Ethics approval and consent to participate
All animal experiments were reviewed and approved by the Laboratory Animal Center of the Academy of Military Medical Science in China’s Institutional Animal Care and Use Committee reviewed and authorized all animal studies (Approval No.: IACUC-DWZX-2020-619). All studies involving animals are reported in accordance with the ARRIVE guidelines for reporting experiments involving animals.
Acknowledgements
No applicable
Declaration of competing interest
The authors declare there is no competing interests.
References
- Mavragani, I. V.; Laskaratou, D. A.; Frey, B.; Candéias, S. M.; Gaipl, U. S.; Lumniczky, K.; Georgakilas, A. G., Key mechanisms involved in ionizing radiation-induced systemic effects. A current review. Toxicology Research 2016, 5, (1), 12-33. [CrossRef] [PubMed]
- Su, L.; Dong, Y.; Wang, Y.; Wang, Y.; Guan, B.; Lu, Y.; Wu, J.; Wang, X.; Li, D.; Meng, A.; Fan, F., Potential role of senescent macrophages in radiation-induced pulmonary fibrosis. Cell Death Dis 2021, 12, (6), 527. [CrossRef] [PubMed]
- Li, H. H.; Wang, Y. W.; Chen, R.; Zhou, B.; Ashwell, J. D.; Fornace, A. J., Jr., Ionizing Radiation Impairs T Cell Activation by Affecting Metabolic Reprogramming. Int J Biol Sci 2015, 11, (7), 726-36. [CrossRef] [PubMed]
- Guo, J. J.; Liu, N.; Ma, Z.; Gong, Z. J.; Liang, Y. L.; Cheng, Q.; Zhong, X. G.; Yao, Z. J., Dose-Response Effects of Low-Dose Ionizing Radiation on Blood Parameters in Industrial Irradiation Workers. Dose Response 2022, 20, (2), 15593258221105695. [CrossRef] [PubMed]
- Heylmann, D.; Ponath, V.; Kindler, T.; Kaina, B., Comparison of DNA repair and radiosensitivity of different blood cell populations. Scientific Reports 2021, 11, (1), 2478. [CrossRef] [PubMed]
- Gao, S.; Shi, Q.; Zhang, Y.; Liang, G.; Kang, Z.; Huang, B.; Ma, D.; Wang, L.; Jiao, J.; Fang, X.; Xu, C. R.; Liu, L.; Xu, X.; Göttgens, B.; Li, C.; Liu, F., Identification of HSC/MPP expansion units in fetal liver by single-cell spatiotemporal transcriptomics. Cell Res 2022, 32, (1), 38-53. [CrossRef] [PubMed]
- Wang, X.; Yang, L.; Wang, Y. C.; Xu, Z. R.; Feng, Y.; Zhang, J.; Wang, Y.; Xu, C. R., Comparative analysis of cell lineage differentiation during hepatogenesis in humans and mice at the single-cell transcriptome level. Cell Res 2020, 30, (12), 1109-1126. [CrossRef] [PubMed]
- Zeng, X.; Li, X.; Li, X.; Wei, C.; Shi, C.; Hu, K.; Kong, D.; Luo, Q.; Xu, Y.; Shan, W.; Zhang, M.; Shi, J.; Feng, J.; Han, Y.; Huang, H.; Qian, P., Fecal microbiota transplantation from young mice rejuvenates aged hematopoietic stem cells by suppressing inflammation. Blood 2023, 141, (14), 1691-1707. [CrossRef] [PubMed]
- Singh, V.; Gupta, D.; Arora, R., NF-kB as a key player in regulation of cellular radiation responses and identification of radiation countermeasures. Discoveries (Craiova) 2015, 3, (1), e35. [CrossRef] [PubMed]
- Yin, L.; Hu, X.; Pei, G.; Tang, M.; Zhou, Y.; Zhang, H.; Huang, M.; Li, S.; Zhang, J.; Citu, C.; Zhao, Z.; Debeb, B. G.; Feng, X.; Chen, J., Genome-wide CRISPR screen reveals the synthetic lethality between BCL2L1 inhibition and radiotherapy. Life Sci Alliance 2024, 7, (4).
- Gustafsson, N. M. S.; Färnegårdh, K.; Bonagas, N.; Ninou, A. H.; Groth, P.; Wiita, E.; Jönsson, M.; Hallberg, K.; Lehto, J.; Pennisi, R.; Martinsson, J.; Norström, C.; Hollers, J.; Schultz, J.; Andersson, M.; Markova, N.; Marttila, P.; Kim, B.; Norin, M.; Olin, T.; Helleday, T., Targeting PFKFB3 radiosensitizes cancer cells and suppresses homologous recombination. Nat Commun 2018, 9, (1), 3872. [CrossRef] [PubMed]
- Zhu, H.; Song, H.; Chen, G.; Yang, X.; Liu, J.; Ge, Y.; Lu, J.; Qin, Q.; Zhang, C.; Xu, L.; Di, X.; Cai, J.; Ma, J.; Zhang, S.; Sun, X., eEF2K promotes progression and radioresistance of esophageal squamous cell carcinoma. Radiother Oncol 2017, 124, (3), 439-447. [CrossRef] [PubMed]
- Chaudhry, M. A.; Omaruddin, R. A., Mitochondrial gene expression in directly irradiated and nonirradiated bystander cells. Cancer Biother Radiopharm 2011, 26, (5), 657-63. [CrossRef] [PubMed]
- Salimi, A.; Roudkenar, M. H.; Seydi, E.; Sadeghi, L.; Mohseni, A.; Pirahmadi, N.; Pourahmad, J., Chrysin as an Anti-Cancer Agent Exerts Selective Toxicity by Directly Inhibiting Mitochondrial Complex II and V in CLL B-lymphocytes. Cancer Invest 2017, 35, (3), 174-186. [CrossRef] [PubMed]
- Summers, C.; Rankin, S. M.; Condliffe, A. M.; Singh, N.; Peters, A. M.; Chilvers, E. R., Neutrophil kinetics in health and disease. Trends Immunol 2010, 31, (8), 318-24. [CrossRef] [PubMed]
- Ponath, V.; Heylmann, D.; Haak, T.; Woods, K.; Becker, H.; Kaina, B., Compromised DNA Repair and Signalling in Human Granulocytes. J Innate Immun 2019, 11, (1), 74-85. [CrossRef] [PubMed]
- Banerjee, D.; Barton, S. M.; Grabham, P. W.; Rumeld, A. L.; Okochi, S.; Street, C.; Kadenhe-Chiweshe, A.; Boboila, S.; Yamashiro, D. J.; Connolly, E. P., High-Dose Radiation Increases Notch1 in Tumor Vasculature. Int J Radiat Oncol Biol Phys 2020, 106, (4), 857-866. [CrossRef] [PubMed]
- Zhang, H.; Jiang, H.; Chen, L.; Liu, J.; Hu, X.; Zhang, H., Inhibition of Notch1/Hes1 signaling pathway improves radiosensitivity of colorectal cancer cells. Eur J Pharmacol 2018, 818, 364-370. [CrossRef] [PubMed]
- Zhang, J.; Wu, Q.; Zhu, L.; Xie, S.; Tu, L.; Yang, Y.; Wu, K.; Zhao, Y.; Wang, Y.; Xu, Y.; Chen, X.; Ma, S.; Zhang, S., SERPINE2/PN-1 regulates the DNA damage response and radioresistance by activating ATM in lung cancer. Cancer Lett 2022, 524, 268-283. [CrossRef] [PubMed]
Figure 1.
Radiosensitivity analysis of multiple cellular populations in BM. Mice were exposed to 6Gy total body irradiation for the indicated time and the mononuclear cells were analyzed by flow cytometry. The following markers were used: HSPCs: Lin-Sca-1+c-Kit+; GMP: Lin-Sca-1+c-Kit+CD150+CD48+; B cells: B220+; T cells: CD3+; neurtrophil (Neu): CD11b+Ly6g+; monocyte (Mo): CD11b+Ly6c+; NKs: NK1.1+; DCs: CD11c+. Error bars represent SEM.
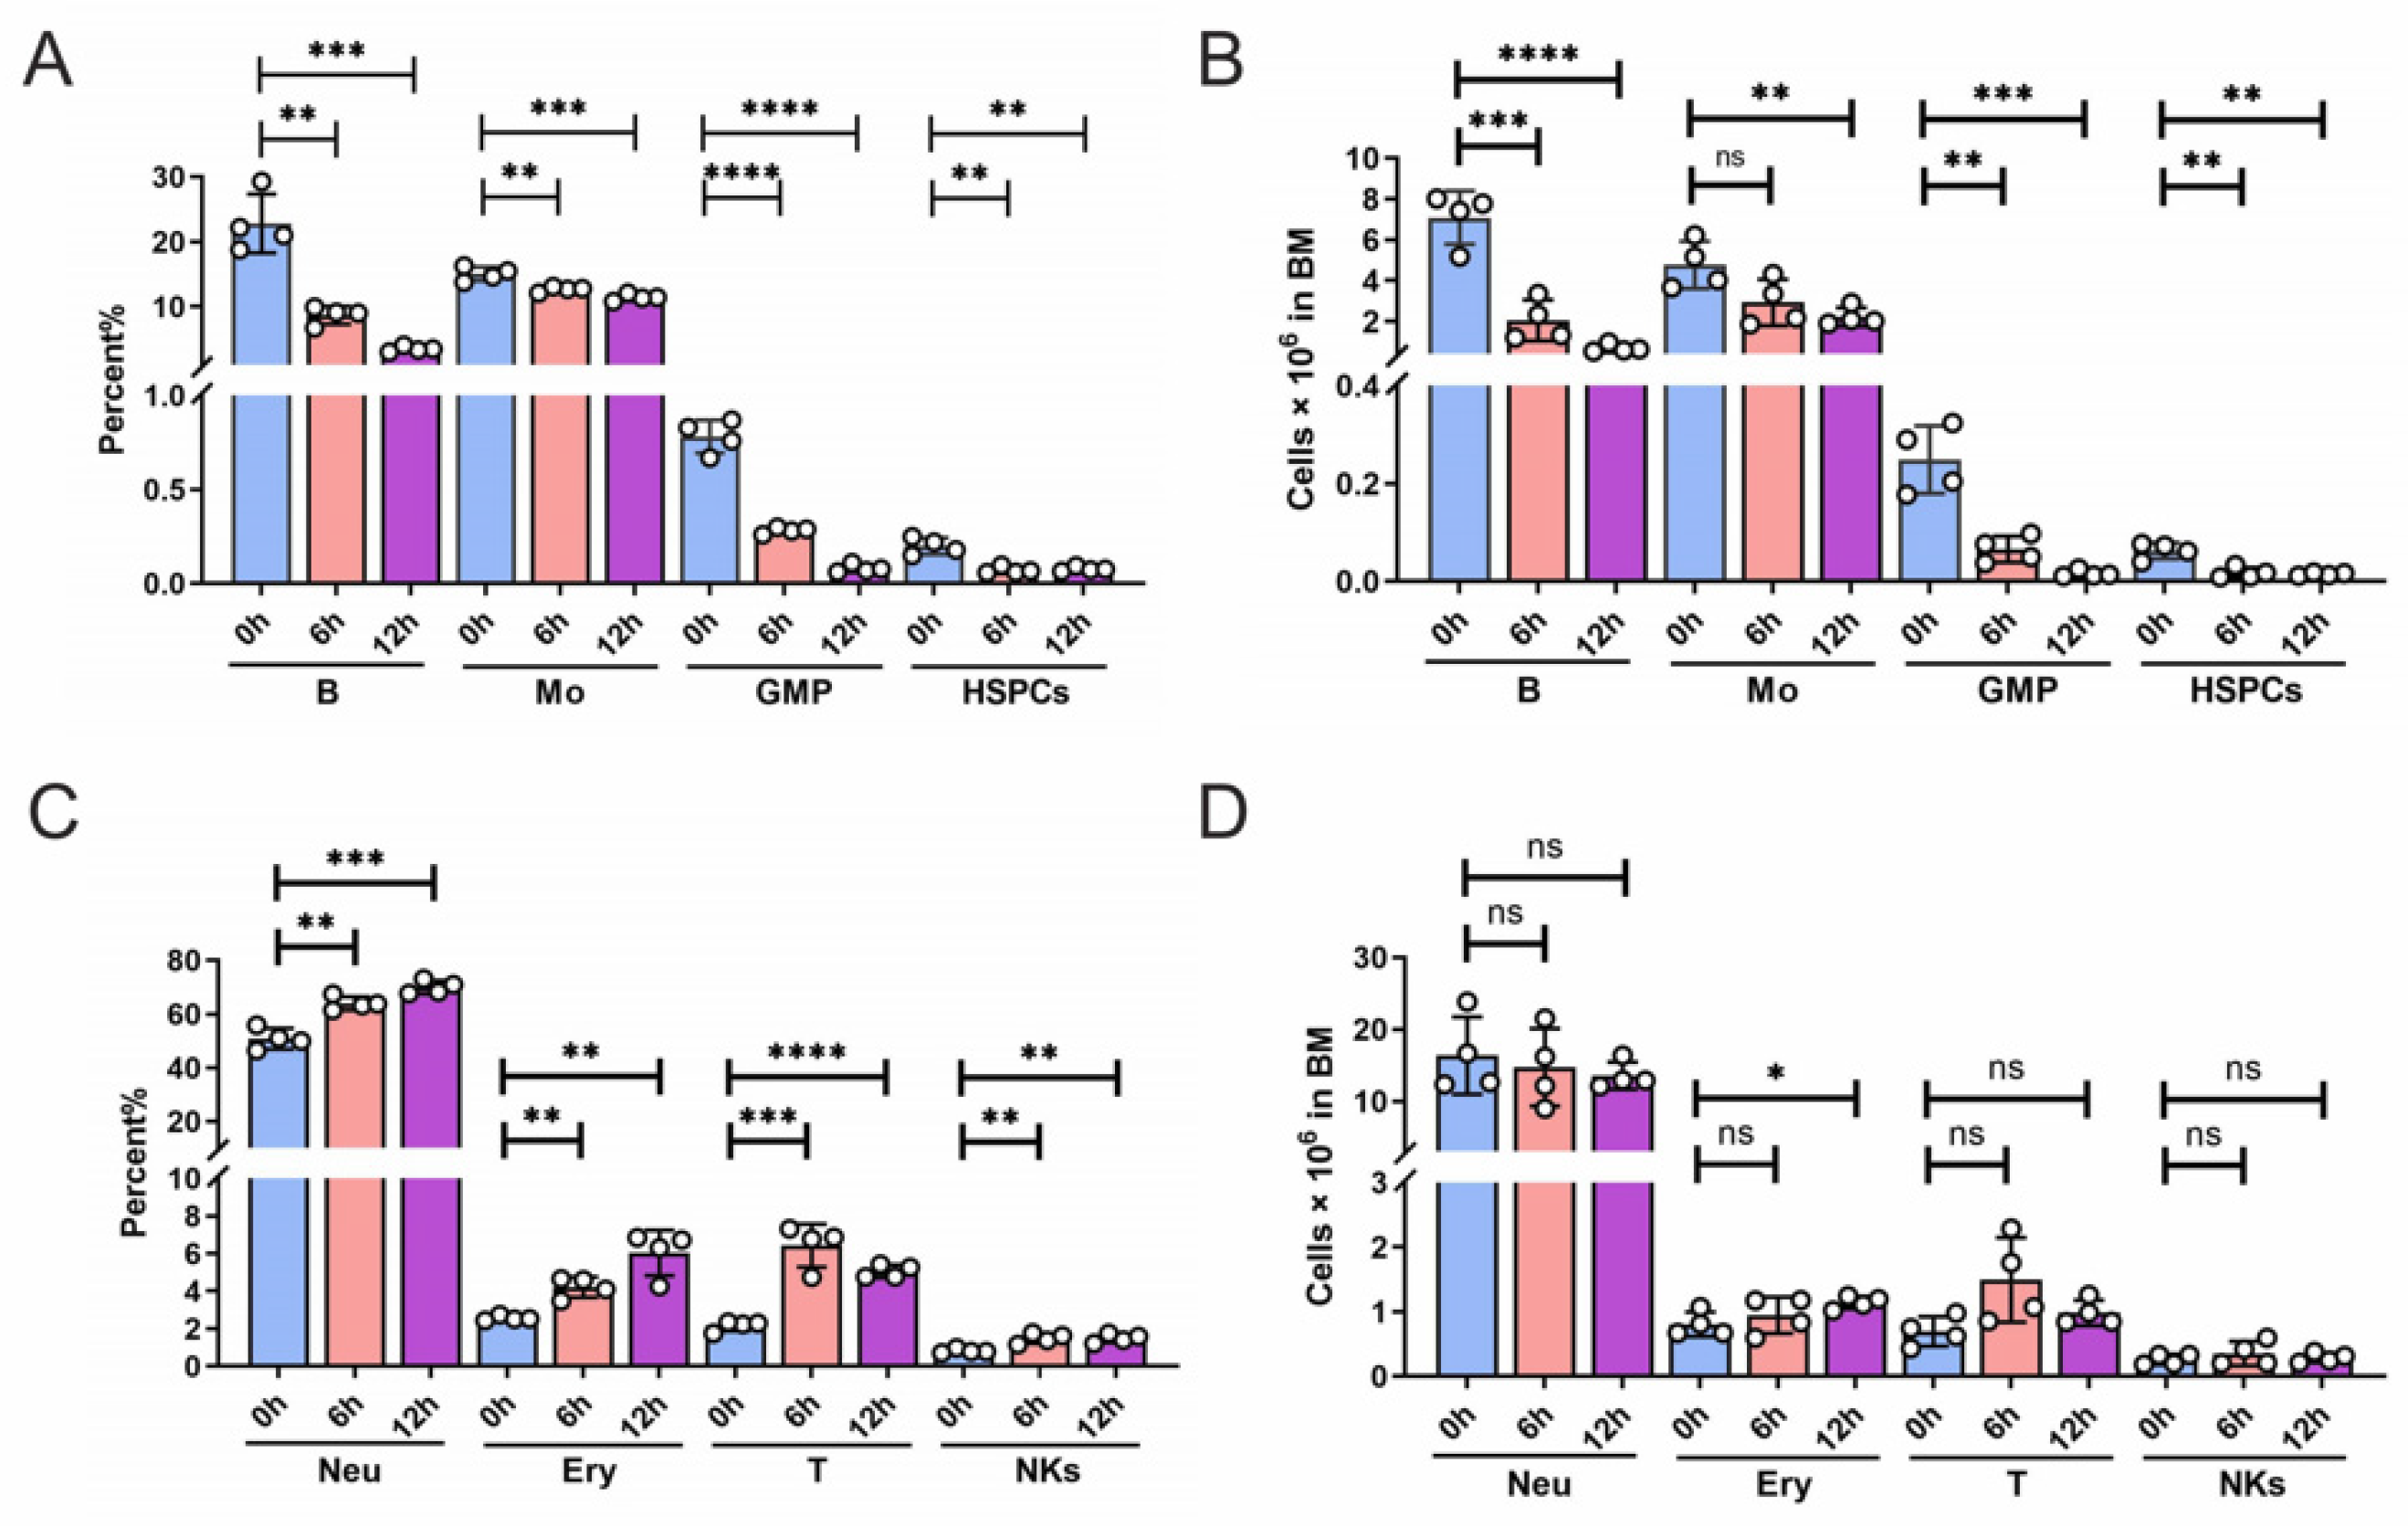
Figure 2.
Single-cell transcriptomes of murine BM mononuclear cells after irradiation. (A) Schematic diagram of the experimental design. (B) UMAP plots (Colored by clusters) of BM mononuclear cells from normal control (NC) and irradiated mice (IR). (C) Dot plot of 11 cell types with unique signature gene expression profiles. (D) UMAP plots (Colored by 11 cell types) of BM mononuclear cells. (E) Splitted UMAPs from NC and IR group. (F) Proportion of identified cell types between groups. (G) Heatmap of the top 10 DEGs in individual cell types. (H) Numbers of significant DEGs (fold change> 1.5, adj.p < 0.05) of 11 populations between NC and IR group.
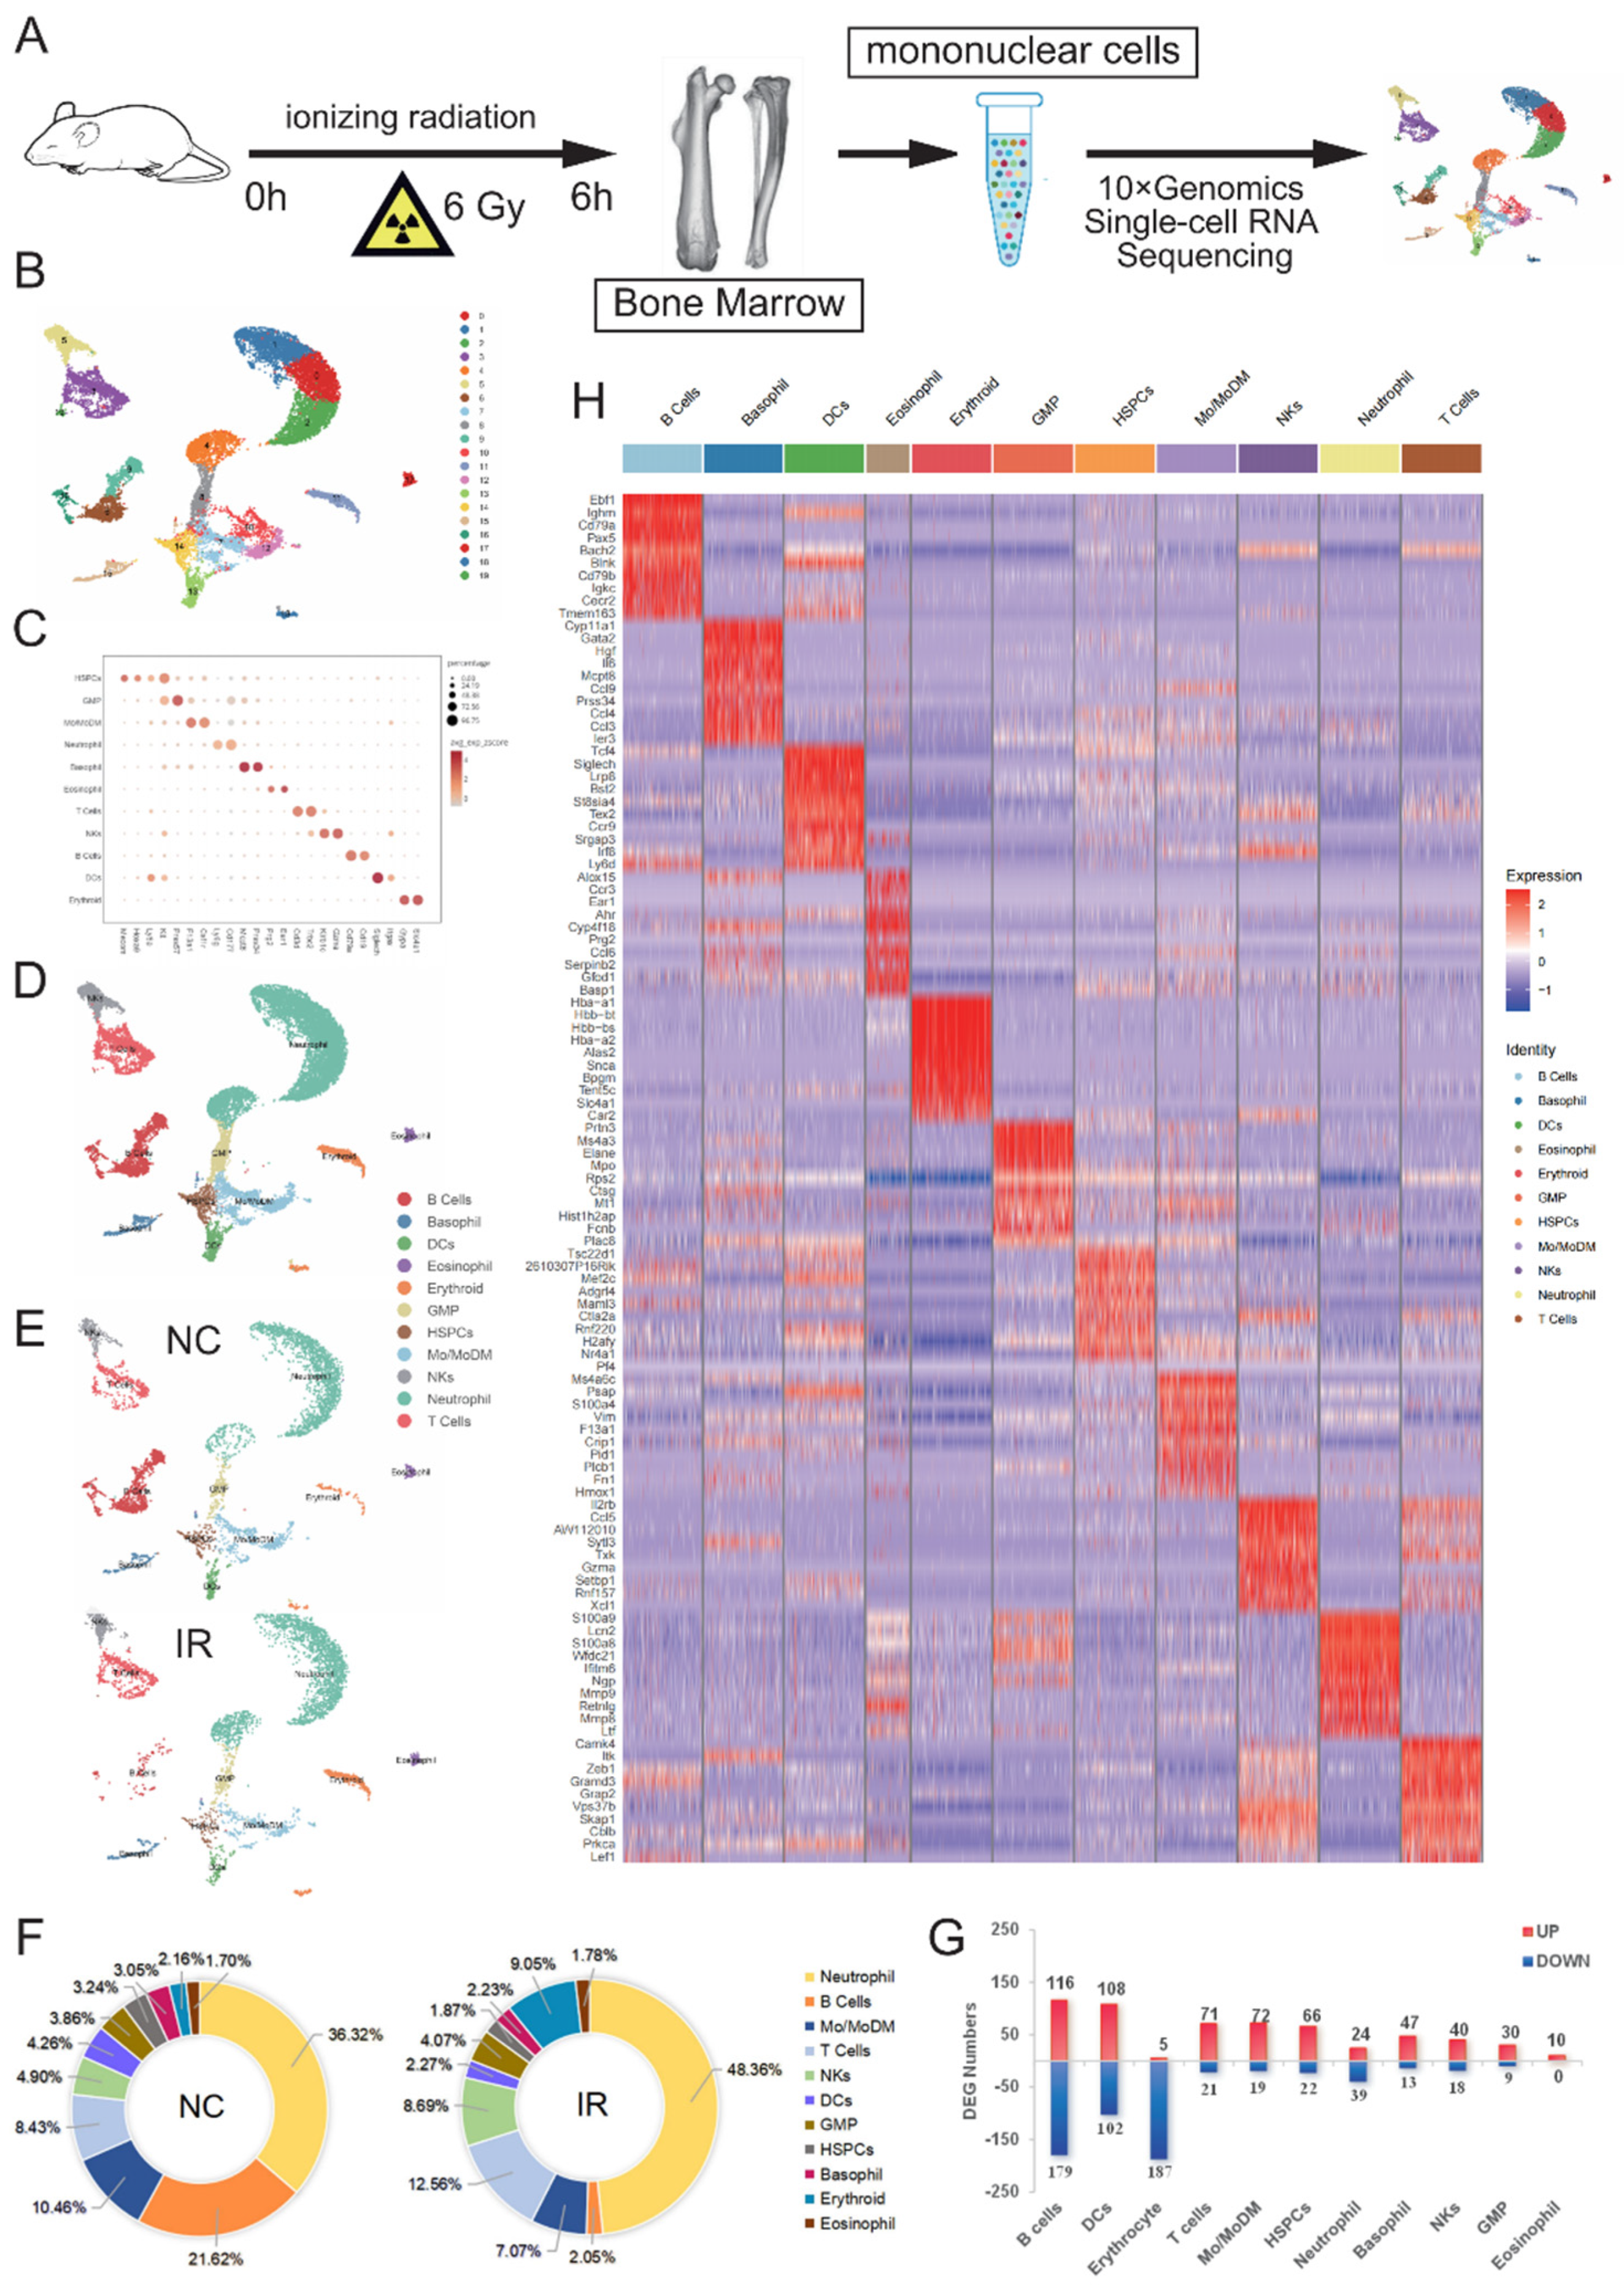
Figure 3.
Early response genes in radiosensitive cells. (A) UMAP plot of specific markers defining HSPCs. (B) Volcano plot showing significant DEGs of HSPCs between NC and IR group. (C) The enrichment analysis of DEGs for HSPCs between NC and IR group. (D) UMAP plot of specific markers defining GMP. (E) Volcano plot showing significant DEGs of GMP between NC and IR group. (F) The enrichment analysis of DEGs for GMP between NC and IR group. (G) UMAP plot of specific markers defining B cells. (H) Volcano plot showing significant DEGs of B cells between NC and IR group. (I) The enrichment analysis of DEGs for B cells between NC and IR group. (J) UMAP plot of specific markers defining Mo/MoDM cells. (K) Volcano plot showing significant DEGs of Mo/MoDM cells between NC and IR group. (L) The enrichment analysis of DEGs for Mo/MoDM cells between NC and IR group. (M) Venn diagrams show the key genes HSPCs, GMP, B cells, and Mo/MoDM. (N) Heatmap showing the expression of mitochondrial respiratory chain complex genes in HSPCs, GMP, B cells, and Mo/MoDM.
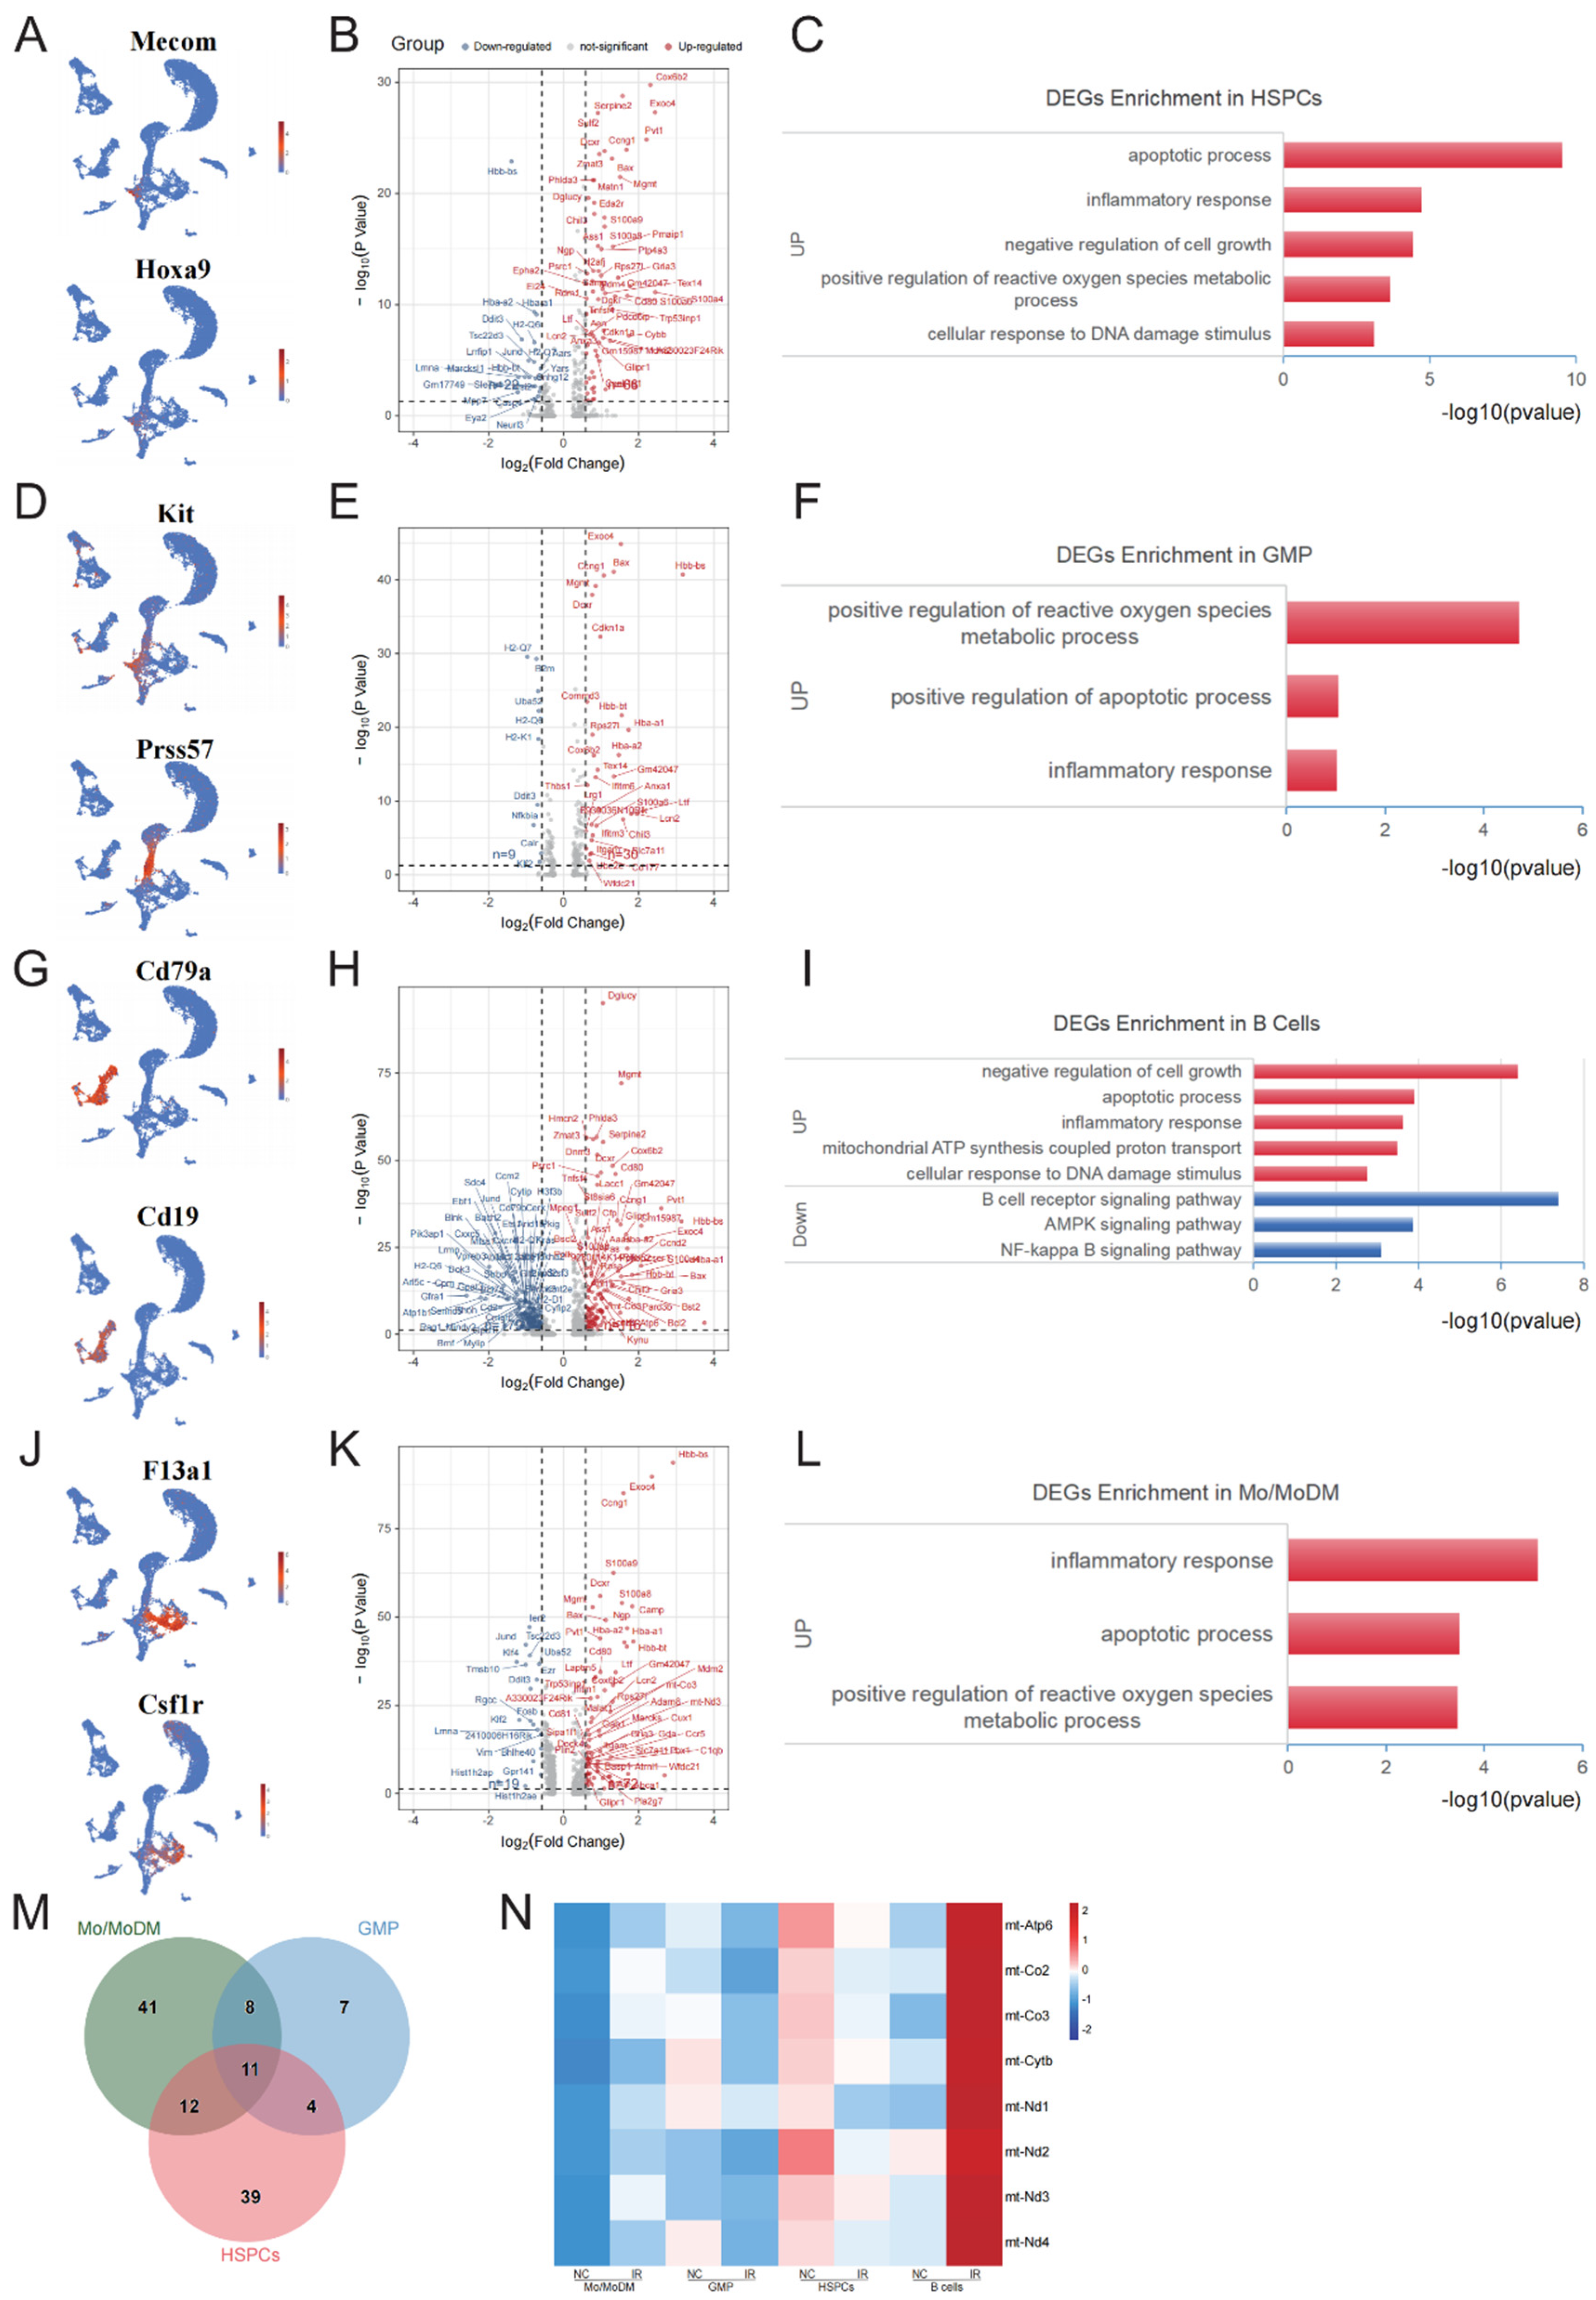
Figure 4.
Early response genes in radioresistant cells. (A) UMAP plot of specific markers defining neutrophil. (B) Volcano plot showing significant DEGs of neutrophil between NC and IR group. (C) The enrichment analysis of DEGs for neutrophils between NC and IR group. (D) UMAP plot of specific markers defining T cells. (E) Volcano plot showing significant DEGs of T cells between NC and IR group. (F) The enrichment analysis of DEGs for T cells between NC and IR group. (G) UMAP plot of specific markers defining NKs. (H) Volcano plot showing significant DEGs of NKs between NC and IR group. (I) The enrichment analysis of DEGs for NKs between NC and IR group. (J) UMAP plot of specific markers defining DC. (K) Volcano plot showing significant DEGs of DC cells between NC and IR group. (L) The enrichment analysis of DEGs for DC cells between NC and IR group. (M) Venn diagrams show the key genes T cells, NKs, and DC cells. (N) Heatmap showing the expression of key genes in T cells, NKs, and DC cells.
Disclaimer/Publisher’s Note: The statements, opinions and data contained in all publications are solely those of the individual author(s) and contributor(s) and not of MDPI and/or the editor(s). MDPI and/or the editor(s) disclaim responsibility for any injury to people or property resulting from any ideas, methods, instructions or products referred to in the content. |
© 2024 by the authors. Licensee MDPI, Basel, Switzerland. This article is an open access article distributed under the terms and conditions of the Creative Commons Attribution (CC BY) license (http://creativecommons.org/licenses/by/4.0/).
Copyright: This open access article is published under a Creative Commons CC BY 4.0 license, which permit the free download, distribution, and reuse, provided that the author and preprint are cited in any reuse.


