Submitted:
01 July 2024
Posted:
03 July 2024
You are already at the latest version
Abstract
The forage fish, a crucial source of nutrition in developing countries, are unfortunately primarily used for fishmeal and aquafeed production for aquaculture that mainly serves consumers in developed countries. Industrial fish use leaves a meager portion of the catch for direct human consumption in the fish-producing countries, leading to inflated fish prices locally. Overfishing forage fish necessary to support the fish reduction industry disrupts the ecosystem, diminishes the catch of larger fish, such as mackerel, and marginalizes local artisanal fishermen. This article appraises roughly the financial and nutritional impacts of elevated fish prices on low-income consumers in forage fish-producing countries, drawing attention to the ethical implications of this situation. A hypothetical 10% boost in the annual supply of fresh forage fish to the current global supply of 5 million MT markets could save consumers hundreds of millions of US dollars globally, tens of mil-lions of US dollars nationally, and several dollars for a family while improving the nutrition of families that depend on forage fish. The numbers suggest that even a modest boost to the supply of forage fish in fresh fish markets could significantly benefit the fish-producing nations' consumers and the fish-producing nations. In some countries, such as South Africa, the orders of magnitude of these sums approach that of the entire local fish reduction industries' value. The increased fish prices could be considered involuntary subsidies by low-income consumers to the aquafeed and aquaculture industries. In summary, the reduction industry's and aquaculture's current use of captured forage fish warrants further scrutiny, as it inadvertently burdens disadvantaged societies financially and nutritionally. The article proposes alternative protein sources and cultivating non-carnivorous fish among several optional measures to ensure equitable distribution of forage fish resources.
Keywords:
Keywords:
; artisanal fishermen
; natural food chain
; anchovy
; sardines
; overfishing
; poor families
; social justice
; supply and price
; fish market
; fishmeal
; fisherfolk
1. Introduction
Forage fish, also known as small pelagic fish and baitfish (Figure 1), constitute a significant portion of the global capture fisheries that typically feed low in the food chain (trophic level 2.6 on average, [1]). They are intermediaries between plankton and larger predatory fish, marine mammals, seabirds, and the fish market [2,3,4]. Many forage fish species have high fecundity and reach maturity early, contributing to their rapid population dynamics and high yields [5]. When eaten by humans, these fish supply consumers with essential nutrients such as proteins and lipids. However, fresh fish consumers have the bad fortune that a significant portion of the local catch of forage fish does not reach their fresh fish markets. Instead, they are industrially reduced into fishmeal and oil used in aquafeed production [6,7]. A decreased commodity supply usually increases its price, and the fish market is no exception (e.g., [8,9]). Since most forage fish capture fisheries are near their maximum sustainable yields, using most catch for industrial use inevitably increases their prices in the fresh fish markets [10].
Withdrawal of most catch to industrial use, labeled here as "the practice," involves using fish from productive marine ecosystems in less developed countries in the southern hemisphere to feed farmed fish for wealthier nations in the northern hemisphere [11]; it has faced widespread criticism for various reasons, including its impact on ecosystems that produce these forage fish and on the socioeconomics of low-income fish consumers, whose buying power decreases [12]. Fishing for forage fish at the maximum sustainable yield level and overfishing above it can interfere with the ecosystem's natural functioning [13]. The capture competes with piscivorous birds, mammals, and fish [3,14,15,16,17,18]. This is especially true when such fish comprise a significant portion of the ecosystem's biomass and are highly connected to the food web [2,3]. Disturbingly, most forage fish processed into aquafeed ingredients are of food-grade quality [19], suggesting that "the practice" limits the access of low-income communities in developing countries to local affordable and nutritious food [5]. Contrarily, Hilborn et al. [20] have argued that fishing simultaneously both piscivorous fish and their leading food, forage fish, has maintained high populations of the latter fish. This viewpoint should be reconciled with the decline in harvests in recent decades associated with intense fishing [21,22], but is beyond the scope of the present article.
However, the ecological, socioeconomic justice, and ethical concerns described above have been evaluated only qualitatively [23,24,25,26]. The present article uses available sources to gauge quantitatively, for the first time as far as we know, the financial and nutritional costs involved with the socioeconomic consequences of "the practice" to low-income populations in the countries that supply most forage fish to the aquafeed industry. The premise is that paying increased prices for fish in a market because of "the practice" can reduce the individual's family's fish nutrition. In contrast, families that are used to consuming fish may remain loyal to it and maintain their fish intake by increasing their expenditure on the fish. The difference between the two prices, with and without "the practice," can be considered a levy or a subsidy by the individuals to the industry.
1.1. Forage Fish in Human Nutrition
Populations in developing countries often suffer from poor nutrition; locally captured fresh forage fish can alleviate inadequate food supply, being a considerably cost-effective source of essential nutrients, such as proteins; the nutrient content of forage fish has considerable dietary benefits, particularly to children and young women of reproductive age, and their oil is also used in effective human health food supplements [27]. The micronutrients in forage fish include vitamin A, iron, calcium, and zinc, which are concentrated in the bones and heads. The oil in the fish contains essential long-chain polyunsaturated fatty acids (PUFAs), including omega-3, eicosapentaenoic acid (EPA), and docosahexaenoic acid (DHA) [28]. The same attributes make forage fish valuable ingredients in farmed animal feed, primarily aquafeed [29].
Forage fish, readily available near the coast throughout the year, are a tremendous, delicious source of nutrition [30]. These fish are often consumed whole with their nutritious bones and heads, making them nutritionally superior per kilogram purchased than larger fish, where only about half the body weight is edible [31,32]. Some small fish species in developing countries are more accessible than larger fish and other animal-source foods and vegetables [7,33]. To be effective, however, forage fish must be available, affordable, and appealing to local consumers to benefit from their nutritional value fully. Even for those who can afford large fish, forage fish provide a healthier and more cost-effective seafood option, as feeding low in the food chain accumulates fewer pollutants and carcinogens than larger fish [34].
1.2. Global Forage Fish Catch and Its Reduction to Fishmeal ("the Practice")
Forage fish species sustain the world's largest fishery, with a catch of between 20 and 30 million MT annually [14]. Most of these fish are processed into fishmeal and fish oil intended mainly for aquafeeds, leaving only about 10-20% available for direct human consumption [20,35,36,37,38] (Figure 2). The practice" has, of course, also benefitted humanity through farming aquatic organisms. Much of the global fish and crustacean culture production, a multi-billion US$ industry, relies on forage fish-containing commercial aquafeeds [22,39] thanks to their fulfilling the dietary requirements of popular carnivorous species like salmon and sea bass, providing them with essential proteins and fatty acids (e.g.,[17]).
The demand for fish in the aquafeed industry has risen even though fish content in aquafeeds has dropped dramatically [22] due to the significant increase in aquaculture production and the use of fish products in feeding tens of millions MT non-carnivorous fish such as carp, tilapia, catfish, mullet, and milkfish [35,38,40], whose biology allows them to obtain their entire nutrition from "natural food" found in "green water" bodies [41], sometimes supplemented with village and farm waste and even night soil [40].
1.3. The Impact of "the Practice" on Social Sectors: A Matter of Both Profit and Deprivation
The worth of the global forage fisheries has been estimated at US$9 billion and upwards (US$17 billion in 2006, [14]). The worth of the global fishmeal production has ranged between US$8-9 billion 42. The total economic benefit of forage fish to humanity, as fresh fish for human consumption and through industry and ecosystem services, has been estimated at nearly US$20 billion y-1 [13,42]. Approximately 85% of fishmeal and oil production supports the US$64 billion aquafeed industry (in 2022, [42,43,44]). Over a third of the aquafeed production feeds high-value carnivorous and omnivorous fish and crustacean species primarily intended for high-income and upper-middle-income societies; the rest goes to carp, tilapia, and catfish production, which likewise do not usually reach the local markets of the forage fish producing nations [22,24,45]. In 2006, aquaculture fed by forage fish was twice as valuable as the forage fish that fed them [14]. However, this is still a fraction of the global food fish production value, which in 2016 amounted to US$231.6 billion [24].
The main beneficiaries of the fed aquaculture industry are those involved in it, such as fishers, traders, the fish reduction and aquafeed industries, fish growers, those involved in the supply chain to the markets, and retailers who sell aquafeed-fed seafood. These influential sectors leverage their economic and political power to receive a larger share of the benefits in the value chain; on the other hand, tens of millions of small-scale artisanal fishermen and the populations of the countries from whose waters most forage fish are extracted earn the least in terms of fish and money for their efforts and products [13,46,47,48].
Despite the valid and justified social and economic arguments for supplying the local market with a larger share of these fish [49,50,51] (Figure 2), the industry argues that fresh forage fish have low market demand due to the preference of local consumers for larger fish. Therefore, increasing supply would not necessarily lead to increased consumption [52]. The industry's rationales regarding the diminished demand for fresh fish and its subsequent utilization in industrial processes within nations such as Peru do not pay sufficient attention to the interests of the local fresh fish consumers. Their arguments seem to oversimplify the situation, disregarding alternative rationales and associated consequences. The following evidence can challenge the validity of such statements:
- We can learn from the documented situation in certain African countries, where demand for small fish is strong among low-income communities [53]. Nevertheless, the industry's and exporters' economic leverage allows them to buy much of the catch. Proactive attention by relevant authorities and organizations to the population's interest could considerably increase the direct human consumption of forage fish in such countries and elsewhere.
- In the past, low demand for anchovy in Peruvian and other markets could be attributed to this fragile fish's poor quality, which deteriorates quickly under inadequate storage and sanitary conditions on unrefrigerated boats supplying the local markets [19,42]. Additionally, Peru's fishery has offered larger, widely available species, such as mackerels and bonito (Figure 4 and Figure 5), which are less affordable but more versatile and palatable from a culinary standpoint; yet many Peruvian households cannot afford them and would purchase high-quality anchovy [38,42,46], which has historically been a crucial protein source in Peru and has played a significant role in ensuring food security since ancient Andean civilizations [31,49,54].
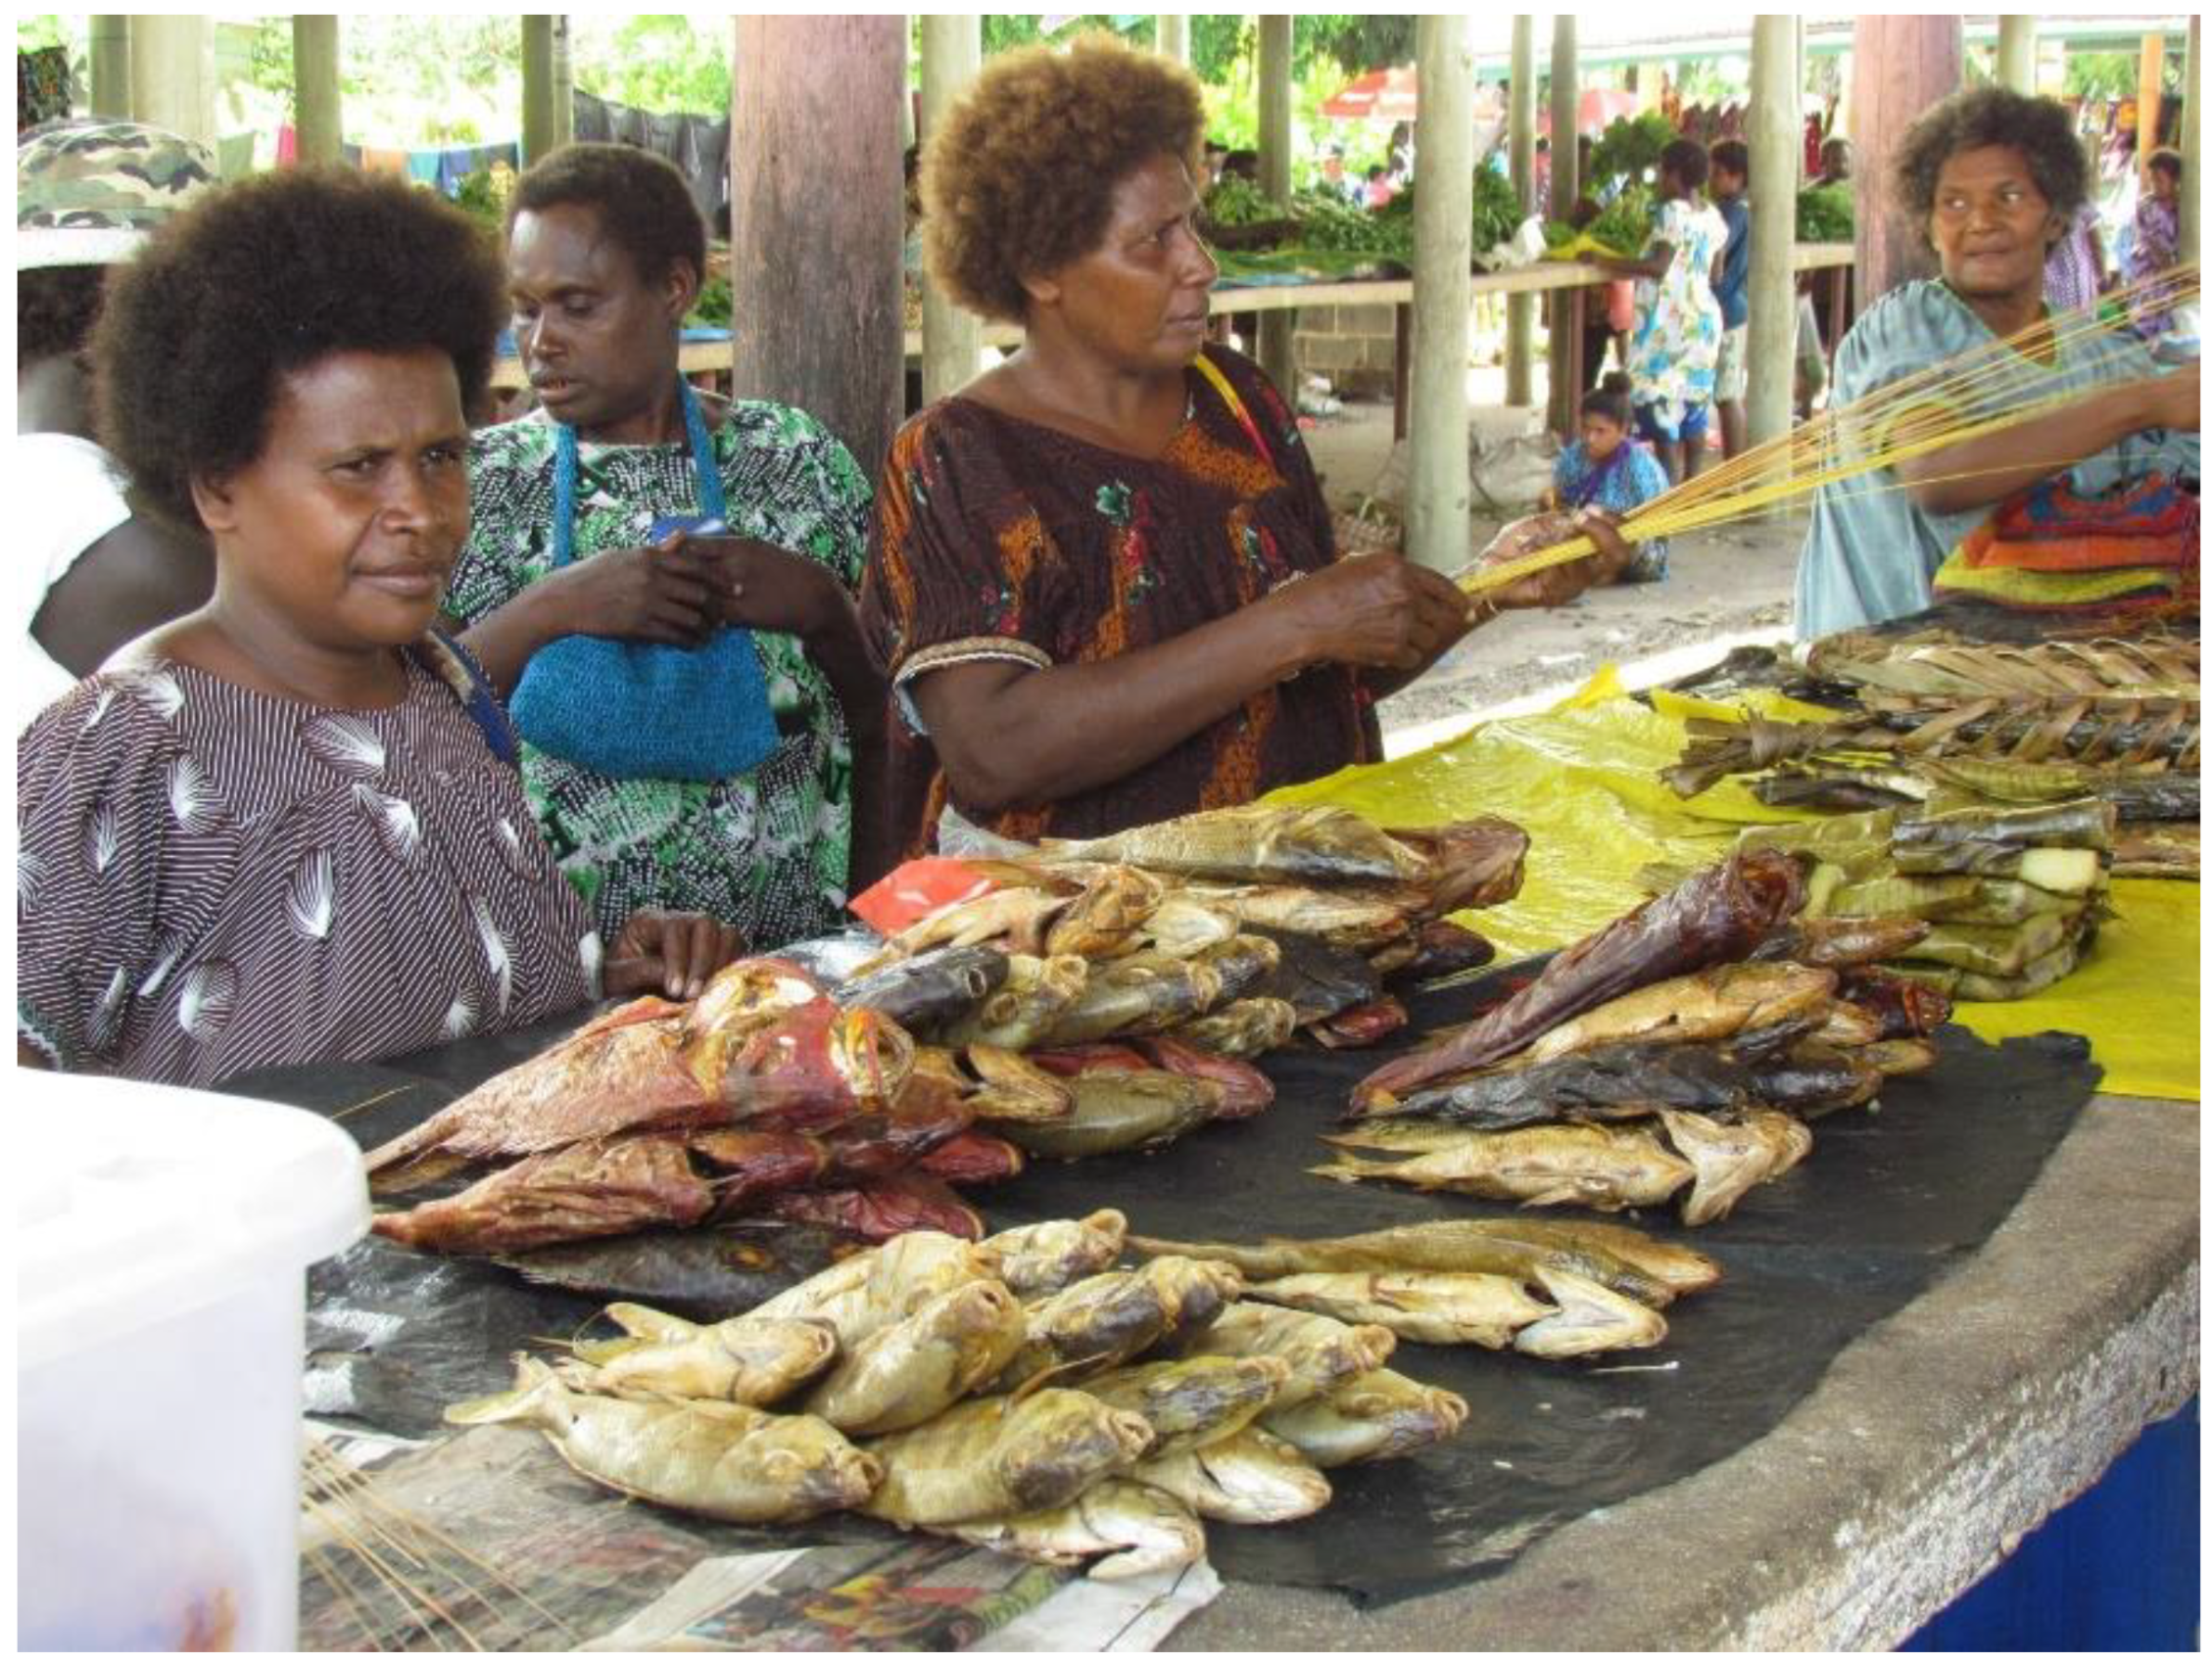
Figure 3.
A typical local fish market in Kavieng, New Ireland Island, Papua NG. October 2013 (Photo: M. Agami).
Figure 3.
A typical local fish market in Kavieng, New Ireland Island, Papua NG. October 2013 (Photo: M. Agami).
1.4. Socioeconomic Impact- Social Sectors Worsened by "the Practice"
1.4.1. Food Fish or Fish Feed?
The capture of a large quantity of small fish to produce a smaller amount of high-value aquacultured fish has been the subject of research, debate, and controversy (e.g., [29,55]). Scientists have questioned the sustainability and social logic of the fish reduction to feed, "the practice," which diverts large quantities of nutritious, small fish away from the fresh fish markets in favor of industrial use elsewhere (e.g., [52,56,57,58,59]). The aquafeed for certain farmed carnivorous fish used several decades ago to contain much more wild fish than the growth of those cultured fish, an untenable and unsustainable situation. The fish aquafeed fish content has since improved dramatically by research and the industry [20,22,46]. At the same time, articles such as [23,60] discussed the gap in knowledge exchange and the conflict of interests between the aquaculture industry and policymakers trying to reconcile support for aquaculture development and fresh fish consumers. The studies mentioned raise fundamental questions about fairness, socioeconomic justice, and ethics. They focus qualitatively on the impact of higher prices on the local communities' economics, nutrition, and marine ecosystem.
Feed is the most significant cost item among farming inputs of many fed fish species and crustaceans; it is often also the leading contributor to undesirable environmental impacts, such as waste, associated with commercial aquaculture activities [38]. The ecological costs of production, including pollution and carbon emissions, are often shouldered by less developed countries., thereby exacerbating global inequality [26,61]. It deprives low-income individuals involved with the supply of fish for local markets, including artisanal fishing, fish processing, trading, and sales, of their just benefits.
1.4.2. Impact of "the Practice" on Artisanal Fishermen and Others
Raising fish prices by forage fish reduction to fishmeal impacts low-income societies in several ways, among them losing jobs [5]. Fresh fish for human consumption creates several times more jobs per MT than the fish reduction industry [62]. Additionally, artisanal fishermen make up a significant portion of all fishing-related jobs. While the number of jobs related to fishing has been assessed [5,48,63], the specific number of jobs lost and gained because of "the practice" is yet to be evaluated.
Large refrigerated boats and aggressive buying agents can outcompete the artisanal fishermen and retailers who supply most of the fish for the fresh fish markets [2,7,13,16,22,27,64,65,66,67,68,69,70,71,72]. Artisanal fishermen require sophisticated fishing equipment, larger boats, and stronger nets to compete with industrial fishing fleets in deeper waters [63,73,74]. Consequently, artisanal fishermen's fraction of Peruvian captured fish dropped from over 90% in the 1980s to below 40% two decades later as industrial fishing increased [63]. In 2009, when Peruvian anchovy generated a third of the world's fishmeal supply, artisanal fishers, wholesalers, markets, and restaurants involved with fresh fish consumption constituted 80% of fisheries employment in Peru and generated US$2.4 billion, nearly as much as the worth of their fish reduction industry [31,42,49].
1.4. The Forage Fish Market and Its Response to "the Practice"
The quantity, types, and sizes of fish available, season, the perceived quality of the catch, the availability of alternative food sources, the number of potential purchasers, and other market conditions [33,75] influence the prices in a fish market [15]. "The practice" raises forage fish prices and lowers their consumption on top of the aforementioned driving forces; moreover, globalization of the forage fish market can affect local fish prices, regardless of local supply (e.g., [42]).
Villanueva García Benítez and Flores-Nava [70] explained how higher prices may lead to increased fish landings and improved supply to the fresh fish market for those who can afford the higher prices. Understanding the reasons behind price fluctuations requires a comprehensive investigation, as they vary depending on geographical and temporal considerations. [9].
Introducing fish products is not essential for diets of non-carnivorous fish but raises the scale of "the practice"; it is intended to increase production, even though higher production does not always bring about higher profit margins; costly resources, such as aquafeed and environmental impact handling, can offset the increased income [18,75,76,77]. According to Table 1 in Naylor et al. (2021)[22], there was a 17.5% increase in the overall use of wild fish in aquafeeds by 2017, compared to the value in 1997 (Table 2 in Naylor et al. (2000)[78]. Thus, unfortunately, the non-essential use of fish products in diets for carp, tilapia, and catfish, the use of trimmings, and the rapid growth of the aquaculture industry in recent decades (aquaculture production and aquafeed output rose over threefold and sevenfold in two decades [79]); these processes have jointly offset the dramatic 85% reduction in overall fish product content in aquafeeds between 1997 and 2017 in modern (novel) aquafeeds [22,35,40,80].
The above processes undoubtedly impacted fish supply and price in the fresh fish market. A possible contributor to the limited availability of fish in specific low-income fresh fish markets like Namibia and Peru (Figure 3) may be the higher prices offered to fishermen by the aquafeed and canning industries, despite the legal complexities involved [42,63,81,82]. Conversely, lower prices were reported for fish destined for the industry than those for direct human consumption [83], possibly thanks to better organization, frequent subsidies, and improved access to these fish within the sector [66,84]. Unfortunately, industrial fishing and processing firms, which receive 75-85% of global fisheries subsidies (totaling US$ 35 billion), generate only 10% of jobs and approximately 30% of fish for human consumption [85,86,87].
"The practice" can have dire ecological and social consequences, and Lake Victoria, the largest lake in Africa, provides a textbook case. Introducing the Nile perch (Lates niloticus) into the lake in the 1960s transformed the region's fisheries and the life of local communities of artisanal fishermen and fish consumers, providing a compelling example of the socioeconomic impact of a changed fish ecosystem on disadvantaged populations [73]. The deliberate introduction of a large predatory fish has resulted in the depletion of native small fish species, such as tilapias and other cichlids, which were previously crucial to the local fishing industry and consumers. Consequently, the availability of small fish in the local market has decreased, leading to increased prices. Artisanal fishermen have encountered difficulties in catching the new, larger fish and were outcompeted by larger boats; the labor structure changed. The captured Nile perch has been primarily exported, making it less accessible locally than the native fish. These consequences have compelled local populations to seek more expensive and potentially less nutritious alternative food sources or to migrate from the lake to other areas [73].
The existing studies have provided only qualitative descriptions of the impact of the rising market price and reduced supply of forage fish on low-income families' budgets, nutrition, and food security. The situation's socially unjust negative socioeconomic implications have been widely acknowledged [2,23,45,84]. Despite these concerns, scientific studies have not quantified this issue's economic and dietary consequences for low-income families relying on such fish as a vital food source [35,54]. This article begins to close this gap. We assessed here the magnitude of the effect of "the practice" on the price of fish and, therefore, the expenditure and fish consumption of low-income consumers who depend on small fish for their nutritional needs. This evaluation inevitably involved several assumptions, which were inevitable due to the lack of solid data [63].
2. Forage Fish Supply and Prices in the Fresh Fish Markets: Quantification of the Socioeconomic Impact of "the Practice"
Complete and accurate fish supply and price market data can be elusive [47]. For example, data is not readily available for every variable, location, and year, and sometimes reports disagree [33,38,67,88]), but any discrepancies should not invalidate our calculations thanks to the relative stability of the capture fisheries sector [24,89].
Economists evaluate market forces and prices mainly based on commercial interest, using mathematical parameters such as price elasticity, which measures the change in demand relative to a change in price, and its price flexibility, which is the inverse demand counterpart to elasticity, reflects the change in price relative to supply [88,90]. When the demand for a commodity is inflexible, its price rises more as the supply drops, compared to a commodity with flexible demand and alternative products, where the price rise is dampened by diminished demand [88,91].
According to Lem et al. (2014) [91], a 10% change in fish price was associated with a 4-5% change in supply (price flexibility of -2-2.5, meaning a 10% supply drop is linked to a 20 to 25% price rise), while Cornelsen et al. (2015) [92] reported price flexibility of -1.25. Yildiz et al. (2023) [33] found that a 33% reduction in anchovy catch was associated with a 50% price increase (price flexibility of 1.5) in the Istanbul fish market. The calculations below have used several well-based assumptions to fill this information gap. For convenience, a flexibility value of 1, meaning a 10% decrease in supply raises the price by 10%, is used [88], where no specific value is available.
Hypothetical 10% boosts in the fresh forage fish supply to the markets in several fish-producing countries should reduce prices and improve consumer fish purchases (Table 1) [90,92]. The differences between the actual high price and the hypothetical low price in a better-supplied market represent levies, which we can consider a subsidy paid by the consumers for the operation of the reduction industry and fish exports. A 10% boost should be a conservative underestimate compared with the much more significant actual fraction that goes to reduction. The table provides supply boosts' financial and nutritional implications for the consumer families and entire nations.
2.1. The Global Forage Fish Market
The present article does not examine fish catch and price dynamics but only provides typical values to permit the order of magnitude calculations (Table 1). The global catch of forage fish has fluctuated up and down over the years, with values varying between reports; it decreased from 37 million MT y-1 in 1994 to 25 million MT y-1 in 2017 [22]. The amount of forage fish used for fishmeal and fish oil production declined, according to some reports, from 27 million MT (73% of the total) in 1994 to 16 million MT (64% of the total) in 2017 and 22 million in 2018, a drop which was compensated by the increased use of trimmings [22,81].
The quantity of fish used for direct human consumption, fresh and processed (canned, dried, smoked, frozen, etc.), has been relatively stable, with 10 million MT in 1994 and 9 million MT in 2017 [22](Naylor et al. 2021). Different values of 19.3 million MT for reduction and only 5 million MT for direct human consumption represent 2010 and onward [15,35]. The prices, some of them landed values and other retail values, usually ranged from about US$200 to US$1,750 MT-1, while the retail price of forage fish for human consumption has averaged globally between US$700-2000 MT-1 [19,42,83]. Naturally, prices vary temporally and geographically [68].
According to FAO data, over 5 million MT divided by the worldwide population of 7.8 billion people reflects an average global per capita consumption of live fish equivalents (in 2019) of 20 kg y-1, with forage fish contributing about 0.65 kg y-1 [38]. Per capita consumption has been notably higher in low-income countries with a forage fish capture industry [84], as highlighted in the case studies below.
2.2. Estimating the Quantitative Impact of "the Practice" on Fresh Forage Fish Price and Consumption
The total value of the fresh forage fish supplied to the markets has been reported at approximately US$4 billion or US$0.78 per kilogram. However, prices were lower in several of the country cases at the time of landing [83] and higher in others (e.g., [33]).
For a hypothetical family of five in fish-consuming countries, with a three kg per capita y-1 purchase, the cost for 15 kg y-1 was $11.7 (3x5 kg x US$0.78 kg-1), and the calculated family subsidy was US$1.17. Multiplying the US$0.78 kg-1 subsidy by the average forage fish consumption of 0.65 kg y-1 gives US$0.5 subsidy per capita y-1 for every person on earth. The total global subsidy amount (5 million MT x US$78 subsidy MT-1) would be close to US$400 million, not including the more elusive estimate of indirect ecosystem services, such as the functioning of the marine food web and the nutrition of piscivorous animals (e.g., [55]).
2.3. Country Case Studies
The initial calculations were based on the correlation between the supply and price of fresh forage fish in the local markets of South Africa, Senegal, Turkey, and Peru, for which data were available in the literature. A standard conservative 10% hypothetical boost in supply was applied across the country-based values. Although the data is sourced from different years and time frames, it still holds significant indicative value of the hidden subsidy consumers provide to the fishmeal, aquafeed, and aquaculture industries.
2.3.1. South Africa
The total forage fish caught in South Africa in 2004 amounted to 614,153 MT [66]. This level of harvest was consistent for those years. In 2024, the retail value of anchovy ranged from US$680 to US$1,360 MT-1 [93]. In the absence of other specific figures, and considering the volatile nature of anchovy prices, an average value of US$1000 MT-1 is used to estimate the total value of the 2004 forage fish harvest at US$614 million. The industry purchased two-thirds of the harvest that year, while the remaining 204,680 MT, valued at US$204.7 million, supplied the fresh fish markets. A 10% boost to the fresh fish supply would decrease the market price, allowing the population to buy 10% more fish for the same cost. In this case, the fish consumers subsidized the industry by over US$20 million.
2.3.2. Senegal
Forage fish represent the primary source of animal protein in Senegal; however, per capita consumption in the country decreased from 18 kg y-1 in 2009 to 9 kg y-1 in 2018. This decline was concurrent with a population growth that exceeded capture growth and increased withdrawal from the annual harvest, ranging from 260,000 to 330,000 MT for "the practice," i.e., withdrawn from the fresh fish market for industrial and export purposes [83,94]. Over the same period, fish exports rose steadily from 71,000 MT in 2009 to 206,600 MT, valued at around US$1500 MT-1 for a total of US$310 million in 2018 [95], leaving 37.5% less available for fresh consumption, which dropped from 216,000 MT in 2009 to 135,000 MT in 2018.
Lancker and Bronnmann (2022) [96] calculated price flexibility for Senegalese forage fish of about 2; that is, a change in supply by 10% would be associated with a price change of 20% in the opposite direction. Using the 1:1 price flexibility ratio is, therefore, conservative. Deme et al. (2022)[94] provided an average forage fish price over nine years of US$0.266 kg-1, including the retail margin [97]. Consequently, we can estimate prices for two levels of supply, 135,000 and 216,000 metric tons, as follows: the price is assumed to have increased steadily between 2009 and 2018 by 37.5%, from US$216 MT-1 in the 216,000 MT market of 2009 to US$297 MT-1 in the 135,000 MT market of 2018 (Table 1 line 3). In the 135,000 MT market of 2018, a family of five with a per capita consumption of 9 kg paid in 2018 a levy of US$3.65 on its 45-kilogram purchase compared to the lower price of 2009. Because of the higher 2018 prices, the nation subsidized the industry by nearly US$11 million for 37.5% less fish compared to the 2009 prices, on top of the other variables.
A second scenario (Table 1, line 4) examined, level with the other cases, the impact of a supply boost of 10% from the base 135,000 MT to 148,500 MT. In the 135,000 MT market of 2018, a family of five paid a levy of US$0.97 y-1 on its 45-kg annual purchase compared to a 10%- boosted supply. In this case, the nation subsidized the industry in 2018 by nearly US$2.9 million for 10% less fish.
2.3.3. Istanbul, Turkey
The price of anchovies in Istanbul fluctuates depending on the season and availability; however, they are generally affordable and accessible to most consumers; these small, flavorful fish play a significant role in Turkish cuisine and are particularly popular among low-income families due to their affordability [7,33]. However, approximately half of this market's 200,000 MT of forage fish captured annually are reduced to fishmeal and oil [98]. The fresh anchovy supply that remains for the 15 million inhabitants of Istanbul market, around 100,000 metric tons [99], satisfies a per capita consumption of fresh forage fish of approximately 6.7 kg (compared with 6.3 kg national average [100]).
Over 13 years, a 50% decrease in anchovy landings corresponded to a 75% increase in the landed price, resulting in a price flexibility of 1.5 [33]. Moreover, Yilmaz et al. (2016) [101] calculated price flexibility of 1.94 (price rise per supply drop). The landing price of US$0.2 kg-1 for the fish supplied to the industry during the study can be compared to the much higher retail price of fresh anchovy in the fresh fish market, which was US$0.767 per kilogram, including the costs for cold chain transportation, intermediaries, and retailers indicating a factor of 3.8 between the landed price of the entire catch and the retail price of the reduced quantity that remained for the market [98]. Therefore, using a flexibility value of 1.5 for our calculations appears conservative. A family of five that consumed 33.5 kg anchovy paid in 2018 (33.5 kg x US$0.767 kg-1) US$ 25.7 y-1. It would pay only US$21.8 y-1 with the hypothetically 10%-boosted 110,000 MT market price of US$0.652 kg-1; the family levy was US$3.86 y-1, which totals for the 15 million person city subsidy to the industry of US$11.5 million y-1.
2.3.4. Peru
2.3.4.1. Forage fish
The Peruvian anchovy is the world's most extensive fishery resource, with annual landings reaching 12 million MT y-1 and averaging about 7 million MT y-1 [43,102]. Only 10-20% of this is used for direct human consumption [2]. The rest of the Peruvian catch (and much of the global catch of forage fish) consistently goes to reduction and not to direct human consumption (Figure 2; [103,104]). Peruvian per capita fresh fish consumption has been recently reported at 23 kg y-1 thanks to successful proactive government programs [70]. About 8 kg y-1 per capita fish consumption was forage fish [15]. Several reports have estimated the anchovy market prices in Peru from US$600 to US$1100 MT-1 [42,48,93]. Reported consumption values for fresh forage fish reached 218 kg per capita for fishers' communities, considering some are probably unreported self-captured fish [70,105]. Using the 8 kg per capita consumption value and a base price of US$1000 MT-1, the total Peruvian consumption for the 30 million population for the year reported was 240,000 MT, with a total value of US$240 million. If boosted by 10% for a total of 264,000 MT and using a price flexibility of 1:1, the total market fish price would drop to US$223 million. A family of five would pay a base price of US$40 y-1 for its fish. Compared to the lower price with the boosted supply of US$36, the family spent an annual levy of US$4, and the nation subsidized the industry by US$24 million. A five-person fisher family, where small fish make up half of their food [70], would pay an annual levy of around US$100.
2.3.4.2. Mackerel (Representing Piscivorous Fish in Peru)
The potential impact of leaving 5 million MT of Peruvian forage fish catch that today supplies the industry in the water on capturing larger fish, with mackerel as a representative of small predatory species, has been considered in the literature [106,107]. In the absence of a quantitative estimate on the effect of capturing millions of MT of forage fish on piscivorous fish's availability and market price, informed assumptions were made for the following calculations. Being their primary food sources, the fecundity and population density of anchovies and sardines influence the population, fecundity and capture of mackerel-sized piscivorous fish [108,109]. Free et al. (2017) [109] did not find an impact of anchovy populations on mackerel populations, but others have different opinions [14,110]. According to the latter study, the biomass of Peruvian anchovies and sardines in the relevant 165,000 km2 Peruvian fished waters from 2010 to 2015 varied around 10 million with corresponding annual catches of 8.8 million MT [111].
The Peruvian mackerel catch has been highly variable [91]. In 2022-2023, it was 220,000 MT, most of it for human consumption [103] (7 kg per capita if all the fresh fish market, valued at US$ 1000 MT-1 and US$220 million in total [14,93,112].
Ecosystem models suggest that the contribution of anchovy as food for the Peruvian catch of piscivorous fish (not all of them mackerel) varies in time and space, yielding on average over 1 MT piscivores km-2 y-1 from an area of about 165,000 km2 [14]. These values differ significantly between reports and years [63]. Nevertheless, as a rough estimate, leaving 5 million MT y-1 of anchovy catch in the water could boost the mackerel catch by 10% to 275,000 million MT y-1 (Table 1 line 7). With a price flexibility of 1:1, the total value of the original 220,000 MT would drop to US$218 million. After the 10% boost, a family of five consuming 35 kg y-1 of mackerel-sized fish could save US$3.15 y-1. The subsidy or levy for the Peruvian nation for capuring anchovies instaed of leaving them in the water and feeding mackerel would be US$22 million y-1. These figures would have presumably a much more significant impact on individual families and the nation if the mackerel supply boost were 50%. In that scenario, the nation would subsidize the forage fish fisheries by over US$100 million. These levies reflect the order of magnitude of the extra cost for mackerel paid by Peruvian consumers due to the impact of forage fish overfishing on the mackerel population. Applying this calculation to the global value of fisheries supported by forage fish in the previous decade [14] of US$11.3 billion results in a worldwide subsidy of over US$1 billion.
4. Discussion
Any assessment of the quantitative approach used here should note that other factors not mentioned previously could also impact the processes described above. For example, lower prices could decrease fishermen's interest in catching fish, and reduced prices for fresh forage fish could incentivize fishermen to sell their catch to the industry. On the other hand, decreasing revenues by lower prices may be compensated for by the increased catch per unit effort to maintain reasonable profitability for the artisanal fishermen. Therefore, the calculated subsidy values only provide orders of magnitude for their impacts, using a conservative supply boost of only 10% for most calculations, which is lower than the actual scale of "the practice." [20,35].
The estimated subsidy for a 10% drop in fish supply on a global scale approaches US$100 MT-1, totaling hundreds of millions of US$ annually. This burden, primarily shouldered by those with limited financial means, accounts for several percent of the US$10 billion total value of worldwide fishmeal production [113]. On the national or regional scale, the impact on fish consumers was in the US$ millions, up to US$24 million y-1 in Peru, the largest forage fish supplier globally. It is alarming that an average individual consumer family could consume significantly more fish or save several US$ y-1 upon forwarding a significant fraction of the fish from the reduction industry to the fresh fish markets; these values should stimulate international policies and agreements to consolidate the competing interests of powerful industries and disadvantaged populations, implementing laws and ethics in properly utilizing and distributing ocean resources. Peru, however, stands out as a positive example, with its proactive governmental efforts successfully reintroducing the public to the ancient tradition of consuming nutritious forage fish, maintaining the artisanal fishermen's fleet, and its capacity to supply fresh fish to the market.
It appears that the industry, authorities, fishermen, consumers, scientists, and other fisheries stakeholders have given in their considerations less attention to the influence of globalization and the financial and nutritional needs of the less influential populations of low-income consumers in the fish-capturing nations, who suffer the loss of full access to small fish, a significant local natural resource essential for food security [114]. These gaps justify the effort made here to introduce some figures to the arguments about the just distribution of ocean resources.
4.1. Country Case Studies
4.1.1. South Africa
The five-member family of the South African consumer that typically consumed 15 kg of forage fish annually would save US$1.5, which could still equal a day's wage for the most disadvantaged [45,66]. The 10% change in total value, amounting to US$20.5 million y-1, can be seen as a significant subsidy; moreover, it constituted 29% of the total output of US$ 71 million by the South African fish products industry at the time of the study [66].
4.1.2. Senegal
Based on data for the literature's 37.5% forage fish supply boost, the calculations levy to family and national levies are nearly 4-fold higher than those for the hypothetical 10% supply boost estimate calculations used here as standard. The resulting national respective subsidy to the industry and exports of US$11 million for the actual 37.5% boost and US$3 million for the hypothetical 10% boost should be evaluated relative to the US$310 million value of Senegalese forage fish exports in 2018 [94]. With such a large discrepancy, it should be possible for the Senegalese government to regulate the leaving of a significantly larger supply to the fresh fish market to make it more affordable, with little harm to the industry.
4.1.3. Istanbul, Turkey
Low-income families are the primary consumers of forage fish in the Istanbul fish markets [101]. In 2018, these families paid the highest levy, nearly US$4 y-1. The city levy of US$11.5 million represented about 12% of the total value of the entire Turkish fishmeal industry, which was approximately US$94 million (300,000 MT x US$314 MT-1 [100]). With a population of 82 million in 2018 [115], five and a half times the population of Istanbul, the national levy for only a hypothetical 10% supply change could be over US$60 million, accounting for 67% of the entire US$90 y-1 million Turkish fishmeal industry. Considering that the actual quantity of fish diverted to the industry is closer to 50% than 10% [33], it is likely that the national subsidy, shouldered mainly by the disadvantaged Turkish population for "the practice", exceeds the total value of the Turkish fish reduction industry.
4.1.4. Peru
Peru, the largest producer of forage fish, receives significant attention in this context. The 10% increase in forage fish supply results in a substantial family levy, and the national levy stands at a substantial US$24 million. This figure is likely a conservative estimate, considering that the actual boost, representing the fish supply the market would have received in the absence of a fish reduction industry, would have been considerably higher. Considering a hypothetical boosted mackerel supply to the Peruvian markets if all forage fish remains in the water suggests that the Peruvian public pays, either way, a subsidy that is conservatively tens of millions of US$ y-1.
5. Conclusions
This article provides a brief overview of the ecological, economic, ethical, and social costs emanating from directing completely edible captured forage fish to the fish reduction industry; these costs comprise higher expenditure on fish and reduced nutrition of consumers in the fresh fish market. The presented basic calculations, as approximate as they are, shed light on the scale of involuntary and socially harmful contributions by low-income forage fish consumers to the industries of fishmeal and oil, aquafeed and aquaculture, much of which caters to more affluent Northern Hemisphere consumers [3,22,47,116]. The article also reviews how the industrial fishing operations and the ensuing industrial use of the catch can adversely affect the livelihoods of impoverished artisanal fishermen threatened by [42,70,89,94,117]. One of the main messages in the present article is that "the practice" raises prices of fresh forage fish; these increases, even if approximate, are levies that cost low-income families several US$ annually, amounting to tens of millions of US$ nationally and hundreds of millions to a billion US$ globally. These levies and the reduced fish purchase are accompanied by disruptions to the natural marine food web, which can have a similarly significant value [13,14,43,65].
At the national level, the sums of levies imposed on low-income individuals to support the fish reduction industry can match the industry's value in their order of magnitude in some countries; globally, these levies approach in their order of magnitude the values of the sectors, considering that recent estimates place the fishmeal industry at between US$ 7-9 billion and the global aquafeed industry at US$64 billion [43,118]. Reduced availability and increased prices can significantly harm individuals with lower incomes, as they tend to be more sensitive to fluctuations in fish prices than those with higher incomes [10,119]. For instance, elevated prices of a favored fish choice may compel individuals with limited incomes to transition to more affordable alternatives such as chicken or lower-grade fish [10,42,47,67,69,83,91,120].
The inequality embodied in "the practice" demands attention from economists, fish market experts, regulators, and other stakeholders, given the significance of social justice for the sustainability of human activities [3,13,25,72,94,121]. It is essential to recognize the significant socioeconomic value of these food fish in economic considerations and reconsider the utilization of most forage fish in the reduction industry, considering the interests of all consumers.
Authorities and industries that acknowledge the problem can take proactive, collaborative steps to improve the availability and appeal of nutritious fresh small fish; other measures (like those implemented in Peru [70]) that can address the injustice include regulating the capture of smaller fish by industrial boats and providing the artisanal fishermen with refrigerated supply chains; such measures will enhance fish supply to the fresh fish markets by the artisanal fleets catching forage fish and larger piscivorous fish [67,106]. Alternatively, leaving forage fish in the water can support larger populations and catches of the larger fish by local artisanal fishermen [31,46].
Insect-based feeds, microalgae, and plant proteins such as soybeans or legumes can reduce the environmental impact of aquaculture while meeting the nutritional needs of farmed fish and their consumers [122]. The culture of herbivorous or omnivorous fish, such as tilapia, catfish, mullet, and carp, which thrive on plant-based feeds, can eliminate the need for fish in aquafeeds. Industry, interested organizations, and authorities can collaborate to create a brighter and more sustainable future for the fisheries industry and fish consumers, balancing economics and socioeconomic justice.
Readers, industry professionals, policymakers, NGOs, and other stakeholders should carefully assess the broader rationale behind current global, regional, and national situations. In this context, it is essential to recognize that the fish reduction industry, serving mainly affluent consumers [24,123] while producing valuable food fish, could compromise marginalized consumers' and fishermen's financial and nutritional welfare. The evidence provided here can support the formation of well-informed opinions. Scientists can use the present article as a stepping stone in pursuing quantitative studies toward the fair distribution of ocean fish resources.
Funding
This research received no external funding.
Data Availability Statement
Data was extracted from the cited references.
Acknowledgments
We thank Albert Tacon for his encouragement and inspiration. GraphPad Prism, Grammarly, and Zotero aided in the preparation of the manuscript. A friend who does not wish to be identified helped with editing. MDPI Foods Editor rejected manuscript ID foods-2904306. Constructive comments by Foods' reviewers are gratefully acknowledged.
Conflicts of Interest
The authors declare no conflict of interest.
References
- Duarte, L.O.; Garcı́a, C.B. Trophic Role of Small Pelagic Fishes in a Tropical Upwelling Ecosystem. Ecol. Model., 2004, 172, 323–338. [Google Scholar] [CrossRef]
- Alder, J.; Campbell, B.; Karpouzi, V.; Kaschner, K.; Pauly, D. Forage Fish: From Ecosystems to Markets. Annu. Rev. Environ. Resour., 2008, 33, 153–166. [Google Scholar] [CrossRef]
- Smith, A.D.M.; Brown, C.J.; Bulman, C.M.; Fulton, E.A.; Johnson, P.; Kaplan, I.C.; Lozano-Montes, H.; Mackinson, S.; Marzloff, M.; Shannon, L.J.; Shin, Y.-J.; Tam, J. Impacts of Fishing Low–Trophic Level Species on Marine Ecosystems. Science, 2011, 333, 1147–1150. [Google Scholar] [CrossRef] [PubMed]
- Alheit, J.; Peck, M.A. Drivers of Dynamics of Small Pelagic Fish Resources: Biology, Management and Human Factors. Mar. Ecol. Prog. Ser., 2019, 617–618, 1–6. [Google Scholar] [CrossRef]
- Wijkström, U.N. The Use of Wild Fish as Aquaculture Feed and Its Effects on Income and Food for the Poor and the Undernourished. In Fish as feed inputs for aquaculture: practices, sustainability and implications; Hasan, M.R.; Halwart, M., Eds.; Fisheries and Aquaculture Technical Paper; FAO,Rome, 2009; pp. 371–407.
- Muringai, R.T.; Mafongoya, P.; Lottering, R.T.; Mugandani, R.; Naidoo, D. Unlocking the Potential of Fish to Improve Food and Nutrition Security in Sub-Saharan Africa. Sustainability, 2022, 14, 318. [Google Scholar] [CrossRef]
- Robinson, J.P.W.; Mills, D.J.; Asiedu, G.A.; Byrd, K.; Mancha Cisneros, M. del M.; Cohen, P.J.; Fiorella, K.J.; Graham, N.A.J.; MacNeil, M.A.; Maire, E.; Mbaru, E.K.; Nico, G.; Omukoto, J.O.; Simmance, F.; Hicks, C.C. Small Pelagic Fish Supply Abundant and Affordable Micronutrients to Low- and Middle-Income Countries. Nat. Food, 2022, 3, 1075–1084. [Google Scholar] [CrossRef] [PubMed]
- Aksnes, D.L.; Holm, P.; Bavinck, M.; Biermann, F.; Donovaro, R.; Harvey, P.; Hynes, S.; Ingram, J.; Kaiser, M.; Kaushik, S.; Krause, G. Food from the Oceans: How Can More Food and Biomass Be Obtained from the Oceans in a Way That Does Not Deprive Future Generations of Their Benefits? Evidence Review Report 1; SAPEA, Science Advice for Policy by European Academics: Berlin, 2017; p. 160. [Google Scholar]
- Brækkan, E.H. Disentangling Supply and Demand Shifts: The Impacts on World Salmon Price. Appl. Econ., 2014, 46, 3942–3953. [Google Scholar] [CrossRef]
- Belton, B.; Bush, S.; Little, D. Not Just for the Wealthy: Rethinking Farmed Fish Consumption in the Global South. Glob. Food Secur., 2017, 16. [Google Scholar] [CrossRef]
- Deutsch, L.; Gräslund, S.; Folke, C.; Troell, M; Huitric, M. ; Kautsky, N.; Lebel, L. Feeding Aquaculture Growth through Globalization: Exploitation of Marine Ecosystems for Fishmeal. Glob. Environ. Change, 2007, 17, 238–249. [Google Scholar] [CrossRef]
- Tidwell, J.H.; Allan, G.L. Fish as Food: Aquaculture’s Contribution. EMBO Rep.
- Konar, M.; Qiu, S.; Tougher, B.; Vause, J.; Tlusty, M.; Fitzsimmons, K.; Barrows, R.; Cao, L. Illustrating the Hidden Economic, Social and Ecological Values of Global Forage Fish Resources. Resour. Conserv. Recycl., 2019, 151, 104456. [Google Scholar] [CrossRef]
- Pikitch, E.K.; Rountos, K.J.; Essington, T.E.; Santora, C.; Pauly, D.; Watson, R.; Sumaila, U.R.; Boersma, P.D.; Boyd, I.L.; Conover, D.O.; Cury, P.; Heppell, S.S.; Houde, E.D.; Mangel, M.; Plagányi, É.; Sainsbury, K.; Steneck, R.S.; Geers, T.M.; Gownaris, N.; Munch, S.B. The Global Contribution of Forage Fish to Marine Fisheries and Ecosystems. Fish Fish., 2014, 15, 43–64. [Google Scholar] [CrossRef]
- Avadí, A.; Fréon, P. A Set of Sustainability Performance Indicators for Seafood: Direct Human Consumption Products from Peruvian Anchoveta Fisheries and Freshwater Aquaculture. Ecol Ind, 2015, 147, 518–553. [Google Scholar] [CrossRef]
- Pomeroy, R.; Parks, J.; Mrakovcich, K.L.; LaMonica, C. Drivers and Impacts of Fisheries Scarcity, Competition, and Conflict on Maritime Security. Mar. Policy, 2016, 67, 94–104. [Google Scholar] [CrossRef]
- Belton, B.; Little, D.C.; Zhang, W.; Edwards, P.; Skladany, M.; Thilsted, S.H. Farming Fish in the Sea Will Not Nourish the World. Nat. Commun., 2020, 11, 5804. [Google Scholar] [CrossRef]
- Peng, D.; Mu, Y.; Zhu, Y.; Chu, J.; Sumaila, U.R. Insights from Chinese Mariculture Development to Support Global Blue Growth. Rev. Fish. Sci. Aquac., 2023, 31, 453–457. [Google Scholar] [CrossRef]
- Avadí, A.; Fréon, P.; Tam, J. Coupled Ecosystem/Supply Chain Modelling of Fish Products from Sea to Shelf: The Peruvian Anchoveta Case. PLoS ONE, 2014, 9, e102057. [Google Scholar] [CrossRef] [PubMed]
- Hilborn, R.; Buratti, C.C.; Díaz Acuña, E.; Hively, D.; Kolding, J.; Kurota, H.; Baker, N.; Mace, P.M.; de Moor, C.L.; Muko, S.; Osio, G.C.; Parma, A.M.; Quiroz, J.-C.; Melnychuk, M.C. Recent Trends in Abundance and Fishing Pressure of Agency-Assessed Small Pelagic Fish Stocks. Fish Fish., 2022, 23, 1313–1331. [Google Scholar] [CrossRef]
- Essington, T.E.; Moriarty, P.E.; Froehlich, H.E.; Hodgson, E.E.; Koehn, L.E.; Oken, K.L.; Siple, M.C.; Stawitz, C.C. Fishing Amplifies Forage Fish Population Collapses. Proc. Natl. Acad. Sci., 2015, 112, 6648–6652. [Google Scholar] [CrossRef] [PubMed]
- Naylor, R.L.; Hardy, R.W.; Buschmann, A.H.; Bush, S.R.; Cao, L.; Klinger, D.H.; Little, D.C.; Lubchenco, J.; Shumway, S.E.; Troell, M. A 20-Year Retrospective Review of Global Aquaculture. Nature, 2021, 591, 551–563. [Google Scholar] [CrossRef]
- Krause, G.; Brugere, C.; Diedrich, A.; Ebeling, M.W.; Ferse, S.C.A.; Mikkelsen, E.; Pérez Agúndez, J.A.; Stead, S.M.; Stybel, N.; Troell, M. A Revolution without People? Closing the People–Policy Gap in Aquaculture Development. Aquaculture, 2015, 447, 44–55. [Google Scholar] [CrossRef]
- FAO. The State of World Fisheries and Aquaculture 2018 (SOFIA), 2018.
- Campbell, L.M.; Fairbanks, L.; Murray, G.; Stoll, J.S.; D´Anna, L.; Bingham, J. From Blue Economy to Blue Communities: Reorienting Aquaculture Expansion for Community Wellbeing. Mar. Policy, 2021, 124, 104361. [Google Scholar] [CrossRef]
- Brugere, C.; Bansal, T.; Kruijssen, F.; Williams, M. Humanizing Aquaculture Development: Putting Social and Human Concerns at the Center of Future Aquaculture Development. J. World Aquac. Soc., 2023, 54, 482–526. [Google Scholar] [CrossRef]
- Kawarazuka, N.; Béné, C. The Potential Role of Small Fish Species in Improving Micronutrient Deficiencies in Developing Countries: Building Evidence. Public Health Nutr., 2011, 14, 1927–1938. [Google Scholar] [CrossRef] [PubMed]
- Sprague, M.; Dick, J.R.; Tocher, D.R. Impact of Sustainable Feeds on Omega-3 Long-Chain Fatty Acid Levels in Farmed Atlantic Salmon, 2006–2015. Sci. Rep., 2016, 6, 21892. [Google Scholar] [CrossRef]
- Shannon, L.; Waller, L. A Cursory Look at the Fishmeal/Oil Industry From an Ecosystem Perspective. Front. Ecol. Evol., 2021, 9. [Google Scholar] [CrossRef]
- Arthur, R.I.; Skerritt, D.J.; Schuhbauer, A.; Ebrahim, N.; Friend, R.M.; Sumaila, U.R. Small-Scale Fisheries and Local Food Systems: Transformations, Threats and Opportunities. Fish Fish., 2022, 23, 109–124. [Google Scholar] [CrossRef]
- Majluf, P.; De la Puente, S.; Christensen, V. The Little Fish That Can Feed the World. Fish Fish., 2015, 18, 772–777. [Google Scholar] [CrossRef]
- Roos, N.; Wahab, M.A.; Chamnan, C.; Thilsted, S.H. The Role of Fish in Food-Based Strategies to Combat Vitamin A and Mineral Deficiencies in Developing Countries. J. Nutr., 2007, 137, 1106–1109. [Google Scholar] [CrossRef]
- Yildiz, T.; Ulman, A.; Karakulak, F.S.; Uzer, U.; Demirel, N. Bio-Economic Indicators of Fisheries: Impact of Variations in Landings and Fish Size on Market Prices in Istanbul Fish Market. PeerJ, 2023, 11, e15141. [Google Scholar] [CrossRef]
- Bosch, A.C.; O’Neill, B.; Sigge, G.O.; Kerwath, S.E.; Hoffman, L.C. Heavy Metal Accumulation and Toxicity in Smoothhound (Mustelus Mustelus) Shark from Langebaan Lagoon, South Africa. Food Chem., 2016, 190, 871–878. [Google Scholar] [CrossRef]
- Tacon, A.G.J. Contribution of Fish and Seafood to Global Food and Feed Supply: An Analysis of the FAO Food Balance Sheet for 2019. Rev. Fish. Sci. Aquac., 2023, 31, 274–283. [Google Scholar] [CrossRef]
- Ghamkhar, R.; Hicks, A. Comparative Environmental Impact Assessment of Aquafeed Production: Sustainability Implications of Forage Fish Meal and Oil Free Diets. Resour. Conserv. Recycl., 2020, 161, 104849. [Google Scholar] [CrossRef]
- D’Abramo, L.R. Sustainable Aquafeed and Aquaculture Production Systems as Impacted by Challenges of Global Food Security and Climate Change. J. World Aquac. Soc., 2021, 52, 1162–1167. [Google Scholar] [CrossRef]
- FAO. The State of World Fisheries and Aquaculture 2022, 2022.
- Galkanda-Arachchige, H.S.C.; Wilson, A.E.; Davis, D.A. Success of Fishmeal Replacement through Poultry By-Product Meal in Aquaculture Feed Formulations: A Meta-Analysis. Rev. Aquac., 2020, 12, 1624–1636. [Google Scholar] [CrossRef]
- Edwards, P. Aquaculture Environment Interactions: Past, Present and Likely Future Trends. Aquaculture, 2015, 447, 2–14. [Google Scholar] [CrossRef]
- Neori, A. “Green Water” Microalgae: The Leading Sector in World Aquaculture. J. Appl. Phycol., 2011, 23, 143–149. [Google Scholar] [CrossRef]
- Fréon, P.; Sueiro, J.C.; Iriarte, F.; Miro Evar, O.F.; Landa, Y.; Mittaine, J.-F.; Bouchon, M. Harvesting for Food versus Feed: A Review of Peruvian Fisheries in a Global Context. Rev. Fish Biol. Fish., 2014, 24, 381–398. [Google Scholar] [CrossRef]
- Derichs, C. Small Pelagic Fisheries; 1; Briefing; Marine Stewardship Council (MSC): London, 2021; p. 20. [Google Scholar]
- The Fortune Business Insights. Aquafeed Market Size, Share, Growth, Industry Analysis https://www.fortunebusinessinsights.com/industry-reports/aquafeed-market-100698 (accessed Jun 6, 2024).
- Tacon, A.G.J.; Metian, M. Food Matters: Fish, Income, and Food Supply—A Comparative Analysis. Rev. Fish. Sci. Aquac., 2018, 26, 15–28. [Google Scholar] [CrossRef]
- IFFO -The Marine Ingredients Organization. New IFFO Position: Fish as Food or Feed - 14, 2019. 20 September.
- Bronnmann, J.; Smith, M.D.; Abbott, J.; Hay, C.J.; Naesje, T.F. Integration of a Local Fish Market in Namibia with the Global Seafood Trade: Implications for Fish Traders and Sustainability. World Dev., 2020, 135, 105048. [Google Scholar] [CrossRef]
- Teh, L.; Teh, L.C.L.; Sumaila, U.R. Global Fisheries : Livelihood Impacts of Overfishing: 22; Fisheries Centre Research Reports; Technical Report Volume #31 Number #2; Institute for the Oceans and Fisheries, The University of British Columbia, Canada, 2023; p. 51. 20 November.
- Christensen, V.; de la Puente, S.; Sueiro, J.C.; Steenbeek, J.; Majluf, P. Valuing Seafood: The Peruvian Fisheries Sector. Mar. Policy, 2014, 44, 302–311. [Google Scholar] [CrossRef]
- Tacon, A.G.J. Use of Fish Meal and Fish Oil in Aquaculture: A Global Perspective. CAB Rev., 2004, 1, 3–14. [Google Scholar]
- Malcorps, W.; Kok, B.; van‘t Land, M.; Fritz, M.; van Doren, D.; Servin, K.; van der Heijden, P.; Palmer, R.; Auchterlonie, N.A.; Rietkerk, M.; Santos, M.J.; Davies, S.J. The Sustainability Conundrum of Fishmeal Substitution by Plant Ingredients in Shrimp Feeds. Sustainability, 2019, 11, 1212. [Google Scholar] [CrossRef]
- Allan, Geoff. Fish for Feed vs Fish for Food. In Fish, Aquaculture, and Food Security: Sustaining Fish as a Food Supply; A.G. Brown, Ed.; the Crawford Fund for International Agricultural Research: Canberra, Australia, 2004; pp. 20–26. [Google Scholar]
- Hecht, T. Regional Review on Aquaculture Development. 4. Sub-Saharan Africa - 2005.; 2006.
- Vizurraga, A. Peru’s Fishmeal Industry: Its Societal and Environmental Impact. Thesis, City University of New York (CUNY), 2022.
- Nissar, S.; Bakhtiyar, Y.; Arafat, M.Y.; Andrabi, S.; Bhat, A.A.; Yousuf, T. A Review of the Ecosystem Services Provided by the Marine Forage Fish. Hydrobiologia, 2023, 850, 2871–2902. [Google Scholar] [CrossRef]
- Hasan, M.R.; Halwart, M. Fish as Feed Inputs for Aquaculture: Practices, Sustainability and Implications; FAO Fisheries and Aquaculture Technical Papers; FAO: Food and Agriculture Organization of the United Nations: Rome, 2009. [Google Scholar]
- Hecht, T.; Jones, C. “Use of Wild Fish and Other Aquatic Organisms as Feed in Aquaculture - A Review of Practices and Implications in Africa and the Near East.” Fish Feed Inputs Aquac. Pract. Sustain. Implic., 2009.
- Naylor, R.L.; Hardy, R.W.; Bureau, D.P.; Chiu, A.; Elliott, M.; Farrell, A.P.; Forster, I.; Gatlin, D.M.; Goldburg, R.J.; Hua, K.; Nichols, P.D. Feeding Aquaculture in an Era of Finite Resources. Proc. Natl. Acad. Sci., 2009, 106, 15103–15110. [Google Scholar] [CrossRef] [PubMed]
- Schindler, D.E.; Hilborn, R.; Chasco, B.; Boatright, C.P.; Quinn, T.P.; Rogers, L.A.; Webster, M.S. Population Diversity and the Portfolio Effect in an Exploited Species. Nature, 2010, 465, 609–612. [Google Scholar] [CrossRef] [PubMed]
- Röcklinsberg, H. Fish Consumption: Choices in the Intersection of Public Concern, Fish Welfare, Food Security, Human Health and Climate Change. J. Agric. Environ. Ethics, 2015, 28, 533–551. [Google Scholar] [CrossRef]
- Cánovas Molina, A.; Frapolli, E. Socio-Ecological Impacts of Industrial Aquaculture and Ways Forward to Sustainability. Mar. Freshw. Res., 2021, 72. [Google Scholar] [CrossRef]
- Eide, A.; Bavinck, M.; Raakjær, J. Avoiding Poverty: Distributing Wealth in Fisheries. In Poverty Mosaics: Realities and Prospects in Small-Scale Fisheries; Svein, Jentoft, Arne Eide, Eds.; Springer: Dordrecht, 2011; pp. 13–25. [Google Scholar]
- de la Puente, S.; Noël, S.-L.; White, R. Peru: Updated Catch Reconstruction for 1950-2018. In Updating to 2018 the 1950-2010 Marine Catch Reconstructions of the Sea Around Us. Part II: The Americas and Asia-Pacific; B., Derrick, M., Khalfallah, V., Relano, D., Zeller, D. Pauly, Eds.; Fisheries Centre Research Reports; Institute for the Oceans and Fisheries at the University of British Columbia: Vancouver, British Columbia, 2020. [Google Scholar]
- Seto, K.L.; Easterday, K.J.; Aheto, D.W.; Asiedu, G.A.; Sumaila, U.R.; Gaynor, K.M. Evidence of Spatial Competition, over Resource Scarcity, as a Primary Driver of Conflicts between Small-Scale and Industrial Fishers. Ecol. Soc., 2023, 28. [Google Scholar] [CrossRef]
- Cisneros-Montemayor, A.M.; Moreno-Báez, M.; Voyer, M.; Allison, E.H.; Cheung, W.W.; Hessing-Lewis, M.; Oyinlola, M.A.; Singh, G.G.; Swartz, W.; Ota, Y. Social Equity and Benefits as the Nexus of a Transformative Blue Economy: A Sectoral Review of Implications. Mar. Policy, 2019, 109, 103702. [Google Scholar] [CrossRef]
- Hecht, T.; Jones, C.L.W. Use of Wild Fish and Other Aquatic Organisms as Feed in Aquaculture – a Review of Practices and Implications in Africa and the Near East, Technical Peper No. 518. In Fish as feed inputs for aquaculture: practices, sustainability and implications; Hasan, M. R., Halwart, M., Eds.; FAO Fisheries and Aquaculture Technical Papers; FAO Fisheries and Aquaculture: Rome, 2009; pp. 129–157. [Google Scholar]
- Bjørndal, T.; Guillen, J. Market Competition between Farmed and Wild Fish: A Literature Survey; Fisheriews and Aquaculture; Circular C1114; FAO: Food and Agriculture Organization of the United Nations: Rome, 2016; p. 34. [Google Scholar]
- Cashion, T.; Le Manach, F.; Zeller, D.; Pauly, D. Most Fish Destined for Fishmeal Production Are Food-Grade Fish. Fish Fish., 2017, 18, 837–844. [Google Scholar] [CrossRef]
- Edwards, P.; Zhang, W.; Belton, B.; Little, D.C. Misunderstandings, Myths and Mantras in Aquaculture: Its Contribution to World Food Supplies Has Been Systematically over Reported. Mar. Policy, 2019, 106, 103547. [Google Scholar] [CrossRef]
- Villanueva García Benítez, J.; Flores-Nava, A. The Contribution of Small-Scale Fisheries to Food Security and Family Income in Chile, Colombia, and Peru. In Viability and Sustainability of Small-Scale Fisheries in Latin America and The Caribbean; Salas, S., Barragán-Paladines, M.J., Chuenpagdee, R., Eds.; MARE Publication Series; Springer International Publishing: Cham, Switzerland, 2019; pp. 329–352. [Google Scholar]
- Ahern, M.B.; Thilsted, S.H.; Kjellevold, M.; Overå, R.; Toppe, J.; Doura, M.; Kalaluka, E.; Wismen, B.; Vargas, M.; Franz, N. Locally-Procured Fish Is Essential in School Feeding Programmes in Sub-Saharan Africa. Foods, 2021, 10, 2080. [Google Scholar] [CrossRef] [PubMed]
- Fiorella, K.J.; Okronipa, H.; Baker, K.; Heilpern, S. Contemporary Aquaculture: Implications for Human Nutrition. Curr. Opin. Biotechnol., 2021, 70, 83–90. [Google Scholar] [CrossRef] [PubMed]
- Pringle, R.M. The Nile Perch in Lake Victoria: Local Responses and Adaptations. Africa, 2005, 75, 510–538. [Google Scholar] [CrossRef]
- Natugonza, V.; Nyamweya, C.; Sturludóttir, E.; Musinguzi, L.; Ogutu-Ohwayo, R.; Bassa, S.; Stefansson, G. Spatiotemporal Variation in Fishing Patterns and Fishing Pressure in Lake Victoria (East Africa) in Relation to Balanced Harvest. Fish. Res., 2022, 252, 106355. [Google Scholar] [CrossRef]
- Engle, C.R.; McNevin, A.; Racine, P.; Boyd, C.E.; Paungkaew, D.; Viriyatum, R.; Tinh, H.Q.; Minh, H.N. Economics of Sustainable Intensification of Aquaculture: Evidence from Shrimp Farms in Vietnam and Thailand. J. World Aquac. Soc., 2017, 48, 227–239. [Google Scholar] [CrossRef]
- Neori, A.; Nobre, A.M. Relationship Between Trophic Level and Economics in Aquaculture. Aquac. Econ. Manag., 2012, 16, 40–67. [Google Scholar] [CrossRef]
- Emerenciano, M.G.C.; Rombenso, A.N.; Vieira, F. d N.; Martins, M.A.; Coman, G.J.; Truong, H.H.; Noble, T.H.; Simon, C.J. Intensification of Penaeid Shrimp Culture: An Applied Review of Advances in Production Systems, Nutrition and Breeding. Animals, 2022, 12, 236. [Google Scholar] [CrossRef] [PubMed]
- Naylor, R.L.; Goldburg, R.J.; Primavera, J.H.; Kautsky, N.; Beveridge, M.C.M.; Clay, J.; Folke, C.; Lubchenco, J.; Mooney, H.; Troell, M. Effect of Aquaculture on World Fish Supplies. Nature, 2000, 405, 1017–1024. [Google Scholar] [CrossRef]
- Froehlich, H.E.; Jacobsen, N.S.; Essington, T.E.; Clavelle, T.; Halpern, B.S. Avoiding the Ecological Limits of Forage Fish for Fed Aquaculture. Nat. Sustain., 2018, 1, 298–303. [Google Scholar] [CrossRef]
- Glencross, B. Where Are We with the Sustainability of Fishmeal Fisheries? | IFFO- the Marine Ingredients Organisation https://www.iffo.com/where-are-we-sustainability-fishmeal-fisheries (accessed Feb 10, 2024).
- FAO. Sustainability in Action; The State of World Fisheries and Aquaculture; Annual; FAO, Food and Agriculture Organization of the United Nations: Rome, 2020; p. 207. ISSN 1020-5489. [Google Scholar]
- Dème, E. hadj B.; Failler, P.; Fall, A.D.; Dème, M.; Diedhiou, I.; Touron-Gardic, G.; Bocoum, W.; Asiedu, B. Contribution of Small-Scale Migrant Fishing to the Emergence of the Fishmeal Industry in West Africa: Cases of Mauritania, Senegal and the Gambia. Front. Mar. Sci., 2023, 10, 871911. [Google Scholar] [CrossRef]
- Tai, T.C.; Cashion, T.; Lam, V.W.Y.; Swartz, W.; Sumaila, U.R. Ex-Vessel Fish Price Database: Disaggregating Prices for Low-Priced Species from Reduction Fisheries. Front. Mar. Sci., 2017, 4, 363. [Google Scholar] [CrossRef]
- Bennett, N.J.; Alava, J.J.; Ferguson, C.E.; Blythe, J.; Morgera, E.; Boyd, D.; Côté, I.M. Environmental (in)Justice in the Anthropocene Ocean. Mar. Policy, 2023, 147, 105383. [Google Scholar] [CrossRef]
- Sumaila, U.R.; Lam, V.; Le Manach, F.; Swartz, W.; Pauly, D. Global Fisheries Subsidies: An Updated Estimate. Mar. Policy, 2016, 69, 189–193. [Google Scholar] [CrossRef]
- Schuhbauer, A.; Skerritt, D.J.; Ebrahim, N.; Le Manach, F.; Sumaila, U.R. The Global Fisheries Subsidies Divide Between Small- and Large-Scale Fisheries. Front. Mar. Sci., 2020, 7. [Google Scholar] [CrossRef]
- Skerritt, D.J.; Schuhbauer, A.; Villasante, S.; Cisneros-Montemayor, A.M.; Bennett, N.J.; Mallory, T.G.; Lam, V.W.L.; Arthur, R.I.; Cheung, W.W.L.; Teh, L.S.L.; Roumbedakis, K.; Palomares, M.L.D.; Sumaila, U.R. Mapping the Unjust Global Distribution of Harmful Fisheries Subsidies. Mar. Policy, 2023, 152, 105611. [Google Scholar] [CrossRef]
- Nielsen, M.; Smit, J.; Guillen, J. Price Effects of Changing Quantities Supplied at the Integrated European Fish Market. Mar. Resour. Econ., 2012, 27, 165–180. [Google Scholar] [CrossRef]
- HLPE- High Level Panel of Experts (HLPE). Sustainable Fisheries and Aquaculture for Food Security and Nutrition A Report by the High Level Panel of Experts on Food Security and Nutrition.; HLPE Reports; HLPE Policy Support and Governance Gateway 7; Committee on World Food Security: Rome, 2014; p. 119. [Google Scholar]
- Sjöberg, E. Pricing on the Fish Market—Does Size Matter? Mar. Resour. Econ., 2015, 30, 277–296. [Google Scholar] [CrossRef]
- Lem, A.; Bjorndal, T.; Lappo, A. Economic Analysis of Supply and Demand for Food up to 2030 – Special Focus on Fish and Fishery Products.; FAO Fisheries and Aquaculture Circular 1089; FAO: Food and Agriculture Organization of the United Nations: Rome, 2014; p. 106. [Google Scholar]
- Cornelsen, L.; Green, R.; Turner, R.; Dangour, A.D.; Shankar, B.; Mazzocchi, M.; Smith, R.D. What Happens to Patterns of Food Consumption When Food Prices Change? Evidence from A Systematic Review and Meta-Analysis of Food Price Elasticities Globally. Health Econ., 2015, 24, 1548–1559. [Google Scholar] [CrossRef]
- Selina Wamuchii. Peru Fish Prices. Selina Wamucii.
- Deme, E. hadj B.; Deme, M.; Failler, P. Small Pelagic Fish in Senegal: A Multi-Usage Resource. Mar. Policy, 2022, 141, 105083. [Google Scholar] [CrossRef]
- GLOBEFISH, Food and Agriculture Organization of the United Nations. Global trade statistical update - Small Pelagics https://www.sidalc.net/search/Record/dig-fao-it-20.500.14283-CA5870EN/Description (accessed Jun 18, 2024).
- Lancker, K.; Bronnmann, J. Substitution Preferences for Fish in Senegal. Environ. Resour. Econ., 2022, 82, 1015–1045. [Google Scholar] [CrossRef]
- Guillen, J.; Maynou, F. Characterisation of Fish Species Based on Ex-Vessel Prices and Its Management Implications: An Application to the Spanish Mediterranean. Fish. Res., 2015, 167, 22–29. [Google Scholar] [CrossRef]
- Ceyhan, V.; Emir, M. Structural and Economic Analysis of Turkish Fishmeal and Fish Oil Industry. Turk. J. Fish. Aquat. Sci., 2015, 15, 841–850. [Google Scholar]
- Canitez, F.; Alpkokin, P.; Kiremitci, S.T. Sustainable Urban Mobility in Istanbul: Challenges and Prospects. Case Stud. Transp. Policy, 2020, 8, 1148–1157. [Google Scholar] [CrossRef]
- Sagun, O.K.; Sayğı, H. Consumption of Fishery Products in Turkey’s Coastal Regions. Br. Food J., 2021, 123, 3070–3084. [Google Scholar] [CrossRef]
- Yilmaz, İ.; Yilmaz, S.; Olguner, M.T. Assessment of Fishery Products Consumption Behavior: the Case of Turkey. Agro -Knowl. J., 2016, 17, 101–111. [Google Scholar] [CrossRef]
- Tveteras, S.; Paredes, C.E.; Peña-Torres, J. Individual Vessel Quotas in Peru: Stopping the Race for Anchovies. Mar. Resour. Econ., 2011, 26. [Google Scholar] [CrossRef]
- Veiga, P.; Sousa, P.; Lee-Harwood, B.; Lee-Harwood, B.; Segurado, S.; Schmidt, C. Reduction Fisheries: SFP Fisheries Sustainability Overview; Sustainable Fisheries Partnership Foundation, 2015; p. 35.
- Pincinato, R.B.M.; Asche, F.; Oglend, A. Climate Change and Small Pelagic Fish Price Volatility. Clim. Change, 2020, 161, 591–599. [Google Scholar] [CrossRef]
- Hartje, R.; Bühler, D.; Grote, U. Eat Your Fish and Sell It, Too – Livelihood Choices of Small-Scale Fishers in Rural Cambodia. Ecol. Econ., 2018, 154, 88–98. [Google Scholar] [CrossRef]
- Koehn, L.E.; Essington, T.E.; Marshall, K.N.; Sydeman, W.J.; Szoboszlai, A.I.; Thayer, J.A. Trade-Offs between Forage Fish Fisheries and Their Predators in the California Current. ICES J. Mar. Sci., 2017, 74, 2448–2458. [Google Scholar] [CrossRef]
- Eddy, T.D.; Bernhardt, J.R.; Blanchard, J.L.; Cheung, W.W.; Colléter, M.; Du Pontavice, H.; Fulton, E.A.; Gascuel, D.; Kearney, K.A.; Petrik, C.M. Energy Flow Through Marine Ecosystems: Confronting Transfer Efficiency. Trends Ecol. Evol., 2021, 36, 76–86. [Google Scholar] [CrossRef] [PubMed]
- Zhang, W.; Ye, Z.; Tian, Y.; Yu, H.; Ma, S.; Ju, P.; Watanabe, Y. Spawning Overlap of Japanese Anchovy Engraulis Japonicus and Japanese Spanish Mackerel Scomberomorus Niphonius in the Coastal Yellow Sea: A Prey–Predator Interaction. Fish. Oceanogr., 2022, 31, 456–469. [Google Scholar] [CrossRef]
- Free, C.M.; Jensen, O.P.; Hilborn, R. Evaluating Impacts of Forage Fish Abundance on Marine Predators. Conserv. Biol., 2021, 35, 1540–1551. [Google Scholar] [CrossRef] [PubMed]
- Ortiz, M. Pre-Image Population Indices for Anchovy and Sardine Species in the Humboldt Current System off Peru and Chile: Years Decaying Productivity. Ecol. Indic., 2020, 119, 106844. [Google Scholar] [CrossRef]
- Swartzman, G.; Bertrand, A.; Gutiérrez, M.; Bertrand, S.; Vásquez, L. The Relationship of Anchovy and Sardine to Water Masses in the Peruvian Humboldt Current System from 1983 to 2005. Prog. Oceanogr., 2008, 79, 228–237. [Google Scholar] [CrossRef]
- CEIC. Peru Fishery Production: Vol: Sea Fishing: Fresh: Mackerel | Economic Indicators | CEIC https://www.ceicdata.com/en/peru/fishery-production-volume/fishery-production-vol-sea-fishing-fresh-mackerel (accessed Jun 20, 2024).
- Natividad, G. Quotas, Productivity, and Prices: The Case of Anchovy Fishing. J. Econ. Manag. Strategy, 2016, 25, 220–257. [Google Scholar] [CrossRef]
- Bennett, N.J.; Blythe, J.; White, C.S.; Campero, C. Blue Growth and Blue Justice: Ten Risks and Solutions for the Ocean Economy. Mar. Policy, 2021, 125, 104387. [Google Scholar] [CrossRef]
- Beşe Canpolat, Ş.; Gök, M.G. Census Methodology in Turkey: Transformation from Traditional to Register-Based Administrative Data. Stat. J. IAOS, 2020, 36, 177–185. [Google Scholar] [CrossRef]
- Cojocaru, A.L.; Liu, Y.; Smith, M.D.; Akpalu, W.; Chávez, C.; Dey, M.M.; Dresdner, J.; Kahui, V.; Pincinato, R.B.M.; Tran, N. The “Seafood” System: Aquatic Foods, Food Security, and the Global South. Rev. Environ. Econ. Policy, 2022, 16, 306–326. [Google Scholar] [CrossRef]
- Cohen, P.J.; Allison, E.H.; Andrew, N.L.; Cinner, J.; Evans, L.S.; Fabinyi, M.; Garces, L.R.; Hall, S.J.; Hicks, C.C.; Hughes, T.P.; Jentoft, S.; Mills, D.J.; Masu, R.; Mbaru, E.K.; Ratner, B.D. Securing a Just Space for Small-Scale Fisheries in the Blue Economy. Front. Mar. Sci., 2019, 6. [Google Scholar] [CrossRef]
- ReportLinker. Fishmeal Global Market Report 2023 https://www.globenewswire.com/en/news-release/2023/03/03/2620246/0/en/Fishmeal-Global-Market-Report-2023.html (accessed Jun 6, 2024).
- Beveridge, M.C.M.; Thilsted, S.H.; Phillips, M.J.; Metian, M.; Troell, M.; Hall, S.J. Meeting the Food and Nutrition Needs of the Poor: The Role of Fish and the Opportunities and Challenges Emerging from the Rise of Aquaculturea. J. Fish Biol., 2013, 83, 1067–1084. [Google Scholar] [CrossRef] [PubMed]
- Willman, R. Economic Factors of Excess Fishing Effort. In 22nd Session of the Indo-Pacific Fishery Commission; Regional Office for Asia and the Pacific; Food and Agriculture Organization of the United Nations: Darwin, Australia, 1987; pp. 16–26. [Google Scholar]
- Boyd, C.E.; D’Abramo, L.R.; Glencross, B.D.; Huyben, D.C.; Juarez, L.M.; Lockwood, G.S.; McNevin, A.A.; Tacon, A.G.J.; Teletchea, F.; Tomasso, J.R.; Tucker, C.S.; Valenti, W.C. Achieving Sustainable Aquaculture: Historical and Current Perspectives and Future Needs and Challenges. J. World Aquac. Soc., 2020, 51, 578–633. [Google Scholar] [CrossRef]
- Albrektsen, S. Future Feed Resources in Sustainable Salmonid Production: A Review. Rev. Aquac., 2022, 14, 1790–1812. [Google Scholar] [CrossRef]
- Edward, P. Examining Inequality: Who Really Benefits from Global Growth? World Dev., 2006, 34, 1667–1695. [Google Scholar] [CrossRef]
Figure 1.
Forage fish in a Madagascar market (Photo: M. Agami).
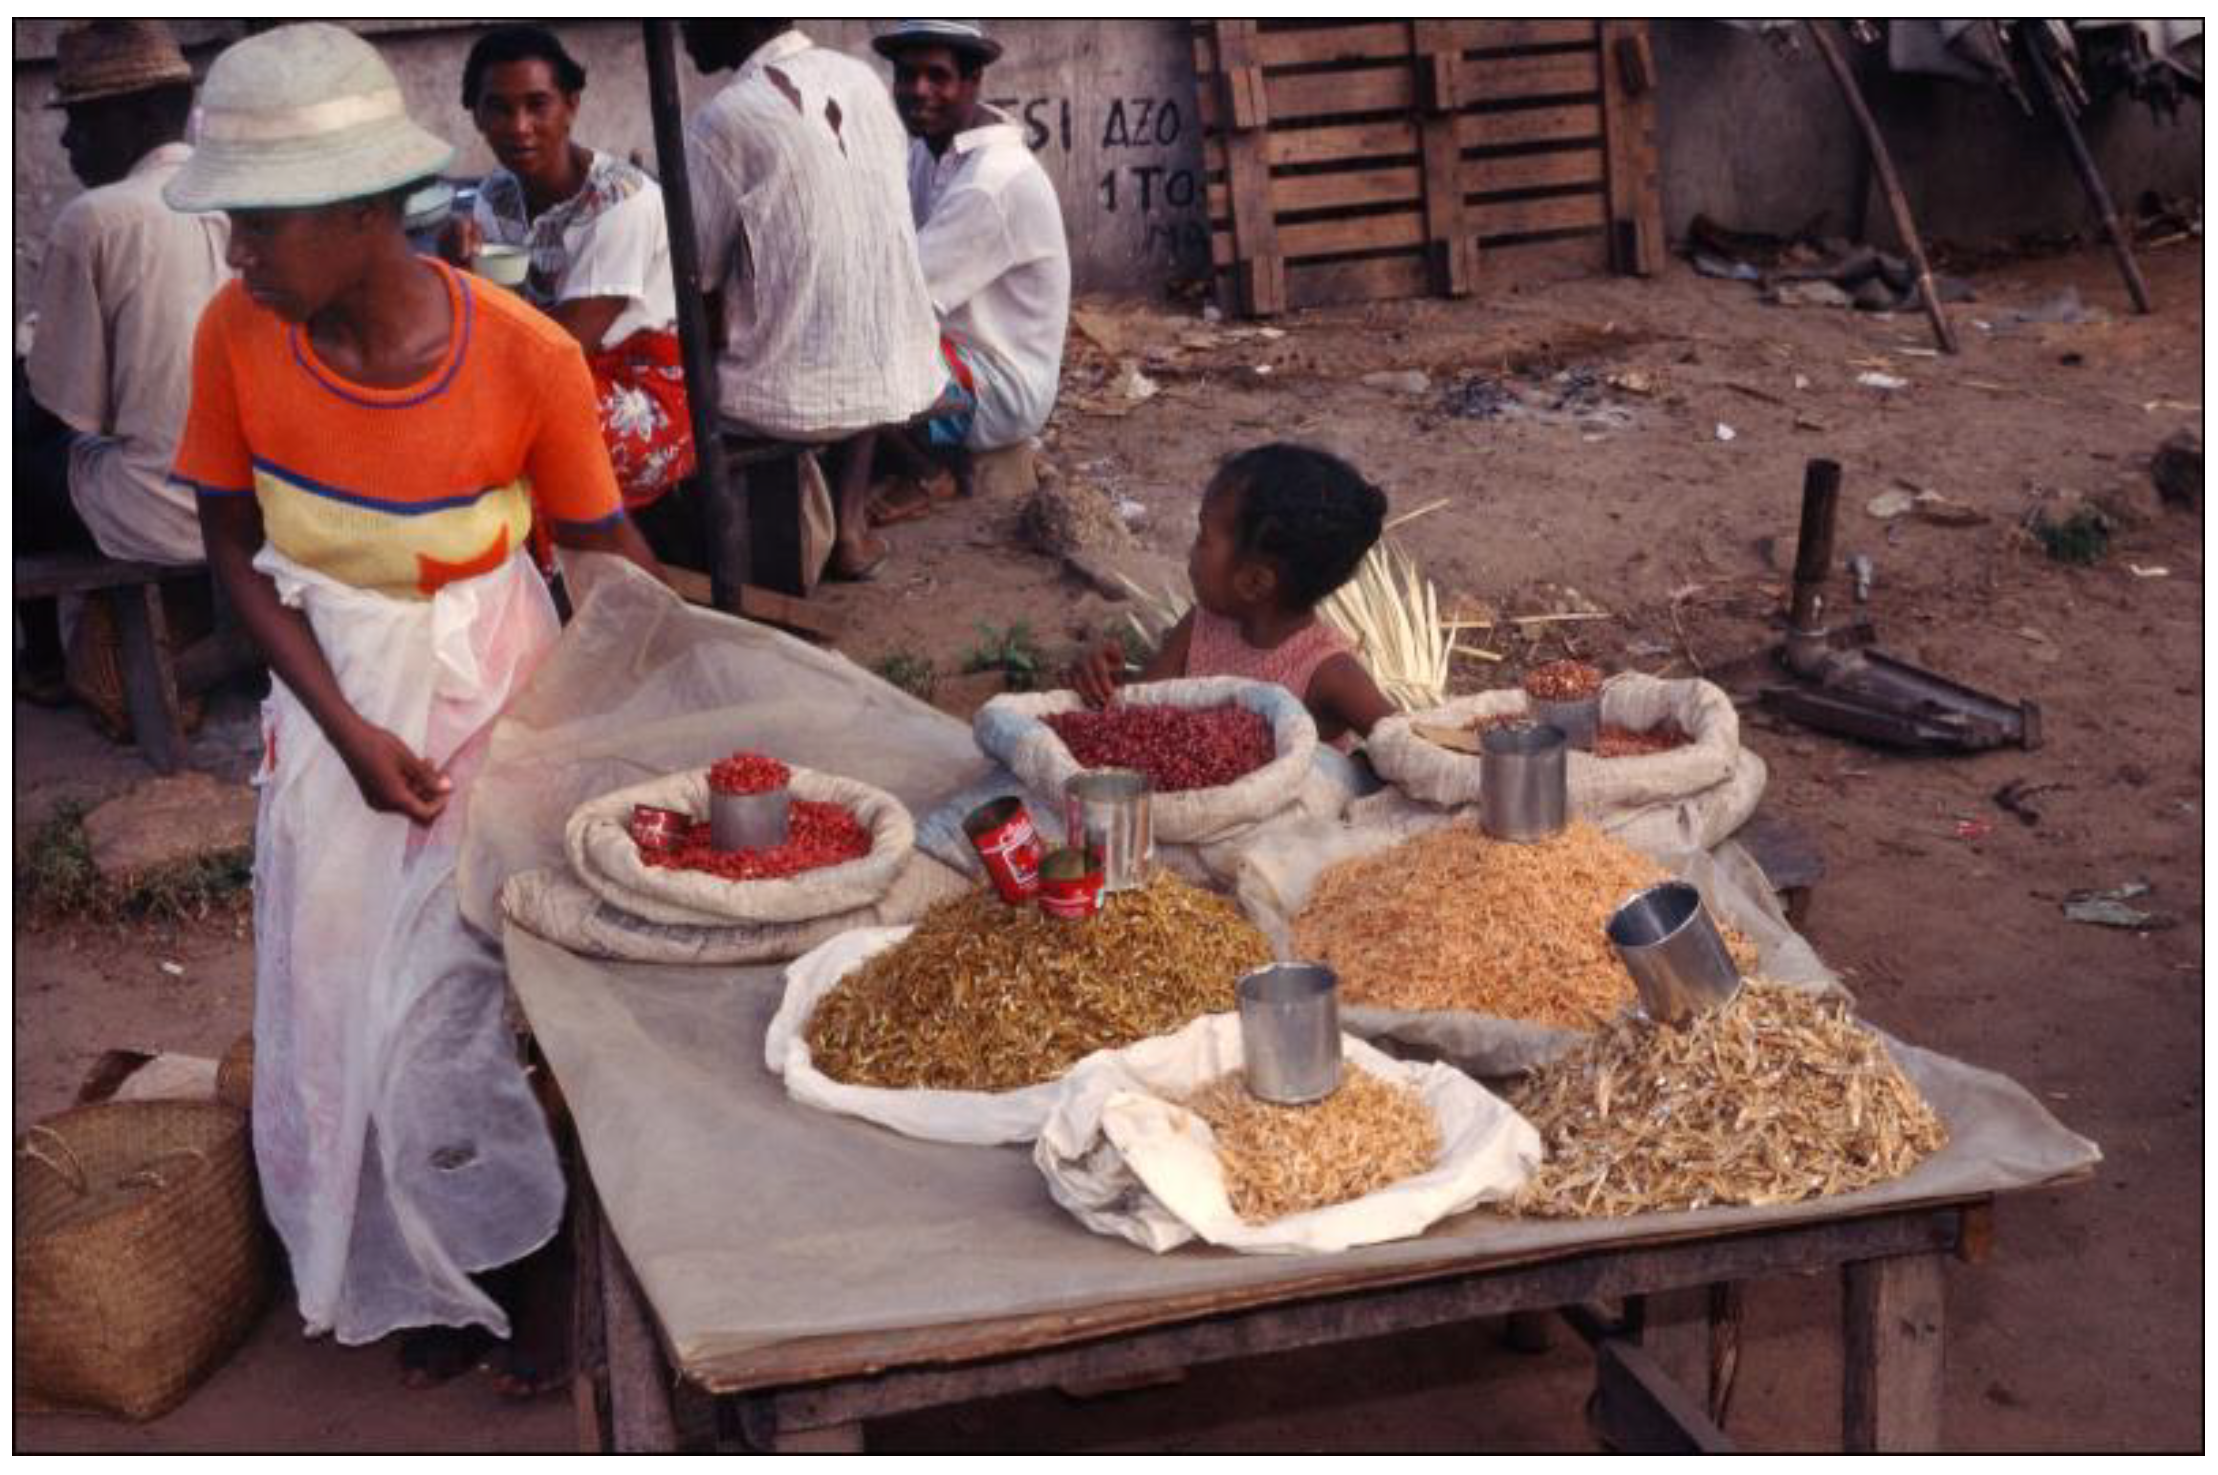
Figure 2.
Total global capture of forage fish and percent of total capture remaining domestically in the local fresh fish markets.
Figure 2.
Total global capture of forage fish and percent of total capture remaining domestically in the local fresh fish markets.
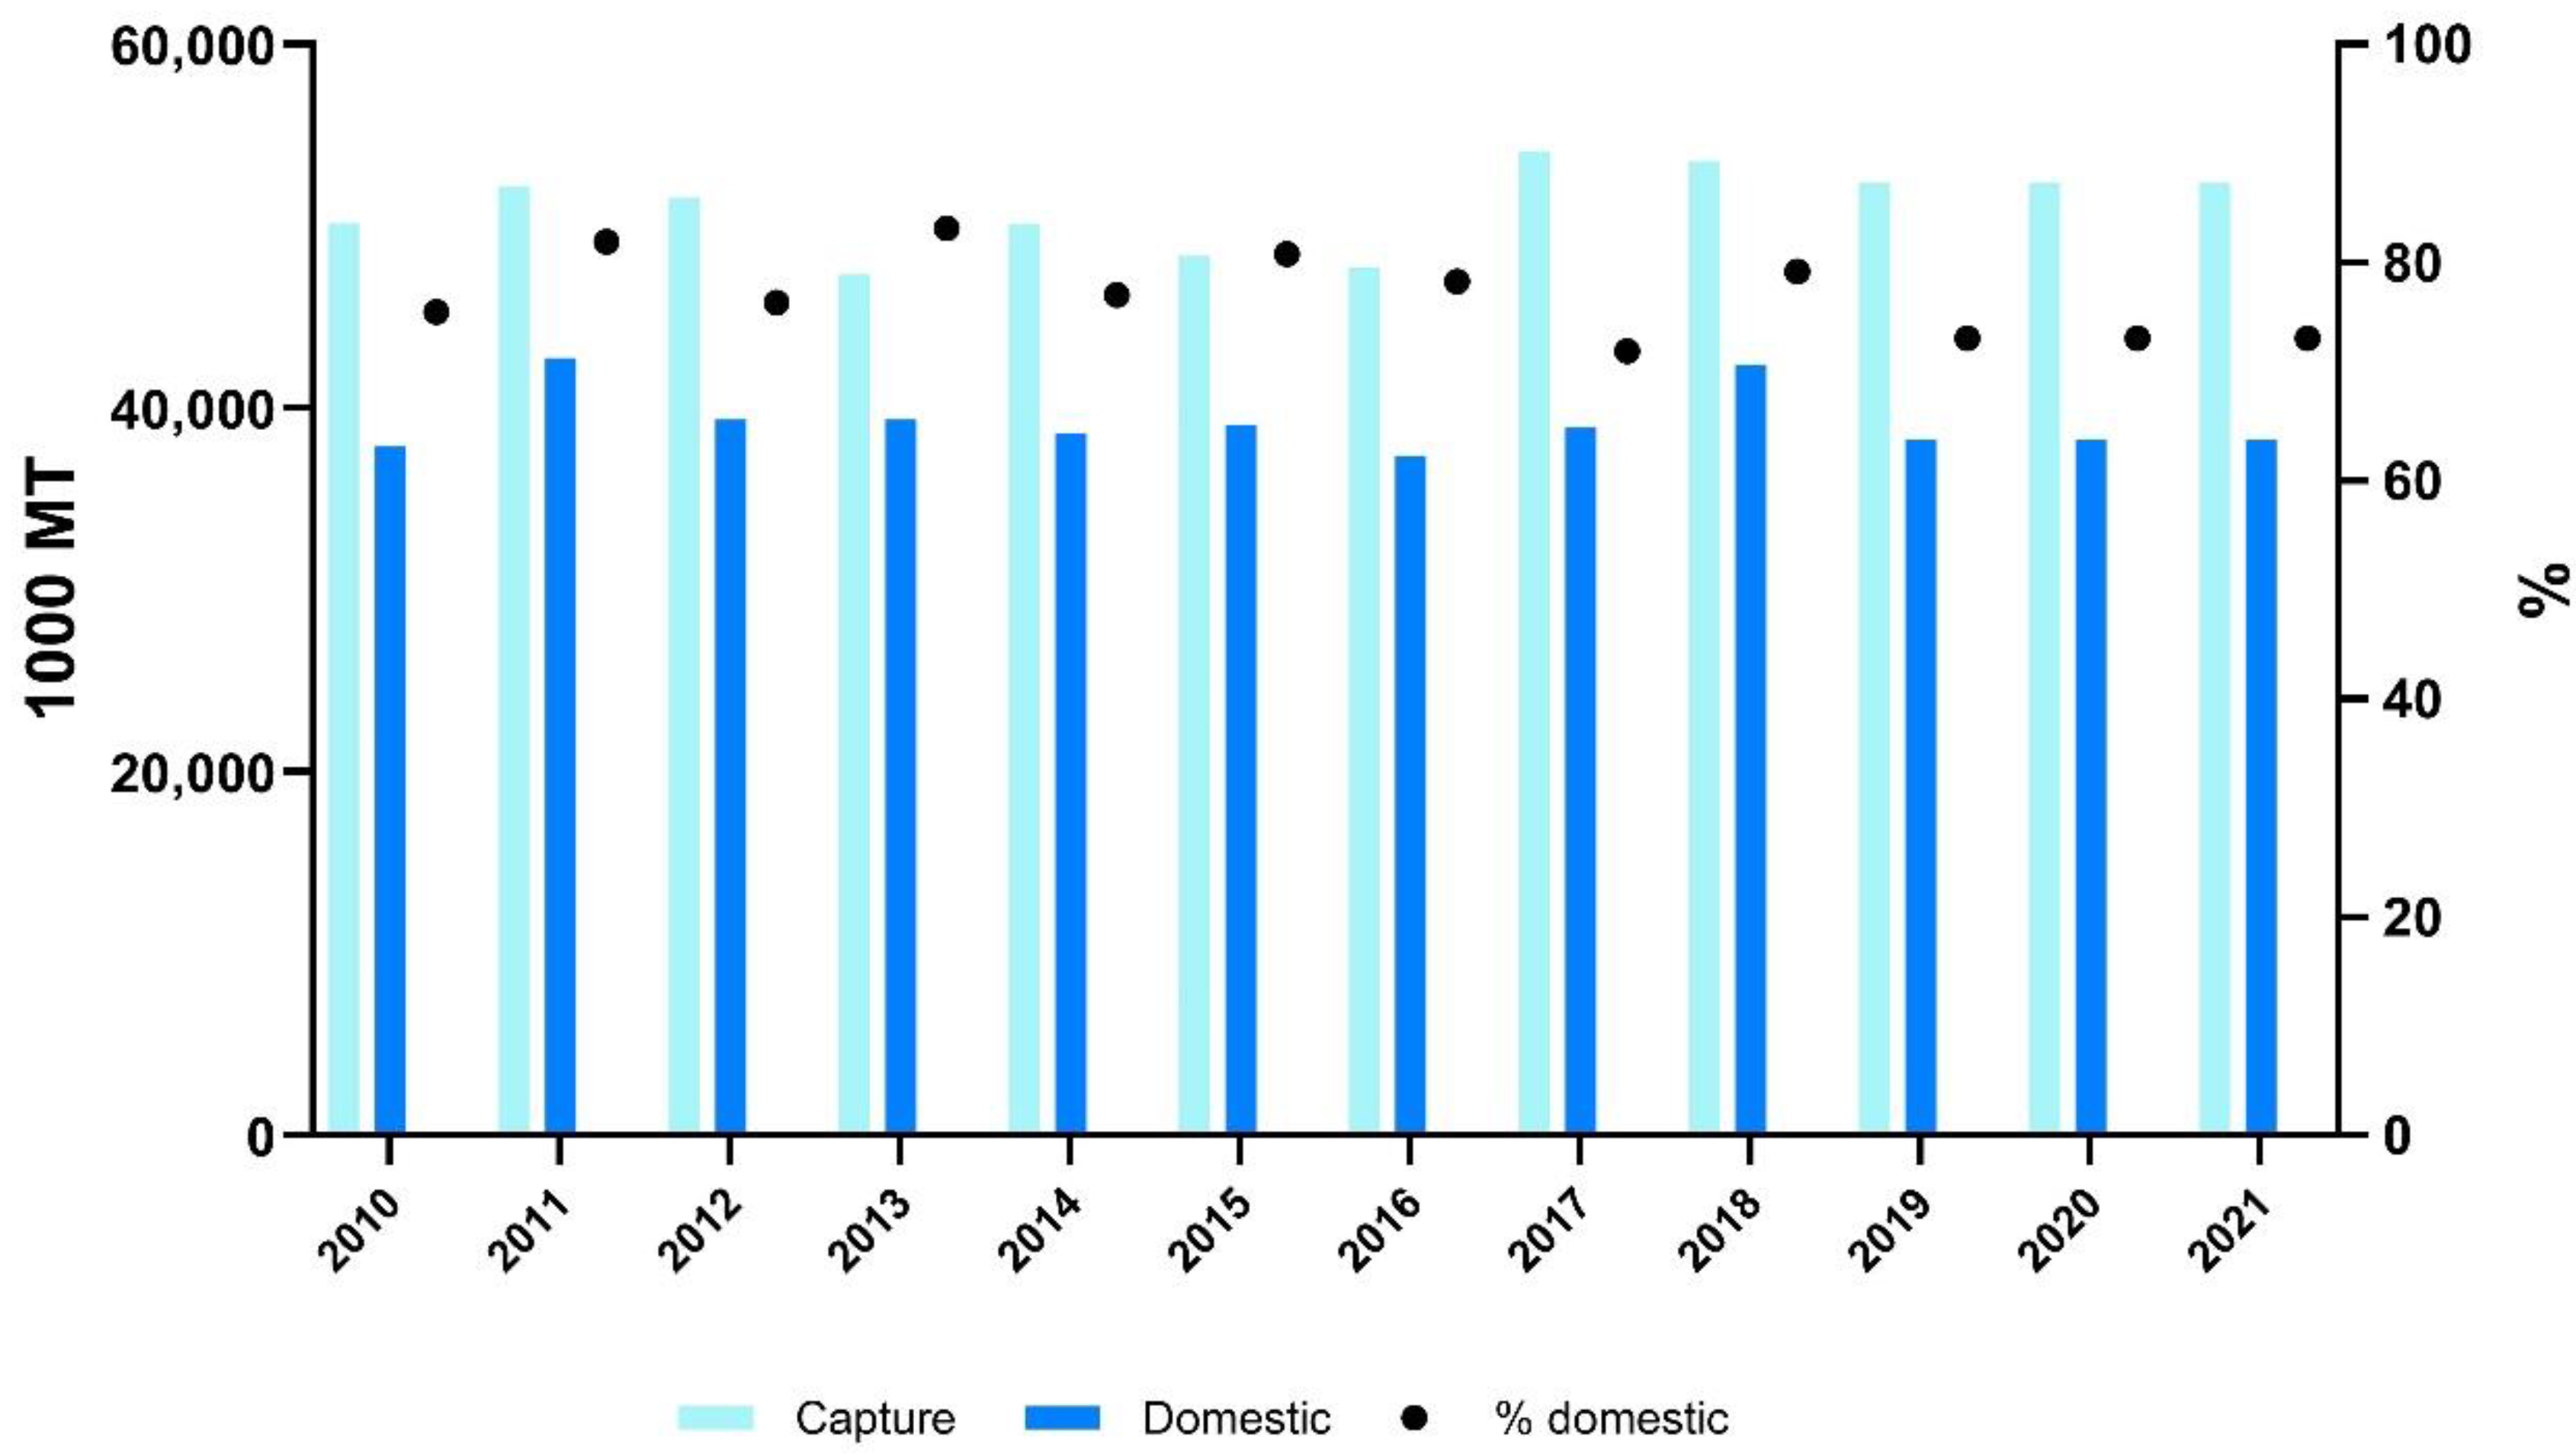
Figure 4.
In the Acre, Israel fish market (Photo: A Neori).
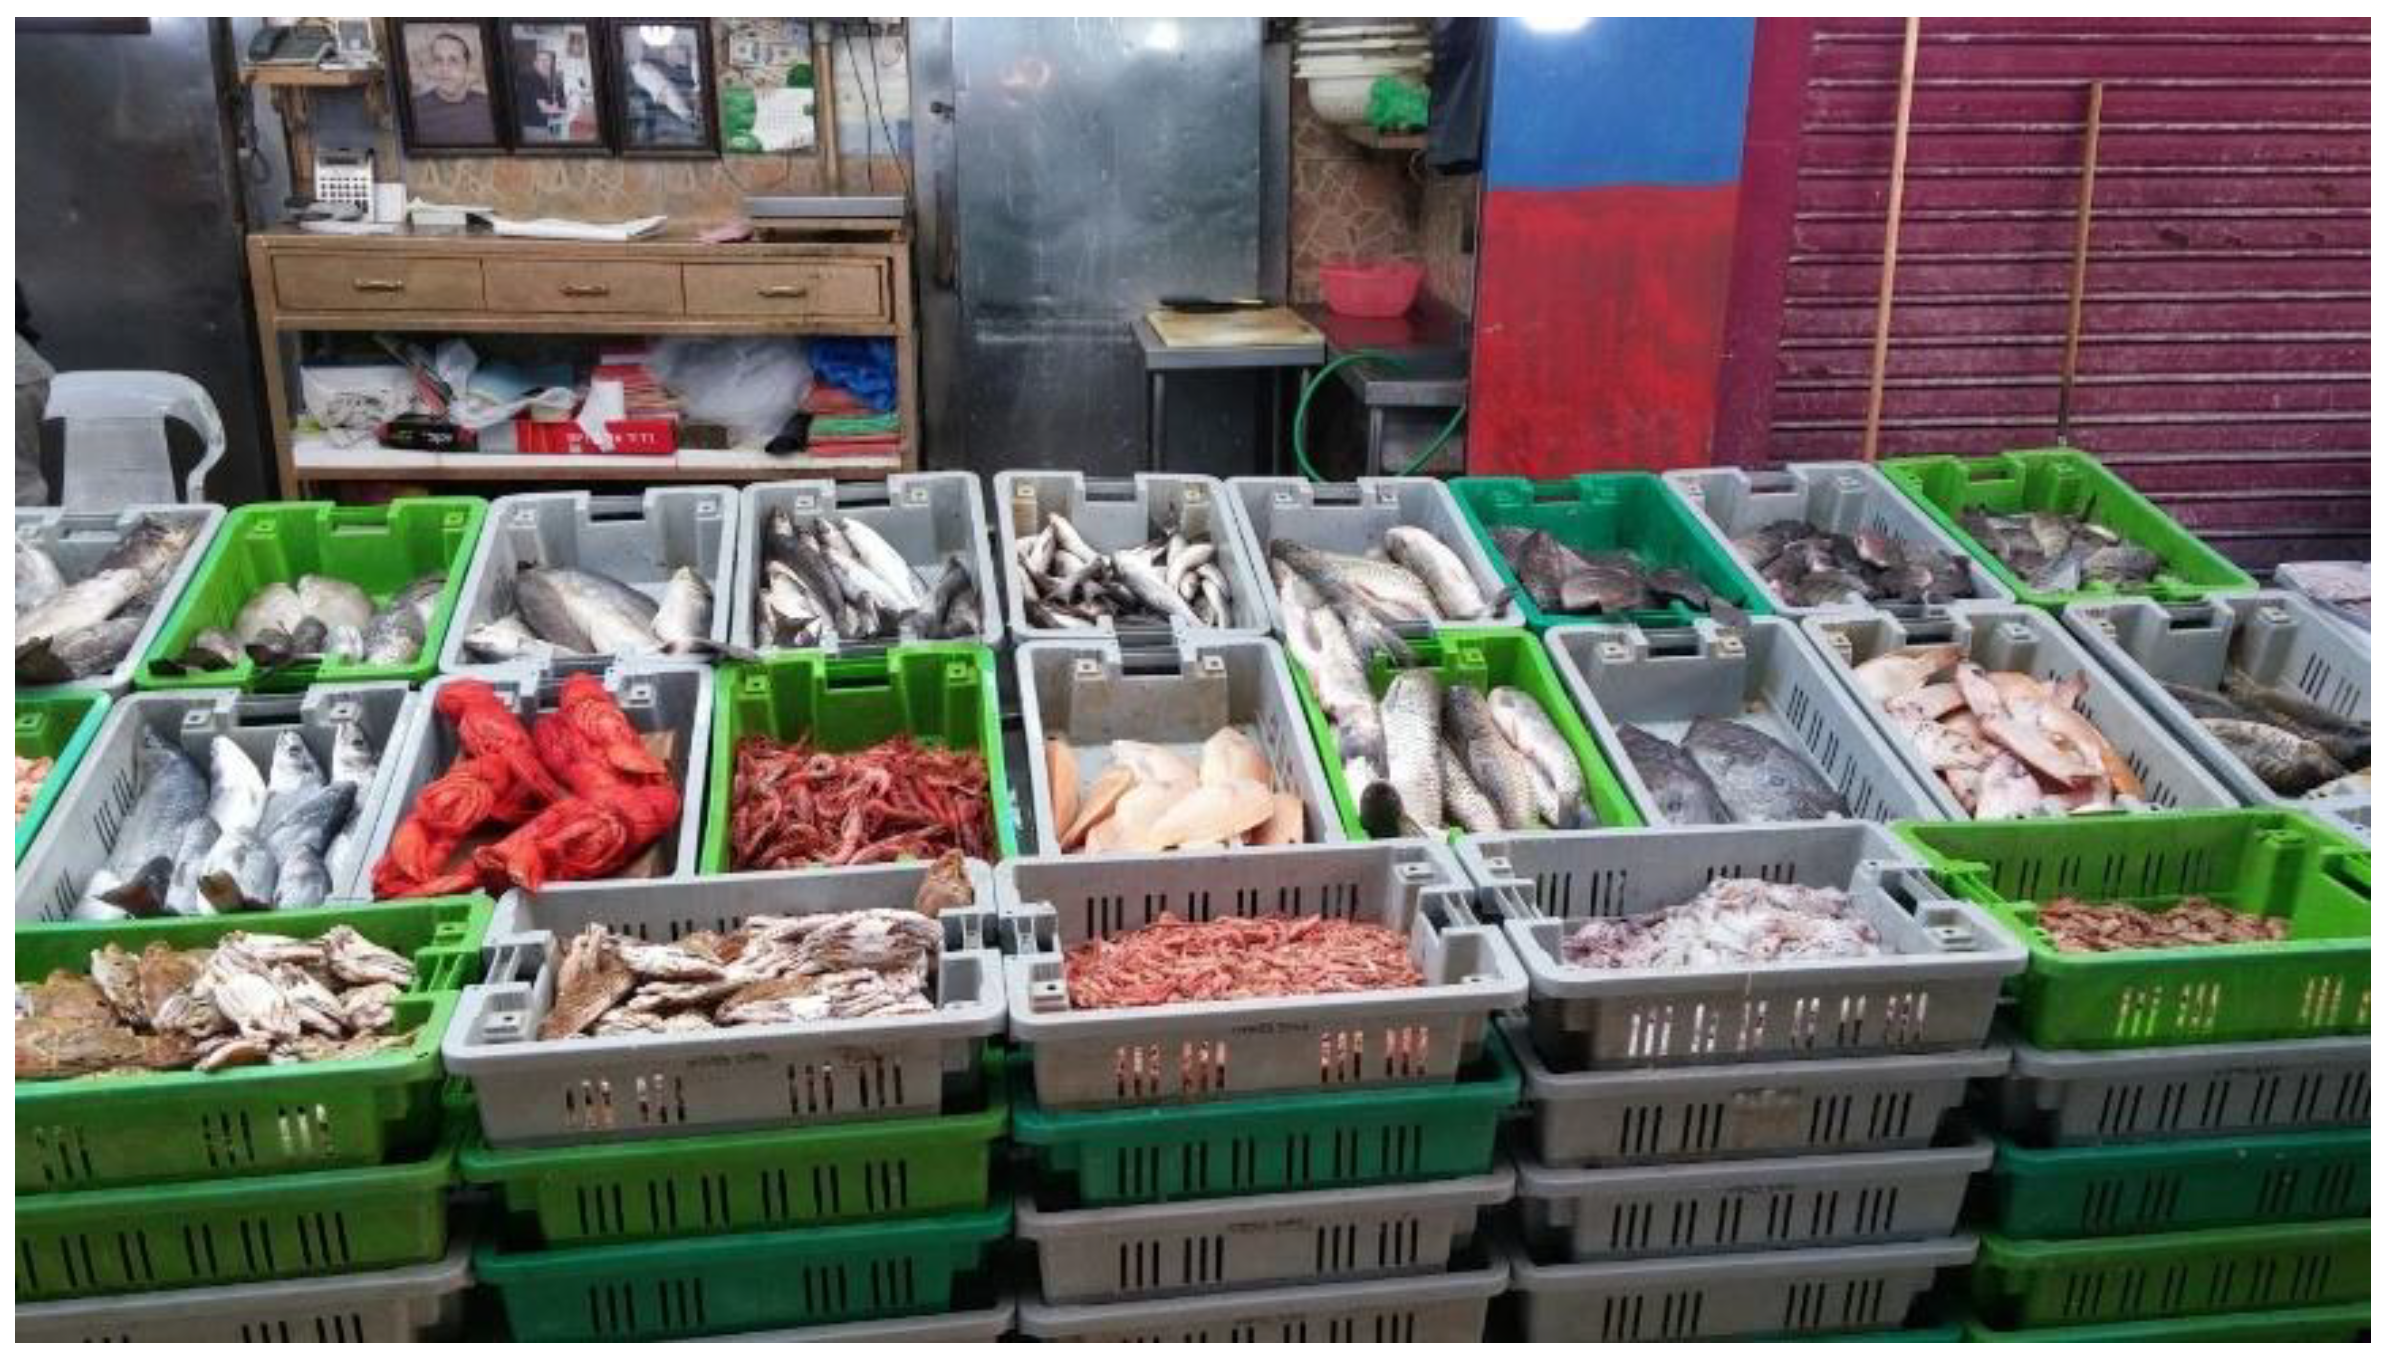
Figure 5.
The total capture of forage fish and the percentage of total capture remains in the local markets in Peru, Namibia, and Chile.
Figure 5.
The total capture of forage fish and the percentage of total capture remains in the local markets in Peru, Namibia, and Chile.
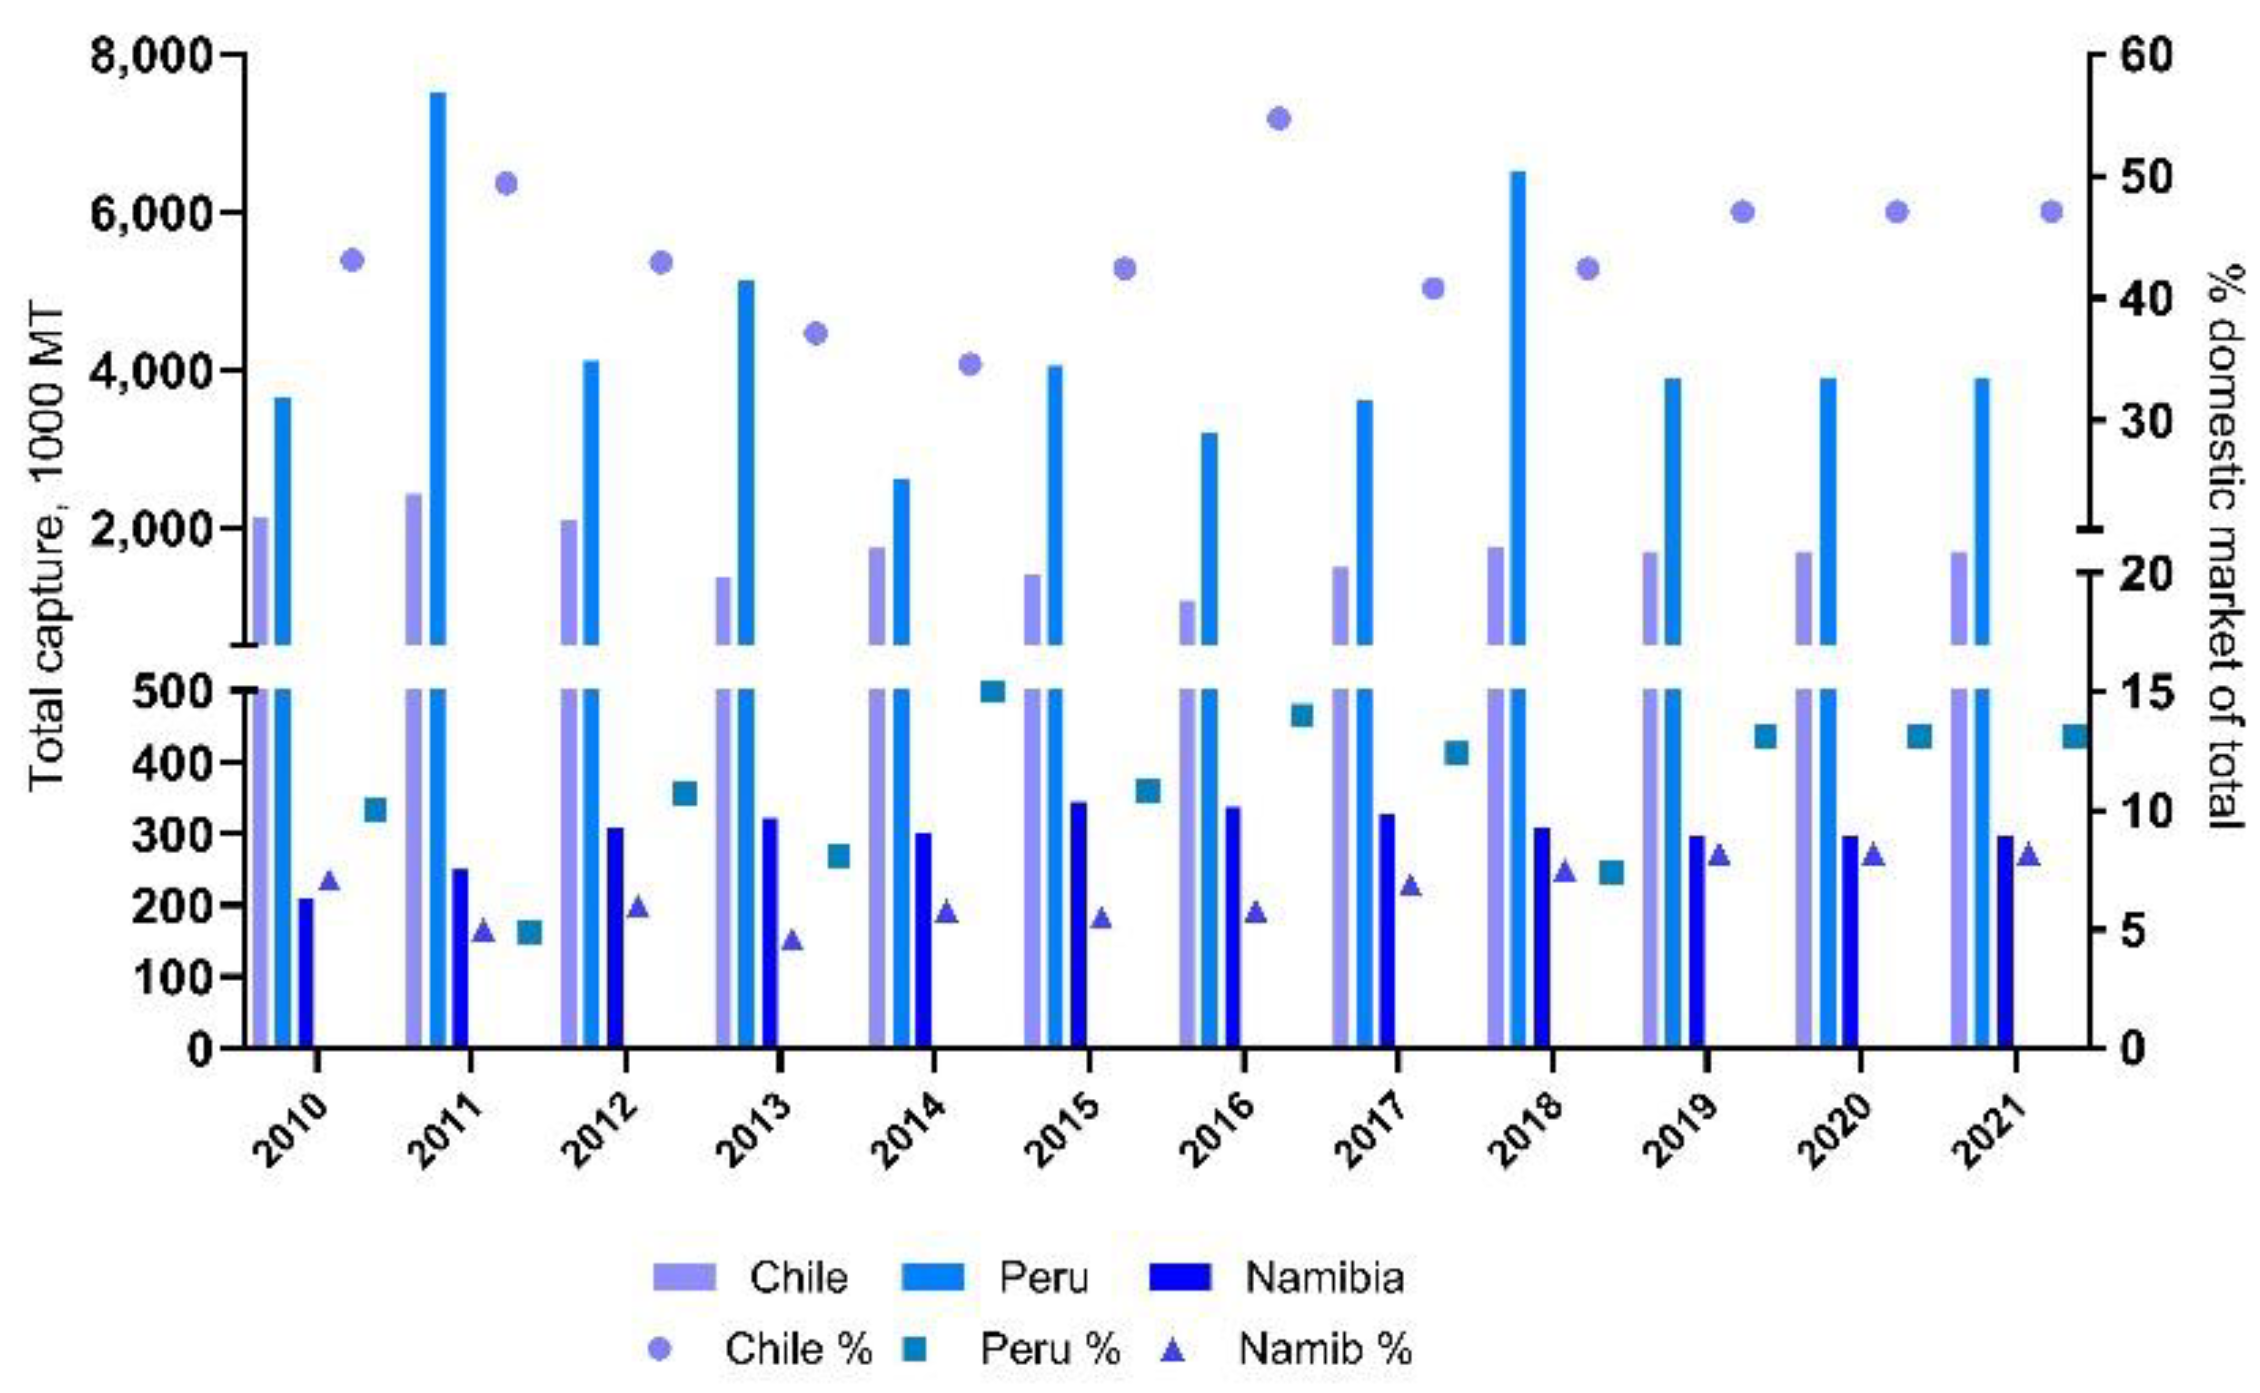

Table 1.
Supply and prices of forage fish in the fresh fish markets. For each case, base (factual) values of market quantity and price are followed by boosted values of market quantity and consequently reduced prices, and the postulated subsidy thereof for a hypothetical family of five and the nation if the base supply was priced with the boosted price.
| Country | Base market supply MT. | Base price刘US$ MT-1 | Base total刘US$ million | Boosted supply % | Boosted fish supply MT. | Price flexibility, quantity: price | Reduced price刘US$ MT-1 | Boosted total columns 6 x 8 刘US$ million | Specific subsidy columns 3 minus 8 US$ MT-1 | Hypothetical family levy-subsidy US$ y-1* | Total national subsidy, columns 2 x 10 million US$ y-1 |
|---|---|---|---|---|---|---|---|---|---|---|---|
| 1 | 2 | 3 | 4 | 5 | 6 | 7 | 8 | 9 | 10 | 11 | 12 |
| 1 Global | 5,000,000 | 780 | 39,000 | 10 | 5,500,000 | 1:1 | 702 | 38,600 | 78 | 1.17 a | 390 |
| 2 South Africa | 204,700 | 1,000 | 204.7 | 10 | 225,000 | 1:1 | 900 | 202.6 | 100 | 1.5 b | 20.5 |
| 3 Senegal a | 135,000 | 216 | 29.17 | 37.5 | 216,000 | 1:1 | 135 | 29.16 | 81 | 3.65 c | 10.9 |
| 4 Senegal b | 135,000 | 216 | 29.17 | 10 | 148,500 | 1:1 | 194.4 | 28.867 | 21.6 | 0.97 c | 2.9 |
| 5 Istanbul, Turkey | 100,000 | 767 | 76.7 | 10 | 110,000 | 1:1.5 | 652 | 71.7 | 115 | 3.9 d | 11.5 |
| 6 Peru forage fish | 240,000 | 1,000 | 240 | 10 | 264,000 | 1:1 | 900 | 237.6 | 100 | 1.5 e | 24 |
| 7 Peru Mackerel | 220,000 | 1,000 | 220 | 10 | 242,000 | 1:1 | 900 | 218 | 100 | 3.15 f | 22 |
* The levy paid by a family of five that consumes the annual average for that country with the base price, compared with the boosted price; A family of five annual consumption (kg y-1): a15; b15; c90; d31.25; e15; f 35.
Disclaimer/Publisher’s Note: The statements, opinions and data contained in all publications are solely those of the individual author(s) and contributor(s) and not of MDPI and/or the editor(s). MDPI and/or the editor(s) disclaim responsibility for any injury to people or property resulting from any ideas, methods, instructions or products referred to in the content. |
© 2024 by the authors. Licensee MDPI, Basel, Switzerland. This article is an open access article distributed under the terms and conditions of the Creative Commons Attribution (CC BY) license (https://creativecommons.org/licenses/by/4.0/).
Copyright: This open access article is published under a Creative Commons CC BY 4.0 license, which permit the free download, distribution, and reuse, provided that the author and preprint are cited in any reuse.


