Submitted:
01 July 2024
Posted:
02 July 2024
You are already at the latest version
Abstract
Light is a crucial environmental factor that influences the phenotypic development of plants. Despite extensive studies on the physiological, biochemical, and molecular mechanisms of the impact of light on phenotypes, genetic investigations regarding light-induced transgenerational plasticity in Arabidopsis thaliana remain incomplete. In this study, we used Arabidopsis thaliana as the material, then gathered phenotypic data regarding leaf number and plant height under high- and low-light conditions from two generations. In addition to the developed genotype data, a functional mapping model was used to locate a series of significant SNPs. Under low-light conditions, a noticeable adaptive change in the phenotype of leaf number in the second generation suggests the presence of transgenerational genetic effects in Arabidopsis thaliana under environmental stress. Under different lighting treatments, 33 and 13 significant genes associated with transgenerational inheritance were identified, respectively. These genes are largely involved in signal transduction, technical hormone pathways, light responses, and the regulation of organ development. Notably, genes identified under high-light conditions more significantly influence plant development, whereas those identified under low-light conditions focus more on responding to external environmental stimuli.
Keywords:
transgenerational
; functional mapping
; QTL
; light intensity
1. Introduction
Because of sessile growth, plants change their development and physiological characteristics under various environmental stresses to better adapt to the current environment [1]. This plasticity can be transmitted across generations, wherein the phenotype of offspring is influenced by the environmental conditions experienced by the maternal plant, a phenomenon referred to as transgenerational plasticity [2]. Transgenerational plasticity is mainly achieved through epigenetic mechanisms, including but not limited to DNA methylation, histone modification, and noncoding-RNA-mediated mechanisms [3]. In the expression of some abnormal phenotypes, the influence is even stronger than that of DNA inheritance [4]. This inheritance mode extends beyond conventional Mendelian genetics and encompasses the effects of environmental factors, lifestyles, and other nongenetic elements on offspring phenotypes.
Arabidopsis thaliana, a model plant in the field of botany, is highly regarded for its unique advantages. Researchers have extensively explored the transgenerational inheritance of phenotypes in this species. When recombinant Arabidopsis thaliana inbred lines were cultivated under mild heat conditions (30℃), the seed yield of the third generation surpassed that of the first generation by more than fivefold [5]. Under high-temperature stress, the flowering time and plant structure of Arabidopsis thaliana progeny exhibit substantial alterations, enhancing their adaptation to high-temperature environments [6]. The fruit quality fraction of the progeny of the ancestral plants in a low-nutrient environment was significantly higher than that of the progeny of the ancestral plants in a suitable nutrient environment [7]. These findings collectively suggest that Arabidopsis thaliana retains a non-DNA-inherited memory of ancestral environmental conditions, subsequently enhancing offspring adaptability. This memory appears to be transmitted through epigenetic inheritance mechanisms [8]. Intergenerational plasticity plays a pivotal role in enhancing offspring adaptability within the same environmental context, thereby notably bolstering plant survival capabilities under continuous environmental challenges [9,10].
Light exerts a profound influence on plant phenotypic development through signal sensing, signal transmission, and hormone regulation [11,12]; these responses to light conditions can also be transmitted to subsequent generations. For instance, in Wedelia trilobata, offspring subjected to low-light treatment displayed significantly increased leaf area, potential maximum net photosynthetic rates, and biomass accumulation compared with those under high-light conditions [13]. The offspring of Vicia faba L. exposed to short ultraviolet light for a long time established a protective mechanism through the accumulation of flavonoids in the early stage [14]. Projections for population growth in wild plants revealed that those adapted to their current light environment through maternal effects exhibit 3-4 times higher adaptability than other plants [2]. In Arabidopsis thaliana, a plethora of light-responsive signal receptors, growth-influencing biohormones, and enzymes and proteins that modulate biohormones have been identified [15,16,17]. However, genetic studies investigating the effects of light on transgenerational plasticity in Arabidopsis thaliana remain limited. Key areas such as the genes that play pivotal roles in transgenerational plasticity and those that exert indirect effects on this phenomenon warrant further exploration.
In this study, we employed a statistical model to quantitatively assess the genetic influences underlying transgenerational plasticity within the context of functional mapping. Using Arabidopsis thaliana as our study material, we aimed to identify the transgenerational plasticity gene by analyzing Arabidopsis thaliana genotypes and dynamic growth phenotypes across two generations subjected to high- and low-light treatments to elucidate the genetic mechanisms underlying the transgenerational phenotypic plasticity of Arabidopsis thaliana in response to varying light conditions.
2. Materials and Methods
2.1. Experimental Materials
In this study, hybrid progeny derived from Arabidopsis thaliana Ler (Landsberg erecta) and Shr (Shahdara) were used as parental materials. The primary phenotypic characteristics of Ler include round leaves, short petioles, short pedicels, and a plant height ranging from approximately 10 to 25 cm. Shr is characterized by narrow leaves and a plant height of approximately 30 cm. Through ten consecutive generations of selfing, a total of 84 recombined inbred lines (RILs) were generated, resulting in a highly pure population. This meticulously bred population served as an ideal resource for genetic mapping and QTL localization.
This study was initiated by sowing seeds from the RIL population consisting of 84 distinct lines. These seeds were cultivated to expand the population and subsequently divided into two groups, with each line having a total of 20 replicates. Arabidopsis thaliana seedlings were nurtured under controlled conditions, maintaining a constant temperature of 22°C, 80% relative humidity, 16 hours of daily light exposure, and a nutrient-rich soil mixture comprising charcoal ash, limestone, and vermiculite in a 1:1:1 ratio. The high-light group received daily illumination of 7633 lux, whereas the low-light group was exposed to 4852 lux. Subsequently, first-generation Arabidopsis thaliana populations under two different light treatments were obtained. Then, the seeds from both first-generation populations were propagated and subjected to high- and low-light treatments as described above, resulting in four second-generation Arabidopsis thaliana populations. In summary, the entire process yielded six groups of populations under different treatments, as illustrated in the simplified flowchart in Figure 1.
2.2. Phenotypic Data Acquisition
Phenotypic data, including measurements of plant height and total leaf count, were meticulously recorded at regular intervals starting from one week after planting and subsequently every seven days. The phenotypic values for leaf number included both rosette and cauline leaves, whereas the plant height phenotype was described using the primary inflorescence height. Comprehensive phenotypic data were amassed, capturing leaf number over seven measurement intervals and plant height over eight measurement intervals.
2.3. Genotypic Data Acquisition
After gathering the phenotypic data from Arabidopsis thaliana, we extracted the genomic DNA from the entire recombined inbred line (RIL) population. Whole-genome resequencing was conducted using the Illumina HiSeq2000 platform. The Arabidopsis thaliana reference genome data were downloaded from https://ftp.ncbi.nlm.nih.gov/gnomes/all/GCF/000/001/735/GCF_000001735.4_TAIR10.1/GCF_000001735.4_TAIR10.1_genomic.fna.gz. To ensure the quality of the raw data, BWA bioinformatic analysis software (bwa-0.7.17) was employed for alignment. Subsequently, SAMTOOLS (samtools-1.11) was used to detect single-nucleotide polymorphism (SNP) variants at the population level. The SNPs were filtered using VCFtools (vcftools-0.1.13) with the following criteria: a quality value of comparison ≥20, a quality value of variant detection ≥50, sequencing depth >12, P-value of Hardy–Weinberg equilibrium test >5%, minimum allele frequency >5%, and deletion and heterozygosity rates <10%. This process resulted in the identification of 164,029 high-quality SNPs.
2.4. Phenotypic Data Processing and Analysis
After phenotypic data were gathered from 20 replicates within each lineage and group at the designated measurement timepoint, the mean phenotypic value for each lineage was computed based on these 20 replicates. For the high-light first-generation population, any missing measurement data were excluded, resulting in a final set of phenotypic values for 79 genotypes. In accordance with our experimental design, comparisons among different phenotypic combinations were employed to characterize the plasticity relationships across generations. The specific plasticity relationships were categorized and abbreviated as described in Table 1.
To conduct a variation statistical analysis of the phenotype data, the R package MVN was used to analyze the phenotype data for each group, obtaining statistical metrics including mean, standard deviation (SD), range, coefficient of variation (CV), and kurtosis. Additionally, the reshape2 package was employed to organize the data, which was followed by visualizing the overall variation in the phenotype data in the form of box plots using the ggplot2 package. To further compare the phenotypic growth over time under the different light treatments, histograms of the mean values for each group of phenotype data were plotted. The t.test function in R was employed to detect the existence of any significant differences in the mean values of the phenotypes under the different light treatments at the different measurement time points. Microsoft Excel was used to integrate the mean values, standard deviations, and significant p-values into a wide data format suitable for plotting. The R packages ggplot2 and ggpubr were used for visualizing the histograms.
2.5. Functional Mapping
To localize quantitative trait QTL, a statistical framework–functional mapping [18] was proposed. The functional mapping model includes fitting biologically meaningful functions, parameter estimation, hypothesis testing, and filtering to obtain the target QTL. A logistic growth model was initially used to study the growth of the biological populations, which is practically valuable and is now widely used in economics, biology, medicine, and other field [19]. In this study, the plant height and leaf number phenotypes were be fitted by
where is the asymptotic or limit value of when, is the initial value of g when t=0, and r is the relative rate of growth.
Let be the phenotypic data measured at time point for line number . The sample size of the mapping population is n, and p marker loci are obtained after gene sequencing. For a particular SNP locus, a genotyping exists; the phenotypic data of all samples under genotypic component j at time point T obey a multivariate normal distribution:
where the fitted mean was obtained from Equation (1) , and the Σ covariance matrix was modeled using SAD1 [20]:
For all genotypes j of a given SNP, by integrating the above growth curves, covariance matrices and multivariate normal distribution functions, the likelihood function is constructed as follows:
when the display solution is not directly available, some optimization algorithms such as Simplex, BFGS [21,22] can be used to estimate the unknown parameters (a, b, r,,) in the likelihood function.
To determine whether a QTL significantly affects phenotypic variation, the judgment criterion is set as whether the means of different components under different genotypes are significantly different. This hypothesis can be tested as follows:
After computing the likelihood values under each hypothesis, the logarithm of the likelihood ratio for each locus is obtained using the following formula:
Considering the statistical uncertainty of the probability distribution of LR, in this hypothesis testing, 1000 permutation tests were used to determine the threshold value and filtered to obtain the significant QTL. The R function pchisq was employed to convert LR values into p-values, and the R package qqman was used for visualizing the quantile-quantile plots. All the above calculations were performed using R4.1.0.
2.6. Construction of Genetic Effect Networks
The Lotka-Volterra (LV) model framework was first proposed by Alfred Lotka and Vito Volterra to describe the dynamics of predator-prey interactions in biological systems. As research progressed, the LV equations have been shown to be a powerful tool for analyzing interactions within various biological systems [23]. Based on the LV model framework, following the approach of Yang et al. [24], the independent genetic effects of different SNP loci are considered as nodes and the dependent genetic effects as edges to construct a genetic effect network diagram of significant loci. All calculations were performed in R4.1.0, and the network diagram was visualized using Cytoscape3.7.1.
2.7. Functional Annotation
To gather detailed information on each identified significant QTL, we aligned the significant SNPs with the genome annotation file. This alignment allowed us to compile a comprehensive list of the significant gene IDs associated with these loci. The gene descriptions for each of these significant gene IDs are accessible through Genome Data Viewer on the National Center for Biotechnology Information (NCBI) website (https://www.ncbi.nlm.nih.gov/). To further understand the biological processes involved in the significant loci, the list of gene IDs was input to R software and compared with the org.at.tair.db gene annotation package to convert the IDs. Finally, we performed GO analysis using the R package clusterProfiler and selected the gene entries related to the target traits and with a high number of enriched genes to draw GO annotation maps.
2.8. Genetic Effects Analysis of Significant Genes
By leveraging the powerful statistical capabilities of the functional mapping model, the genetic effects of different genotypes of significant genes can be analyzed. The specific procedure involved likelihood calculations based on Equation (4) to obtain the estimated parameters for the different genotypes of each SNP. Using the Arabidopsis genotype file, where each SNP exists in AA and aa genotypes respectively, the estimated parameters for different genotypes are substituted into Equation (1) to fit the overall growth curve of the corresponding gene with different genotypes.
3. Results
3.1. Analysis of Phenotypic Variation under Different Light Conditions
The statistical data for each set of phenotypic data regarding leaf number and plant height traits are summarized in Tables S1 and S2, respectively. The statistical distributions are visualized in Figures S1–S3. At each time point, the standard deviation accounted for 7% to 18% of the mean, with this proportion diminishing as the plants continued to grow. The coefficient of variation for leaf phenotypic data consistently remained below 0.2, indicating relatively concentrated data. In contrast, the coefficient of variation for the plant height phenotypic data ranged from 0.08 to 1.05. This disparity underscored substantial variations in the growth rates of individual Arabidopsis thaliana plants over time, particularly notable among the first-generation phenotypic data. Most time points exhibited kurtosis coefficients below 0, indicative of less-concentrated central data. However, the kurtosis coefficient at the third measurement time point for plant height stood was significantly higher than that at the other measurement time points. This divergence was attributed to this particular time point, marking the juncture at which the growth rate of Arabidopsis thaliana accelerated. Notably, the coefficient of variation highlighted substantial growth rate differences among individual plants at this juncture, resulting in extreme deviations from the mean and consequently elevating the kurtosis coefficient.
To depict the overall trend in phenotype growth over time under different light environments, bar graphs displaying the mean values for all phenotype groups were constructed (Figure 2). We found almost no difference in the leaf number generated by the first-generation populations under different light environments. Similarly, the difference in leaf number among the second-generation populations under high-light treatment was not pronounced until the late growth stage, where slightly more leaves were observed in the low-light environment than in the high-light environment. The second-generation population under low-light treatment from the first generation exhibited the largest disparity in leaf number among all phenotype groups, with the leaf count in the L1L2 group being the highest. In contrast, plant height exhibited significant differences among the first-generation populations, with little development observed in the early stages but more pronounced growth observed under high-light conditions from the mid-growth stage onward. This phenotypic variation induced by different environments was more evident among the second-generation populations under the low-light treatment. Conversely, although the plant height of H1H2 group gradually surpassed that of the H1L2 group over time, the disparity compared with the other two groups was not substantial. Notably, plant development occurred earlier in the second- than in the first-generation populations.
3.2. Significant SNPs Located via Functional Mapping
The quantitative trait loci (QTLs) that play a dominant role in determining the leaf number and plant height of Arabidopsis thaliana in response to different light conditions were localized via functional mapping, and the results were plotted in Figure 3. The Manhattan plots and quantile-quantile plots were shown in Figures S4–S5. H1 localized 43 significant SNPs; L1 localized 54 significant SNPs; H1H2 localized 114 significant SNPs; H1L2 localized 56 significant SNPs; L1H2 localized 57 significant SNPs; L1L2 localized 63 significant SNPs. For plant height, H1 localized 91 significant SNPs; L1 localized 83 significant SNPs; H1H2 localized 112 significant SNPs; H1L2 localized 65 significant SNPs; L1H2 localized 68 significant SNPs; L1L2 localized 51 significant SNPs. Overall, the positional distribution of the significant loci on chromosomes varied, with chromosomes 2 and 4 containing a larger number of significant SNPs.
After comparing the localized significant SNPs with the genome annotation files, we identified the final annotated significant gene IDs associated with leaf number: 32 in the H1 group, 38 in the L1 group, 48 in the H1H2 group, 40 in the H1L2 group, 38 in the L1H2 group, and 35 in the L1L2 group. Subsequently, we conducted gene description queries for each of these significant gene IDs through the NCBI online website and organized the results into appendices (Tables S3–S14).
The significant gene IDs obtained from the above analysis for leaf number and plant height in the high- and low-light groups were input to a website (https://bioinformatics.psb.ugent.be/webtools/Venn/) to draw a Venn diagram (Figure 4) to search for significant genes associated with both leaf number and plant height under the same environment and to find the significant genes associated with both leaf number and plant height traits through NCBI online website using Genome Data Viewer to find their specific gene descriptions, which are plotted in Table 2 and Table 3.
A total of 33 and 13 significant genes were duplicated in high- and low-light conditions, respectively, for Arabidopsis thaliana leaf number and plant height. All of the duplicated genes under high light are distributed on chromosome 4, whereas most of those duplicated under low light are located on chromosome 2, which corresponds to the results shown in the Manhattan plot. Most of the duplicated genes in both environments could be categorized according to functional annotation into four groups: developmental regulation, stress response, transcriptional regulation, and anabolic correlation. For example, among the duplicated genes under high light, AT4G30840, AT4G34220, AT4G35390 and AT4G35840 are related to developmental regulation, and AT2G14210, AT4G35920, AT4G36150 and AT4G36140 are related to stress response. AT4G35890, AT4G36590 and AT4G36650 are related to transcriptional regulation, and AT4G35650, AT4G35640 and AT4G36090 are related to anabolism. The genes duplicated under low light also included AT1G16440 and AT2G27520, which are related to developmental regulation, AT1G16670, AT2G27580 and AT2G28060 related to stress response, AT2G27700 and AT2G27880 are related to transcriptional regulation, AT2G18640, AT2G27570, AT2G27650 related to anabolism. Simultaneously, when exposed to ample light resources, plants seem to prioritize individual development, entailing the regulation of various hormonal pathways. Conversely, in conditions of limited light availability, plants tend to be more responsive to external environmental stimuli.
3.3. Genetic Effect Network Analysis
The genetic effect network diagram (Figure S6) provides a new perspective on our understanding of gene function. For leaf number traits, there are 4 hub genes in H1 generation, 6 in L1 generation, 2 in H1H2 generation, 3 in H1L2 generation, 3 in L1H2 generation, and 3 in L1L2 generation. For plant height traits, there are 3 hub genes in H1 generation, 6 in L1 generation, 4 in H1H2 generation, 3 in H1L2 generation, 8 in L1H2 generation, and 4 in L1L2 generation. Most of these hub genes are associated with developmental regulation and signal transduction. For instance, in the second-generation population of leaf number traits, there are numerous hub genes encoding Transducin/WD40 repeat-like superfamily proteins. These proteins are particularly widespread in chromatin modification and transcription mechanisms, participating in various cellular and organismal processes, including cell division, cytokinesis, apoptosis, and light signal transduction [25]. In the context of plant height traits, there is a notable presence of hub genes encoding enzymes related to signal transduction. For instance, both the H1H2 and H1L2 generations exhibit hub genes encoding alpha/beta-Hydrolases superfamily proteins. The α/β-Hydrolases (ABH) superfamily represents a widely distributed and functionally adaptable protein folding structure. In plants, it serves as a foundational structure in various hormone pathways and ligand receptors, demonstrating robust functional versatility [26]. The interaction patterns among genes within each population’s network diagrams also exhibit complex and dynamic relationships.
In the population of the L1L2 group for plant height traits (Figure 5), we observed that the significant gene interactions exhibit more promotion than inhibition, with inhibitory effects predominantly exerted by hub genes on other connected genes. The hub genes AT1G15040 and AT1G13460 primarily exhibit inhibitory effects on other connected genes, and these two hub genes mutually inhibit each other. The hub gene AT2G47420 is more prone to strong promoting effects, with inhibitory effects observed only on two connected genes, both of which are influenced by the promoting effect of the hub gene AT2G46495. Additionally, the hub gene AT2G46495 directly inhibits the hub gene AT2G47420. From the effect decomposition diagram of AT1G13460 (Figure 6), it is evident that other genes have a greater influence on the AT1G13460 gene compared to its independent effect. The gene AT2G47670 mainly promotes its expression, while the genes AT1G15040 and AT1G14670 inhibit its expression.
3.4. Gene Ontology (GO) Analysis
The phenotypic combinations of the two growth traits were stratified into high- and low-light environments to conduct a comprehensive analysis. The plant populations grown under high-light conditions (comprising H1, H1H2, and L1H2) and low-light conditions (consisting of L1, H1L2, and L1L2) were categorized as the high- and low-light groups, respectively. Subsequently, the significant gene IDs for each of the localized populations associated with leaf number and plant height were consolidated into the following groups: 118 and 113 significant gene IDs for leaf number in the high- and low-light groups, respectively; 158 and 144 significant gene IDs for plant height in the high- and low-light groups, respectively. To facilitate analysis, we imported the list of gene IDs into RStudio2022.7.1.554 software and conducted ID conversion using the org.at.tair.db gene annotation package. Following this, we performed GO analysis using the R package clusterProfiler. This analysis allowed us to select gene entries pertinent to the target traits that were enriched with a substantial number of genes, which we then used to construct GO annotation maps (Figure 6). The GO analysis, through which we identified biological process (BP), cellular component (CC), and molecular function (MF), revealed the main biological functions and potential regulatory mechanisms of the genes that are significantly expressed under different light treatments, providing a foundation for further experimental design and theoretical research.
Key insights include the critical roles of genes in regulating transcription, chromosome organization, protein complexes, seed germination, and carbohydrate metabolism, indicating their importance in gene expression regulation, plant development, and energy metabolism. Additionally, the data highlight the genes involved in signal transduction and cellular responses to stimuli, underscoring their pivotal roles in cellular adaptation to environmental changes. The charts also emphasize the localization of gene products to specific cellular structures such as the cell membrane and nucleus, reflecting their integral roles in maintaining cellular architecture and function. The presence of genes involved in both positive and negative regulation across these processes points to the complexity and precision of regulatory networks within biological systems. Furthermore, the distribution of gene numbers may reflect the foci of this study or the effects of specific experimental conditions, suggesting how certain treatments may influence gene expression in particular biological processes. The results of this comprehensive analysis provide foundational insights for further experimental design and theoretical research in this field.
3.5. Genetic Effects Analysis of Significant Genes Across Different Populations
Comparing the leaf number growth curves of the AT4G30840 gene in different populations (Figure 7A,B), we found that the growth curve differences between the aa genotype in H1 (curve a) and H1H2 (curve c) were similar to the differences between L1 (curve b) and L1L2 (curve f) under two different light conditions. This suggests that the aa genotype exhibits similar transgenerational plasticity under both light conditions, while the AA genotype shows greater transgenerational plasticity under low light compared to high light. In the first-generation population, both genotypes H1 (curve a) and L1 (curve b) displayed minimal growth differences, indicating low within-generation plasticity in this population. The within-generation plasticity of the L1H2 and L1L2 genotypes was higher than that of the second-generation populations H1H2 and H1L2. The aa genotype also exhibited minimal curve differences between H1H2 (curve c) and H1L2 (curve d), whereas the growth curve of L1H2 (curve e) differed significantly from that of L1L2 (curve f). The AA genotype showed a similar pattern of differences, but the differences were less pronounced compared to the aa genotype. The differences between the AA genotype in H1L2 (curve d) and L1L2 (curve f) were similar to the differences between H1H2 (curve c) and L1H2 (curve e), while the differences between H1H2 (curve c) and L1H2 (curve e) in the aa genotype were greater than the differences between H1L2 (curve d) and L1L2 (curve f). This suggests that the aa genotype is more susceptible to maternal environmental influences.
Comparing the plant height growth curves of the AT1G13460 gene in different populations (Figure 7C,D), we found that the growth curves of H1 (curve a) and H1H2 (curve c) of the two genotypes widely differed from each other; however, the differences between L1 (curve b) and L1L2 (curve f) were small, which indicated that this gene exhibits similar transgenerational plasticity across different genotypes. Notably, the AA genotype demonstrates significantly different transgenerational plasticity under two different light conditions compared to the aa genotype. Between the first-generation populations, the differences in the growth curves of the two genotypes were different, and the differences between the aa genotype for H1 (curve a) and L1 (curve b) were much larger than those of the AA genotype. Between the second-generation populations, the growth curves of the two genotypes for L1H2 (curve e) differed more from those of L1L2 (curve f). The difference between the curves of H1H2 (curve c) and H1L2 (curve d) was smaller, which indicated that the plasticity of the aa genotypes was much larger than that of the AA genotypes between the first-generation populations, and the plasticity between the two genotypes for L1H2 and L1L2 was larger than that between H1H2 and H1L2 in the second-generation population. The differences between AA genotypes for H1L2 (curve d) and L1L2 (curve f) were considerable; the differences between H1H2 (curve c) and L1H2 (curve e) were small. The growth curves of the aa genotypes showed a similar pattern but the differences were not as large as those of the AA genotypes, which suggests that differences in the maternal environments of the genes have little effect on the offspring under high-light conditions but a strong effect on offspring in low-light environments.
4. Discussion
Leaf number and plant height are important phenotypic characteristics in Arabidopsis thaliana, and light is an important environmental factor affecting phenotype. To determine how light affects the leaf number and plant height phenotypes, we conducted an analysis of the association between phenotype and genotype as an important tool to answer this question from the genetic point of view. Compared with GWAS for static traits, this study used functional mapping to analyze the obtained dynamic phenotypic data to locate a series of genes associated with leaf number and plant height under high- and low-light conditions. By comparing the significant genes in the different light-treated groups in different generations and quantifying their genetic effects, we attempted to explain the genetic mechanisms underlying the transgenerational plasticity of Arabidopsis thaliana in response to light conditions.
Our observations showed that the first-generation population had a higher number of outliers than the second-generation population, with the majority occurring during the middle stages of growth. This indicated that the first-generation population had a higher proportion of individuals with growth patterns that significantly deviated from those of the overall population. We speculate that the presence of growth rate inflection points during the middle stages amplified the individual growth differences, resulting in a higher distribution of outliers during this period. This also affected the kurtosis and skewness coefficients of the phenotypic data. Comparisons of the mean phenotype values between the different treatments (Figure 2) revealed that Arabidopsis leaves exhibited transgenerational adaptive growth when subjected to low-light treatment in the first generation and were subsequently faced with low-light conditions again, consistent with previous findings reported by Robinson [8]. Corresponding to the increased leaf count in the L1L2 group, the plant height of the L1L2 group was significantly lower than that of the L1H2 group. Arabidopsis thaliana tends to mitigate adverse environmental conditions by differentially modulating leaf elongation in response to low light environments [27]. This suggests that the species may allocate more biomass to leaf growth rather than to plant elongation. In ample light conditions, no significant difference was found in plant height between the H1H2 and L1H2 groups, indicating the sensitivity of Arabidopsis thaliana to changes in the light environment, with transgenerational effects typically being activated only in the face of environmental stress.
We found a large number of genes encoding RING/U-box superfamily proteins that are associated with E3 ubiquitin ligases from the description of significant genes for each phenotypic combination. The ubiquitin-mediated degradation of the proteasome is one of the major mechanisms of the post-translational regulation of gene expression and protein quality control in eukaryotes and is involved in a wide range of cellular activities including biotic and abiotic stress responses, signal transduction, transcriptional regulation, DNA repair, and organelle biogenesis [28,29]. Protein ubiquitination is mainly mediated via a three-step enzymatic process, namely, ubiquitin-activating enzyme E1, ubiquitin-conjugating enzyme E2, and ubiquitin ligase E3. E3 ubiquitin ligases, as the largest family of the three enzymes, can be classified into different categories based on their structure, function and substrate specificity: RING, HECT (homologous to the E6AP carboxyl terminus), CRL (Cullin-RING ligases), and U-box [30]. RING/U-box E3 ubiquitin ligases are involved in various plant developmental processes and stress signal transduction; for example, U-box proteins interfere with abscisic acid response in Arabidopsis thaliana [31], and the RING-type E3 ubiquitin ligase COP1 (constitutively photomorphogenic 1) protein plays a central switching role in the light regulation of Arabidopsis thaliana seedling development [32]. The genes encoding F-box proteins were found in the traits H1 and L1 for both plant height and number of leaves. The F-box motif of F-box proteins is located at the N-terminus, whereas the C-terminal region usually has one or more structural domains for protein interactions, resulting in high variability [33,34]. Based on the C-terminal structural domains, the F-box family of genes can be categorized into several subfamilies, such as leucine-rich repeat (LRR), beta-transducin (WD40) repeat, tetraploid repeat (G-TPR), or Kelch repeat [35,36]. The F-box protein sequence variability leads to functional diversity, and F-box proteins are mainly involved in biological processes such as growth and development, cellular protein degradation, reproduction, embryogenesis, seed emergence, biotic and abiotic stress responses, endogenous hormone signaling, and senescence as components of the formation of the Skp-cullin-f-box (SCF) complex [37,38,39,40,41,42]. Notably, we also identified the methyltransferase MT-A70 family protein encoded by AT1G19340, a mammalian METTL4 direct homolog [43]. The enzymatic covalent modification of RNA is an important epigenetic mechanism that finely and plasticly regulates a wide range of cellular activities in eukaryotes [44]. Among them, N6-methyladenosine (m6A) methylation is one of the common RNA modifications, and MT-A70 family proteins can mediate the catalytic mechanism of m6A methylation [45], which is involved in the plasticity in the response to different environments.
The analysis of the effect network diagram under low-light conditions indicates that the phenotypic response to low light involves the regulatory effects of multiple genes. The hub gene AT1G15040 encodes a class I glutamine amidotransferase (GAT1), and studies have shown that GAT1 has a significant inhibitory function on branching and is involved in branch regulation under nitrogen stress. Mutants of GAT exhibit a quicker manifestation of increased leaf and flower phenotypes [46]. In this study, the L1L2 population also exhibited an increased number of leaves and a dwarf plant phenotype, suggesting a correlation with the gene experiencing more inhibitory effects in the network diagram. The increase in branching to some extent leads to an increase in the number of leaves. The hub gene AT1G13460 is associated with the response to low-light stimulus (GO:0009645). This gene encodes a regulatory B subunit of protein phosphatase 2A (PP2A). PP2A is a crucial and abundant serine/threonine phosphatase in eukaryotic cells, with the B subunit primarily controlling substrate recognition [47]. PP2A can counteract various kinases involved in cell growth, proliferation, apoptosis, cytoskeletal dynamics, and stress responses. It plays a significant role in regulating plant development and responding to various stresses [48]. In addition to mutually inhibiting each other, these two hub genes interact with the linking gene AT2G47670. AT2G47670 has been shown to be highly co-expressed with ATL54 and is involved in programmed cell death during secondary wall biosynthesis and lignification [49]. Additionally, the hub gene AT2G46495 encodes a RING/U-box superfamily protein, which is believed to have potential phosphorylation hotspot regions [50]. Protein phosphorylation, as a critical post-translational modification, influences numerous aspects of dynamic cellular behavior. According to network analysis, AT2G46495 directly inhibits the hub gene AT2G47420. AT2G47420 encodes ADENOSINE DIMETHYLTRANSFERASE 1A (DIM1A), an RNA-binding (RRM/RBD/RNP motifs) family protein (RBP) involved in ribosome biosynthesis, which has been found to be associated with epidermal cell formation [51]. Thus, it is evident that complex interactions between genes ultimately influence phenotype formation.
GO analysis of the low-light group for leaf number indicates that the gene AT4G09040 (GO:0009641), associated with shade avoidance, also encodes an RBP protein. This protein regulates the transcription of corresponding genes in the organism by controlling mRNA localization, thereby modulating expression levels. AT4G09040 thus conducts the corresponding protein modifications and subcellular localization to improve plant resistance to environmental and other stresses [52]. The GO analysis of the high-light environment similarly indicates a large number of genes involved in hormone regulation and signal transduction processes. For instance, it was found that in the high-light leaf group, the gene AT4G36740, which is associated with the regulatory entry of the gibberellic-acid-mediated signaling pathway (GO:0009937), encodes a gibberellic acid (GA) homeostatic regulator homeobox protein 40 (HB40) [53]. HB40 directly activates the NAC (NAM, ATAF1/2, CUC2) transcription factor JUB1(JUNGBRUNNEN1) [54], which inhibits GA synthesis, and genes encoding C19-GA inactivating enzymes (GA 2-oxidases GA2ox2 and GA2ox6). HB40-overexpressing plants grew to exhibit the typical associated GA-deficient traits. In the high-light height group, found that AT4G36090 in the gene related to the cell surface receptor signaling pathway (GO:0007166) encodes a 2-oxoglutarate and Fe (II)-dependent dioxygenase family protein (2OG-Fe (II) oxygenase family protein, 2ODDs). 2ODDs are involved in a variety of important metabolic pathways, including melatonin metabolism [55,56], the anabolic metabolism of important phytohormones [57], and the biosynthesis of secondary metabolites [58]. 2ODDs can directly affect plant growth, development, and the stress response [59].
The genotype growth curve indicates that a substantial portion of the large plasticity difference between the two genotypes of AT4G30840 is due to the growth disparity in the L1H2 generation. According to functional localization results, the genotype difference is associated with the significance of the gene; therefore, we speculate that AT4G30840 is significantly expressed under L1H2 conditions. AT4G30840 encodes a Transducin/WD40 repeat-like superfamily protein, and WD40 proteins act as multifunctional scaffold proteins, regulating protein-protein interactions in various cellular processes such as plant stress and hormone responses [60].
In contrast, the growth gap between the two genotypes in L1 and L1L2 consistently increased over time. AT1G13460 encodes the B subunit of the protein phosphatase PP2A, which, in concert with kinases, is often associated with signaling. The more pronounced genotypic disparity of AT1G13460 in low-light environments compared with high-light environments corresponds to the finding that this gene is associated with GO entries regarding the response to low-light-intensity stimuli. Additionally, the signaling pathway involved in PP2A may be equally active in the mid-growth phase of H1 populations.
We found that some genes are involved in the response of leaf number and plant height to the same environment from the combined study of the two traits, which corresponds to the strong correlation between the traits. Moreover, we found that these genes are similar in the types of proteins they encode, mostly protein kinases, binding proteins and transcription factors. For example, AT4G35390 encodes the DNA-binding protein of the negative GA feedback cis-acting sequence (AT-hook protein of GA feedback 1, ACF1), which binds to the negative GA feedback cis-acting sequence of AtGA3ox1 (gibberellin 3-oxidase 1 in Arabidopsis). GA 3-oxidase (GA3ox) is the last part catalyzed into physiologically active GA, and only AtGA3ox1 in the Arabidopsis thaliana AtGA3ox family is regulated by negative GA feedback [61]. AtGA3ox1 is mainly associated with plant nutrient growth [62] and is expressed in seedlings, leaves, stems, floral tips, and flowers [63]. This suggests that ACF1 is involved in the regulation of GA homeostasis and thus affects the number of leaves and plant height. In addition, more duplicated genes encode protein kinases. PK, as one of the largest and most diverse plant protein superfamilies involved in biological processes including mitosis and cytoplasmic division [64,65], cell growth and elongation [66], organogenesis [67], photosynthesis [68], and hormonal responses [69], plays a key role in the plant phenotypic response to environmental changes.
We identified the genes involved in the response of the leaf number and plant height phenotypes to heterogeneous light environments across different generations, and we observed the transgenerational adaptive growth of the leaf number phenotype under low-light stress. Further research could involve expanding the sample size and incorporating additional generations to more accurately examine the genetic bases of plasticity and evaluate the consistency of this transgenerational adaptation. Additionally, because plants are influenced by various environmental factors during growth in reality, other factors such as humidity, population density, and nutrient levels could be introduced to investigate the changes in plasticity of plants under multiple stressors.
5. Conclusions
We used Arabidopsis thaliana as the study material, then gathered phenotypic data regarding leaf number and plant height under high- and low-light conditions from two generations. Using the obtained genotype data, a functional mapping model was used to locate a series of significant SNPs. We observed similarities and differences in the significant genes among the different generations, and a gene encoding methyltransferase linked to epigenetics was discovered. Subsequently, we constructed a genetic effect network and performed GO analysis to explore the gene functions annotated to the candidate genes. The results revealed complex interactions among these genes, primarily associated with signaling transduction, hormone pathways, light response, and organ development regulation. Further analysis of the significant genes AT4G30840 and AT1G13460’s genetic effects unveiled their distinct involvement in the regulation of light response processes. We also observed variations in their impact on phenotypic plasticity under different light treatments, providing evidence for transgenerational inheritance and the intricate relationship between light-induced plasticity and phenotype. Our study offers insights into this process at the genetic level and provides clues for further exploration of the genetic mechanisms underlying transgenerational plasticity in Arabidopsis thaliana’s response to light conditions.
Supplementary Materials
The following supporting information can be downloaded at the website of this paper posted on Preprints.org. Figure S1. Box plot of Arabidopsis thaliana leaf number and plant height for the H1 and L1 populations. Figure S2. Box plot of Arabidopsis thaliana leaf number and plant height for the H1H2 and H1L2 populations. Figure S3. Box plot of Arabidopsis thaliana leaf number and plant height for the L1H2 and L1L2 populations. Figure S4. Manhattan plots of significant loci in different populations of Arabidopsis thaliana according to functional mapping analysis. Figure S5. Quantile-quantile plots of p-values for different populations of Arabidopsis thaliana. Figure S6. Genetic network diagrams of different Arabidopsis thaliana populations. Table S1. Analysis of variation in phenotypic trait of leaf number. Table S2. Analysis of variance for phenotypic trait of plant height. Table S3. Significant loci of leaf number trait of Arabidopsis thaliana in H1 generation. Table S4. Significant loci of leaf number trait of Arabidopsis thaliana in L1 generation. Table S5. Significant loci of leaf number trait of Arabidopsis thaliana in H1H2 generation. Table S6. Significant loci of leaf number trait of Arabidopsis thaliana in H1L2 generation. Table S7. Significant loci of leaf number trait of Arabidopsis thaliana in L1H2 generation. Table S8. Significant loci of leaf number trait of Arabidopsis thaliana in L1L2 generation. Table S9. Significant loci of plant height trait of Arabidopsis thaliana in H1 generation. Table S10. Significant loci of plant height trait of Arabidopsis thaliana in L1 generation. Table S11. Significant loci of plant height trait of Arabidopsis thaliana in H1H2 generation. Table S12. Significant loci of plant height trait of Arabidopsis thaliana in H1L2 generation. Table S13. Significant loci of plant height trait of Arabidopsis thaliana in L1H2 generation. Table S14. Significant loci of plant height trait of Arabidopsis thaliana in L1L2 generation.
Author Contributions
RW and XZ conceived the idea and designed the model and experiments. JM, JC analyzed the data. JM, YS, and YF wrote the manuscript. YS and YF performed the experiments. XZ provided advice and guidance on the manuscript. All authors contributed to the review and approval of the current version of the manuscript.
Funding
This study was funded by the Science and Technology Innovation 2030 Major Program (No. 2023ZD0405804).
Institutional Review Board Statement
Not applicable.
Informed Consent Statement
Not applicable.
Data Availability Statement
Data and analysis codes are available for download from https://github.com/fssq811/Arabidopsis/tree/master/code.
Acknowledgments
The analysis part of this study was supported by the high-performance computing platform of Beijing Forestry University.
Conflicts of Interest
The authors declare no conflicts of interest.
References
- Ibanez, C.P.Y.P. Ambient temperature and genotype differentially affect developmental and phenotypic plasticity in Arabidopsis thaliana. BMC Plant Biol. 2017, 17, 114. [Google Scholar] [CrossRef] [PubMed]
- Galloway, L.F.; Etterson, J.R. Transgenerational plasticity is adaptive in the wild. Science 2007, 318, 1134–1136. [Google Scholar] [CrossRef] [PubMed]
- Miska, E.A.; Ferguson-Smith, A.C. Transgenerational inheritance: models and mechanisms of non-DNA sequence-based inheritance. Science 2016, 354, 59–63. [Google Scholar] [CrossRef] [PubMed]
- Ho, D.H. Transgenerational epigenetics: the role of maternal effects in cardiovascular development. Integr. Comp. Biol. 2014, 54, 43–51. [Google Scholar] [CrossRef] [PubMed]
- Whittle, C.A.; Otto, S.P.; Johnston, M.O.; Krochko, J.E. Adaptive epigenetic memory of ancestral temperature regime in Arabidopsis thaliana. Botany 2009, 87, 650–657. [Google Scholar] [CrossRef]
- Deng, Y.; Bossdorf, O.; Scheepens, J.F. Transgenerational effects of temperature fluctuations in Arabidopsis thaliana. Aob Plants 2021, 13, plab064. [Google Scholar] [CrossRef] [PubMed]
- Yan, Z.; Tian, D.; Han, W.; Ji, C.; Hou, X.; Guo, Y.; Fang, J. Weak transgenerational effects of ancestral nitrogen and phosphorus availabilities on offspring phenotypes in Arabidopsis thaliana. J. Plant Res. 2023, 136, 515–525. [Google Scholar] [CrossRef] [PubMed]
- Robinson, G.I.; Robinson, J.W. Digest: Transgenerational stress memory mechanisms in Arabidopsis thaliana. Evolution 2020, 74, 2423–2424. [Google Scholar] [CrossRef] [PubMed]
- Latzel, V.; Klimešová, J. Transgenerational plasticity in clonal plants. Evol. Ecol. 2010, 24, 1537–1543. [Google Scholar] [CrossRef]
- Weinhold, A. Transgenerational stress-adaption: an opportunity for ecological epigenetics. Plant Cell Reports 2018, 37, 3–9. [Google Scholar] [CrossRef]
- Holdsworth, M.J.; Bentsink, L.; Soppe, W. Molecular networks regulating Arabidopsis seed maturation, after-ripening, dormancy and germination. New Phytol. 2008, 179, 33–54. [Google Scholar] [CrossRef] [PubMed]
- Robertson, F.C.; Skeffington, A.W.; Gardner, M.J.; Webb, A.A. Interactions between circadian and hormonal signalling in plants. Plant Mol.Biol. 2009, 69, 419–427. [Google Scholar] [CrossRef] [PubMed]
- Xiao, X.; He, L.; Zhang, X.; Jin, Y.; Chen, J. Differential effects of transgenerational plasticity on morphological and photosynthetic properties between an invasive plant and its congeneric native one. Biol. Invasions 2023, 25, 115–123. [Google Scholar] [CrossRef]
- Yan, Y.; Stoddard, F.L.; Neugart, S.; Oravec, M.; Urban, O.; Sadras, V.O.; Aphalo, P.J. The transgenerational effects of solar short-UV radiation differed in two accessions of Vicia faba L. from contrasting UV environments. J. Plant Physiol. 2020, 248, 153145. [Google Scholar] [CrossRef] [PubMed]
- Zhang, T.; Zhang, R.; Zeng, X.Y.; Lee, S.; Ye, L.H.; Tian, S.L.; Zhang, Y.J.; Busch, W.; Zhou, W.B.; Zhu, X.G.; et al. GLK transcription factors accompany ELONGATED HYPOCOTYL5 to orchestrate light-induced seedling development in Arabidopsis. Plant Physiol. 2024. [Google Scholar] [CrossRef]
- Hou, L.Y.; Sommer, F.; Poeker, L.; Dziubek, D.; Schroda, M.; Geigenberger, P. The impact of light and thioredoxins on the plant thiol-disulfide proteome. Plant Physiol. 2024. [Google Scholar] [CrossRef] [PubMed]
- Yao, X.; Fang, K.; Qiao, K.; Xiong, J.; Lan, J.; Chen, J.; Tian, Y.; Kang, X.; Lei, W.; Zhang, D.; et al. Cooperative transcriptional regulation by ATAF1 and HY5 promotes light-induced cotyledon opening in Arabidopsis thaliana. Sci. Signal. 2024, 17, eadf7318. [Google Scholar] [CrossRef] [PubMed]
- Wu, R.L.; Ma, C.X.; Hou, W.; Corva, P.; Medrano, J.F. Functional mapping of quantitative trait loci that interact with the hg mutation to regulate growth trajectories in mice. Genetics 2005, 171, 239–249. [Google Scholar] [CrossRef] [PubMed]
- West, G.B.; Brown, J.H.; Enquist, B.J. A general model for ontogenetic growth. Nature 2001, 413, 628–631. [Google Scholar] [CrossRef] [PubMed]
- Zhao, W.; Hou, W.; Littell, R.C.; Wu, R. Structured antedependence models for functional mapping of multiple longitudinal traits. Stat. Appl. Genet. Mol. Biol. 2005, 4. [Google Scholar] [CrossRef]
- Gao, F.; Han, L. Implementing the Nelder-Mead simplex algorithm with adaptive parameters. Comput. Optim. Appl. 2012, 51, 259–277. [Google Scholar] [CrossRef]
- Yuan, G.; Sheng, Z.; Wang, B.; Hu, W.; Li, C. The global convergence of a modified BFGS method for nonconvex functions. J. Comput. Appl. Math. 2018, 327, 274–294. [Google Scholar] [CrossRef]
- Dam, P.; Rodriguez-R, L.M.; Luo, C.; Hatt, J.; Tsementzi, D.; Konstantinidis, K.T.; Voit, E.O. Model-based comparisons of the abundance dynamics of bacterial communities in two lakes. Sci. Rep. 2020, 10, 2423. [Google Scholar] [CrossRef] [PubMed]
- Yang, D.; Jin, Y.; He, X.; Dong, A.; Wang, J.; Wu, R. Inferring multilayer interactome networks shaping phenotypic plasticity and evolution. Nat. Commun. 2021, 12, 5304–5317. [Google Scholar] [CrossRef] [PubMed]
- van Nocker, S.; Ludwig, P. The WD-repeat protein superfamily in Arabidopsis: conservation and divergence in structure and function. BMC Genomics 2003, 4, 50. [Google Scholar] [CrossRef] [PubMed]
- Mindrebo, J.T.; Nartey, C.M.; Seto, Y.; Burkart, M.D.; Noel, J.P. Unveiling the functional diversity of the alpha/beta hydrolase superfamily in the plant kingdom. Curr. Opin. Struct. Biol. 2016, 41, 233–246. [Google Scholar] [CrossRef] [PubMed]
- van Zanten, M.; Snoek, L.B.; van Eck-Stouten, E.; Proveniers, M.C.G.; Torii, K.U.; Voesenek, L.A.C.J.; Millenaar, F.F.; Peeters, A.J.M. ERECTA controls low light intensity-induced differential petiole growth independent of phytochrome B and cryptochrome 2 action in Arabidopsis thaliana. Plant Signal. Behav. 2010, 5, 284–286. [Google Scholar] [CrossRef] [PubMed]
- Hershko, A. The ubiquitin system for protein degradation and some of its roles in the control of the cell division cycle. Cell Death Differ. 2005, 12, 1191–1197. [Google Scholar] [CrossRef] [PubMed]
- Stone, S.L.; Callis, J. Ubiquitin ligases mediate growth and development by promoting protein death. Curr. Opin. Plant Biol. 2007, 10, 624–632. [Google Scholar] [CrossRef] [PubMed]
- Vierstra, R.D. The ubiquitin - 26S proteasome system at the nexus of plant biology. Nat. Rev. Mol. Cell Biol. 2009, 10, 385–397. [Google Scholar] [CrossRef] [PubMed]
- Sharma, B.; Taganna, J. Genome-wide analysis of the U-box E3 ubiquitin ligase enzyme gene family in tomato. Sci. Rep. 2020, 10. [Google Scholar] [CrossRef] [PubMed]
- Mazzucotelli, E.; Belloni, S.; Marone, D.; De Leonardis, A.M.; Guerra, D.; Di Fonzo, N.; Cattivelli, L.; Mastrangelo, A.M. The E3 ubiquitin ligase gene family in plants: regulation by degradation. Curr. Genomics 2006, 7, 509–522. [Google Scholar] [CrossRef] [PubMed]
- Boycheva, I.; Vassileva, V.; Revalska, M.; Zehirov, G.; Iantcheva, A. Cyclin-like F-box protein plays a role in growth and development of the three model species Medicago truncatula, Lotus japonicus, and Arabidopsis thaliana. Research and reports in biology 2015, 6, 117–130. [Google Scholar] [CrossRef]
- Kuroda, H.; Takahashi, N.; Shimada, H.; Seki, M.; Shinozaki, K.; Matsui, M. Classification and expression analysis of Arabidopsis F-box-containing protein genes. Plant Cell Physiol. 2002, 43, 1073–1085. [Google Scholar] [CrossRef] [PubMed]
- Jin, J.; Cardozo, T.; Lovering, R.C.; Elledge, S.J.; Pagano, M.; Harper, J.W. Systematic analysis and nomenclature of mammalian F-box proteins. Genes Dev. 2004, 18, 2573–2580. [Google Scholar] [CrossRef] [PubMed]
- Gagne, J.M.; Downes, B.P.; Shiu, S.H.; Durski, A.M.; Vierstra, R.D. The F-box subunit of the SCF E3 complex is encoded by a diverse superfamily of genes in Arabidopsis. Proc. Natl. Acad. Sci. U. S. A. 2002, 99, 11519–11524. [Google Scholar] [CrossRef] [PubMed]
- Baute, J.; Polyn, S.; De Block, J.; Blomme, J.; Van Lijsebettens, M.; Inze, D. F-Box protein FBX92 affects leaf size in Arabidopsis thaliana. Plant Cell Physiol. 2017, 58, 962–975. [Google Scholar] [CrossRef] [PubMed]
- Gusti, A.; Baumberger, N.; Nowack, M.; Pusch, S.; Eisler, H.; Potuschak, T.; De Veylder, L.; Schnittger, A.; Genschik, P. Schnittger, A.; Genschik, P. The Arabidopsis thaliana F-Box protein FBL17 is essential for progression through the second mitosis during pollen development. PLoS One 2009, 4. [Google Scholar] [CrossRef] [PubMed]
- Majee, M.; Kumar, S.; Kathare, P.K.; Wu, S.; Gingerich, D.; Nayak, N.R.; Salaita, L.; Dinkins, R.; Martin, K.; Goodin, M.; et al. KELCH F-BOX protein positively influences Arabidopsis seed germination by targeting PHYTOCHROME-INTERACTING FACTOR1. Proc. Natl. Acad. Sci. U. S. A. 2018, 115, E4120–E4129. [Google Scholar] [CrossRef] [PubMed]
- Bu, Q.Y.; Lv, T.X.; Shen, H.; Luong, P.; Wang, J.; Wang, Z.Y.; Huang, Z.G.; Xiao, L.T.; Engineer, C.; Kim, T.H.; et al. Regulation of drought tolerance by the F-box protein MAX2 in Arabidopsis. Plant Physiol. 2014, 164, 424–439. [Google Scholar] [CrossRef] [PubMed]
- Koops, P.; Pelser, S.; Ignatz, M.; Klose, C.; Marrocco-Selden, K.; Kretsch, T. EDL3 is an F-box protein involved in the regulation of abscisic acid signalling in Arabidopsis thaliana. J. Exp. Bot. 2011, 62, 5547–5560. [Google Scholar] [CrossRef]
- Li, Y.; Zhang, L.; Li, D.; Liu, Z.; Wang, J.; Li, X.; Yang, Y. The Arabidopsis F-box E3 ligase RIFP1 plays a negative role in abscisic acid signalling by facilitating ABA receptor RCAR3 degradation. Plant Cell Environ. 2016, 39, 571–582. [Google Scholar] [CrossRef] [PubMed]
- Luo, Q.; Mo, J.; Chen, H.; Hu, Z.; Wang, B.; Wu, J.; Liang, Z.; Xie, W.; Du, K.; Peng, M.; et al. Structural insights into molecular mechanism for N 6-adenosine methylation by MT-A70 family methyltransferase METTL4. Nat. Commun. 2022, 13. [Google Scholar] [CrossRef]
- Frye, M.; Harada, B.T.; Behm, M.; He, C. RNA modifications modulate gene expression during development. Science 2018, 361, 1346–1349. [Google Scholar] [CrossRef] [PubMed]
- Wu, B.; Li, L.; Huang, Y.; Ma, J.; Min, J. Readers, writers and erasers of N(6)-methylated adenosine modification. Curr. Opin. Struct. Biol. 2017, 47, 67–76. [Google Scholar] [CrossRef] [PubMed]
- Zhu, H.; Kranz, R.G. A nitrogen-regulated glutamine amidotransferase (GAT1_2.1) represses shoot branching in Arabidopsis. Plant Physiol. 2012, 160, 1770–1780. [Google Scholar] [CrossRef] [PubMed]
- Wu, C.; Chen, H.; Guo, F.; Yadav, V.K.; Mcilwain, S.J.; Rowse, M.; Choudhary, A.; Lin, Z.; Li, Y.; Gu, T.; et al. PP2A-B’ holoenzyme substrate recognition, regulation and role in cytokinesis. Cell Discov. 2017, 3. [Google Scholar] [CrossRef]
- Lechward, K.; Awotunde, O.S.; Swiatek, W.; Muszynska, G. Protein phosphatase 2A: variety of forms and diversity of functions. Acta Biochim. Pol. 2001, 48, 921–933. [Google Scholar] [PubMed]
- Noda, S.; Takahashi, Y.; Tsurumaki, Y.; Yamamura, M.; Nishikubo, N.; Yamaguchi, M.; Sakurai, N.; Hattori, T.; Suzuki, H.; Demura, T.; et al. ATL54, a RING-H2 domain protein selected by a gene co-expression network analysis, is associated with secondary cell wall formation in Arabidopsis. Plant Biotechnol. 2013, 30, 169–174. [Google Scholar] [CrossRef]
- Riaño-Pachón, D.M.; Kleessen, S.; Neigenfind, J.; Durek, P.; Weber, E.; Engelsberger, W.R.; Walther, D.; Selbig, J.; X, S.W.; Birgit, K. Proteome-wide survey of phosphorylation patterns affected by nuclear DNA polymorphisms in Arabidopsis thaliana. BMC Genomics 2010, 11, 1–19. [Google Scholar] [CrossRef] [PubMed]
- Wieckowski, Y.; Schiefelbein, J. Nuclear ribosome biogenesis mediated by the DIM1A rRNA dimethylase is required for organized root growth and epidermal patterning in Arabidopsis. Plant Cell 2012, 24, 2839–2856. [Google Scholar] [CrossRef] [PubMed]
- Lee, K.; Kang, H. Emerging roles of RNA-binding proteins in plant growth, development, and stress responses. Mol. Cells 2016, 39, 179–185. [Google Scholar] [CrossRef] [PubMed]
- Shuchao Dong, D.T.M.S. An HB40 - JUNGBRUNNEN1 - GA 2-OXIDASE regulatory module for gibberellin 2 homeostasis in Arabidopsis. BioRxiv 2021. [Google Scholar] [CrossRef]
- Shahnejat-Bushehri, S.; Tarkowska, D.; Sakuraba, Y.; Balazadeh, S. Arabidopsis NAC transcription factor JUB1 regulates GA / BR metabolism and signalling. Nat. Plants 2016, 2. [Google Scholar] [CrossRef] [PubMed]
- Lee, K.; Zawadzka, A.; Czarnocki, Z.; Reiter, R.J.; Back, K. Molecular cloning of melatonin 3-hydroxylase and its production of cyclic 3-hydroxymelatonin in rice (Oryza sativa). J. Pineal Res. 2016, 61, 470–478. [Google Scholar] [CrossRef]
- Yu, Y.; Lv, Y.; Shi, Y.; Li, T.; Chen, Y.; Zhao, D.; Zhao, Z. The role of phyto-melatonin and related metabolites in response to stress. Molecules 2018, 23. [Google Scholar] [CrossRef] [PubMed]
- Hagel, J.M.; Facchini, P.J. Expanding the roles for 2-oxoglutarate-dependent oxygenases in plant metabolism. Nat. Prod. Rep. 2018, 35, 721–734. [Google Scholar] [CrossRef] [PubMed]
- Kakizaki, T.; Kitashiba, H.; Zou, Z.; Li, F.; Fukino, N.; Ohara, T.; Nishio, T.; Ishida, M. A 2-oxoglutarate-dependent dioxygenase mediates the biosynthesis of glucoraphasatin in Radish. Plant Physiol. 2017, 173, 1583–1593. [Google Scholar] [CrossRef] [PubMed]
- Wei, S.; Zhang, W.; Fu, R.; Zhang, Y. Genome-wide characterization of 2-oxoglutarate and Fe (II)- dependent dioxygenase family genes in tomato during growth cycle and their roles in metabolism. BMC Genomics 2021, 22. [Google Scholar] [CrossRef] [PubMed]
- Xu, X.; Wan, W.; Jiang, G.; Xi, Y.; Huang, H.; Cai, J.; Chang, Y.; Duan, C.; Mangrauthia, S.K.; Peng, X.; et al. Nucleocytoplasmic trafficking of the Arabidopsis WD40 repeat protein XIW1 regulates ABI5 stability and abscisic acid responses. Mol. Plant. 2019, 12, 1598–1611. [Google Scholar] [CrossRef] [PubMed]
- Hedden, P.; Phillips, A.L. Gibberellin metabolism: new insights revealed by the genes. Trends Plant Sci. 2000, 5, 523–530. [Google Scholar] [CrossRef] [PubMed]
- Mitchum, M.G.; Yamaguchi, S.; Hanada, A.; Kuwahara, A.; Yoshioka, Y.; Kato, T.; Tabata, S.; Kamiya, Y.; Sun, T.P. Distinct and overlapping roles of two gibberellin 3-oxidases in Arabidopsis development. Plant J. 2006, 45, 804–818. [Google Scholar] [CrossRef] [PubMed]
- Matsushita, A.; Furumoto, T.; Ishida, S.; Takahashi, Y. AGF1, an AT-hook protein, is necessary for the negative feedback of AtGA3ox1 encoding GA 3-oxidase. Plant Physiol. 2007, 143, 1152–1162. [Google Scholar] [CrossRef] [PubMed]
- Krupnova, T.; Sasabe, M.; Ghebreghiorghis, L.; Gruber, C.W.; Hamada, T.; Dehmel, V.; Strompen, G.; Stierhof, Y.; Lukowitz, W.; Kemmerling, B.; et al. Microtubule-associated kinase-like protein RUNKEL needed for cell plate expansion in Arabidopsis cytokinesis. Curr. Biol. 2009, 19, 536. [Google Scholar] [CrossRef]
- Nowack, M.K.; Harashima, H.; Dissmeyer, N.; Zhao, X.; Bouyer, D.; Weimer, A.K.; De Winter, F.; Yang, F.; Schnittger, A. Genetic framework of cyclin-dependent kinase function in Arabidopsis. Dev. Cell 2012, 22, 1030–1040. [Google Scholar] [CrossRef] [PubMed]
- Guo, H.; Li, L.; Ye, H.; Yu, X.; Algreen, A.; Yin, Y. Three related receptor-like kinases are required for optimal cell elongation in Arabidopsis thaliana. Proc. Natl. Acad. Sci. U. S. A. 2009, 106, 7648–7653. [Google Scholar] [CrossRef] [PubMed]
- Wang, W.M.; Chen, X.M. HUA ENHANCER3 reveals a role for a cyclin-dependent protein kinase in the specification of floral organ identity in Arabidopsis. Development 2004, 131, 3147–3156. [Google Scholar] [CrossRef] [PubMed]
- Trotta, A.; Suorsa, M.; Rantala, M.; Lundin, B.; Aro, E. Serine and threonine residues of plant STN7 kinase are differentially phosphorylated upon changing light conditions and specifically influence the activity and stability of the kinase. Plant J. 2016, 87, 484–494. [Google Scholar] [CrossRef] [PubMed]
- Clouse, S.D. Brassinosteroid signal transduction: from receptor kinase activation to transcriptional networks regulating plant development. Plant Cell 2011, 23, 1219–1230. [Google Scholar] [CrossRef] [PubMed]
Figure 1.
Simplified experimental workflow diagram. Light red and blue represent the high- and low-light treatments, respectively. The second and third rows represent the first-and second-generation populations, respectively. The abbreviations in parentheses denote the population names, with the specific abbreviation rule as follows: H and L represent high- and low-light conditions, respectively; 1 and 2 denote first- and second- generation populations, respectively. For instance, ‘H1’ denotes a first-generation population subjected to high-light treatment, ‘H1H2’ designates a second-generation population derived from a first-generation population exposed to high-light treatment, with the second-generation population similarly grown under high-light conditions. Similarly, ‘H1L2’ signifies a second-generation population originating from a first-generation population exposed to high-light treatment, but with the second-generation population cultivated under low-light conditions.
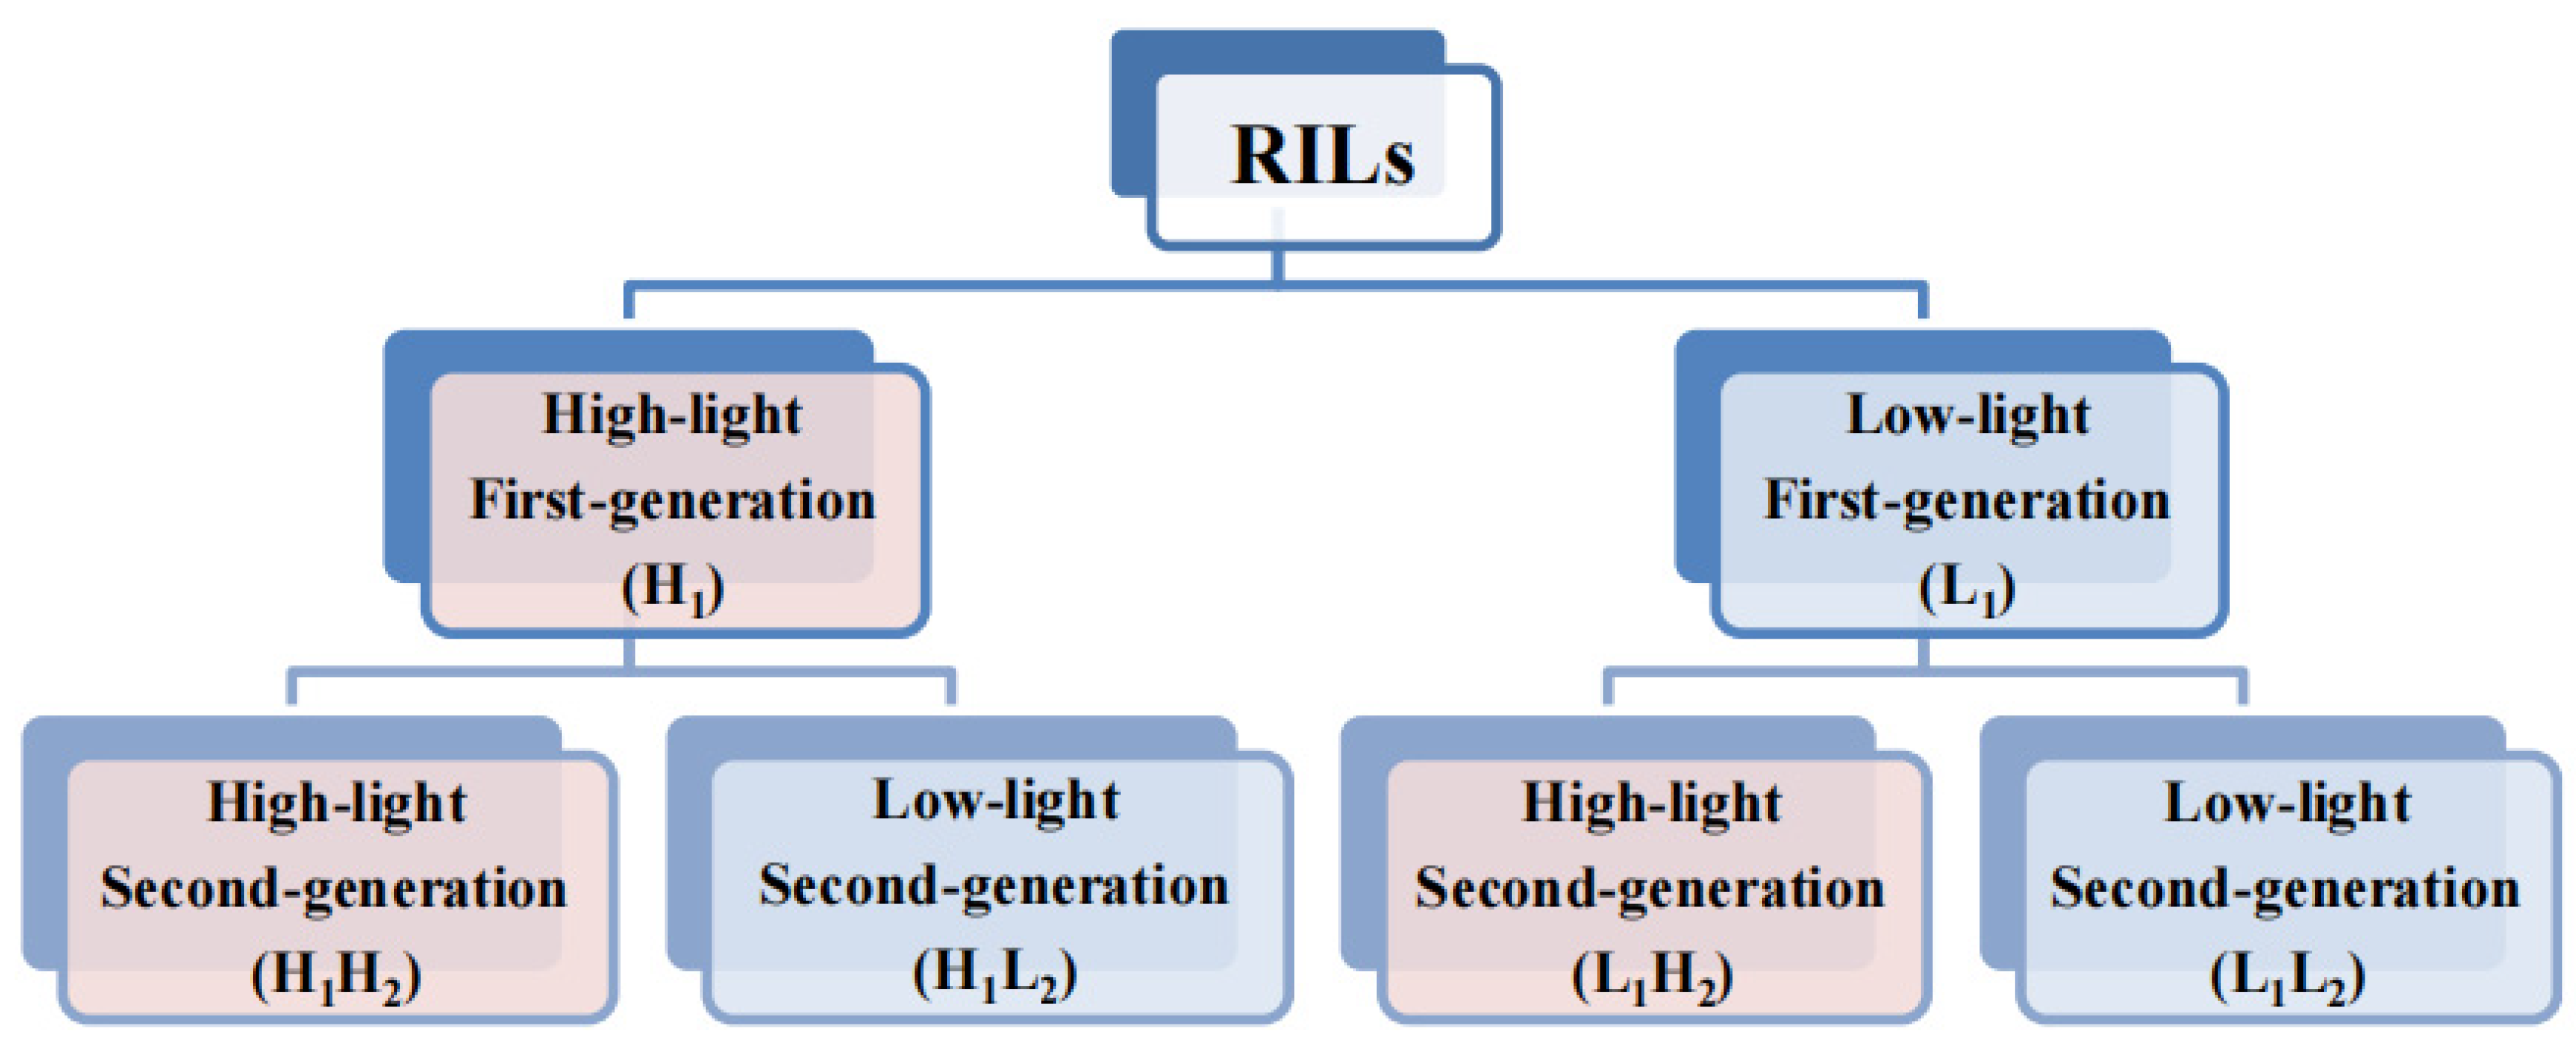
Figure 2.
Histograms depicting the mean phenotype values over time. The left panel shows the mean leaf number over time, whereas the right panel displays the mean plant height over time. The x axis represents the measurement time points, and the y axis represents the phenotype values. Red and green bars represent the high- and low-light treatments, respectively. The central line within each bar is the error bar, and above each bar indicates the significance level of the mean differences between the two treatments at each time point. ns, p > 0.05; **, p ≤ 0.01; ***, p ≤ 0.001. In the top left corner of the figure, the significance level and abbreviations for the groups are provided, with abbreviations detailed in Section 2.1.
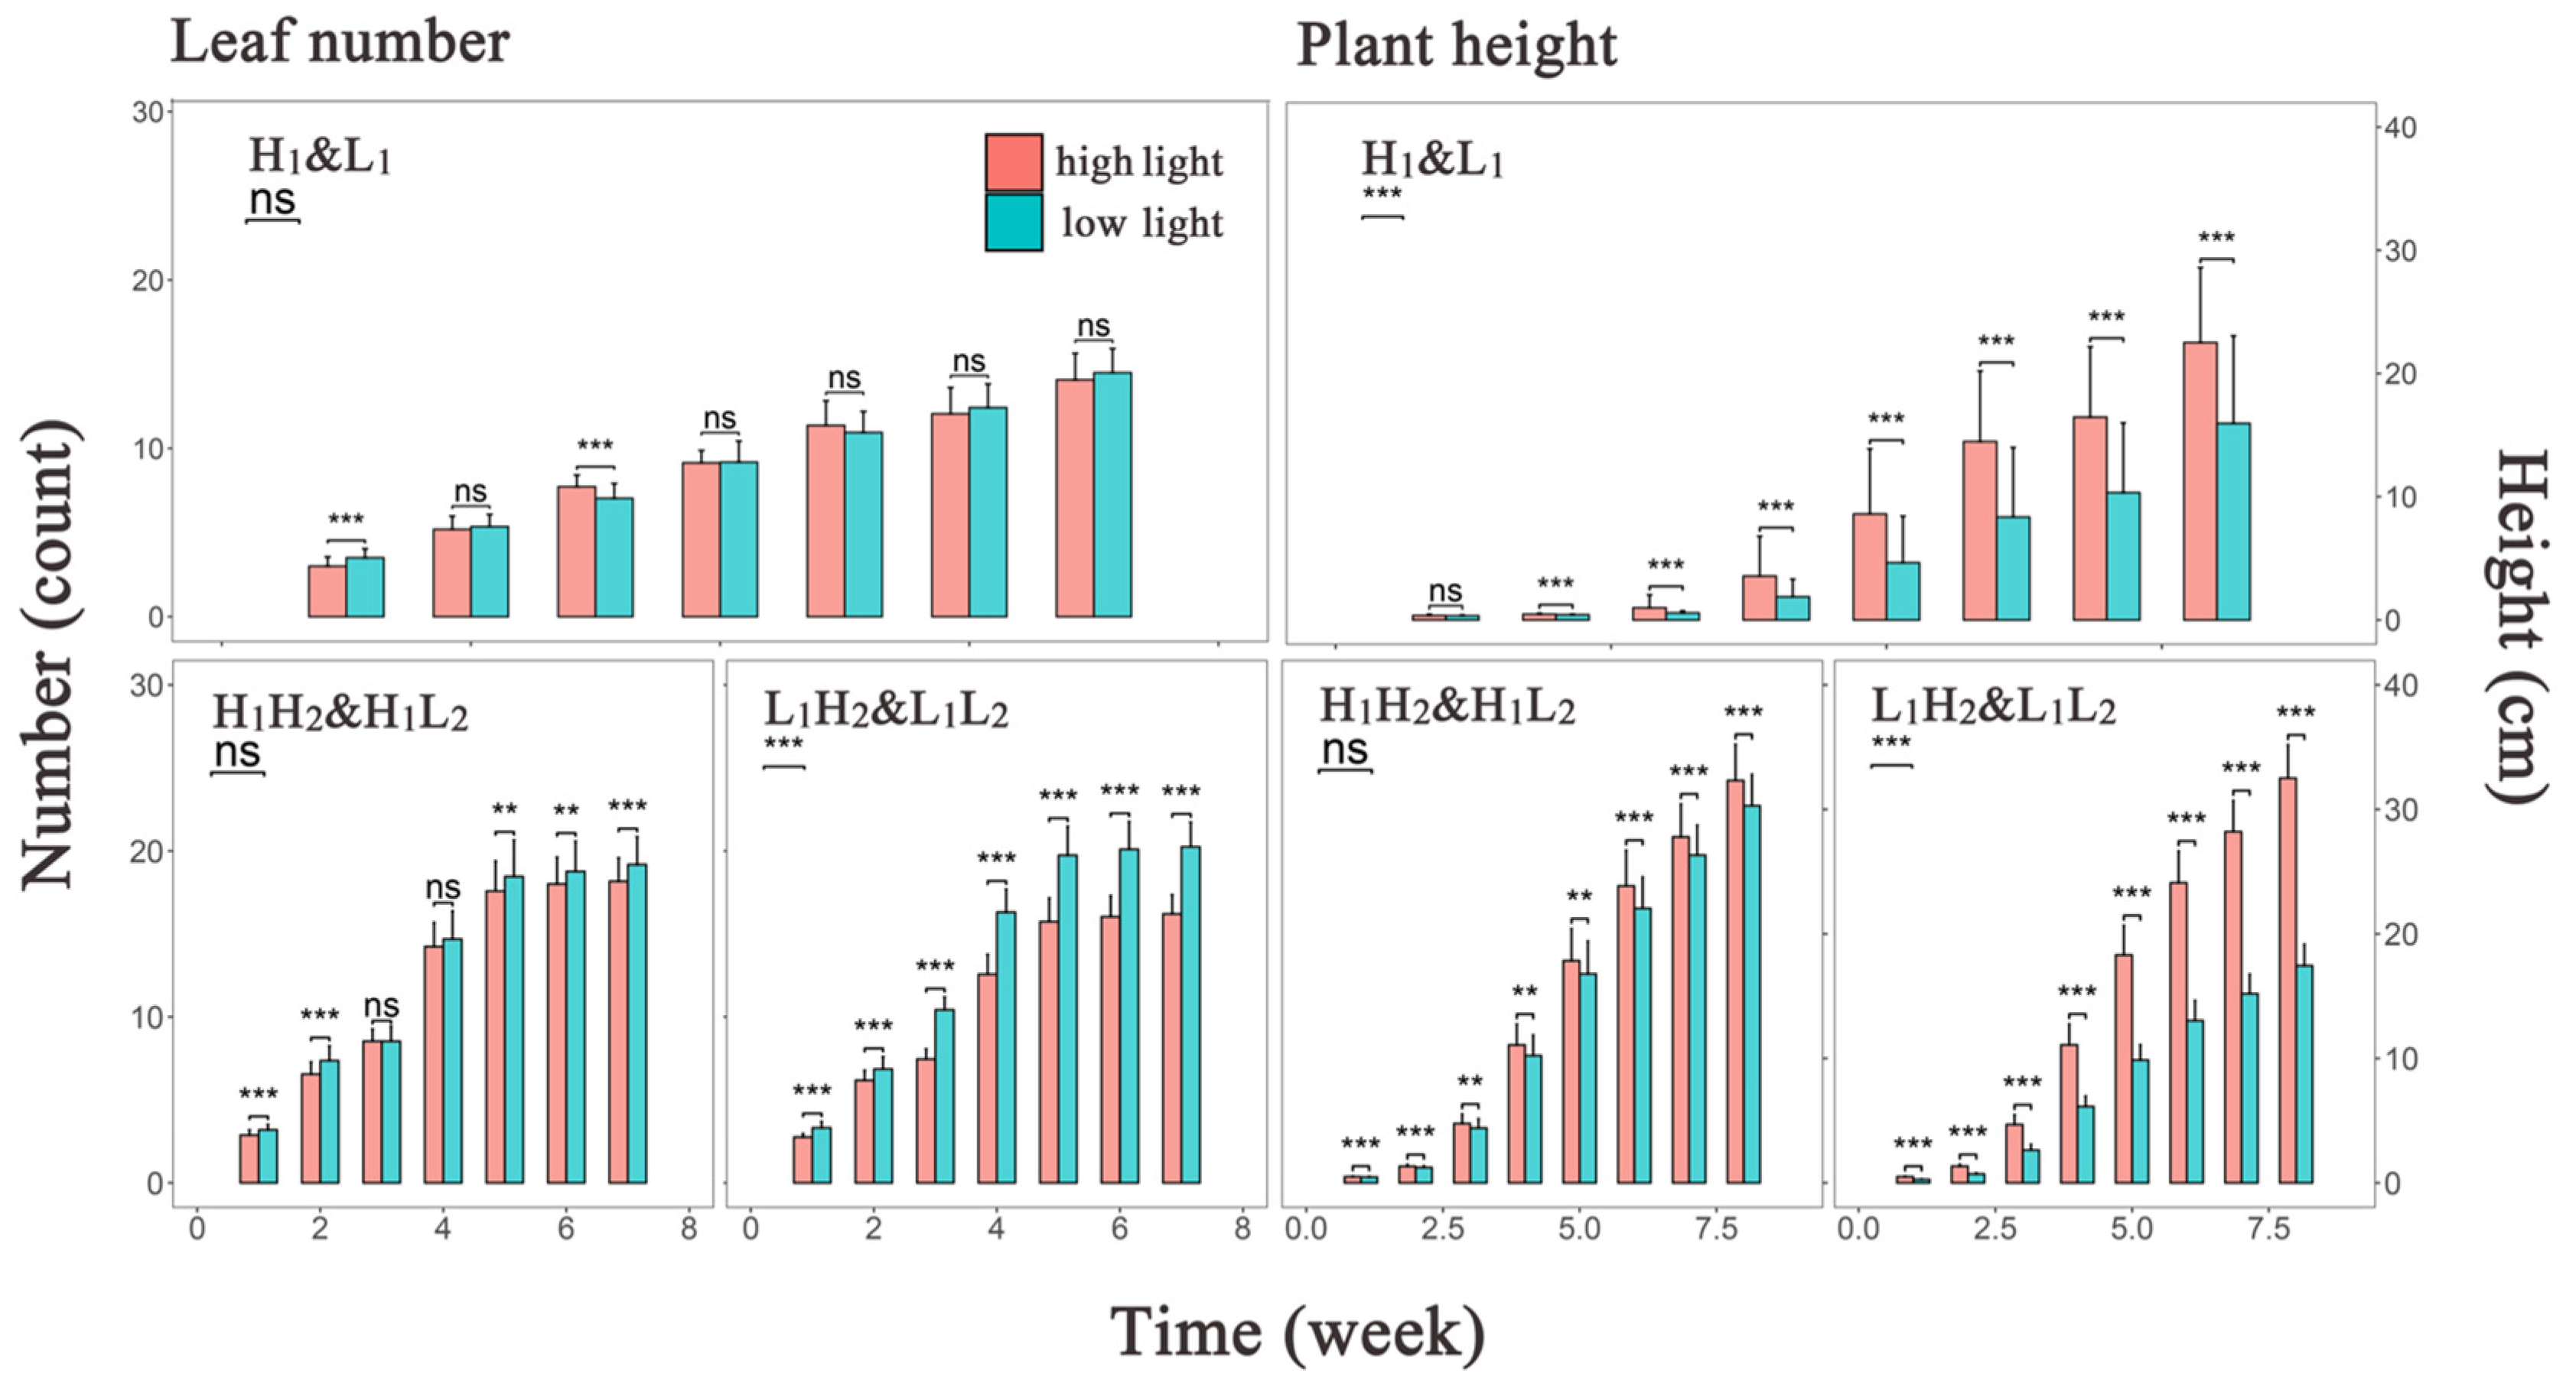
Figure 3.
Results of functional mapping. (A) Distribution of significant loci across chromosomes in various populations of Arabidopsis thaliana. (B) Manhattan plot of plant height trait of Arabidopsis thaliana in the H1L2 population. (C) Quantile-quantile plot of plant height of Arabidopsis thaliana in the H1L2 population.
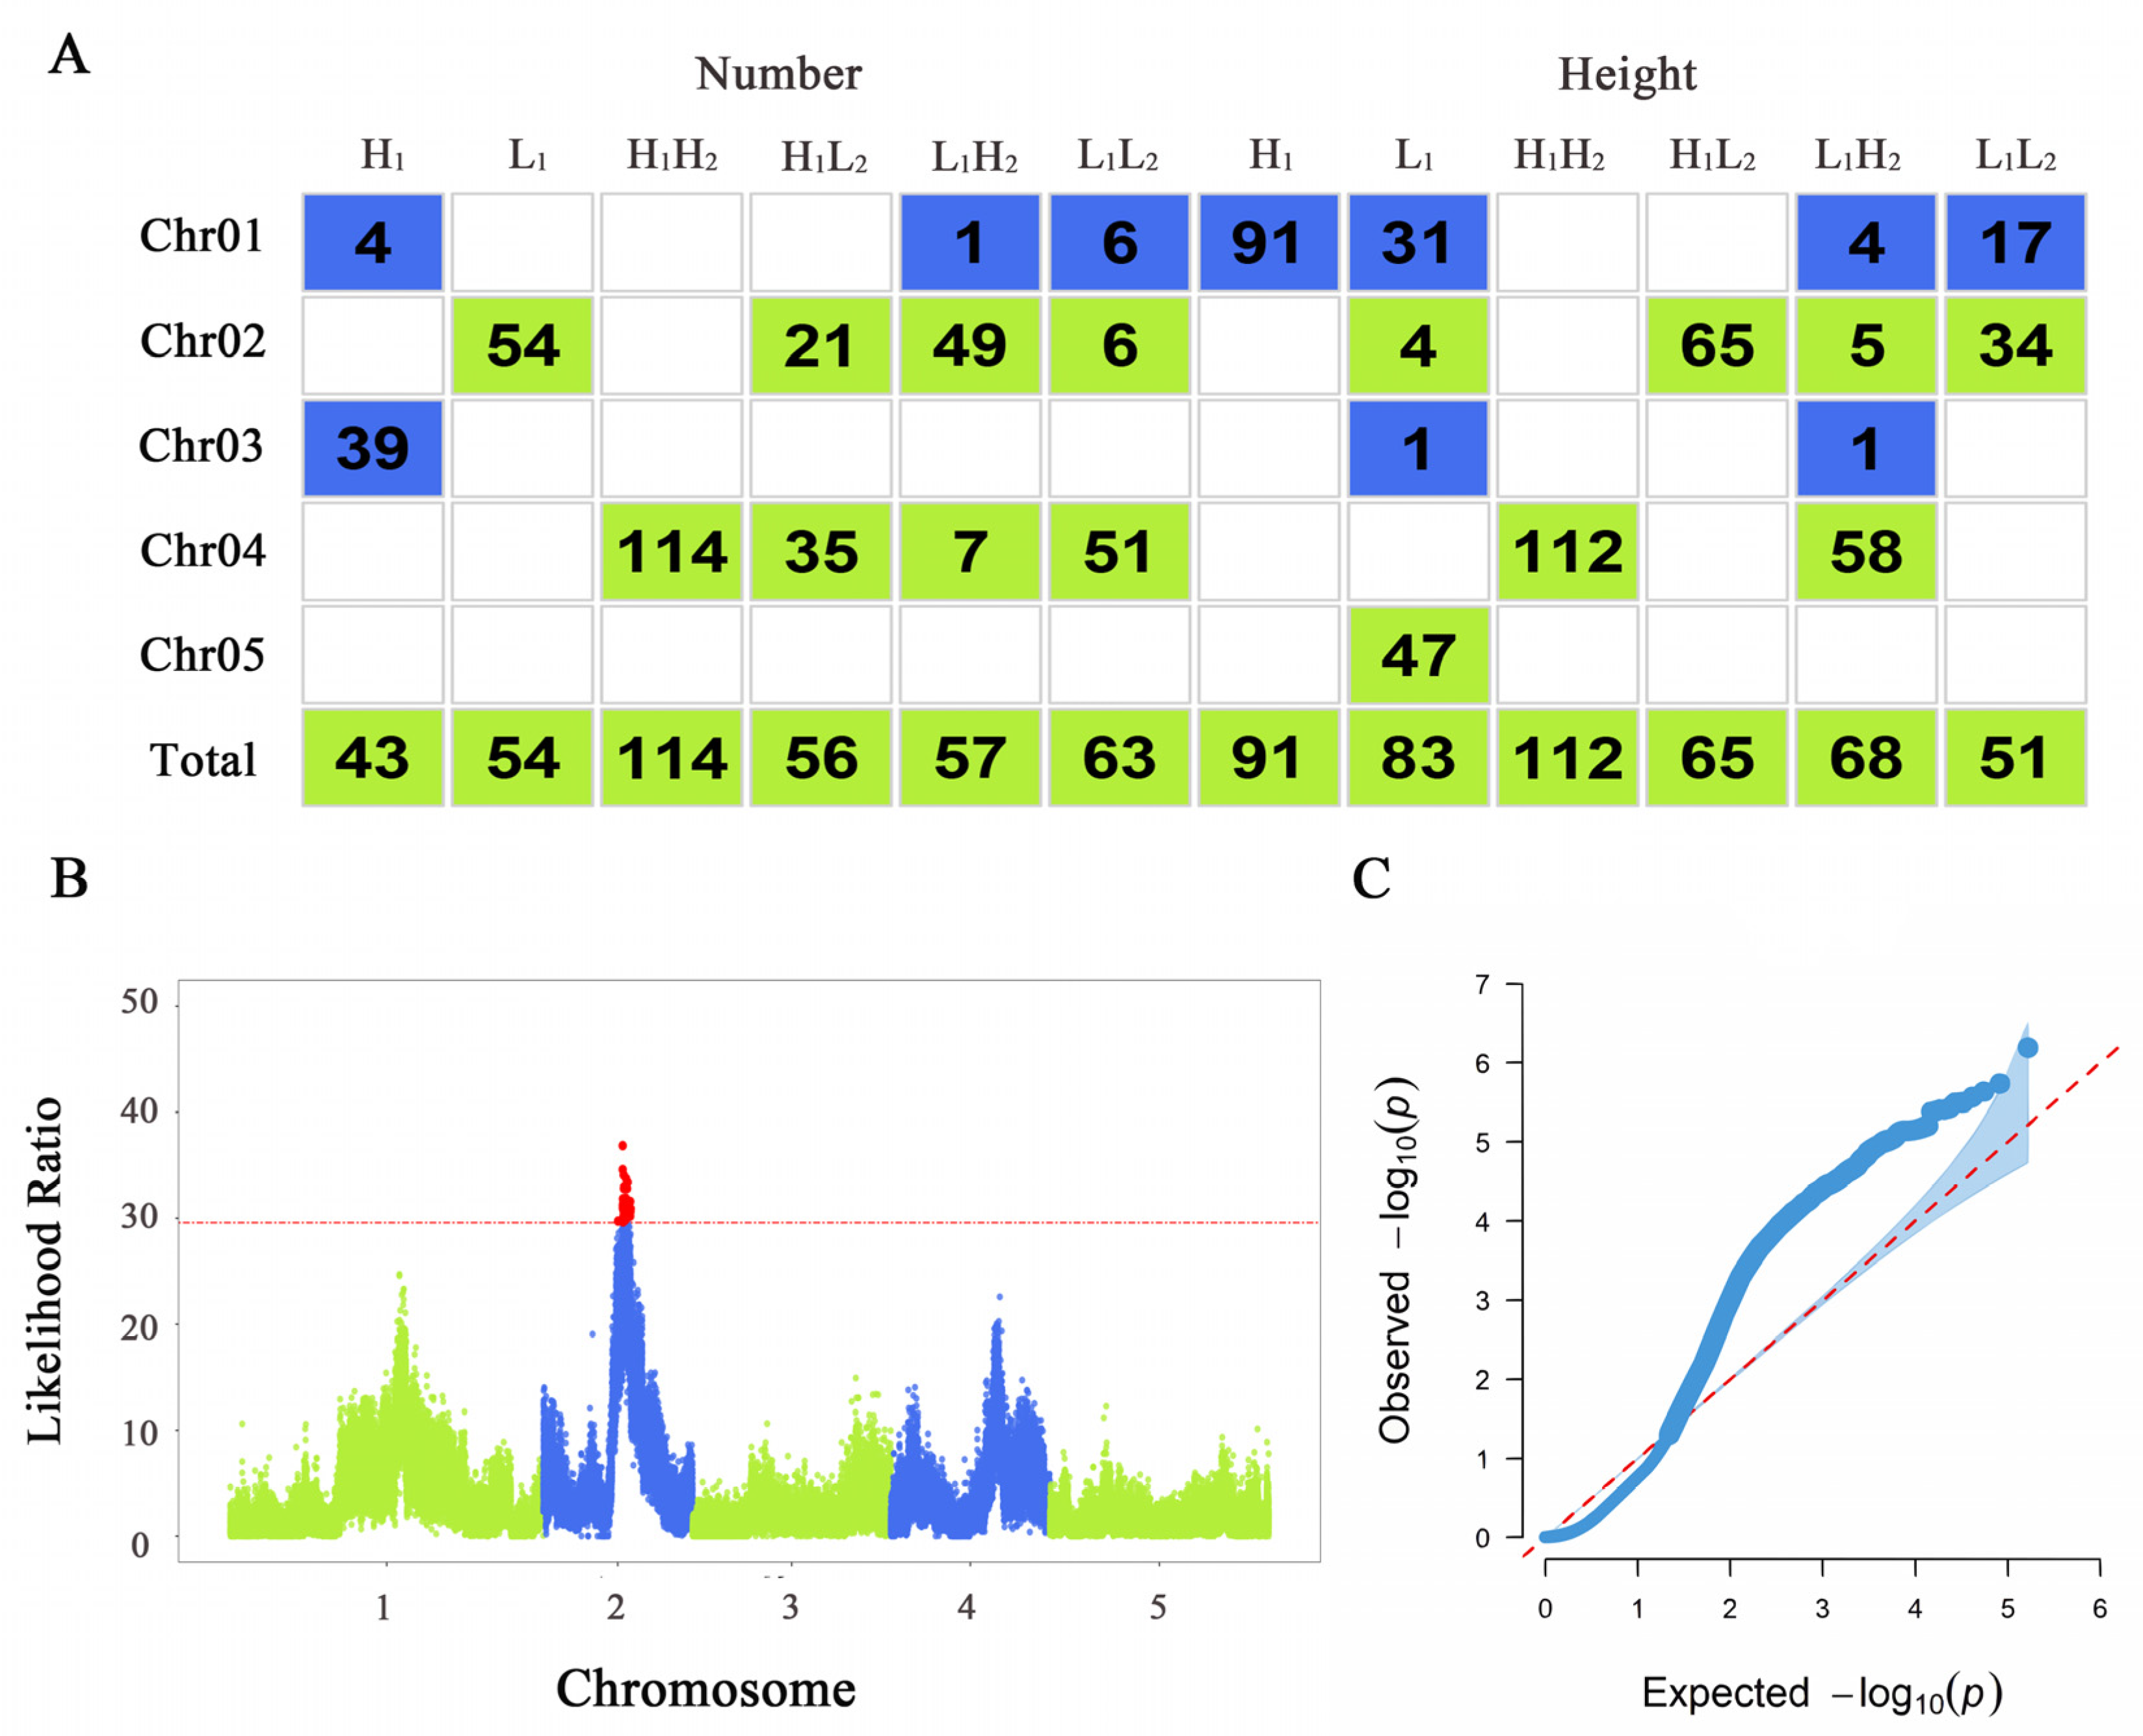
Figure 4.
Venn diagram showing significant genes associated with leaf number and plant height traits in Arabidopsis under different light treatments. The red ellipse represents significant genes associated with leaf number trait under high light treatment, the blue ellipse represents significant genes associated with leaf number trait under low light treatment, the yellow ellipse represents significant genes associated with plant height trait under high light treatment, and the green ellipse represents significant genes associated with plant height trait under low light treatment.
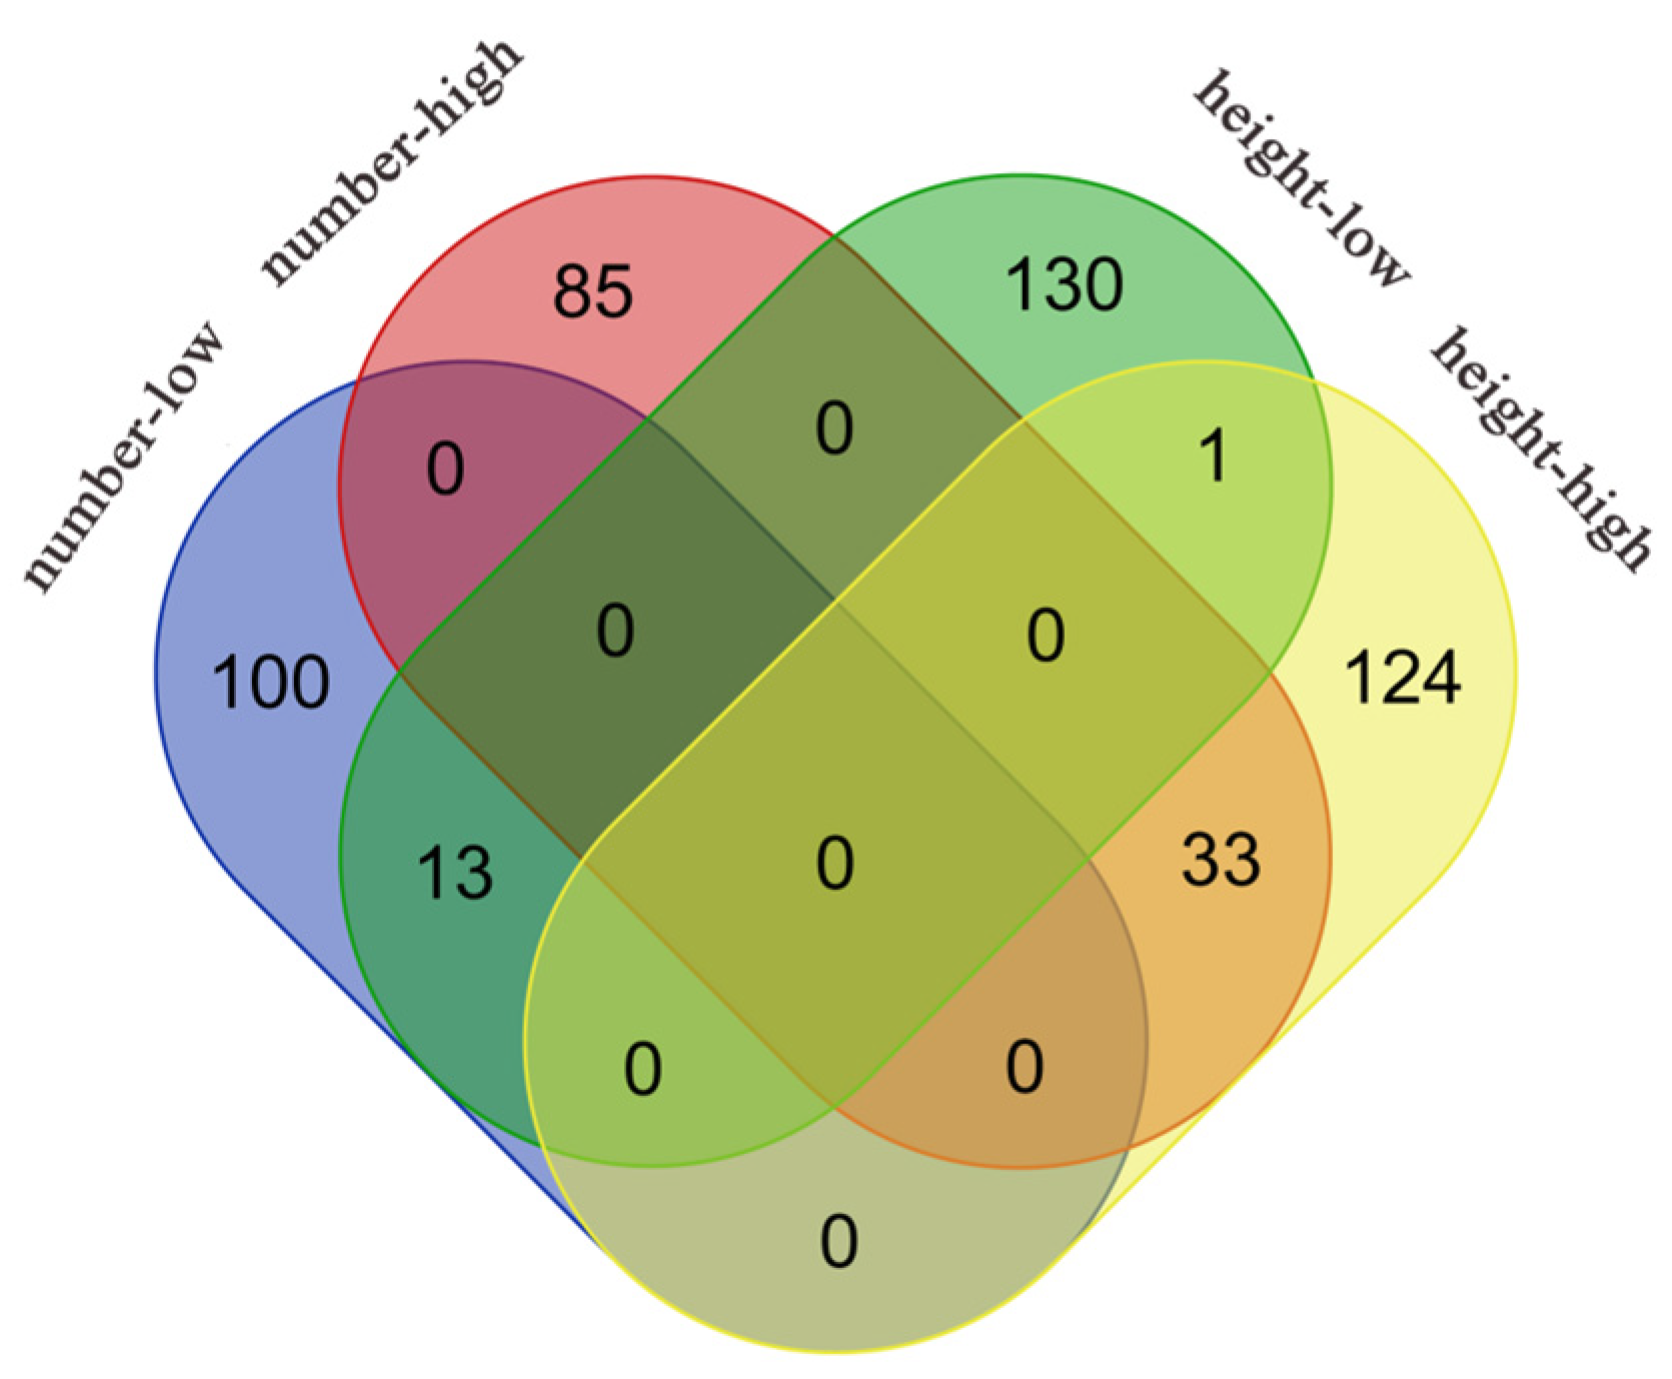
Figure 5.
(A) Genetic network diagram of significant gene effects on plant height in the Arabidopsis L1L2 population. Pink nodes represent hub genes. Red arrows indicate promoting effects, while blue arrows indicate inhibitory effects. The thicker the arrow, the greater the influence; conversely, the thinner the arrow, the smaller the influence. (B) Genetic effect decomposition plot for AT1G13460. The horizontal axis represents the measurement time points, and the vertical axis represents the genetic effect values. Blue represents the actual effect curve, red represents the independent effect curve, and green represents the dependent effect curve.
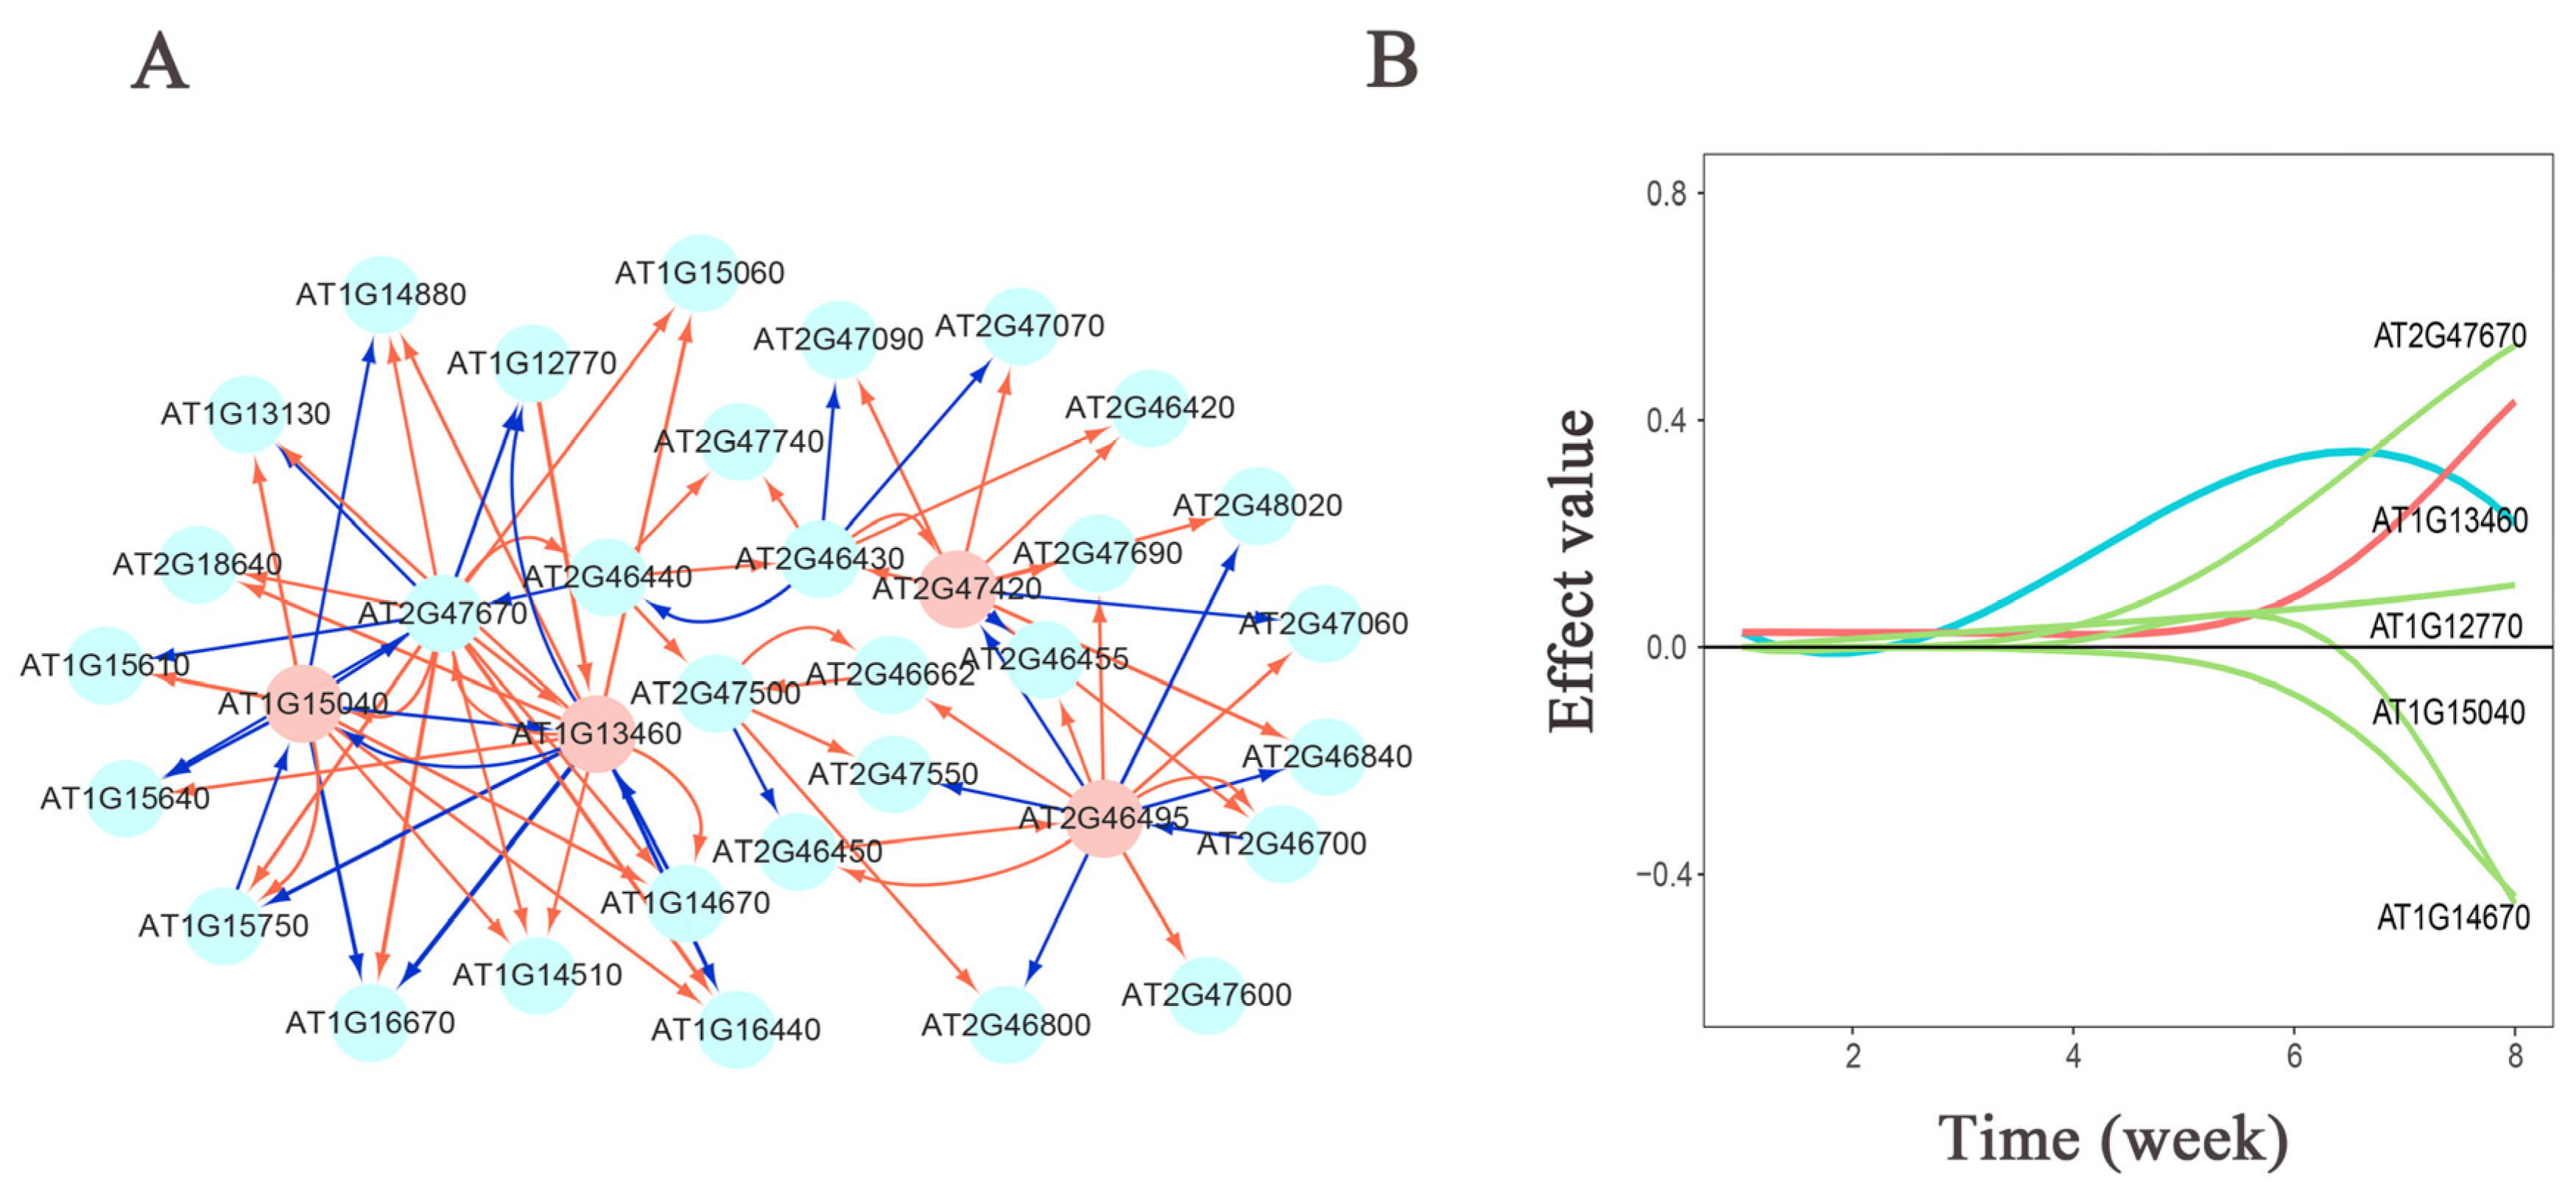
Figure 6.
Figure 6. GO annotation maps of significant genes for growth traits in Arabidopsis thaliana: leaf number in (A) high-light and (B) low-light groups; plant height in (C) high-light and (D) low-light groups. The horizontal coordinate is the number of genes enriched to the GO entries, and the vertical coordinate is the content of the GO entries. Red circle represents biological processes (BP); blue diamond represents cellular components (CC); green triangle represents molecular functions (MF).
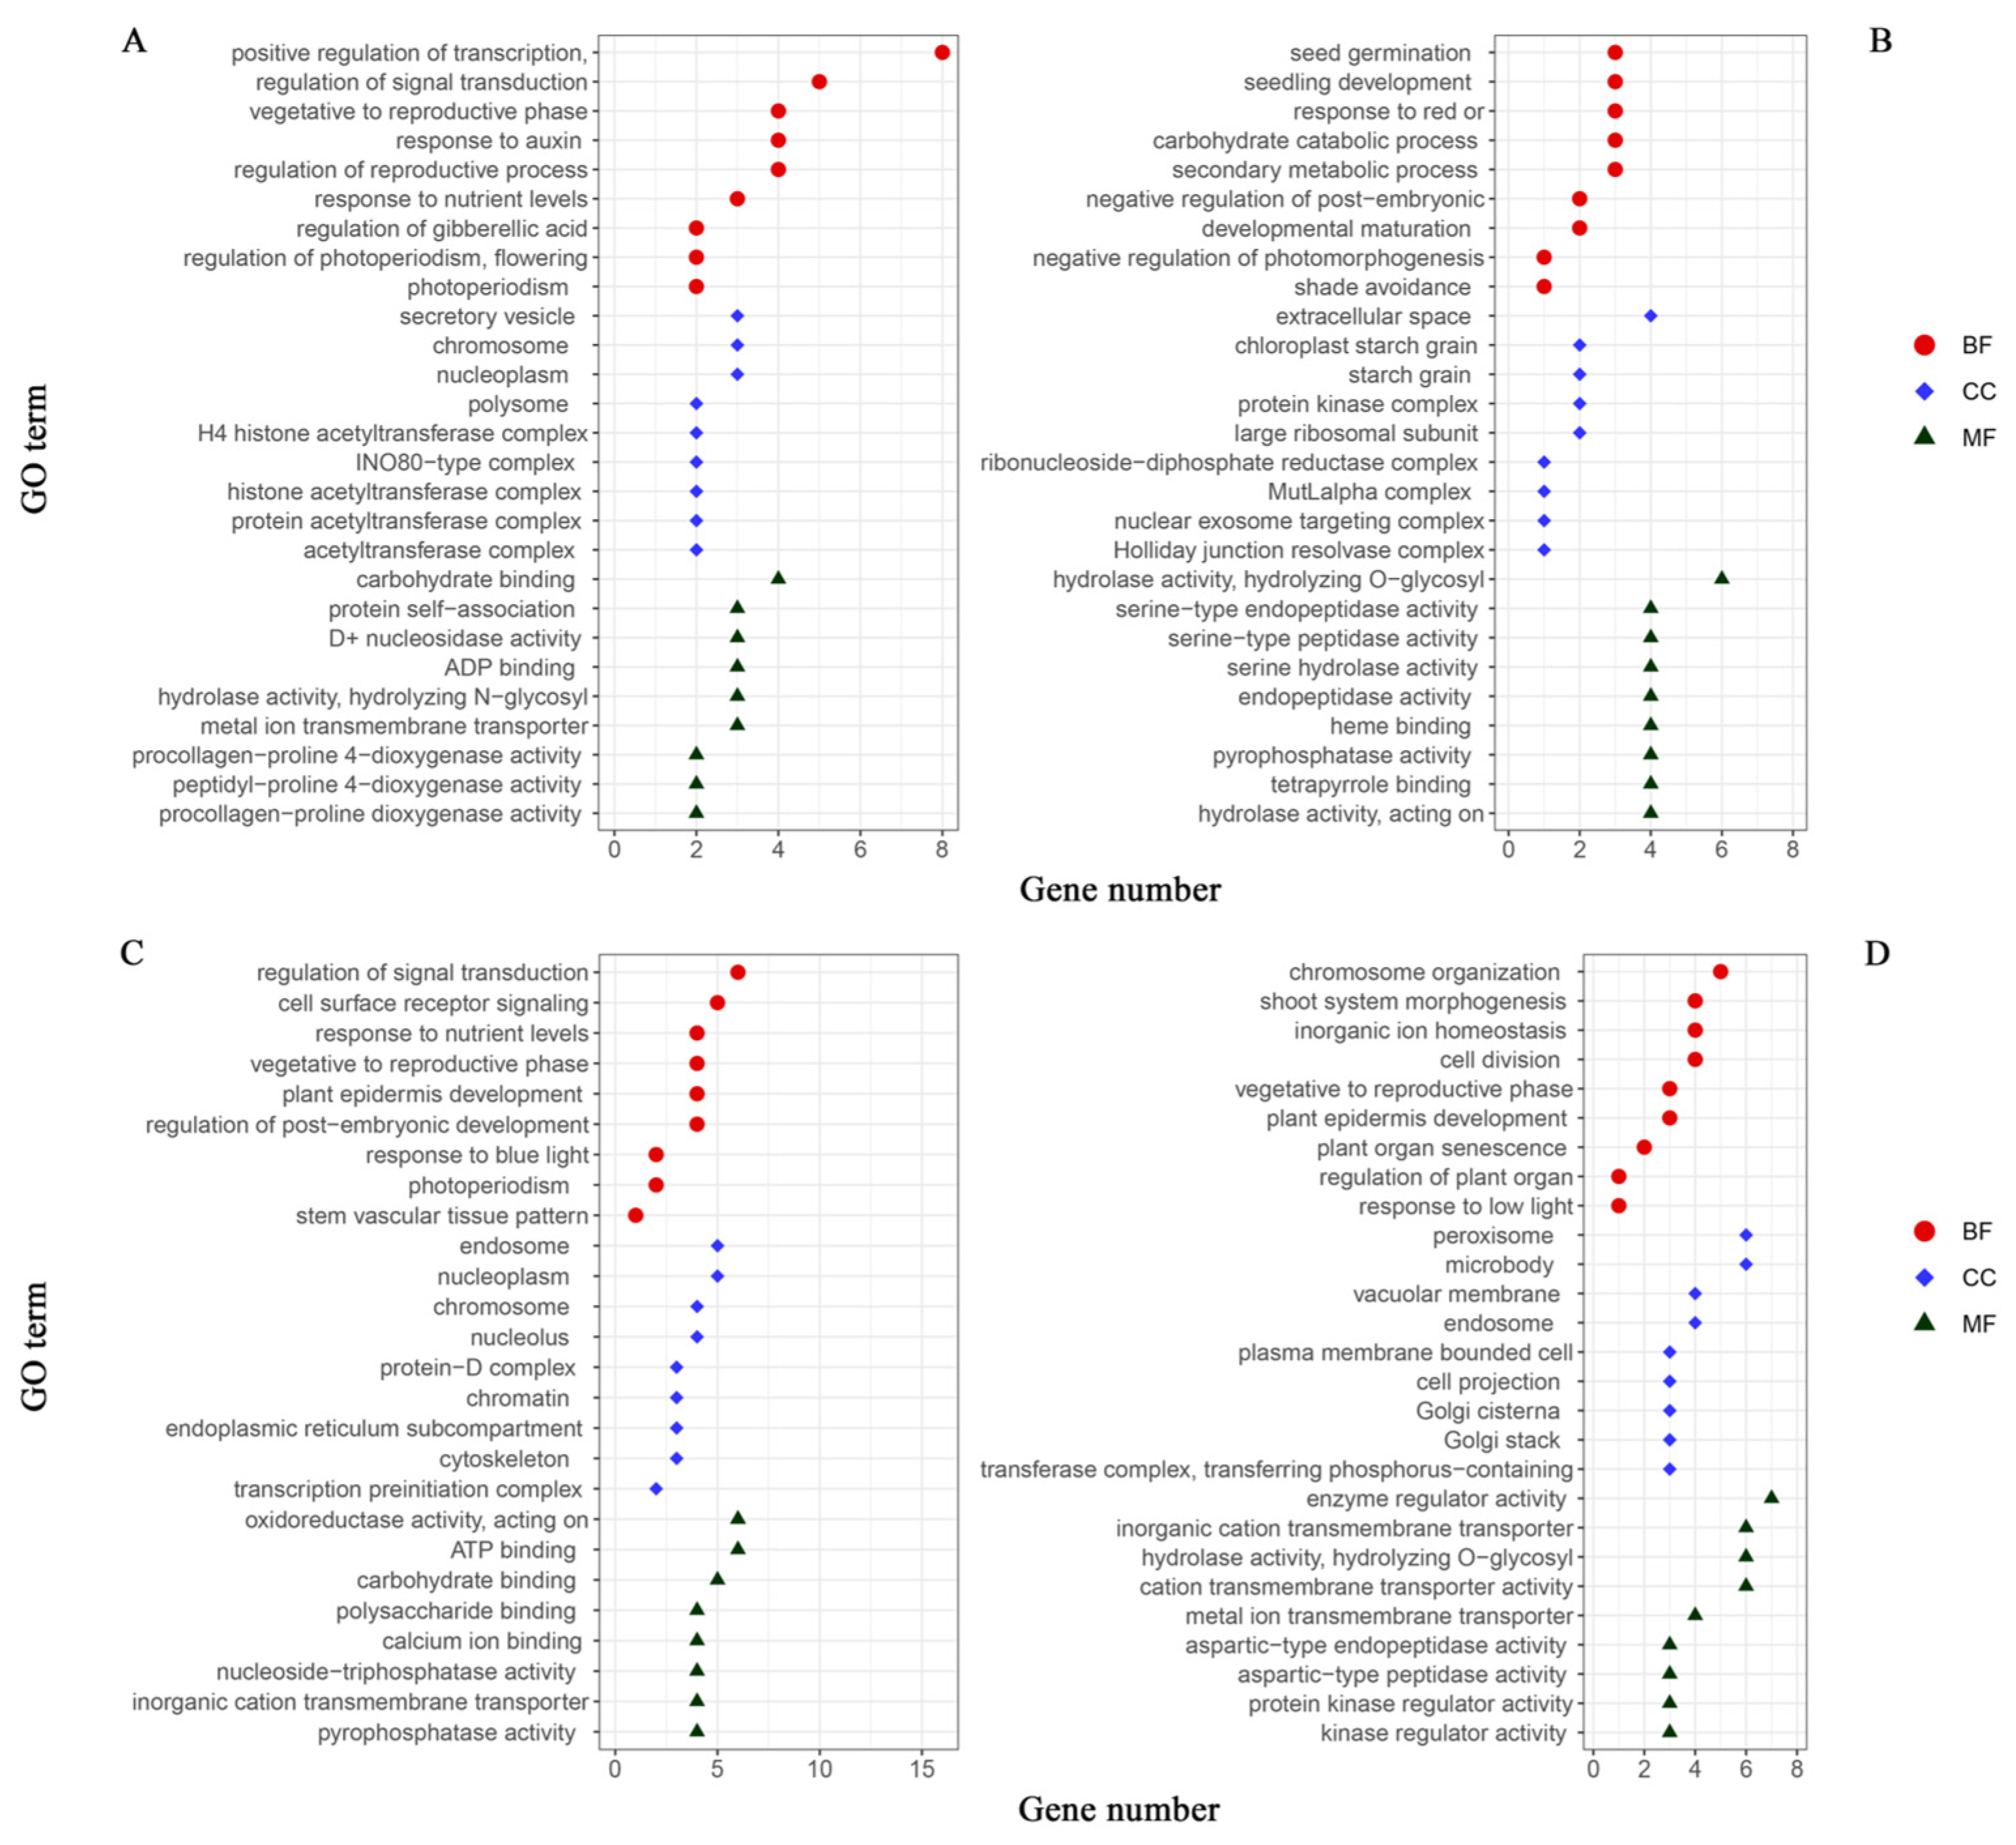
Figure 7.
Growth curves estimated for two genotypes of hub genes. Growth curves estimated for (A) aa and (B) AA genotypes of AT4G30840 in leaf number trait group; (C) aa and (D) AA genotypes of AT1G13460 in plant height group. Horizontal coordinates are measurement time points, and vertical coordinates are phenotypic value units. a-f are each phenotypic combination (a, H1; b, L1; c, H1H2; d, H1L2; e, L1H2; f, L1L2). Intra (orange) represents intergenerational phenotypic plasticity; Cross (green) represents transgenerational phenotypic plasticity; and Maternal (purple) represents maternal effects.
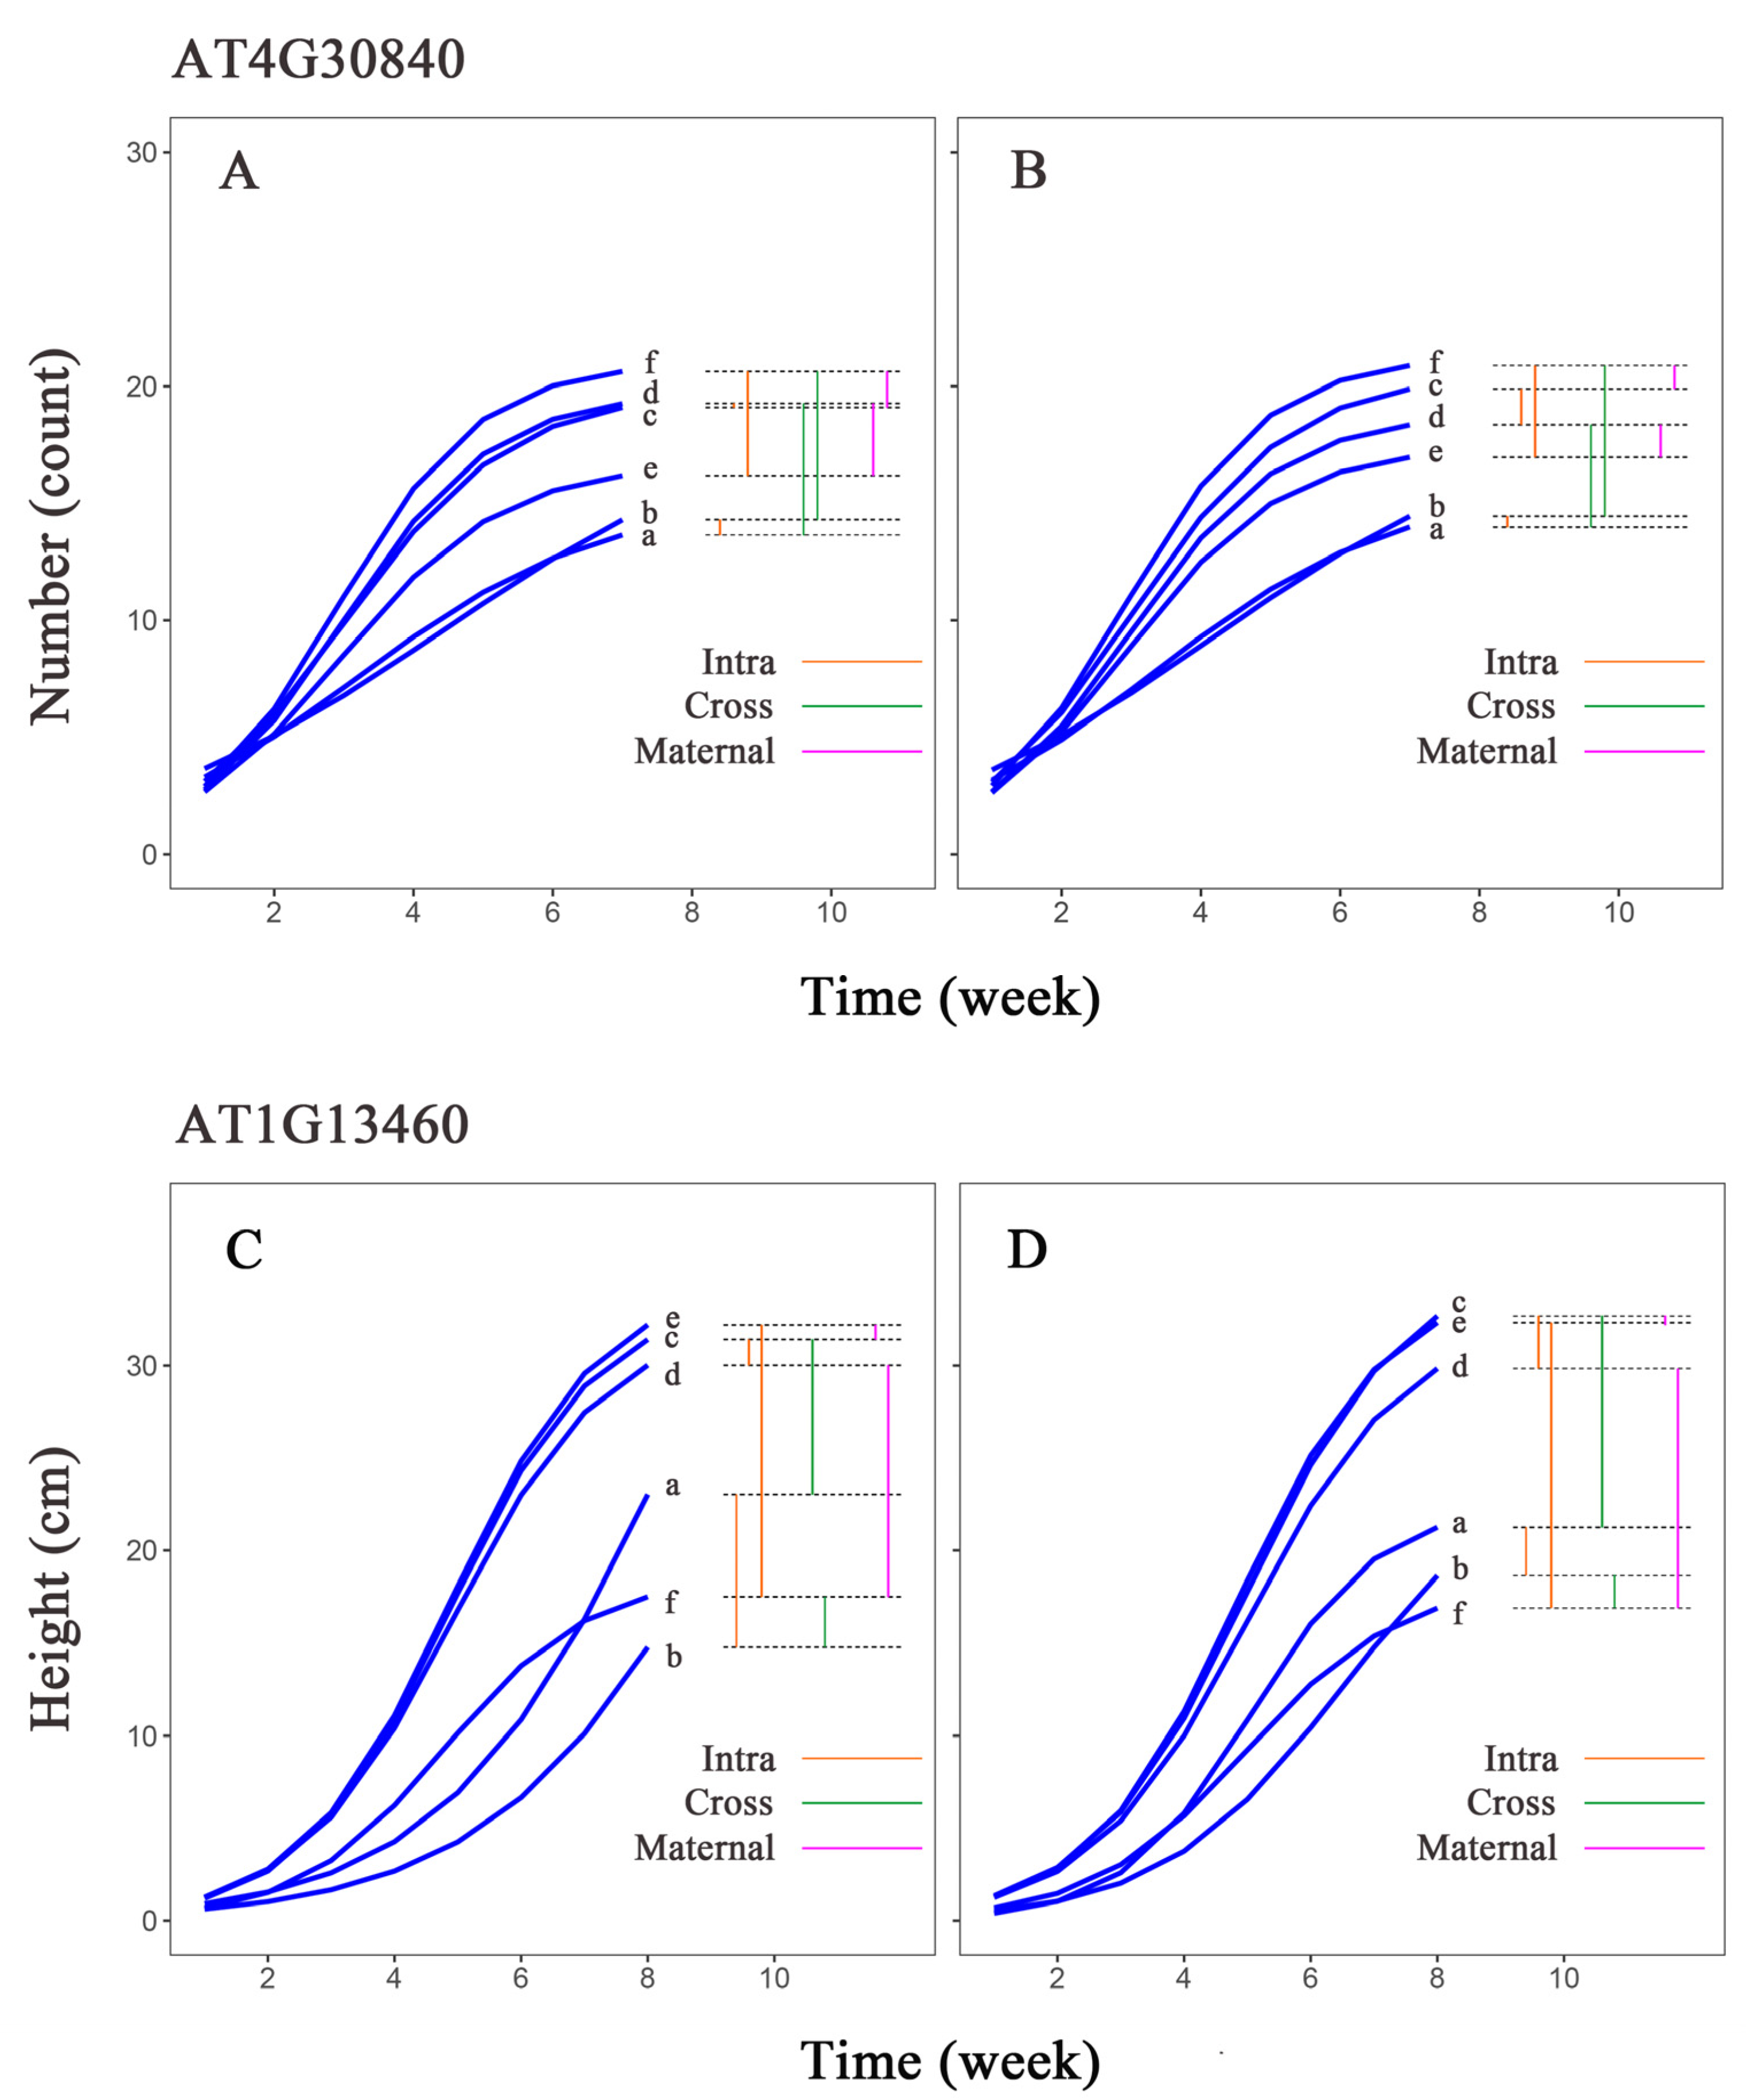

Table 1.
Abbreviations for plasticity group name.
| Category | Phenotypic Analysis Group | Abbreviation |
| Intragenerational plasticity | High-light and low-light | H1&L1 |
| High-light–high-light and high-light–low-light | H1H2&H1L2 | |
| Low-light–high-light and low-light–low-light | L1H2&L1L2 | |
| Cross-generational plasticity | High-light and high-light–high-light | H1&H1H2 |
| Low-light and low-light–low-light | L1&L1L2 | |
| Maternal effect | High-light–high-light and low-light–high-light | H1H2&L1H2 |
| High-light–low-light and low-light–low-light | H1H2&L1H2 |
Table 2.
Summary of significant genes for leaf number and plant height traits of Arabidopsis thaliana under high-light treatment.
Table 2.
Summary of significant genes for leaf number and plant height traits of Arabidopsis thaliana under high-light treatment.
| Category | Gene ID | Position | Chr | Alle | Variation type | Gene Description |
|---|---|---|---|---|---|---|
| Developmental regulation |
AT4G30840 | 15023742 | 4 | T/T | upstream_gene | Transducin/WD40 repeat-like superfamily protein |
| AT4G34220 | 16388827 | 4 | A/A | upstream_gene | Leucine-rich repeat protein kinase family protein | |
| AT4G35165 | 16739054 | 4 | C/C | downstream_gene | Egg cell-secreted-like protein (DUF1278) | |
| AT4G35370 | 16812606 | 4 | A/A | upstream_gene | Transducin/WD40 repeat-like superfamily protein | |
| AT4G35390 | 16829046 | 4 | C/C | upstream_gene | AT-hook protein of GA feedback 1 | |
| AT4G35840 | 16982215 | 4 | C/C | synonymous | RING/U-box superfamily protein | |
| AT4G35860 | 16989499 | 4 | T/T | upstream_gene | GTP-binding 2 | |
| AT4G35900 | 17005228 | 4 | G/G | missense | Basic-leucine zipper (bZIP) transcription factor family protein | |
| AT4G35910 | 17010429 | 4 | G/G | synonymous | Adenine nucleotide alpha hydrolases-like superfamily protein | |
| AT4G35950 | 17026971 | 4 | A/A | upstream_gene | RAC-like 6 | |
| AT4G36080 | 17065428 | 4 | G/G | synonymous | phosphotransferases/inositol or phosphatidylinositol kinase | |
| AT4G36160 | 17118705 | 4 | T/T | upstream_gene | NAC domain containing protein 76 | |
| AT4G36630 | 17273803 | 4 | C/C | synonymous | Vacuolar sorting protein 39 | |
| Stress response |
AT2G14210 | 6018220 | 2 | T/T | upstream_gene | AGAMOUS-like 44 |
| AT4G35920 | 17013293 | 4 | C/C | splice_region&synonymous | PLAC8 family protein | |
| AT4G36150 | 17107236 | 4 | C/C | missense | disease resistance protein (TIR-NBS-LRR class) family | |
| AT4G36140 | 17109354 | 4 | T/T | upstream_gene | disease resistance protein (TIR-NBS-LRR class) | |
| AT4G37640 | 17688360 | 4 | G/G | upstream_gene | calcium ATPase 2 | |
| Transcriptional regulation | AT4G35890 | 16995463 | 4 | C/C | upstream_gene | winged-helix DNA-binding transcription factor family protein |
| AT4G36590 | 17265352 | 4 | C/C | upstream_gene | MADS-box transcription factor family protein | |
| AT4G36650 | 17285093 | 4 | T/T | synonymous | plant-specific TFIIB-related protein | |
| Anabolism | AT4G35650 | 16910021 | 4 | T/T | 3_prime_UTR | Isocitrate dehydrogenase III |
| AT4G35640 | 16911160 | 4 | A/A | upstream_gene | Serine acetyltransferase 3;2 | |
| AT4G36090 | 17079871 | 4 | T/T | synonymous | oxidoreductase, 2OG-Fe(II) oxygenase family protein | |
| AT4G36250 | 17151190 | 4 | A/A | synonymous | aldehyde dehydrogenase 3F1 | |
| AT4G36360 | 17183722 | 4 | T/T | upstream_gene | beta-galactosidase 3 | |
| Other | AT2G14310 | 6070613 | 2 | A/A | upstream_gene | pseudo |
| AT4G35660 | 16912804 | 4 | T/T | missense | selection/upkeep of intraepithelial T-cell protein, putative (DUF241) | |
| AT4G35837 | 16984099 | 4 | C/C | upstream_gene | hypothetical protein | |
| AT4G36120 | 17098217 | 4 | C/C | upstream_gene | filament-like protein (DUF869) | |
| AT4G35980 | 17032032 | 4 | T/T | upstream_gene | uncharacterized protein | |
| AT4G36197 | 17129567 | 4 | T/T | upstream_gene | tRNA-Glu | |
| AT4G36648 | 17286112 | 4 | C/C | upstream_gene | ncRNA |
Table 3.
Summary of significant genes for leaf number and plant height traits in Arabidopsis thaliana under low-light treatment.
Table 3.
Summary of significant genes for leaf number and plant height traits in Arabidopsis thaliana under low-light treatment.
| Category | Gene ID | Position | Chr | Alle | Variation type | Gene Description |
|---|---|---|---|---|---|---|
| Developmental regulation |
AT1G16440 | 5616819 | 1 | G/G | missense | root hair specific 3 |
| AT2G27520 | 11762957 | 2 | T/T | synonymous | F-box and associated interaction domains-containing protein | |
| Stress response |
AT1G16670 | 5694727 | 1 | G/G | upstream_gene | Protein kinase superfamily protein |
| AT2G27580 | 11777295 | 2 | A/A | 5_prime_UTR | A20/AN1-like zinc finger family protein | |
| AT2G28060 | 11952520 | 2 | T/T | upstream_gene | 5’-AMP-activated protein kinase beta-2 subunit protein | |
| Transcriptional regulation | AT2G27700 | 11818626 | 2 | C/C | upstream_gene | eukaryotic translation initiation factor 2 family protein / eIF-2 family protein |
| AT2G27880 | 11878388 | 2 | A/A | downstream_gene | Argonaute family protein | |
| Anabolism | AT2G18640 | 8086595 | 2 | T/T | upstream_gene | geranylgeranyl pyrophosphate synthase 4 |
| AT2G27570 | 11775564 | 2 | G/G | stop_gained | P-loop containing nucleoside triphosphate hydrolases superfamily protein | |
| AT2G27650 | 11801094 | 2 | G/G | upstream_gene | Ubiquitin carboxyl-terminal hydrolase-related protein | |
| Other | AT1G15610 | 5371155 | 1 | G/G | missense | uncharacterized protein |
| AT2G27740 | 11821497 | 2 | G/G | upstream_gene | RAB6-interacting golgin (DUF662) | |
| AT2G28180 | 12017798 | 2 | C/C | upstream_gene | cation/hydrogen exchanger family protein |
Disclaimer/Publisher’s Note: The statements, opinions and data contained in all publications are solely those of the individual author(s) and contributor(s) and not of MDPI and/or the editor(s). MDPI and/or the editor(s) disclaim responsibility for any injury to people or property resulting from any ideas, methods, instructions or products referred to in the content. |
© 2024 by the authors. Licensee MDPI, Basel, Switzerland. This article is an open access article distributed under the terms and conditions of the Creative Commons Attribution (CC BY) license (http://creativecommons.org/licenses/by/4.0/).
Copyright: This open access article is published under a Creative Commons CC BY 4.0 license, which permit the free download, distribution, and reuse, provided that the author and preprint are cited in any reuse.


