Submitted:
01 July 2024
Posted:
01 July 2024
Read the latest preprint version here
Abstract
Synthetic Aperture Radar has been extensively used in numerous fields and can gather a wealth of information about the area of interest. This large-scene data-intensive technology puts a high value on automatic target recognition (ATR) which can free the utilizers and boost the efficiency. Recent advances in artificial intelligence have made it possible to create a deep learning-based SAR ATR that can automatically identify target features from massive input data. In the last 6 years, intensive research has been conducted in this area, however, most papers in the current SAR ATR field used recurrent neural network (RNN) and convolutional neural network (CNN)-varied models to deepen the regime’s understanding of the SAR images. To equip SAR ATR with updated deep learning technology, this paper tries to apply a lightweight vision transformer (LViT)-based model to classify SAR images. The entire structure was verified by an open- accessed SAR data set and recognition results show that the final classification outcomes are robust and more accurate in comparison with referred traditional network structures without even using any convolutional layers.
Keywords:
Multi-category learning
; Lightweight vision transformer (LViT)
; Synthetic aperture radar (SAR)
; Automatic target recognition (ATR)
; Open set recognition (OSR)
I. Introduction
Synthetic Aperture Radar (SAR), a prominent modern microwave sensor technology, has made substantial contributions to both civilian and military fields because of its capability to image the region where the interested targets conceal themselves. The SAR sensor system can operate in most situations independent of changes in lighting conditions or weather which can greatly impact conventional sensor regimes like infrared and optical systems. In terms of depicting targets, the fact that SAR gathers and analyzes electromagnetic data rather than employing a direct image method also distinguishes it from other common sensor systems. Due to all these special characteristics, SAR is capable of containing more compact information about the interested targets and is widely applied in modern imagery.
To increase the efficacy and flexibility of SAR ATR while reducing its complexity, the deep learning-based SAR ATR has been introduced which completely employs the power of the computer in discovering the intrinsic relationship between the input data and expected output via optimizing network parameters. The amount of human power required by this kind of SAR ATR approach is much reduced, and it is better equipped to handle input alternation like size reshape and rotation. With the advent of deep learning-based SAR ATR, the work has gradually moved from creating complex feature-extraction methods to constructing powerful network structures, and the effectiveness of those structures can be evaluated via the Moving and Stationary Target Acquisition and Recognition (MSTAR) program [1]. Throughout these years, many network structures have been conducted, but most of them focused on proposing structures based on traditional CNN or RNN to deepen the network’s understanding- ing towards the MSTAR data set. For example, S. Deng et al. applied an enhanced autoencoder CNN to recognize the data set and achieved a better performance than the conventional autoencoder [2]. Z. Huang et al. completed the multi-categorial recognition task using an enhanced CNN with a designed feedback bypass [3]. In 2018, Pei, J. et al. proposed a CNN-based expandable ‘multi-view’ structure [4] which was further modified to an RNN-based structure in 2021 [5]. In 2019, Z. Zhou et al. used a multi-level reconstruction methodology [6]. Later in 2022, X. Ma et al. proposed a generative adversarial network (GAN) based structure [7]. J. Ai et al. proposed a multi-kernel size feature fusion CNN (MKSFF-CNN) [8].
To introduce the updated knowledge of the deep learning field into SAR ATR, this paper plans to classify the MSTAR via a vision transformer-based structure [9,10,11] which is encouraged by the multi-head self-attention mechanisms [12]. It is also noticeable that we deduced the size of the original ViT to make it more compatible with the current data set scale and formed a lightweight ViT (LViT), and this structure can be expanded along with the data size to classify other SAR sets especially those internally-collected ones with more images.
To integrate the latest advancements in deep learning into the area of Synthetic Aperture Radar (SAR) Automatic Target Recognition (ATR), the main contributions of this research paper are mentioned as follows:
- This paper proposes a novel approach or methodology, possibly involving a lightweight vision transformer (LViT)-based model for Synthetic Aperture Radar (SAR) image classification.
- This paper presents a comparison of this model’s performance against traditional network structures, demonstrating improved accuracy and robustness in automatic target recognition in SAR data.
- The paper introduces a new framework for processing SAR images, which could be an advancement in the field of remote sensing.
- The findings of this paper provide valuable experience in terms of practical applications or implications of this research in relevant fields, such as military, aerospace, or environmental monitoring.
The rest of this paper is structured as follows: Section 2 introduces the utilized MSTAR data set and the proposed method. The results and further analysis of the proposed framework are discussed in Section 3. This paper is concluded in Section 4.
II. Data Set and Proposed Methodology
- A.
- MSTAR Data Set
The MSTAR program contains ten categories of targets including 2 kinds of tanks, 4 classes of armored carriers, bulldozers, trucks, howitzers, and anti-air units. In Figure 1., details of the aforementioned targets can be found via the optical-SAR pair pictures. For the MSTAR program, since its data was collected by a plane that scans targets using SAR imagery technology from the top, it can be discovered that great similarities are observed among different target classes even though the ground imageries of those targets are in relatively high quality. This method of data acquisition offers a unique perspective and challenges for image classification and recognition. Despite the high quality of ground imagery, there are significant similarities observed among different target classes. This similarity poses a challenge in differentiating between the various categories. In spite of this, there is also a depression angle variation between the train (17°) and test (15°) data sets, this alternation also puts a higher requirement on the generalization ability of the constructed network since the train- and-test sets are not split from a single data set under the same circumstance.
- B.
- Model Architecture
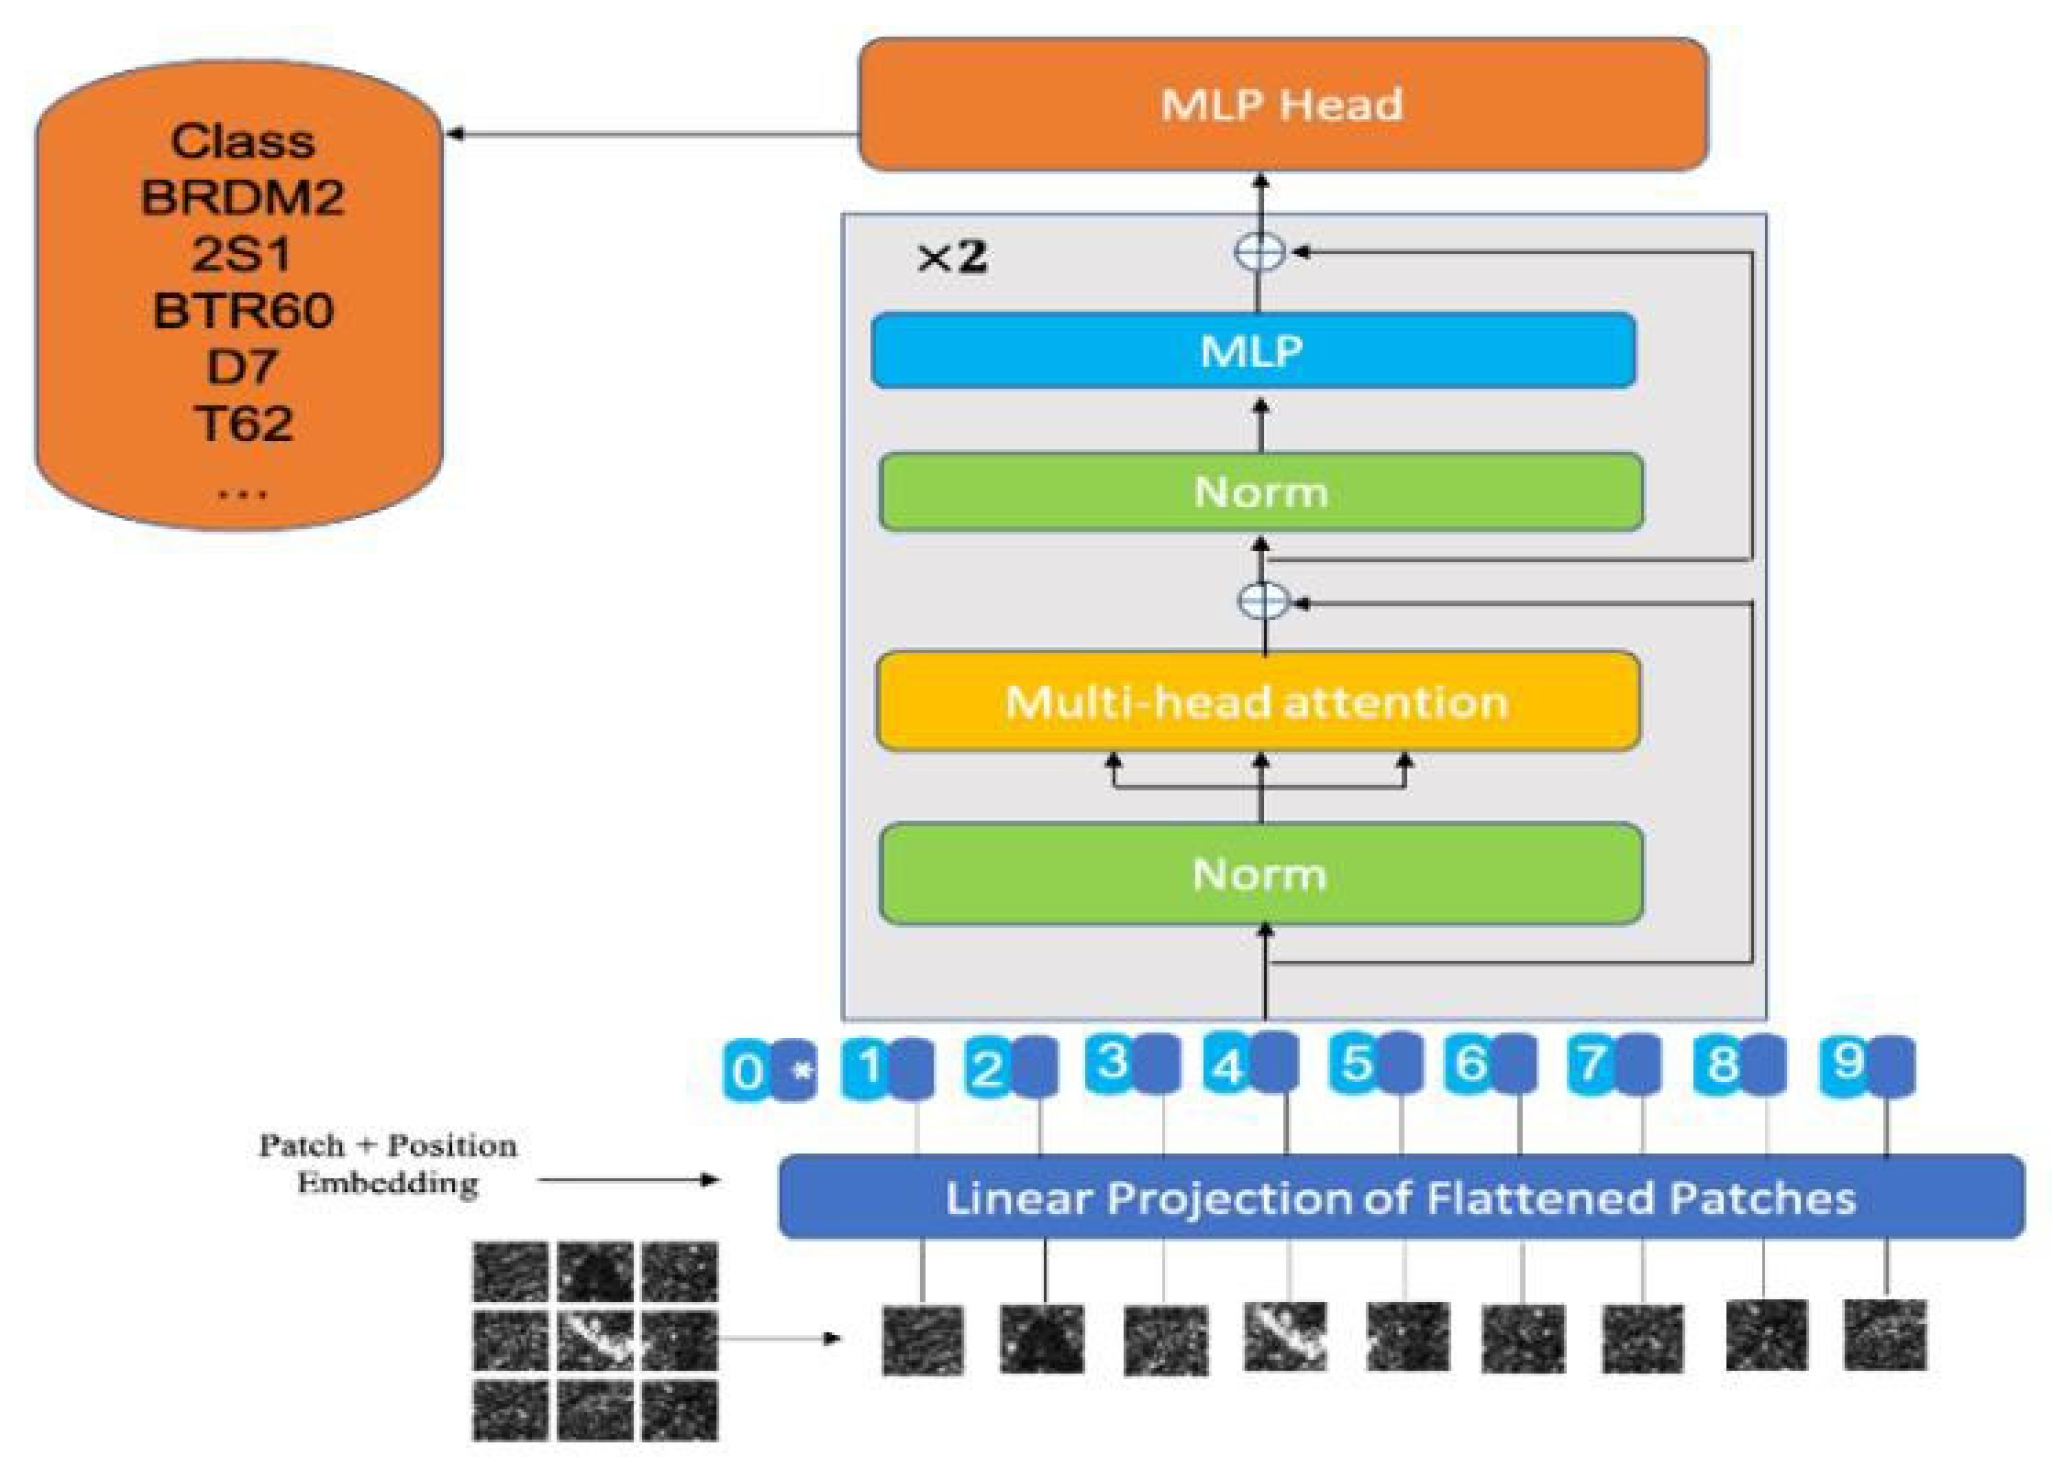
The main body of the model architecture follows the structure of the original Vit model introduced by [9,10]. The overview of architecture is depicted in Figure 2. The model is composed of two components: a transformer encoder and MLP. We first process the images with a vision transformer encoder and then feed the output features into MLP for the ten-category classification task.
For the input image as ∃x ∈ ℝ48×48×1, 1 denotes one channel and (48,48) denotes the width and height of the input image. To input the features into the transformer encoder, we first split the input image into 9 patches, xi ∈ ℝ16×16×1, i = {1, …, N}, where N = = 9 is the number of patches and 16 is the patch size. Then, the 9 patches are flattened into a sequence of 1D patches, x ∈ ℝ162×1 . Next, the flattened patches are mapped to 512 dimensions with a trainable linear projection (Equation (1)). The output of this linear projection Zi ∈ ℝD×1, i = {1, …, 9}, refers to the patch embeddings. Besides, we pretend a learnable embedding(Z0=Xclass) to the patch embeddings.
To utilize the position information of each patch of the image, we add the position encodings Pi ∈ ℝD×1, i = {0,1, …, 9}, for each patch Zi . Then, Pi + Zi are inputted into trans- former encoder directly (Equation (2)). The transformer encoder consists of two identical encoder layers. Each encoder layer has a multi-head self-attention and feed-forward network (Equations (3) and (4)). The output of the encoder f0 ∈ ℝD×1 acts as input of MLP for image classification (Equation (5)). The calculation can be formulated as:
𝑦0 = [ 𝑃0 + 𝑍0, 𝑃1 + 𝑍1, ... , 𝑃9 + 𝑍9]
𝑦′ = 𝑀𝑆𝐴(𝐿𝑁(𝑦𝑙−1)) + 𝑦𝑙−1, 𝑙 = 1, …, 𝐿
𝑦𝑙 = 𝑀𝐿𝑃(𝐿𝑁(𝑦′)) + 𝑦′, 𝑙 = 1, …, 𝐿
𝑦𝐿 = [𝑓0, 𝑓1, 𝑓2, … , 𝑓9]
Where l denotes the number of encoder layers in the encoder, MSA denotes the multi-head self-attention mechanism, and FFN denotes the feed-forward network.
- C.
- Fine-tuning
This paper selected multi-categorical cross-entropy as a loss function which is optimized by a self-decaying Adam optimizer with a learning rate starting from 0.001. We trained the model for 80 epochs with a batch size of 64. The LViT architecture is fine-tuned to 2 layers and 2 heads, an embedding size of 256, and a drop-out rate of 0.3 was applied.
In summary, Section 2 provides a comprehensive overview of the dataset used, the architecture of the model, and the fine- tuning approach. It begins with a detailed description of the MSTAR Data Set, which includes ten categories of targets such as tanks, armored carriers, bulldozers, trucks, howitzers, and anti-air units. The data, gathered by a plane using SAR imagery technology, presents challenges due to similarities among target classes and variations in depression angles between training and testing sets, emphasizing the need for a model with strong generalization abilities. This section sets a solid foundation for the results and analysis presented in Section 3, where the effectiveness of the LViT model in classifying SAR images is demonstrated and compared with traditional methods.
III. Results And Analysis
- A.
- Classification in Progress
The entire experiment was supported via a laptop with AMD Ryzen 9 5900HX, and a 16 GB NVIDIA RTX 3080 Laptop GPU. Heatmaps in Figure 3 that have genuine target labels in the row and predicted target labels in the column demonstrate the recognition process and classification performance of the constructed LViT.
From the 4 typical stages of the classification process, it can be observed that all images were gradually classified from an initial random stage (most images being classified into a random column) to stages in which all predicted results gradually align and finally to a well-trained result that the most of the predicted results are in diagonal which indicates the model does a good job in recognizing all these classes.
When looking inside the confusion matrix, it is interesting- ing to find that some quasi-rectangles are formed in the intermediate stage (the top left and bottom right of the heatmaps), these two blocks generally indicate the similarity among SAR images of different categories. For example, the first block indicates that two types of armored carriers confuse with T-62 tank and the howitzer, and different sub-versions of T-72 tanks (SN 132, SN C71) and the BMP2 armored carrier confuse each other.
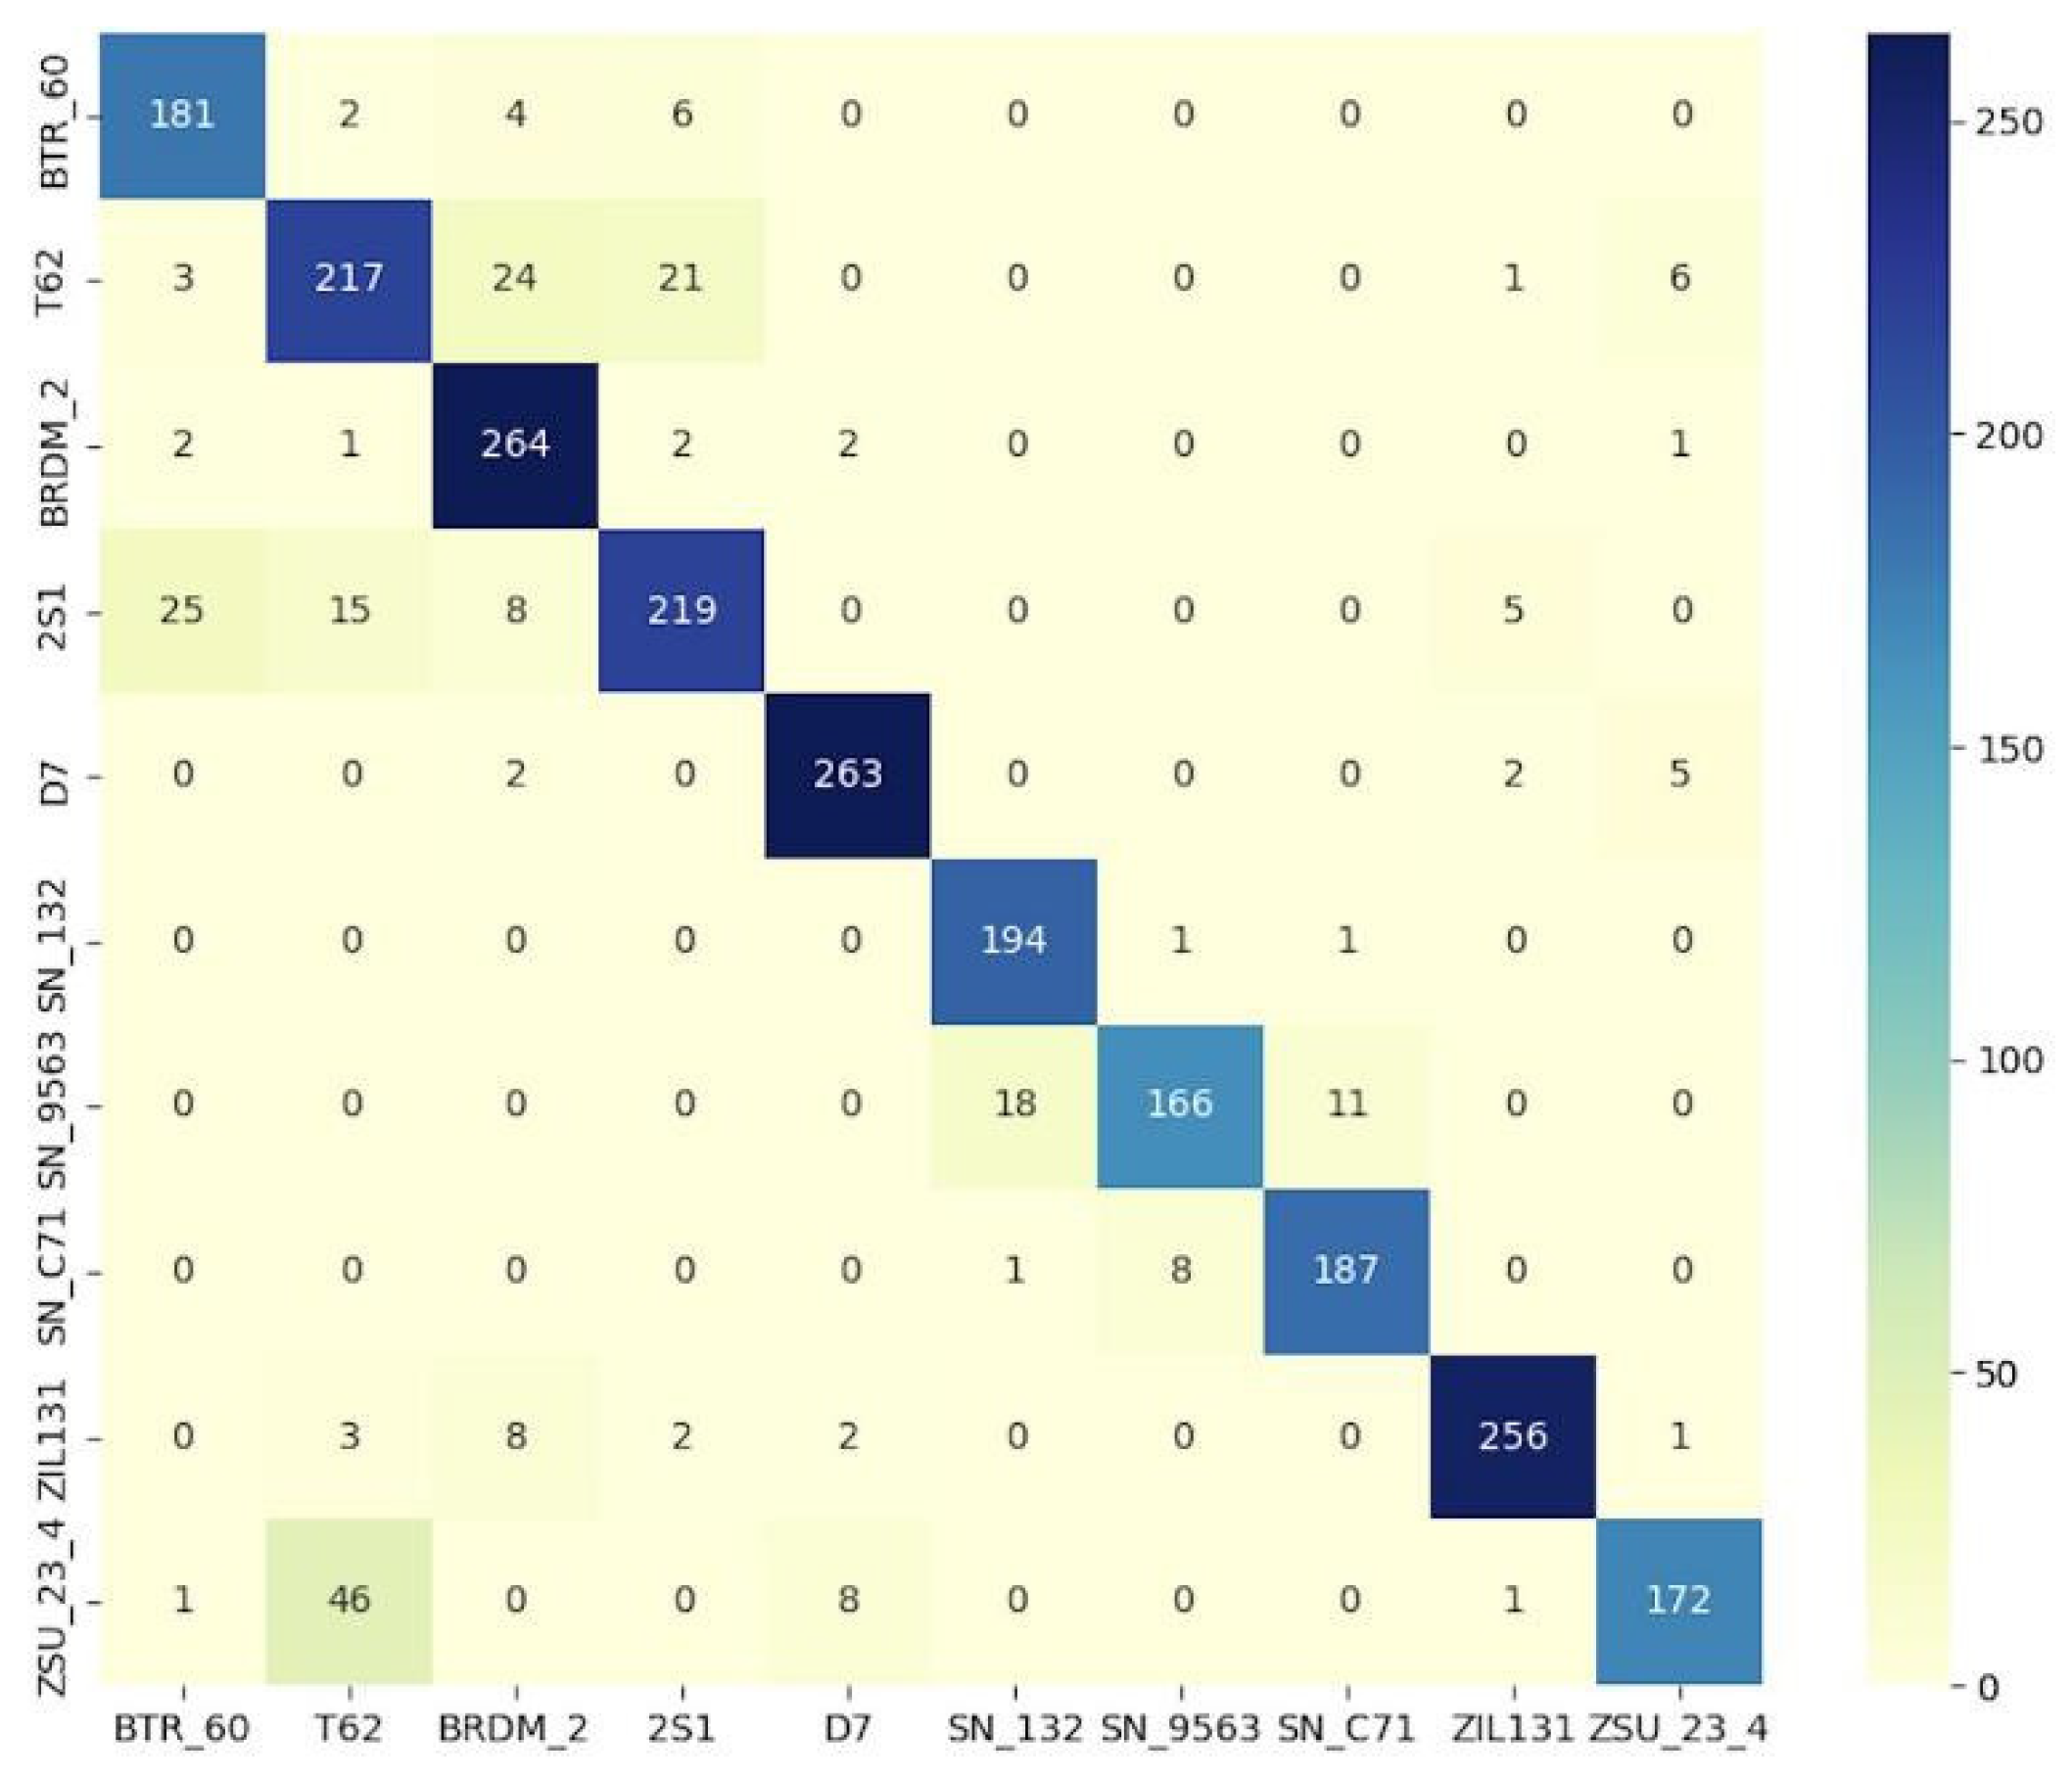
The final heatmap shows that the most amount of predicted labels correctly match the ground truth (in blue or dark blue), and except for the last row, every remaining box is in the light color which means seldom predicted labels are wrongly categorized into other categories. Figure 4. shows the final classification heatmap of our network, from where the detailed quantity of each class can be clearly found and a further result analysis based on this heatmap will be conducted in the following section.
Figure 3.
The classification results of different epochs during the training process of the model: (a) The initial training phase (when epoch=0). (b) The early intermediate stage (when epoch=30). (c) The late intermediate stage (when epoch=50). (d) The final well-trained stage (when epoch=80).
Figure 3.
The classification results of different epochs during the training process of the model: (a) The initial training phase (when epoch=0). (b) The early intermediate stage (when epoch=30). (c) The late intermediate stage (when epoch=50). (d) The final well-trained stage (when epoch=80).
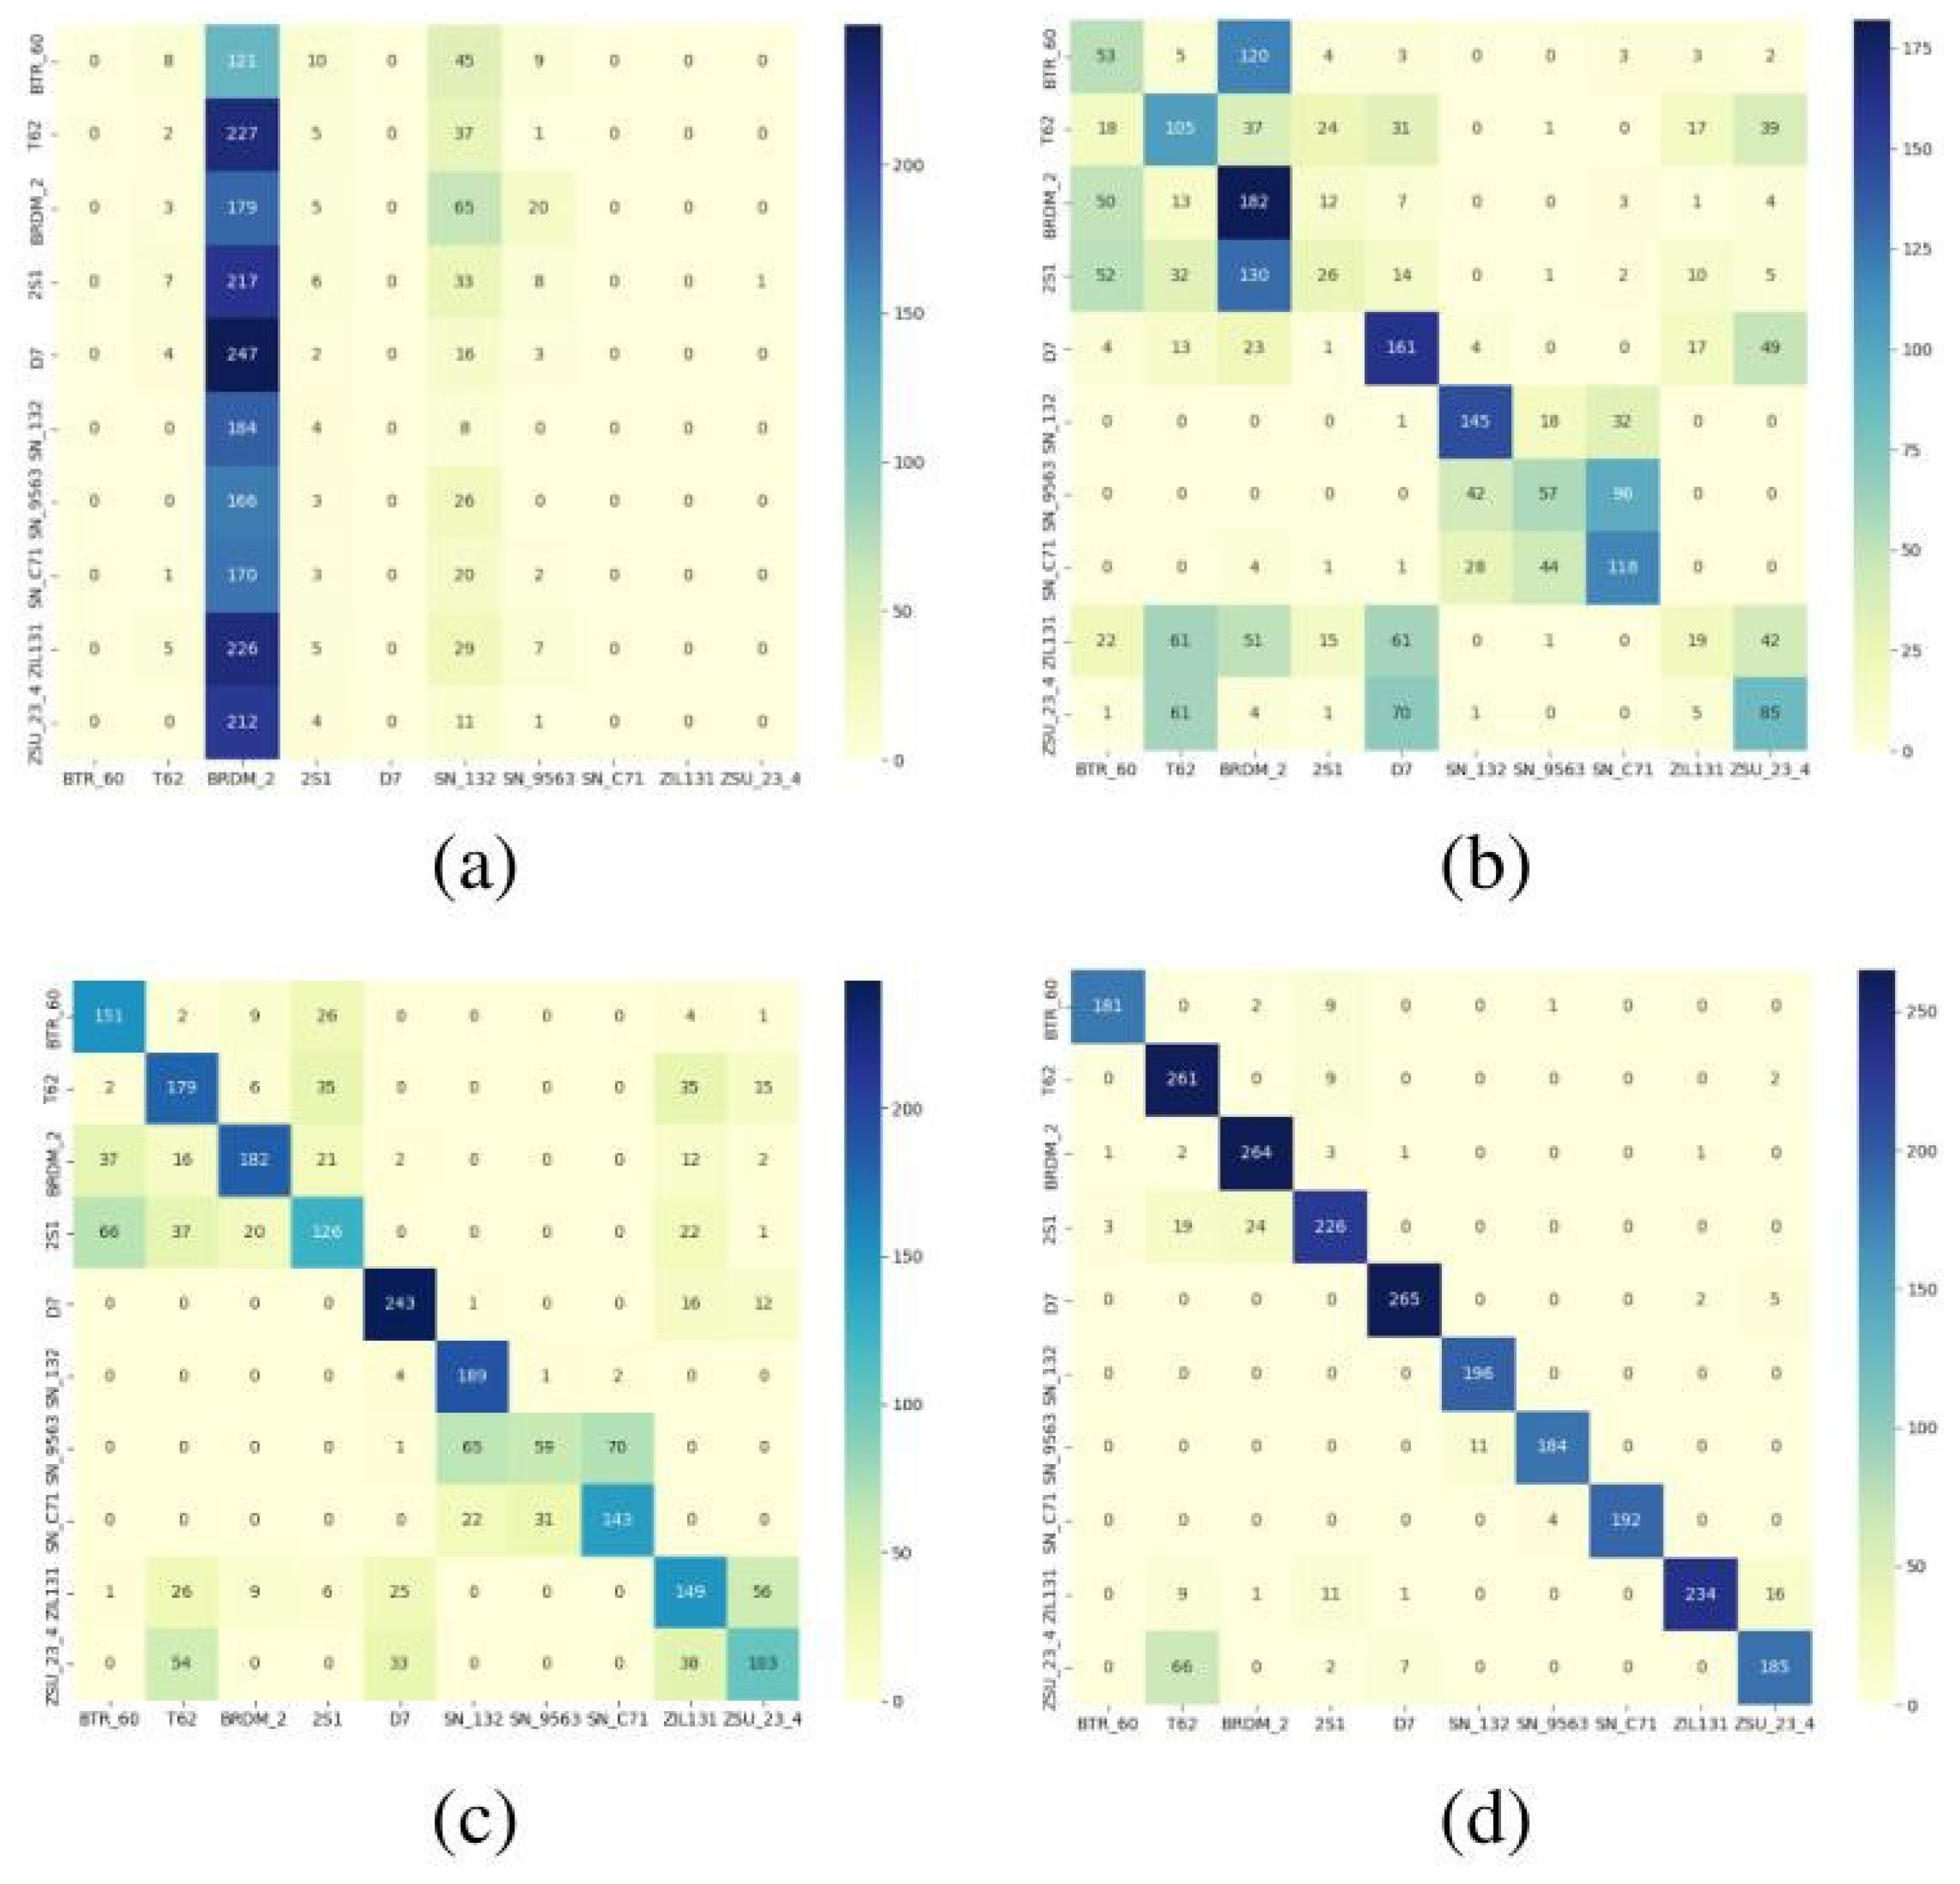
Figure 4.
The final classification results of the model in heatmap.
- B.
- Results in Confusion Matrix
A more detailed analysis of each category is shown in Figure 4. below, from which it can be observed that, for the LViT network, an overall recognition rate of 91.83% is achieved. And except for the 2S1, ZSU23/4, and ZIL131 classes, all the remaining 7- class targets are in good recognition with each accuracy exceeding 93% (this network even achieved full recognition for the T-72 tank).
When looking inside each category, it is observed that for the 2S1 self-propelled howitzer: 6.99% of 2S1 were thought to be T62 and 3.31% of T62 were misunderstood as 2S1 by the LViT network, it is also noticed that some part of 2S1 were recognized as BRDM2 and D7, this might due to all these three types of targets have ‘rectangular appearance’ which makes the network hard to distinguish among them. As for the worst recognized ZSU23/4 anti-aircraft gun, 25.38% of this target was wrongly recognized as a T-62 tank, this might be because they both have similar ‘round turret’, especially when the plane imagines the target from the top. Therefore, the network gets very confused.
For the three types of armored carriers (BTR70, BTR60, BMP2), although they all belong to the carrier category, the network is not perplexed by shared similarities, on the contrary, few of them are wrongly recognized with others, and they are all classified with an over 93.78% accuracy. It was also worth pointing out that the BMP2 could be confused with tanks because of similar gun barrels. The other categories like the T72 tank and BRDM2 amphibious armoured scout generally have very appreciating results when adopting our network.
- C.
- Model Evaluation
Recall, Precision, and F1-score [13] are traditional indicators for evaluating the model. In terms of our 10-class classification task, the overall recall value is the average of all the 10 classes and refers to the proportion that true positive classified samples take within the pool of all expected results, and the overall precision is the average proportion that true positive results take within the domain of positive results. Similar-ly, the overall F1- Score represents the average result of the so-called ‘harmonic aver-age’ of the 10-class targets’ recall and precision, which in general has a positive corre-lation with the classification ability of a model. The mathematical representations for all these three parameters are [7,8]:
Where Capital Precision, Recall, and F1 score represent the corresponding overall results of the 10 classes, and precisionc , recallc , f1c represent the separate results associated with each category ranging from 0 to 9. TP is the number of true positives (both real and predicted labels are positive), FP is the number of false positives (the real label is negative, but the predicted label is positive), TN is the number of true negatives (the real true label is predicted as negative), and FN is the number of the false negatives (both real and predicted labels are negative). It should be stressed that these four parameters rely on the pre-designed threshold values which categorize the negative and positive values by defining whether labels with a certain confidence score be classified as positive or negative. And in Python, we can use the ‘sklearn’ to calculate these evaluation parameters. The calculated results of our investigated model show that this model has a recall of 90.7%, a precision of 90.3%, and an F1-score of 90.5%.
- D.
- Results Comparison
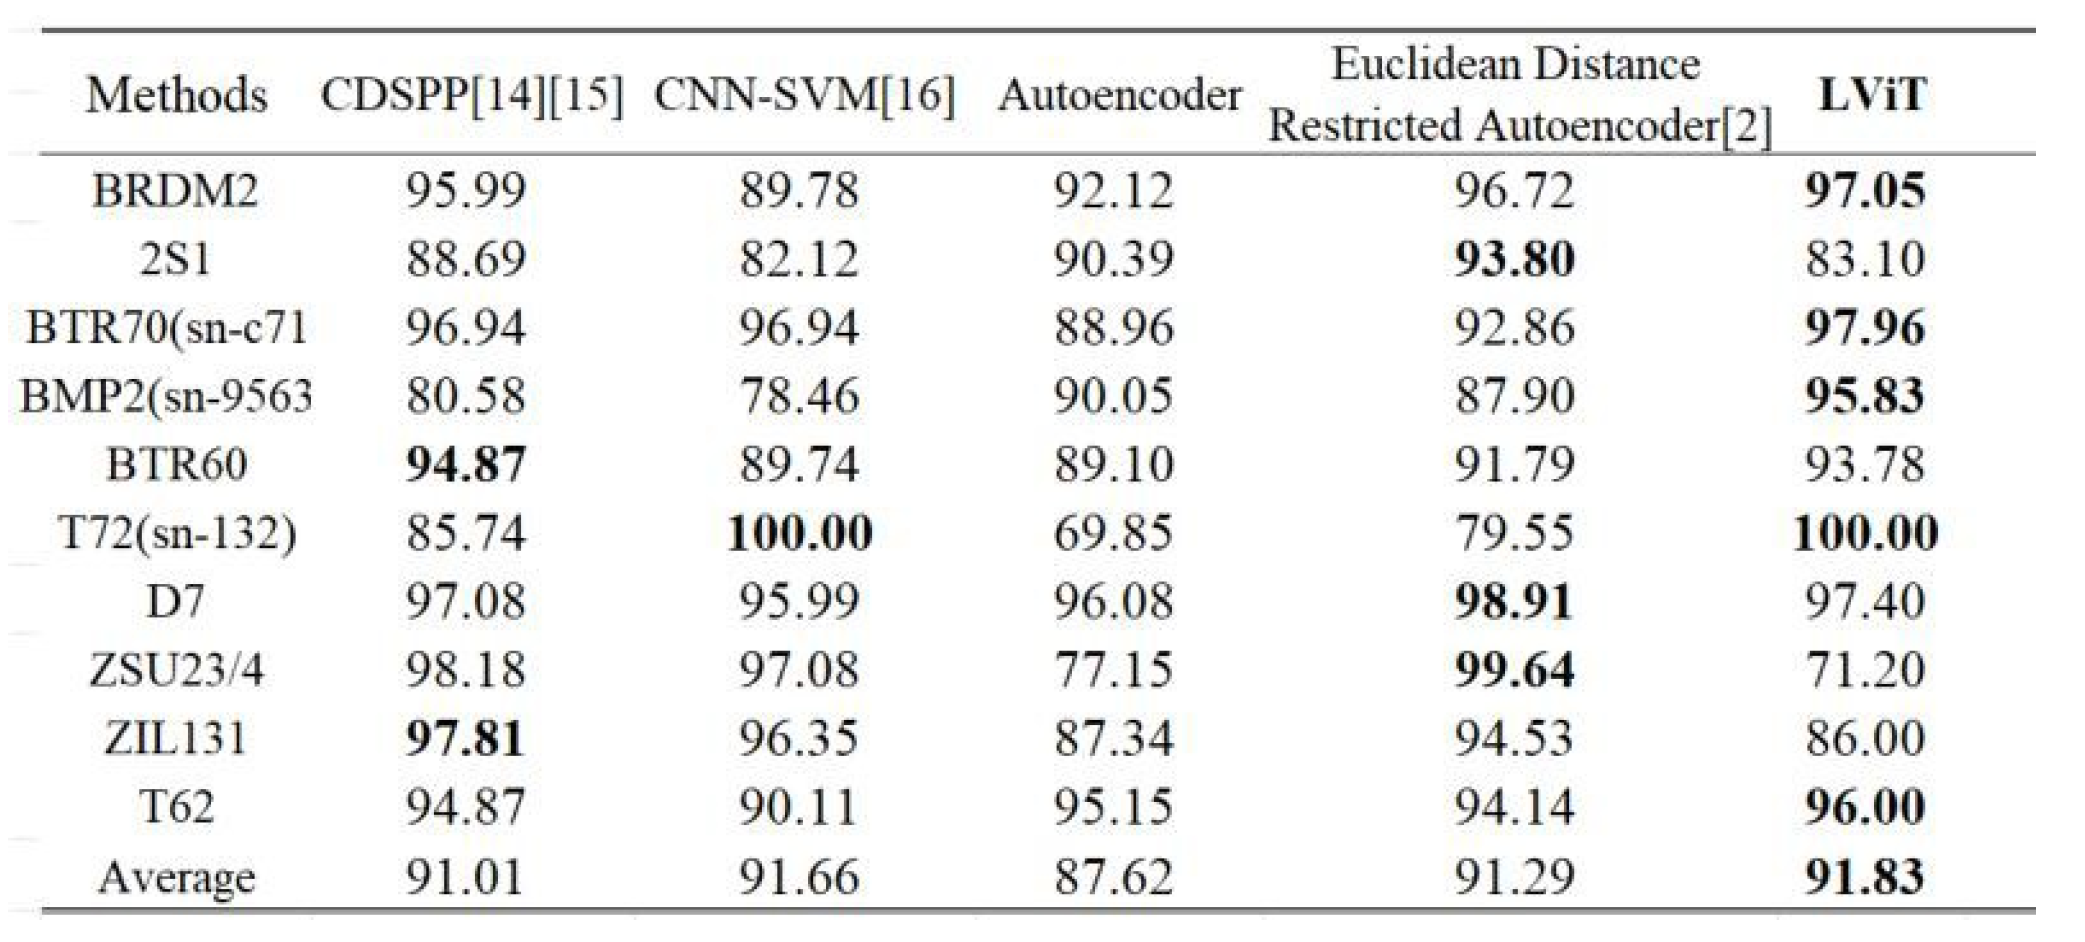
Figure 5. selected some typical experiments throughout these years including conventional methods like CDSPP [14,15] and deep learning‐based methods such as CNN‐SVM [16,17], autoencoder, and its variant [2,18]. It can be found that in comparison with these referred structures, the LViT structure achieved enhanced recognition rates for 5 categories out of 10 together with a better
overall performance [19]. Considering the fact that all outcomes were derived from a structure with lighter layers and without any convolution layers, this result is satisfying [20]. When looking inside each category, it is also found that except for the ZSU23/4 category, the remaining classes generally achieved good results especially the 3 kinds of ar‐ moured carriers (BRDM2, BTR70, BMP2) as well as the T62 tank and the truck. It should also be pointed out that the LViT is expandable in layers and can be further applied to deal with other large scene classification problems or the same SAR image classification task but with more input images. Its promising power in dealing with the future huge
data sets has already been demonstrated in [10,11].
Figure 5.
Different methods of comparison.
IV. Conclusion and Future Work
In conclusion, this study has successfully demonstrated the effectiveness of deep learning-based methods, particularly the lightweight vision transformer (LViT), in enhancing Synthetic Aperture Radar (SAR) Automatic Target Recognition (ATR). This approach has shown significant advantages over traditional network structures like CNNs and RNNs in terms of recognition accuracy and robustness. Deep learning-based methods can benefit the SAR ATR in terms of making researchers free from designing sophisticated feature extraction algorithms. Over the years, many effective neural network structures have been proposed and make the SAR ATR field move forward to the peak. However, all these structures rely on traditional structure-based networks such as CNN and RNN and do not combine the newest technology of deep learning area with the SAR ATR task. In this paper, we applied and tested the power of LViT in classifying the MSTAR data set which shows that this methodology can achieve both good recognition results and robust behavior. For future work, we plan to further advance our research by incorporating multi- view data collection methods, which are expected to enrich the dataset with more diverse and comprehensive perspectives, thereby improving the model’s ability to generalize across different scenarios. Additionally, we aim to integrate deep learning uncertainty metrics into our model. This integration will provide a more nuanced understanding of the model’s confidence in its predictions, potentially leading to more reliable and interpretable results in SAR image classification. These future endeavors will not only refine our current achievements but also pave the way for more sophisticated and efficient SAR ATR systems.
References
- Timothy D Ross, Steven W Worrell, Vincent J Velten, John C Mossing, and Michael Lee Bryant, “Standard sar atr evaluation experiments using the mstar public release data set,” in Algorithms for Synthetic Aperture Radar Imagery V. SPIE, 1998, vol. 3370, pp. 566–573. [CrossRef]
- Sheng Deng, Lan Du, Chen Li, Jun Ding, and Hongwei Liu, “Sar automatic target recognition based on euclidean distance restricted autoencoder,” IEEE Journal of Selected Topics in Applied Earth Observations and Remote Sensing, vol. 10, no. 7, pp. 3323–3333, 2017. [CrossRef]
- Zhongling Huang, Zongxu Pan, and Bin Lei, “Transfer learning with deep convolutional neural network for sar target classification with limited labeled data,” Remote Sensing, vol. 9, no. 9, pp. 907, 2017. [CrossRef]
- Jifang Pei, Yulin Huang, Weibo Huo, Yin Zhang, Jianyu Yang, and Tat- Soon Yeo, “Sar automatic target recognition based on multiview deep learning framework,” IEEE Transactions on Geoscience and Remote Sensing, vol. 56, no. 4, pp. 2196–2210, 2017. [CrossRef]
- Jifang Pei, Weibo Huo, Chenwei Wang, Yulin Huang, Yin Zhang, Junjie Wu, and Jianyu Yang, “Multiview deep feature learning network for sar automatic target recognition,” Remote Sensing, vol. 13, no. 8, pp. 1455, 2021. [CrossRef]
- Zhi Zhou, Zongjie Cao, and Yiming Pi, “Subdictionary- based joint sparse representation for sar target recognition using multilevel reconstruction,” IEEE Transactions on Geoscience and Remote Sensing, vol. 57, no. 9, pp. 6877–6887, 2019. [CrossRef]
- Xiaojie Ma, Kefeng Ji, Linbin Zhang, Sijia Feng, Boli Xiong, and Gangyao Kuang, “An open set recognition method for sar targets based on multitask learning,” IEEE Geoscience and Remote Sensing Letters, vol. 19, pp. 1–5, 2021. [CrossRef]
- Jiaqiu Ai, Yuxiang Mao, Qiwu Luo, Lu Jia, and Mengdao Xing, “Sar target classification using the multikernel-size feature fusion-based convolutional neural network,” IEEE Transactions on Geoscience and Remote Sensing, vol. 60, pp. 1–13, 2021. [CrossRef]
- Xin, Yi, Siqi Luo, Haodi Zhou, Junlong Du, Xiaohong Liu, Yue Fan, Qing Li, and Yuntao Du. “Parameter-Efficient Fine-Tuning for Pre-Trained Vision Models: A Survey.” arXiv preprint arXiv:2402.02242 (2024).
- Yulin Wang, Rui Huang, Shiji Song, Zeyi Huang, and Gao Huang, “Not all images are worth 16x16 words: Dynamic transformers for efficient image recognition,” Advances in Neural Information Processing Systems, vol. 34, pp. 11960–11973, 2021.
- Hanting Chen, Yunhe Wang, Tianyu Guo, Chang Xu, Yiping Deng, Zhenhua Liu, Siwei Ma, Chunjing Xu, Chao Xu, and Wen Gao, “Pre- trained image process- ing transformer,” in Proceedings of the IEEE/CVF Conference on Computer Vision and Pattern Recognition, 2021, pp. 12299–12310. [CrossRef]
- Xin, Yi, et al. “VMT-Adapter: Parameter-Efficient Transfer Learning for Multi-Task Dense Scene Understanding.” Proceedings of the AAAI Conference on Artificial Intelligence. Vol. 38. No. 14. 2024. [CrossRef]
- Feng Yang, Qizhi Xu, and Bo Li, “Ship detection from optical satellite images based on saliency segmentation and structure-lbp feature,” IEEE Geoscience and Remote Sensing Letters, vol. 14, no. 5, pp. 602–606, 2017. [CrossRef]
- Ke Wang, Gong Zhang, Yanbing Xu, and Henry Leung, “Sar target recognition based on probabilistic meta-learning,” IEEE Geoscience and Remote Sensing Letters, vol. 18, no. 4, pp. 682–686, 2020. [CrossRef]
- Ming Liu, Shichao Chen, Jie Wu, Fugang Lu, Jun Wang, and Taoli Yang, “Configuration recognition via class-dependent structure preserving projections with application to targets in sar images,” IEEE Journal of Selected Topics in Applied Earth Observations and Remote Sensing, vol. 11, no. 6, pp. 2134–2146, 2018. [CrossRef]
- Xin, Yi, Junlong Du, Qiang Wang, Ke Yan, and Shouhong Ding. “Mmap: Multi-modal alignment prompt for cross-domain multi-task learning.” In Proceedings of the AAAI Conference on Artificial Intelligence, vol. 38, no. 14, pp. 16076-16084. 2024. [CrossRef]
- Guo F, Wu J Z, Pan L. An Empirical Study of AI Model’s Performance for Electricity Load Forecasting with Extreme Weather Conditions[C]//International Conference on Science of Cyber Security. Cham: Springer Nature Switzerland, 2023: 193-204.
- Dang B, Zhao W, Li Y, et al. Real-Time Pill Identification for the Visually Impaired Using Deep Learning[J]. arXiv preprint arXiv:2405.05983, 2024.
- Li, Shaojie, Yuhong Mo, and Zhenglin Li. “Automated pneumonia detection in chest x-ray images using deep learning model.” Innovations in Applied Engineering and Technology (2022): 1-6. [CrossRef]
- Xin, Yi, Siqi Luo, Pengsheng Jin, Yuntao Du, and Chongjun Wang. “Self- Training with Label-Feature-Consistency for Domain Adaptation.” In International Conference on Database Systems for Advanced Applications, pp. 84-99. Cham: Springer Nature Switzerland, 2023.
Figure 1.
The ten categories of targets in the MSTAR data set with a one-to-one Optical-SAR image match.
Figure 1.
The ten categories of targets in the MSTAR data set with a one-to-one Optical-SAR image match.
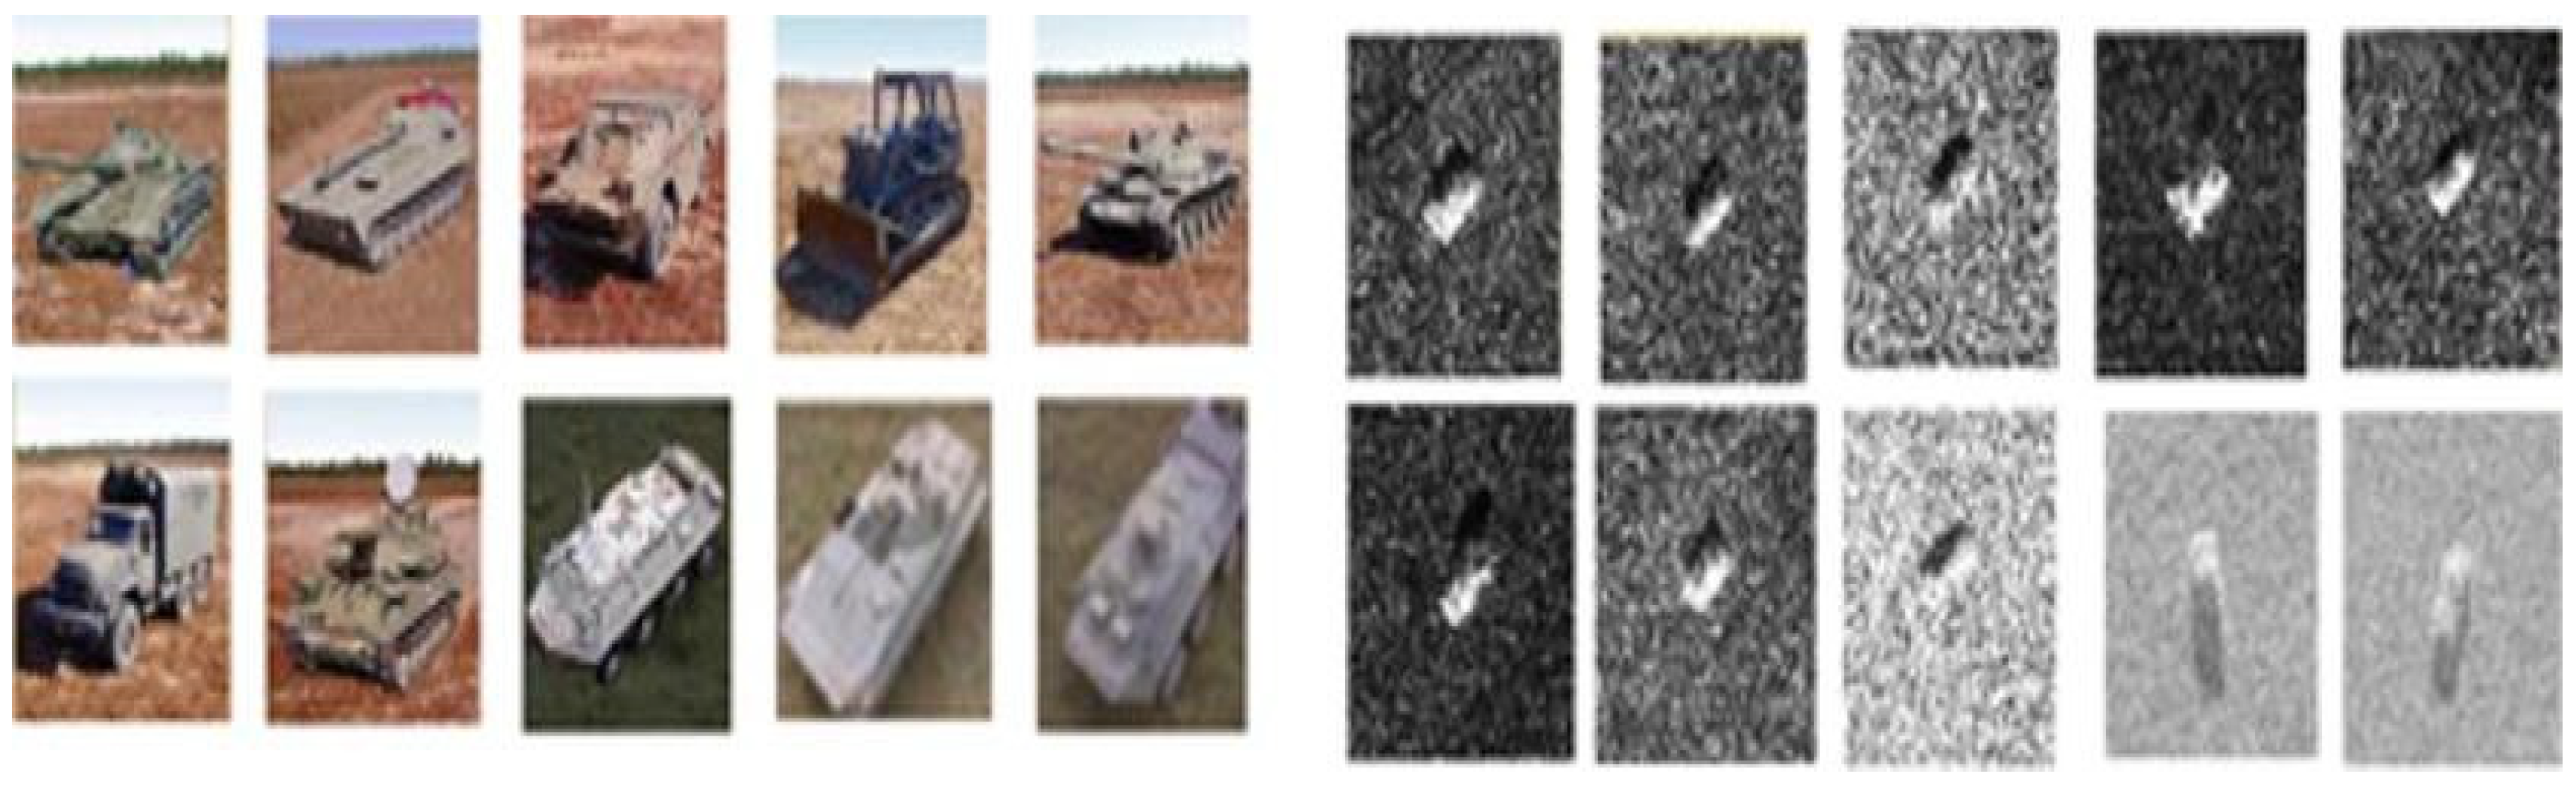
Figure 2.
Overview of the proposed architecture.
Disclaimer/Publisher’s Note: The statements, opinions and data contained in all publications are solely those of the individual author(s) and contributor(s) and not of MDPI and/or the editor(s). MDPI and/or the editor(s) disclaim responsibility for any injury to people or property resulting from any ideas, methods, instructions or products referred to in the content. |
© 2024 by the authors. Licensee MDPI, Basel, Switzerland. This article is an open access article distributed under the terms and conditions of the Creative Commons Attribution (CC BY) license (http://creativecommons.org/licenses/by/4.0/).
Copyright: This open access article is published under a Creative Commons CC BY 4.0 license, which permit the free download, distribution, and reuse, provided that the author and preprint are cited in any reuse.


