Submitted:
21 June 2024
Posted:
24 June 2024
You are already at the latest version
Abstract
Food security is the cornerstone of national security, and exploring the resilience of the grain industry chain is particularly important under the current complex and changing external environment. The study is to evaluate the grain industry chain resilience and identify its influencing factors. Based on the panel data of 30 provinces (cities) in China from 2011 to 2022, this paper adopted Partial Least Squares structural equation modeling method to carry out comprehensive evaluation, applied Dagum Gini coefficient to analyze spatial differences, and used geo-detectors to identify the influencing factors. The results showed that (1) from an overall perspective, the resilience of China's grain industry chain showed an overall upward trend, and each region had been greatly improved; (2) from the perspective of spatial differences, the overall spatial variability of China's grain industry chain is relatively small, and the gap mainly originates from inter-regional differences; (3) from the perspective of influencing factors, the level of grain foreign trade, regional market size and agricultural innovation level were important factors. In order to enhance the resilience of China's grain industry chain, based on the heterogeneous characteristics, the coordinated development of each region should be integrated, and the endogenous power should be given full play to enhance the resilience of the industry chain.
Keywords:
grain industry chain resilience
; PLS structural equation modeling
; spatial variation
; geo-detectors
1. Introduction
Food security is “the most important thing of the country”, and improving the resilience and security level of the food industry chain is an important hand in guaranteeing national food security. At present, the impact of external disturbances such as epidemic shocks, extreme weather and geopolitical risks on the whole grain industry chain has always been a key concern of the state and scholars. In recent years, China’s grain production capacity has continued to improve, the number of deep processing enterprises has increased year by year, the supply structure has been optimized, and the modernization level of distribution has continued to improve. However, the global unprecedented changes have accelerated the evolution of the domestic market supply and demand for food from the stage of structural relative surplus tends to tight balance situation and will be maintained in the medium and long term continuation [1], the uncertainty and instability of the international food market increased significantly, the global food supply chain is facing the risk of decoupling and chain breakage has further increased. Therefore, it is of great significance to study the resilience level of China’s grain industry chain to promote the high-quality development of the grain industry, promote the coordinated development of production and marketing regions, and consolidate the foundation of food security.
In the research of existing scholars, the theoretical research around the connotation of the industry chain resilience definition, formation mechanism, enhancement path and other theoretical research has made a big achievement, which provides a lot of reference for the research of this paper. However, there is little literature on China’s industrial chain resilience level for direct measurement, the relative lack of empirical research, specific to the food industry chain resilience research is even more rare. Especially in the context of the urgent improvement of industry chain resilience and security, there is an urgent need to have a comprehensive understanding of the development level of China’s grain industry chain resilience. Based on this, this paper bases on the four levels of industry chain foundation, risk resistance, adaptive adjustment and innovation and transformation, constructs a comprehensive evaluation index of China’s grain industry chain resilience, comprehensively measures the level of grain industry chain resilience based on China’s data from 2011-2022, analyzes its spatial differences by using the Dagum Gini coefficient, and combines the geographic detectors to identify and diagnose the main factors affecting the resilience of the grain industry chain. There are two possible marginal contributions: (1) to analyze the resilience of the Chinese grain industry chain in depth, focus on the inter-provincial differences in the the grain industry chain resilience in and analyze in depth the intrinsic causes of its spatial differences, so as to provide a reference for the integrated and coordinated development of the grain industry chain resilience in China; (2) to incorporate spatial effects into the scope of analyzing the influencing factors, and to use the geo-detectors to reveal the driving factors of spatial, which can better overcome the problems of multiple covariance and endogeneity than the traditional regression method.
2. Literature Review and Theoretical Analysis
2.1. Literature Review
The word “resilience” is originally from the Latin word “resilire”, which is translated by scholars as “to return to a pristine state”, denoting the ability of a system to recover from an external perturbation [2]. In the field of economics, resilience is often used to characterize the resistance and resilience of an economy to external shocks, and related studies have focused on economic resilience, innovation resilience and system resilience [3,4,5]. With the expansion of the resilience concept in the field of economics, the study of “resilience” has been introduced into the field of industrial economics [6,7]. The resilience issue has been an important concern in economics, but there are relatively few studies on resilience of grain industry chain [8]. Among them, the representative results focus on resilience of grain system and supply chain, including the connotation of grain resilience, resilience measurement and resilience improvement countermeasures.
In terms of the connotation of grain resilience, Tendall et al. [9] were the first to introduce resilience research into the food field, and built up a conceptual framework of food system resilience in their study of food security systems, proposing that food system resilience refers to the ability of a food system to cope with the formation of shocks (internal or external, cyclical or structural, emergent or gradual) by factors such as the natural environment, the political economy, and the socio-economy; Smith et al. [10], using extreme weather events in Australia as a research context, noted that the key elements of food chain resilience include scale, diversity, variety, and cohesion, which are specified as the ability of a system to withstand and recover from disruptions, thereby maintaining essentially the same organizational structure and functional roles; Ivanov et al. [11] studied food supply chain management systems in the context of disruptions to the economy, defining resilience as the ability of an organization or system to regain its full functionality in the face of disruption. Zurek et al. [12] proposed food system resilience consisting of robustness, resilience, and reorientation based on the understanding of food system risks, shocks, and stresses by examining different concepts of resilience. Hui et al. [13] empirically analyzed grain production resilience based on the studies related to resilience and defined food production resilience as the resistance and resilience shown by the food production system in response to external shocks. Chan et al. [14] believed that the resilience and security level of the food industry chain mainly refers to the ability to maintain the stability of the chain when subjected to external shocks, prevent the interruption of key nodes, and be able to quickly adjust after the shock to restore to the operating state, or upgrade and optimize the chain to a more ideal state. Based on this, industry chain resilience is mainly manifested as the infrastructure, resistance, adaptability and change ability of the industry chain. When the grain industry chain responds to impacts and disturbances, the three capacities of resistance, adaptability and change ability exist at the same time, influence each other, and jointly reflect the strength of its own resilience, which is also the core element to test the risk-resistant ability of the resilience industry chain.
In terms of grain resilience measurement, most scholars increasingly recognize that grain industry resilience is a critical path to address the grain security crisis, but there is still a lack of accurate methods to measure grain system resilience. Béné et al. reported that grain system resilience is derived from individual actors and phylogenetic processes, and established a system for assessing grain resilience consisting of absorptive capacity, adaptability and reform capability [15]. Specifically, tangible elements include easily measurable capabilities such as improved farming methods, income levels, livelihood diversification, and safety nets. Additionally, Rimhanen et al. prioritized key variables in constructing a framework for grain system resilience in Finland, valuing as the most crucial factors variety of production, multifaceted, trust-based interaction between actors, independence of external inputs, system comprehension, and domestic renewable energy sources [16].
In terms of grain resilience improvement, Hertel et al. claimed that a resilient grain system needs to be economically resilient, socially resilient and ecologically resilient [17]. The grain industry chain involves multiple links, and enhancing industry chain resilience to better mitigate external shocks and pressures requires consideration of the entire grain industry, including the synergies between the different links and the behavioral activities of the grain system participants [18,19]. When the grain system faces a series of external shocks, participants need to quickly adjust their behavior to respond to external changes, so as to resist the destruction of the expected results, that is, to maintain the status quo as much as possible [20]. There are studies show that agricultural development, increase of farmer income and grain security are closely related, which promoting the organic integration of agricultural development, increase of farmer income and grain efficiency is a crucial route to strengthening the grain security system’s resilience [21,22].
2.2. Theoretical Analysis
Resilience emphasizes more on the system’s capacity to withstand shocks and the adaptability to the new environment, focusing on the evolution process rather than the results. In this study, the grain industry chain’s resilience is defined as “the grain system’s capacity to keep the chain stable in the face of pressures and shocks from the outside and within, i.e., industry basis, resistance, adaptability and reform capability”.
2.2.1. Industrial Basis
The grain industry base is mainly reflected in the logistics base and communication base. The rapid development of modern information technology has prompted all kinds of logistics and communication elements to become the basic carrier linking the upstream and downstream of China’s grain industry chain [23,24].
2.2.2. Resistance
The resistance of grain industry mainly refers to the grain industry chain’s ability to prevent chain breakage underneath the impact of shock disturbances from the environment and the inside. The development of the grain industry chain itself is an important factor influencing the resistance, such as the resource allocation capacity of the industry chain, the industry infrastructure and the completeness of the chain.
2.2.3. Adaptability
The adaptability of grain industry chain mainly refers to the sustainability and restorability of grain industry chain to cope with shocks, the ability of chain operators to make reasonable adjustments of resources, technology and system to adapt to the changes in external environment caused by shocks and maintain the stable operation of full industry chain, including the degree of recovery and adaptation of internal adjustments of each link in the industry chain. Compared with resistance, the difference is that the adaptability of the industry chain is reflected by a major impact during its operation. If any of links fails to recover from an impact, it will cause a knock-on effect across the entire industry chain.
2.2.4. Reform Capability
The reform capability of grain industry chain mainly alludes to the innovation of the grain industrial chain after being affected by shocks and disturbances, which is manifested as a series of comprehensive improvements and technological innovations in grain production methods, business models and services. A huge exogenous shock can make the grain industry chain face a series of problems, in extreme cases, the internal organization of the grain industry chain and the external operating environment will change qualitatively, but this usually also provides new opportunities for the grain industry chain to change and reshape.
3. Methods and Materials
3.1. Methods
3.1.1. PLS Structural Equation
This paper draws on the complex data table analysis method proposed by Guinot et al. [25] to construct a model for measuring the resistance of China’s grain industry chain. The model measures the resistance of the grain industry chain using a second-order model based on PLS structural equations to achieve greater theoretical simplicity and lower model complexity, which is shown in Table 1. In addition, PLS-SEM is more lenient in its requirements for sample size and data distribution, and has a higher reliability of model estimation for models that contain multiple structures and multiple path relationships. In summary, PLS-SEM is very effective in identifying multiple key target structures and their influencing factors, can flexibly set the relationship between model structures and variables, has a high degree of explanation for endogenous variables in the model, and has been widely used in other empirical studies at home and abroad [26,27,28].
3.1.2. Dagum Gini Coefficient and Its Subgroup Decomposition Method
According to Dagum Gini coefficient and its decomposition, the overall source of variation G can be decomposed into the contribution of intra-regional variation G1, the contribution of inter-regional variation G2 and the contribution of hypervariance density G3, and the relationship between the three satisfies G=G1+G2+G3. Usually, the smaller the intra-regional variation and the inter-regional variation, the closer the resilience of the food industry chain is to the intra- or inter-region, and the higher synergy, and vice versa, the lower synergy. The hypervariance density measures the variability of the cross overlapping parts of different regions. The specific formula is shown in Equation (1):
In Equation (1), G is the total Gini coefficient, k is the total number of regions, j and h are the different regions within the k regions, and i and r are the provinces (cities) within the different regions. nj (nh) denotes the number of provinces (cities) within the j (h) region, yji (yhr) denotes the level of resilience of the food industry chain of the provinces (municipalities) within the j (h) region, and denotes the average of the resilience of the food industry chain of each province (cities). Among them, the intra-regional variation contribution G1, inter-regional variation contribution G2 and hypervariable density contribution G3 are shown in Equations (2), (3) and (4), respectively:
In Equation (4), , 且.
3.1.3. Geo-Detectors
The geodetector can effectively detect the spatial dissimilarity of data and measure the driving factors of variables and their contribution based on the similarity of spatial distribution among variables, and it does not need to consider the problem of multicollinearity of the explanatory variables, and it can better avoid the problem of endogeneity that the explanatory variables and the explanatory variables are causal to each other [29]. Therefore, based on the geo-spatiality of the data geo-detectors is selected to study the influencing factors of the resilience of the food chain. Its expression is:
3.2. Data Sources and Indicator Systems
Due to the large number of missing values in Tibet and Hong Kong and Macao Autonomous Region, the paper selects data from 30 provinces and regions in China from 2011 to 2022 to provide a comprehensive evaluation of the resilience of the grain industry chain. The data are mainly from China Rural Statistical Yearbook, China Grain Yearbook, China Agricultural Reclamation Statistical Yearbook, China Regional Economic Statistical Yearbook and China Statistical Yearbook, and statistical methods are adopted to fill in individual missing values.
In the construction of grain industry chain resilience index system, based on the connotation of grain industry chain resilience and referring to the previous research [30,31,32,33], the guideline layer is constructed from four levels, namely, industry chain foundation, risk resistance and adaptive adjustment and innovation and transformation. Among them, the industrial chain foundation mainly refers to the logistics foundation and communication foundation, and five indicators such as railroad business mileage and highway mileage are selected [34]; the risk resistance is mainly the ability to resist shocks when the food system is affected by uncertainties, and four indicators such as sown area of grain and effective irrigated area are selected; the adaptive adjusting power is mainly the adaptive ability of the food system to damage after the shock occurs, and four indicators such as 4 indicators such as agricultural film use and rural electricity consumption; innovation and transformation power is mainly the ability of the food system to recover to the original state or even exceed the original level through adjustment after the shock, and 6 indicators such as total power of agricultural machinery and output value of agriculture, forestry, animal husbandry and fishery are selected. The details are shown in Table 2.
According to the theoretical model, the industrial chain foundation, risk resistance, adjustment adaptability, innovation and creativity together constitute the first-order latent variables, the variables JC1-CX4 are the measurement variables of the first-order latent variables, and the first-order latent variables are constructed to form the second-order latent variables of the resilience of the food industry chain. Among them, the connection relationship between first-order latent variables and measurement variables is Reflective (i.e., pointing from first-order latent variables to measurement variables), the reason is that the measurement variables such as JC1 can reflect but not determine the first-order latent variables such as the foundation of the grain industry chain and the capacity; while the connection relationship between first-order latent variables and second-order latent variables is Formative (i.e., pointing from first-order latent variables to second-order latent variables). The connection between first-order latent variables and second-order latent variables is formative (i.e., from first-order latent variables to second-order latent variables), because the resilience of the food industry chain constructed in this paper consists of topics such as the basis of the industry chain, and the change of the topics will cause the change of conceptual organization. The above measurement variables, first-order latent variables, second-order latent variables, and the connecting relationship between the variables together construct a Reflective-Formative Hierarchical Model in Figure 1, which is suitable for assessment using the Repeated Indicator Approach [35].
4. Results
4.1. Analysis of Spatial and Temporal Differences in the Resilience of China’s Grain Industry Chain
4.1.1. The Results of Composite Indicator Measuring China’s Grain Industry Resilience
- Model fitting results
In this study, SmartPLS3.0 software was used to analyze the data, and the parameter estimation method used was Path Weighting (Path Weighting Scheme), and the self-help sample method (i.e., Bootstrap) was chosen for the significance test of the model parameters. The maximum number of iterations of Path Weighting was set to 300 times, and the number of sampling times of the self-help sample method was set to 5000 times [36], and the factor loading coefficients and the model reliability and validity were obtained through calculations.
As can be seen from Table 3, the factor loading coefficients from the measured variables to the first-order latent variables are mostly above 0.60, and only the factor loading coefficients of cargo turnover (JC3), rural electricity consumption (SY2) and the number of enterprises in the food industry (CX4) are around 0.50, and all of them passed the significance test. Composite Reliable (CR) is a reliable indicator of the internal consistency of the model structure, and the compositional reliabilities CR of the latent variables in the model are all higher than 0.60.Average Variance Extracted (AVE) reflects the convergent validity of the model, and the average In addition, the correlation coefficients between the latent variables are less than the square root of their AVE, indicating that the model meets the requirements of the Fornell-Larcker criterion [37] and has discriminant validity. In summary, the results of model fitting in this paper passed the reliability test.
- 2.
- The results of the composite indicator measuring China’s grain industry resilience
According to the calculation structure of PLS structural equation, the weights of each indicator are obtained in Table 4. For explicit variables, the weight value of an indicator is the proportion of its loading coefficient value in the sum of the corresponding loading coefficients of the same group of explicit variables, and for evaluation dimensions, the weight of a certain evaluation dimension is equal to the proportion of its path coefficient value in the total of the path coefficients of each evaluation dimension. Based on the weights of the indicators, the comprehensive scores of the resilience of the grain industry chain of 30 provinces and regions in China from 2011 to 2022 were calculated.
From the national level, the average value of China’s grain industry chain resilience water rose from -0.20 in 2011 to 0.17 in 2022, with an average annual growth rate of 15.42%, showing a good development trend, indicating that China’s grain industry chain is transforming and upgrading in the direction of stabilization and resilience, but the overall level of resilience is still on the low side, and there is much room for improvement. As can be seen in Figure 2, the index levels of industry chain foundation, risk resistance and innovation and transformation capacity all show a growing trend, which reflects that China’s agricultural infrastructure construction, material resource input and innovation capacity levels have all improved, and the modernization level of the grain industry has accelerated. However, the level of the adjustment resilience index has been showing a downward trend, indicating that the grain industry chain is still characterized by the overuse of chemicals in the production chain, and the green development of the grain industry is facing difficulties.
From the provincial level, China’s grain industry chain resilience level shows obvious differences in different regions due to their different geographic advantages, resource endowments, transportation infrastructures, and market development. As can be seen in Figure 3, the index of the resilience level of the grain industry chain is higher in the eastern and central regions with abundant natural resources, perfect agricultural infrastructure, and a high degree of organization and scale of grain production, such as Shandong, Henan and Jiangsu. In addition, some regions have higher levels of industrialization and service industry, crowding out the factor resources and carrying space for agricultural development, and the resilience level of the food industry chain is lower, such as Beijing, Tianjin and Shanghai. In the western region, the per capita share of agricultural resources is relatively small, the location advantage is not obvious, coupled with backward infrastructure, low degree of mechanization, the resilience level of the food industry chain is relatively low, such as Gansu, Qinghai and Ningxia.
4.1.2. Analysis of Spatial Variation in China’s Grain Industry Resilience
According to the National Bureau of Statistics division standard, China is divided into eastern, central, western and northeastern regions to explore the spatial differences in the resilience level of China’s industrial chain. Dagum Gini coefficient and its subgroup decomposition method were applied to analyze the spatial differences, and the results are shown in Table 5. Among them, the overall Gini coefficient of China’s grain industry chain toughness from 2011 to 2022 is in the range of 0.360 to 0.390, indicating that the overall spatial variability is small. In terms of the contribution rate, the transfer variance contribution rate is the largest, which is around 40% in most years; the intra-regional variance contribution rate and the intra-regional variance contribution rate show opposite trends. Within the study interval, interregional variation decreases year by year, while intraregional variation shows an increasing trend. On the one hand, this indicates that the food industry gap between the four major regions of China is gradually decreasing, and the synergistic development between regions promotes the narrowing of the resilience level of the industry chain between regions. On the other hand, it reflects that the grain industry in individual provinces (cities) within each region needs to be further strengthened, which in turn improves the resilience level of the region.
4.2. Analysis of Factors Affecting the Resilience of China’s Grain Industry Chain
By analyzing the spatial differences in the resilience of China’s grain industry chain, it is found that there are significant spatial differences in the resilience of the grain industry chain between provinces and regions, so it is necessary to further analyze the influencing factors of the resilience of China’s grain industry chain. To this end, the geodetector model is applied to analyze the influencing factors of the grain industry chain resilience in terms of single-factor detection and multi-factor interaction detection, which provides a basis for improving the resilience of China’s grain industry chain.
4.2.1. Selection of Indicators
4.2.2. Analysis of Detection Results
- One-way analysis of variance
The influencing factors need to be discretized before using Geodetector, and the continuity factors are discretized using SPPS27 software and substituted into Geodetector program for Geodetector analysis, and the degree of explanatory power (Q-value) of each influencing factor on the resilience of China’s grain industry chain is finally calculated, and the results are shown in Table 7.
By analyzing the Q value and p value of the explanatory power of the grain industry chain resilience influencing factors, it can be seen that the level of China’s grain industry chain resilience is significantly affected by these five factors. First, the Q value of the regional market size factor is 0.3689, with the strongest explanatory power. Provinces with developed regional market scale have high capital activity, which can not only activate the regional economy and increase investment and consumption, but also provide a good market environment for the development of the grain industry and significantly enhance the grain industry chain resilience. Second, the Q value of the level of foreign trade in grain is 0.3678. From the perspective of the import and export pattern of grain, China is a net importer of grain, but from the perspective of imported grains, China’s external dependence on staple grains is very small, which has an important impact on the enhancement of the resilience of the grain industry chain [40]. Third, the Q value of agricultural innovation level is 0.3551. regions with high innovation level are more likely to use advanced scientific and technological achievements in the grain industry, reduce production costs, improve the grain production mechanism and circulation mechanism, increase grain production efficiency, and then enhance the grain industry chain resilience [41]. Fourth, the Q value of the regional economic level factor is 1513. with the implementation of the strategies of the rise of central China, the development of western China, and the revitalization of northeastern China, the economic development gap between regions is gradually narrowing, and the resilience level of the grain industry chain in the lagging regions is also gradually improving. Fifth, the Q value of the supply of arable land resources is 0.1413. Reasonable utilization of arable land resources and improvement of the arable land protection mechanism ensure the food production capacity of arable land and enhance the resilience level of the food industry chain.
- 2.
- Multifactor interaction analysis
The detection of interaction between multiple factors can identify whether the explanation of the resilience of the food chain will be increased or weakened when different factors work together. There are interactions between the five influencing factors, namely, the level of foreign trade in grain, the supply of arable land resources, the level of regional economy, the size of the regional market, and the level of agricultural innovation, and the types of interactions are two-factor enhancement and nonlinear enhancement, i.e., the explanatory power of the two-by-two interactions of the different influencing factors on the resilience of the agricultural industry chain is greater than that of the single-factor interactions on the resilience of the grain industry chain. According to Table 8, it can be seen that the spatial distribution of China’s grain industry chain toughness in 2022 is affected by the interaction and enhancement effects between different influencing factors. Among them, the explanatory power of the interaction between the level of foreign trade in grain and regional market size, the level of foreign trade in grain and the level of agricultural innovation, and the level of regional market size and the level of agricultural innovation ranked in the top 3, indicating that the level of foreign trade in grain, the level of regional market size, and the level of agricultural innovation have a greater impact on the toughness of China’s grain industry chain.
5. Conclusions and Policy Implications
5.1. Conclusions
This paper explores the resilience of the grain industry chain in 30 provinces (cities) of China from 2011 to 2022, systematically analyzes its spatial differences and main sources by using Dagum’s Gini coefficient and its subgroup decomposition method, and efficiently identifies the influencing factors of the grain industry chain through geodetectors. The main research conclusions are as follows:
First, from an overall perspective, China’s grain industry chain as a whole showed a significant upward trend from 2011 to 2022, and the toughness of the grain industry chain in various regions has been greatly improved. Among them, the average value of Shandong’s grain industry chain toughness is the highest, 1.642, and the average value of Beijing’s grain industry chain toughness is the lowest, -1.094, and the toughness of the grain industry chain in the eastern region is significantly higher than that in the western region.
Second, in terms of spatial differences, the gap in agricultural resilience is larger in the eastern region and the regions, and the gap in resilience of the food chain between the rest of the regions are all in a gradually narrowing trend. Meanwhile, the differences were found to originate mainly from inter-regional differences through the decomposition of the Dagum Gini coefficient and its subgroups.
Third, from the point of view of influencing factors, the level of food foreign trade, regional market size and agricultural innovation level are important factors affecting the resilience of the food industry chain, and the multi-factors interaction detection shows that there are interactions between all five influencing factors, and the types of interactions are two-factor enhancement and nonlinear enhancement.
5.2. Policy Implications
5.2.1. Differentiated Strategies Should Be Formulated to Coordinate Regional Coordinated Development
Different regions should implement differentiated strategies according to local conditions and collaborate to promote the resilience of the grain industry chain. The eastern and central regions can take advantage of their economic development advantages, information technology and scientific and technological innovation advantages, focusing on cultivating leading enterprises in grain processing and circulation, promoting the digital transformation of the grain industry chain, and driving the synergistic development of the main grain-producing areas and the balance of production and marketing areas. The Northeast region should give full play to its resource advantages and location advantages, increase investment in agricultural infrastructure, take up the responsibility of growing food, strive to improve the efficiency of food production, and improve the risk resistance of the food industry chain. Further improve the policy support for the western region, so that it according to their own advantages in the development of mountain agriculture, while increasing the construction of rural road network and information technology to ensure smooth food supply, improve the ability to resist risk impact.
5.2.2. Play the Spatial Effect, Reduce the Inter-Regional Grain Industry Chain Resilience Gap
The level of toughness of the food industry chain has a significant positive spatial correlation, and neighboring regions with higher levels are more likely to influence the region to promote its upward transfer. Therefore, provinces with stable and strong grain industry chains (high-level provinces) should continue to play an advantage, and drive the improvement of the toughness level of grain industry chains in neighboring regions through technical foreign aid, project cooperation and other means. Low-level provinces should capitalize on their strengths and avoid their weaknesses, strengthen cooperation and exchanges with high-level provinces, and learn from advanced experiences and practices. At the same time, attention should be paid to the construction of transportation infrastructure within and outside the region, the Internet and other information technology platforms, narrowing the space-time barriers, promoting the circulation of factors and market links, and thus narrowing the gap in the resilience of the food industry chain between regions.
5.2.3. Adhere to the Innovation-Driven Strategy to Improve the Resilience of the Food Industry Chain
First, increase investment in scientific and technological innovation, strengthen scientific and technological innovation in the seed industry, cultivate high-quality and high-yield varieties of grain; improve the level of agricultural mechanization, enhance the efficiency of grain production; strengthen the application of agricultural information technology and intelligence, comprehensively improve the efficiency and accuracy of grain production, and enhance the risk resistance of the grain industry chain. Secondly, we will build an integrated innovation platform of “industry, academia and research”, cultivate high-level professionals around grain production, storage, processing and circulation, and promote the sustainable, rapid and coordinated development of the grain industry chain. Thirdly, we will carry out in-depth cooperation and exchanges with developed agricultural countries in the fields of breeding, production, deep processing, etc., and draw on the advanced experience and excellent practices of foreign countries to promote the transformation and upgrading of the grain system, and assist the high-quality development of the grain industry.
Author Contributions
Songlin Ma: Conceptualization, Methodology, Formal Analysis, Funding Acquisition, Supervision, Writing—Original Draft; Pingping Wang: Software, Validation, Visualization, Writing—Original Draft.
Funding
This research was funded by the National Social Science Fund of China (Project No. 21BJY023); Major Project of Basic Research in Philosophy and Social Sciences in Higher Education Institutions in Henan Province (Project No. 2024-JCZD-15).
Institutional Review Board Statement
Not applicable.
Informed Consent Statement
Not applicable.
Data Availability Statement
The data presented in this study are available on request from the corresponding author.
Acknowledgments
The authors would like to thank the reviewers for their expertise and valuable input.
Conflicts of Interest
The authors declare no conflicts of interest.
References
- Li, W.; Guo, J.; Tang, Y.; et al. Resilience of agricultural development in China’s major grain-producing areas under the double security goals of “grain ecology”. Environ Sci Pollut Res. 2024, 31, 5881–5895. [Google Scholar] [CrossRef] [PubMed]
- Cheng, L.; Zhang, J. Is tourism development a catalyst of economic recovery following natural disaster? An analysis of economic resilience and spatial variability. Current Issues in Tourism 2020, 23(20), 2602–2623. [Google Scholar] [CrossRef]
- Ma, S.; Huang, J. Analysis of the spatio-temporal coupling coordination mechanism supporting economic resilience and high-quality economic development in the urban agglomeration in the middle reaches of the Yangtze River. PLOS ONE 2023, 18(2), e0281643. [Google Scholar] [CrossRef] [PubMed]
- Suseno, Y.; Standing, C. The Systems Perspective of National Innovation Ecosystems. Syst. Res. 2018, 35, 282–307. [Google Scholar] [CrossRef]
- Zhen, Z.; Wang, F.B. Dynamic Evolution of Resilience of Global Value Chain Systems under the Impact of Adverse Events: A Longitudinal Study Based on Embedding Multiple Cases. China Industrial Economy 2022, 1, 174–192. [Google Scholar] [CrossRef]
- Um, J.; Han, N. Understanding the relationships between global supply chain risk and supply chain resilience: the role of mitigating strategies. Supply Chain Management-an International Journal. 2020, 26(2), 240-255. [CrossRef]
- Sako, M. Technology strategy and management global supply chain disruption and resilience. Communications of the ACM 2022, 65(4), 18–21. [Google Scholar] [CrossRef]
- Golgeci, I.; Kuivalainen, O. Does social capital matter for supply chain resilience? The role of absorptive capacity and marketing-supply chain management alignment. Industrial Marketing Management 2020, 84, 63–74. [Google Scholar] [CrossRef]
- TENDALL, D M; JOERIN, J.; KOPAINSKY, B, et al. Food system resilience: defining the concept. Global Food Security 2015, 6, 17–23. [CrossRef]
- Smith, K.; Lawrence, G.; MacMahon, A.; Muller, J. and Brady, M. The resilience of long and short food chains: a case study of flooding in Queensland, Australi. Agriculture and Human Values. 2016, 33(1), 45-60. [CrossRef]
- Ivanov, D.; Sokolov, B.; Solovyeva, I.; Dolgui, A. and Jie, F. Ripple effect in the time-critical food supply chains and recovery policies. IFAC-PapersOnLine. 2015, 46(3), 1682-1687. [CrossRef]
- Zurek, M.; Ingram, J J A.; Bellamy, A, et al. Food System Resilience: Concepts, Issues, and Challenges. Annual Review of Environment and Resources, 2022. [CrossRef]
- Jang, H.; Chen, Y.; Liu, Z.Y. The spatiotemporal pattern and influencing factors of resilience in China’s grain production. Economic geography. 2023, 43(06), 126-134. [CrossRef]
- Chan, H.Y.; Abdul Halim-Lim, S.; Tan, T.B.; Kamarulzaman, N.H.; Jamaludin, A.A.; Wan-Mohtar, W.A.A.Q.I. Exploring the Drivers and the Interventions towards Sustainable Food Security in the Food Supply Chain. Sustainability 2020, 12, 7890. [Google Scholar] [CrossRef]
- Béné, C.; Frankenberger, T.R.; Nelson, S.; Constas, M.A.; Collins, G.; Langwor-thy, M.; Fox, K. Food system resilience measurement: principles, framework andcaveats. Food Security 2023, 15(6), 1437–1458. [Google Scholar] [CrossRef]
- Rimhanen, K.; Aakkula, J.; Aro, K.; Rikkonen, P. The elements of resilience in the food system and means to enhance the stability of the food supply. Environ Syst Decis. 2023, 43(2), 143–160. [Google Scholar] [CrossRef] [PubMed]
- Hertel, T.; Elouafi, I.; Tanticharoen, M.; Ewert, F. Diversification for enhanced food systems resilience. Nat. Food 2021, 2, 832–834. [Google Scholar] [CrossRef]
- Merkle, M.; Moran, D.; Warren, F.; Alexander, P. How does market power affect the resilience of food supply? Glob. Food Secur. 2021, 30, 100556. [Google Scholar] [CrossRef]
- Gomez, M.; Mejia, A.; Ruddell, B.L.; Rushforth, R.R. Supply chain diversity buffers cities against food shocks. Nature 2021, 595, 250–254. [Google Scholar] [CrossRef] [PubMed]
- Midgley, G.; Rajagopalan, R. Critical Systems Thinking, Systemic Intervention and Beyond. New York: Springer. 2020. [CrossRef]
- Walker, B.; Carpenter, S.R.; Folke, C.; Gunderson, L.; Peterson, G.D.; et al. Navigating the chaos of an unfolding global cycle. Ecol. Soc. 2020, 25, 23. [Google Scholar] [CrossRef]
- Susanna, K.; Fabio, B.; David, R.; Adrian, L.; et al. Implications of a food system approach for policy agenda-setting design. Global Food Security 2021, 28, 100451. [Google Scholar] [CrossRef]
- Li, X.; Lv, X.Y. The assessment of China’s current food security situation: emphasizing both quantity and quality. Issues in Agricultural Economy 2021, 11, 31–44. [Google Scholar] [CrossRef]
- He, Y L; Yang, S C. Research on Resilience Forging of Agricultural Industry Chain in the “Dual Circulation” Scenario. Issues in Agricultural Economy 2021, 10, 78–89. [CrossRef]
- Guinot, C.; Latreille, J.; Tenenhaus, M. PLS Path Modelling and Multiple Table Analysis. Application to the Cosmetic Habits of Women in Ile- de- France. Chemometrics and Intelligent Lab oratory Systems. 2001, 58(2), 247-259. [CrossRef]
- Zomer, T T S.; Neely, A.; Martinez, V. Digital transforming capability and performance: a microfoundational perspective. International Journal of Operations & Production Management. 2020, 40(7-8), 1095-1128. [CrossRef]
- Juan, Ramón.; Gallego, Bono.; MariaR, Tapia-Baranda. A Territorial-Driven Approach to Capture the Transformative Momentum of the Social Economy Especially from the Agricultural Cooperatives. Agriculture 11. 2021, 12, 1281. [CrossRef]
- Peng, B.; Shen, X. Does Environmental Regulation Affect Circular Economy Performance? Evidence from China. Sustainability 2024, 16, 4406. [Google Scholar] [CrossRef]
- Liu, J.; Gong, C.; Wang, S.; Wang, L.; Tan, C.; et al. Spatial differentiation of soil nutrients and their ecological chemometrics based on geographic detector in National Agricultural Park of Tangchang, Southwest China. PLOS ONE. 2024, 19(1), e0294568. [CrossRef]
- Wang, R F.; Wang, Y Y.; Zeng, H R. Empirical Testing of Factors Influencing the High Quality Development of the Grain Industry. Statistics and Decision Making 2021, 37(18), 103–107. [CrossRef]
- Zheng, T.; Zhao, G.; Chu, S. A Study on the Impact of External Shocks on the Resilience of China’s Grain Supply Chain. Sustainability 2024, 16, 956. [Google Scholar] [CrossRef]
- Zhang, Y.; Chen, Y B.; Li, F T. et al. Basic evaluation of national food security industry belt construction based on the entire industry chain. Agricultural Resources and Regionalization in China, 2024, 1-14. Available online: http://kns.cnki.net/kcms/detail/11.3513.S.20230511.1125.004.html.
- Zhang, R.; Zhang, X. Spatial-Temporal Differentiation and the Driving Mechanism of Rural Transformation Development in the Yangtze River Economic Belt. Sustainability 2022, 14, 2584. [Google Scholar] [CrossRef]
- Zhenhong, M. Analysis of the resilience and influencing factors of China’s pig feed industry chain. Feed research 2024, 09, 189–194. [Google Scholar] [CrossRef]
- Becker, J M.; Klein, K.; Wetzels, M. Hierarchical Latent Variable Models in PLS-SEM: Guidelines for Using Reflective-Formative Type Models. Long Range Planning, 2012, 45(5-6), 359-394. [CrossRef]
- Hair, J.; Hollingsworth, C L.; Randolph, A B. et al. An updated and expanded assessment of PLSSEM in information systems research. Industrial Management & Data Systems. 2017, 117(3), 442-458. [CrossRef]
- Fornell, C.; Larcker, D.F. Evaluating Structural Equation Models With Unobservable Variables And Measurement Error. Journal of Marketing Research 1981, 18(1), 39–50. [Google Scholar] [CrossRef]
- Yin, Z.; Wu, J. Spatial Dependence Evaluation of Agricultural Technical Efficiency-Based on the Stochastic Frontier and Spatial Econometric Model. Sustainability 2021, 13, 2708. [Google Scholar] [CrossRef]
- Changsong, L.; Xia, Z.; Yuxi, Z. Spatiotemporal coupling study of agricultural water poverty and grain production vulnerability in China’s main grain-producing areas. Agricultural Resources and Environment 2023, 40(04), 965–975. [Google Scholar] [CrossRef]
- Blackie, M. Michael Ewing-Chow and Melanie Vilarasau Slade (eds): International trade and food security: exploring collective food security in Asia. Food Sec. 2018, 10, 767–768. [Google Scholar] [CrossRef]
- Jian, H.; Xueqing, P. The impact of agricultural science and technology innovation on the high-quality development of the food industry: Based on the panel data analysis of 30 provinces. East China Economic Management 2022, 36(7), 55–64. [Google Scholar] [CrossRef]
Figure 1.
Reflection-Forming Second-Order Model.
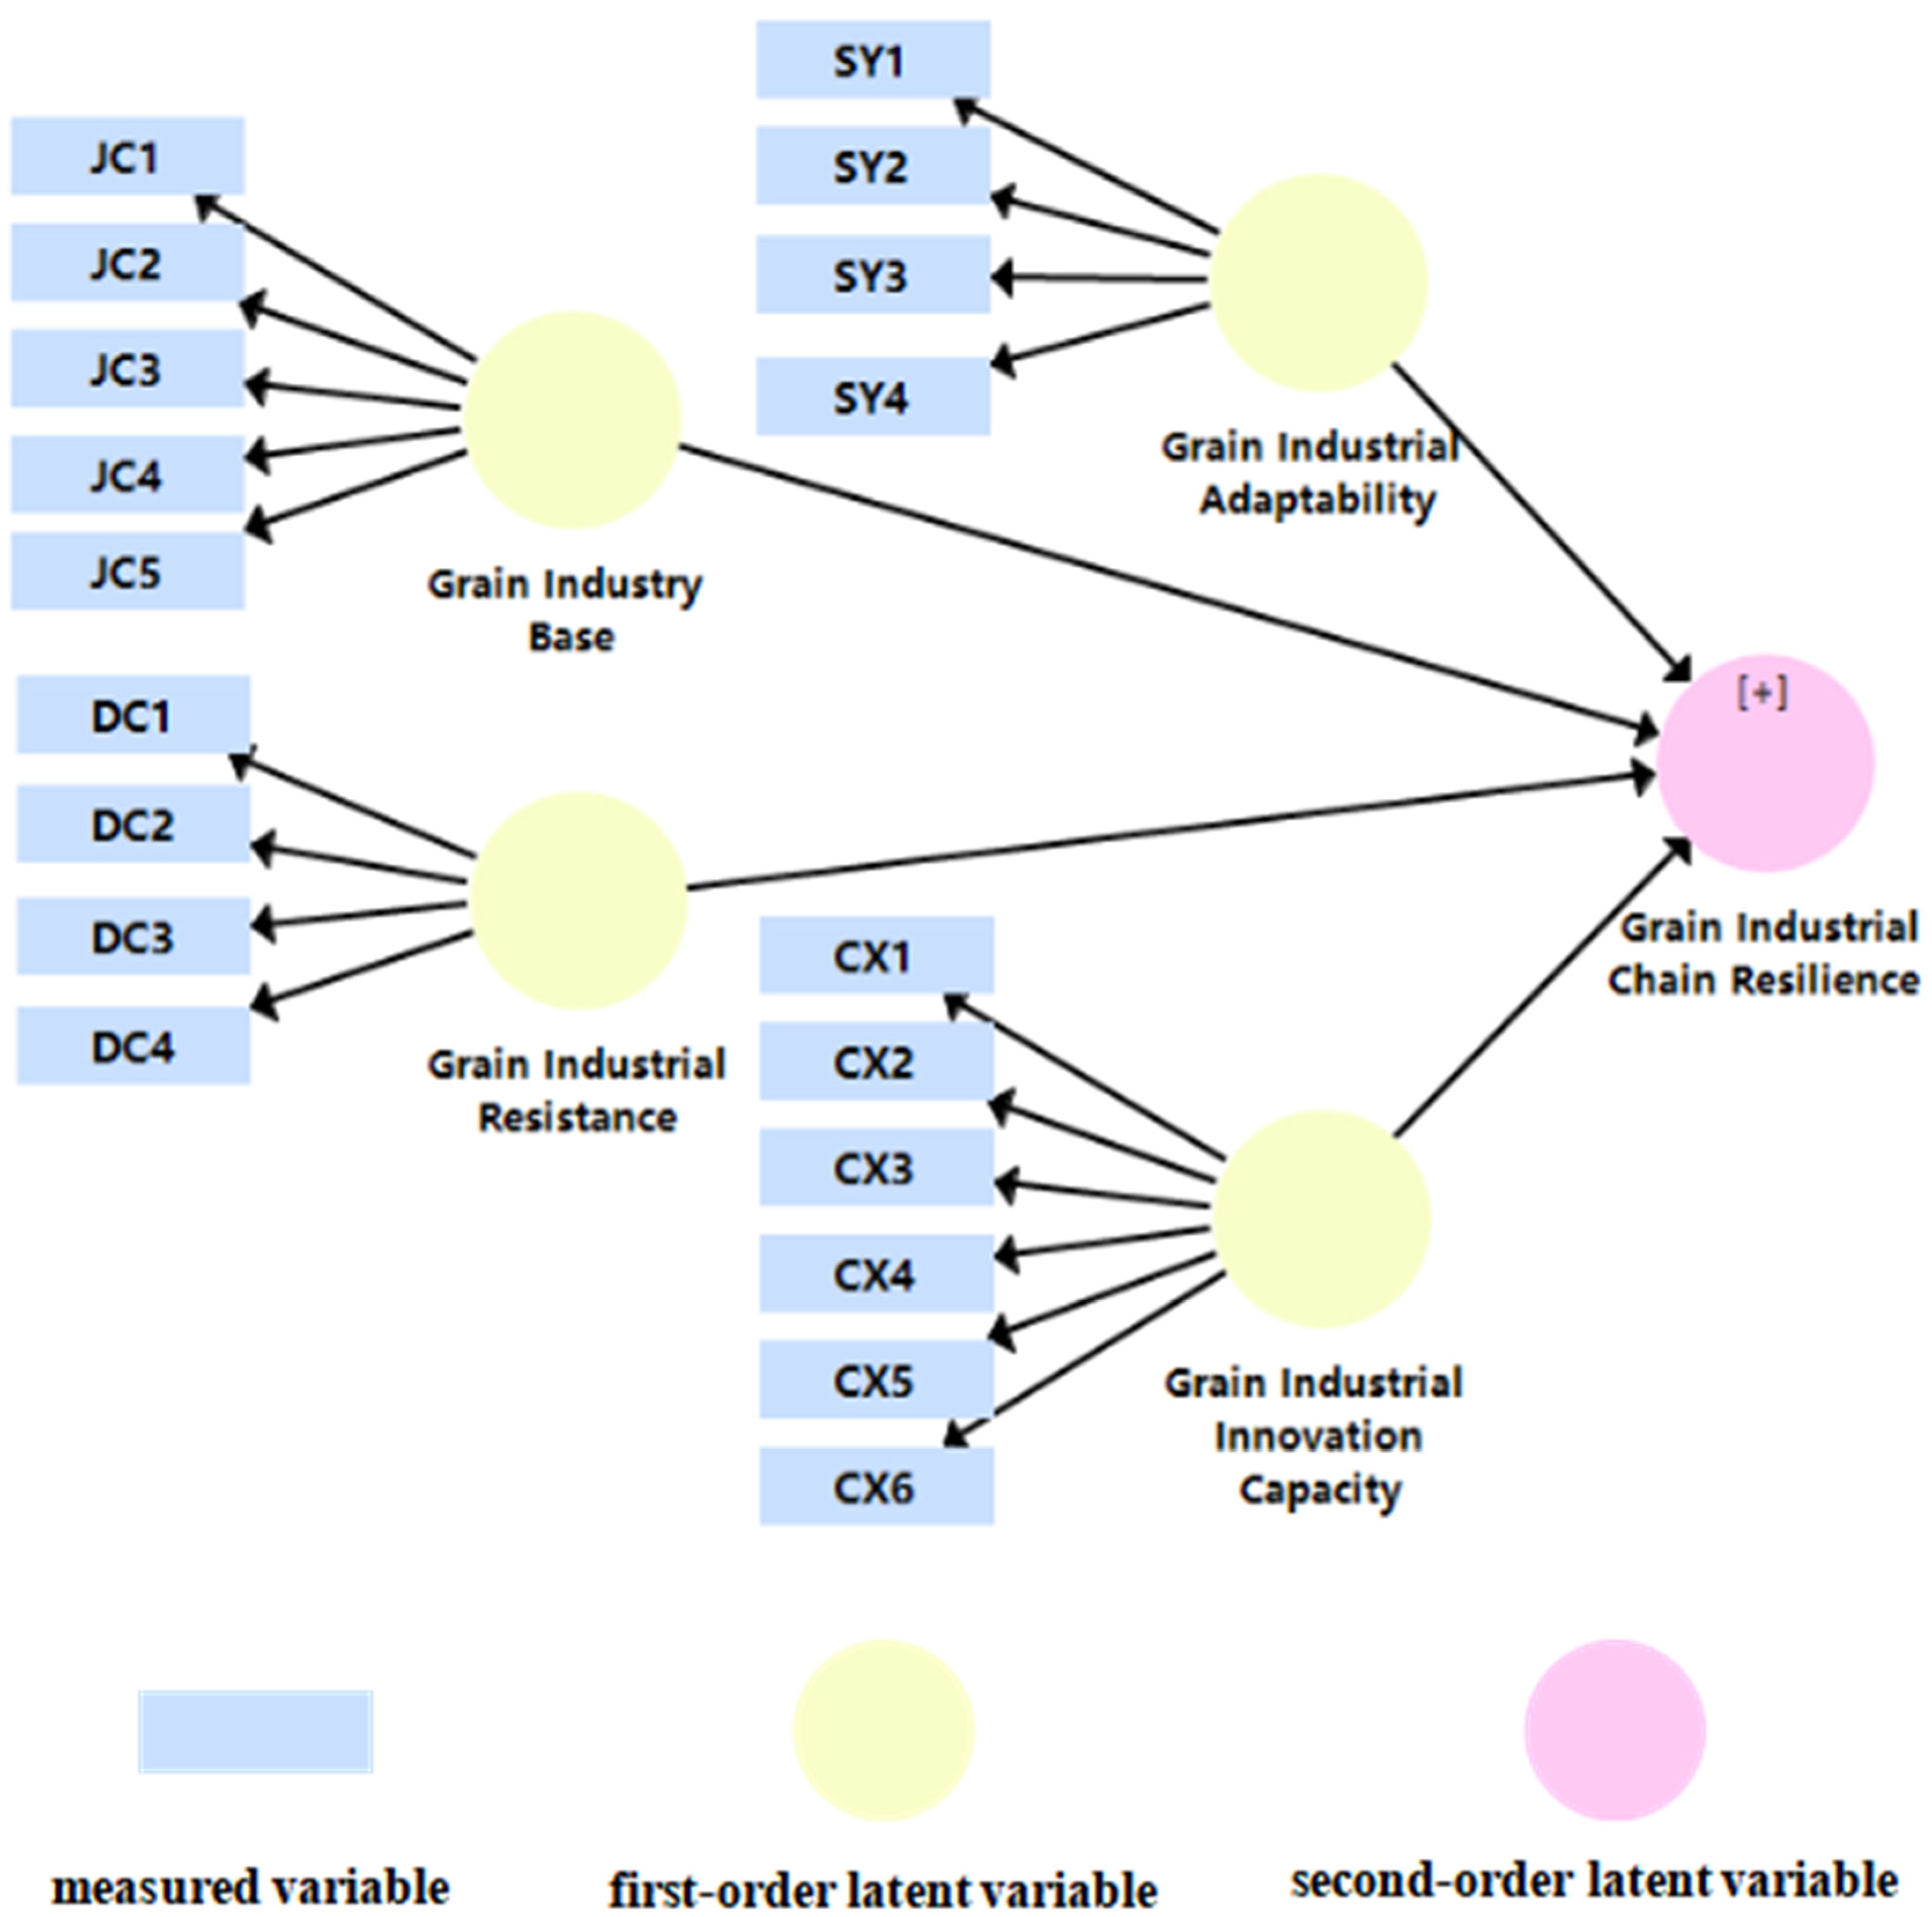
Figure 2.
China’s grain industry chain resilience average in 2011-2022.
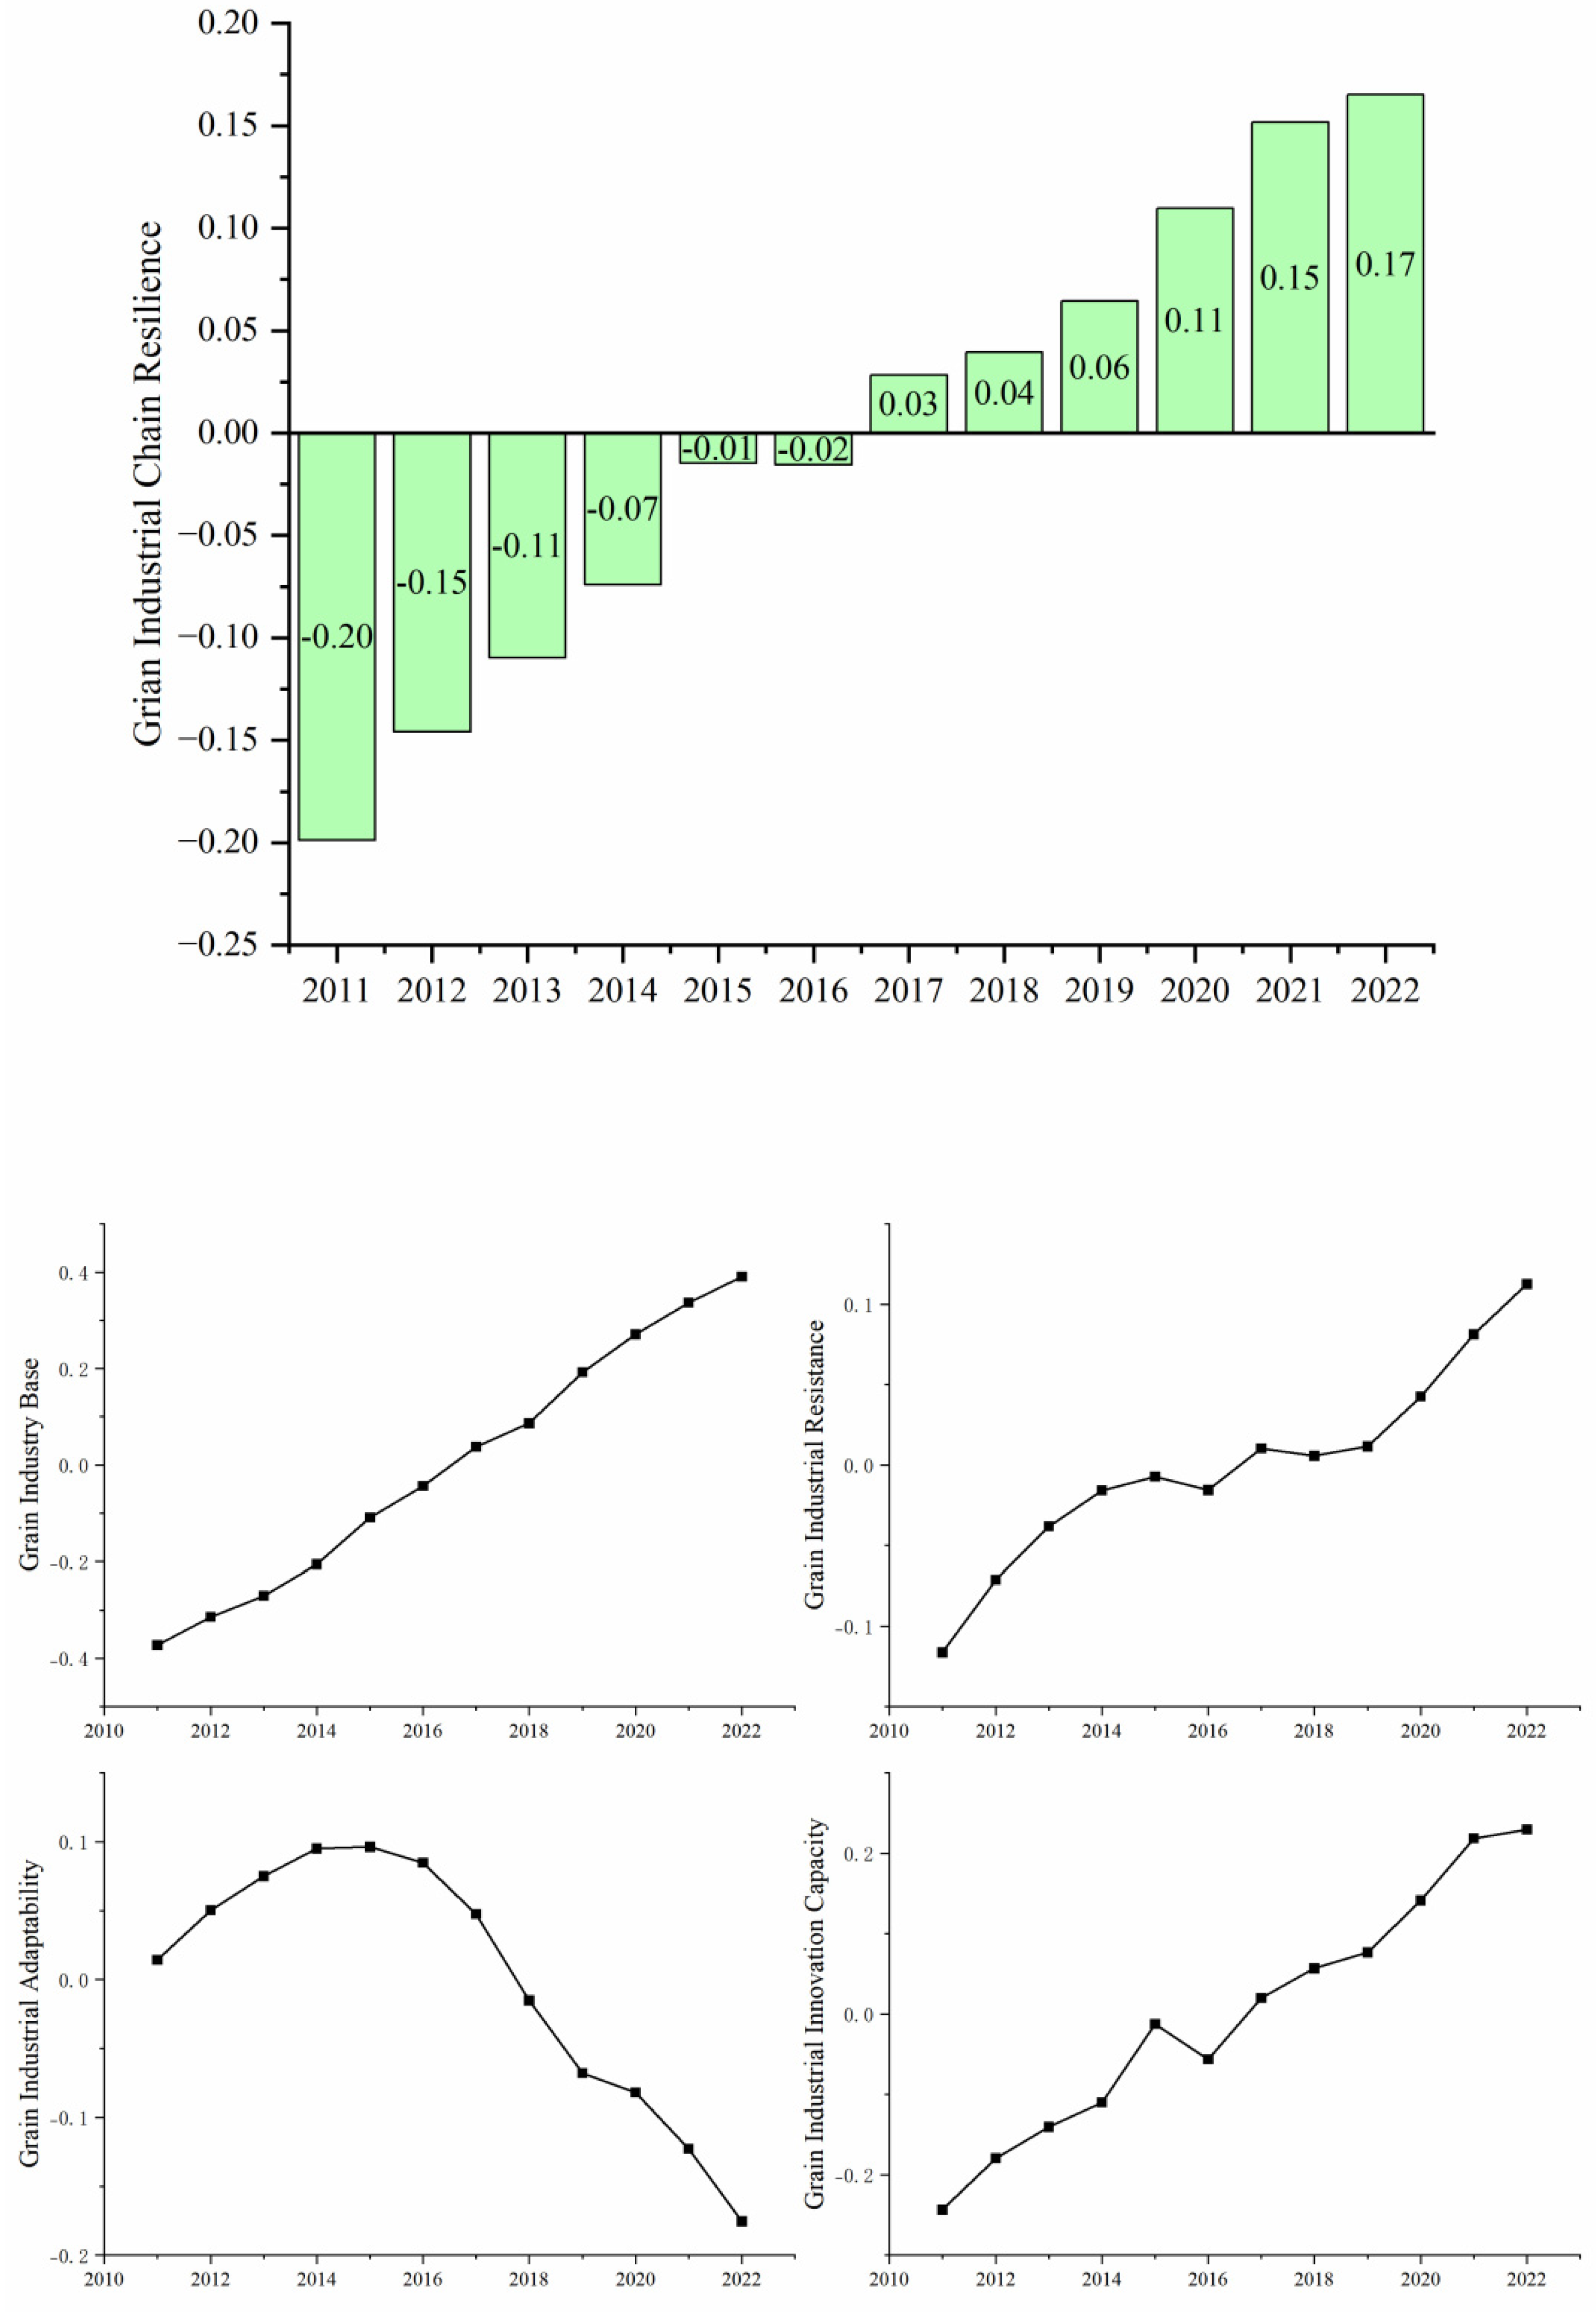
Figure 3.
China grain industry chain resilience composite Score in 2011-2022.
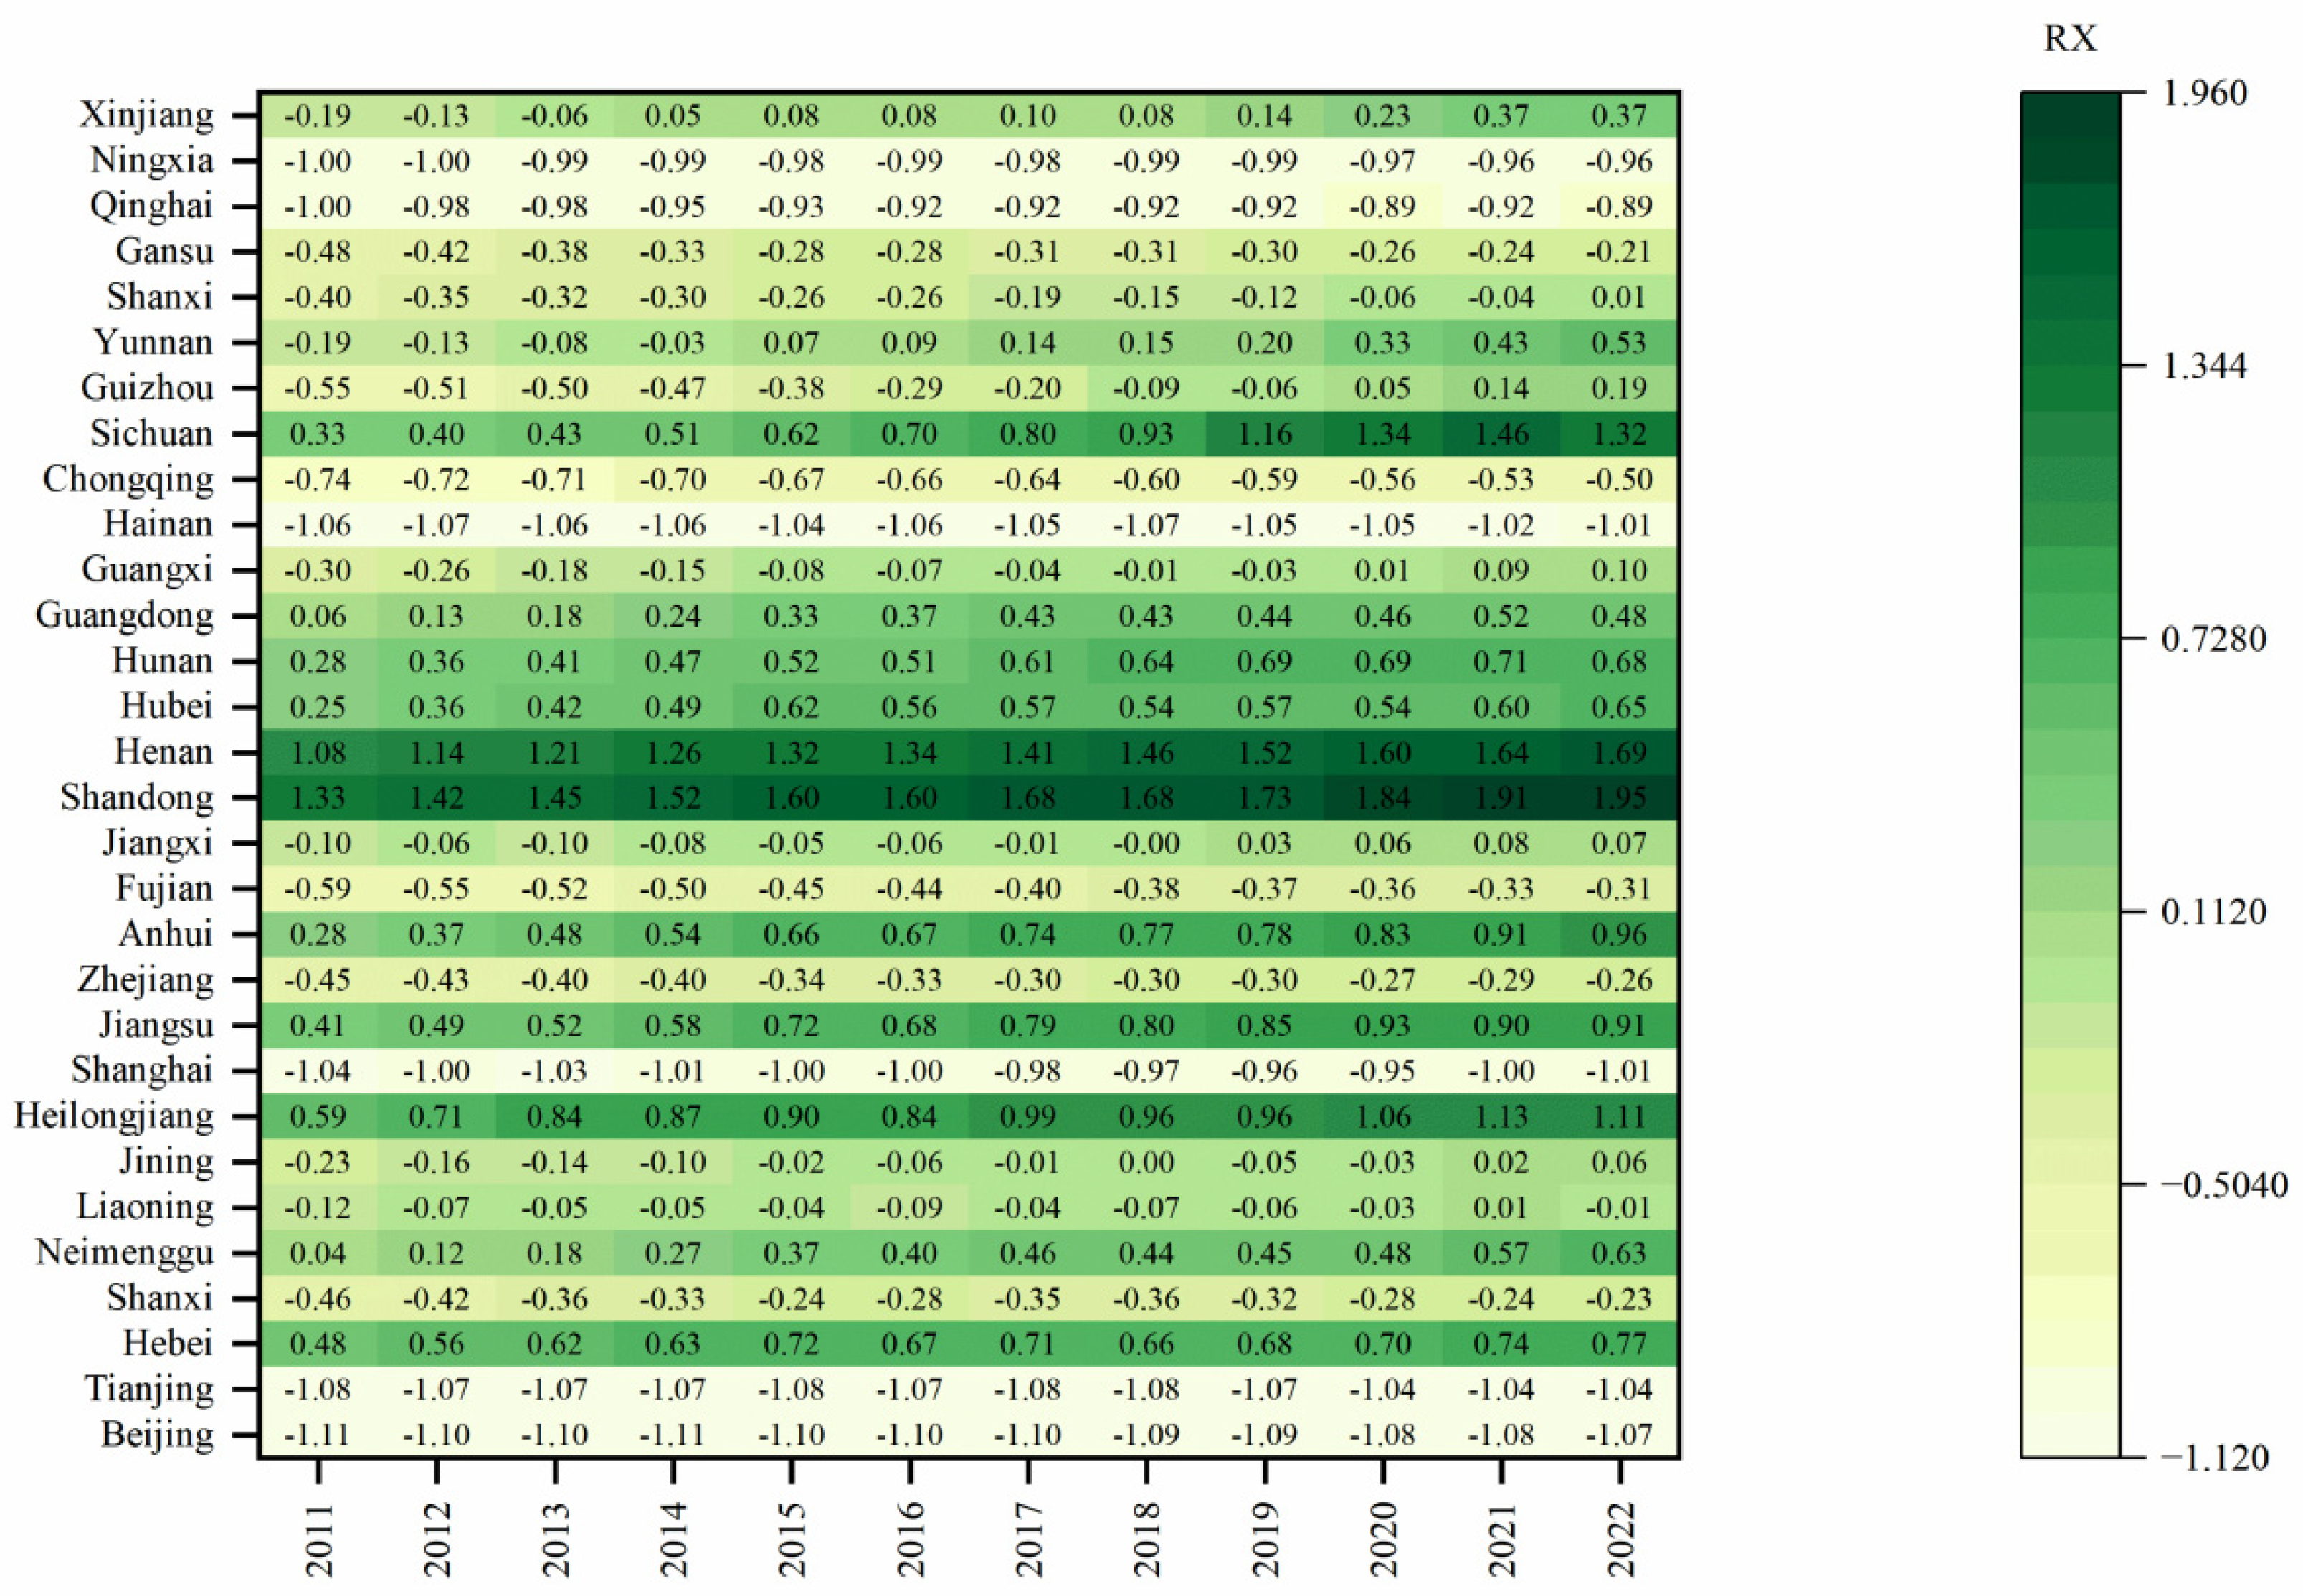

Table 1.
Measurement of grain industry chain resilience based on second-order structural equation modeling.
Table 1.
Measurement of grain industry chain resilience based on second-order structural equation modeling.
| First-order model | Second-order model |
|---|---|
| yi=Λy·ηj+εi yi=manifest variables Λy=first-order latent variable factor loading ηj=first-order latent variable εi=measurement error |
ηj=Γ·ξk+ζi ηj=first-order factor Γ=second-order latent variable factor loading ξk=second-order latent variable ηj=first-order latent variable ζi=first-order factor error |
Table 2.
Comprehensive evaluation index system for the resilience level of the food chain.
| Second-order latent variable | First-order latent variable | Visible-variable | Normative |
|---|---|---|---|
| Grain Industrial Chain Resilience | Grain Industry Basis | JC1 | Railroad operating mileage (10,000 kilometers) |
| JC2 | Road mileage (10,000 km) | ||
| JC3 | Cargo turnover (billion tons kilometers) | ||
| JC4 | Length of long-distance fiber-optic cable lines (10,000 km) | ||
| JC5 | Number of Internet broadband access ports (10,000) | ||
| Grain Industrial Resistance | DC1 | Area sown with grain (thousands of hectares) | |
| DC2 | Effective irrigated area (thousands of hectares) | ||
| DC3 | Value of grain production (billions of dollars) | ||
| DC4 | Total grain production (tons) | ||
| Grain Industrial Adaptability | SY1 | Agricultural film use (tons) | |
| SY2 | Rural electricity consumption (billion kWh) | ||
| SY3 | Fertilizer application (tons) | ||
| SY4 | Pesticide use (tons) | ||
| Grain Industrial Innovation Capacity | CX1 | Total power of agricultural machinery (10,000 kilowatts) | |
| CX2 | Agriculture output (billions of dollars) | ||
| CX3 | Gross output value of the grain and oil industry (billion yuan) | ||
| CX4 | Number of enterprises in the food industry (number) | ||
| CX5 | Profit of food industry enterprises (billions of dollars) | ||
| CX6 | Agricultural technicians (persons) |
Table 3.
The measurement model of resilience of grain industry chain.
| Latent variable | Factor loading | CR | AVE |
|---|---|---|---|
| Grain Industry Base | 0.430-0.765 | 0.834 | 0.530 |
| Grain Industrial Resistance | 0.932-0.981 | 0.983 | 0.934 |
| Grain Industrial Adaptability | 0.454-0.919 | 0.840 | 0.589 |
| Grain Industrial Innovation Capacity | 0.483-0.883 | 0.880 | 0.558 |
Table 4.
Results obtained by the PLS structural equation model.
| Path Relationship | Path Coefficient |
|---|---|
| Grain Industrial Adaptability -> Grain Industrial Resilience | 0.226*** |
| (34.534) | |
| Grain Industrial Innovation Capacity -> Grain Industrial Resilience | 0.356*** |
| (29.384) | |
| Grain Industrial Resistance -> Grain Industrial Resilience | 0.226*** |
| (26.300) | |
| Grain Industry Base -> Grain Industrial Resilience | 0.293*** |
| (27.679) |
Table 5.
Intra-regional differences in China grain industry chain resilience in 2011-2022.
| Year | G1 | Intraregional Gini coefficient | Contribution (%) | |||||
|---|---|---|---|---|---|---|---|---|
| Eastern region | Western region | Central Region | Northeast Region | G12 | G23 | G34 | ||
| 2011 | 0.385 | 0.542 | 0.185 | 0.314 | 0.153 | 25.629 | 36.371 | 38.000 |
| 2012 | 0.379 | 0.536 | 0.180 | 0.310 | 0.151 | 25.605 | 36.378 | 38.018 |
| 2013 | 0.378 | 0.534 | 0.182 | 0.311 | 0.164 | 25.640 | 36.032 | 38.328 |
| 2014 | 0.376 | 0.533 | 0.182 | 0.312 | 0.160 | 25.873 | 34.582 | 39.542 |
| 2015 | 0.369 | 0.526 | 0.176 | 0.309 | 0.149 | 26.044 | 33.978 | 39.978 |
| 2016 | 0.367 | 0.525 | 0.183 | 0.308 | 0.155 | 26.402 | 31.719 | 41.879 |
| 2017 | 0.368 | 0.522 | 0.192 | 0.309 | 0.161 | 26.452 | 30.822 | 42.726 |
| 2018 | 0.367 | 0.521 | 0.197 | 0.308 | 0.162 | 26.612 | 29.540 | 43.847 |
| 2019 | 0.368 | 0.518 | 0.194 | 0.318 | 0.162 | 26.824 | 28.934 | 44.242 |
| 2020 | 0.365 | 0.516 | 0.196 | 0.318 | 0.167 | 27.113 | 28.289 | 44.598 |
| 2021 | 0.365 | 0.518 | 0.194 | 0.323 | 0.166 | 27.247 | 29.072 | 43.682 |
| 2022 | 0.360 | 0.517 | 0.196 | 0.312 | 0.166 | 27.296 | 29.355 | 43.349 |
1 Total Gini coefficient. 2 Differential contributions within regions. 3 Contribution of interregional differences. 4 Transfer Variation Contribution.
Table 6.
Factors affecting the resilience of China’s grain industry chain.
| Influencing factors | Measuring Variables | |
|---|---|---|
| x1 | Level of foreign trade in grain | Foreign trade dependence on grain |
| x2 | Supply of arable land resources | Area of arable land used per unit of grain production |
| x3 | Regional economic level | GDP per capita |
| x4 | Regional market size | Total retail sales of consumer goods |
| x5 | Level of agricultural innovation | Number of patents in agricultural science and technology |
Table 7.
One-Factor Detection Results of China’s Grain Industry Chain Resilience in 2022.
| x1 | x2 | x3 | x4 | x5 | |
|---|---|---|---|---|---|
| Q statistic | 0.3679 | 0.1413 | 0.1513 | 0.3689 | 0.3551 |
| p value | 0.0278 | 0.0451 | 0.0344 | 0.0322 | 0.0355 |
Table 8.
One-Factor Detection Results of China’s Grain Industry Chain Resilience in 2022.
| A∩B=Q | A+B | Comparative results | Interact Result |
|---|---|---|---|
| x1∩x2=0.6239 | x1+x2=0.5093 | Q>A+B>x1,x2 | Enhance, nonlinear |
| x1∩x3=0.4388 | x1+x3=0.5192 | A+B>Q>x1,x3 | Enhance, bi- |
| x1∩x4=0.7253 | x1+x4=0.7368 | A+B>Q>x1,x4 | Enhance, bi- |
| x1∩x5=0.7008 | x1+x5=0.7231 | A+B>Q>x1,x5 | Enhance, bi- |
| x2∩x3=0.3771 | x2+x3=0.2927 | Q>A+B>x2,x3 | Enhance, nonlinear |
| x2∩x4=0.4515 | x2+x4=0.5102 | A+B>Q>x2,x4 | Enhance, bi- |
| x2∩x5=0.3820 | x2+x5=0.4965 | A+B>Q>x2,x5 | Enhance, bi- |
| x3∩x4=0.6016 | x3+x4=0.5202 | A+B>Q>x3,x4 | Enhance, nonlinear |
| x3∩x5=0.6089 | x3+x5=0.5065 | Q>A+B>x3,x5 | Enhance, nonlinear |
| x4∩x5=0.6311 | x4+x5=0.7240 | A+B>Q>x4,x5 | Enhance, bi- |
Disclaimer/Publisher’s Note: The statements, opinions and data contained in all publications are solely those of the individual author(s) and contributor(s) and not of MDPI and/or the editor(s). MDPI and/or the editor(s) disclaim responsibility for any injury to people or property resulting from any ideas, methods, instructions or products referred to in the content. |
© 2024 by the authors. Licensee MDPI, Basel, Switzerland. This article is an open access article distributed under the terms and conditions of the Creative Commons Attribution (CC BY) license (https://creativecommons.org/licenses/by/4.0/).
Copyright: This open access article is published under a Creative Commons CC BY 4.0 license, which permit the free download, distribution, and reuse, provided that the author and preprint are cited in any reuse.


