Submitted:
20 June 2024
Posted:
22 June 2024
You are already at the latest version
Abstract
This research provides an in-depth analysis of drought impacts in West Pokot, Kenya, utilizing both remote sensing surveys and focus group discussions. The study commenced by assessing the impact of drought on vegetation health via spatial sensors. It then utilized surveys and focus group discussions (FGDs) to engage farmers from the most drought-affected areas in Kacheliba and Sigor sub-counties. The analysis of remote sensing data from 1990 to 2022 highlighted that Sigor and Kacheliba experienced significant drought events during the years 1995, 2000, 2002, 2005, and 2009, and 1991, 1995, 2000, 2005, and 2019, respectively. This study delves into both the meteorological and socio-economic effects on local communities. Using the Multinomial Logistic Regression (MLR) model with the glm function, the research uncovered the impacts of so-cio-economic factors and agricultural practices on household livestock production. Additionally, the study employed Multiple Correspondence Analysis (MCA) to explore the dynamics between livestock production, community resilience, and crop production. The findings underscore the urgent need for tailored interventions to enhance community resilience in the face of increasing climatic extremes, serving as a blueprint for similar arid and semi-arid regions worldwide.
Keywords:
Climate Change
; Adaptive Capacity
; Resilience
; Remote Sensing
; Developing Countries
; Multinominal Logistic Regression
; Multiple Correspondence Analysis
1. Introduction
Climate variability and change represent significant threats to food security in many African countries and other regions of the developing world. The impact of climate change has proven particularly challenging for nations with a large dependency on rain-fed agriculture [1,2,3,4]. These countries are highly sensitive to changes in rainfall patterns, which directly affects their agricultural output and food security. According to Obwocha et al. [5], the economies of many African countries [5,6] are heavily based on agriculture and predominantly reliant on smallholder farming households. This dependency makes them particularly vulnerable to climate variability and change. The complexity of African agro-ecologies, combined with the absence of long-term rainfall data from the past century in many regions, underscores the importance of understanding community-based resilience and adaptation strategies in the face of these challenges [7,8,9,10,11].
Unlike the views presented by Skogseid [12], this study posits that a deep understanding of the local knowledge that farmers have about their environments [13, 14] can lead to more accurate predictions of the effects of climate change and variability on smallholder farming systems. Furthermore, it can facilitate the implementation of optimized resilience mechanisms. By leveraging this localized knowledge and understanding, the development and application of adaptive and resilient agricultural practices can become an attainable goal for our time, enhancing the ability of these communities to cope with the increasing unpredictability of climate impacts. A sustainable livelihoods and landscapes in smallholder systems includes improving targeted outcomes that positively influence communities' ability to overcome climate-related constraints and other development barriers [15]. Among the targeted outcomes include community proactive and dynamics preparedness approach [16, 17].
Arid and Semi-Arid Lands (ASAL) are among the most vulnerable areas to climate variability and change [7]. The population residing those areas often exposed to food shortages [18], leading to food insecurity and its negative impact on livelihood [18, 19]. These areas are subject to rise in temperature and change in precipitation patterns [20]. Such impacts have altered potential crop yield through short-term crop failures and long-term production declines [21], hence, increasing vulnerabilities for smallholder farmers in developing countries [22]. East Africa's ASAL area is famous for its abundant land and animal resources. Extreme drought and flooding in recent years has led East Africa ASAL community into its most severe food security crisis in 20 years, with over 11.5 million people requiring food aid in Tanzania, Kenya, and Uganda [23]. Kenya, in particular, has faced frequent and chronic droughts and floods threatening livelihoods and the environment, resulting in the highest economic drop in gross domestic product (GDP) [24].
Despite its rich agricultural productivity history [7], recent drought events have left around 3.5 million people (24% of Kenya's ASAL population) facing high levels of acute food insecurity, with approximately 2.7 million people in Integrated Food Security Phase Classification (IPC) Phase 3 (Crisis) and 785,000 people in IPC Phase 4 (Emergency) [25]. Additionally, dams and water pans in the ASAL region of Kenya had dried up [25], further impacting agriculture, livestock health, and community well-being especially with 93% of cultivated land in sub-Saharan Africa being rainfed [27, 28, 29].
Moreover, countries highly dependent on rain-fed agriculture, such as Kenya, face significant threats due to changes in rainfall patterns [30,31,32,33]. Rains in Kenyan West Pokot County have been erratic and scarce, significantly reducing crop yields and severely affecting pastoralists who had little time to recover from the recent heavy droughts, floods and subsequent locust infestation [34]. Poor rainfall distribution and inter-seasonal dry spells have further exacerbated the challenges of food security and income among many farming families in West Pokot [35,36,37]. Most communities in the affected West Pokot County lack sufficient food reserves to survive until the next harvest, aggravating the depletion of pastures and water availability in the southern and eastern zones of the country. Vulnerable groups, particularly women, children, and the elderly in West Pokot, are the most affected, with the remaining healthy livestock either sold or permanently moved to areas with greener pastures, even across the border to Uganda [38, 39].
Spatial tools have recently proven to be crucial in understanding community-based resilience and developing adaptation strategies. Satellite-based remote sensing and Geographic Information Systems (GIS) are used to monitor various environmental phenomena, including drought, and to assess their repercussions on agricultural production [40,41,42,43]. According to Huang et al. [44], the application of remote sensing and GIS can significantly enhance the assessment and monitoring of climate variability. This enhancement is evident in the accuracy of results, the breadth of information obtained, and the temporal availability of data, among other factors. To achieve this aim, various drought monitoring indices from satellites and other data sources have been explored. Common methods for drought monitoring include the vegetation index, canopy temperature, thermal inertia, and microwave remote sensing [45]. The Vegetation Health Index (VHI) approach has demonstrated high reliability in monitoring agricultural drought [46], and the use of remote sensing to assess crop productivity has proven invaluable in preventing and managing acute food crises [47]. Other indices, such as the Crop Moisture Index (CMI) and the Palmer Drought Severity Index (PDSI), are used to determine the timeline for emergency drought assistance and to reflect short-term moisture conditions in targeted areas [48,49,50]. To assess the impacts of drought on agricultural production in West Pokot, the VHI, which combines the effects of leaf surface area and temperature on vegetation, offers enhanced reliability. In addition to using spatial tools, understanding community-based resilience and adaptation strategies involves engaging with the community in the study.
Petersen et al. [52] identified land-use and land-cover (LULC) changes and their drivers in Pokot Central (one of the West Pokot sub-counties) from 1986 to 2017 by integrating local knowledge with remote sensing. The study detected significant LULC changes in 41% of the area investigated. It revealed that bush encroachment into former pastures was the dominant change, with woodland increasing by 39% and grassland decreasing by 74%. A similar study conducted by Obwocha et al. [5] emphasized that to build resilient food systems, understanding local knowledge and perceptions of the relationships between climate change and variability, land use decisions, and food (in)security is critical to farmers' decisions in sub-counties. This is particularly true in areas with low average annual rainfall (mm) and high land cover (area in square meters), such as Kacheliba sub-county, West Pokot. Therefore, the study will conduct surveys and focus group discussions (FGDs) targeting regions and communities affected by extreme droughts.
Therefore, the study will conduct surveys and focus group discussions (FGDs) targeting regions and communities affected by extreme droughts. Disasters are not a recent phenomenon, yet there is limited literature that highlights both the challenges and the community-based resilience against the adverse impacts of disasters on local populations, especially in the southern hemisphere. Community-based resilience approaches have provided local communities with unique survival strategies against formidable challenges, including resource scarcity [53, 54], inadequate awareness strategies [55, 52], and high illiteracy rates, with West Pokot having a 67% illiteracy level [56]. Integrating both spatial tools and qualitative approaches will aid in understanding how communities develop resilience and adapt in the face of increasing climate change and variability.
2. Study Framework and Methodology
2.1. Study Area
West Pokot County encompasses three main livelihoods: pastoral, agro-pastoral, and mixed farming. Bordered by Trans Nzoia County to the south, Turkana County to the north, Baringo County to the east, Elgeyo-Marakwet County to the southeast, and Uganda to the west, West Pokot is predominantly inhabited by the Pokot ethnic group. As depicted in Figure 1, the county is divided into four sub-counties: West Pokot (Kapenguria), North Pokot (Kacheliba), Central Pokot (Sigor), and South Pokot (Chepareria). These areas have frequently experienced drought disasters, especially in the western region of Kenya. The indigenous Pokot people classify their land based on altitude, rainfall, and agricultural potential [5]. According to the Pokot land classification system, Kacheliba and Sigor are categorized under the “Tow” type, which is characterized by low agricultural potential. These areas are primarily used for pastoralism and grazing livestock, including goats, sheep, and cattle. Crop cultivation is limited, focusing mostly on drought-resistant varieties, and the land is less protected from harsh weather conditions.
Pokot Central, also known as Sigor, is a predominantly agricultural sub-county in West Pokot County. It is geographically bordered by Masol Hill to the east, Cherangani Hill to the south, and Sekerr Hill to the west, with coordinates ranging from 1°24' to 1°48' N latitude and 35°25' to 35°41' E longitude. Sigor comprises 12 locations and 45 sub-locations, primarily inhabited by a rural population. The area experiences significant interannual and spatial variability in precipitation, ranging from 400 mm in the lower plains to 1,200 mm in the higher altitudes, distributed across two main rainy seasons [57]. The diverse topography of Sigor, from flat plains to rolling hills, influences agricultural productivity and water availability. Sigor is home to several ethno-linguistic groups, predominantly the Pokot, who constitute the majority of the population. According to the 2019 census, the sub-county has a population of 119,016 [58, 59]. The residents primarily engage in agro-pastoral activities, including mixed farming and livestock rearing, with agricultural practices adapted to varied climatic conditions. Farmers grow drought-resistant crops in the drier areas and more diverse crops in regions with higher rainfall. Livestock rearing, focusing on goats, sheep, and cattle, is a critical component of the local economy.
North Pokot, often referred to as Kacheliba, is a predominantly pastoral sub-county within West Pokot County. It is bordered by the Turkwel River to the south, the Uganda border to the west, and the expansive Suguta Valley to the north, with coordinates ranging from approximately 1°48' to 2°24' N latitude and 34°47' to 35°25' E longitude. North Pokot is composed of 9 locations and 34 sub-locations, featuring a rural and semi-nomadic population. The region experiences significant precipitation variations, from as low as 250 mm per year in the arid lowlands to around 900 mm in the more elevated areas, distributed across two main rainy seasons [57]. The diverse topography, including arid flatlands, rugged hills, and occasional lush highlands, greatly influences these climatic disparities, impacting water availability and vegetation types. North Pokot is home to several ethno-linguistic groups, predominantly the Pokot. According to the 2019 census, the sub-county has a population of approximately 133,505 [58, 59]. The inhabitants primarily depend on pastoralism, focusing on herding livestock such as goats, sheep, camels, and cattle, with practices well adapted to the harsh and variable climatic conditions. Limited agricultural activities occur, mainly as rain-fed farming along riverbanks and in favorable microclimates, where drought-resistant crops like sorghum, millet, and maize are grown. Livestock rearing remains the backbone of the local economy, emphasizing indigenous breeds resilient to the semi-arid climate. These practices are crucial for livelihood and hold significant cultural and social value for the Pokot community, central to their traditional lifestyle and social structure.
2.2. Data Sources and Sampling Procedures
2.2.1. Data Sources
1.Geographic Information Systems (GIS) and VHI: To understand how the communities in Sigor and Kacheliba develop resilience and adapt in the face of 'extreme' and 'severe' weather events, GIS was useful in the mapping of the West Pokot County and the area at hand and using satellite imageries from the period 1990 to 2022. Landsat images utilized in this study comprise high-resolution satellite imagery sourced from the U.S. Geological Survey website 60. These images, characterized by a spatial resolution of 30 m, are provided in a standardized, orthorectified format. This study encompassed the entire twelve-month period, a necessity driven by the prolonged duration of drought disaster events. The analysis of vegetation health using the Vegetation Health Index (VHI) in Google Earth Engine (GEE) comprised several processing steps [43]. Initially, satellite imagery from Landsat was imported. Images with a substantial cloud cover percentage were excluded to ensure that datasets from four distinct satellites accurately represented the land surface without interference from clouds. Following the application of cloud masking, the Normalized Difference Vegetation Index (NDVI) or the Vegetation Health Index (VHI) was calculated. This data was processed using GIS to pinpoint areas most affected by these climatic extremes.
2.Meteorological Trends: Accurate data on precipitation and temperature play a pivotal role in monitoring drought conditions, exerting profound impacts on agriculture, water supplies, and ecosystems. Precipitation data provides insights into the moisture quantity within an environment, aiding in assessing whether an area receives sufficient rainfall to sustain plant growth and replenish water sources. Conversely, temperature data influences the rates of evaporation and transpiration, delineating the speed at which available moisture may be lost. The integration of these two data types empowers scientists and policymakers to gauge the severity and duration of drought conditions. By closely scrutinizing these factors, informed decisions about water distribution, agricultural practices, and disaster preparedness can be made, ensuring communities are equipped to respond effectively to drought challenges. Climate Hazard Infrared Precipitation Stations (CHIRPS) data from UCSB were employed in both study areas (CHIROS), while temperature data were extracted from the European Centre for Medium-Range Weather Forecasting fifth reanalysis [62, 63].
3. Survey Design: The survey is designed to delve into the intricate web of impacts that drought imposes on farming systems and communities within the West Pokot region of Kenya. Its overarching goal is to offer a comprehensive understanding of the multifaceted dimensions of drought, spanning the climatic, socio-economic, and meteorological realms. By focusing on these interrelated factors, the survey endeavors to unearth spatial correlations and resilience strategies crucial for mitigating the adverse effects of drought.
Geographically, the survey zooms in on areas profoundly affected by extreme drought, specifically targeting the regions of Kacheliba and Sigor. See the maps in Figure 1 deriving from Humanitarian Exchange [61]. These locations serve as microcosms of the broader challenges faced by communities grappling with erratic weather patterns and diminishing agricultural yields.
Methodologically, the survey adopts a structured approach, leveraging closed-ended questions to systematically gather data across various domains. It encompasses inquiries into demographics, agricultural practices, livestock rearing, crop cultivation, and adaptive measures employed by farmers to withstand drought-induced adversities. The utilization of Kobo Collect as the survey platform ensures not only the efficiency of data collection but also stringent quality control measures to uphold the integrity and reliability of the findings [64].
In terms of participation, the survey aims to engage a representative sample of farmers hailing from the target regions. By ensuring inclusivity and diversity in participant selection, the survey endeavors to paint a holistic picture reflective of the broader community’s experiences and perspectives regarding drought resilience and adaptation strategies. Through this comprehensive approach, the survey endeavors to equip stakeholders with actionable insights and evidence-based recommendations to bolster resilience and foster sustainable agricultural practices in drought-prone regions like West Pokot, Kenya.
Participant selection is designed to ensure inclusivity and diversity, thereby enriching the survey’s findings with a broad spectrum of perspectives and experiences. One approach to achieving this is through proportional representation based on sub-locations, wherein participants are selected from various geographical areas within Kacheliba and Sigor. This method ensures that voices from different communities and demographic backgrounds are heard, thereby enhancing the representativeness of the data collected. Additionally, efforts are made to engage with community leaders and local organizations to facilitate outreach to marginalized groups, ensuring their inclusion in the survey process. Through these deliberate measures, the survey strives to capture the diversity inherent in the farming communities of West Pokot, Kenya, fostering a more nuanced understanding of the impacts of drought and the resilience strategies employed across different segments of the population.
4. Focused Group Discussions (FGDs): served as a complementary tool to the structured surveys, providing a nuanced exploration of farmers’ perceptions and experiences of drought [65-67]. Discussions centered on coping mechanisms employed, challenges faced in daily life and long-term planning, and potential solutions for building community resilience. Eight FGDs were meticulously conducted, specifically targeting farmers from extremely vulnerable sub-location communities to ensure a representative sample reflecting the diversity within the region’s farming population. Participant recruitment took into account the demographic composition of the farmer population, along with the documented impacts of drought on their livelihoods, ensuring inclusivity across various age groups and gender identities. FGDs served as a platform for participants to share their experiences, insights, and concerns regarding drought resilience, facilitating a deeper understanding of community perspectives and priorities [65-67]. Each FGD, comprising 8–10 participants, provided rich insights into the socio-economic, agro-pastoral, and meteorological impacts of drought on livelihoods, fostering discussions on community-based solutions for effective resilience. Thematic content analysis was employed to systematically analyze the transcripts.
Nvivo software facilitated this process by enabling efficient coding, organization, and visualization of the thematic data, ensuring accuracy and consistency in data interpretation [67]. Furthermore, the targeted nature of FGDs ensured that a diverse range of voices, including men, women, young people, and the elderly, contributed to the discussions, enhancing the credibility and richness of the findings. Overall, FGDs complemented the survey findings by providing contextual insights and facilitating participatory approaches to resilience-building efforts, thereby strengthening the study’s credibility and relevance.
2.2.2. Exploratory Data Analysis
A combined quantitative and qualitative approach was employed to delve deeper into community challenges and their resilience to climate variability, as illustrated in Figure 2. The quantitative analysis involved surveys that helped identify the impacts of extreme and severe droughts on livelihoods, including agricultural productivity, water scarcity, and changes in pastoral practices. This approach provided a broad overview of the economic and social stresses these communities face during such periods. Conversely, the qualitative analysis, which included focus group discussions, was crucial in understanding the community-based resilience and adaptation capacities.
1. VHI method
The Vegetation Health Index (VHI), a well-established indicator of drought disasters, is derived from the combination of the Normalized Difference Vegetation Index (NDVI) and Land Surface Temperature (LST). The Normalized Difference Vegetation Index (NDVI) is calculated by utilizing the reflectance values from the red and near-infrared bands, NDVI products derived from 'Landsat Surface Reflectance' are generated from scenes captured by Landsat 4–5 Thematic Mapper (TM), Landsat 7 Enhanced Thematic Mapper Plus (ETM+), and Landsat 8-9* Operational Land Imager (OLI)/Thermal Infrared Sensor (TIRS) in both Collection 1 and Collection 2. These scenes undergo processing to become Landsat Level-2 Surface Reflectance products. In Landsat 4, 5, and 7, the infrared data corresponds to band number 4, while in Landsat 8, it corresponds to band number 5. Ghaleb et al. [2] express the NDVI computation using the formula (Eq. 1):
where Normalized Difference Vegetation Index (NDVI) values range between – 1 and 1.
The VHI is calculated using remote sensing data, combining measures of vegetation cover, land surface temperature, and rainfall. Ghaleb et al. [40] and Bento et al. [68] developed the Vegetation Condition Index (VCI), the Temperature Condition Index (TCI), and the Vegetation Health Index (VHI) using the following Equations (2) – (4):
where NDVI, , and represent the seasonal average of the smoothed weekly NDVI, its multiyear absolute minimum, and its maximum, respectively, and , , and represent similar values for the land surface temperature in Celsius.
The VHI values range from 0 to 100, with higher values indicating healthier vegetation. The index values were further aggregated over a yearly temporal window due to the desire to capture temporal trends of extended drought starting from 1990 in the targeted country of interest (Kenya). The data obtained were visualized using charts, maps, or time series plots to observe vegetation health trends. Further statistical and spatial analyses were conducted to quantify and interpret the trends in vegetation health over time.
Furthermore, the land surface temperature (LST) serves as an indicator of the Earth’s surface temperature, reflecting its warmth or coolness to the touch [69]. In determining the LST, thermal bands were employed, with Ghaleb et al. [40] noting that for Landsats 4, 5, and 7 it is the sixth band, while for Landsat 8 it involves bands 10–11. The sensors within the Satellite Thermal Infrared (TIR) category gauge top-of-the-atmosphere (TOA) radiances, enabling the derivation of brightness temperatures through the application of Plank’s law [70]. Specifically focusing on Landsat 8 imagery, both bands 10 and 11 are accessible, but band 10 was favored due to calibration uncertainties associated with the band 11 Landsat 8 Thermal Infrared Sensor (TIRS). Figure 3 below illustrates the VHI map process, focusing specifically on vegetated areas.
The VHI values are classified into different drought severity levels to assess the impact on agriculture [71]. Table 1 shows the drought severity classification:
2. Quantitative (Surveys) Analysis
The surveys targeted 88 participants, focusing on analyzing livestock production, crop production, the impact of drought, and community resilience and adaptation strategies using Python for data processing and analysis. Various statistical analyses were conducted. Initially, frequency distributions were run for all variables to identify missing cases and understand the underlying reasons for these gaps. This method was particularly useful in providing a clear overview of crop and livestock production levels, as well as other drought-related empirical data.
To gain deeper insights into how the community responds to and manages drought conditions, cross-tabulations were performed to explore the relationships between different variables. This helped in understanding the intricate dynamics of community resilience and adaptation strategies in detail. Furthermore, linear regression analysis was employed to examine the relationship between community resilience, adaptation strategies, and livestock production at the household level. This analysis aimed to quantify how different resilience and adaptation strategies influenced the economic aspects of households, particularly through livestock production. By doing so, the research provided a more nuanced understanding of the socio-economic impact of drought on these communities and highlighted potential areas for intervention to enhance their resilience.
To ensure data integrity and analysis accuracy, we conducted a comprehensive data preprocessing phase using Python’s Pandas library. This involved handling missing data through techniques like imputation and deletion (considering potential biases from exclusion). We employed robust outlier detection and removal methods (z-scores, winsorization) [72] from Pandas and SciPy libraries to mitigate their influence. Finally, the study performed data validation to ensure consistency and alignment with the study’s objectives, including cross-referencing [73] with external sources where applicable.
Key variables were useful for the statistical analysis. The study first determined agricultural activity farmers engaged the most in Sigor and Kacheliba. Figure 4 depicts that Mixed farming, encompassing both livestock rearing and crop cultivation is the prevalent activity of households with a proportion of 81.4%. This shows the community’s diverse farming activities. In addition, livestock rearing is the second most common activity, with a proportion of 12.8%. While only 5.8% of households practically engage in crop farming activity.
Furthermore, determining the frequency of livestock and crop production in Table 2 and Table 3 respectively revealed that Cows have a notable presence with a percentage of 72% of livestock holdings, demonstrating their importance to the regional agricultural economy. On the other hand, the Goat and Camel have a large percentage respectively of 96%, and 90%, this shows their importance in Livestock production and local cultures, and they are the two main types. Conversely, sheep have a small percentage of 52%. This distribution shows the variety of livestock farming in the area. Each of these livestock types provide various roles, ranging from producing dairy and meat to having cultural and financial importance.
Meanwhile, Maize has the most common crops. It makes up a large proportion of 97%. This indicates its crucial role in local agricultural practices. Sorghum follows, but to a lesser extent. It has a 51% presence. This reflects its importance as a staple food. On the other hand, Beans represent an important proportion of 73%. This proportion shows the big role of Beans in farm diversity and food security. While the other various minor types of crops have a 64% proportion.
With Pokot being nomad, the livestock herd size is a critical information requiring particular attention. The livestock herd size distribution, as shown in Table 4, Kenya, indicates a predominance of small-scale livestock farming, with a smaller percentage of medium and large-scale herders. Due to repetitive drought disaster cases, limited access to veterinary services, high vulnerability to diseases and limited resources, small herds are more sustainable for households.
In West Pokot, Kenya, agricultural production relies on community resilience strategies to cope with environmental and economic challenges. The most common practices, as shown in Table 5, include adopting modern agriculture techniques, practicing diverse grazing areas, using resilient livestock breeds, and diversifying income through business ventures. These strategies ensure consistent productivity, financial stability, and resilience against agricultural risks.
Furthermore, understanding the distribution of age and gender in the agricultural workforce of West Pokot is crucial for designing effective interventions. By addressing the specific needs of different age groups and supporting both women and men, the agricultural sector in West Pokot can be made more productive, sustainable, and resilient. The gender disparity in agricultural practices leans towards female farmers, with 53% being female and 47% male. This skew towards female-headed households has cultural roots. Culturally, women are more involved in crop production in West Pokot, often practiced near family households, while men are more involved in livestock farming, which typically takes place further from home, within a 10 km radius.
In the context of agricultural production in West Pokot, Kenya, the age distribution of the population in Table 6 provides insights into labor availability, productivity, and the community resilience against an escalating threat of climatic extremes. The age distribution in West Pokot’s agricultural sector reveals a workforce with diverse age groups, each bringing different strengths and challenges. The presence of a large number of individuals in the 27-35 and 36-42 age intervals is a positive sign for current productivity. However, the relatively low number of young adults (18-26) suggests potential future labor shortages, likely due to the increased risk of agricultural losses. The significant number of older adults (50-80) highlights the importance of succession planning and the need to attract younger individuals to agriculture to sustain and advance the sector.
Table 7 reveals that over half of the population in West Pokot involved in agriculture has no formal education. An additional 20% of the agricultural population has some primary education but did not complete it. This high percentage suggests a reliance on traditional farming methods passed down through generations.
Overall, the diverse range of strategies employed by the community underscores the importance of adaptation in building resilience and mitigating the negative consequences of environmental stressors on their livelihoods
3. Qualitative (FGDs) Analysis
Focus Group Discussions (FGDs) were also utilized to capture farmers' perceptions and understanding of climate change and variability, as well as the community-based resilience and adaptation strategies employed in the face of these challenges. As stated by Eeuwijk and Angehan [74], in the FGD, participants are encouraged to share their attitudes, perceptions, knowledge, and experiences, with an emphasis on practices that emerge during interactions with a diverse range of individuals [74]. FGDs, typically comprising 8-10 participants, provided deep insights into the socio-economic, agro-pastoral, and meteorological impacts of drought on livelihoods.
Thematic content analysis was applied to distill and interpret the rich qualitative data gathered from the discussions. This method, facilitated by the use of NVivo software [75], allowed for a systematic exploration of themes and patterns related to how communities perceive and respond to drought. By employing thematic content analysis, the study could effectively organize and analyze the complex layers of data, revealing the nuanced ways in which communities adapt to and cope with the adverse effects of drought. The integrated methodology, combining remote sensing, surveys, and FGDs, offers a comprehensive approach to assessing the impacts of drought and enhancing community resilience in West Pokot County. This approach ensures that the multifaceted nature of drought impacts and the varied strategies of community adaptation are thoroughly explored and understood.
2.3. Statistical Analysis
2.3.1. Socioeconomic Factors of Agricultural Practices On The Household’s Livestock Production
Understanding the influence of socioeconomic factors and agricultural practices on household livestock production is crucial for several reasons. Firstly, it shows how household traits like gender, age, education, and farming type affect livestock productivity and drought resilience. Secondly, these socioeconomic characteristics of households significantly impact mixed activities, especially animal productivity [76]. Thirdly, identifying these factors can help develop effective strategies to mitigate the adverse effects of drought on farming communities. Fourthly, understanding agricultural activities that influence livestock production can help design integrated strategies to enhance both livestock and agricultural output. In drought-prone areas such as Sigor or Kacheliba, this thorough understanding is vital for building resilience and ensuring food security. In light of these points, it is appropriate to ask: How do socioeconomic factors and the types of agricultural activities undertaken by households influence their livestock production?
To answer these questions, we applied the Multinominal Logistic Regression (MLR) model [76,77,78] using the function GLM () in R. It is defined as follows:
Where represents the probability of a given household head having a high quantity of livestock, based on the predictor variables included in this model.
2.3.2. Examining the Interplay Between Livestock Production, Community Resilience, and Crop Production
Understanding the complex links between livestock and crop production and community resilience is of utmost importance for several reasons. First, this study explored how diverse family attributes and farming practices impact cattle outputs. Additionally, understanding these links can aid in creating effective plans to boost crop yields and enhance drought resilience. By analyzing these interactions, we can identify smart tactics to improve crop and livestock outputs and protect food reserves in vulnerable areas. Furthermore, this study developed focused interventions to help families sustain their livelihoods during challenging times by understanding how various agricultural practices and community resilience initiatives affect livestock production.
To examine these relationships, we employed the Multiple Correspondence Analysis (MCA) model [79,80]. MCA is a sophisticated multivariate statistical technique for analyzing categorical data, including binary variables. It can be considered an extension of Principal Component Analysis (PCA) for categorical variables [79,80,81]. The study strategically applied the MCA model three separate times to extract aggregate scores for each aspect—livestock production, community resilience, and crop production—from the variables presented in Table 1, Table 2 and Table 3 using the FactoMineR, ade4, and Factoshiny packages in R software.
After extracting the scores, the study applied Simple Linear Regression (SLR) models [82] to study the relationships between crop production, community resilience, and livestock production scores. These models are defined as follows:
where and represent the coefficients in the regression model, and ϵ represents the regression error.
3. Findings
3.1. Remote Sensing
The initial assumption was that drought classification and severity were consistent across even geographically and temporally close areas. However, the study's classification of the targeted areas has revealed how drought severity can vary significantly both geographically and over time. The analysis of satellite images has demonstrated that this is indeed the case. West Pokot is composed of four sub-counties, but due to limited time and resources, the study focused on the two sub-counties most severely affected by climate variability, specifically drought. Kacheliba and Sigor were selected because they are among the most impacted areas, covering 1.40% and 1.21% of the sub-county area, respectively.
The findings reveal that both targeted sub-counties experience extreme and severe droughts differently. Figure 5 highlighted the years 1995, 2000, 2002, and 2005, during which both sub-counties suffered from combined extreme and severe drought conditions. However, years like 1991, 2009, and 2019 have shown significant differences in the severity of drought impacts between Kacheliba and Sigor.
This disparity underscores the importance of localized climate studies and suggests that effective drought mitigation strategies must be tailored to the specific conditions of each sub-county. By understanding these nuanced variations, policymakers and researchers can better allocate resources and design interventions that are more likely to succeed in mitigating the adverse effects of drought in affected communities.
Over the span of three decades, Kacheliba consistently shows higher peaks of drought severity compared to Sigor, suggesting a more acute vulnerability to extreme climatic conditions. Notably, during the early 1990s and the mid-2000s, Kacheliba faced particularly severe drought conditions, peaking sharply in 1995 and again in 2005. This pattern aligns with broader climatological studies indicating that regions with higher altitudes and more erratic rainfall patterns, like Kacheliba, tend to experience more severe drought impacts [83].
Conversely, Sigor, while also experiencing fluctuations in drought severity, shows a less volatile pattern, with its peaks generally lower than those of Kacheliba. Post-2005, both Sigor and Kacheliba show a notable decrease in drought severity, suggesting a negative trend in terms of both frequency and intensity of drought events. This improvement in drought conditions likely reflects effective adaptation and resilience strategies implemented within the communities or changing climatic conditions that favor reduced drought incidence. Literature on climate adaptation supports this observation, noting that areas with better-managed agricultural practices and diversified crops tend to exhibit a slower increase in drought severity over time [84].
Overall, the comparative trend analysis between Kacheliba and Sigor underscores the complex interplay of geographic, environmental, and human factors that contribute to the variability in drought severity. It also highlights the importance of localized climate resilience strategies that can mitigate the adverse impacts of such extreme weather events.
Subsequent imagery in Figure 6 and Figure 8 further illustrates the profound impact these droughts had on the local populations, underscoring the considerable challenges faced during this period. The imagery and the graph in Figure 7 and Figure 9 provide a stark depiction of the changing landscape and underscore the adaptive measures that were necessitated by prolonged periods of drought. This visual documentation helps convey the harsh realities faced by the communities and the resilience strategies they employed to cope with these adverse conditions.
To further understanding these nuanced variations Land Surface Temperature (LST) data from Landsat images processed provided insights into the monthly and yearly distribution of temperature values. An analysis of the correlation between LST and ambient temperature highlighted their unique measurement dynamics, emphasizing the importance of considering both datasets in temperature trend analyses. The visual representation illustrated the multifaceted factors influencing LST, including surface types, urban heat islands, vegetation density, soil moisture, albedo effect, and direct solar radiation. Figure 10 displays this distribution, highlighting a prominent frequency range between 30 and 35°C.
Furthermore, Figure 11 below presents the yearly distribution of LST values, revealing a noticeable data gap between 1995 and 2000. This absence can be attributed to the reliance on TM sensors and the limited access to radiometrically rectified and purified data during these years. Outliers, registering values over 50 degrees Celsius, were also observed in 2009. These anomalies were subsequently removed from our time series through accurate correlation processing between LST and ambient temperature.
There exist two distinct heat islands: (1) surface heat islands and (2) atmospheric heat islands. Each type has unique formation processes, detection and measurement techniques, effects, and, to an extent, cooling methodologies. Figure 12 illustrates the yearly distribution of both LST and ambient temperature plotted on the same chart. The graph clearly highlights disparities between the two sets of values. While both temperatures provide crucial insights into the environment's thermal conditions, the discrepancies arise from the inherent differences in their measurement. Finally, Figure 13 shows this inconsistency, where the discrepancy between LST and ambient temperatures is rooted in a plethora of intertwined factors. Understanding these dynamics is crucial for accurate environmental assessments and urban planning.
By understanding these nuanced variations, policymakers and researchers can better allocate resources and design interventions that are more likely to succeed in mitigating the adverse effects of drought in affected communities.
3.2. Surveys
3.2.1. Survey Locations
The areas identified with extreme and severe drought were surveyed to determine the drought's impacts on farmers and communities. A questionnaire was uploaded into Kobo Collect, and a geo-localized survey targeted affected locations and sub-locations in Kacheliba and Sigor. Due to security concerns, limited road accessibility, and logistical challenges, the survey focused on three locations (Kapchok, Lokichar, and Kodich) and five sub-locations (Kapyen, Konyao, Karameri, Kodich, and Oroua) in Kacheliba (Figure 14). In Sigor, five locations and five sub-locations were surveyed, incorporating both surveys and Focus Group Discussions (FGDs) (Figure 15).
3.2.2. Statistical Modeling and Analysis Outcome
1. Socioeconomic Factors and Farm Management Strategies Affecting Household Livestock Herds
In this part, the study presents the results of the model defined in previously. Firstly, to the model evaluates the predictive performance of our model. To this end, study intends to compute three well-known measures: (1) The Likelihood Ratio Test (LRT), (2) Nagelkerke’s R2, and (3) the Accuracy [78]. Table 8 summarizes the values obtained for these three metrics.
Table 8 shows that the LRT p-value is very low (1.24 × 10⁻⁸). So, we reject the null hypothesis. It shows the model is much better than a simple one without extra parameters. A high accuracy score of 93% shows that the model can predict well. It can predict the outcomes. Also, a high Nagelkerke’s R2 value of 0.96 shows that the model explains the variability of the data very well. This highlights its strong predictive power. After validating the accuracy and effectiveness of the model, Table 9 below shows our findings.
Table 9 highlights several key factors that influence the size of livestock herds managed by households in West Pokot, Kenya. Understanding these factors is crucial for developing effective strategies to enhance livestock management and resilience to drought.
Starting with the gender characteristics, the gender differences play a subtle but significant role in livestock herd size. Female-led households typically manage smaller herds, while male-led households are somewhat more likely to manage medium-sized herds (50 to 99 animals). This disparity is likely linked to traditional gender roles in livestock management in the region. Men may have more access to resources and decision-making power in herd management. Managing large herds in a drought-prone region requires considerable effort, and men are often more willing to undertake these challenging tasks due to their traditional roles and fewer time-consuming domestic responsibilities.
The education level of household members also impacts herd size. Households with university-educated members tend to manage smaller herds, suggesting an inverse relationship. Higher education enables diversification into other economic activities, reducing reliance on large livestock herds. Individuals with university educations might pursue alternative employment or adopt modern farming practices that do not require maintaining large herds, thereby enhancing their resilience to drought.
Furthermore, the findings indicate that older heads of households tend to manage larger herds. This can be attributed to their accumulated experience in livestock management and resource navigation during droughts. Older household members have a better understanding of resource management and strategies to maintain larger herds. In the context of droughts, this experience becomes invaluable. Households with older members have endured past droughts and may make more strategic decisions regarding herd size during dry periods. For instance, they might choose to reduce the herd by selling livestock to cope with limited resources, thus protecting the remaining animals and maintaining herd productivity.
As per activity types, Households engaged exclusively in livestock farming are more likely to have larger herds compared to those involved in mixed farming or other agricultural activities. Specialized livestock farmers can allocate more resources and expertise towards managing and growing their herds. However, this specialization increases their vulnerability to drought, which can severely impact their herds and livelihoods by reducing available grazing land and water. Mixed farming households, on the other hand, benefit from a diversified income stream, which helps buffer the impacts of drought on their livestock operations.
Furthermore, Households engaged solely in livestock farming tend to have larger herds compared to those practicing mixed farming or other forms of agriculture. This specialization allows them to allocate more resources and expertise towards managing and growing their herds. However, this focus also increases their susceptibility to the effects of drought. Droughts can severely impact their herds and means of subsistence by reducing available grazing land and water.
Conversely, households involved in mixed farming benefit from a more diversified income stream, which helps mitigate the adverse effects of drought on their livestock operations. By relying on both crop and livestock production, these households can buffer their livelihoods against the fluctuations caused by environmental challenges.
2. Relationships Between Livestock Production, Community Resilience, and Crop Production
This part presents the findings of the models (MCA, and SLR) defined in previously.
To assess the effectiveness of these models, the study begun by presenting their predictive performance using well-known and commonly used metrics [79,80,81]:
Table 10, Table 11 and Table 12 demonstrate that the first principal component in all models explains a substantial proportion of the variance: 89.26% for livestock production (Table 12), 70.39% for community resilience (Table 13), and 94.07% for crop production (Table 14). This indicates that the most significant information within the data for each aspect is effectively captured by the first principal component.
The analysis of variance across livestock production, community resilience, and crop production reveals that the first principal component captures the most critical information in each dataset. This highlights the effectiveness of the applied multivariate analysis technique in identifying the primary drivers within each aspect. For instance, with the Variance Explained of 89.26%, Livestock Production (Table 10) suggests that a few key factors predominantly influence livestock production. This could include variables such as herd size, livestock health, and access to grazing land. The ability to capture such a large proportion of variance with a single component underscores the presence of strong, underlying patterns in livestock management practices within the region. The high community resilience (70.39%) variance suggests that community resilience is influenced by a diverse set of factors. Key factors might include social cohesion, access to resources, and adaptive strategies to cope with environmental stresses. The lower percentage compared to livestock and crop production implies that community resilience is a more complex and multifaceted construct. Finally, the very high percentage of Crop Production variance (94.07) explained by the first component indicates the high influence by a few dominant factors. These could include the type of crops planted, soil fertility, and irrigation practices. This strong explanatory power suggests that targeted interventions focusing on these key factors could significantly enhance crop yields and sustainability.
- Predictive performance of the SLR models defined in defined in (Eqs. 7), and (8).
Table 13 shows that both models have high R-squared values (0.79 and 0.86), suggesting they effectively capture a large portion of the variability in the outcome variable.
- Estimated coefficients, and their P-value of the models in (Eqs. 7), and (8).
The R-squared values and coefficients from the two models provide insights into the relationship between community resilience and livestock production. Table 14 indicated a positive relationship between community resilience and livestock production at the household level. Specifically, the coefficient of 0.69 in this model (Eq. 7), indicates a positive relationship between the predictor variable and the community resilience score. This suggests that an increase in the predictor variable is associated with an increase in community resilience, meaning increase in community resilience resulted in higher livestock production. Conversely, an inverse relationship between community resilience and crop production. An increase in community resilience and adaptation strategies led to a reduction in crop production at the household level. The P-value of 0.00045 is statistically significant (typically, a P-value less than 0.05 is considered significant), indicating strong evidence against the null hypothesis and confirming the reliability of this relationship. The coefficient of -0.178 in this model (Eq. 8) indicates a negative relationship between the predictor variable and the community resilience score. This suggests that an increase in the predictor variable is associated with a decrease in community resilience. The P-value of 0.000083 is highly significant, providing strong evidence against the null hypothesis and affirming the reliability of this inverse relationship.
3.3. FGDs
From the survey findings, Focus Groups Discussions was conducted to list community resilience and adaptation approaches used by farmers in both Sigor and Kacheliba. The FGDs were instrumental in identifying the drought's impacts on health and livelihoods and assessing community-based approaches for drought resilience in the targeted areas. By engaging with community members directly, the study gathered qualitative data that provided deeper insights into the real-world effects of drought. These discussions helped capture the communities' perspectives on how drought affects their daily lives, health, and economic activities.
3.3.1. Extreme Drought Impacts on Communities
Furthermore, Eight FGDs, each involving 8-10 participants, were conducted in targeted locations and sub-locations in Kacheliba and Sigor sub-counties. These discussions aimed to identify drought impacts on health and livelihoods and assess community-based approaches for drought resilience. Thematic content analysis of the FGDs uncovered three primary domains encapsulating the ramifications of drought on farms and livelihoods, commencing with: (1) The foremost Social-Economic Impacts of climate variability on targeted regions, followed by (2) Agro-Pastoral impacts delineating the repercussions of drought on local farms and livelihoods in the targeted areas. Concluding the triad is (3) the climate impacts of drought on crop production and animal rearing (Figure 16).
Drought has had profound impacts on the social and economic conditions of communities in the arid and semi-arid lands of West Pokot. The reduction in animal and crop production capacity has led to significant food insecurity and poverty. These conditions have resulted in several consequences, among which, include the farmers inability to Pay School Fees, the diminished Marketability of agricultural goods. The reduced quantity and quality of crops and livestock have led to decreased marketability, increase increased Conflicts between neighbourhoods, health issues, the rising of commodity prices. The drought has also severely affected agro-pastoral practices. Farmers in Sigor and Kacheliba face a lack of grazing areas, frequent wild dog attacks, and theft. They also suffer from insufficient support for animal disease treatment. Additionally, increased heat and irregular rainfall are further climatic impacts of drought in both areas, complicating agricultural efforts and community resilience, adaptation Strategies.
3.3.2. Community-Based Drought Resilience and Adaptation Approaches
Furthermore, Table 15 presents various community-based drought resilience and adaptation approaches discussed in eight Focus Group Discussions (FGDs). Eight FGDs were conducted in Sigor and Kacheliba sub-locations to elucidate the practical approaches utilized by local communities to bolster resilience to drought disasters. Each FGD represents different community groups, and the table lists various strategies employed to cope with drought conditions. Table 15 shows a wide array of strategies that communities in West Pokot use to enhance their resilience to drought. These strategies range from agricultural practices like growing drought-resistant crops and practicing irrigation to alternative income-generating activities such as gold mining and charcoal burning. The diversity of approaches indicates a robust and multifaceted response to the challenges posed by drought, underscoring the importance of local knowledge and adaptability in managing environmental stressors.
Drawing lessons from previous research on community-based resilience-building interventions in Nicaragua, Ethiopia, and Zimbabwe [85, 86], Table 15 revealed significant insights. FGD7, conducted in Chepserum sub-location, Sigor, identified the most community-based drought resilience and adaptation approaches. Among the most frequently mentioned approaches across all FGDs were: (1) Harvesting Wild Plants, (2) Collection of Firewood and Charcoal Burning, (3) Use of Drought-Resilient Vegetables, (4) Practicing Irrigation.
Conversely, the least used approaches included: Animal Rearing Reduction, despite being promoted by policymakers, this approach struggles to gain traction due to the cultural and economic value attached to owning large livestock herds. Pest Curbing method is less commonly practiced, possibly due to a lack of resources or knowledge. The reluctance to reduce herd sizes, despite policy encouragement, highlights the deep-seated cultural significance and perceived economic security associated with larger herds. Ownership of numerous livestock is often seen as a status symbol and a buffer against economic uncertainties, making it challenging for such policies to be widely adopted.
4. Discussions
Previous studies, including those by Ewbank et al. [85] and Patt et al. [86], have highlighted the importance of community-based resilience interventions in various regions, including Nicaragua, Ethiopia, and Zimbabwe. These interventions focus on leveraging local knowledge and practices to mitigate the impacts of climate variability. In line with these findings, this study in West Pokot emphasizes the need for tailored resilience strategies that incorporate both modern technology and traditional practices.
This research employs both quantitative methods, such as remote sensing and surveys, and qualitative methods, such as focus group discussions (FGDs), to assess and develop strategies for enhancing community resilience in West Pokot. The quantitative approaches include employing remote sensing and GIS to assess drought impacts and inform early actions to mitigate these impacts in arid and semi-arid lands (ASAL) areas, focusing on West Pokot.
The findings reveal that both targeted sub-counties, Kacheliba and Sigor, experience extreme and severe droughts differently. For instance, Figure 5 highlighted the years 1995, 2000, 2002, and 2005, during which both sub-counties suffered from combined extreme and severe drought conditions. However, years like 1991, 2009, and 2019 have shown significant differences in the severity of drought impacts between Kacheliba and Sigor. Understanding these differences is crucial in assessing the impact on the local population during the affected years.
The assessment of vegetation health provided critical information on the motivation of previously well-known farming communities to continue their ancestral practices. The drought reoccurrence often leads to the depopulation of capable, young adults who migrate to urban centers. Consequently, former agriculture hubs are turning into empty, poverty-stricken areas, which are eventually sold and replaced with urban-style homes.
Despite the bleak picture painted earlier, communities in ASAL regions have shown remarkable resilience to the recurrent effects of droughts by employing local-based resilience mechanisms. Indigenous knowledge among pastoralist communities has played a crucial role in surviving the extreme effects of drought for centuries. This resilience was unveiled through FGDs, which highlighted several community-based adaptation strategies.
The statistical modeling and analysis of socioeconomic factors and farm management strategies affecting household livestock herds in West Pokot revealed several key insights: (1) Older heads of households tend to have more cattle, attributed to their accumulated experience in managing livestock and navigating droughts. (2) Female-led households typically manage smaller herds compared to male-led households. This disparity is likely linked to traditional gender roles and access to resources. (3) Farmers with university degrees tend to diversify their farming activities more than those without higher education. This diversification reduces reliance on large livestock herds and enhances resilience to drought. Finally (4) Farmers engaged exclusively in livestock farming are more likely to have larger herds compared to those involved in mixed farming or other agricultural activities. However, this specialization increases their vulnerability to drought, as it impacts their herds and livelihoods by reducing available grazing land and water.
5. Conclusions
The study emphasizes the importance of integrating local knowledge with modern technology in resilience-building interventions. By combining traditional strategies with technological advancements, communities in West Pokot can better address the challenges of drought and climate variability. The findings highlight the broader implications for ASAL areas in Sub-Saharan Africa, stressing the need for tailored interventions to enhance community resilience. Indigenous knowledge among pastoralist communities is a crucial asset for surviving extreme drought effects.
This research serves as a foundation for informed decision-making and the development of effective strategies to mitigate drought in ASAL regions. Policymakers can leverage these insights to create culturally sensitive strategies that support sustainable agricultural practices and enhance community resilience. The cultural significance and economic security associated with livestock ownership highlight the need for policies aligned with local values and practices. By doing so, a more resilient and adaptable agricultural sector can be fostered to withstand the unpredictability of climate impacts.
Understanding these nuances allows policymakers and researchers to allocate resources effectively and design successful interventions. Farmers also play a crucial role in improving productivity and community resilience, even in extreme weather conditions. For livestock production, focusing on primary factors like health and management practices can lead to substantial improvements. For crop production, targeting dominant factors such as irrigation and soil management can significantly boost agricultural output. A comprehensive approach addressing various factors is necessary to enhance community resilience.
In conclusion, the study's multidimensional approach, combining quantitative and qualitative methods, provides a comprehensive understanding of drought impacts in West Pokot. The findings underscore the urgency of tailored interventions, including community-based strategies, to enhance resilience and adaptive capacity in ASAL areas facing escalating drought threats.
6. Patents
Supplementary Materials
Not applicable.
Author Contributions
Conceptualization, J.-C.B.M., O.G., J.C., S.E., L.J.T., and R.A.,; methodology, J.-C.B.M., S. E., and R.A; software, J.-C.B.M., R.A., S. E.; validation, S. J.C-B.M., S.E., O.G., J.C., and R.A; formal analysis, J.-C.B.M, S. E,R.A.; data curation, J.-C.B.M., S. E., R.A; writing—original draft preparation, S. E.; writing—review and editing, O.G., J.C.; L.J.T, S. E., J.-B.M., R.A..; supervision, J.C. and O.G.; project administration, J.C. and O.G. All authors have read and agreed to the published version of the manuscript.
Funding
CROSS, EPFL
Data Availability Statement
Not applicable
Conflicts of Interest
The authors declare no conflict of interest.
References
- Parry, M.L.; Rosenzweig, C.; Iglesias, A.; Livermore, M.; Fischer, G. Effects of climate change on global food production under SRES emissions and socio-economic scenarios. Glob. Environ. Chang. 2004, 14, 53–67. [CrossRef].
- IPCC. Climate Change 2007—The Physical Science Basis: Working Group I Contribution to the Fourth Assessment Report of the IPCC (Climate Change 2007); Solomon, S., Qin, D., Manning, M., Marquis, M., Averyt, K., Tignor, M.M.B., Miller, H.L., Chen, Z., Eds.; IPCC: Geneva, Switzerland; Cambridge University Press: New York, NY, USA, 2007; ISBN 0521705967.
- Ojwang’, G.O.; Agatsiva, J.; Situma, C. Analysis of Climate Change and Variability Risks in the Smallholder Sector; Case studies of the Laikipia and Narok Districts Representing Major Agro-Ecological Zones in Kenya; Department of Resource Surveys and Remote Sensing (DRSRS) and FAO: Rome, Italy, 2010.
- Belloumi, M. Investigating the linkage between climate variables and food security in ESA countries. Reg. Environ. Chang. 2014, 42, 172–186.
- Obwocha, E.B.; Ramisch, J.J.; Duguma, L.; Orero, L. The Relationship between Climate Change, Variability, and Food Security: Understanding the Impacts and Building Resilient Food Systems in West Pokot County, Kenya. Sustainability 2022, 14, 765. [CrossRef]
- Mongi, H.; Majule, A.E.; Lyimo, J.G. Vulnerability and adaptation of rain fed agriculture to climate change and variability in semi-arid Tanzania. Afr. J. Environ. Sci. Technol. 2010, 4, 371–381.
- Fuchs, L.E.; Orero, L.; Namoi, N.; Neufeldt, H. How to Effectively Enhance Sustainable Livelihoods in Smallholder Systems: A Comparative Study from Western Kenya. Sustainability, 11(1) (2019) 1564. [CrossRef]
- Adger, W.N. Vulnerability. Global Environmental Change, 16, 1, 2006, 268–281. [CrossRef]
- Chambers, R. & Conway, G. Sustainable rural livelihoods: Practical concepts for the 21st century. IDS Discussion Paper, 296, 1, 1991, 1–29.
- Boye, A.; Verchot, L.; Zomer, R. Baseline Report Yala and Nzoia River Basins: Western Kenya Integrated Ecosystem Management Project Findings from the baseline SURVEYS; World Agroforestry Centre: Nairobi, Kenya, 2008.
- Conway, G. & College, I. The science of climate change in Africa: Impacts and adaptation, 2009.
- Skogseid, M.V. (2017). Climate Change in Kenya: a review of literature and evaluation of temperature and precipitation data. Student thesis series Ines.
- Mesike, C.S.; Esekhade, T.U. Rainfall variability and rubber production in Nigeria. African J. Environ. Sci. Technol. 2014, 8, 54–57. [CrossRef].
- Technical Centre for Agricultural and Rural Cooperation. Spore Special Issue: Climate Change. Available online: https: //cgspace.cgiar.org/handle/10568/76898 (accessed on 10 September 2021).
- Adams, R.M.; West, J.A.E. The implications of global change for western agriculture. West. J. Agric. Econ. 1988, 13, 348–356.
- Munyaka, J.-C.B.; Yadavalli, V.S.S.S. Using transportation problem in humanitarian supply chain to prepositioned facility locations: a case study in the Democratic Republic of the Congo. International Journal of System Assurance Engineering and Management, 12, 1, 2021, 199-216.
- European Commission Disaster Risk Management Knowledge Centre (DRMKC), Inform Climate Change Risk. https://drmkc.jrc.ec.europa.eu/inform-index/Other-INFORM-Products/INFORM-Climate-Change-Risk. (Accessed 09/08/2023).
- Vigren Skogseid, M. Climate Change in Kenya: A Review of Literature and Evaluation of Temperature and Precipitation Data. Bachelor’s Thesis, Lund University, Lund, Sweden, 2017.
- Fazal, S.A.; Wahab, S.A. Economic Impact of Climate Change on Agricultural Sector: A review. J. Transform. Entrep. 2013, 1, 39–49.
- Neufeldt, H.; Kristjanson, P.; Thorlakson, T.; Gassner, A.; Norton-Griffiths, M.; Place, F.; Langford, K. Making Climate-Smart Agriculture Work for the Poor; World Agroforestry Centre (ICRAF): Nairobi, Kenya, 2011.
- FAO; IFAD; UNICEF; WFP; WHO. The State of Food Security and Nutrition in the World 2017. Building Resilience for Peace and Food Security; FAO: Rome, Italy, 2017; ISBN 978-92-5-109888-2. Available online: www.fao.org/3/a-I7695e.pdf (accessed on 10 September 2021).
- Wheeler, T.; von Braun, J. Climate change impacts on global food security. Science 2013, 341, 508–513. [CrossRef].
- Office for the Coordination of Humanitarian Affairs (OCHA), West Pokot: Drought Early Warning Bulletin for January 2023. Reliefweb, Situation Report, 2023. https://reliefweb.int/report/kenya/west-pokot-drought-early-warning-bulletin-january-2023.
- Food Agriculture Organization/World Food Program (FAO/WFP), Crop Prospects and Food Situation. Regional Reviews, 2007. https://www.fao.org/3/ah868e/ah868e06.htm.
- Integrated Food Security Phase Classification (IPC), N.d. IPC Mapping Tool. (Accessed December 21, 2022).
- International Federation of Red Cross and Red Crescent (IFRC). https://media.ifrc.org/ifrc/what-we-do/disaster-and-crisis-management/disaster-preparedness/#:~:text=Disaster%20preparedness%20refers%20to%20measures,effectively%20cope%20with%20their%20consequences. ( Accessed 19 February 2023).
- Food and Agriculture Organization (FAO), World Agriculture: Towards 2015/2030: Summary Report. Rome, 2002.
- FAO Statistics (FAOSTAT). https://www.fao.org, 2005 (Accessed 12 October 2023).
- Bhattacharya, A. Sustainable Livelihood Based Watershed Management – Watershed Plus Approach, 2nd Working Group meeting of ERIA, Japan IGES, 2008.
- Parry, M.L, Rosenzweig, C., Iglesias, A., Livermore, M., Fischer, G. Effects of climate change on global food production under SRES emissions and socio-economic scenarios. Global Environmental Change, 14, 1, 2004, 53–67. [CrossRef]
- IPCC, Climate Change. The Physical Science Basis: Working Group I Contribution to the Fourth Assessment Report of the IPCC (Climate Change 2007); Solomon, S., Qin, D., Manning, M., Marquis, M., Averyt, K., Tignor, M.M.B., Miller, H.L., Chen, Z., Eds.; IPCC: Geneva, Switzerland; Cambridge University Press: New York, NY, USA, 2007. ISBN 0521705967.
- Ojwang’, G.O., Agatsiva, J., Situma, C. Analysis of Climate Change and Variability Risks in the Smallholder Sector; Case studies of the Laikipia and Narok Districts Representing Major Agro-Ecological Zones in Kenya; Department of Resource Surveys and Remote Sensing (DRSRS) and FAO: Rome, Italy, 2010.
- Belloumi, M. Investigating the linkage between climate variables and food security in ESA countries. Regional Environmental Change, 14, 1, 2014, 172–186.
- Office for the Coordination of Humanitarian Affairs (OCHA), West Pokot: Drought Early Warning Bulletin for January 2023. Reliefweb, Situation Report, 2023. https://reliefweb.int/report/kenya/west-pokot-drought-early-warning-bulletin-january-2023.
- Paavola, J. Vulnerability to Climate Change in Tanzania: Sources, Substance and Solutions”, A paper presented at the inaugural workshop of Southern Africa Vulnerability Initiative (SAVI) in Maputo, Mozambique June 19-21, 2003.
- Tilya, F.F.; Mhita, M.S. Frequency of Wet and Dry Spells in Tanzania. A paper presented at the International Workshop on Climate and Land Degradation, Lamgando Conference Hall, Impala Hotel, ARUSHA, Tanzania, 2006.
- Mongi, H.; Majule, A.E.; Lyimo, J.G. Vulnerability and adaptation of rain-fed agriculture to climate change and variability in semi-arid Tanzania. African Journal of Environmental Science and Technology, 4, 1, 2010, 371–381.
- United Nations Development Programme (UNDP), The Karamoja cluster Rapid Conflict Analysis and Gender Assessment (Kenya and Uganda). UNDP report, 2022. Undp.org.
- Bowell, A.; Salakpi, E.E.; Guigma, K.; Muthoka, J.M; Mwangi, J.; Rowhani, P. Validating commonly used drought indicators in Kenya. Environmental Research Letters, 16, 2021, 8, 084066. [CrossRef]
- Ghaleb, F.; Mario, M.; Sandra, A.N. Regional Landsat-based drought monitoring from 1982 to 2014. Climate, 3, 3, 2015, 563-577.
- Brown, M.E. Remote sensing technology and land use analysis in food security assessment. Journal of Land Use Science, 11, 6, 2016, 623-641.
- Kogan, F.N. Monitoring drought from space and food security. Remote sensing for food security, 2019, 75-113.
- Munyaka, J.-C.B.; Chenal, J.; Mabaso, S.; Tfwala, S.S.; Mandal, A.K. Geospatial Tools and Remote Sensing Strategies for Timely Humanitarian Response: A Case Study on Drought Monitoring in Eswatini. Sustainability 2024, 16, 409. [CrossRef]
- Huang, Y.; Liu, Y.; Shi, R.; Ren, H. Application of Remote Sensing and GIS in Drought and Flood Assessment and Monitoring. Water 2023, 15, 541. [CrossRef].
- Wang, F.;Wang, Z.; Yang, H.; Zhao, Y.; Li, Z. Capability of Remotely Sensed Drought Indices for Representing the Spatio–Temporal Variations of the Meteorological Droughts in the Yellow River Basin. Remote Sens. 2018, 10, 1834. [CrossRef].
- Cong, D.M.; Zhao, S.H.; Chen, C.; Duan, Z. Characterization of droughts during 2001-2014 based on remote sensing: A case study of Northeast China. Ecological Informatics, 39, 1, 2017, 56-67. [CrossRef]
- Mutanga, O.; Dube, T.; Galal, O. Remote sensing of crop health for food security in Africa: Potentials and constraints. Remote Sensing Applications: Society and Environment, 8, 1, 2017, 231–239. [CrossRef]
- Palmer,W.C. Meteorological Drought. Office of Climatology, U.S.Weather Bureau: Washington, DC, USA, 1965.
- Palmer,W.C. Keeping track of crop moisture conditions, nationwide: The new crop moisture index. Weatherwise 1968, 21, 156–161. [CrossRef].
- McKee, T.B.; Doesken, N.J.; Kleist, J. The relationship of drought frequency and duration to time scales. In Proceedings of the 8th Conference on Applied Climatology, Anaheim, CA, USA, 17–22 January 1993; American Meteorological Society: Boston, MA, USA, 1993; Volume 17, pp. 179–183.
- Petersen, M.; Bergmann, C; Roden, P. and Nüsser, M. (2021). Contextualizing land-use and land-cover change with local knowledge: A case study from Pokot Central, Kenya. Wiley, Land Degrad Dev. 2021;32:2992–3007. [CrossRef]
- Munyaka, J.-C.B.; Yadavalli, V.S.S.S. Using transportation problem in humanitarian supply chain to prepositioned facility locations: a case study in the Democratic Republic of the Congo. International Journal of System Assurance Engineering and Management, 12, 1, 2021, 199-216.
- Wilhite, D.A.; Svoboda, M.D.; Hayes, M.J. Understanding the Complex Impacts of Drought: A Key to Enhancing Drought Mitigation and Preparedness. Drought Mitigation Center Faculty Publications, 43(1) (2007). http://digitalcommons.unl.edu/droughtfacpub/43.
- Ding, Y.; Hayes, M.J.; Widhalm, M. Measuring Economic Impacts of Drought: A Review and Discussion. Papers in Natural Resources, 196, 1, 2010. https://digitalcommons.unl.edu/natrespapers/196.
- Kam, J.; Stowers, K.; Kim, S. Monitoring of Drought Awareness from Google Trends: A Case Study of the 2011–17 California Drought. Weather, Climate, and Society, 11(1) (2019) 419-429. [CrossRef]
- West Pokot County, 2018. West Pokot County Integrated Development Plan, CIDP (2018–2022). West Pokot County: Kapenguria, Kenya. https://repository.kippra.or.ke/handle/123456789/778 (Accessed 26 September 2023).
- GeoInformatiks Ltd., 2017.
- 1994; 58. Central Bureau of Statistics, 1994.
- 2019; 59. Kenya National Bureau of Statistics [KNBS], 2019.
- United States Geological Survey (USGS), Landsat Normalized Difference Vegetation Index. Landsat Missions. https://www.usgs.gov/landsat-missions/landsat-normalized-difference-vegetation-index (Accessed 21/09/2023).
- Humanitarian Data Exchange. https://data.humdata.org/group/swz?page=2#datasets-section (accessed April 2023).
- Climate Hazards center UC Santa Barbara, CHIRPS: Rainfall Estimates from Rain Gauge and Satellite Observations. https://www.chc.ucsb.edu/data/chirps (accessed 07/04/2023).
- National Integrated Drought Information System, ECMWF Reanalysis v5 (ERA5). Data & Maps. https://www.drought.gov/data-maps-tools/ecmwf-reanalysis-v5-era5#:~:text=ERA5%20is%20the%20fifth%20generation,land%20and%20oceanic%20climate%20variables. (Accessed 07/04/2023).
- Dizon. T, et al. Experiences in Using KoBo Collect and KoBo Toolbox in a Cross-Sectional Dog Population and Rabies Knowledge and Practices Household Survey in the Philippines. Studies in Health Technology and Informatics, 2022.
- Kamara, J.K.; Agho, K.; Renzaho, A.M.N. Understanding disaster resilience in communities affected by recurrent drought in Lesotho and Swaziland—A qualitative study. PLoS ONE, 2019.
- Hawkins, P, et al (2022). Dietary and agricultural adaptations to drought among smallholder farmers in South Africa: a qualitative study Weather and climate extremes.
- HScheelbeek. P, et al. Improving the use of focus group discussions in low-income settings BMC medical research methodology, 2020.
- Bento, V.A.; Gouveia, C.M.; DaCamara, C.C.; Trigo, I.F. A climatological assessment of drought impact on vegetation health index. Agricultural and Forest Meteorology, 259, 1, 2018, 286-295.
- Guillevic, P.; Göttsche, F.; Nickeson, J.; Hulley, G.; Ghent, D.; Yu, Y.; Trigo, I.; Hook, S.; Sobrino, J.A.; Remedios, J.; Román, M.; Camacho. F. Land Surface Temperature Product Validation Best Practice Protocol. Version 1.1. In P. Guillevic, F. Göttsche, J. Nickeson & M. Román (Eds.), Good Practices for Satellite-Derived Land Product Validation (p. 58): Land Product Validation Subgroup (WGCV/CEOS), 2018. https://doi.10.5067/doc/ceoswgcv/lpv/lst.001.
- Dash, P.; Göttsche, F.M.; Olesen, F.S.; Fischer, H. Land surface temperature and emissivity estimation from passive sensor data: Theory and practice-current trends. International Journal of Remote Sensing, 23, 1, 2002, 2563–2594.
- Kogan, F.; Sullivan, J. Development of global drought-watch system using NOAA/AVHRR data. Advances in Space Research, 13, 5, 1993, 219-222.
- Chikodili, N. Outlier detection in multivariate time series data using a fusion of K-medoid, standardized euclidean distance and Z-score. In International Conference on Information and Communication Technology and Applications, 2020. Cham: Springer International Publishing.
- Woo, H. Analysis of cross-referencing artificial intelligence topics based on sentence modeling Applied Sciences. 2020.
- Eeuwijk, P.; Angehan, Z. How to… conduct a Focus Group Discussion (FGD). Methodological Manual. Swiss Tropical and Public Health Institute (SwissTPH), 2017.
- Blanchet, A. ; Gotman, A. L’enquête et Ses Méthodes ; L’entretien ; Nathan: Paris, France, 1992.
- Makate. C. Increasing resilience of smallholder farmers to climate change through multiple adoption of proven climate-smart agriculture innovations. Lessons from Southern Africa. Journal of environmental management, 2019.
- Twongyirwe. R. Perceived effects of drought on household food security in South-western Uganda: Coping responses and determinants. Weather and Climate Extremes, 2019.
- Ebnou Abdem. S, et al. Using Logistic Regression to Predict Access to Essential Services: Electricity and Internet in Nouakchott, Mauritania. Sustainability, 2019.
- Issaharou-Matchi. I, et al. Rural Communities’ Perceptions of Climate Change and Its Impacts on Their Livelihood in Southeastern Niger. International Journal of Environment and Climate Change, 2019.
- Montcho. M, et al. Perception and adaptation strategies of dairy farmers towards climate variability and change in West Africa. Climatic Change, 2022.
- Atkinson. w, et al. Charting fields and spaces quantitatively: from multiple correspondence analysis to categorical principal components analysis. Quality & Quantity, 2024.
- Arefi, M, et al. Draught force prediction from soil relative density and relative water content for a non-winged chisel blade using finite element modeling. Journal of Terramechanic. 2022.
- Smith, J. Climate Variability and Its Impact on Forest Hydrology on the Upper Western Atlantic Coastal Plain. Environmental Research Letters, 13, 3, 2018.
- Jones, E., et al. "Adaptive Strategies to Mitigate the Impact of Drought in a Changing Climate: Implications for Future Resilience." Ecology and Society, 22, 1, 2017.
- Ewbank, R.; Perez, C.; Cornish, H.; Worku, M.; Woldetsadik, S. Building resilience to El Niño-related drought: experiences in early warning and early action from Nicaragua and Ethiopia. Disasters, 43, 3, 2019, 345−367. https://doi:10.1111/disa.12340.
- Patt, A.; Suarez, P.; Gwata, C. Effects of seasonal climate forecasts and participatory workshops among subsistence farmers in Zimbabwe. PNAS, 102, 35, 2005, 12623-12628. [CrossRef]
Figure 1.
West Pokot County, sub-counties, wards, locations, and sub-locations.
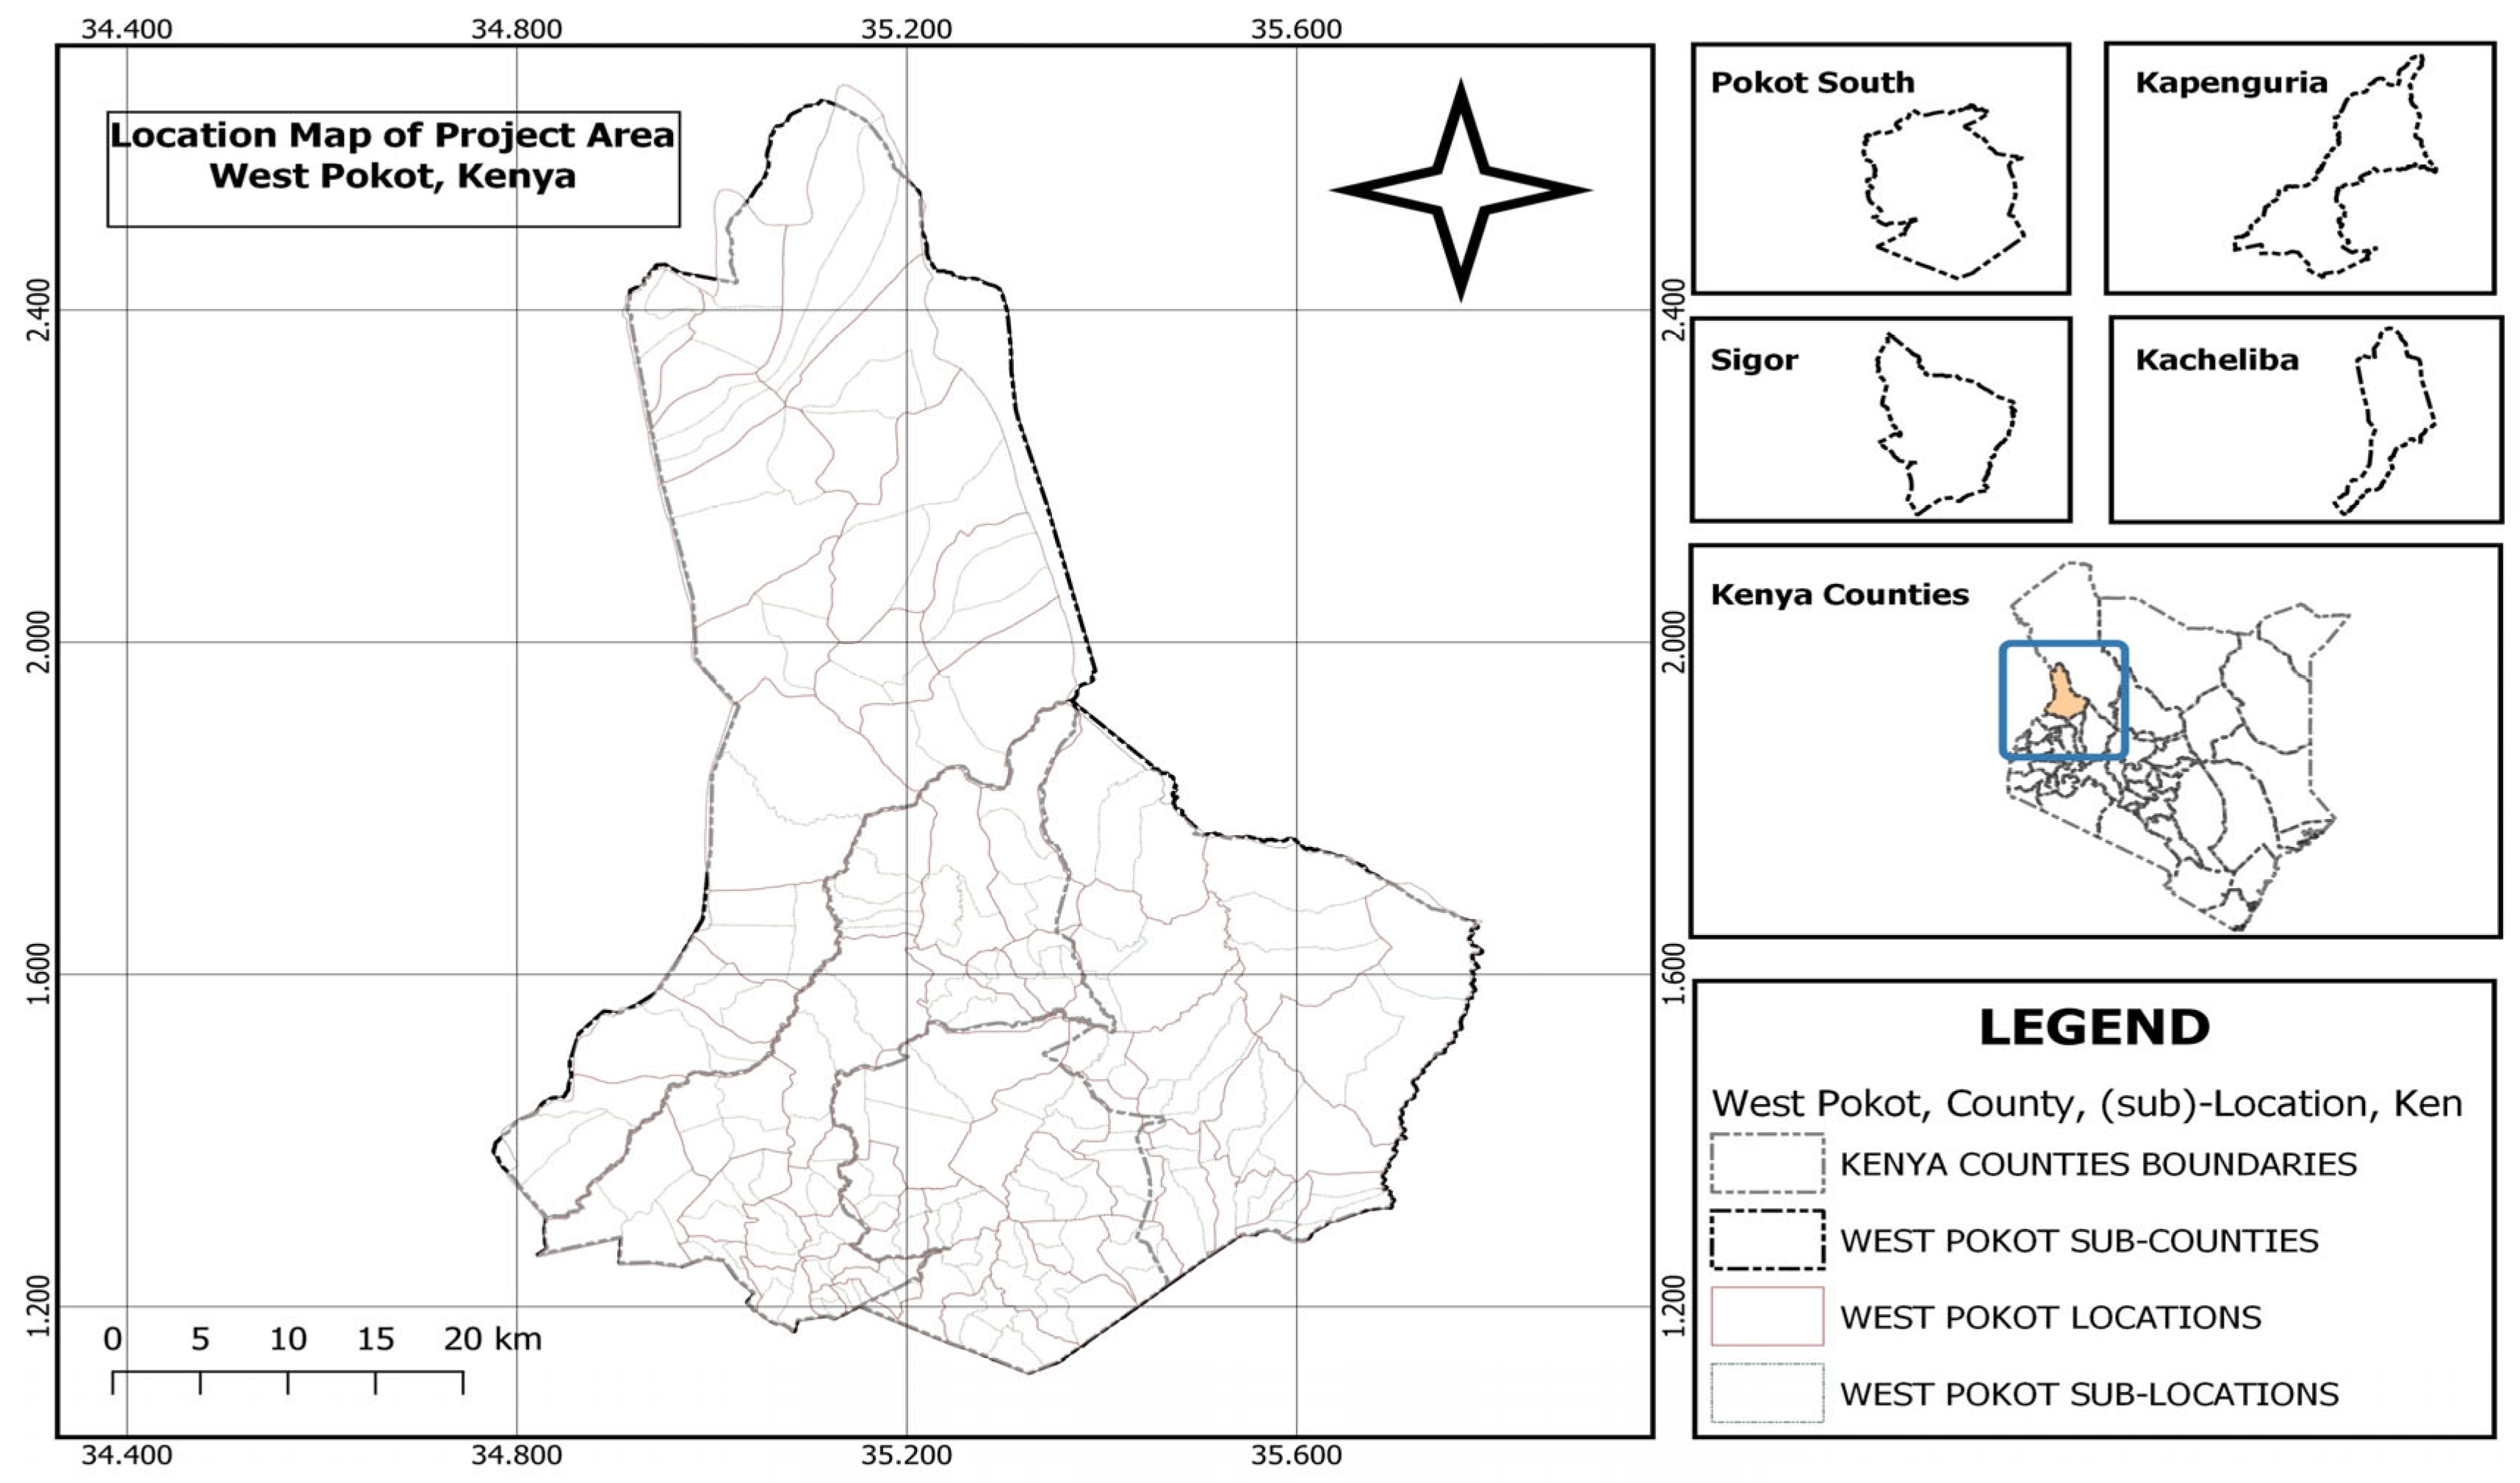
Figure 2.
Research methodology and collection strategy.
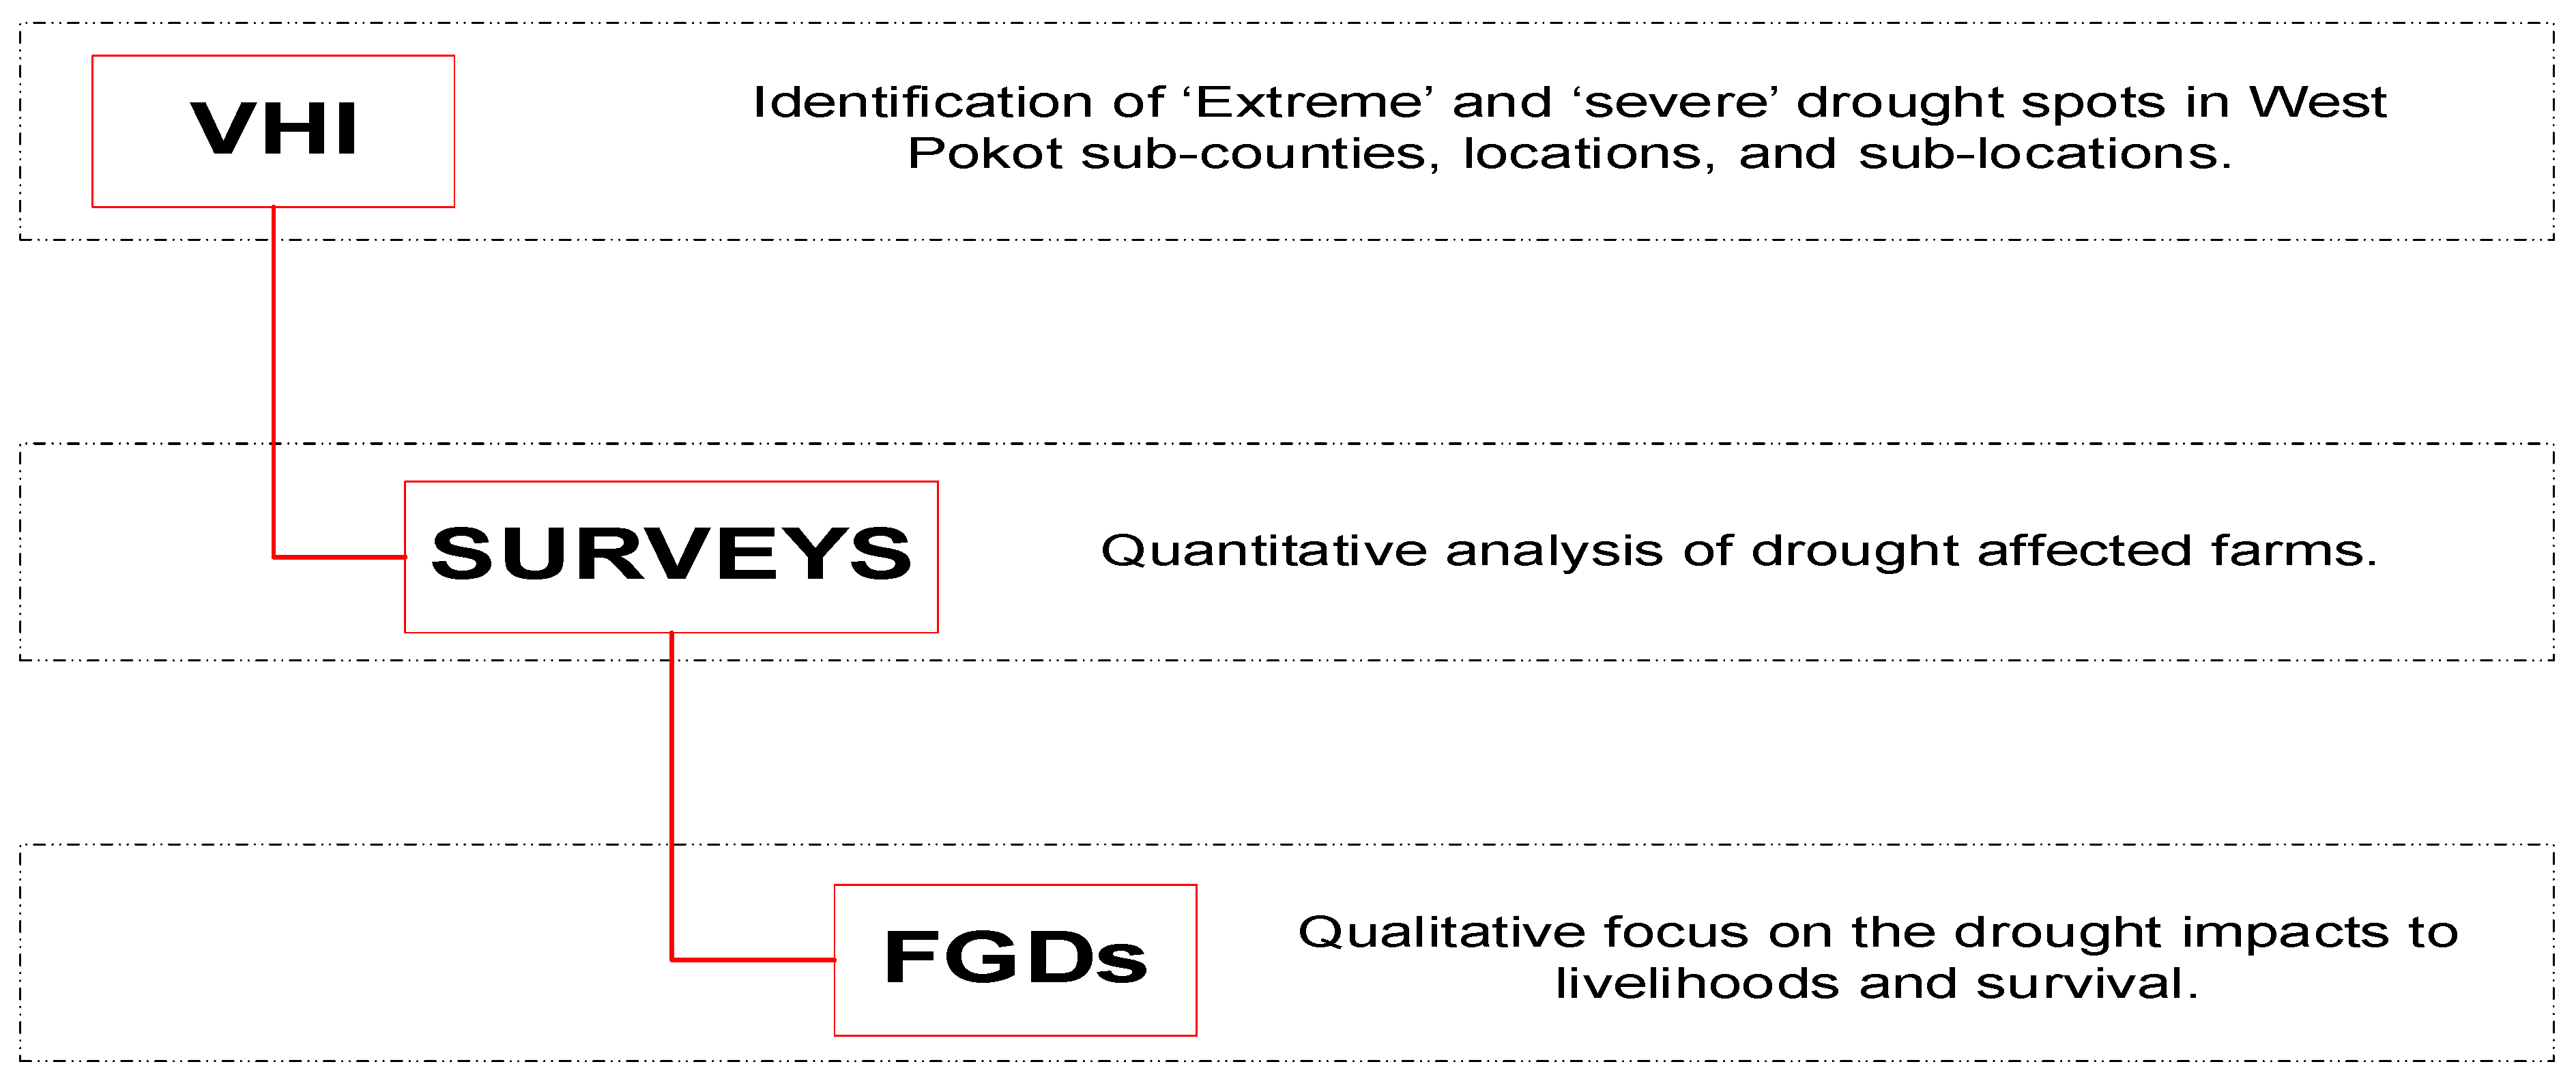
Figure 3.
Framework for VHI calculation [43].
Figure 3.
Framework for VHI calculation [43].
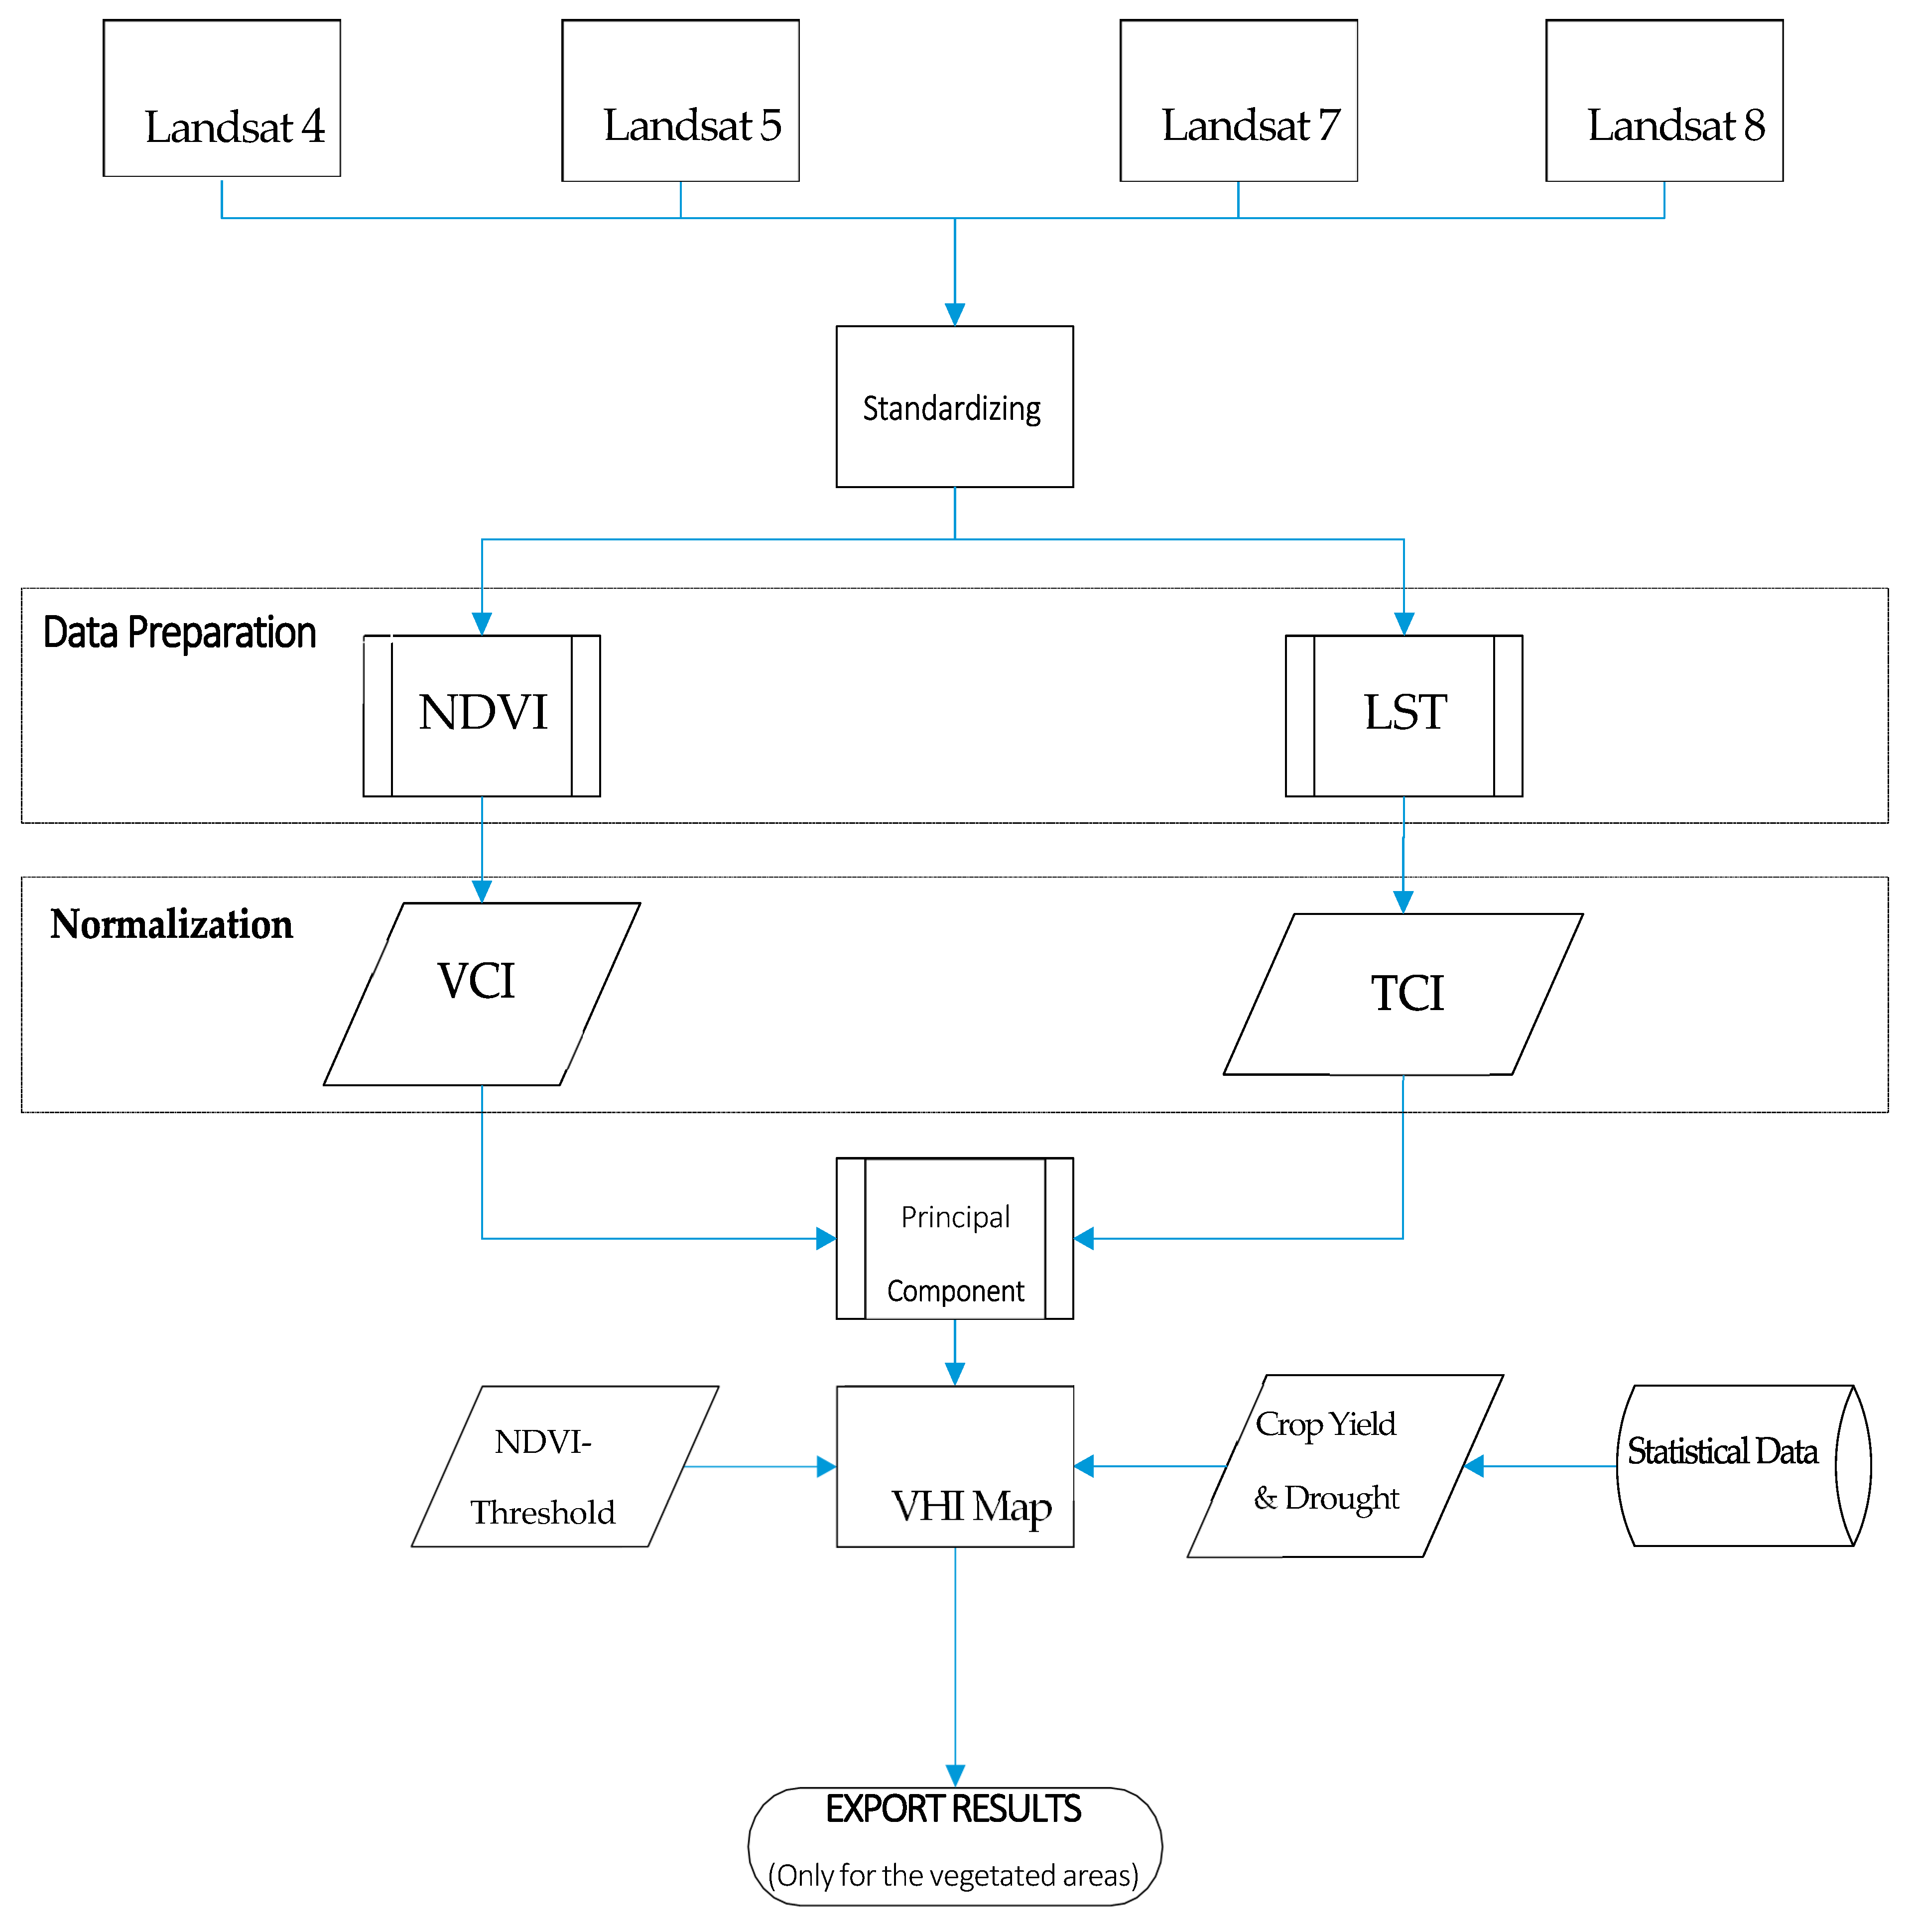
Figure 4.
Distribution of Households Activities types.
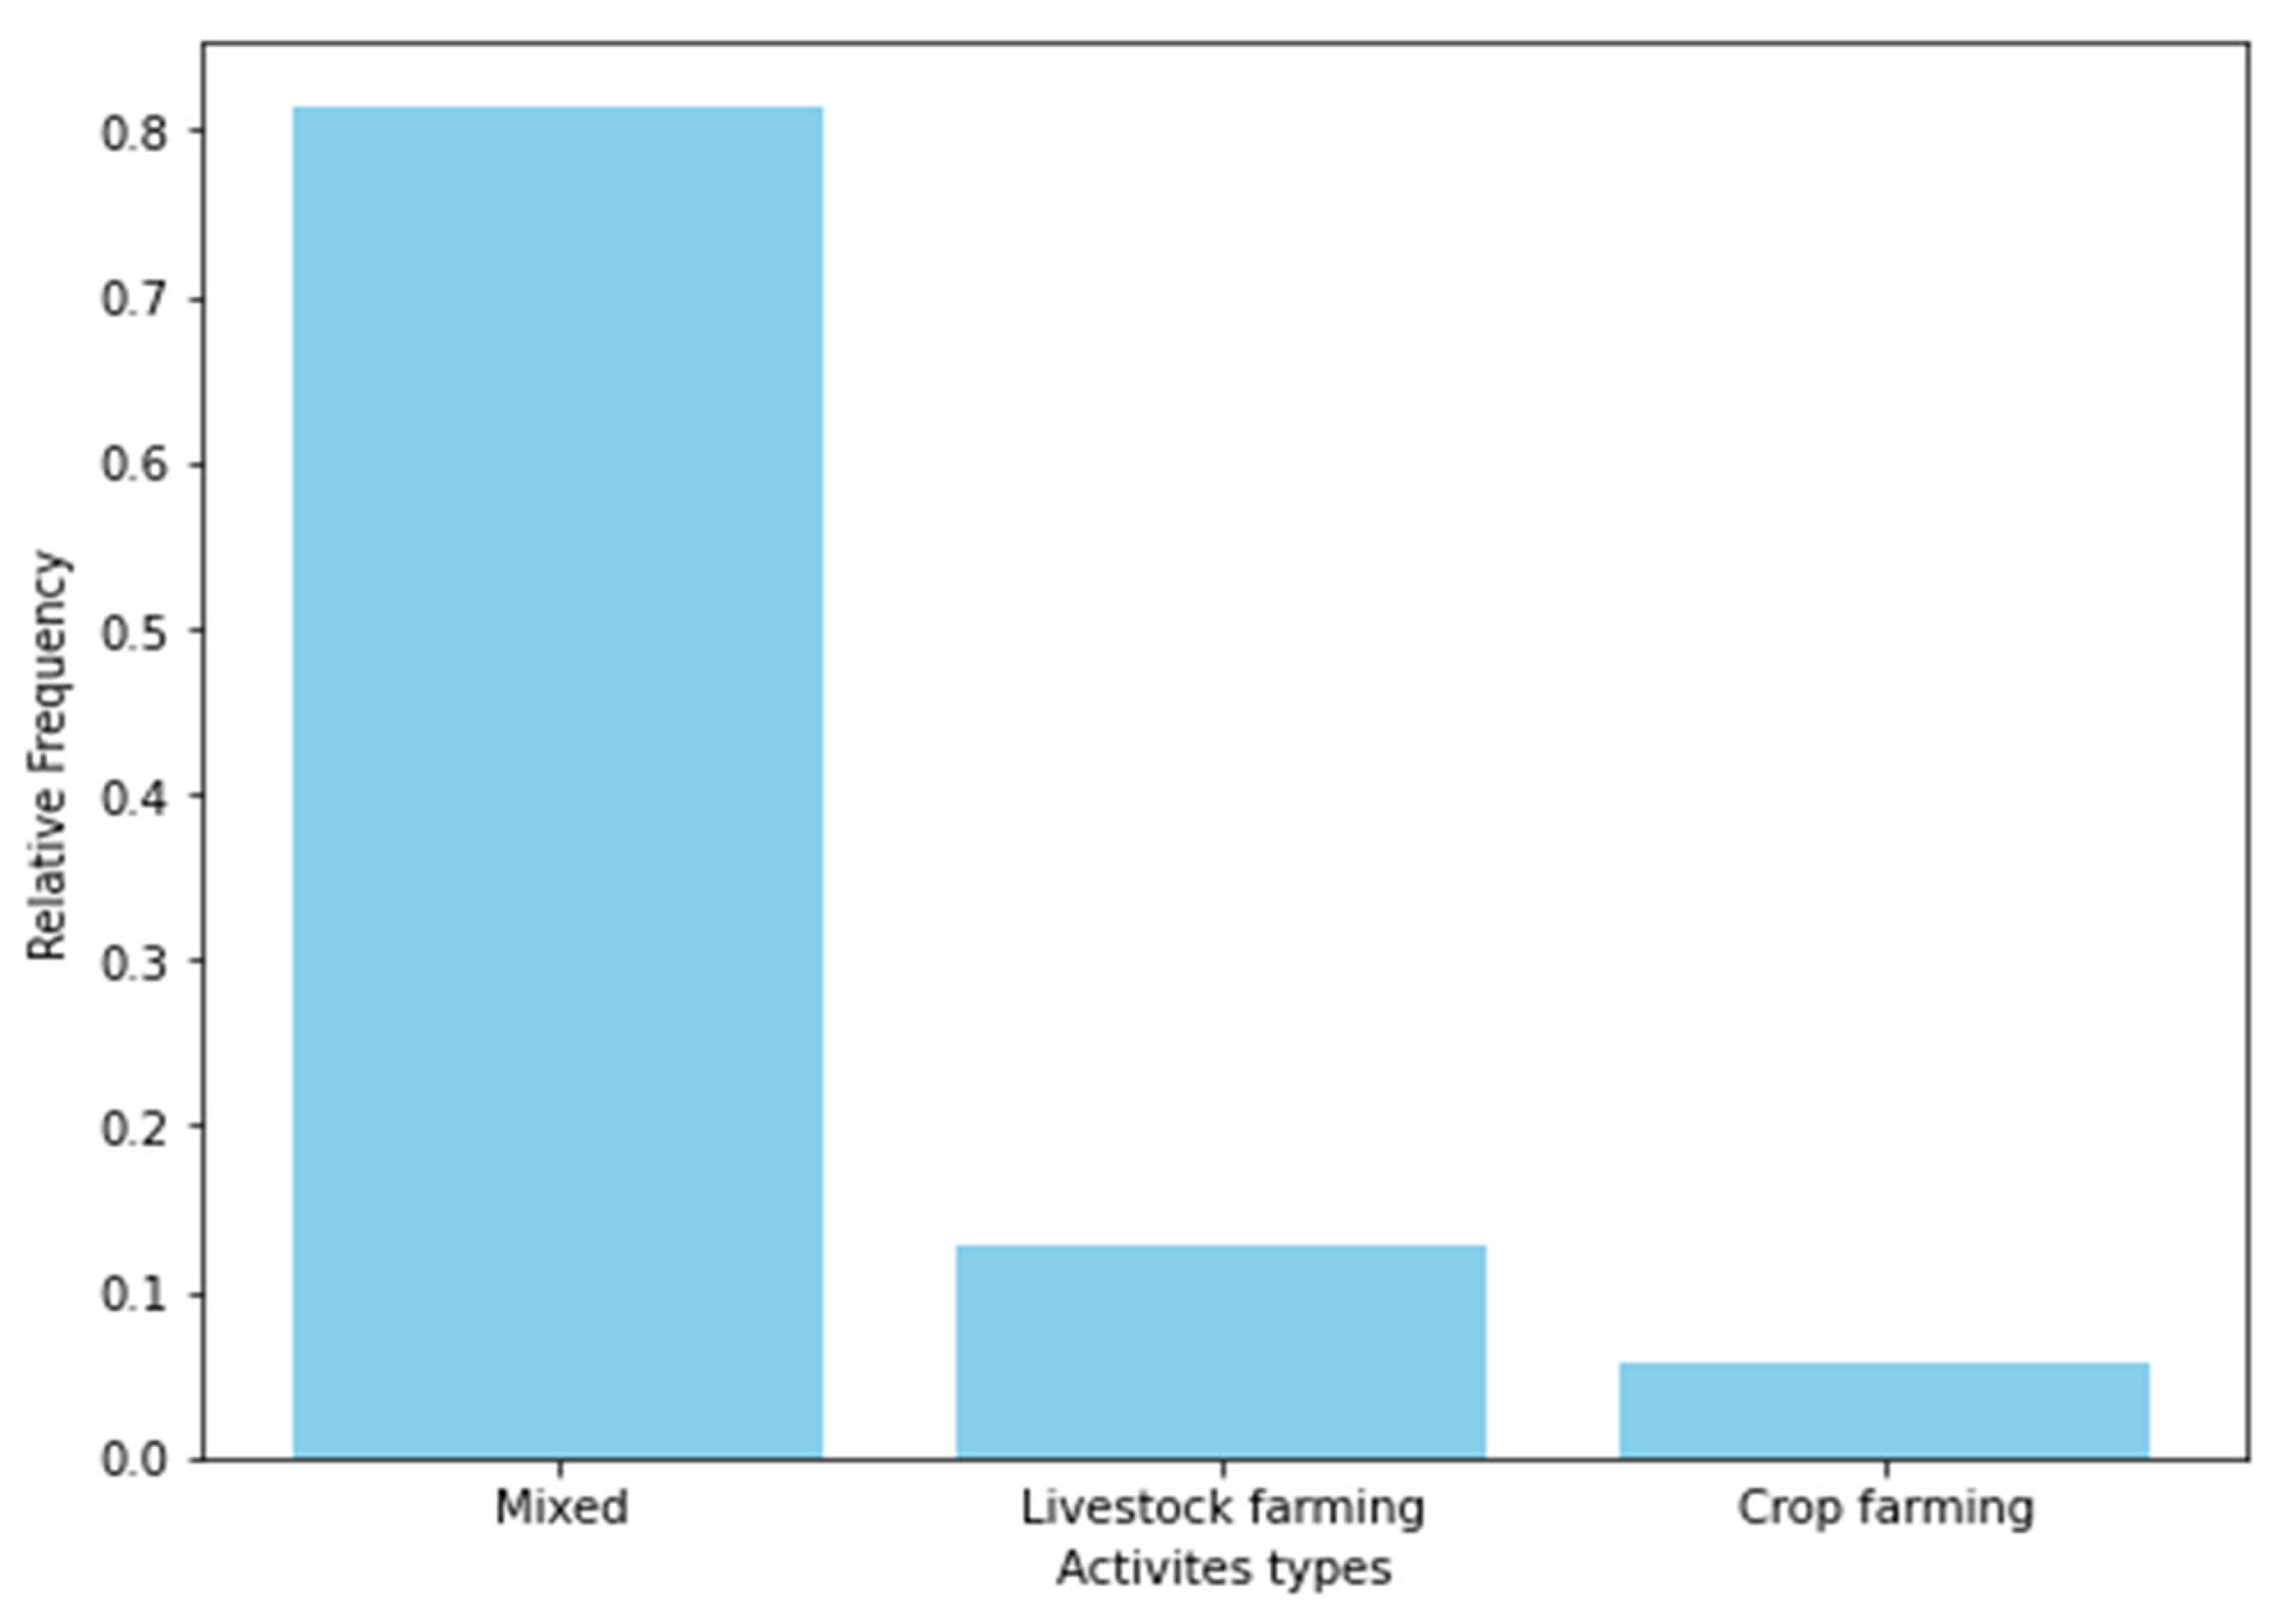
Figure 5.
Comparison of Extreme and Severe Drought Incidence in Kacheliba and Sigor (1990-2020).Figure 5. illustrates the drought incidence trends from 1990 to 2020 in Kacheliba and Sigor, revealing distinct patterns in how each sub-county has experienced extreme and severe droughts. During this period, there was a notable increase in both the frequency and severity of drought conditions, particularly between 1995 and 2005. This analysis highlights three major drought events within this decade, emphasizing the significant challenges these events posed to the local communities and marking a critical period of environmental stress for these regions.
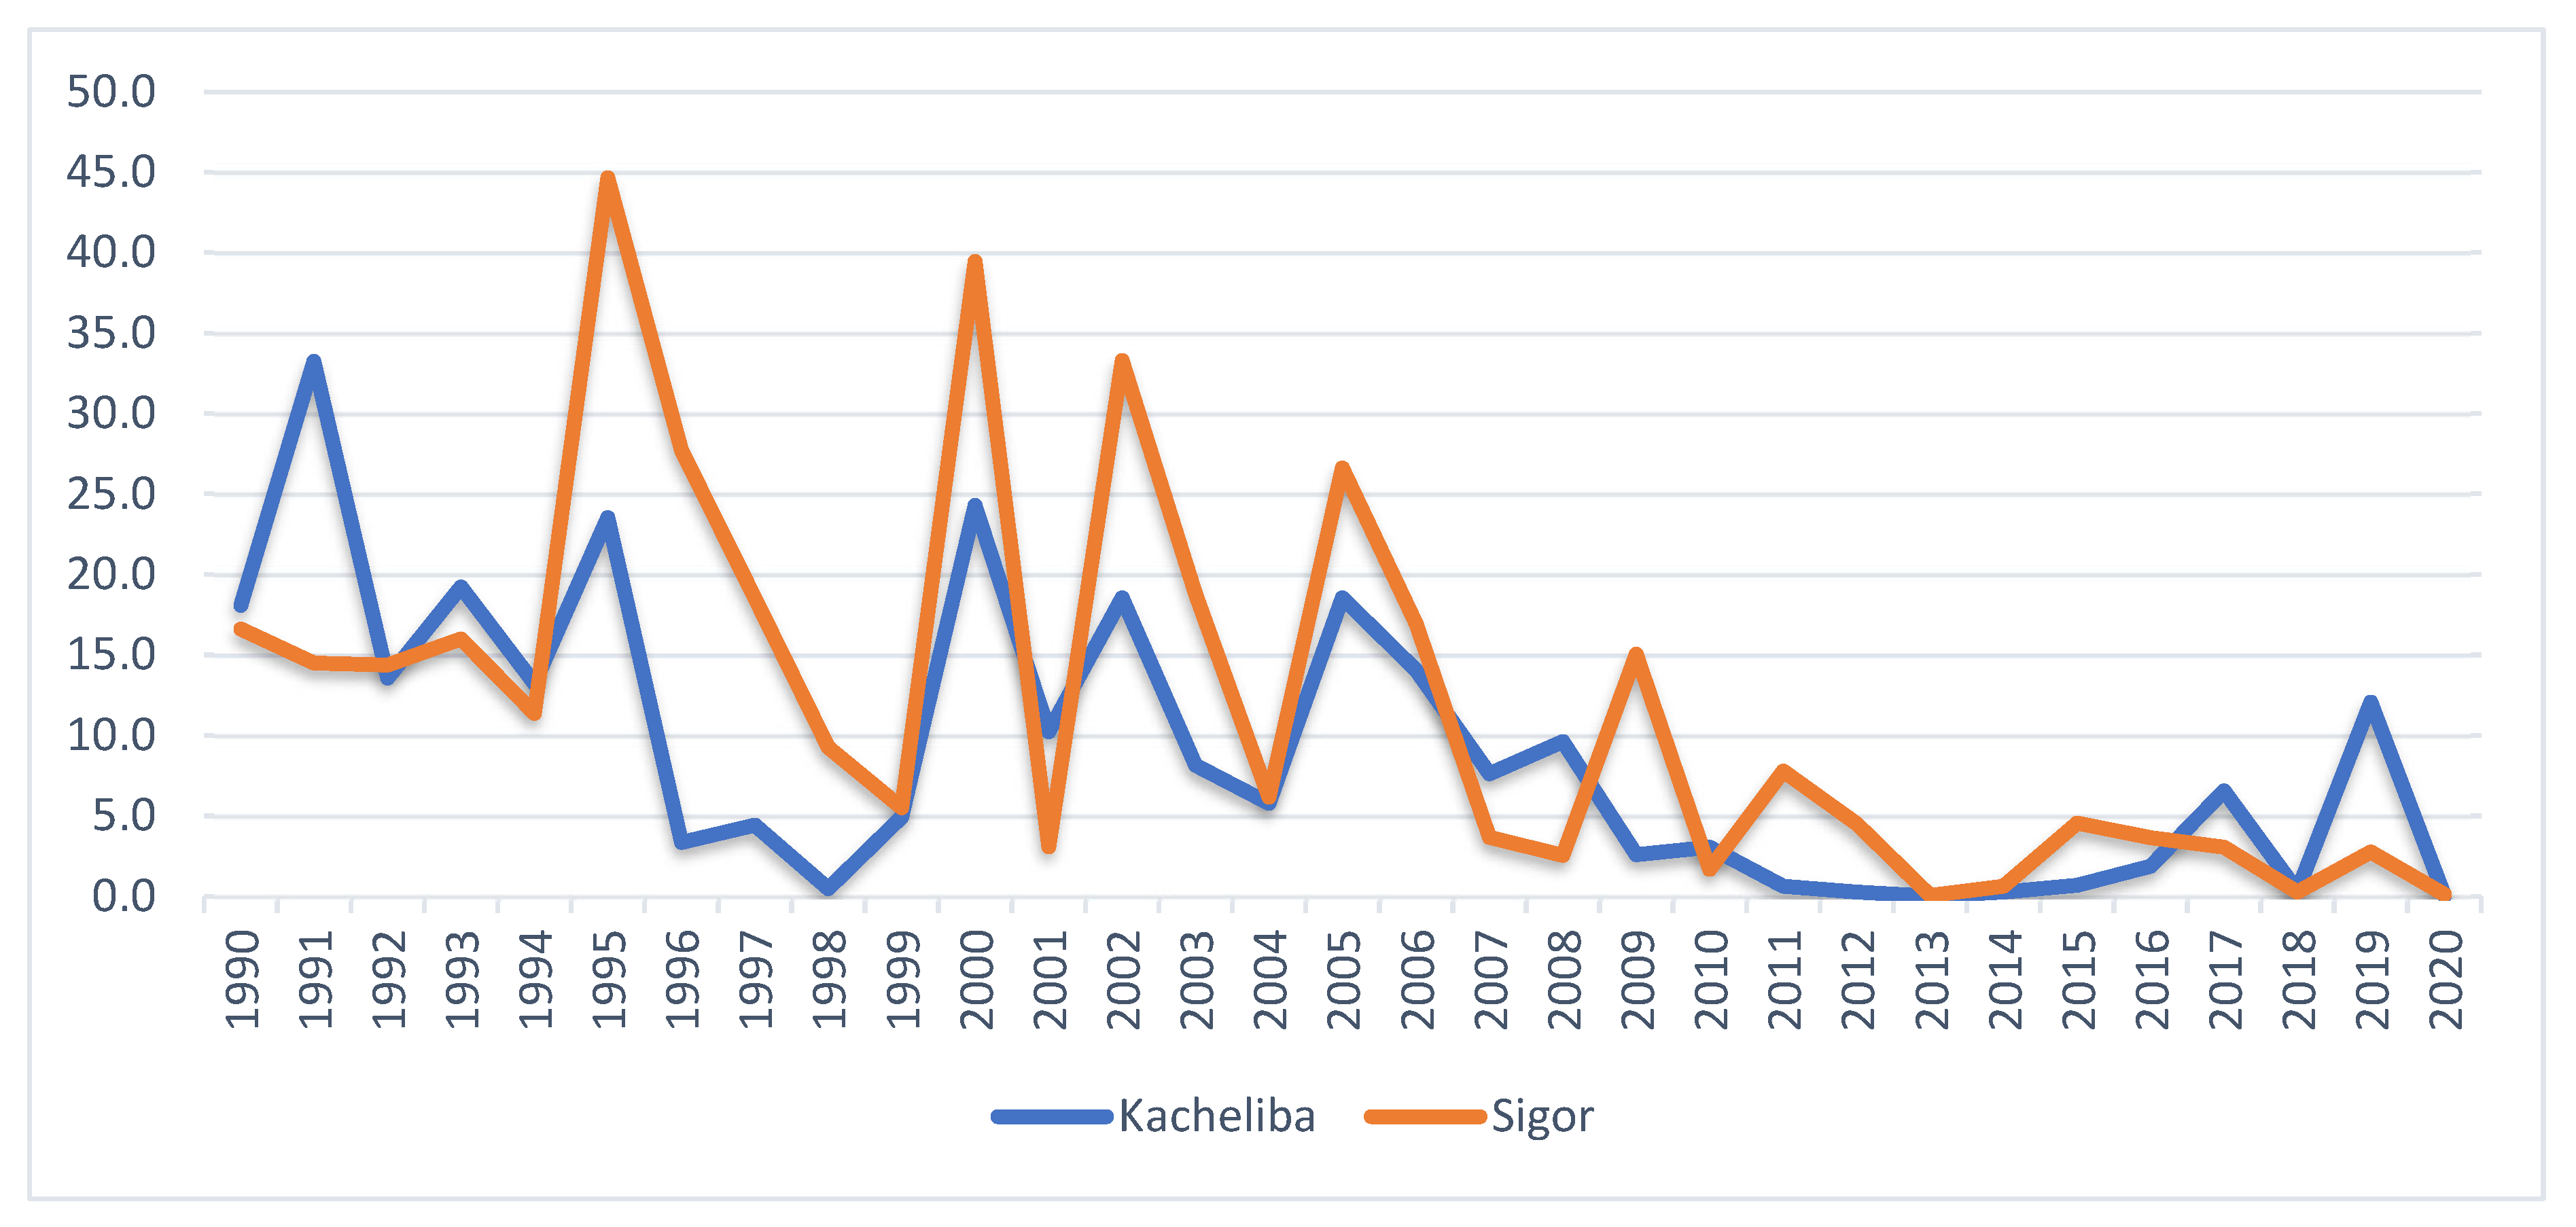
Figure 6.
VHI for Sigor, West Pokot.
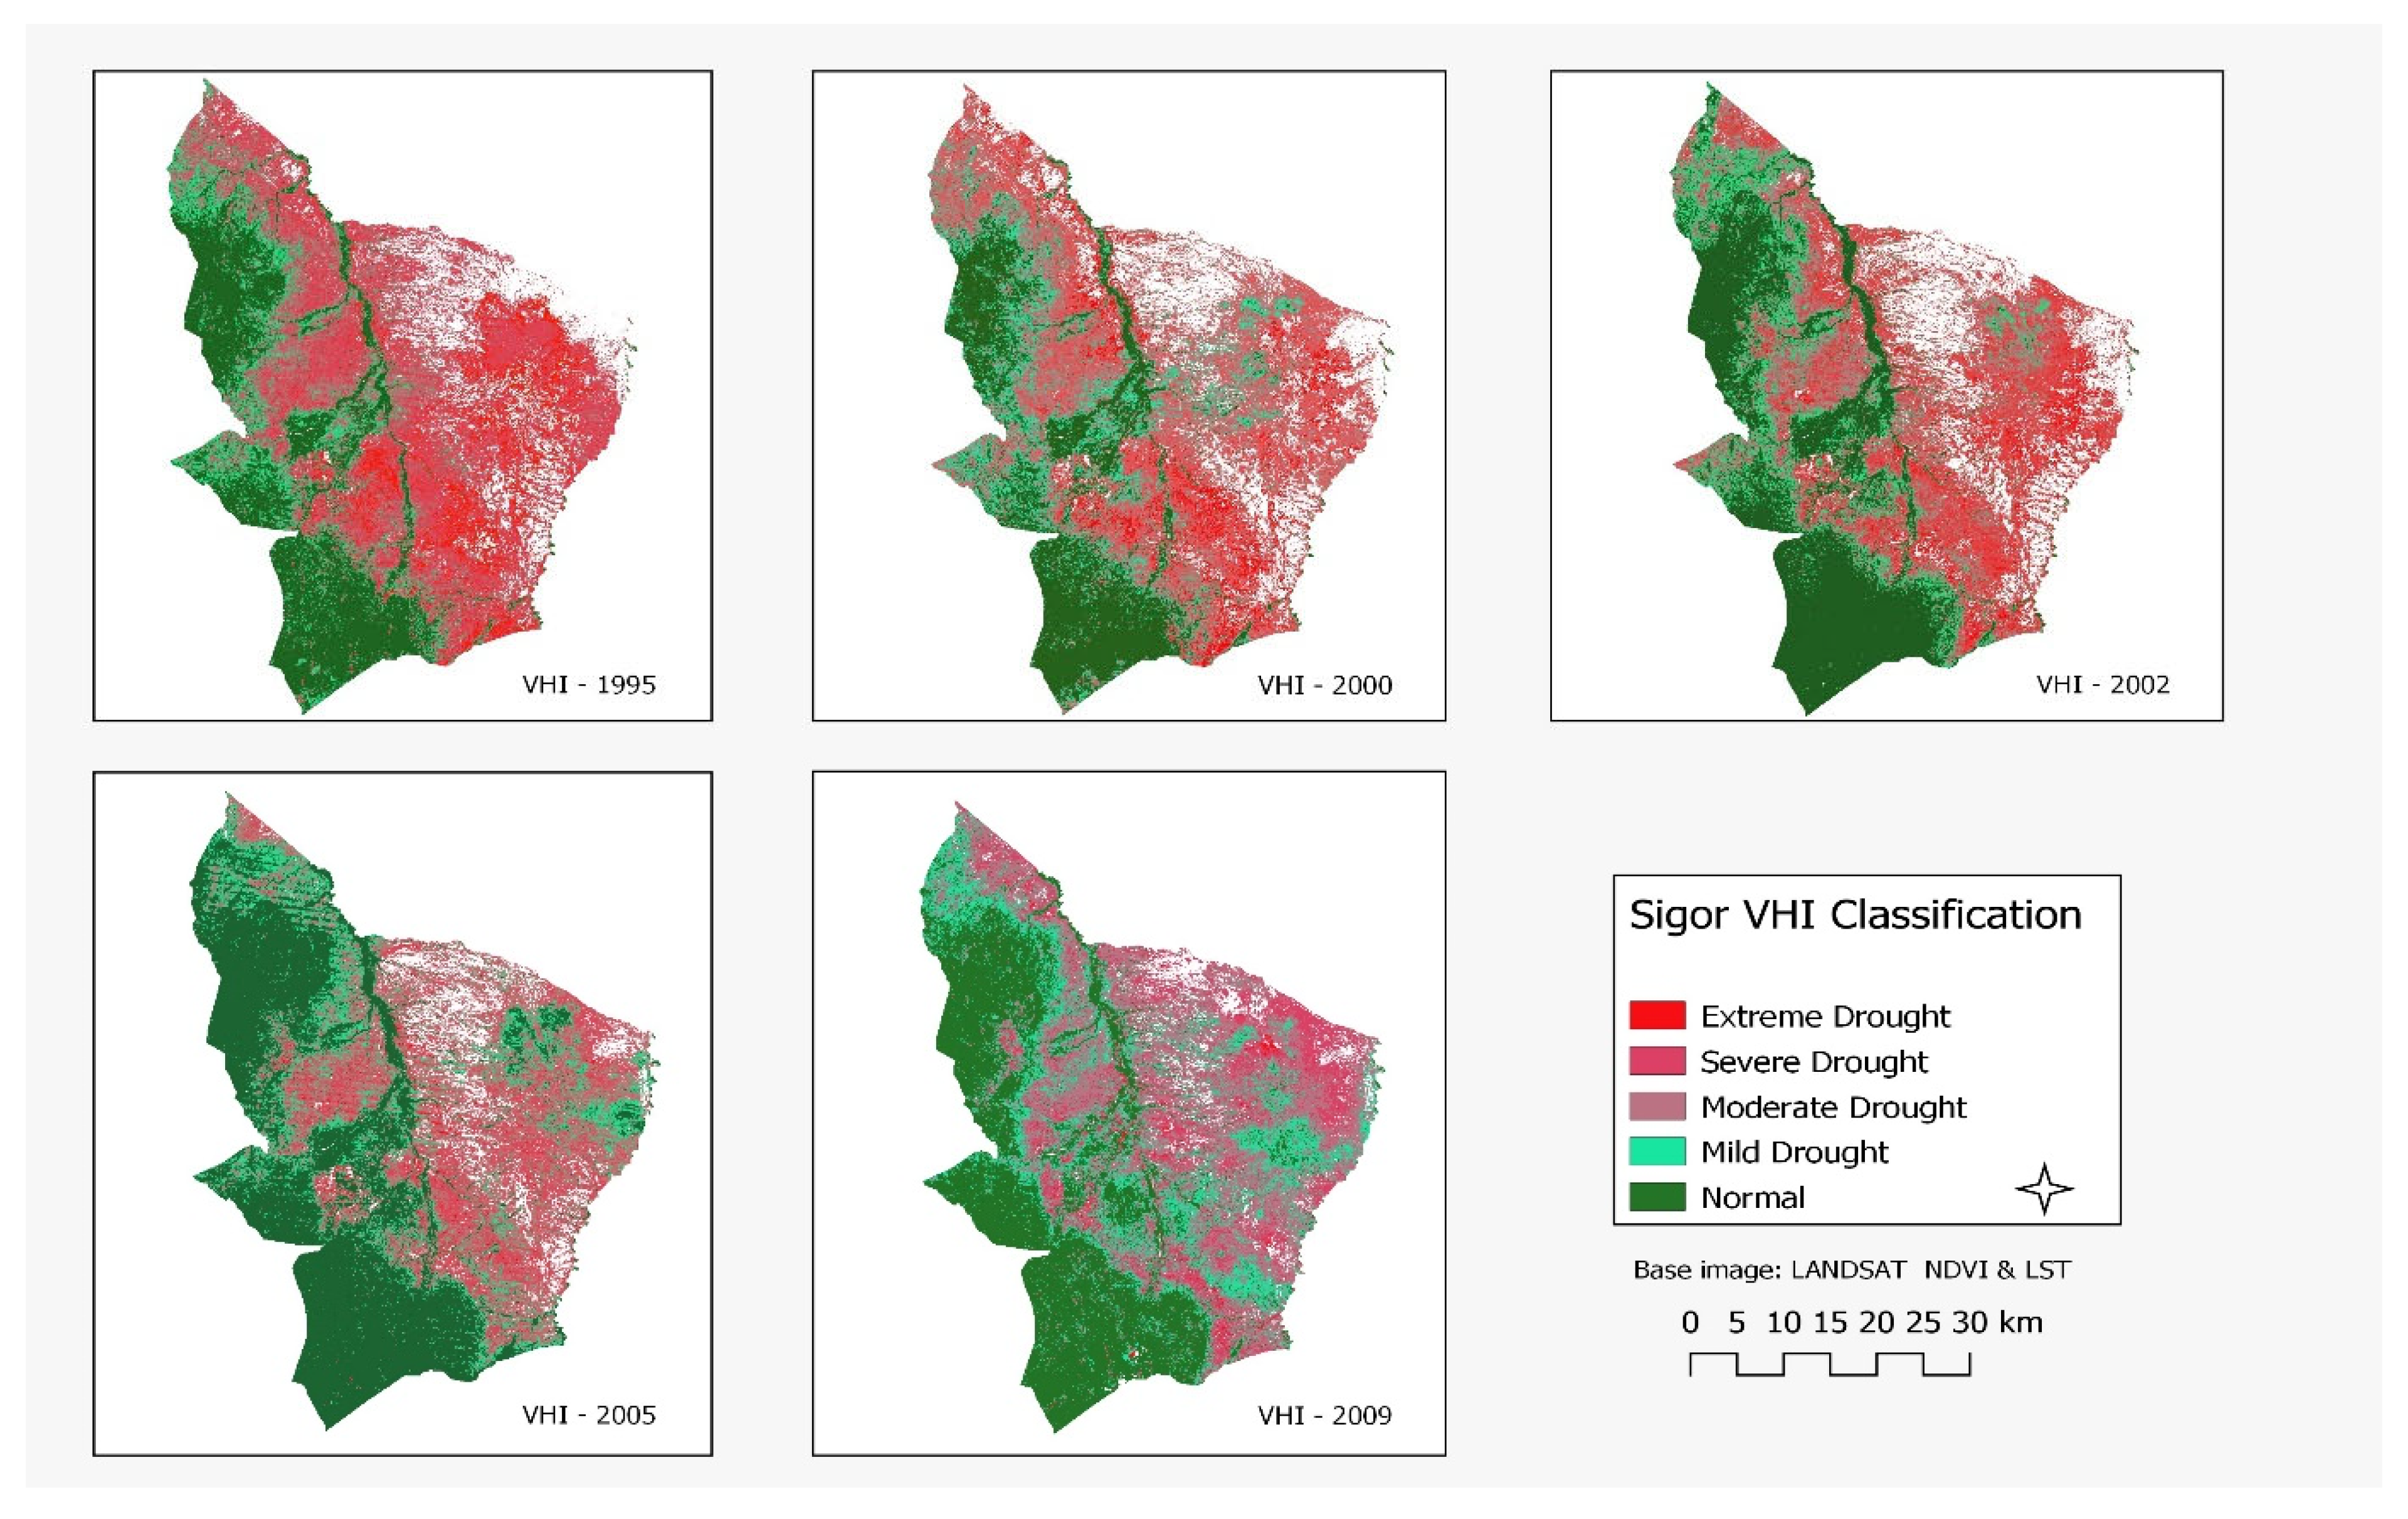
Figure 7.
Sigor VHI classification percentage.
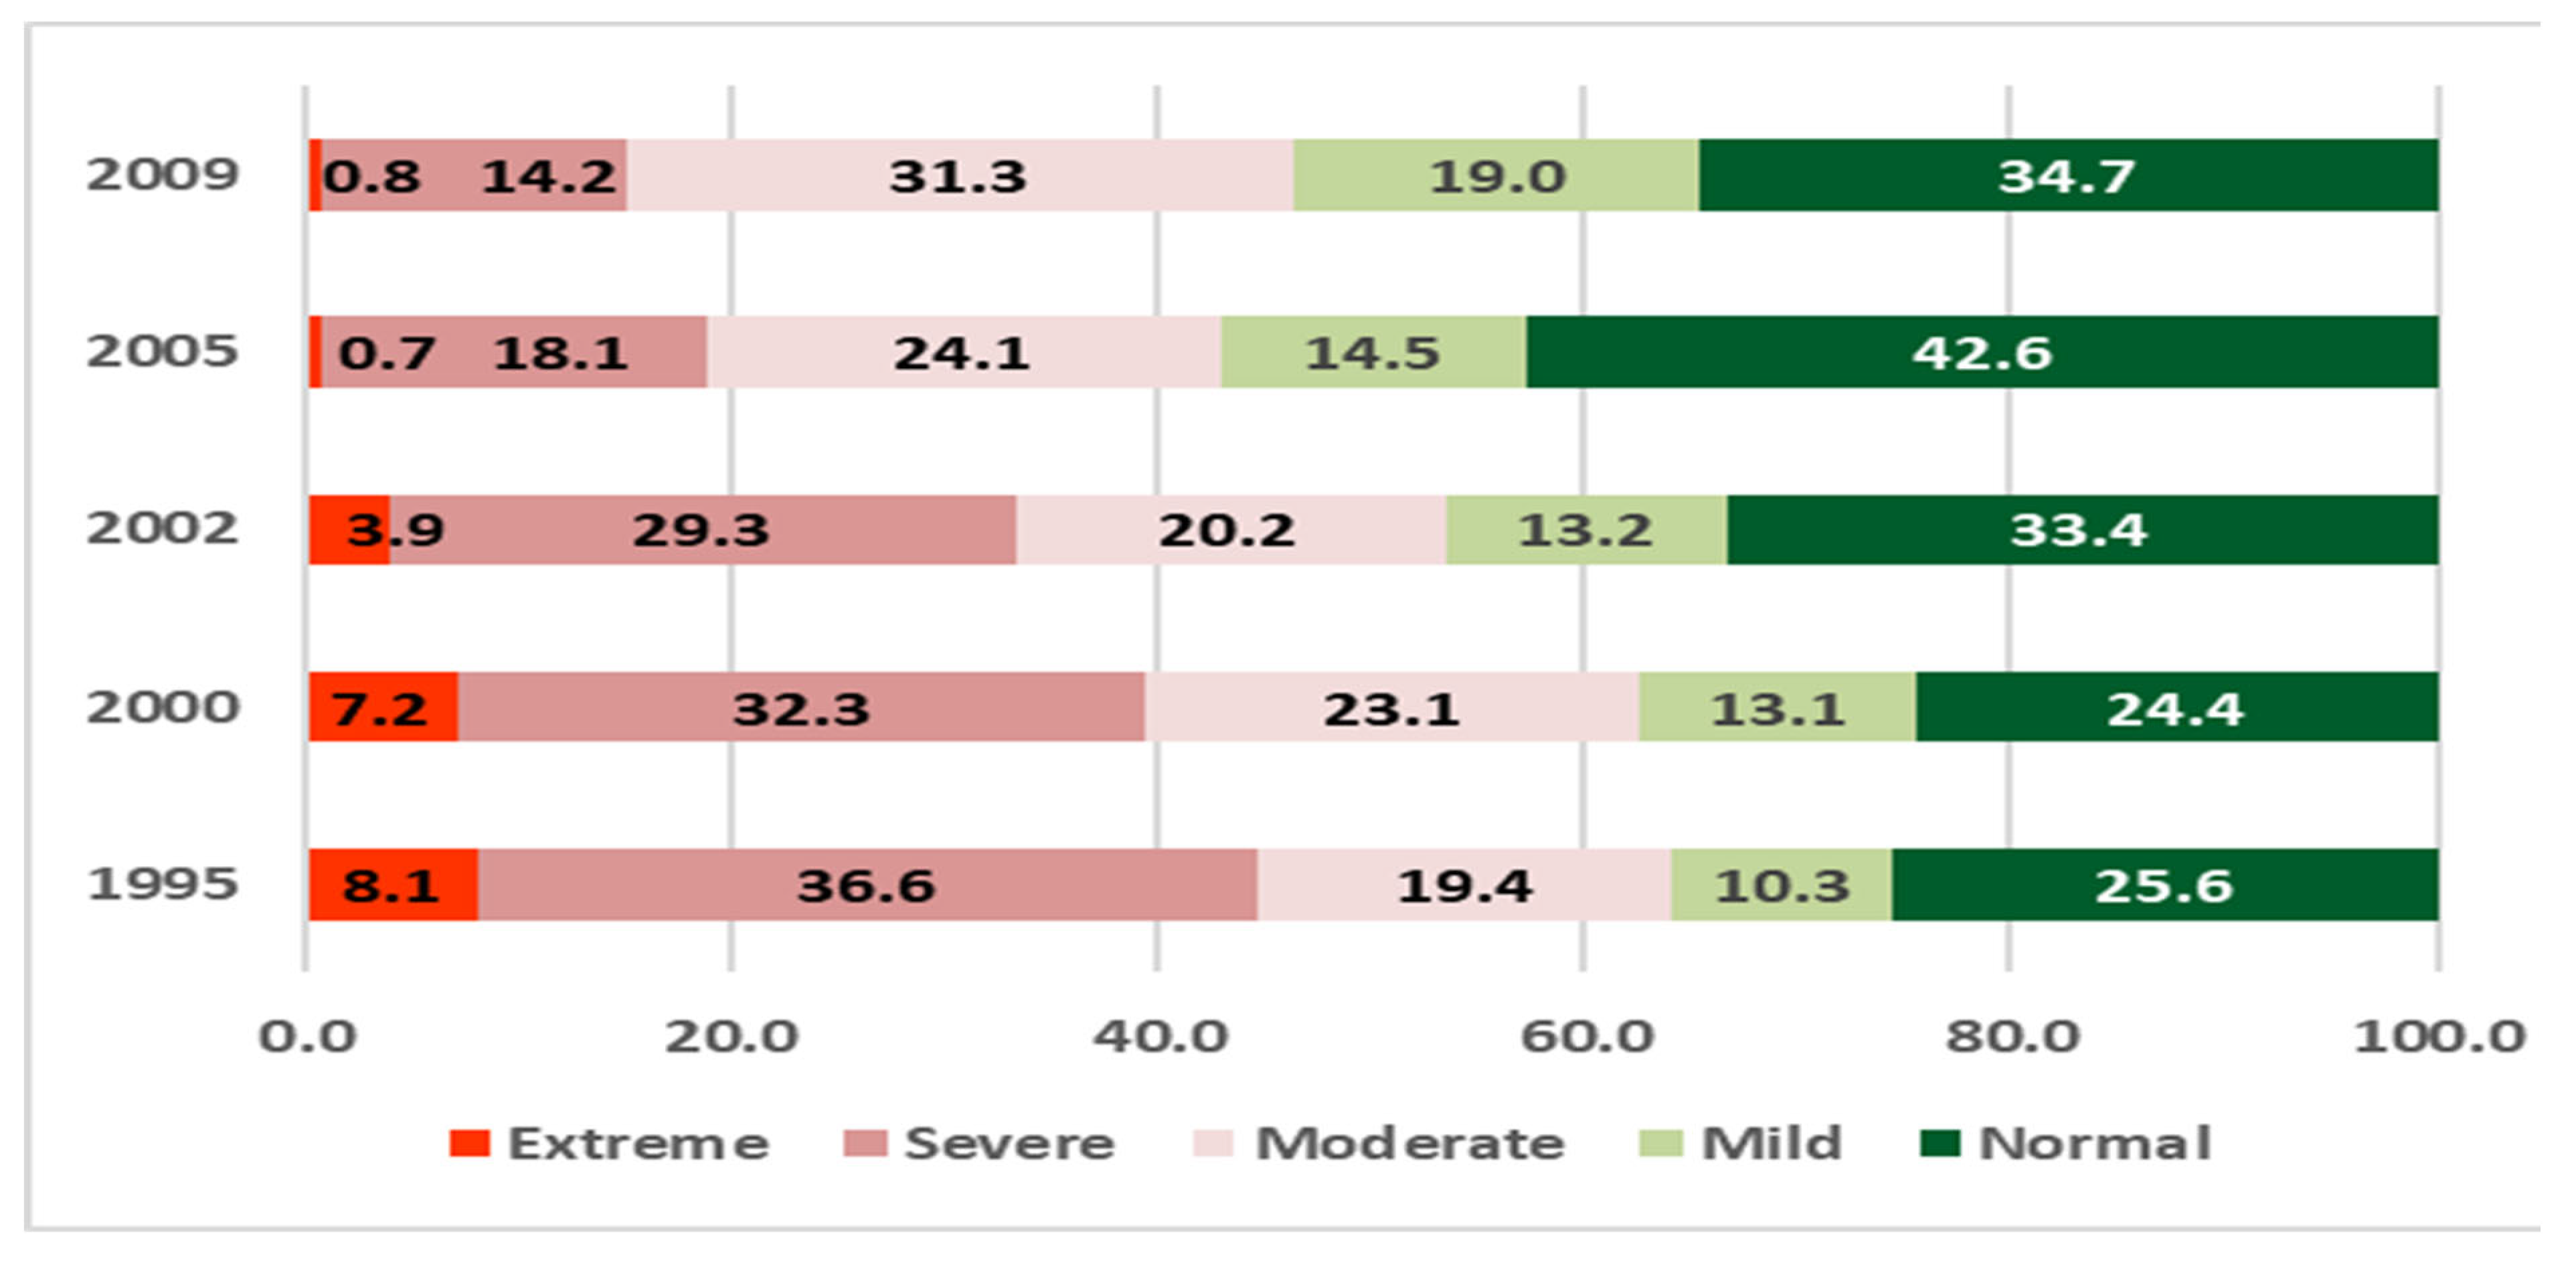
Figure 8.
VHI for Kacheliba, West Pokot.
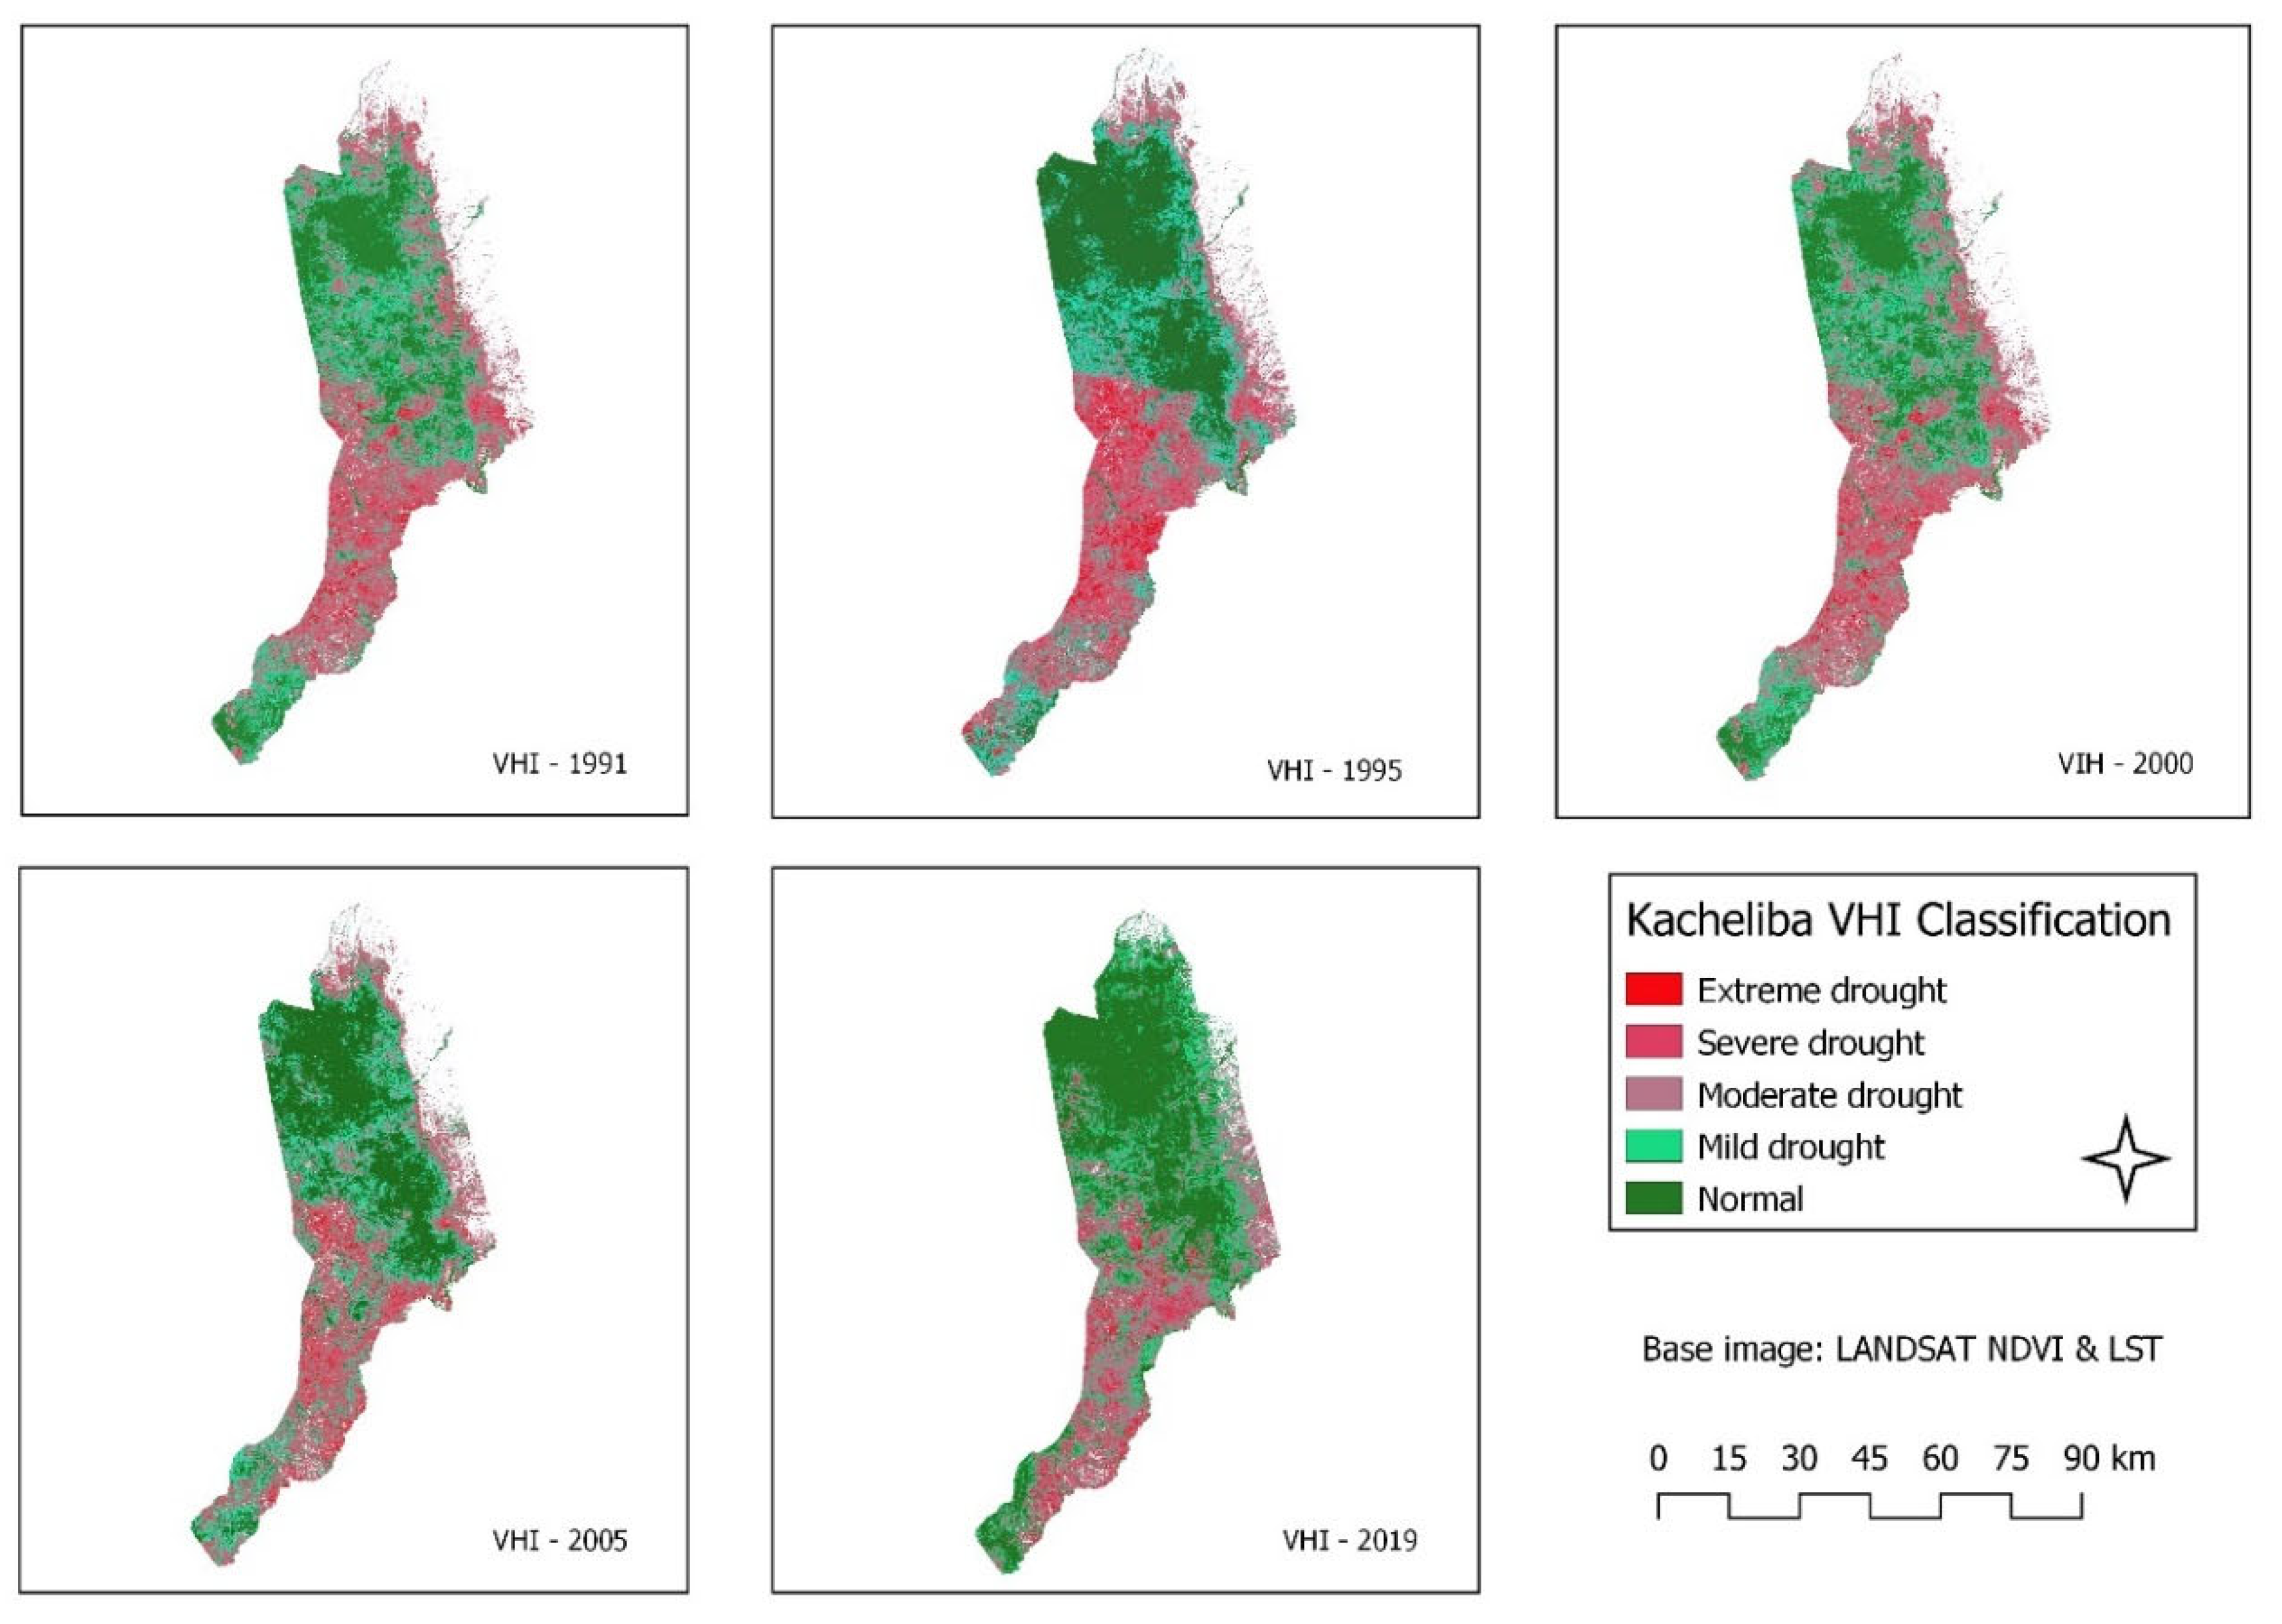
Figure 9.
Kacheliba VHI classification.
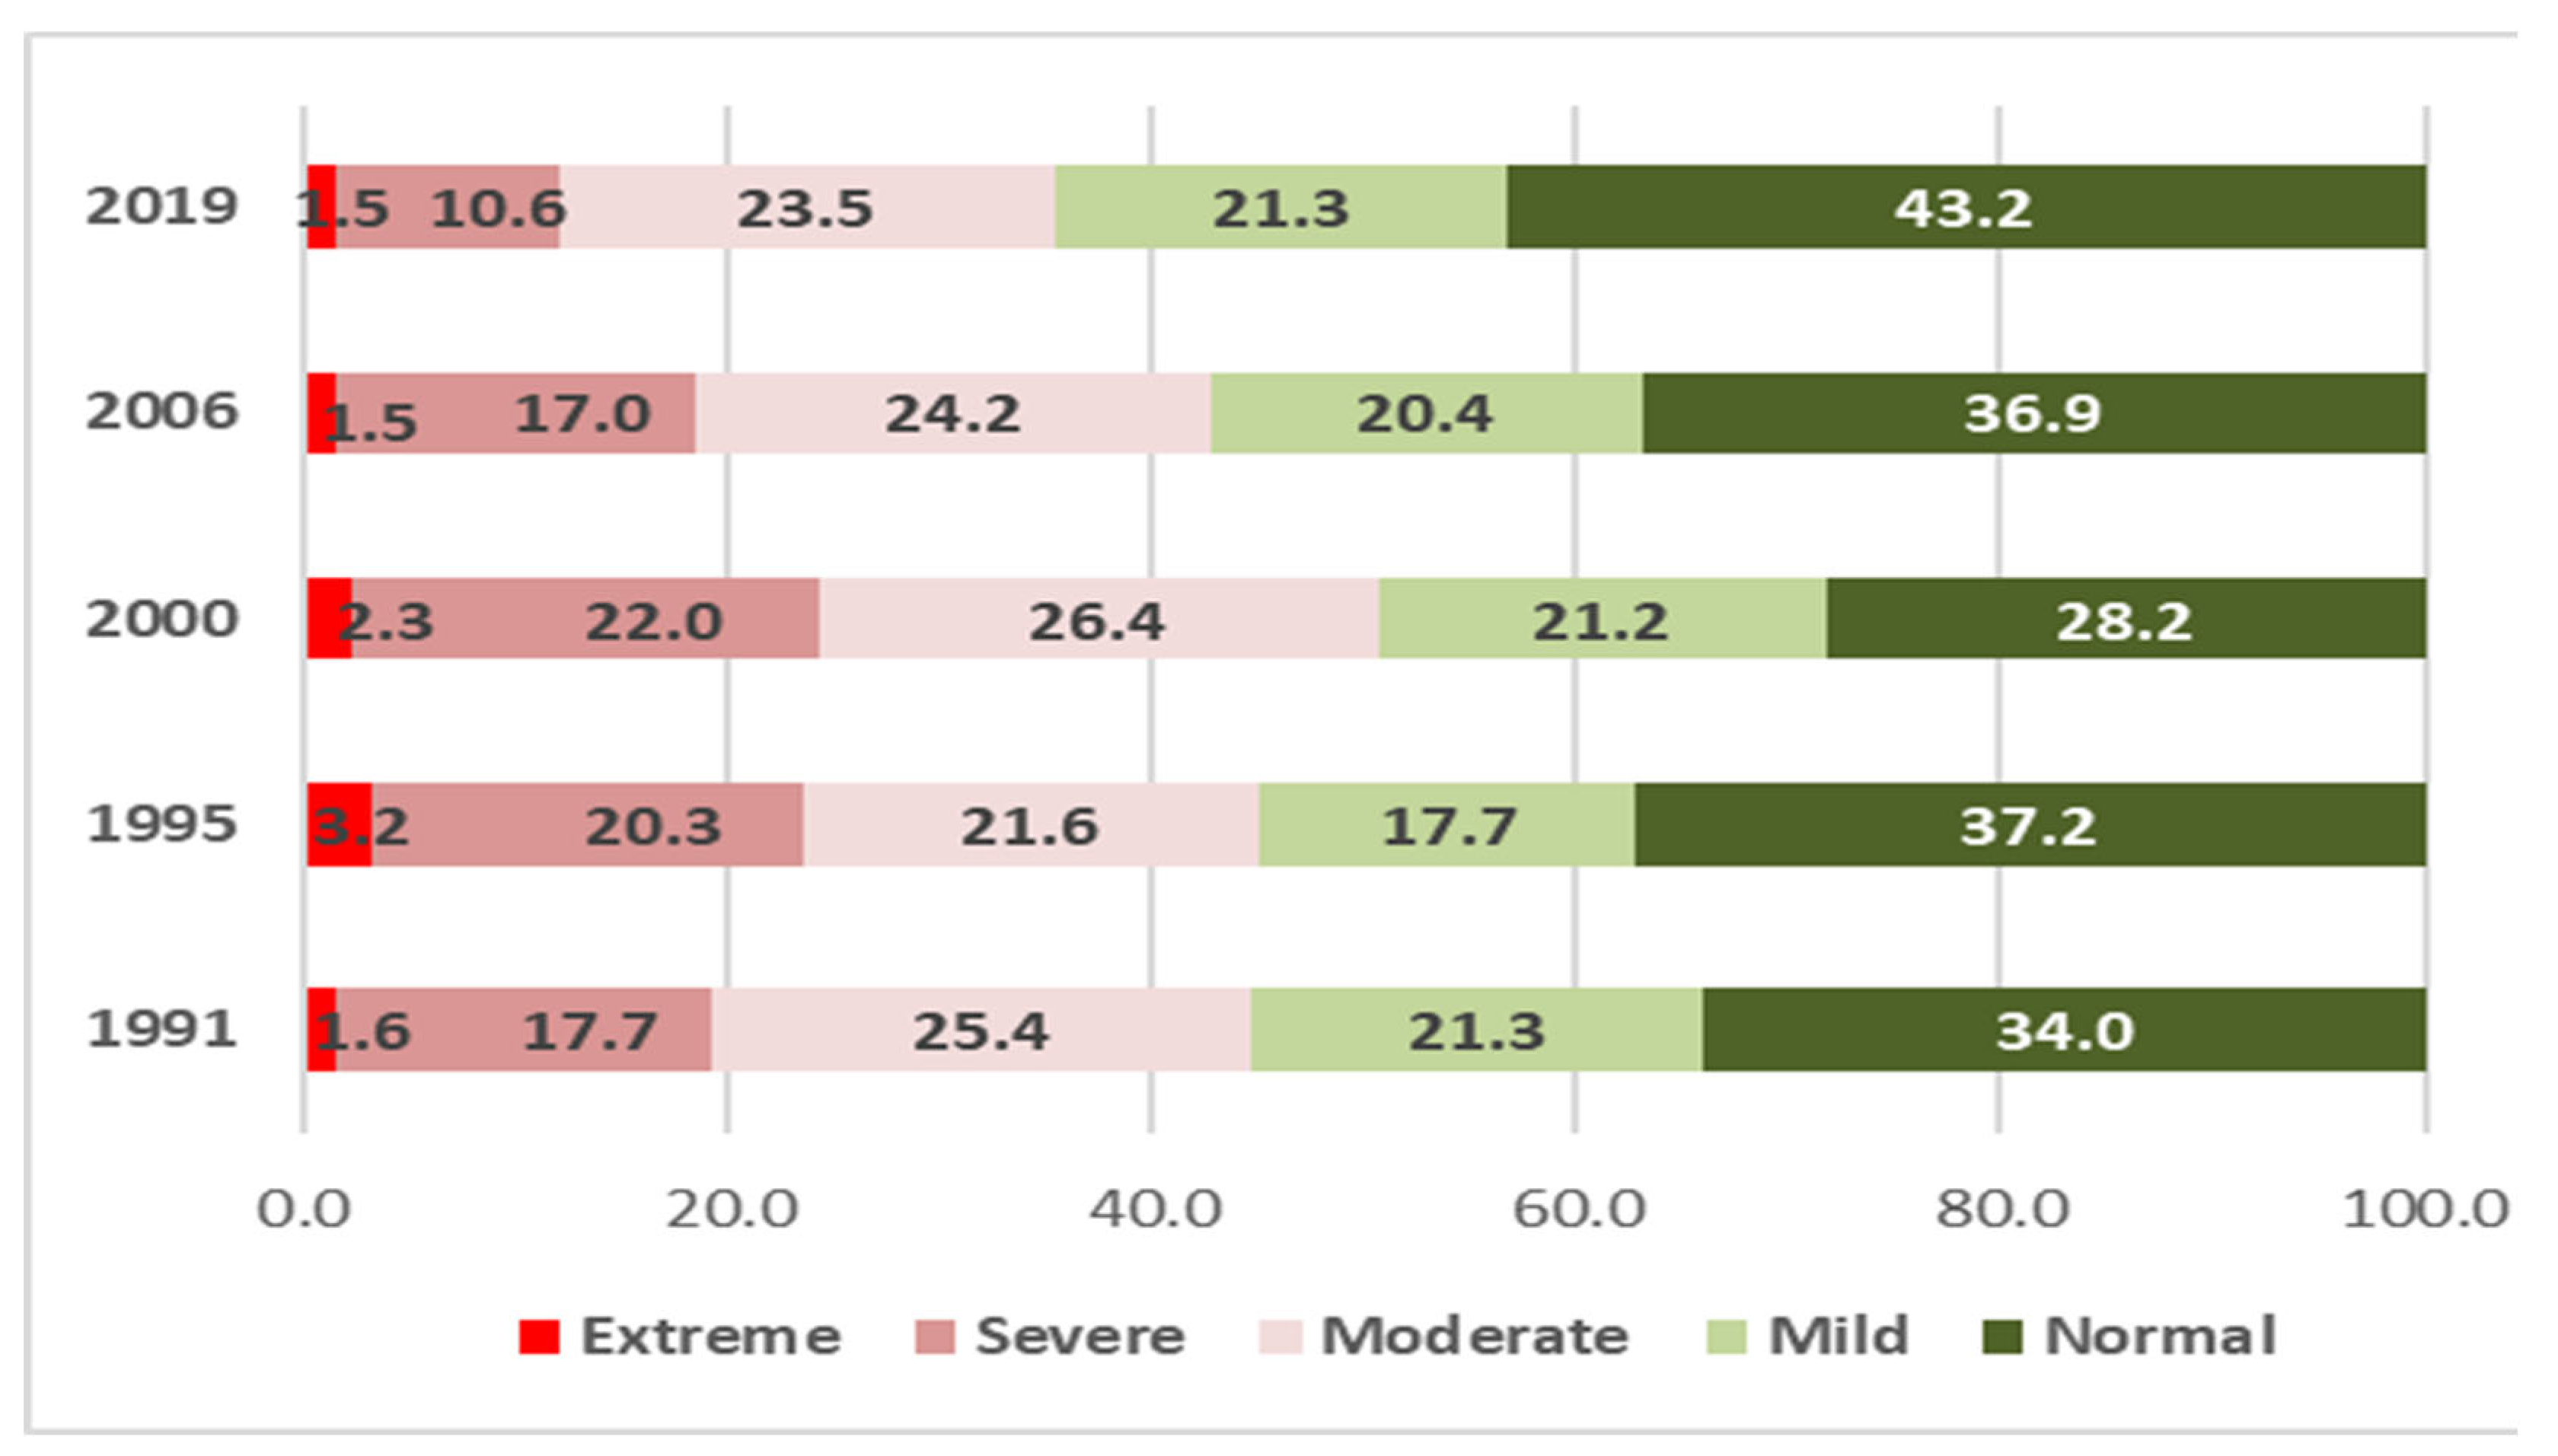
Figure 10.
Distribution of LST values in Celsius for West Pokot.
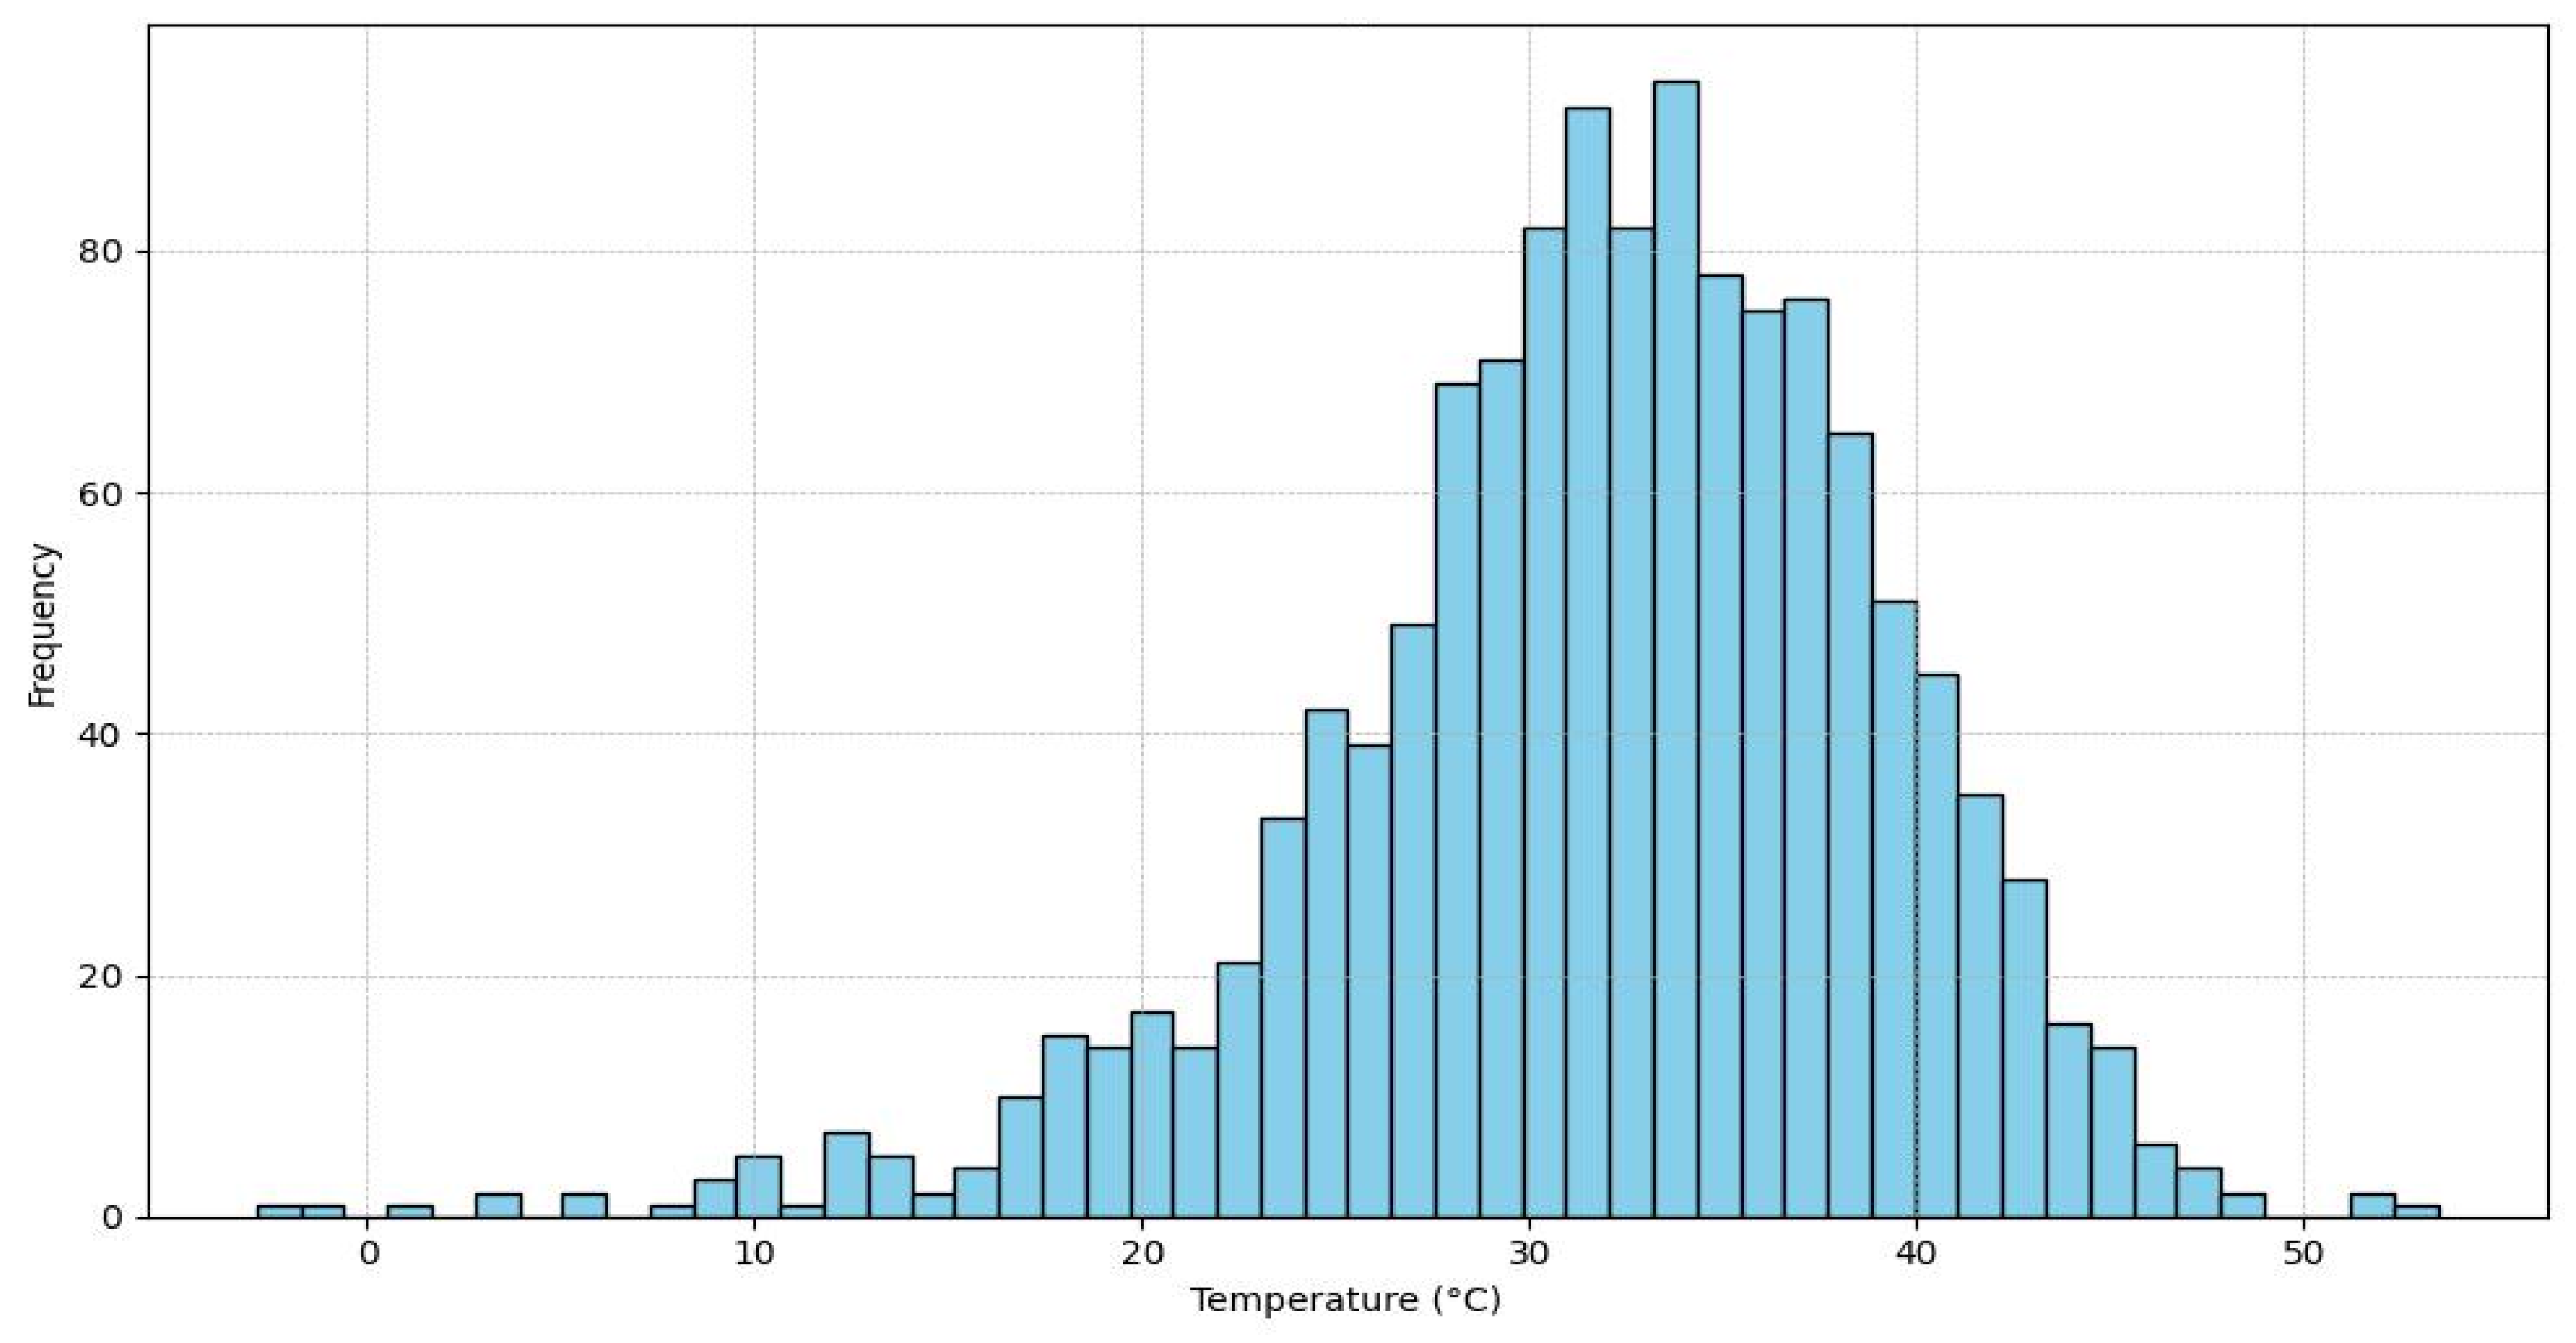
Figure 11.
LST Values by Year for West Pokot.
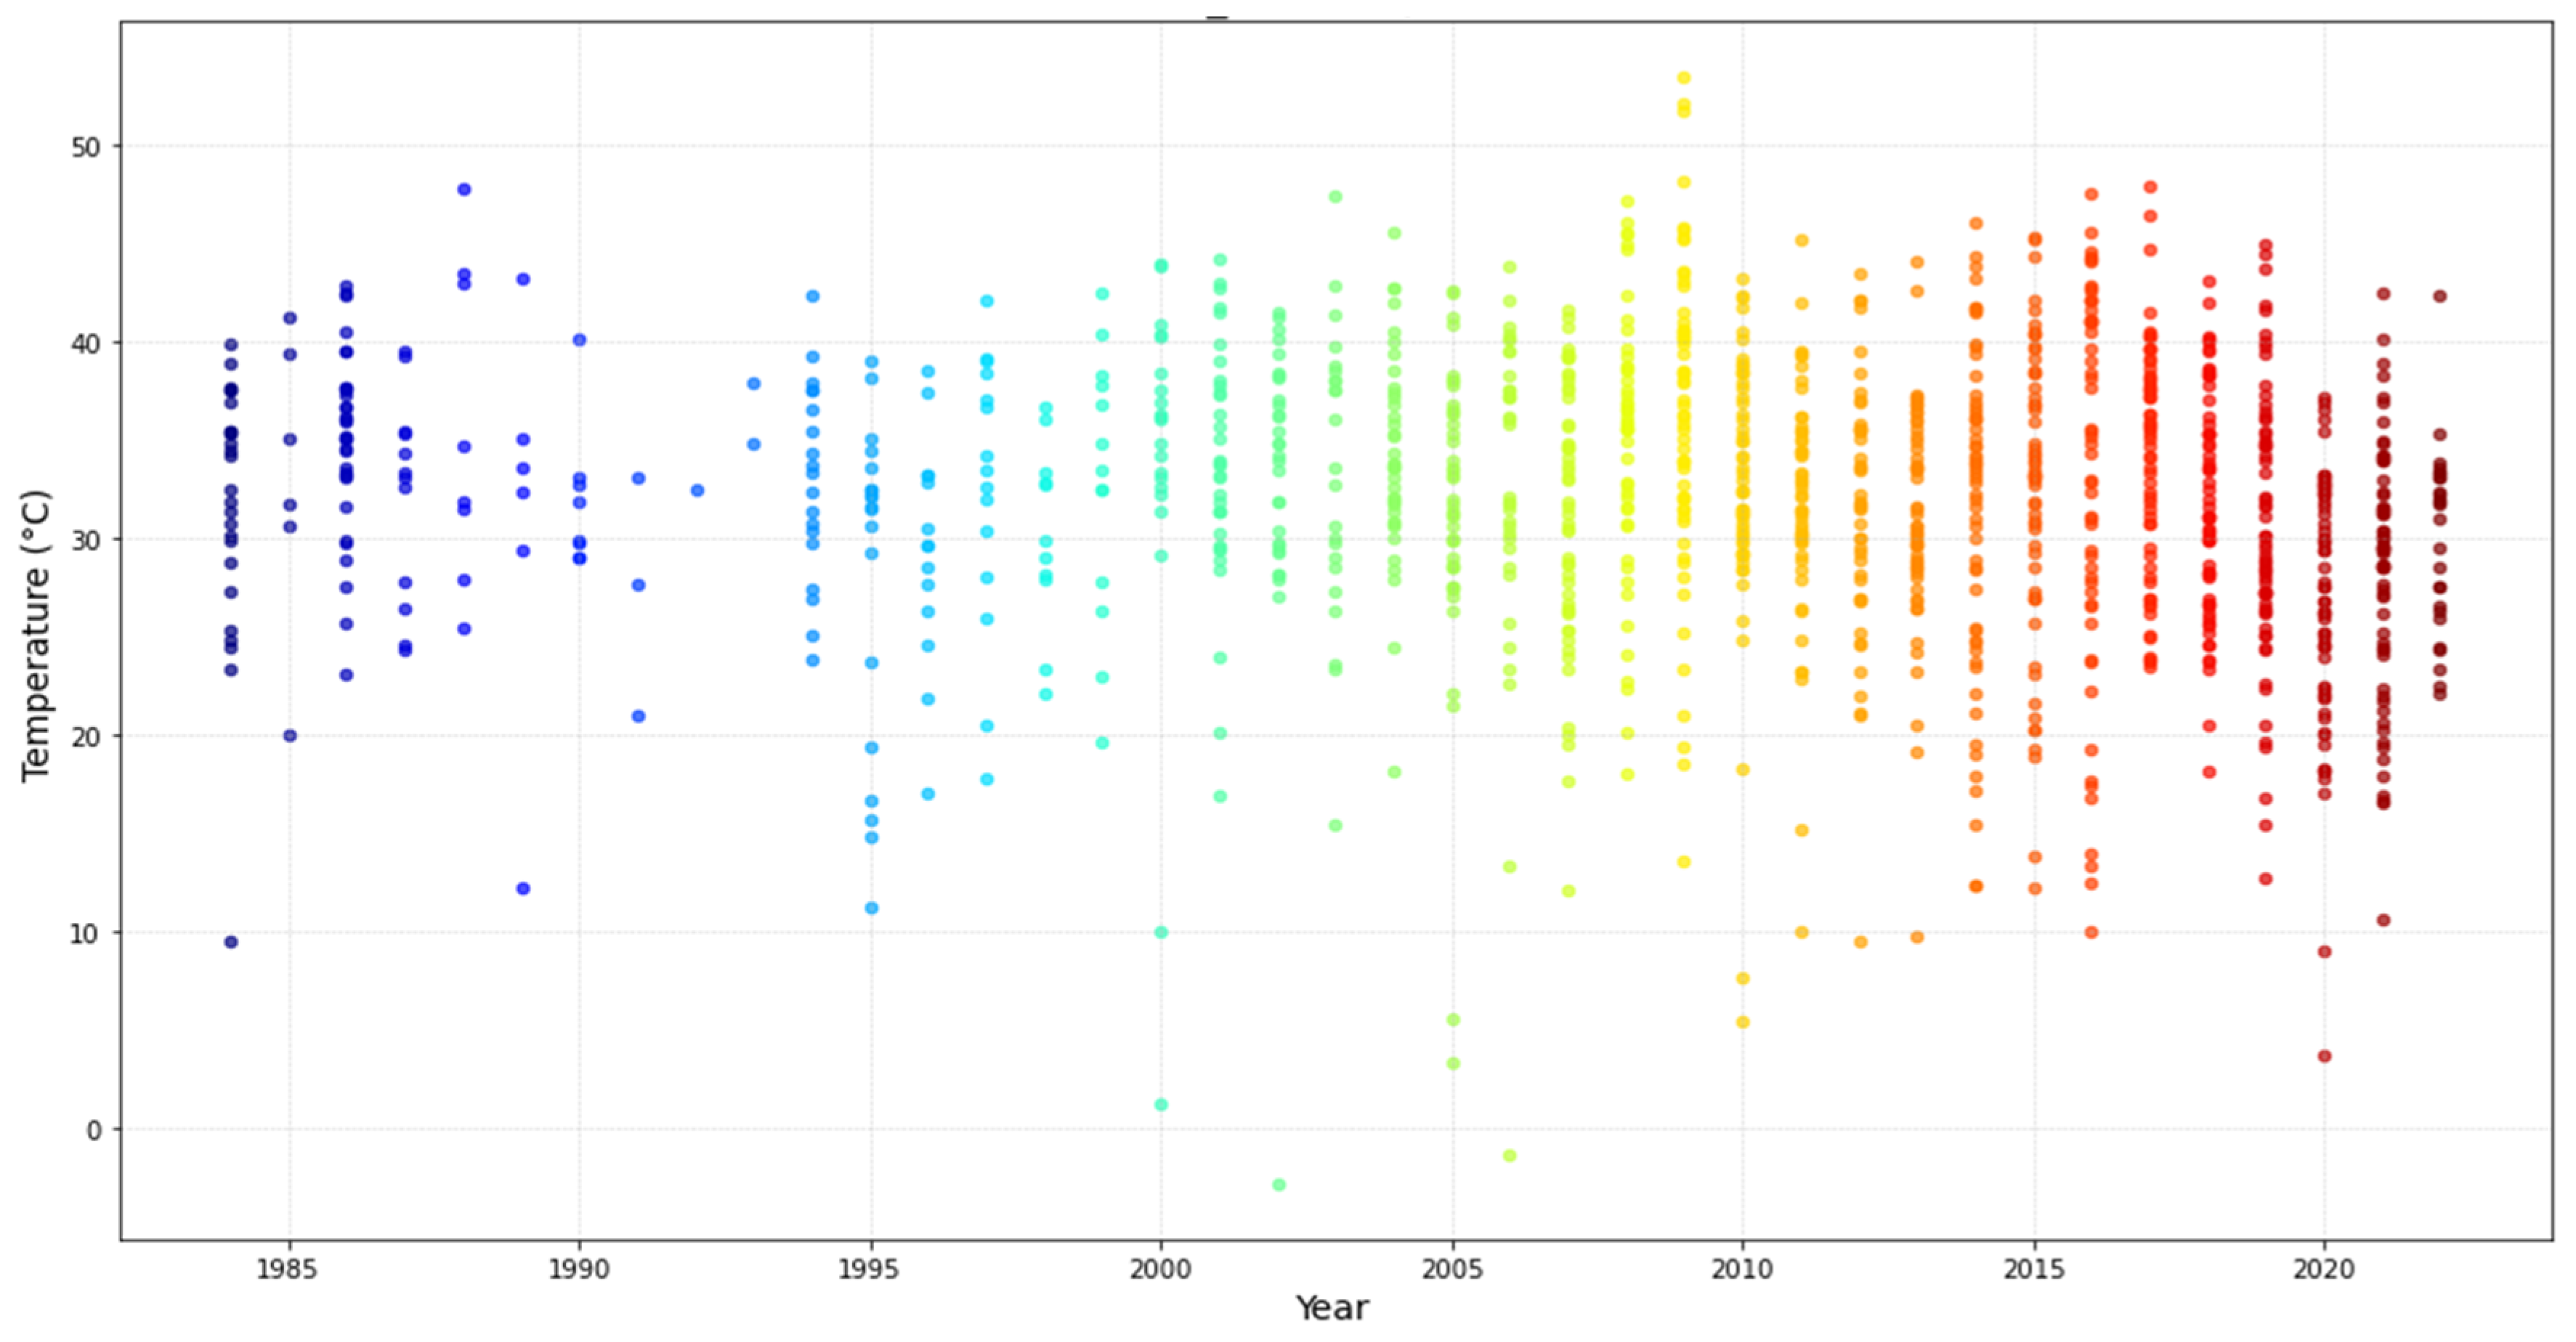
Figure 12.
Comparison of Average Temperature and Annual Average LST values by year.
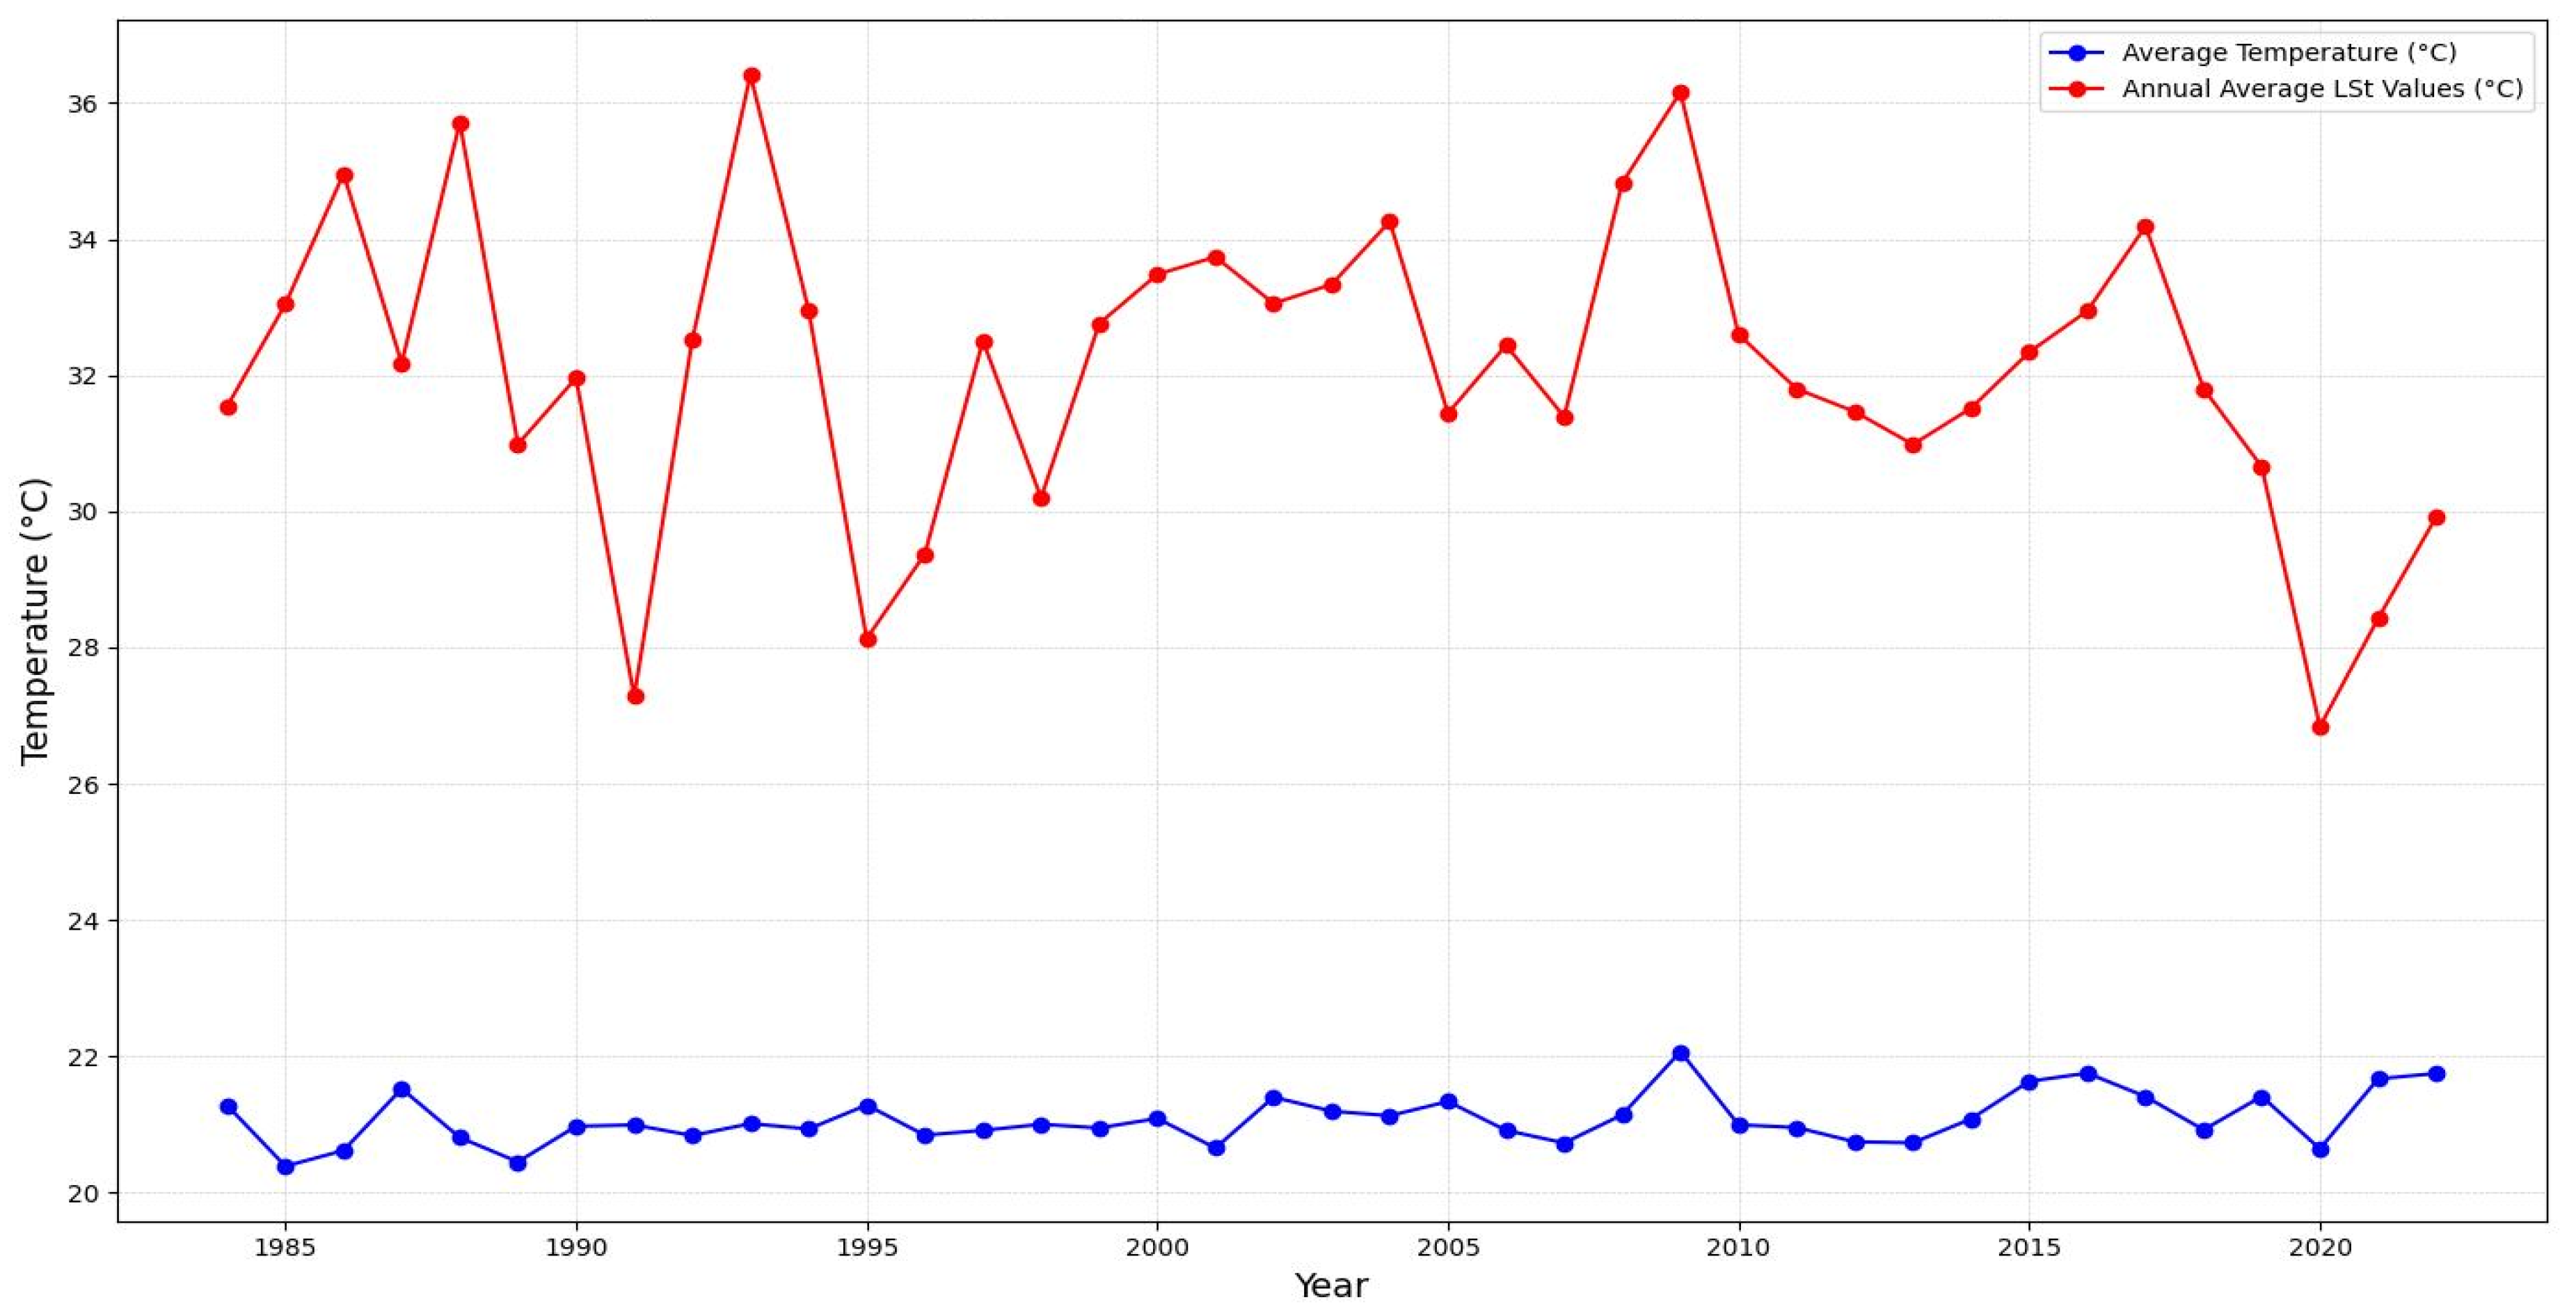
Figure 13.
Relationship between LST and Ambient Temperature.
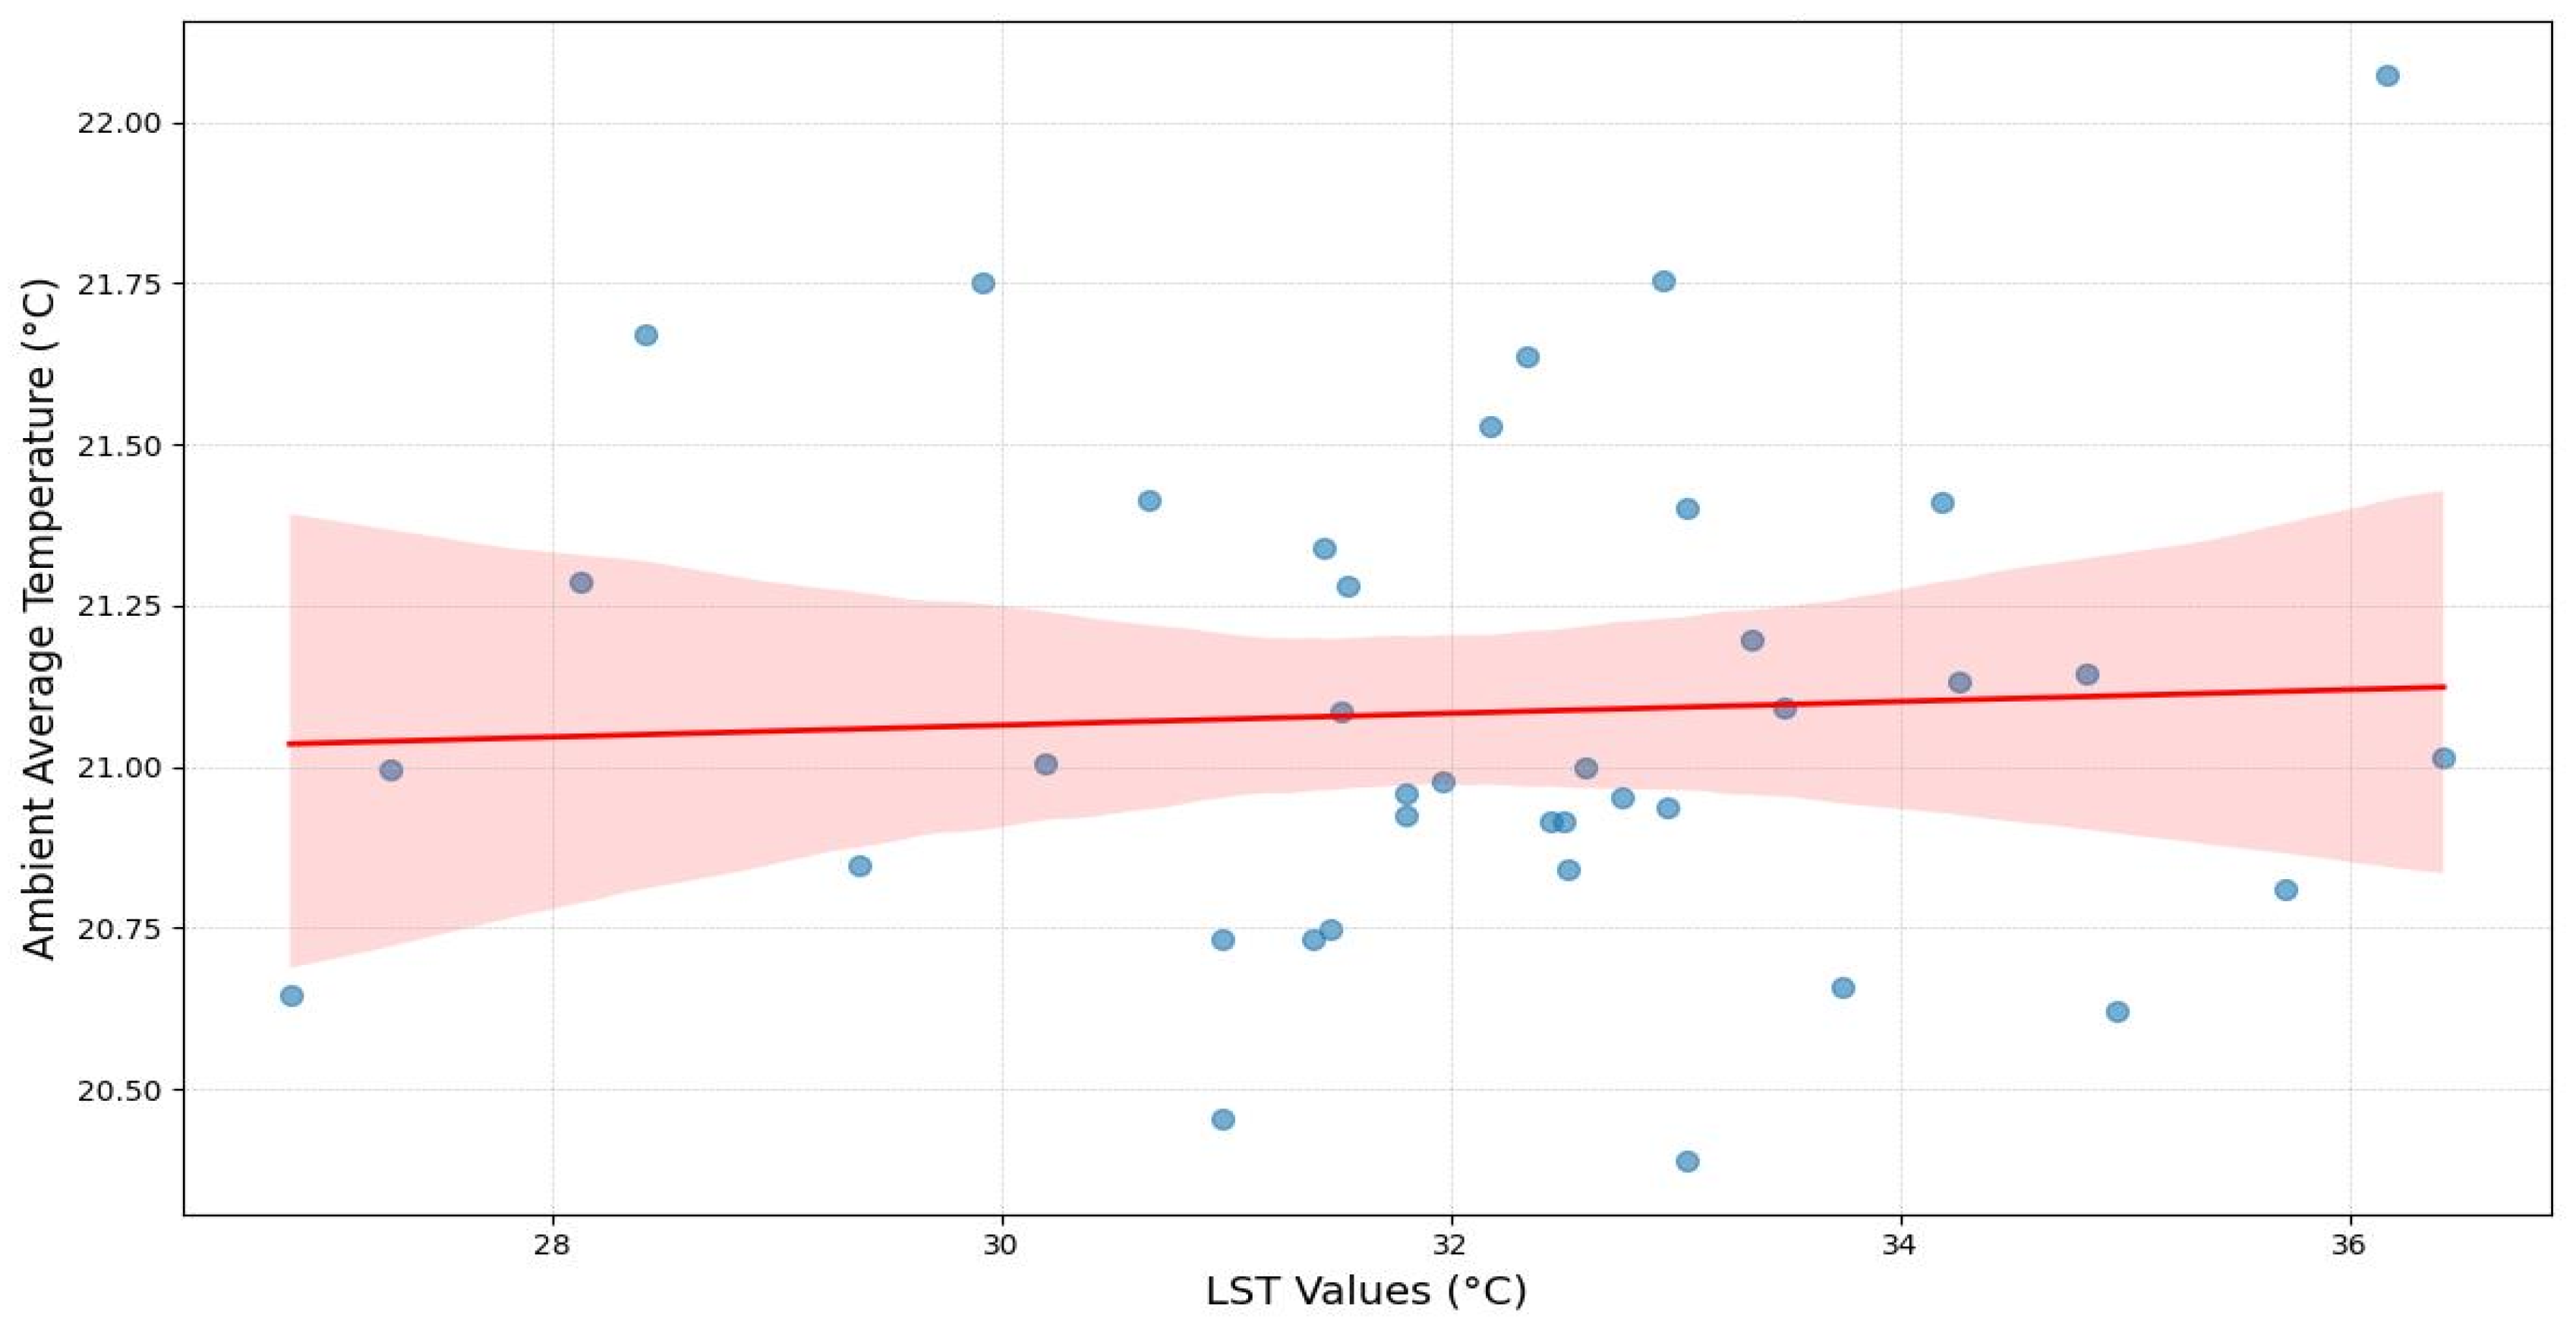
Figure 14.
Kacheliba’ locations and sub-locations targets by surveys.
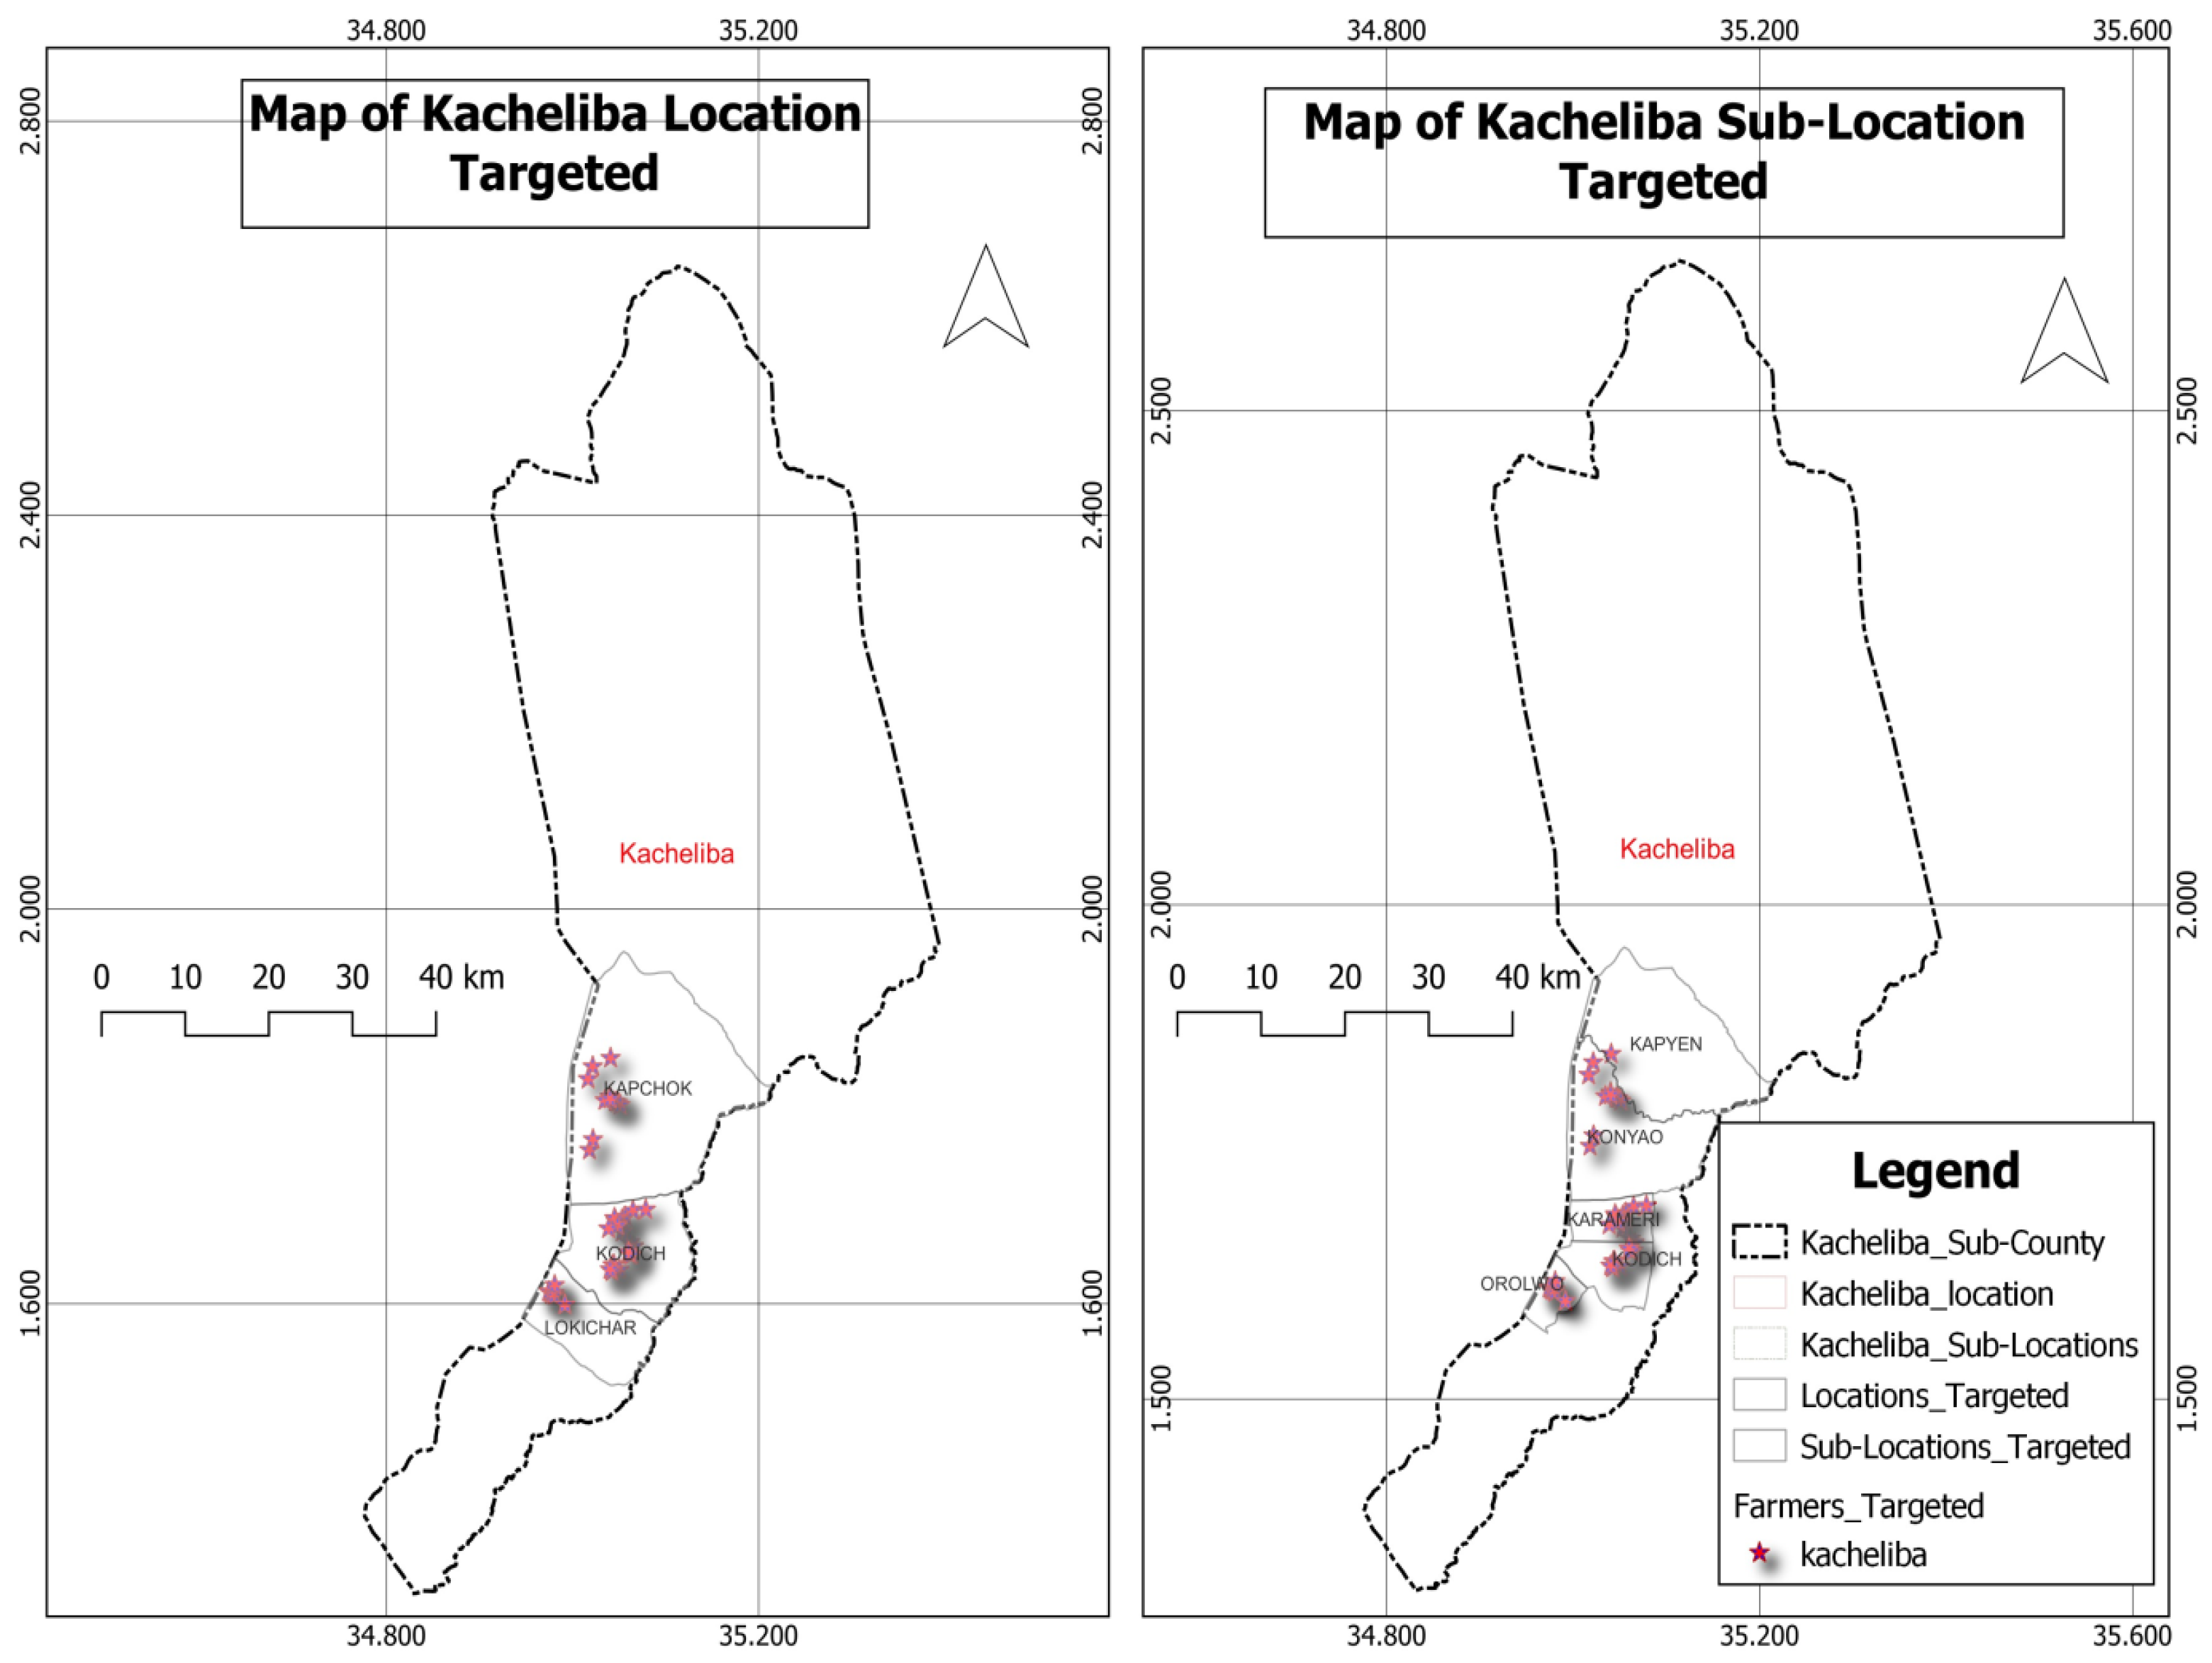
Figure 15.
Sigor’ locations and Sub-Locations targets by surveys.
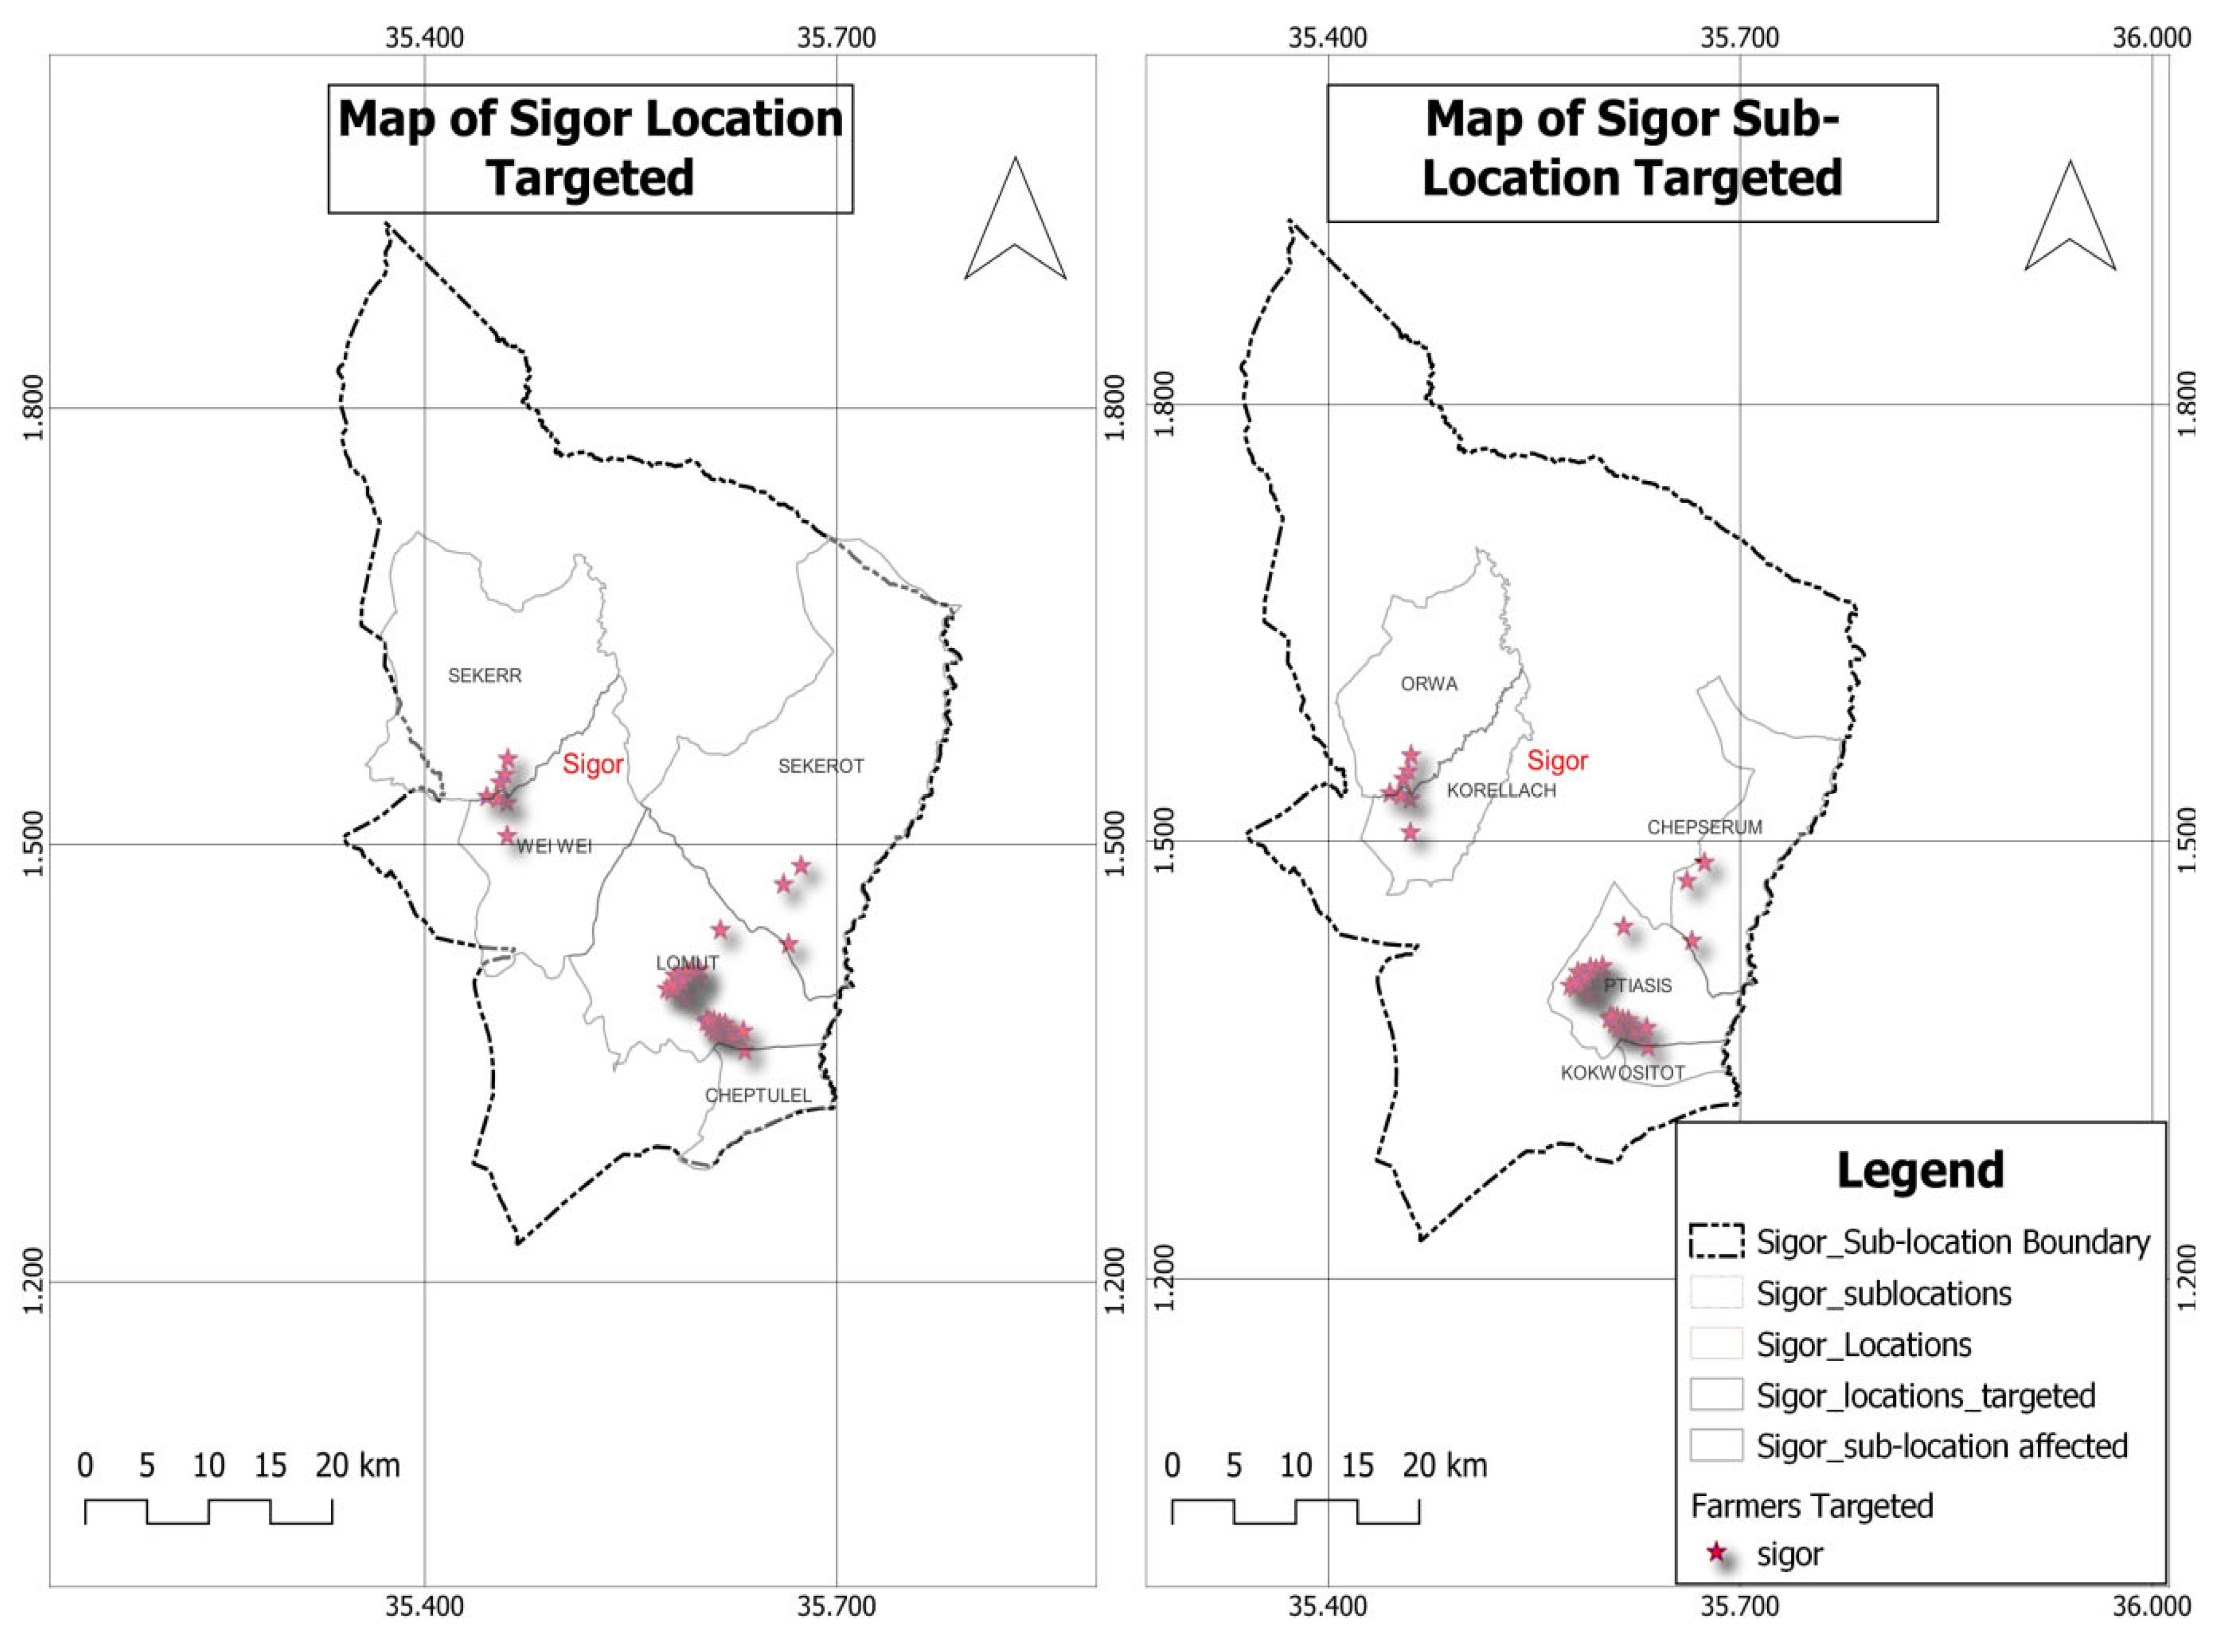
Figure 16.
Socio-Economic, Agro-Pastoral, and Meteorological Impacts of Drought to Kacheliba and Sigor.
Figure 16.
Socio-Economic, Agro-Pastoral, and Meteorological Impacts of Drought to Kacheliba and Sigor.
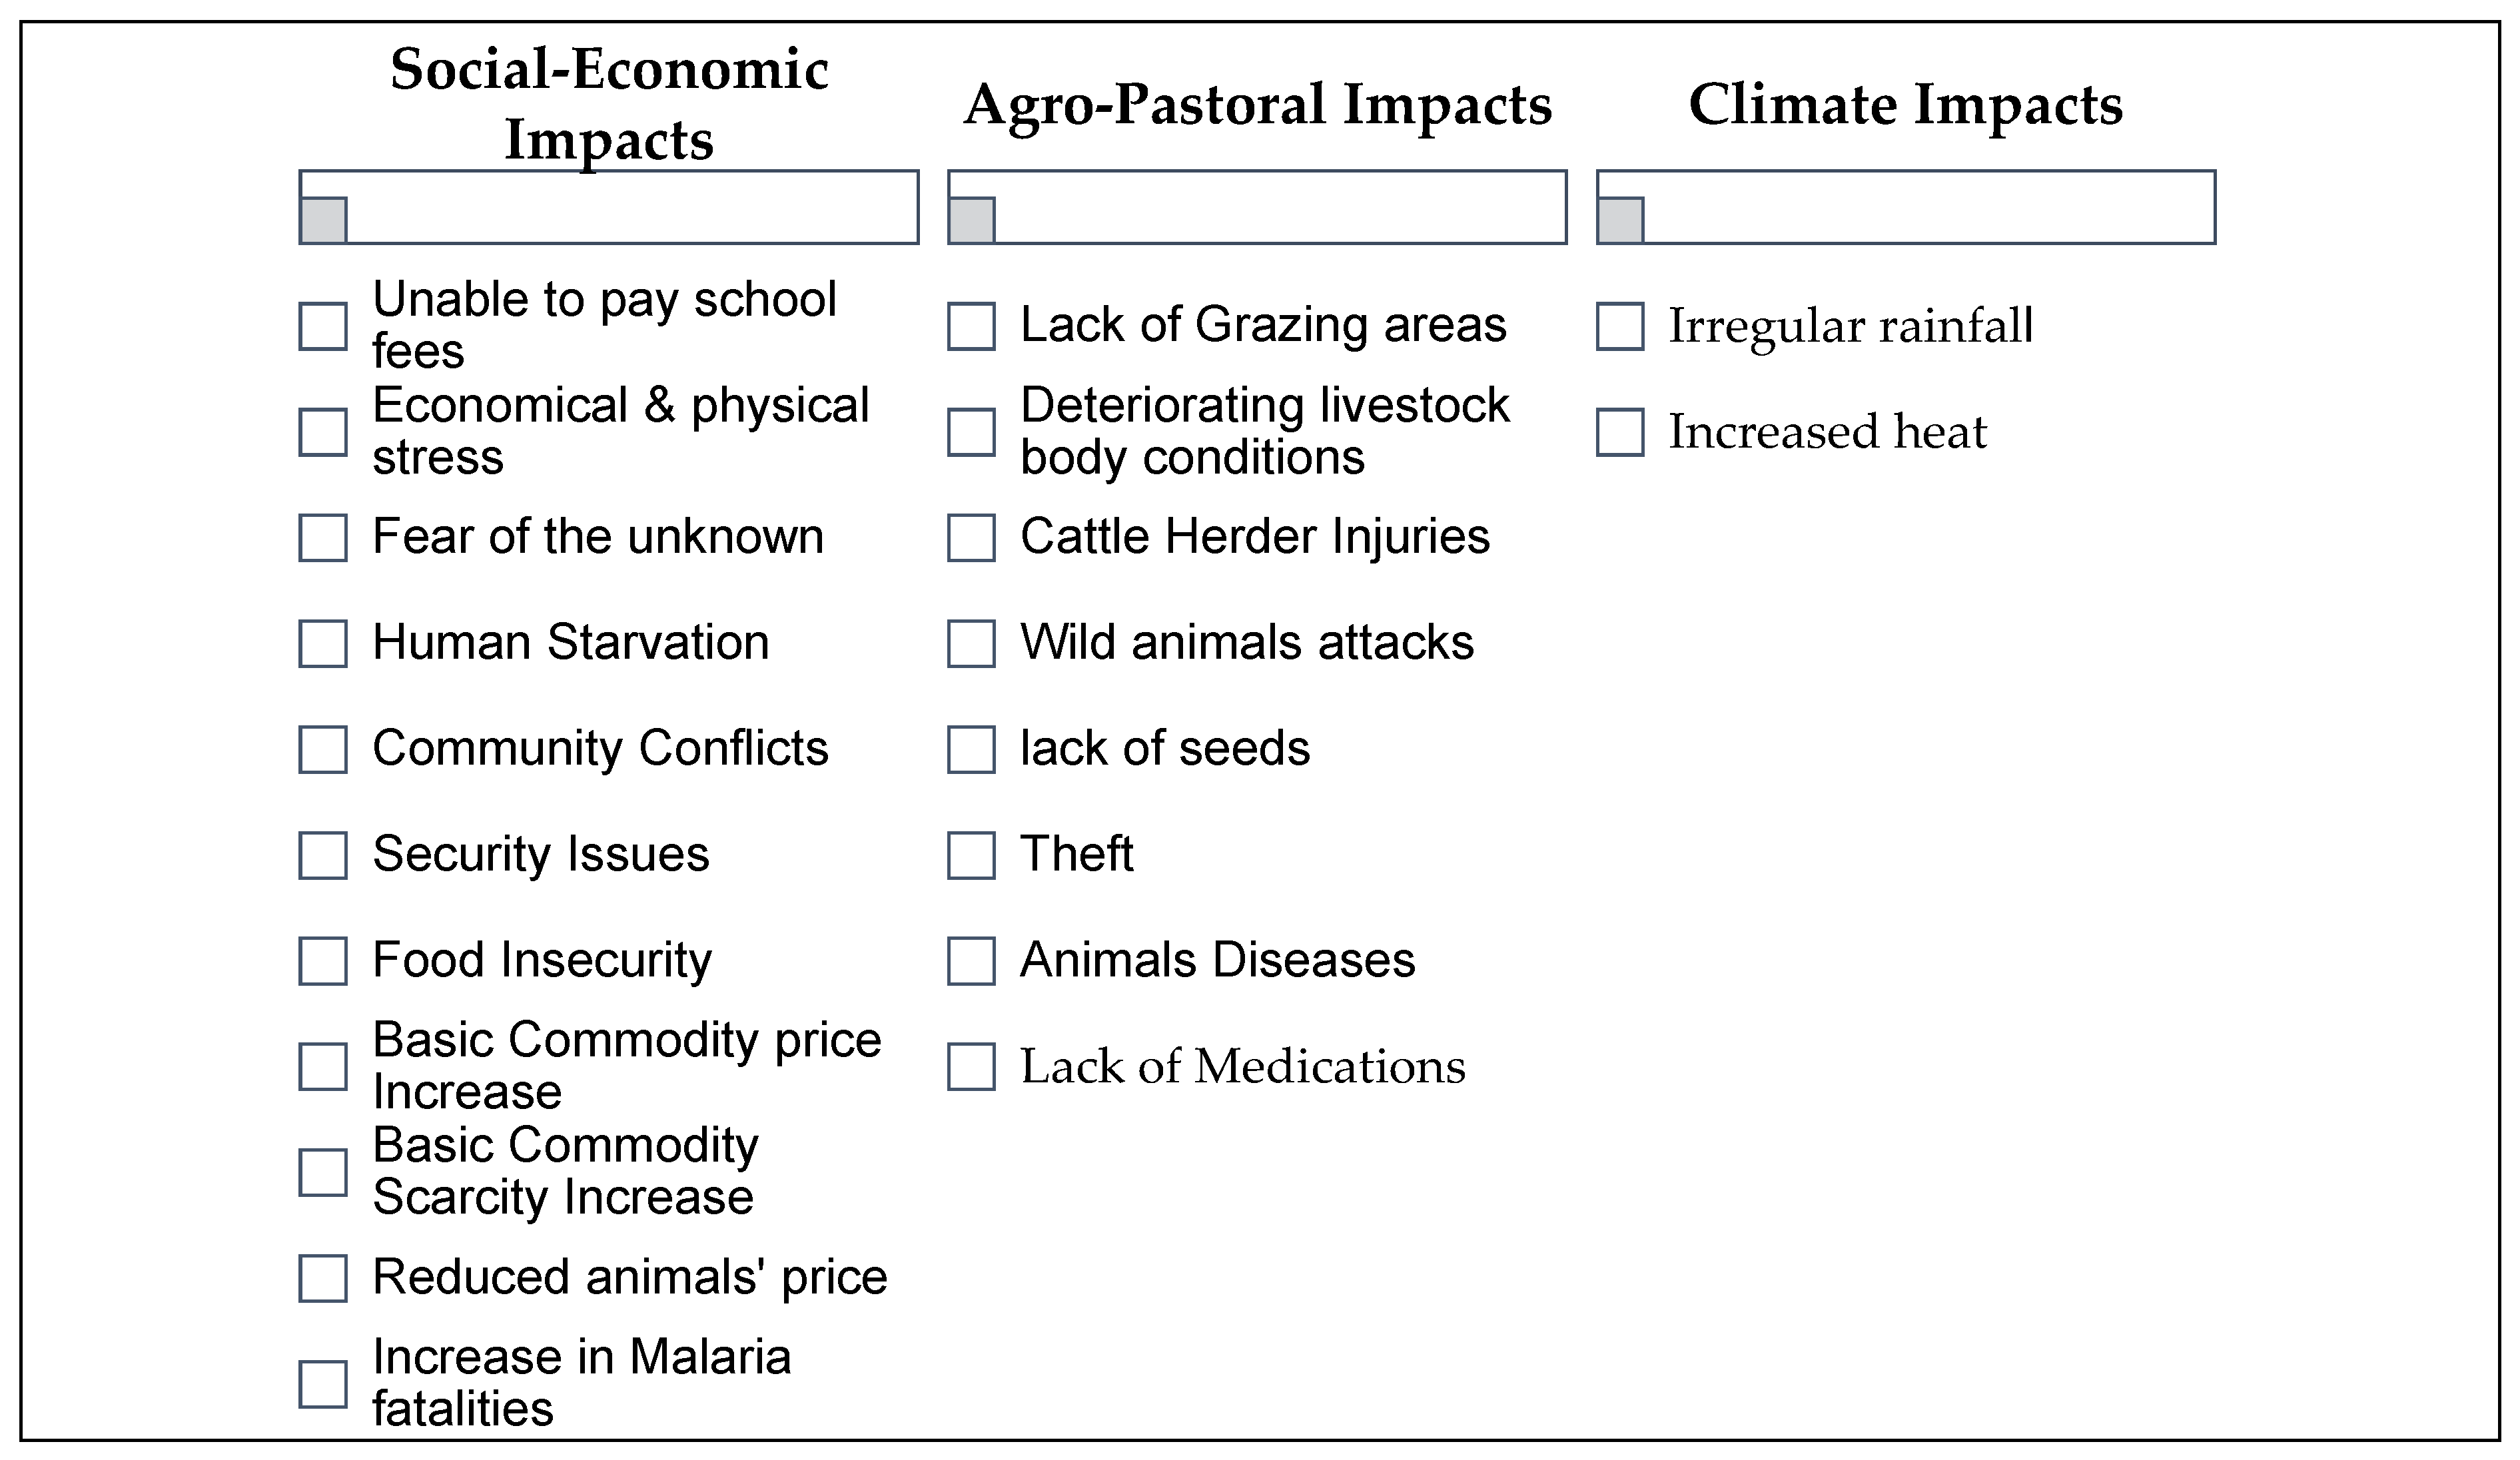

Table 1.
Drought classification for VCI, TCI, VHI values.
| Drought | Values |
| Extreme | < 10 |
| Severe | ≥ 10, < 20 |
| Moderate | ≥ 20, < 30 |
| Mild | ≥ 30, < 40 |
| No | ≥ 40 |
Table 2.
Distribution of Livestock Types.
| Type | Frequencies |
| Cow | 72 |
| Goat | 96 |
| Sheep | 52 |
| Camel | 90 |
Table 3.
Distribution of Crop Production Types.
| Type | Frequencies |
| Maize | 97 |
| Sorghum | 51 |
| Beans | 73 |
| Others | 64 |
Table 4.
Livestock Herd Size Distribution.
| Interval | Frequencies |
| [1 - 49] | 80.2 |
| [50 - 99] | 12.8 |
| [100 - 149] | 6.98 |
Table 5.
Frequency of Community resilience types
| Type | Frequencies |
| I moved my livestock to greener areas | 62 |
| I practiced rotational farming for crops | 4 |
| I practiced different areas of grazing | 94 |
| I planted resilient crops | 80 |
| I moved to keep more resilient livestock | 91 |
| I sold a portion of my livestock | 77 |
| I embraced business | 89 |
| I started practicing modern agriculture | 98 |
| I cut the trees and feed my livestock’s | 51 |
Table 6.
Distribution of Age
| Interval | Age distribution | Frequencies |
| [18 - 26] | Young Adults | 12 |
| [27 - 35] | Early Working Age | 31 |
| [36 - 42] | Middle-Aged Adults | 22 |
| [43 - 49] | Older Working Age | 13 |
| [50 - 80] | Senior Adults | 22 |
Table 7.
Level of Education’s Categories
| Category | Frequencies |
| No Education | 54.65 |
| Primary Incomplete | 19.78 |
| Primary Complete | 9.31 |
| Secondary Incomplete | 5.81 |
| Secondary Complete | 5.81 |
| University | 4.66 |
Table 8.
Model Evaluation Metrics.
| Metric | Value |
| LRT | P-Value = 1.24 × 10⁻⁸ |
| Accuracy | 0.93 |
| Nagelkerke’s R2 | 0.96 |
Table 9.
Summary of coefficients and their P-values.
| Characteristic | Coefficient | P-value |
| Gender | - | - |
| Women | 0.71 | 0.54 |
| Men | 3.10 | 0.04 |
| Education level | - | - |
| No Education | 1.32 | 0.03 |
| Primary Incomplete | -0.42 | 0.99 |
| Primary Complete | 17.82 | 0.65 |
| Secondary Incomplete | 0.82 | 0.97 |
| Secondary Complete | 18.16 | 0.78 |
| University | -3.81 | 0.02 |
| Age | - | - |
| [18 - 26] | 6.82 | 0.07 |
| [27 - 35] | 4.34 | 0.8 |
| [36 - 42] | 4.65 | 0.23 |
| [43 - 49] | 4.60 | 0.17 |
| [50 - 80] | 3.12 | 0.024 |
| Activity types | - | - |
| Livestock farming | 1.71 | 0.01 |
| Agriculture farming | -0.013 | 0.54 |
| Mixed | 1.10 | 0.97 |
Table 10.
Eigenvalues and Explained Variance for the MCA model to extract aggregate score of livestock production.
Table 10.
Eigenvalues and Explained Variance for the MCA model to extract aggregate score of livestock production.
| Components | Eigenvalue | % Of Variance |
| Dimension 1 | 3.91 | 89.26 |
| Dimension 2 | 0.34 | 7.76 |
| Dimension 3 | 0.13 | 2.97 |
Table 11.
Eigenvalues and Explained Variance for the MCA model to extract aggregate score of community resilience.
Table 11.
Eigenvalues and Explained Variance for the MCA model to extract aggregate score of community resilience.
| Components | Eigenvalue | % Of Variance |
| Dimension 1 | 4.35 | 70.39 |
| Dimension 2 | 1.03 | 16.67 |
| Dimension 3 | 0.80 | 12.94 |
Table 12.
Eigenvalues and Explained Variance for the MCA model to extract aggregate score of crop production.
Table 12.
Eigenvalues and Explained Variance for the MCA model to extract aggregate score of crop production.
| Components | Eigenvalue | % Of Variance |
| Dimension 1 | 3.97 | 94.07 |
| Dimension 2 | 0.23 | 5.46 |
| Dimension 3 | 0.02 | 0.47 |
Table 13.
R-squared Values of the Models in (Eqs. 7), and (8).
| Models | R2 |
| Model (Eq. 7) | 0.79 |
| Model (Eq. 8) | 0.86 |
Table 14.
R-squared Values of the Models between community resilience and livestock production.
| Model | Predicted Variable | Coefficient | P-value |
| Model in (Eq. 7) | Community resilience score |
β1 = 0.69 | 0.00045 |
| Model in (Eq. 8) | Community resilience score |
β1 = −0.178 | 0.000083 |
Table 15.
Community-based drought resilience and adaptation approach.
| FGD 1 Konyao |
FGD 2 Karameri |
FGD 3 Orolwo |
FGD 4 Orolwo |
FGD 5 Orwa |
FGD 6 Korellach |
FGD 7 Chepserum |
FGD 8 Ptiasis |
|
| Migration to greener pastures | X | X | X | |||||
| Harvest Wild plants | X | X | X | X | ||||
| Collection of Firewood’s and Charcoal burning | X | X | X | X | ||||
| Animals rearing reduction | X | |||||||
| Construction of water pans and dams | X | X | ||||||
| Arid farming Training | X | X | ||||||
| Use of drought resilient Vegetables | X | X | X | X | ||||
| Use of drought resilient animal breeds | X | X | X | X | ||||
| Gold mining | X | X | ||||||
| Kunde sale | X | X | X | |||||
| Reducing and adapting Meals | X | |||||||
| Farming next to rivers | X | X | ||||||
| Balanites Egyptica leaves for food | X | X | ||||||
| Barter Trade between community | X | X | ||||||
| Preserving land for pasture | X | X | ||||||
| Preserving maize for coming year | X | X | ||||||
| Pasture farming | X | |||||||
| Practicing irrigation | X | X | X | X | ||||
| Deworming animals | X | |||||||
| Grass stocking | X | X | ||||||
| Maize cobs stocking | X | |||||||
| Pest’s curbing | X | |||||||
| 5 | 5 | 4 | 2 | 5 | 8 | 12 | 9 |
Disclaimer/Publisher’s Note: The statements, opinions and data contained in all publications are solely those of the individual author(s) and contributor(s) and not of MDPI and/or the editor(s). MDPI and/or the editor(s) disclaim responsibility for any injury to people or property resulting from any ideas, methods, instructions or products referred to in the content. |
© 2024 by the authors. Licensee MDPI, Basel, Switzerland. This article is an open access article distributed under the terms and conditions of the Creative Commons Attribution (CC BY) license (http://creativecommons.org/licenses/by/4.0/).
Copyright: This open access article is published under a Creative Commons CC BY 4.0 license, which permit the free download, distribution, and reuse, provided that the author and preprint are cited in any reuse.


