

Submitted:
21 June 2024
Posted:
21 June 2024
You are already at the latest version
Abstract
Cerebral aneurysms come in a wide range of shapes and sizes, they can evolve over time and present significant changes. It is generally accepted that large aneurysms are more prone to rupture, but the rupture of small aneurysms has also been observed, indicating the presence of additional risks factors. The aim of this study is to assess the effects of the aneurysm size and wall thickness on its rupture risk by using fluid-structure interaction simulations. Six patient-specific geometries were chosen, four were used for studying the size effect and two for studying the thickness effect. Additional cases where the aneurysm was removed were included. It was found that thinner walls suffer from significantly greater stresses, whereas an increment in size means, in general, lower wall shear stress and greater equivalent stress. By removing the aneurysm, it could be noted that at the rupture point, the reduction in the time-averaged wall shear stress was 75%. Although the size of an aneurysm has a great impact in its rupture risk, its wall thickness needs to be considered, since even maintaining its size, the aneurysm could suffer from a thin-ning of its walls that can lead to structural failure.
Keywords:
Cerebral aneurysms
; thickness
; size
; FSI
; simulations
; aneurysm removal.
1. Introduction
A cerebral aneurysm is a lesion that is presented as a focal bulging in blood vessels, it has a prevalence of about 3% in the population without underlying health conditions [1] and is typically located at a region of the brain known as the circle of Willis [2]. The most severe outcome of this lesion is when the aneurysm ruptures leading to a subarachnoid hemorrhage (SAH) [3,4], which carries a mortality rate exceeding 40% [5].
The serious consequences that a cerebral aneurysm may produce, along with the high-complexity treatments the patient can receive, as neurosurgery, create the need for finding a method to predict the rupture risk of a cerebral aneurysm to make a better decision as to whether the patient needs a complex treatment or not. Nowadays, that method does not exist, but it is known that the interaction between the blood flow and artery walls is the key factor in explaining aneurysm formation, as well as its development and rupture [6].
It is thought that the wall shear stress (WSS) is one of the most important hemodynamic factors to study, where zones with high WSS levels would be more prone to suffer from an aneurysm formation [7,8,9], while zones with low WSS have been related with the development and rupture of an already initiated lesion, finding low-stress levels in those sites where the rupture is produced at the aneurysm dome [10,11], although high WSS levels combined with other factors, could also lead to rupture [12].
Once the aneurysm is initiated, it can have different outcomes, it can rupture young, develop increasing its size to rupture, or be kept in time [13]. The size of an aneurysm does not evolve at a constant rate [14], going through periods where it does not change, and other periods where it can grow, even with different growth rates between ruptured and unruptured aneurysms [15]. It has been shown that aneurysms growth can produce significant morphological changes from at least 23 weeks [16].
Although it may be intuitive to think that an aneurysm will rupture when it is large, it has also been observed that small aneurysms suffer from ruptures [17], which suggests that not only its size is a risk factor. In addition to health conditions such as hypertension or trauma to explain why small aneurysms can rupture, it must be considered that the aneurysm is thinner than the artery [18], and contrary to what could be thought, when the aneurysm grows, it does not necessarily decrease its wall thickness [19] because it is a living structure that can repair itself.
There are several studies modifying hemodynamic parameters to reflect different health conditions that might affect the rupture risk of an aneurysm, and less common are studies where geometrical factors are modified. Sun et al. [20] have shown that when an aneurysm grows and its thickness decreases, the rupture risk increases due to a reduction of the WSS and an increment in the Von Mises stress at the aneurysm, and even keeping a constant wall thickness, the maximum Von Mises stress still increases. Nath et al. [21] studied spherical aneurysm geometries using structural simulations. They found that at the beginning, the aneurysm has a reduction in its maximum Von Mises stress, but then it increases along with the aneurysm size, meaning a higher rupture risk. Other works have used cylindrical/spherical membranes subjected to 1D enlargement to model the development of an aneurysm where the mechanical response is attributed to collagen and elastin [22].
Those previous works have used a uniform distribution of thickness over the aneurysm dome, however, real aneurysms do not have a uniform thickness distribution, and this can be related to stress concentrations [23] or aneurysm expansion for abdominal ones [24]. Nowadays, even with the current medical technology, wall thickness remains a difficult parameter to obtain from patients without performing surgery or removing the aneurysm, especially for cerebral aneurysms. Furthermore, by removing an aneurysm, it has been noted that using a non-uniform thickness distribution in simulations show much higher stress values in the rupture site when compared to a configuration with constant wall thickness [25].
In the present work, the effect of geometrical parameters is studied, specifically, the effects of the aneurysm wall thickness and its size on its rupture risk, separately varying each parameter for better accounting how each parameter affects the rupture risk of cerebral aneurysms. Six patient-specific geometries are chosen and boundary conditions representing healthy conditions for an adult patient are used. Due to the importance of accounting for blood and wall interaction in simulations for an accurate prediction of patient-specific hemodynamics [24,25], a fluid-structure interaction (FSI) approach is used. Besides, as differences in up to 30% in displacement have been observed when comparing two-way, and one-way FSI simulations [28], the former is used.
Additionally, cases where the aneurysm is virtually removed from lateral geometries are included, with the aim of simulating a state before the lesion initiation.
2. Materials and Methods
2.1. Materials and Methods
The obtained geometries belong to a cerebral aneurysm database generated with the methodology exposed by Valencia et al. [29]. That group obtained medical images provided by the Instituto de Neurocirugía Dr. Alfonso Asenjo (INCA) using the tridimensional rotational angiography method with a Philips Integris Allura device. Six geometries were chosen for the study, three of them ruptured and three unruptured. Those geometries can be seen, along with their names in Figure 1, where those with rupture are named RG, and those without rupture are named UG. Table 1 shows each geometry name with its type, location and total geometry volume. Both RG-1 and UG-1 are used to study the aneurysm thickness effect, the rest of the geometries are used for studying the aneurysm size effect. Since the worst outcome for an aneurysm is its rupture, those geometries that presented rupture are modified in such a way that their size is reduced to study a past state, and those with no previous rupture are modified to increase their size to simulate a possible future state. The methodology used to modify the size is shown next.
2.2. Size Variation
The employed algorithm is an adaptation from the one described by Sun in the previously cited work. That algorithm is modified to be used in T-Spline bodies in Autodesk Fusion 360 and to decrease those ruptured aneurysms.
Instead of using offsets as in the original procedure, here, the scaling process uses a scale factor s to expand the aneurysm parallel to its neck plane. s is defined as the ratio between equivalent diameters after (Df) and before (Di) scaling:
Df/Di = s
The assumption that the contours in which the aneurysm is sectioned are similar to a circumference is made, with this, the next formula is used:
Df ≈ Di + 2Δ
Where the approximation is taken as equality. Δ is the offset used by Sun et al., i.e., Δ = (α − 1)Di. Then, the previous expression is written as Df = Di + 2(α − 1)Di and s is written as follows:
s = (2α – 1)
Expression 2.3 is used for unruptured aneurysms, to make them grow, for ruptured aneurysms, s′ is used instead, and defined as s′ = 1/s.
The main steps of the algorithm are listed below:
- From the original geometry, the aneurysm is extracted to convert its main faces into a T-Spline body. The neck plane is visually identified, and a point is placed at its center, by which a perpendicular axis V passes through.
- A factor αmax = 1.26 is used for all the cases. As in the original algorithm, an α parameter that begins at 0 when V = 0, and linearly varies up to αmax for V > Vmax /3, is used. Vmax is the distance between the point at the center of the neck and the highest point of the aneurysm dome. The height of each contour in the T-Spline body, approximately parallel to the neck plane, is measured and named Vc.
- Each contour is moved upwards, for unruptured aneurysms, and downwards, for ruptured aneurysms, in a quantity Vc (α − 1). Additionally, each contour is scaled with the factor s or s′ depending on the rupture status of the aneurysm, parallel to the neck plane. The moving and scaling process are repeated with each one of the contour lines of the body.
- When the process is completed, the T-Spline body is converted into surfaces, the top zone of the aneurysm is closed following the curvature of the surrounding faces, and the zone at the bottom of the aneurysm is closed with another surface. Then, the created surface bodies are joined and converted into a solid. Finally, the resultant scaled aneurysm is joined back to the artery. For lateral aneurysms only, a fillet is created in its neck to create an organic transition between the artery and the aneurysm.
An example of the main steps followed can be seen in Figure 2 , where the algorithm is applied to UG-2.
Since it is not known in beforehand at what size the aneurysm will rupture for those unruptured geometries, nor it is known how structural and fluid parameters are going to change before performing the simulations, just two larger variations are created, which can be seen for both original geometries in Figure 3. In a), I size geometries are shown, while in b) and c), II and III sizes are also shown respectively. Here and for ruptured geometries, the smaller the number the smaller the aneurysm size.
For ruptured geometries, its variations can be seen in Figure 4, where a) is the IV size, b), c) and d) are the III, II, and I sizes. The algorithm is applied beginning from geometries a) and b) to get b) and c) respectively, whereas d), which represents an aneurysm recently initiated, has a semi-spherical morphology whose height is approximately the same as two consecutive applications of the algorithm would yield starting from c). Just for size I for ruptured geometries, the aneurysm neck is decreased.
2.3. Thickness Variation
To reflect the aneurysm thickness effect, just in one case that region is set with the same thickness of the artery, 0.35 [mm], whereas in the other two cases, the aneurysm thickness is reduced to 0.2 and 0.10 [mm] since aneurysm walls can be as thin as 0.05 [mm], and even less [30]. Thickness variation is done when creating the mesh, it is set as a property of the structural element, which is mentioned in the following section.
From the original geometry, two surface bodies are created, seen in gray for the aneurysm and green for the artery in Figure 5. The artery is kept at 0.35 [mm] of thickness for all cases, while the aneurysm varies as stated before. To get a compatible mesh between those two zones, the Shared Topology option from SpaceClaim is activated at their boundary.
2.4. Numerical Setup
2.4.1. Fluid Model
Since there is a wide variety of sizes on the selected geometries, it is chosen to use the one that has a total volume similar to the average volume. RG-2 is selected to conduct the mesh tests for both domains. The fluid mesh test is based on the mesh density, the ratio between the total number of elements and the geometry total volume, using computational fluid dynamics simulations in Ansys Fluent to solve the respective equations associated with the fluid using the finite volume method (FVM). Densities go from 250 [elements/mm3] up to 3000 [elements/mm3], using both, linear and quadratic tetrahedral element. The chosen scheme is PISO, with a spatial discretization using least squares cell based on the gradient and second order for pressure and momentum. The transient formulation is first-order implicit, with a time step of 0.0005 [s], 3600 time steps, and 200 maximum iterations per time step.
Blood model is the same as one previous work that uses geometries from the same database [31], where blood is modeled as a laminar and incompressible Casson fluid with a density of 1065 [kg/m3]. Boundary conditions for the entry are set as a Womersley velocity profile, whereas for the exit, a three-element Windkessel model with pressures ranging between 80 and 120 [mmHg] is chosen. The total simulated time is 1.8 [s], slightly more than two complete cardiac cycles, and the considered results are the area-averaged WSS at the diastole (DWSS) and systole (SWSS), from the second cardiac cycle. Simulations were performed using double precision in a machine with an AMD Ryzen 5 5600G processor and 16 GB of RAM.
In Figure 6 the evolution of both parameters with respect to the mesh density can be seen. Since between 500 and 1000 [elements/mm3] the differences are approximately less than 5%, and that two-way FSI simulations need considerable computational resources, it is chosen to use a mesh density of about 700 [elements/mm3], with size refinements at the aneurysm dome and in the zone in contact with the artery wall. Besides, the differences between quadratic and linear elements are negligible, and therefore, the former is chosen.
2.4.2. Structural Model
Mesh tests for the structural domain are based on the element size using the same geometry as the previous tests, but with computational structural dynamics simulations, using Ansys Transient Structural to solve the corresponding associated equations with the finite element method (FEM). Linear shell element is used since the thickness of the artery and the aneurysm are considerably less than other dimensions of the geometry. It is common to assign the element thickness as 10% of the artery diameter, in this case, considering the average diameter of the selected geometries, the thickness is set to 0.35 [mm]. This thickness is used for both the aneurysm and the artery, and it is kept for all the cases for the size effect.
Element size goes from 0.15 up to 0.50 [mm]. An external pressure representing the cerebrospinal fluid action for a healthy adult of 1650 [Pa] [32] is used, and an internal pressure representing the action of the blood flow is set to 15 [kPa]. Inlet and outlets are assumed to have fixed support. A five-parameter Mooney-Rivlin hyperelastic model is used for both mesh tests and FSI simulations. Its elastic energy density function W can be seen in Equation 4:
W = 𝑐10(𝐼1 − 3) + 𝑐01(𝐼2 − 3) + 𝑐11(𝐼1 − 3) (𝐼2 − 3) +𝑐20(𝐼1 − 3)2 + 𝑐02(𝐼2 − 3)2
I1 and I2 are the strain invariants, c10, c01, c11, c20 and c02 are model constants obtained from the literature [33]. Although the wall of an aneurysm is anisotropic, in this work it is modelled as an isotropic material, a common practice to do since both approaches yield similar results [34].
Considered results are the total displacement and the Von Mises stress at the aneurysm. Its results and percentage differences with respect to that mesh with the smallest element (D015) can be seen in Table 2 where just for the Von Mises there are differences greater than 5%, then, it is chosen to use a maximum size element of 0.20 [mm], since its differences are below that value.
2.4.3. Fluid-Structure Coupling
Simulations performed in this study are two-way FSI using Ansys System Coupling for exchanging information between Fluent and Transient Structural. Boundary conditions to ensure the compatibility of both domains are that the structural and fluid displacement must be compatible with each other (Equation 5), traction at their boundary must be in balance (Equation 6), and the fluid must obey the no-slip condition (Equation 7) [35].
δS = δF
In the previous expressions, δ is the displacement, is the stress tensor, is the normal vector at the boundary, is the velocity vector, is the mobile velocity coordinate, and subscripts S and F stand for the structural and fluid domain respectively.
Additionally to those settings already mentioned for the fluid domain, dynamic mesh options were activated with smoothing and remeshing methods besides of creating information exchange zones. In the structural domain, the internal pressure is removed, and exchange information zones are also created.
3. Results
A total of 24 FSI simulations were carried out to evaluate the effect of geometrical factors, such as the aneurysm size and wall thickness, and to obtain the structural and hemodynamic environment of the lateral arteries before the lesion initiation. The aneurysm wall thickness effect is first presented, then the size effects, and lastly, the aneurysm removal results.
3.1. Aneurysm Wall Thickness Modification
The aneurysm wall thickness modification produces negligible differences for hemodynamic parameters, where for both, average pressure and WSS, differences are less than 5% and therefore, just the temporal evolution of the average WSS at the aneurysm is presented in Figure 7, for each wall thickness and for each geometry, in the last part of the simulated cycles, where the curves are almost indistinguishable from each other. That figure and following similar ones were created using MATLAB R2023a.
Structural parameters include the displacement and the Von Mises stress. The displacement behavior is opposite between the ruptured and the unruptured aneurysms as can be seen in Figure 8, where the average displacement in the aneurysm is plotted against the wall thickness for each case. In Figure 9 the same plot is presented but for the Von Mises stress, where both geometries increase their average perceived stress as the aneurysm wall becomes thinner. Displacement contours can be seen in Figure 10 and Figure 11.
3.2. Aneurysm Size Modification
The evolution of the aneurysm size makes a large difference for both, hemodynamic and structural parameters, where the average WSS temporal evolution for each geometry size variation is shown in Figure 12, whereas Figure 13 shows the average WSS evolution against the AR of each variation and for each geometry, where except for UG-3, as the AR increases, the WSS reduces.
Figure 14 shows the evolution of the average displacement at the aneurysm against the AR for each case. Once again, UG-3 exhibits a different behavior than the rest of the geometries, which is as their AR increases, the displacement increases as well, except for size I variations of the ruptured geometries, which repeats for the Von Mises stress in Figure 15. Here, the behavior of UG-3 is like the rest of the cases, where an aneurysm of greater AR suffers from greater Von Mises stresses. Examples of the obtained Von Mises contours can be seen in Figure 16 and Figure 17 for both terminal geometries.
3.3. Aneurysm Removal
In order to compare the pre-aneurysm with the aneurysm state, the time-averaged wall shear stress is calculated using the following equation:
4. Discussion
4.1. Effect of the Aneurysm Wall Thickness Modification
Although hemodynamic parameters did not significantly perceive the effect of modifying the aneurysm thickness, structural parameters did. As seen in Table 3, if the aneurysm wall becomes thinner, in this case, changing from 0.35 to 0.10 [mm], the average Von Mises stress can increase in more than 200%, which would indicate that the aneurysm has a greater rupture risk due to a structural failure of its wall.
This type of change in the stress magnitude could be expected from Laplace’s law, a principle which relates the pressure, radius, thickness and tension for a sphere, although it could only give an approximate idea of how tension would evolve with the thickness change, whereas a numerical simulation can yield results for the entire dome of an aneurysm with other stresses, such as the Von Mises stress, that could give a better notion of how close the aneurysm is to a structural failure. Besides, it would be not realistic to assume an aneurysm as a sphere, and this has previously shown to give different results [36].
In the other hand, the displacement has a non-intuitive behavior, since it is opposite between both geometries, being the ruptured geometry, RG-1, the one that has the expected trend, where the thinner the wall, the greater the displacement is, furthermore, it is found that this geometry is ten times more sensitive to the wall thickness change than the UG-1 according to Table 4.
The difference in behaviors and sensitivities can be explained due to the parent artery geometry and the blood flow path that it imposes, this can be seen for both chases in Figure 20, where RG-1 has a blood flow that points to the aneurysm, entering that zone more directly, and with more velocity than in UG-1. Once the fluid enters to the RG-1 aneurysm, it travels to its upper zone, where it changes its direction and decreases its velocity magnitude, exchanging momentum with the zone the aneurysm that has the highest displacement values as can be seen in Figure 10 for its contours. In the other case, almost the entire blood flow follows the artery path with very low deviation into the aneurysm, making its displacement very similar to its surrounding zone in the artery, as Figure 11 shows.
4.2. Effect of the Aneurysm Size Modification
As the WSS time evolution shows, there is a clear distinction on its magnitude when the aneurysm evolves in size, except for UG-3, which shows an increase followed by a decrease. These results are similar to those obtained by Sun, in that work, the WSS curves were clearly separated from each other, being the scaled geometry the one with higher levels of WSS. The curves obtained by that research group were closer to each other than in the present case, which can be explained because in the present case of modifying the aneurysm size, the wall thickness remained constant and with a different thickness. Other factors of differences are that the geometries are different and, in this case, a non-Newtonian model for the blood was used.
Table 5 shows that ruptured geometries have an increment in the average WSS for the I size case in between 205 and 276%. Geometry UG-2 shows a reduction in its WSS of around 36% considering both systole and diastole, for its largest variation. UG-3 has an increase of up to 31% at the diastole for its II variation, but a decrease of less than 5% for the largest one, which can be considered as negligible.
The distinctive behavior of geometry UG-3 can be explained by how the path of the blood flow changes as the aneurysm evolves, seen in Figure 21. In the original geometry, the smallest one, there is a recirculation zone for the blood before entering into the aneurysm and then going to the main bifurcation. In the following variation, the size II aneurysm, blood flow enters more directly and with more velocity into the aneurysm, which explains the WSS increment. The blood flow pattern is similar in the largest variation, but just like the rest of the cases, there is a decrease in the WSS levels because now the blood flow reaches the dome with a lower velocity.
In terms of displacement, a larger aneurysm might be expected to have greater displacements because it is farther away from the anchor point to the artery, as it was obtained for most of the cases and the maximum is achieved at the top of the aneurysms, where the blood flow changes its magnitude and direction, transferring its momentum to the aneurysms wall. The distinctive behavior of UG-3 can be explained due to the complexity of its geometry, which includes three bifurcations and whose maximums tend to be located near the neck.
As can be seen in Table 6, the maximum reduction in displacement for both ruptured geometries are achieved for the size II variation, where for RG-2 that reduction is almost 30%, whereas for RG-3, the displacement is reduced both for diastole and systole, in about 54%. UG-2 has the maximum displacement increment in its largest variation, being this of about 60%. For UG3, its size II variation increases its displacement by approximately 10%, while its III variation gets a reduction of about 22% with respect to the original size.
The Von Mises stress evolution with respect to the aneurysm size increment means that larger aneurysms are prone to a higher rupture risk. Percentage differences are presented in Table 7. For both ruptured geometries, their greatest reduction is achieved for II size variations, being approximately 30% for RG-2 and between 23 and 29% for RG-3. For unruptured geometries, in both cases the increase of the Von Mises stress at the aneurysm is between 25 and 29%.
Figure 16 and Figure 17 show examples of the Von Mises stress at the aneurysm evolution for cases RG-3 and UG-3, where it can be noted that the top of the aneurysms shows higher levels of stress than other zones (except for the neck), even in the latter case which has a smooth surface. This is in accordance with the zones where ruptures are typically found. For those ruptured geometries, a reduction of the stresses from size I to size II variation can be seen, to then just increment. This difference of behavior can be explained by the very different morphology that size I variations for ruptured geometries have, which are in both cases, semi-spherical aneurysms, where the change of curvature of their necks can lead to stress concentrations, and since these aneurysms are smaller than the rest of the cases, it has a greater impact on its averaged results.
4.3. Pre-Aneurysm State
The presented contours of the TAWSS and pressure show that the lesion forms in zones where those parameters have medium magnitudes, in no case minimum values. As a comparison, the approximate value of the TAWSS at the zone of the healthy artery where the aneurysm is located afterwards when it occurs (shown in Figure 22), is visually obtained and compared with the same parameter, but averaged at the original aneurysm. Table 8 shows that for all four cases, there is a reduction in the TAWSS when the aneurysm is present, and interestingly, for both ruptured cases, the reduction is approximately 75%, while for the unruptured cases, the reduction is lower, being 45% for UG-1 and 33% for UG-2.
The reduction is explained because when the aneurysm is not present, the blood flow is in contact with the artery with a higher velocity than when the aneurysm occurs, because then it needs to travel a longer path into a cavity that makes it more difficult to the blood to flow due to the change in direction and because there is blood with a lower velocity filling the cavity.
5. Limitations
Real aneurysms exhibit a complex mechanical behavior along with a non-uniform wall thickness distribution and a non-predictable size and shape evolution due to the several factors that can affect its evolution and that can change from patient to patient, nevertheless, assumptions such as constant wall thickness, no pre-stretch, and isotropic wall structure are common practices that have shown to produce realistic structural responses [26,35] to allow investigators to develop models with a complexity that makes it possible to find a solution and predict an structural and hemodynamic evolution to serve as an early clinical aid in a future application of the present methodology.
6. Conclusion
Using computational simulations, this research could study the past evolution of aneurysms and explore potential future developments as well, a task that would otherwise not be possible to perform due to ethical concerns. This study demonstrated that for the studied group, as cerebral aneurysms grow, they trigger significant alterations in hemodynamic and structural parameters which reflect a greater rupture risk environment. For instance, an unruptured geometry can decrease its average WSS by up to 36% when it grows and increase its Von Mises stress by almost 30%. Furthermore, the use of FSI simulations made it possible to assess the effects of aneurysms wall thinning keeping their size unaltered, revealing that even if the aneurysm does not grow, it could be on a high rupture risk state because of a thin wall which is prone to a structural failure since its average Von Mises stress can increase in up to 260%. The use of simulations also enabled the study of the lateral arteries when the aneurysm is removed, finding that for both ruptured aneurysms, the TAWSS was reduced in 75% at the rupture point, whereas for unruptured aneurysms, although they also have a reduction, it was not as high. It is then concluded that even for a healthy patient, either of the geometrical modifications presented in this study implies a significant increment on the rupture risk of the studied cerebral aneurysms, and that there could be an indication of the rupture point of the aneurysms when its TAWSS reduction is obtained, although more samples are needed to give more statistically significant conclusions about this and the geometrical factors effect.
Conflict of interest
No potential conflict of interest was reported by the authors.
References
- Vlak, M.H.; Algra, A.; Brandenburg, R.; Rinkel, G.J. Prevalence of unruptured intracranial aneurysms, with emphasis on sex, age, comorbidity, country, and time period: a systematic review and meta-analysis. Lancet Neurol. 2011, 10, 626–636. [Google Scholar] [CrossRef]
- Keedy, A. An overview of intracranial aneurysms. McGill J. Med. 2006, 9, 141–146. [Google Scholar] [CrossRef]
- Wardlaw, J.M.; White, P.M. The detection and management of unruptured intracranial aneurysms. Brain 2000, 123, 205–221. [Google Scholar] [CrossRef] [PubMed]
- Sforza, D.M.; Putman, C.M.; Cebral, J.R. Hemodynamics of Cerebral Aneurysms. Annu. Rev. Fluid Mech. 2009, 41, 91–107. [Google Scholar] [CrossRef]
- Nieuwkamp, D.J.; E Setz, L.; Algra, A.; Linn, F.H.; de Rooij, N.K.; Rinkel, G.J. Changes in case fatality of aneurysmal subarachnoid haemorrhage over time, according to age, sex, and region: a meta-analysis. Lancet Neurol. 2009, 8, 635–642. [Google Scholar] [CrossRef]
- Munarriz, P.M.; Gómez, P.A.; Paredes, I.; Castaño-Leon, A.M.; Cepeda, S.; Lagares, A. Basic Principles of Hemodynamics and Cerebral Aneurysms. World Neurosurg. 2016, 88, 311–319. [Google Scholar] [CrossRef] [PubMed]
- Gao, L.; Hoi, Y.; Swartz, D.D.; Kolega, J.; Siddiqui, A.; Meng, H.; P, N.; J, P.; E, M.; M, T.; et al. Nascent Aneurysm Formation at the Basilar Terminus Induced by Hemodynamics. Stroke 2008, 39, 2085–2090. [Google Scholar] [CrossRef]
- Metaxa, E.; Tremmel, M.; Natarajan, S.K.; Xiang, J.; Paluch, R.A.; Mandelbaum, M.; Siddiqui, A.H.; Kolega, J.; Mocco, J.; Meng, H. Characterization of Critical Hemodynamics Contributing to Aneurysmal Remodeling at the Basilar Terminus in a Rabbit Model. Stroke 2010, 41, 1774–1782. [Google Scholar] [CrossRef] [PubMed]
- Kulcsár, Z.; Ugron. ; Marosfői, M.; Berentei, Z.; Paál, G.; Szikora, I. Hemodynamics of Cerebral Aneurysm Initiation: The Role of Wall Shear Stress and Spatial Wall Shear Stress Gradient. Am. J. Neuroradiol. 2011, 32, 587–594. [Google Scholar] [CrossRef]
- Boussel, L.; Rayz, V.; McCulloch, C.; Martin, A.; Acevedo-Bolton, G.; Lawton, M.; Higashida, R.; Smith, W.S.; Young, W.L.; Saloner, D.; et al. Aneurysm Growth Occurs at Region of Low Wall Shear Stress. Stroke 2008, 39, 2997–3002. [Google Scholar] [CrossRef]
- Jung, K.-H. New Pathophysiological Considerations on Cerebral Aneurysms. Neurointervention 2018, 13, 73–83. [Google Scholar] [CrossRef]
- Meng, H.; Tutino, V.M.; Xiang, J.; Siddiqui, A. High WSS or Low WSS? Complex Interactions of Hemodynamics with Intracranial Aneurysm Initiation, Growth, and Rupture: Toward a Unifying Hypothesis. Am. J. Neuroradiol. 2014, 35, 1254–1262. [Google Scholar] [CrossRef] [PubMed]
- L. E. Savastano, A. L. E. Savastano, A. Bhambri, D. Andrew Wilkinson, and A. S. Pandey, “Biology of Cerebral Aneurysm Formation, Growth, and Rupture,” in Intracranial Aneurysms, Elsevier, 2018, pp. 17–32. [CrossRef]
- Koffijberg, H.; Buskens, E.; Algra, A.; Wermer, M.J.H.; Rinkel, G.J.E. Growth rates of intracranial aneurysms: exploring constancy. J. Neurosurg. 2008, 109, 176–185. [Google Scholar] [CrossRef]
- Watanabe, Z.; Tomura, N.; Akasu, I.; Munakata, R.; Horiuchi, K.; Watanabe, K. Comparison of Rates of Growth between Unruptured and Ruptured Aneurysms Using Magnetic Resonance Angiography. J. Stroke Cerebrovasc. Dis. 2017, 26, 2849–2854. [Google Scholar] [CrossRef] [PubMed]
- Leemans, E.L.; Cornelissen, B.M.W.; Said, M.; Berg, R.v.D.; Slump, C.H.; Marquering, H.A.; Majoie, C.B.L.M. Intracranial aneurysm growth: consistency of morphological changes. Neurosurg. Focus 2019, 47, E5. [Google Scholar] [CrossRef]
- Joo, S.W.; Lee, S.-I.; Noh, S.J.; Jeong, Y.G.; Kim, M.S.; Jeong, Y.T. What Is the Significance of a Large Number of Ruptured Aneurysms Smaller than 7 mm in Diameter? J. Korean Neurosurg. Soc. 2009, 45, 85–89. [Google Scholar] [CrossRef] [PubMed]
- Sherif, C.; Kleinpeter, G.; Mach, G.; Loyoddin, M.; Haider, T.; Plasenzotti, R.; Bergmeister, H.; Di Ieva, A.; Gibson, D.; Krssak, M. Evaluation of cerebral aneurysm wall thickness in experimental aneurysms: Comparison of 3T-MR imaging with direct microscopic measurements. Acta Neurochir. 2013, 156, 27–34. [Google Scholar] [CrossRef]
- Crompton, M.R. Mechanism of Growth and Rupture in Cerebral Berry Aneurysms. BMJ 1966, 1, 1138–1142. [Google Scholar] [CrossRef]
- Sun, H.T.; Sze, K.Y.; Tang, A.Y.S.; Tsang, A.C.O.; Yu, A.C.H.; Chow, K.W. Effects of aspect ratio, wall thickness and hypertension in the patient-specific computational modeling of cerebral aneurysms using fluid-structure interaction analysis. Eng. Appl. Comput. Fluid Mech. 2019, 13, 229–244. [Google Scholar] [CrossRef]
- Yadav, P.N.; Singh, G.; Chanda, A. Biomechanical modeling of cerebral aneurysm. Mater. Today: Proc. 2022, 62, 3295–3300. [Google Scholar] [CrossRef]
- Watton, P.N.; Ventikos, Y.; Holzapfel, G.A. Modelling the growth and stabilization of cerebral aneurysms. Math. Med. Biol. A J. IMA 2009, 26, 133–164. [Google Scholar] [CrossRef]
- Tobe, Y.; Yagi, T.; Kawamura, K.; Suto, K.; Sawada, Y.; Hayashi, Y.; Yoshida, H.; Nishitani, K.; Okada, Y.; Kitahara, S.; et al. Three-dimensional wall-thickness distributions of unruptured intracranial aneurysms characterized by micro-computed tomography. Biomech. Model. Mechanobiol. 2024, 1–12. [Google Scholar] [CrossRef]
- Shang, E.K.; Nathan, D.P.; Woo, E.Y.; Fairman, R.M.; Wang, G.J.; Gorman, R.C.; Gorman, J.H., III; Jackson, B.M. Local wall thickness in finite element models improves prediction of abdominal aortic aneurysm growth. J. Vasc. Surg. 2015, 61, 217–223. [Google Scholar] [CrossRef]
- Voß, S.; Glaßer, S.; Hoffmann, T.; Beuing, O.; Weigand, S.; Jachau, K.; Preim, B.; Thévenin, D.; Janiga, G.; Berg, P. Fluid-Structure Simulations of a Ruptured Intracranial Aneurysm: Constant versus Patient-Specific Wall Thickness. Comput. Math. Methods Med. 2016, 2016, 1–8. [Google Scholar] [CrossRef] [PubMed]
- Torii, R.; Oshima, M.; Kobayashi, T.; Takagi, K.; Tezduyar, T.E. Fluid–structure interaction modeling of blood flow and cerebral aneurysm: Significance of artery and aneurysm shapes. Comput. Methods Appl. Mech. Eng. 2008, 198, 3613–3621. [Google Scholar] [CrossRef]
- Bazilevs, Y.; Hsu, M.-C.; Zhang, Y.; Wang, W.; Kvamsdal, T.; Hentschel, S.; Isaksen, J.G. Computational vascular fluid–structure interaction: methodology and application to cerebral aneurysms. Biomech. Model. Mechanobiol. 2010, 9, 481–498. [Google Scholar] [CrossRef] [PubMed]
- Khe, A.K.; A Cherevko, A.; Chupakhin, A.P.; Bobkova, M.S.; Krivoshapkin, A.L.; Orlov, K.Y. Haemodynamics of giant cerebral aneurysm: A comparison between the rigid-wall, one-way and two-way FSI models. J. Physics: Conf. Ser. 2016, 722, 012042. [Google Scholar] [CrossRef]
- Valencia, A.; Morales, H.; Rivera, R.; Bravo, E.; Galvez, M. Blood flow dynamics in patient-specific cerebral aneurysm models: The relationship between wall shear stress and aneurysm area index. Med Eng. Phys. 2007, 30, 329–340. [Google Scholar] [CrossRef]
- Suzuki, J.; Ohara, H. Clinicopathological study of cerebral aneurysms. J. Neurosurg. 1978, 48, 505–514. [Google Scholar] [CrossRef]
- Amigo, N.; Valencia. Determining Significant Morphological and Hemodynamic Parameters to Assess the Rupture Risk of Cerebral Aneurysms. J. Med Biol. Eng. 2018, 39, 329–335. [Google Scholar] [CrossRef]
- Dunn, L.T. RAISED INTRACRANIAL PRESSURE. J. Neurol. Neurosurg. Psychiatry 2002, 73, i23–i27. [Google Scholar] [CrossRef] [PubMed]
- Valencia, A.; Contente, A.; Ignat, M.; Mura, J.; Bravo, E.; Rivera, R.; Sordo, J. Mechanical test of human cerebral aneurysm specimens obtained from surgical clipping. J. Mech. Med. Biol. 2015, 15, 1550075. [Google Scholar] [CrossRef]
- Oliveira, I.; Cardiff, P.; Baccin, C.; Gasche, J. A numerical investigation of the mechanics of intracranial aneurysms walls: Assessing the influence of tissue hyperelastic laws and heterogeneous properties on the stress and stretch fields. J. Mech. Behav. Biomed. Mater. 2022, 136, 105498. [Google Scholar] [CrossRef] [PubMed]
- Valencia, A.; Burdiles, P.; Ignat, M.; Mura, J.; Bravo, E.; Rivera, R.; Sordo, J. Fluid Structural Analysis of Human Cerebral Aneurysm Using Their Own Wall Mechanical Properties. Comput. Math. Methods Med. 2013, 2013, 1–18. [Google Scholar] [CrossRef] [PubMed]
- Valencia, A.; Torrens, P.; Rivera, R.; Galvez, M.; Bravo, E. A mechanical study of patient-specific cerebral aneurysm models: The correlations between stress and displacement with geometrical indices. Mech. Res. Commun. 2009, 36, 642–651. [Google Scholar] [CrossRef]
- Cornejo, S.; Guzmán, A.; Valencia, A.; Rodríguez, J.; Finol, E. Flow-induced wall mechanics of patient-specific aneurysmal cerebral arteries: Nonlinear isotropic versus anisotropic wall stress. Proc. Inst. Mech. Eng. Part H: J. Eng. Med. 2013, 228, 37–48. [Google Scholar] [CrossRef]
Figure 1.
Selected geometries for the study. With previous rupture, RG-1 to RG-3 at the top, and without previous rupture, UG-1 to UG-3 at the bottom.
Figure 1.
Selected geometries for the study. With previous rupture, RG-1 to RG-3 at the top, and without previous rupture, UG-1 to UG-3 at the bottom.
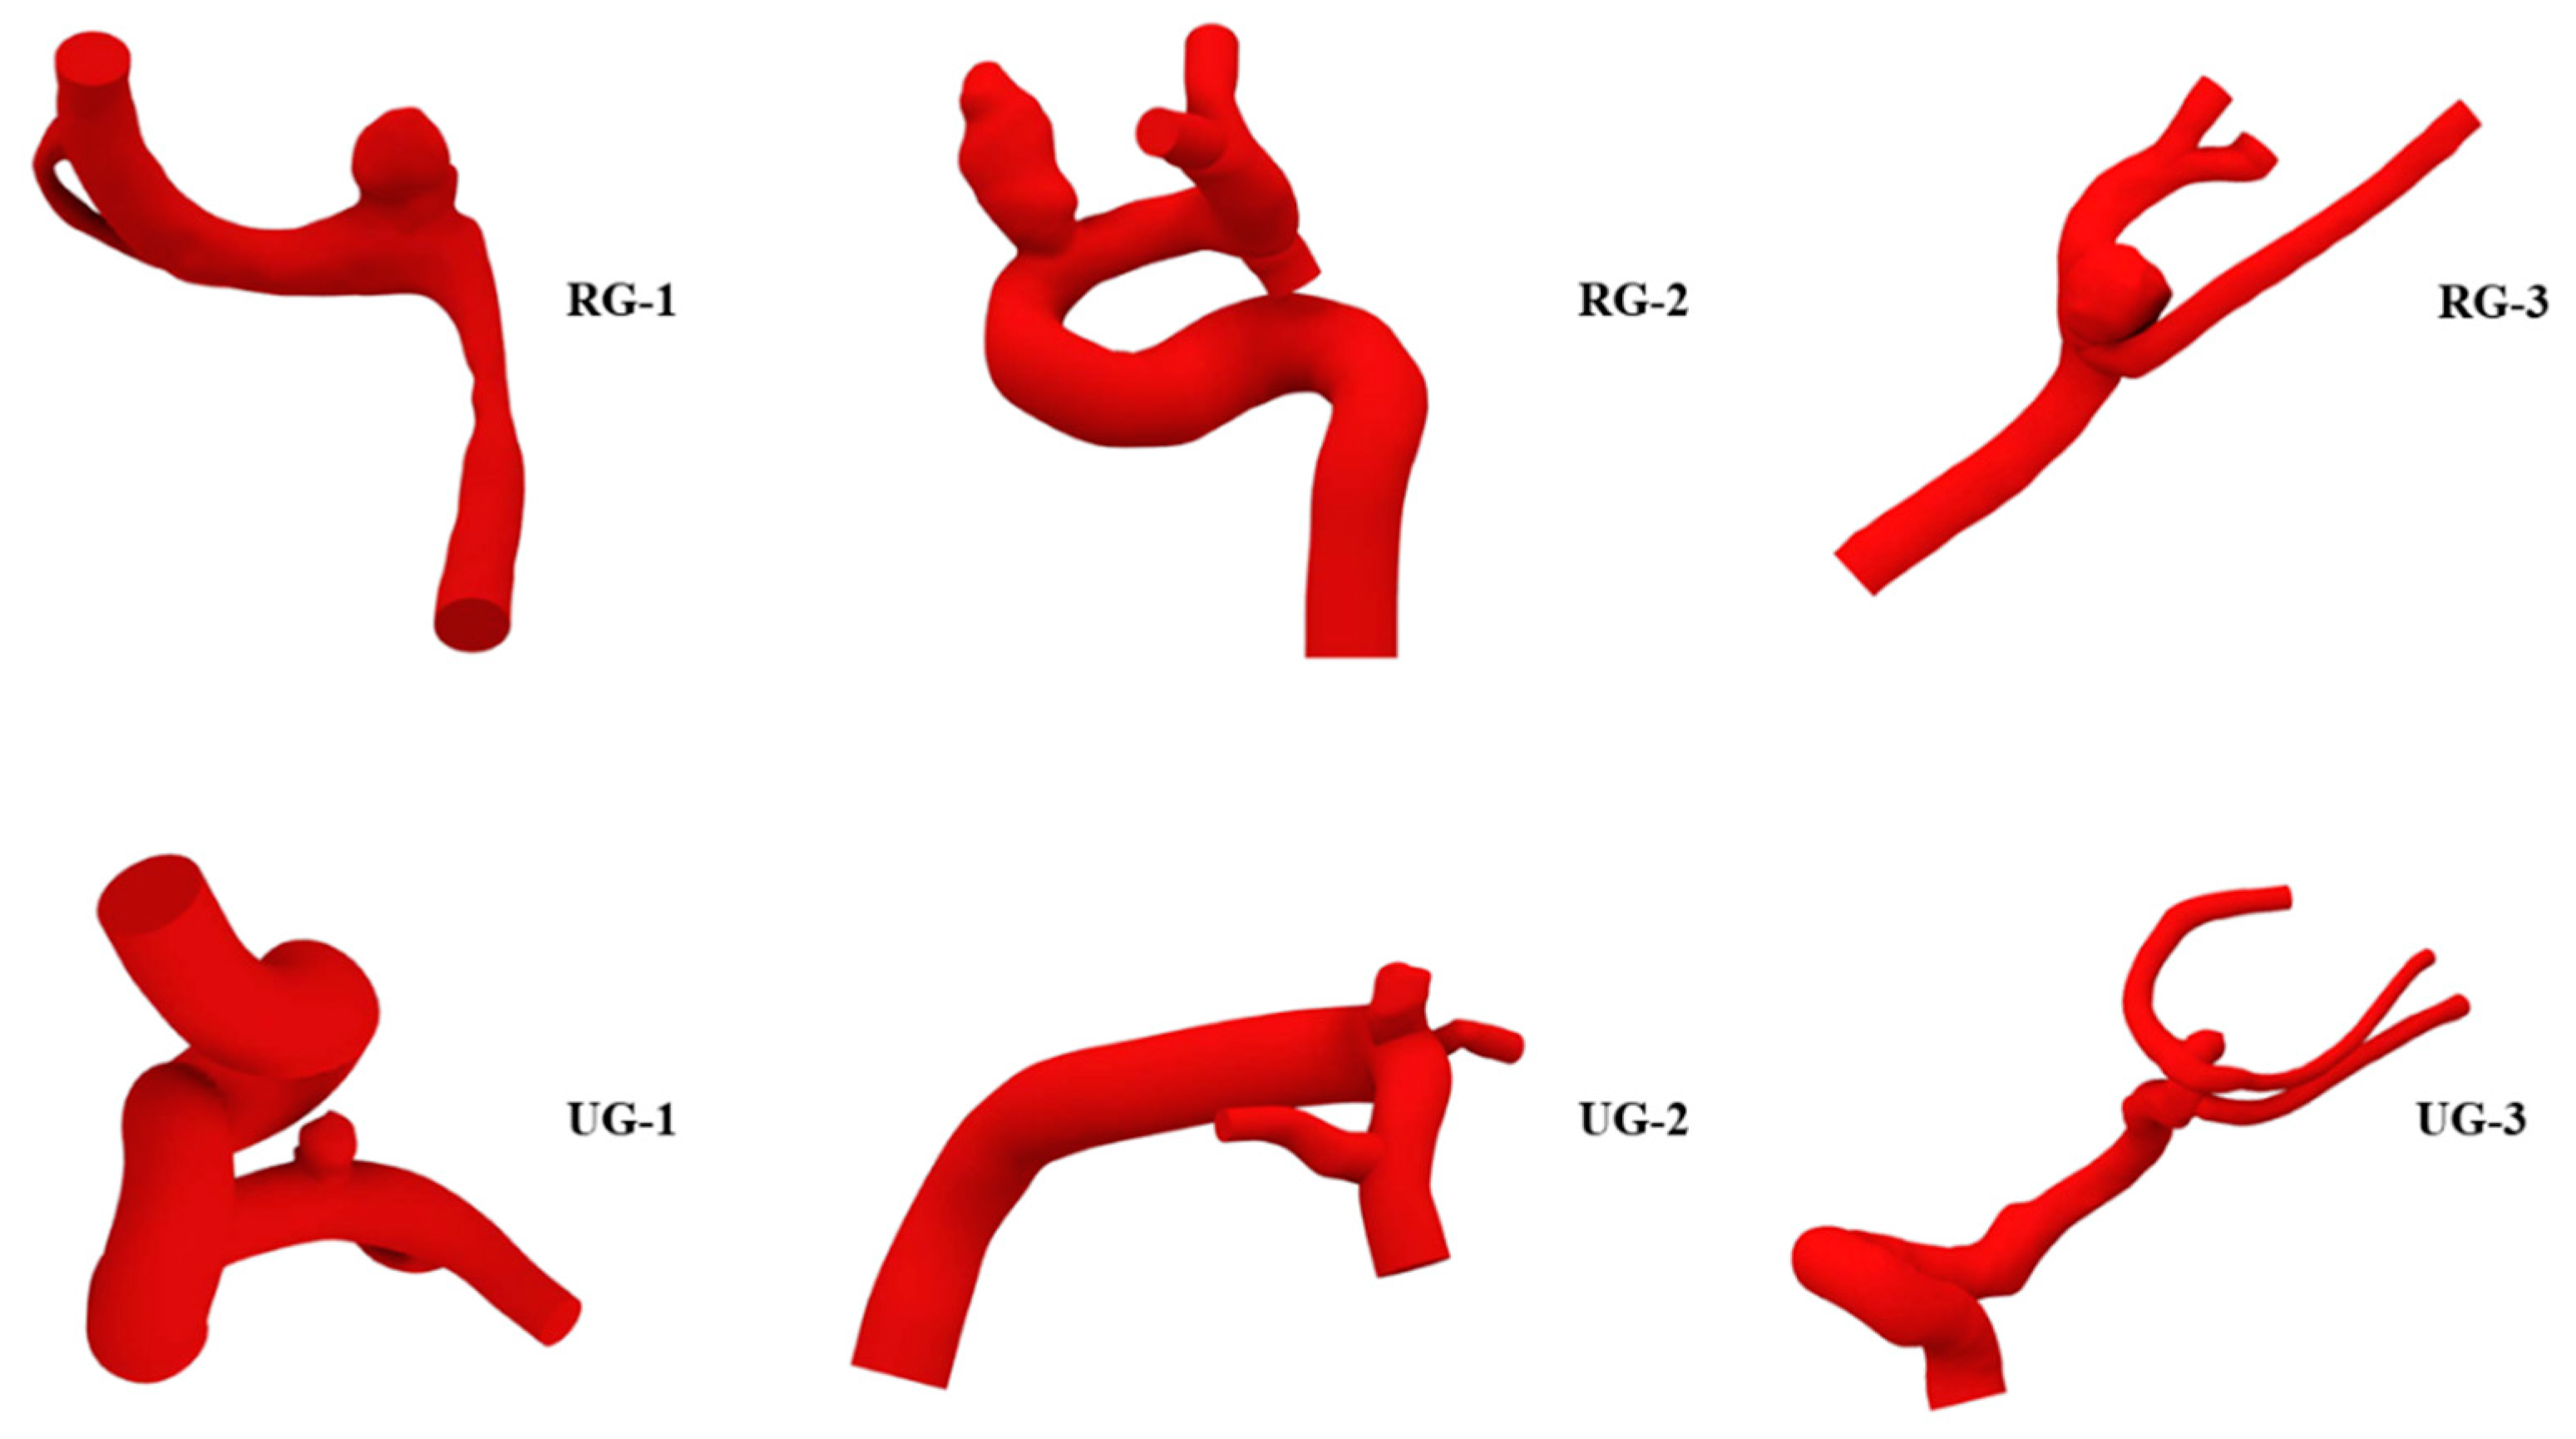
Figure 2.
Example of the main steps of the scaling process. a) Neck plane, b) aneurysm removal, c) T-spline body, d) scaled body, e) solid body, and f) aneurysm joined to the artery.
Figure 2.
Example of the main steps of the scaling process. a) Neck plane, b) aneurysm removal, c) T-spline body, d) scaled body, e) solid body, and f) aneurysm joined to the artery.
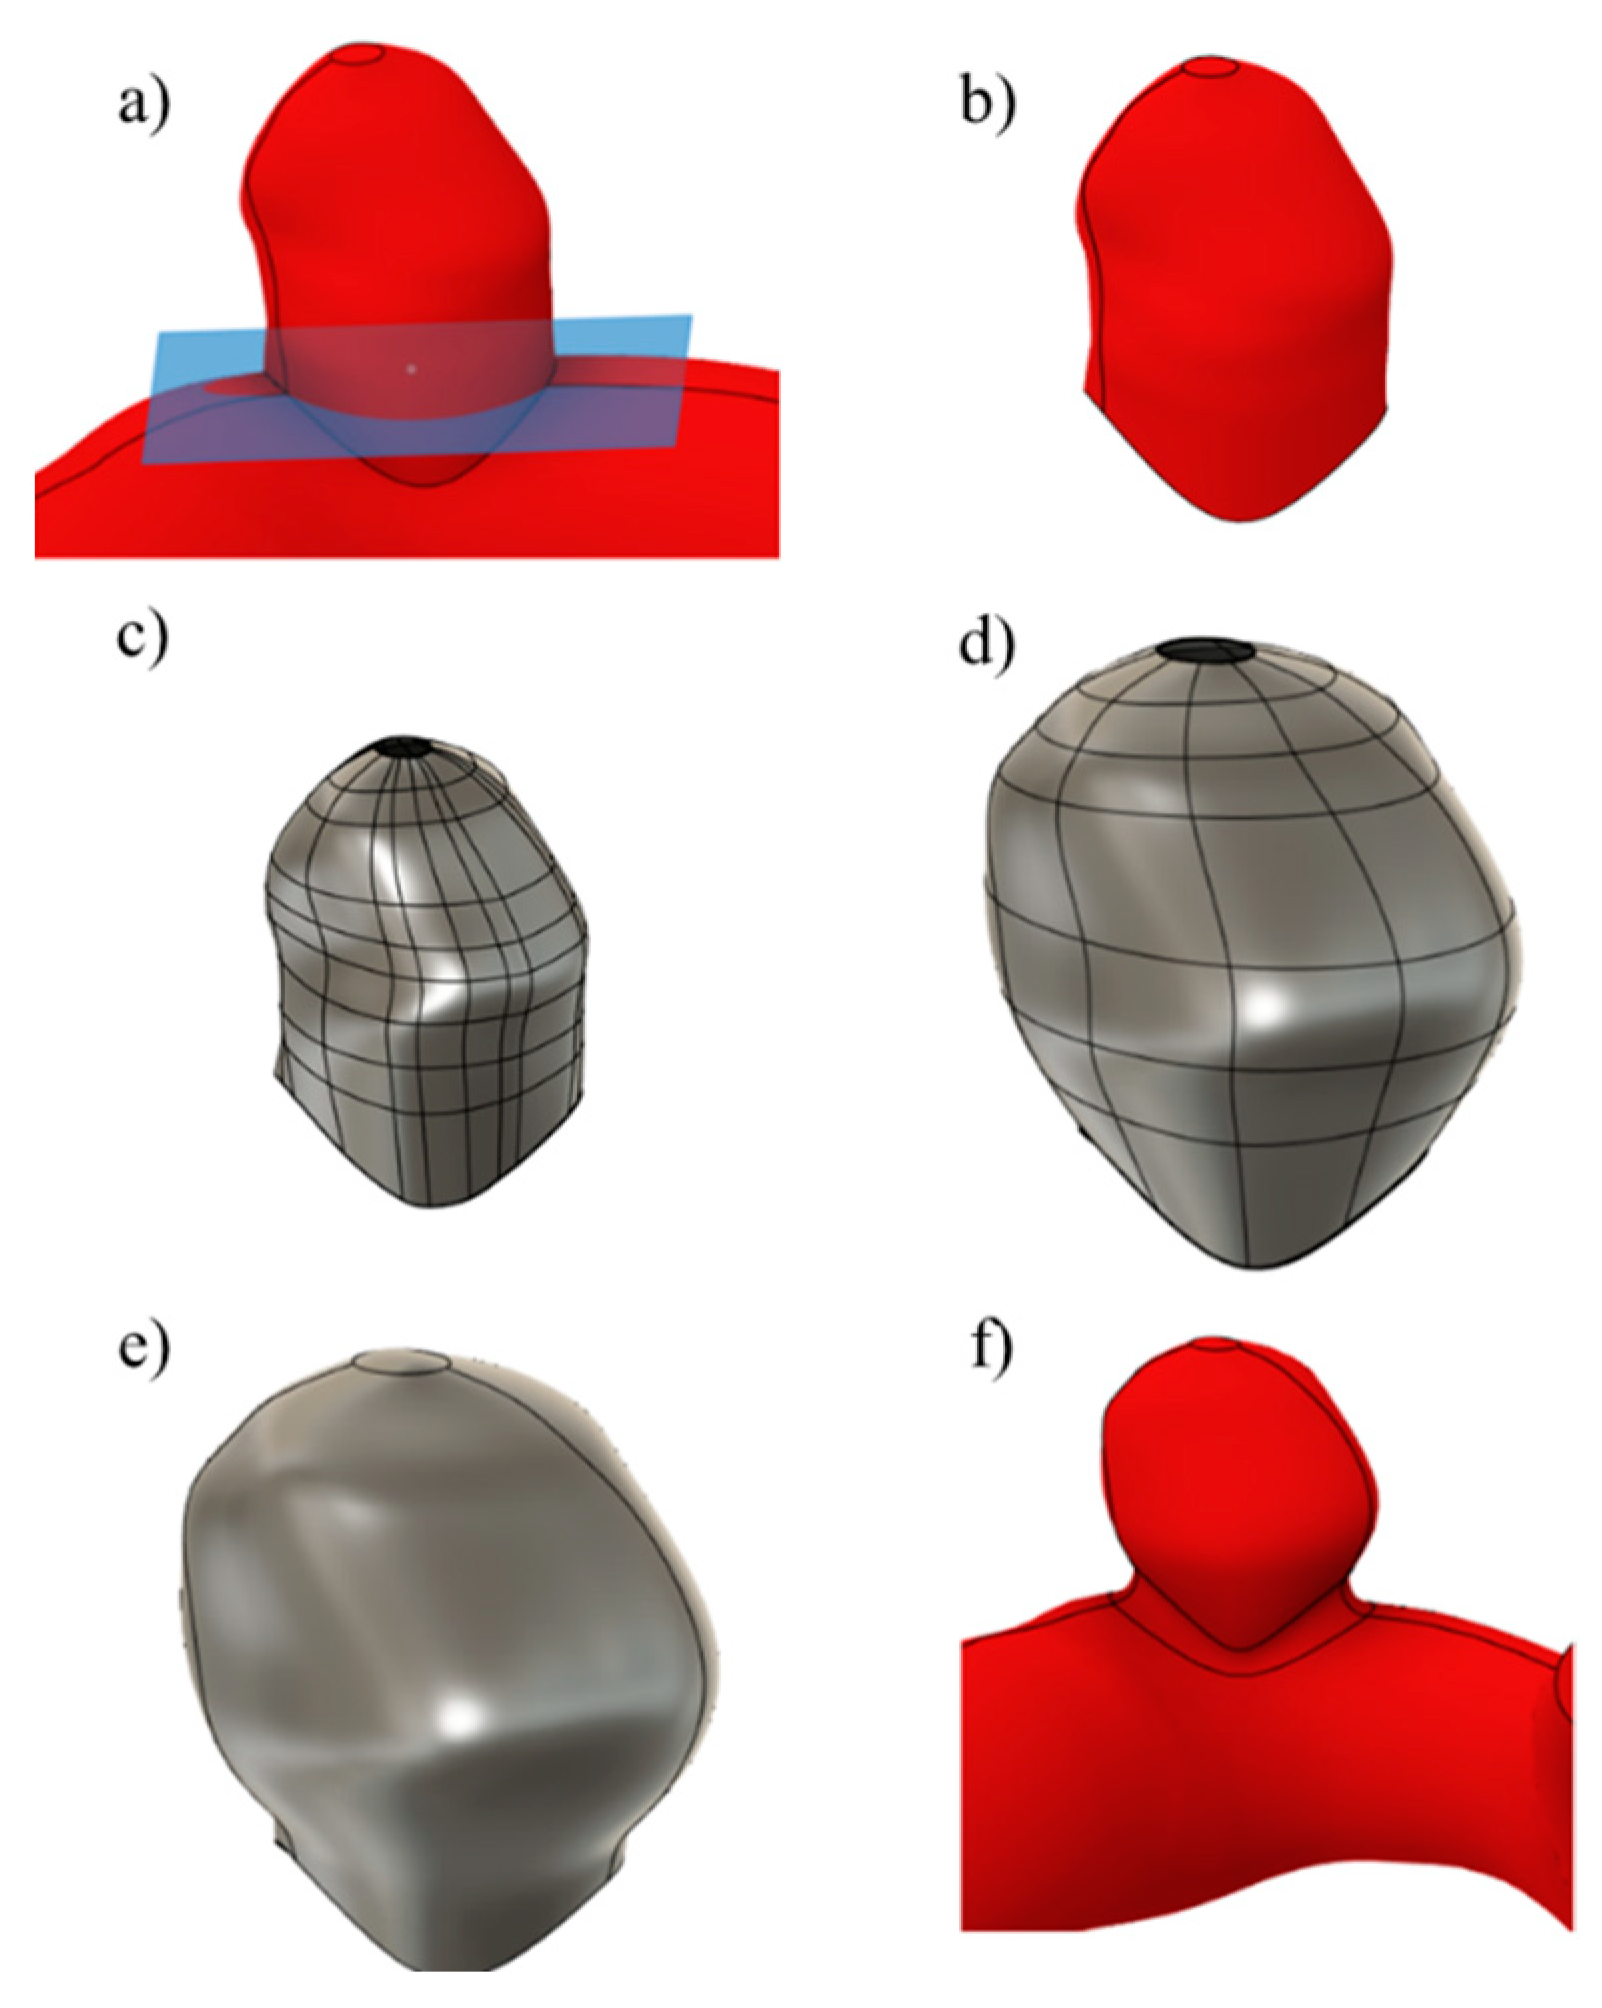
Figure 3.
Unruptured geometries with a) I, b) II and c) III sizes.
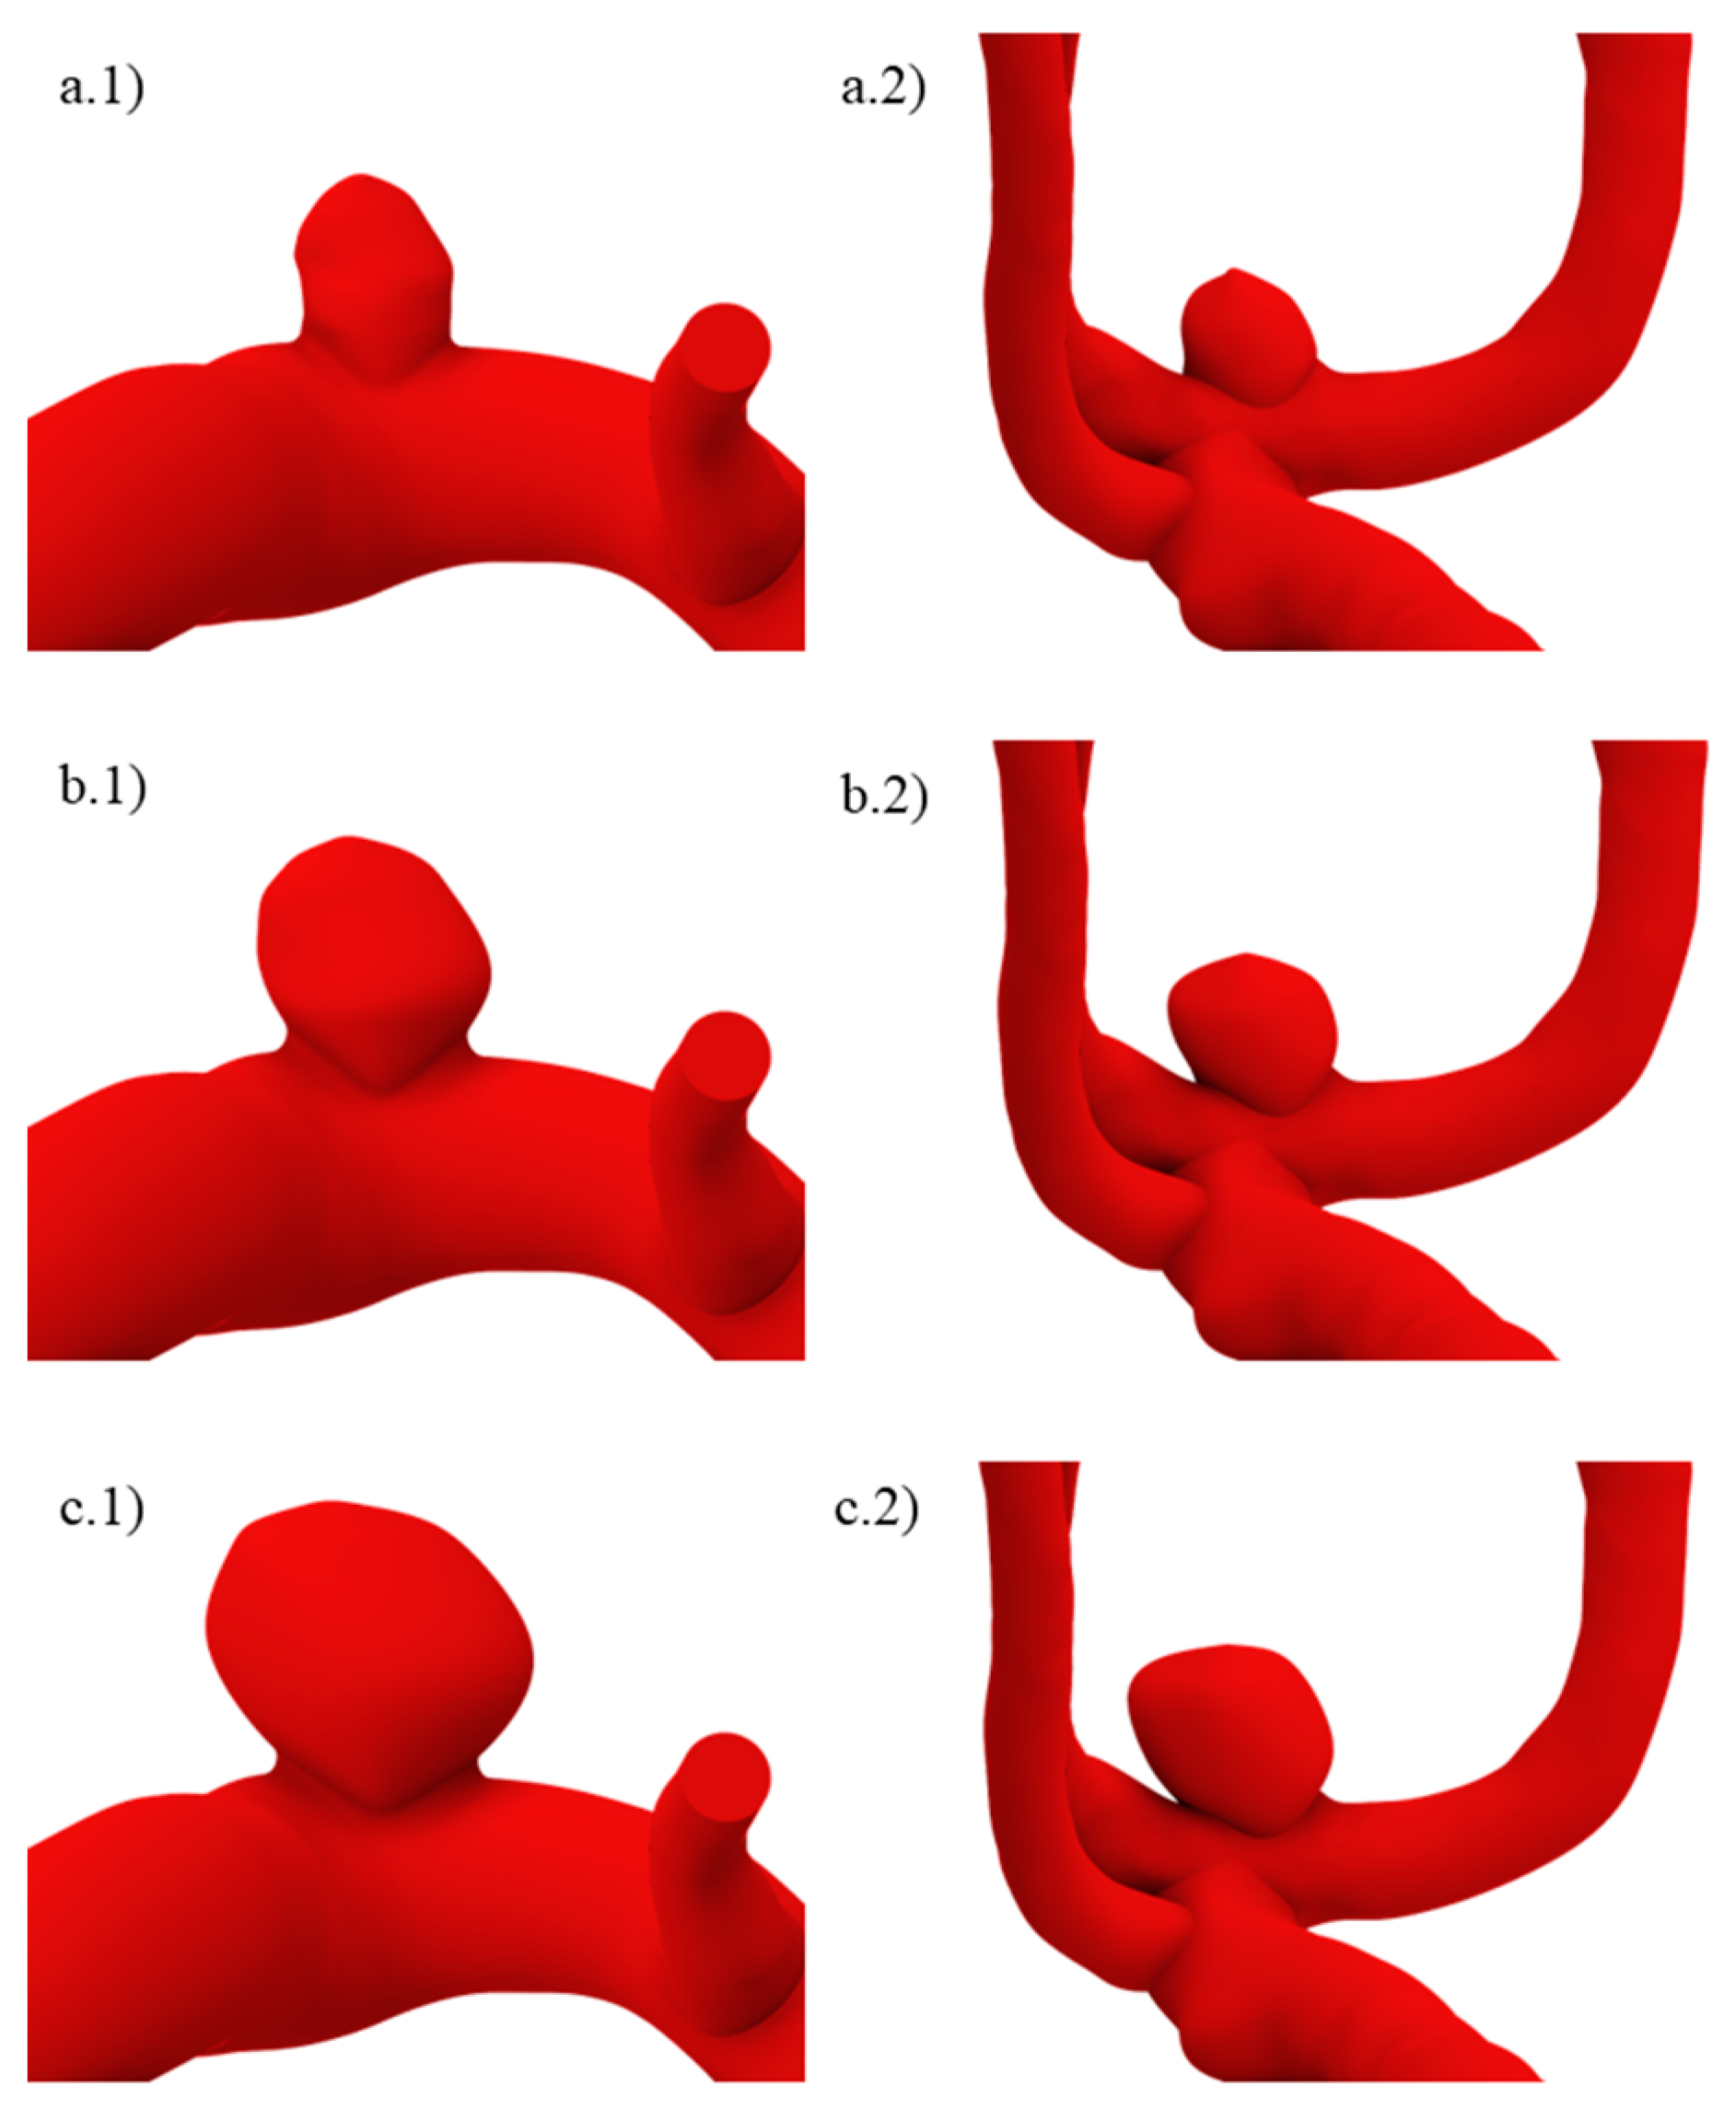
Figure 4.
Ruptured geometries with a) IV, b) III, c) II, and d) I sizes.
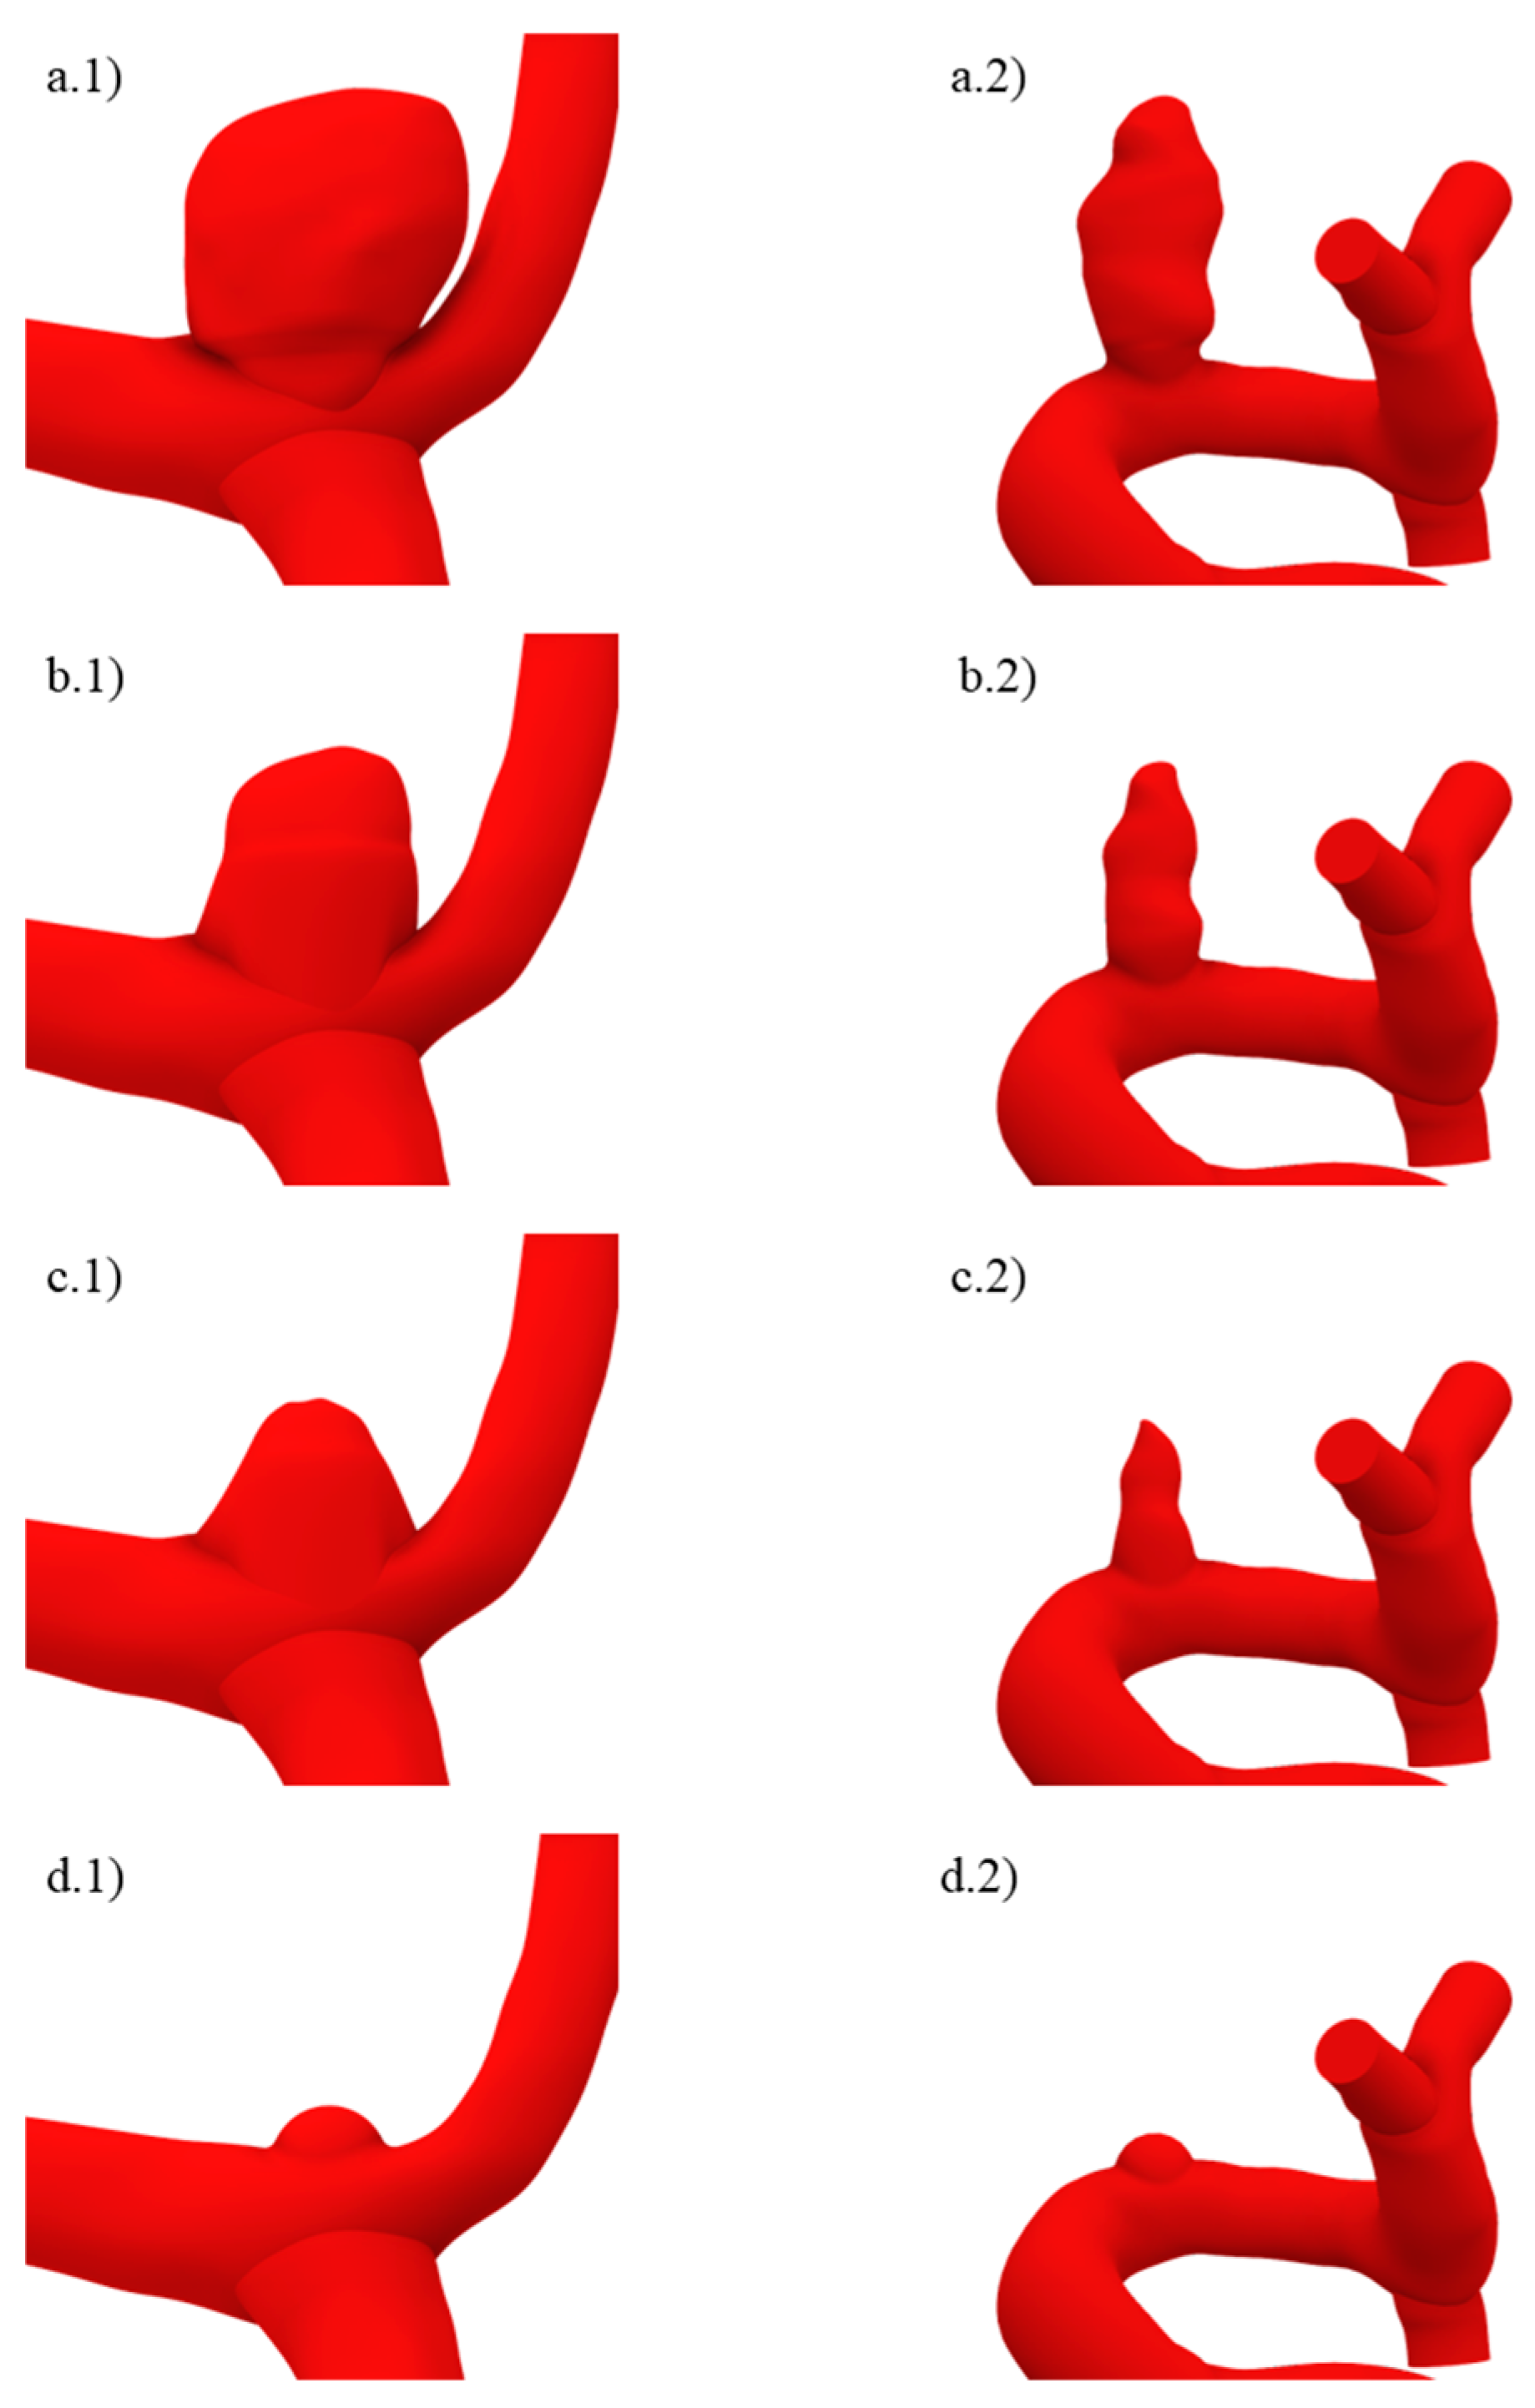
Figure 5.
Created surfaces for the artery (in green), with a thickness of 0.35 [mm] and the aneurysm (in gray) with thicknesses of 0.35, 0.2, and 0.10 [mm].
Figure 5.
Created surfaces for the artery (in green), with a thickness of 0.35 [mm] and the aneurysm (in gray) with thicknesses of 0.35, 0.2, and 0.10 [mm].
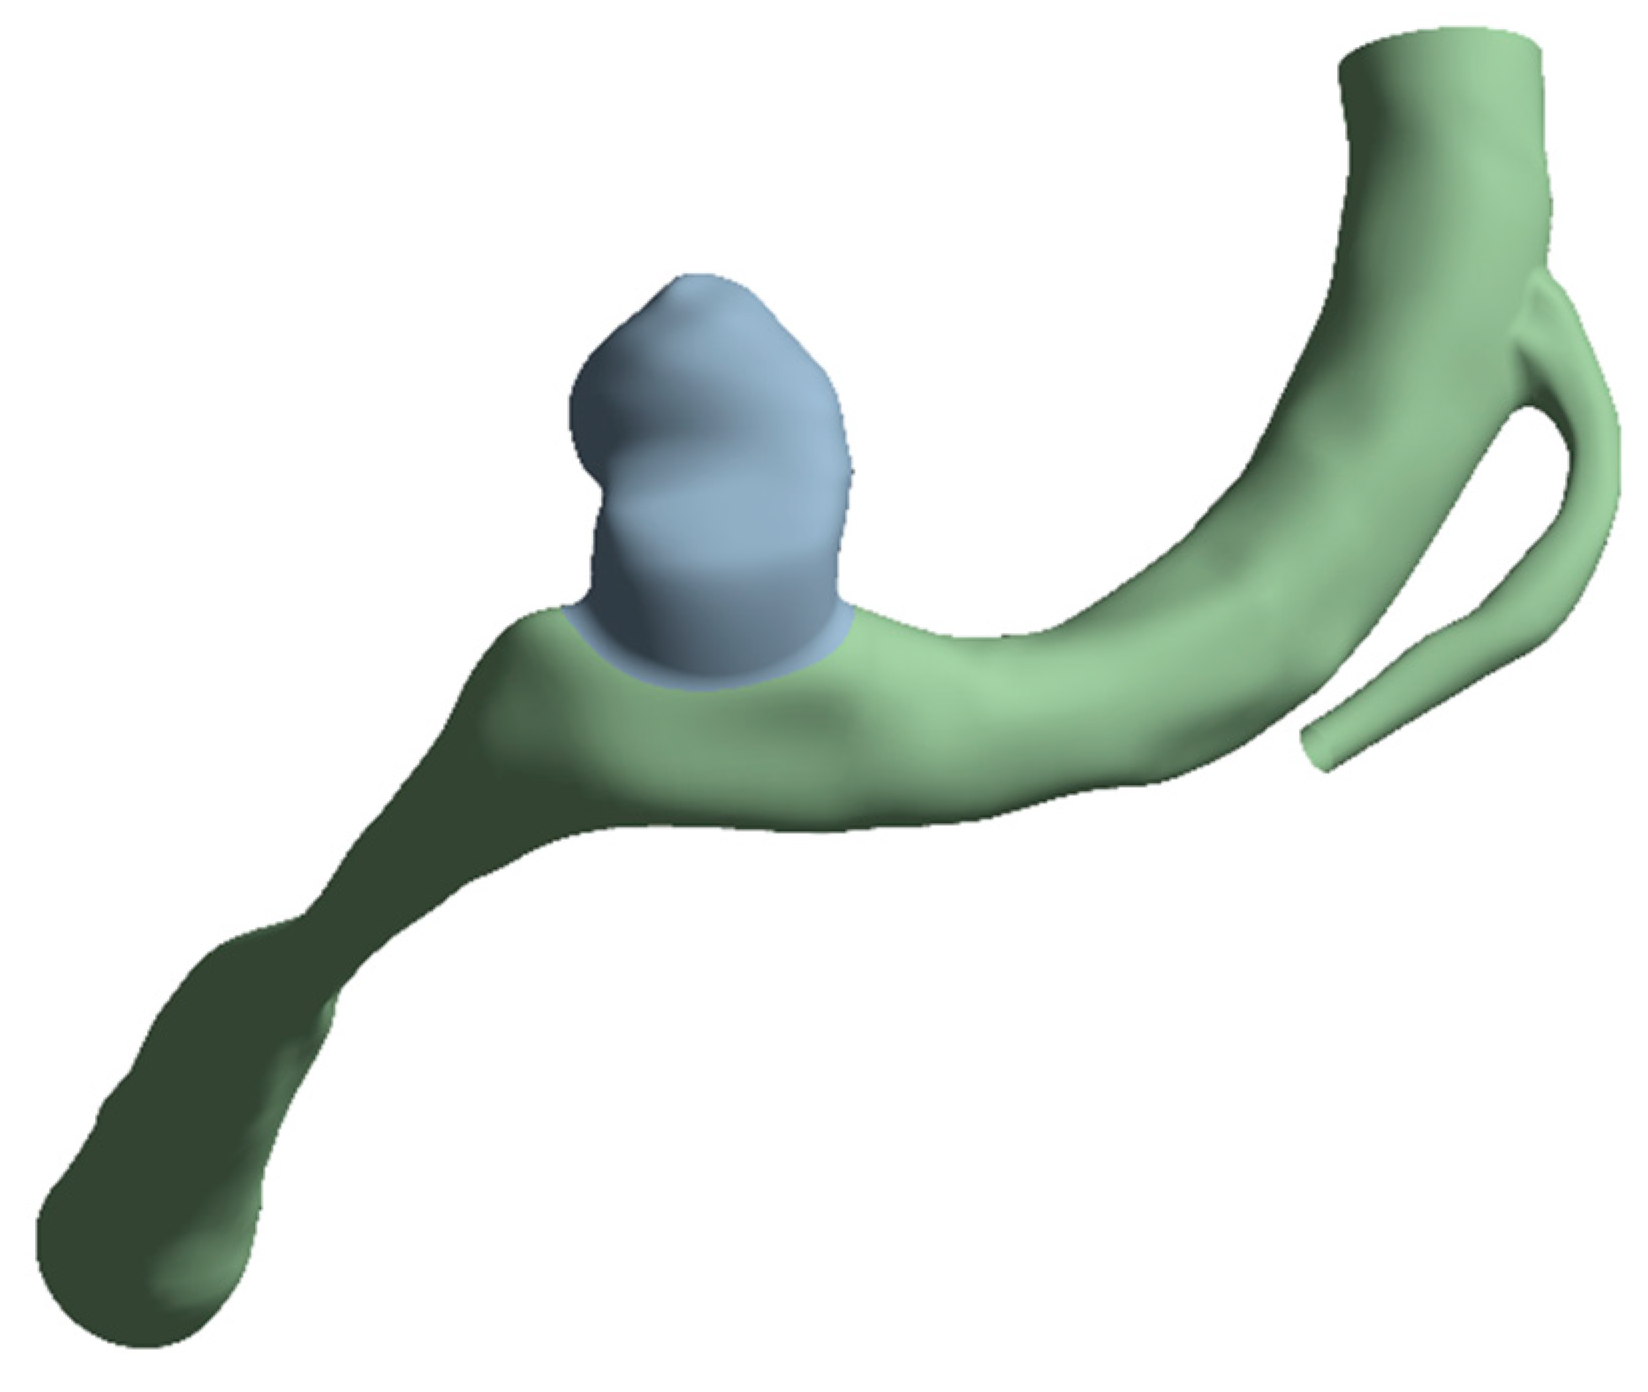
Figure 6.
Average WSS variation at the aneurysm at diastole (DWSS) and systole (SWSS) in mesh convergence test based on mesh density with linear and quadratic tetrahedral element.
Figure 6.
Average WSS variation at the aneurysm at diastole (DWSS) and systole (SWSS) in mesh convergence test based on mesh density with linear and quadratic tetrahedral element.
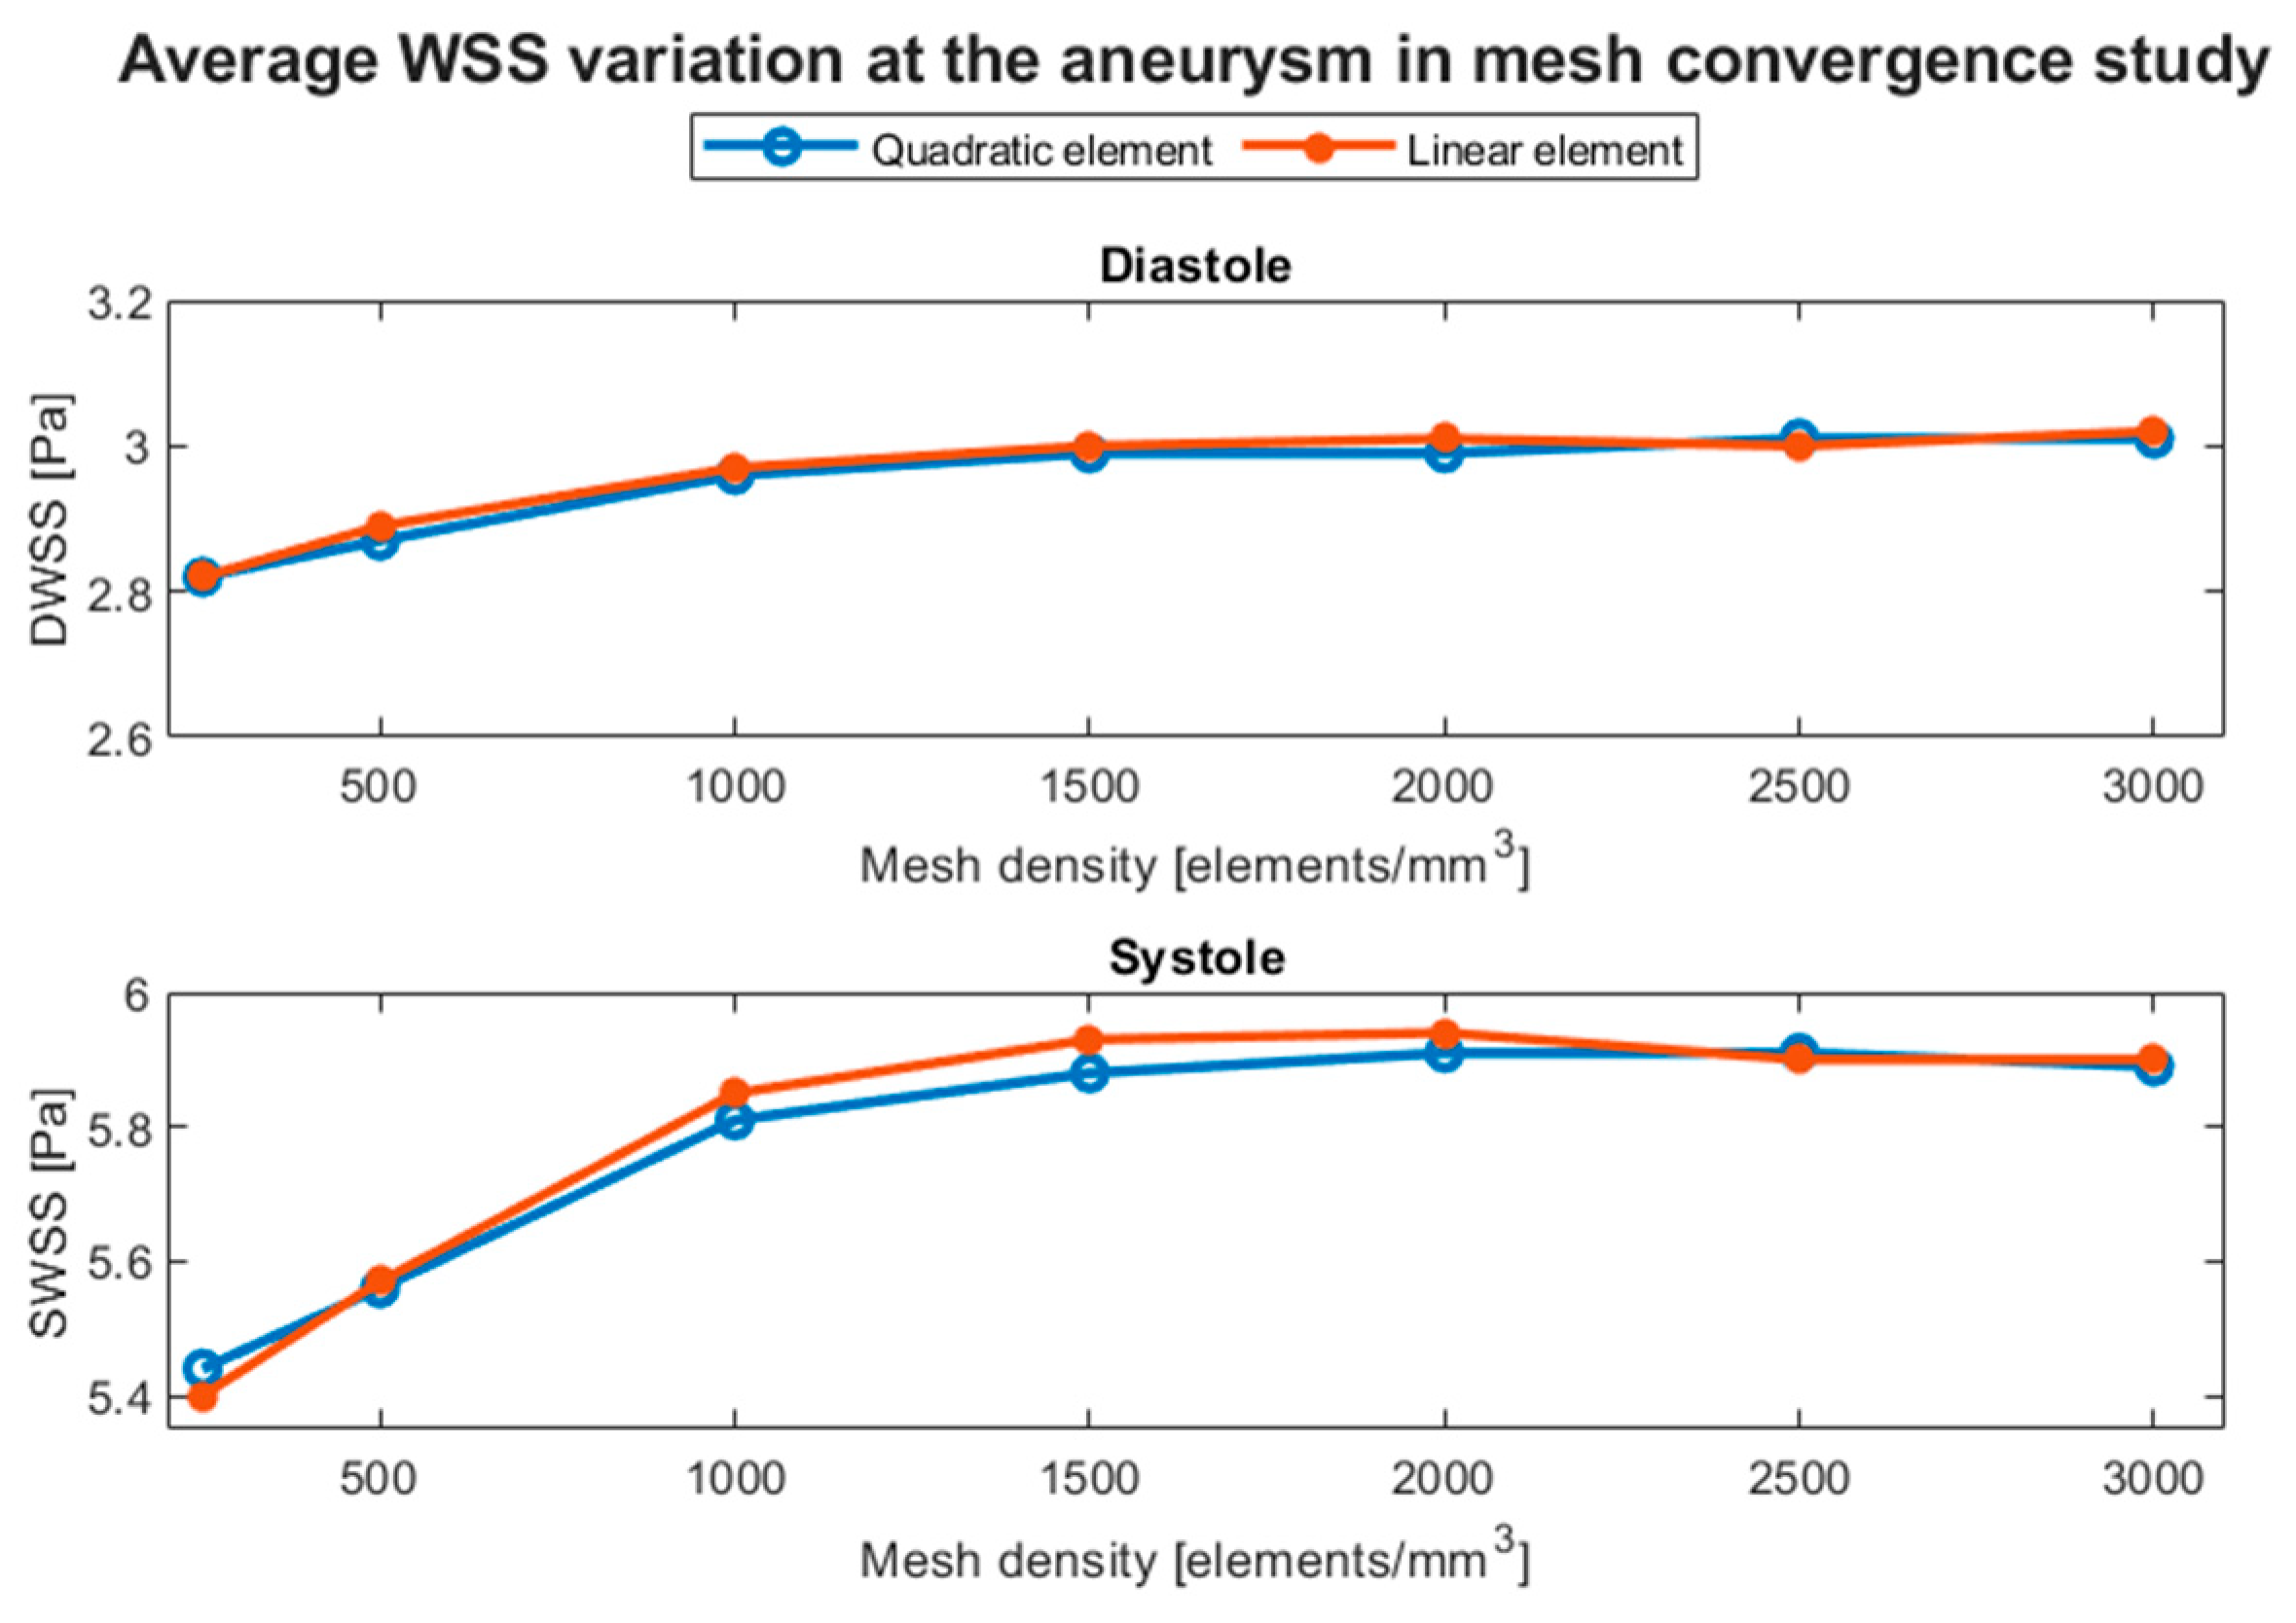
Figure 7.
Temporal evolution of the average WSS at the aneurysm for RG1 and UG-1 for each wall thickness.
Figure 7.
Temporal evolution of the average WSS at the aneurysm for RG1 and UG-1 for each wall thickness.
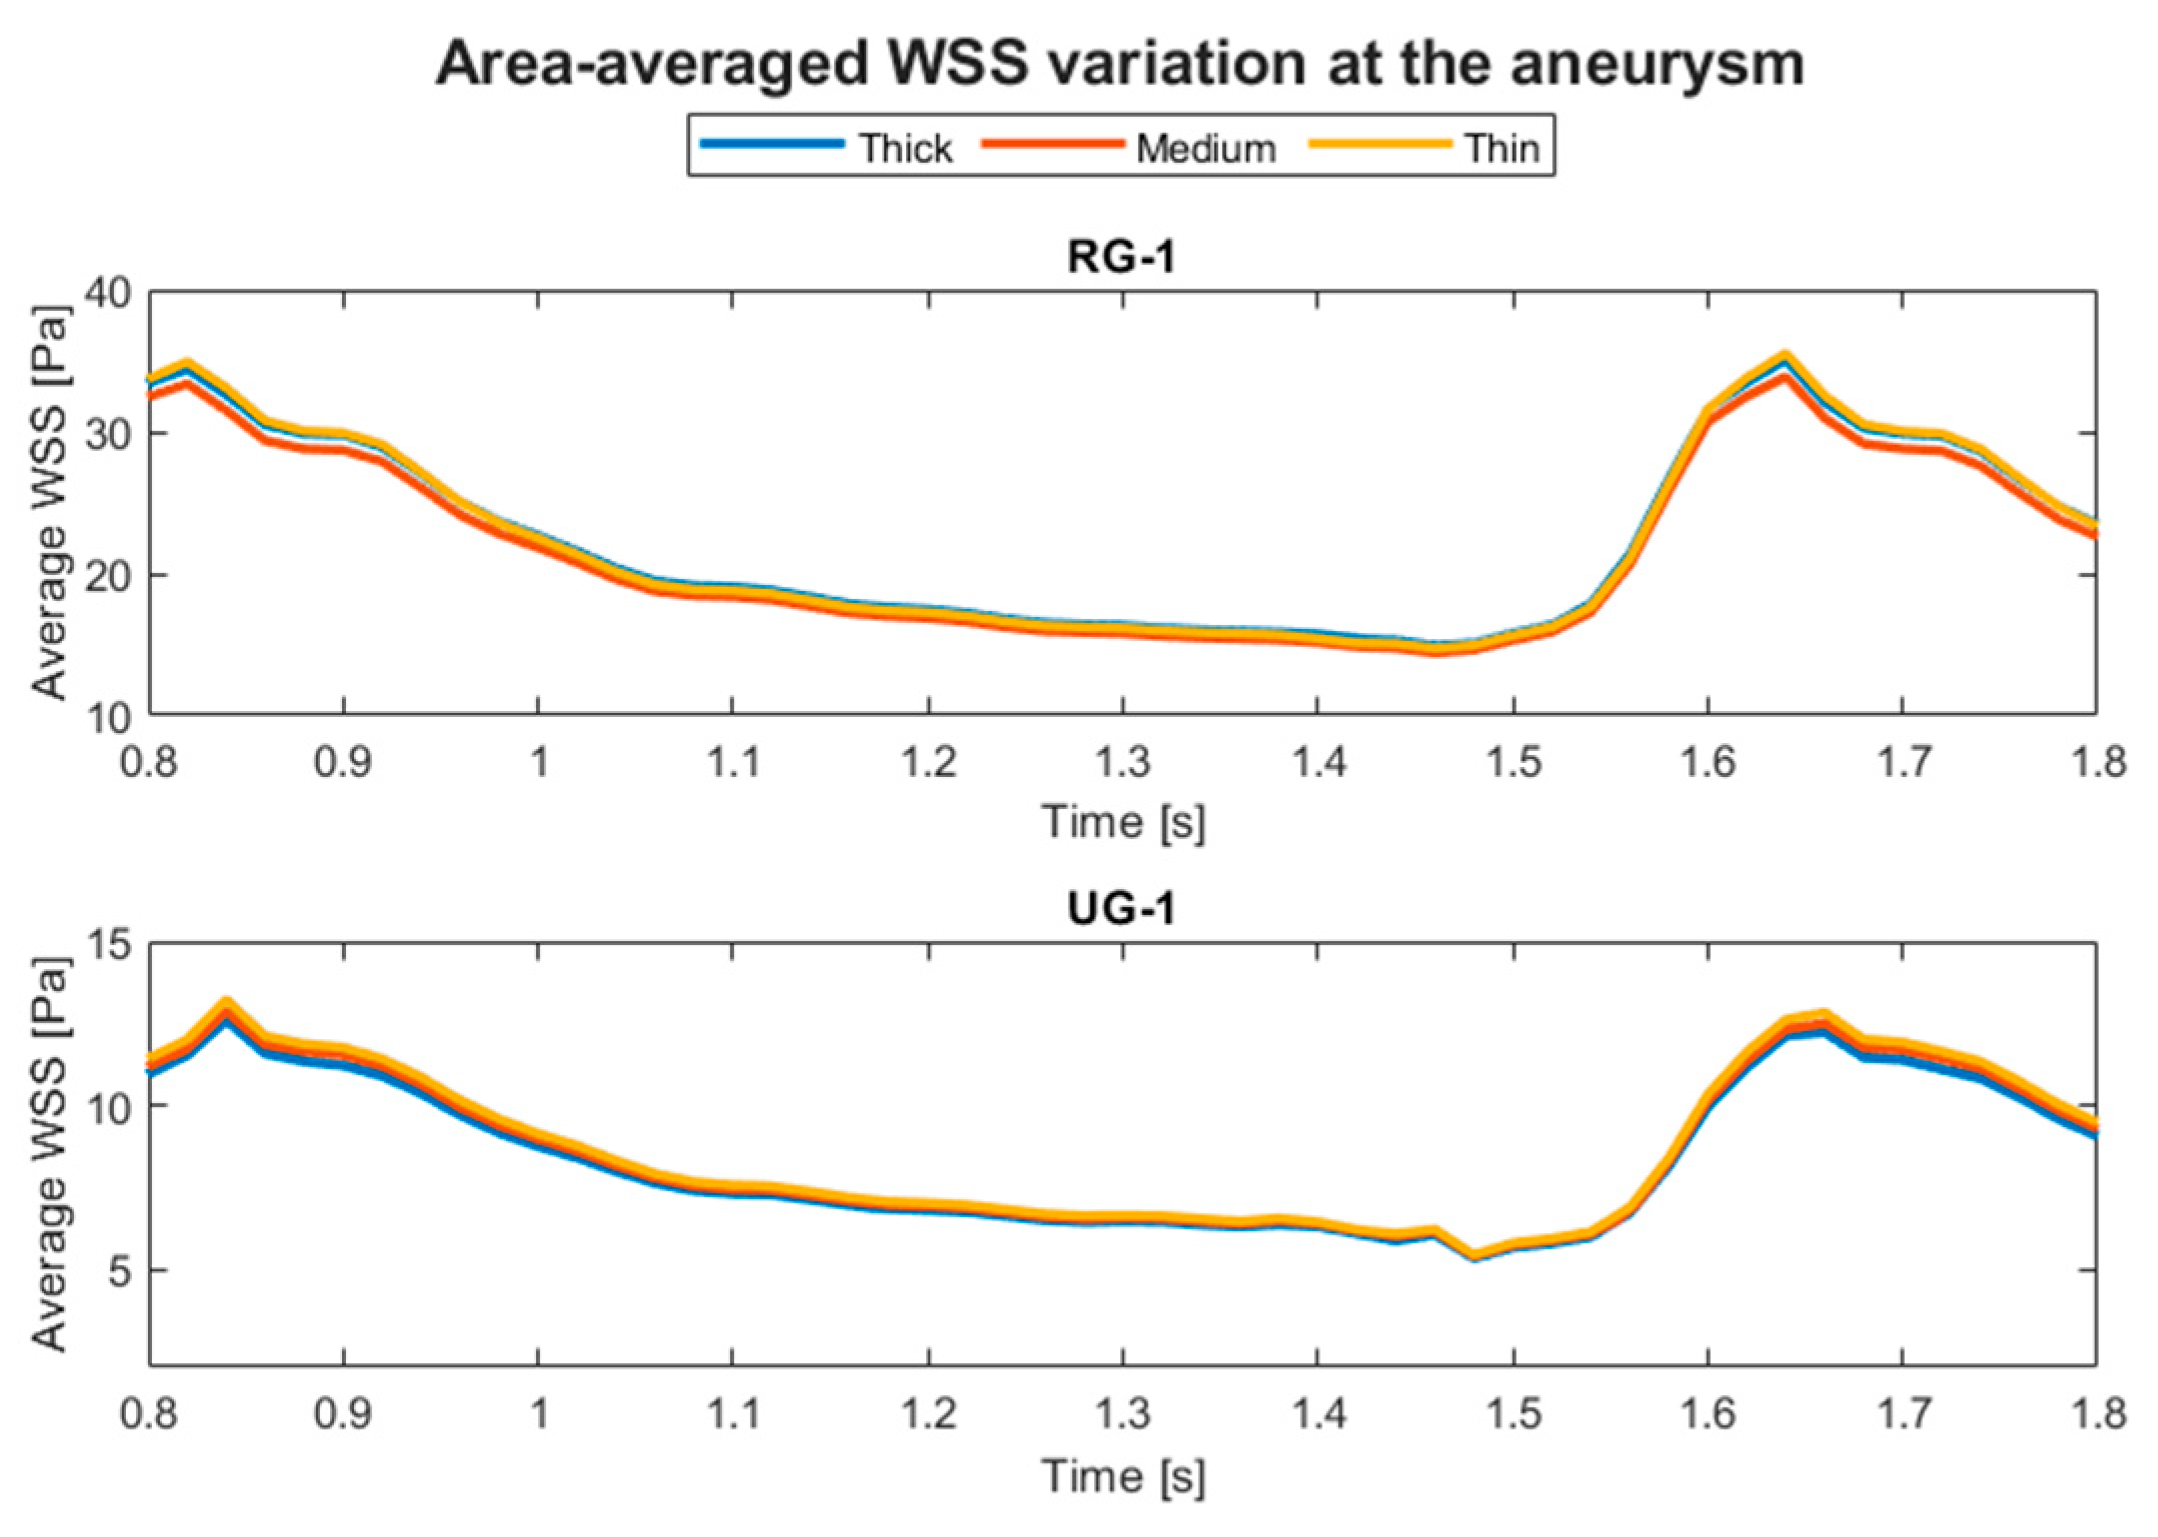
Figure 8.
Evolution of the average displacement at the aneurysm with respect to the aneurysm wall thickness.
Figure 8.
Evolution of the average displacement at the aneurysm with respect to the aneurysm wall thickness.
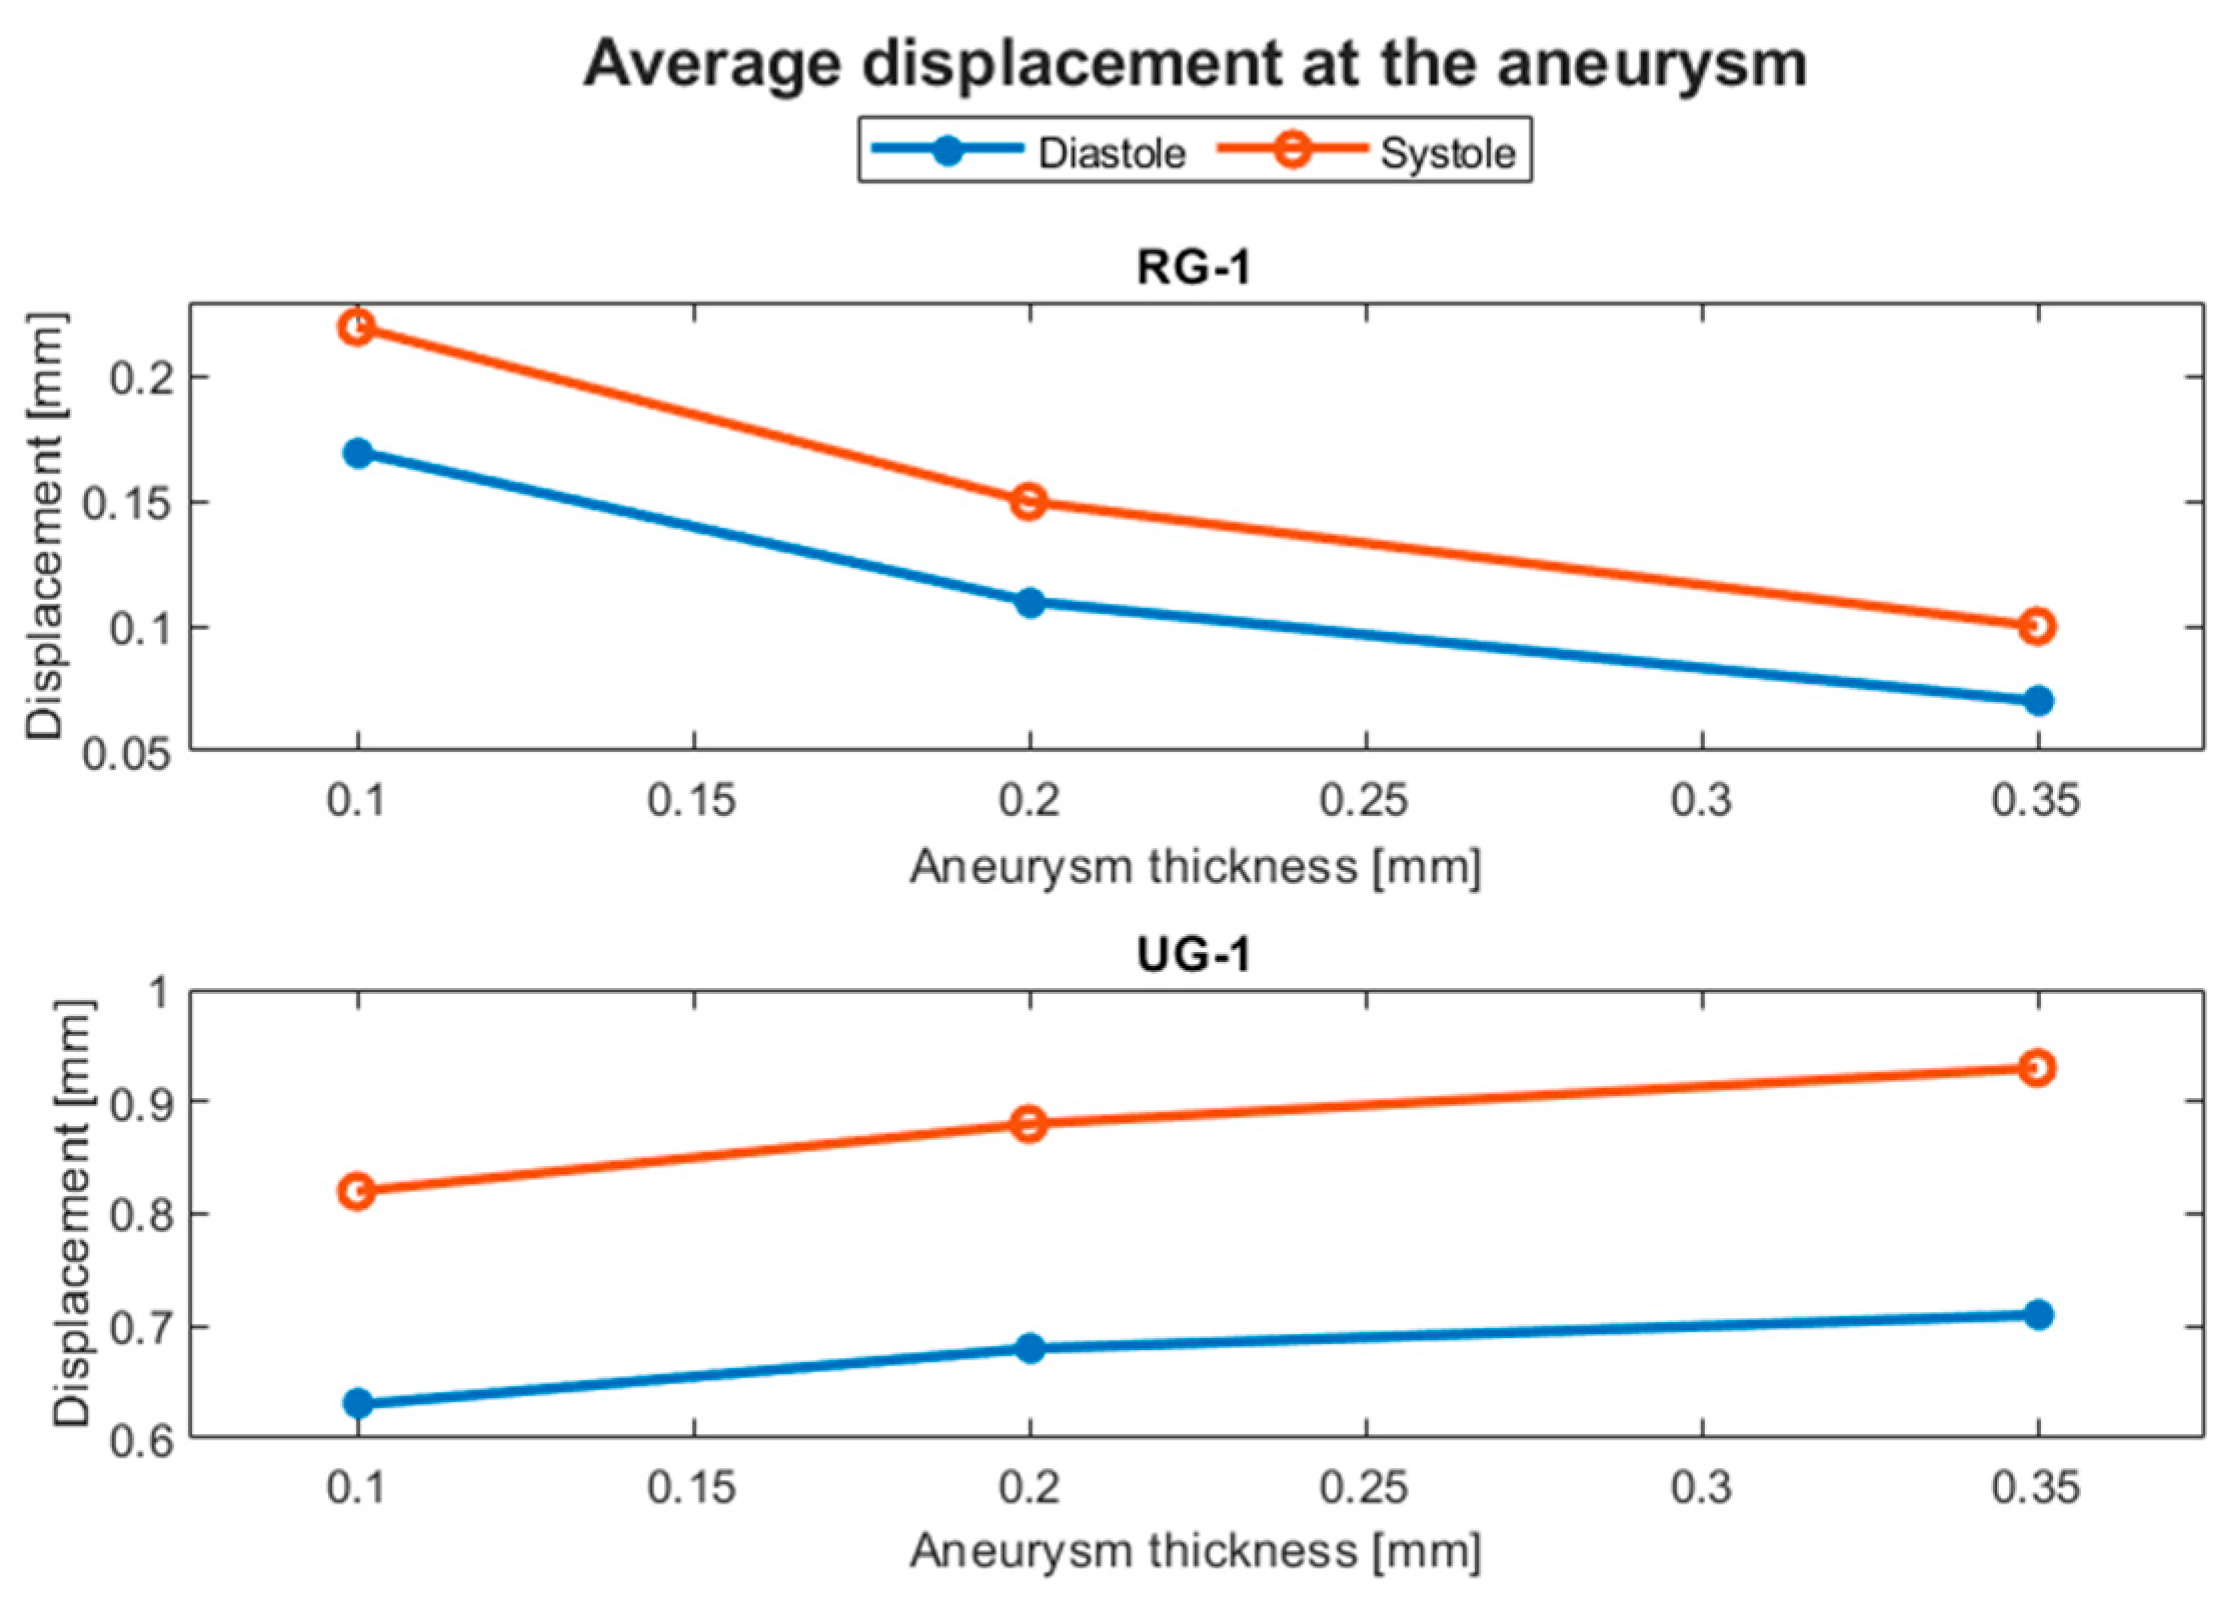
Figure 9.
Evolution of the average Von Mises stress at the aneurysm with respect to the aneurysm wall thickness.
Figure 9.
Evolution of the average Von Mises stress at the aneurysm with respect to the aneurysm wall thickness.
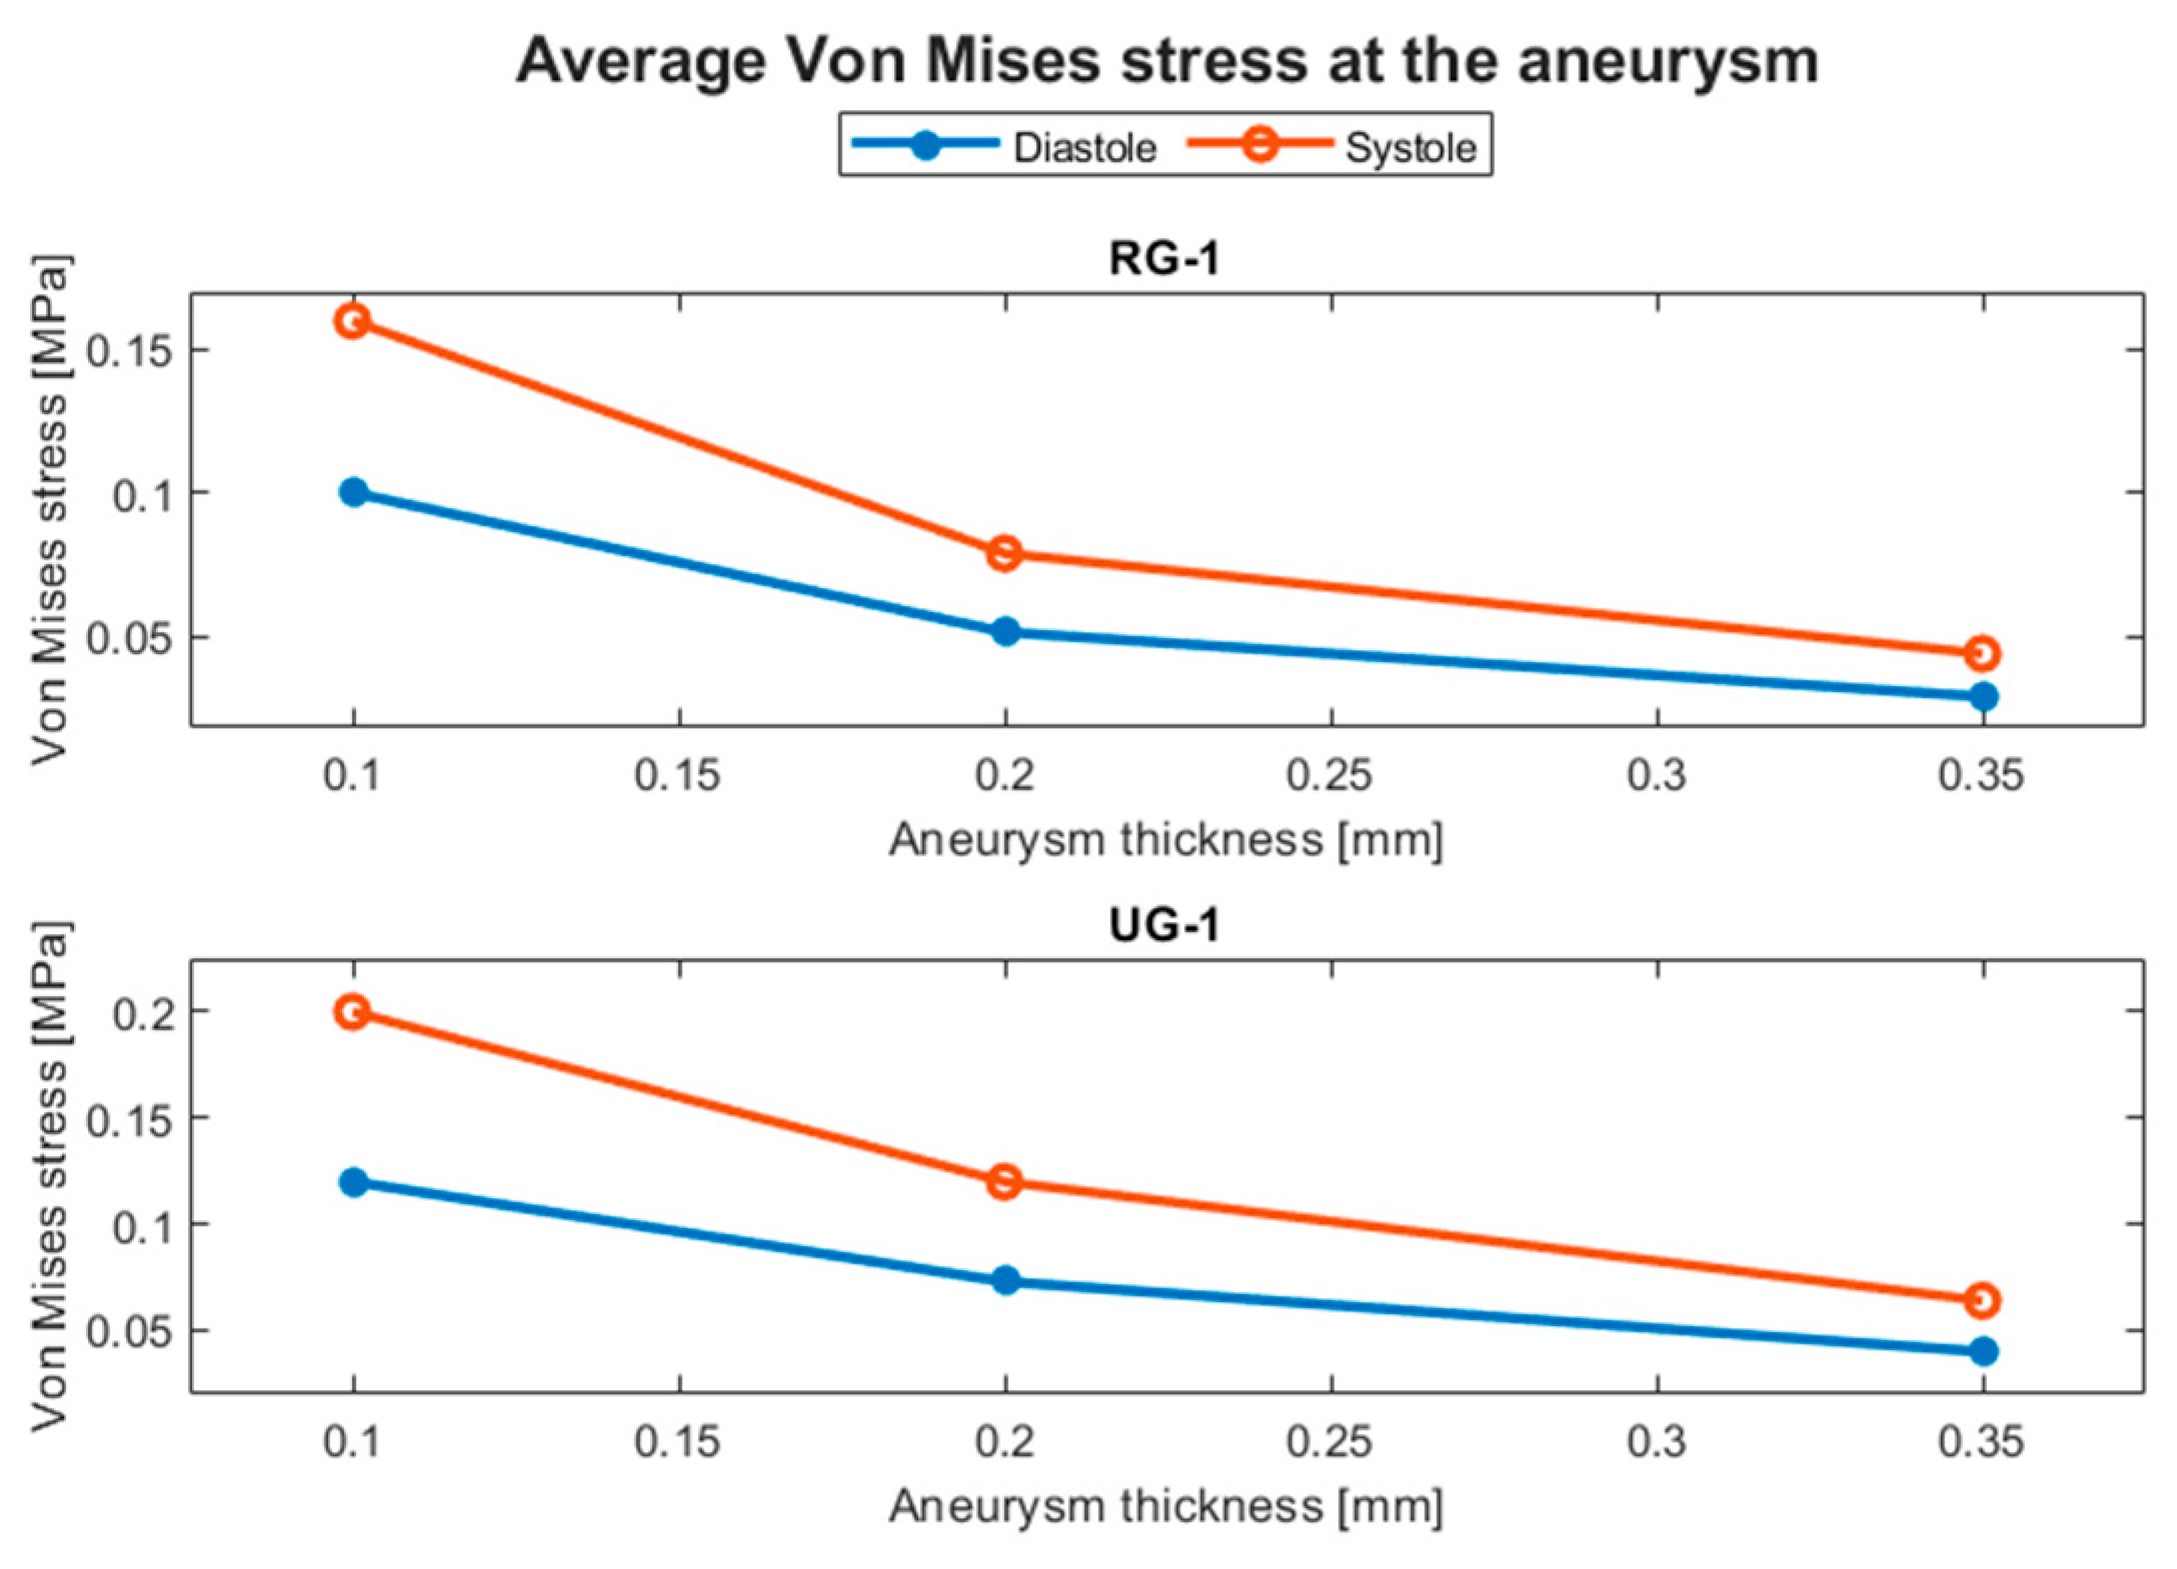
Figure 10.
Displacement contours at systole for RG-1 using a) thick, b) medium, and c) thin aneurysm wall thickness.
Figure 10.
Displacement contours at systole for RG-1 using a) thick, b) medium, and c) thin aneurysm wall thickness.
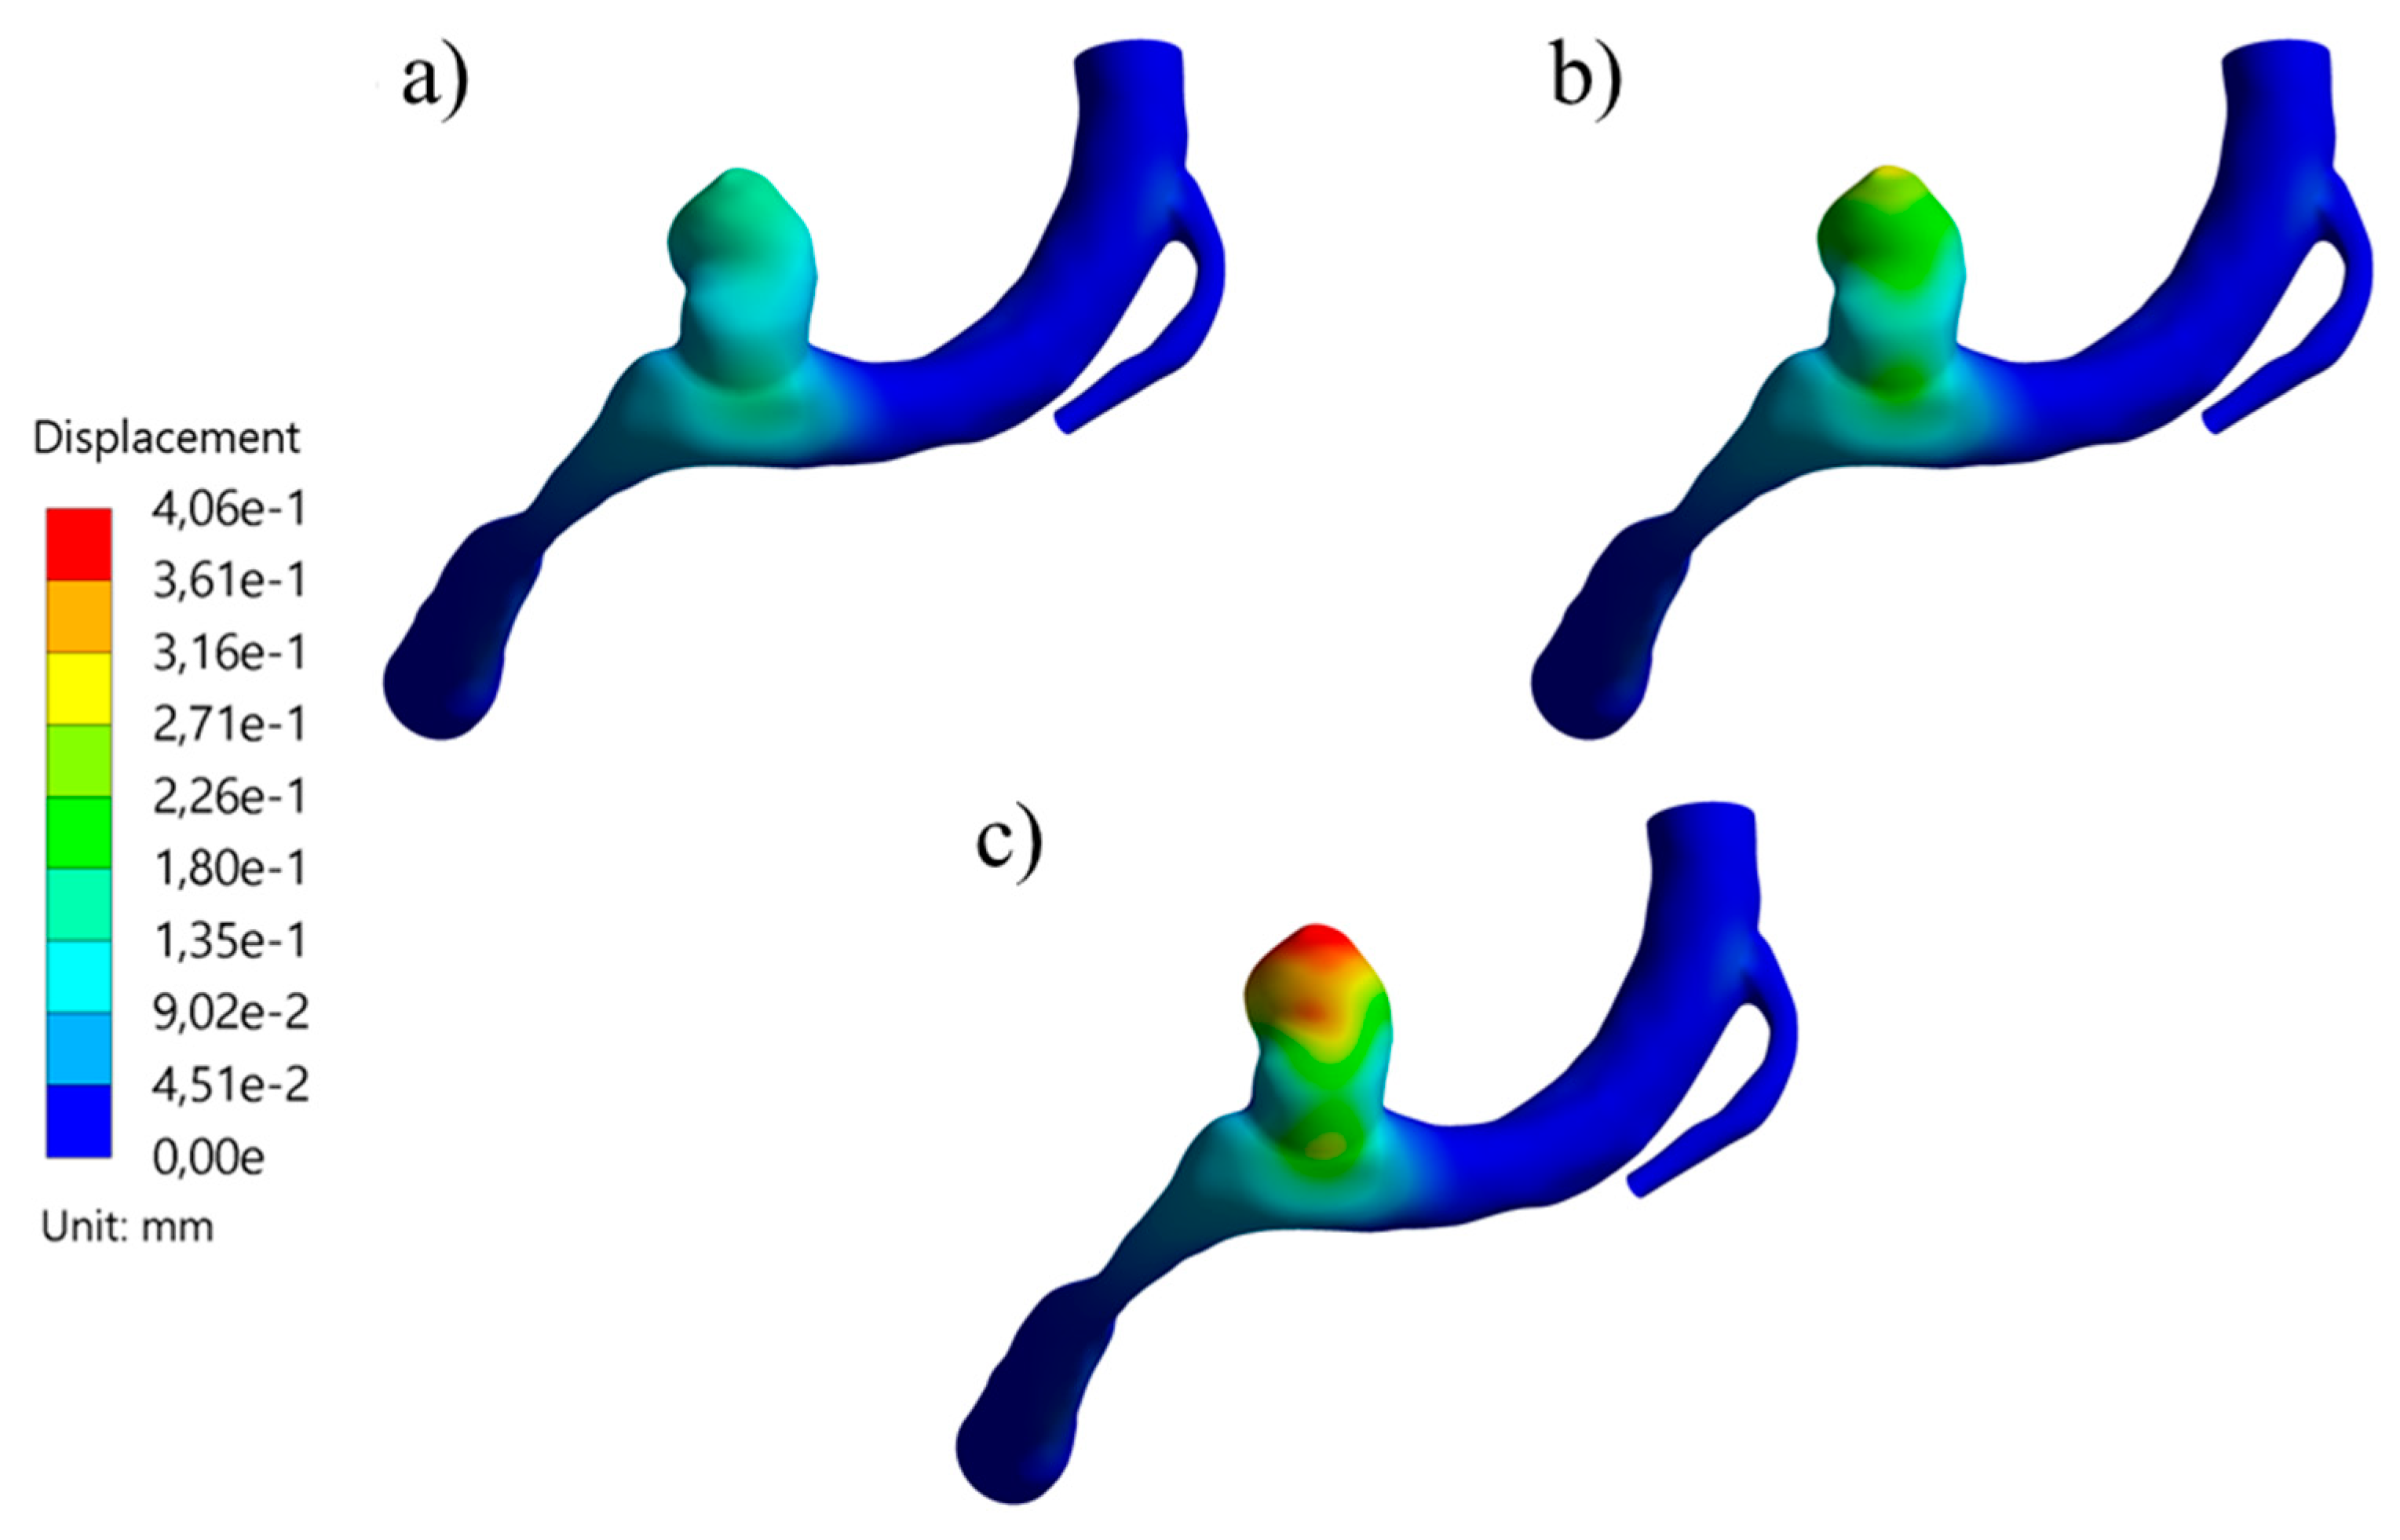
Figure 11.
Displacement contours at systole for UG-1 using a) thick, b) medium, and c) thin aneurysm wall thickness.
Figure 11.
Displacement contours at systole for UG-1 using a) thick, b) medium, and c) thin aneurysm wall thickness.
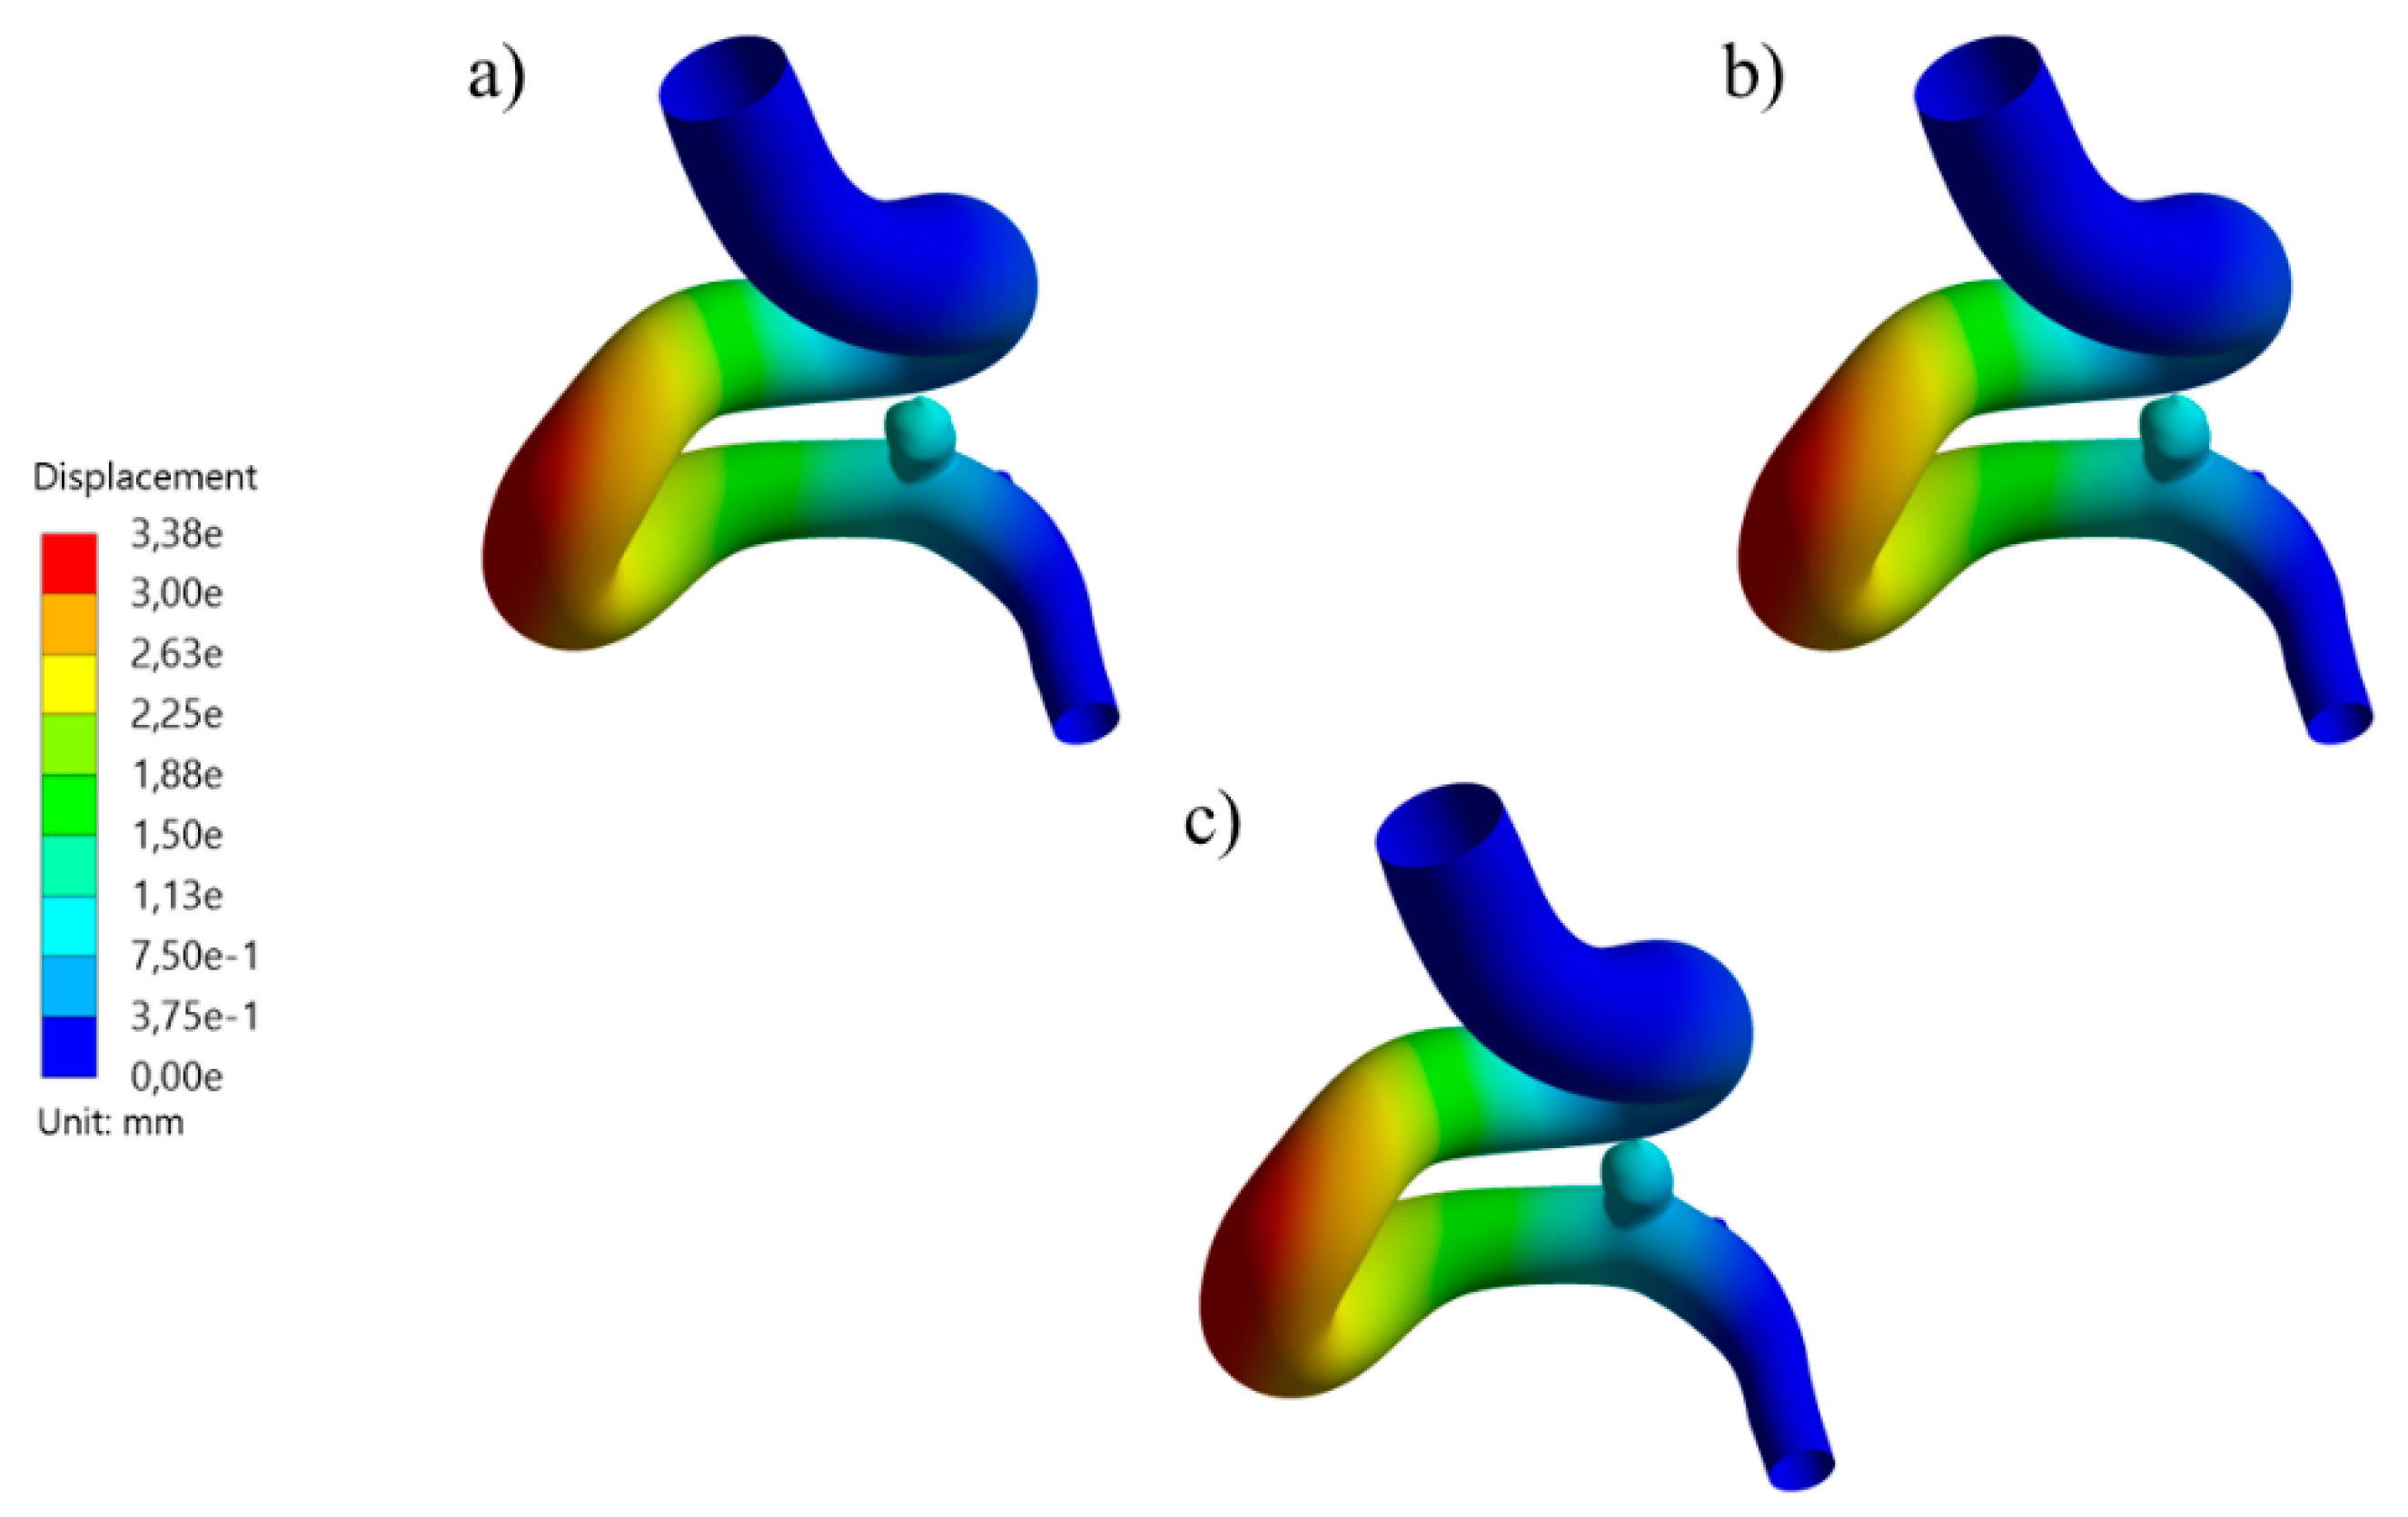
Figure 12.
Temporal evolution of the average WSS at the aneurysm for original aneurysms a) with rupture and b) without rupture, and their size variations.
Figure 12.
Temporal evolution of the average WSS at the aneurysm for original aneurysms a) with rupture and b) without rupture, and their size variations.
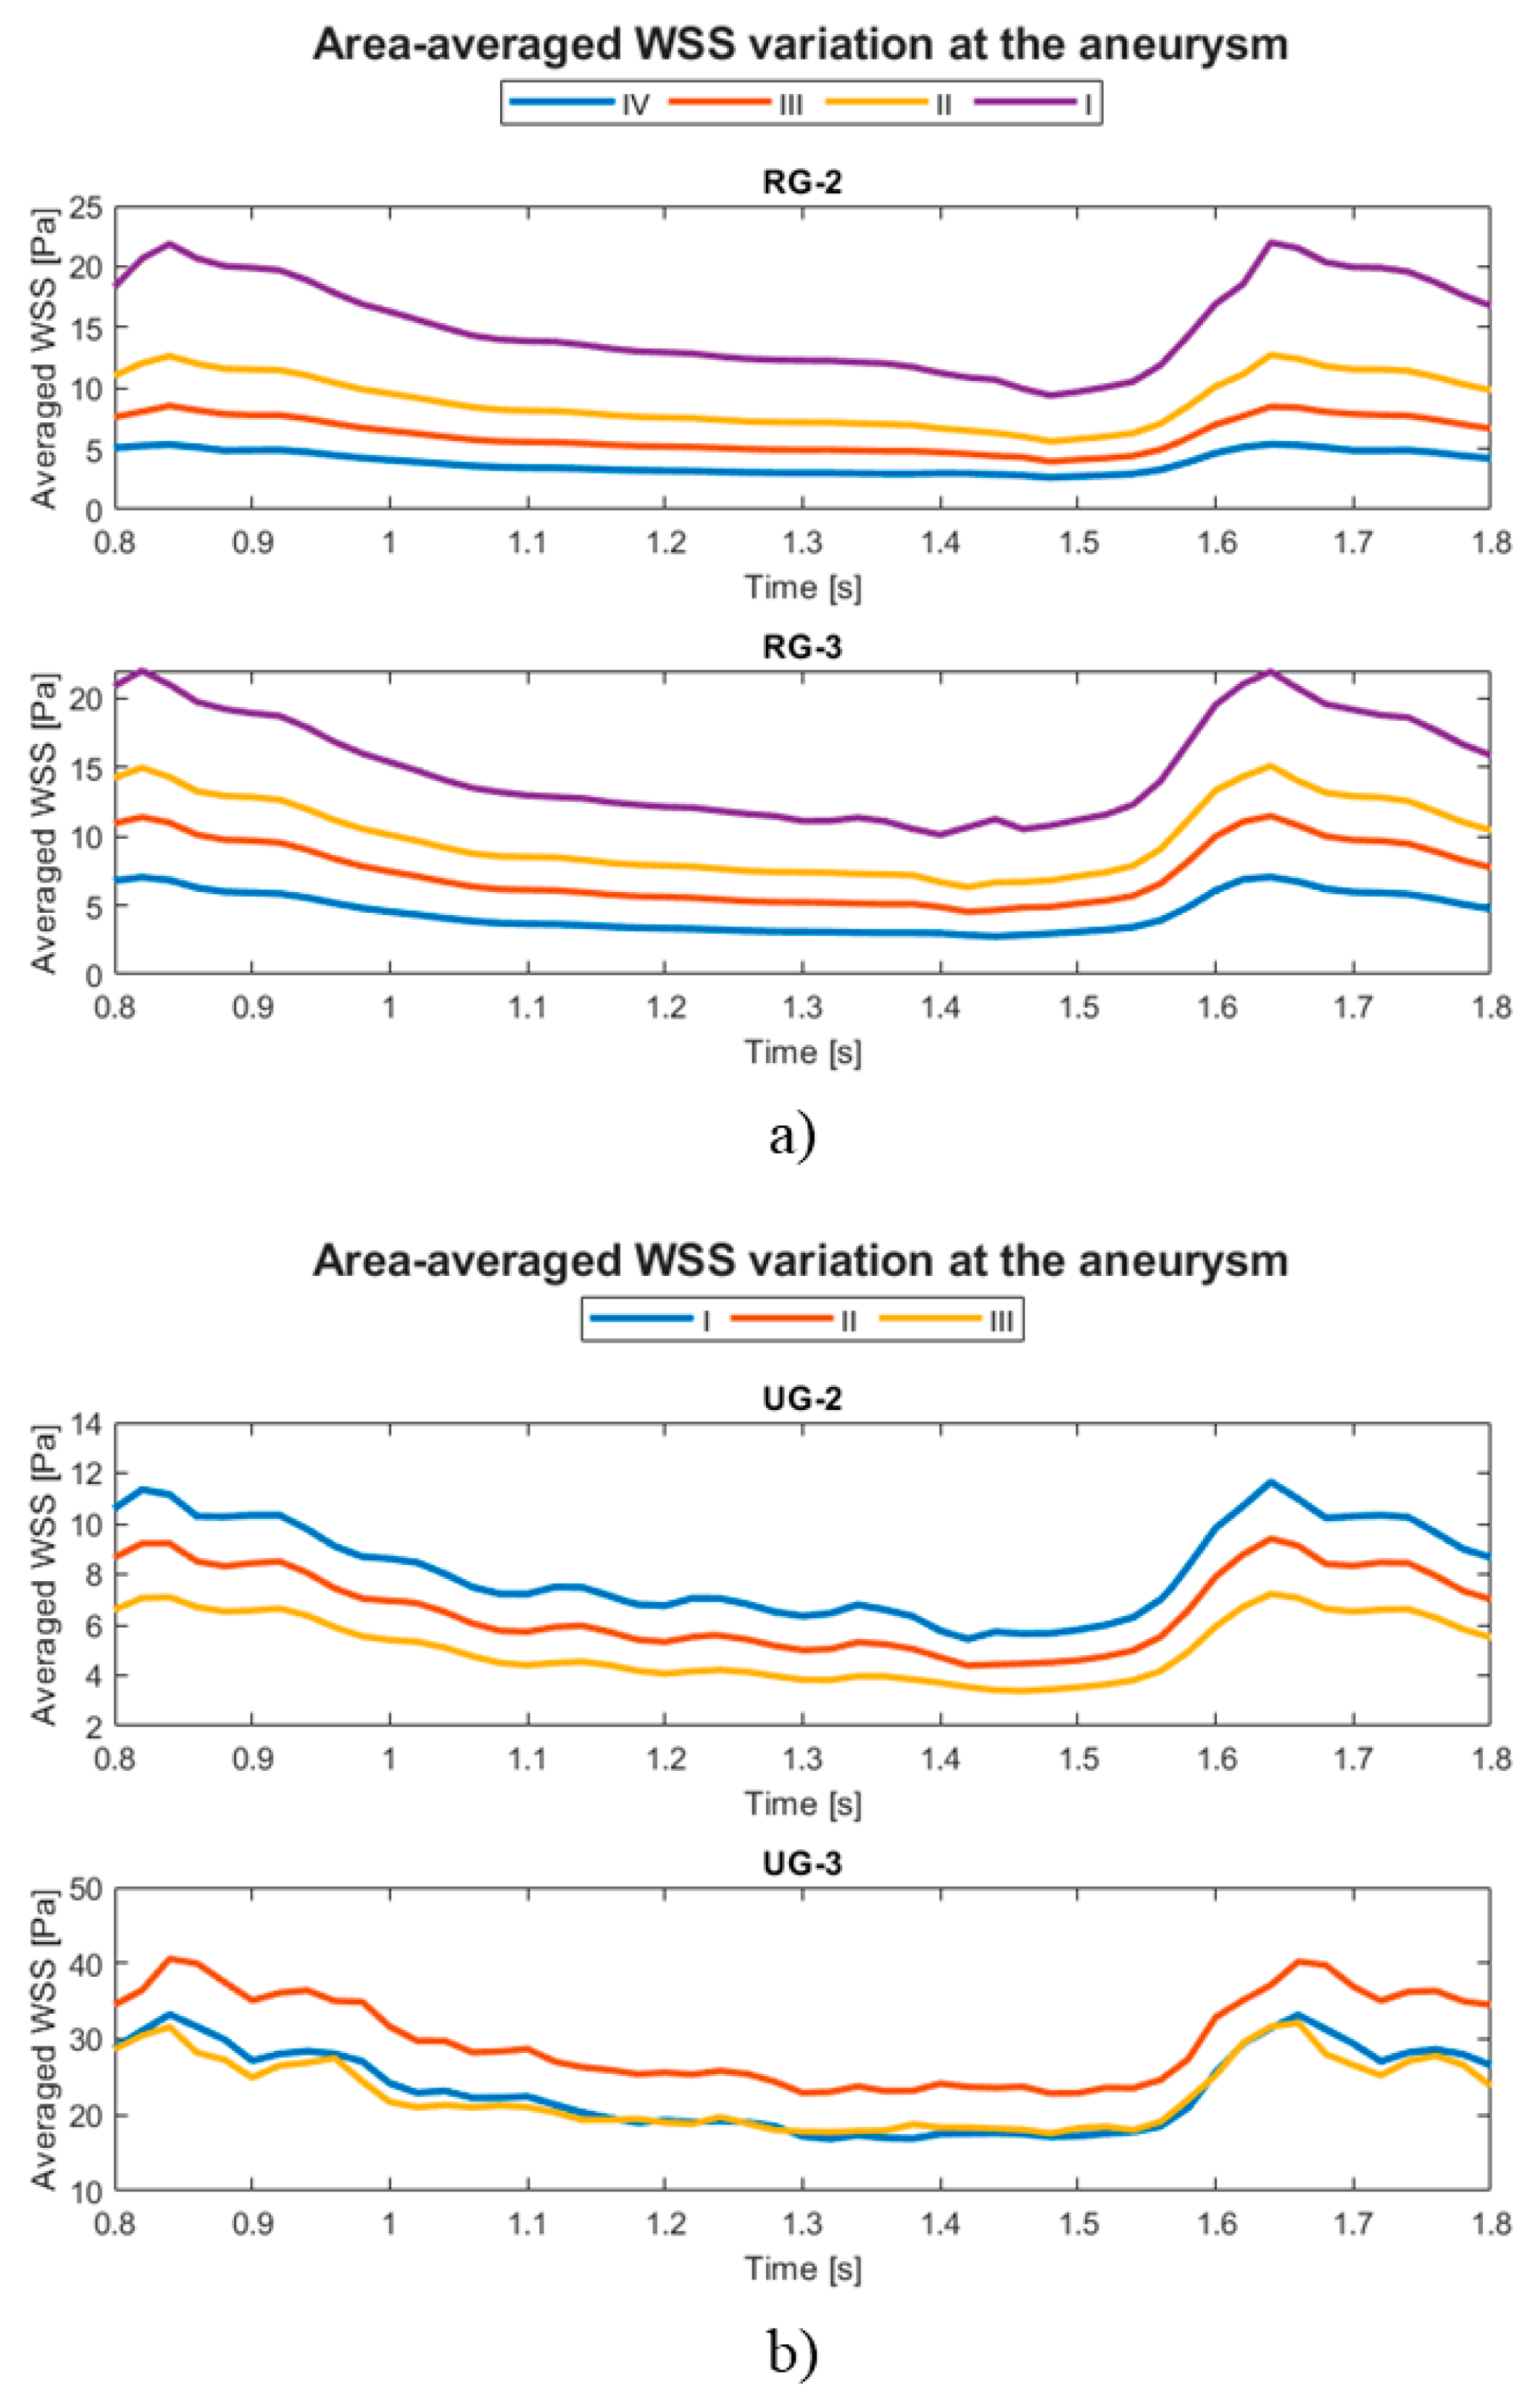
Figure 13.
Evolution of the average WSS at the aneurysm with respect to the AR.
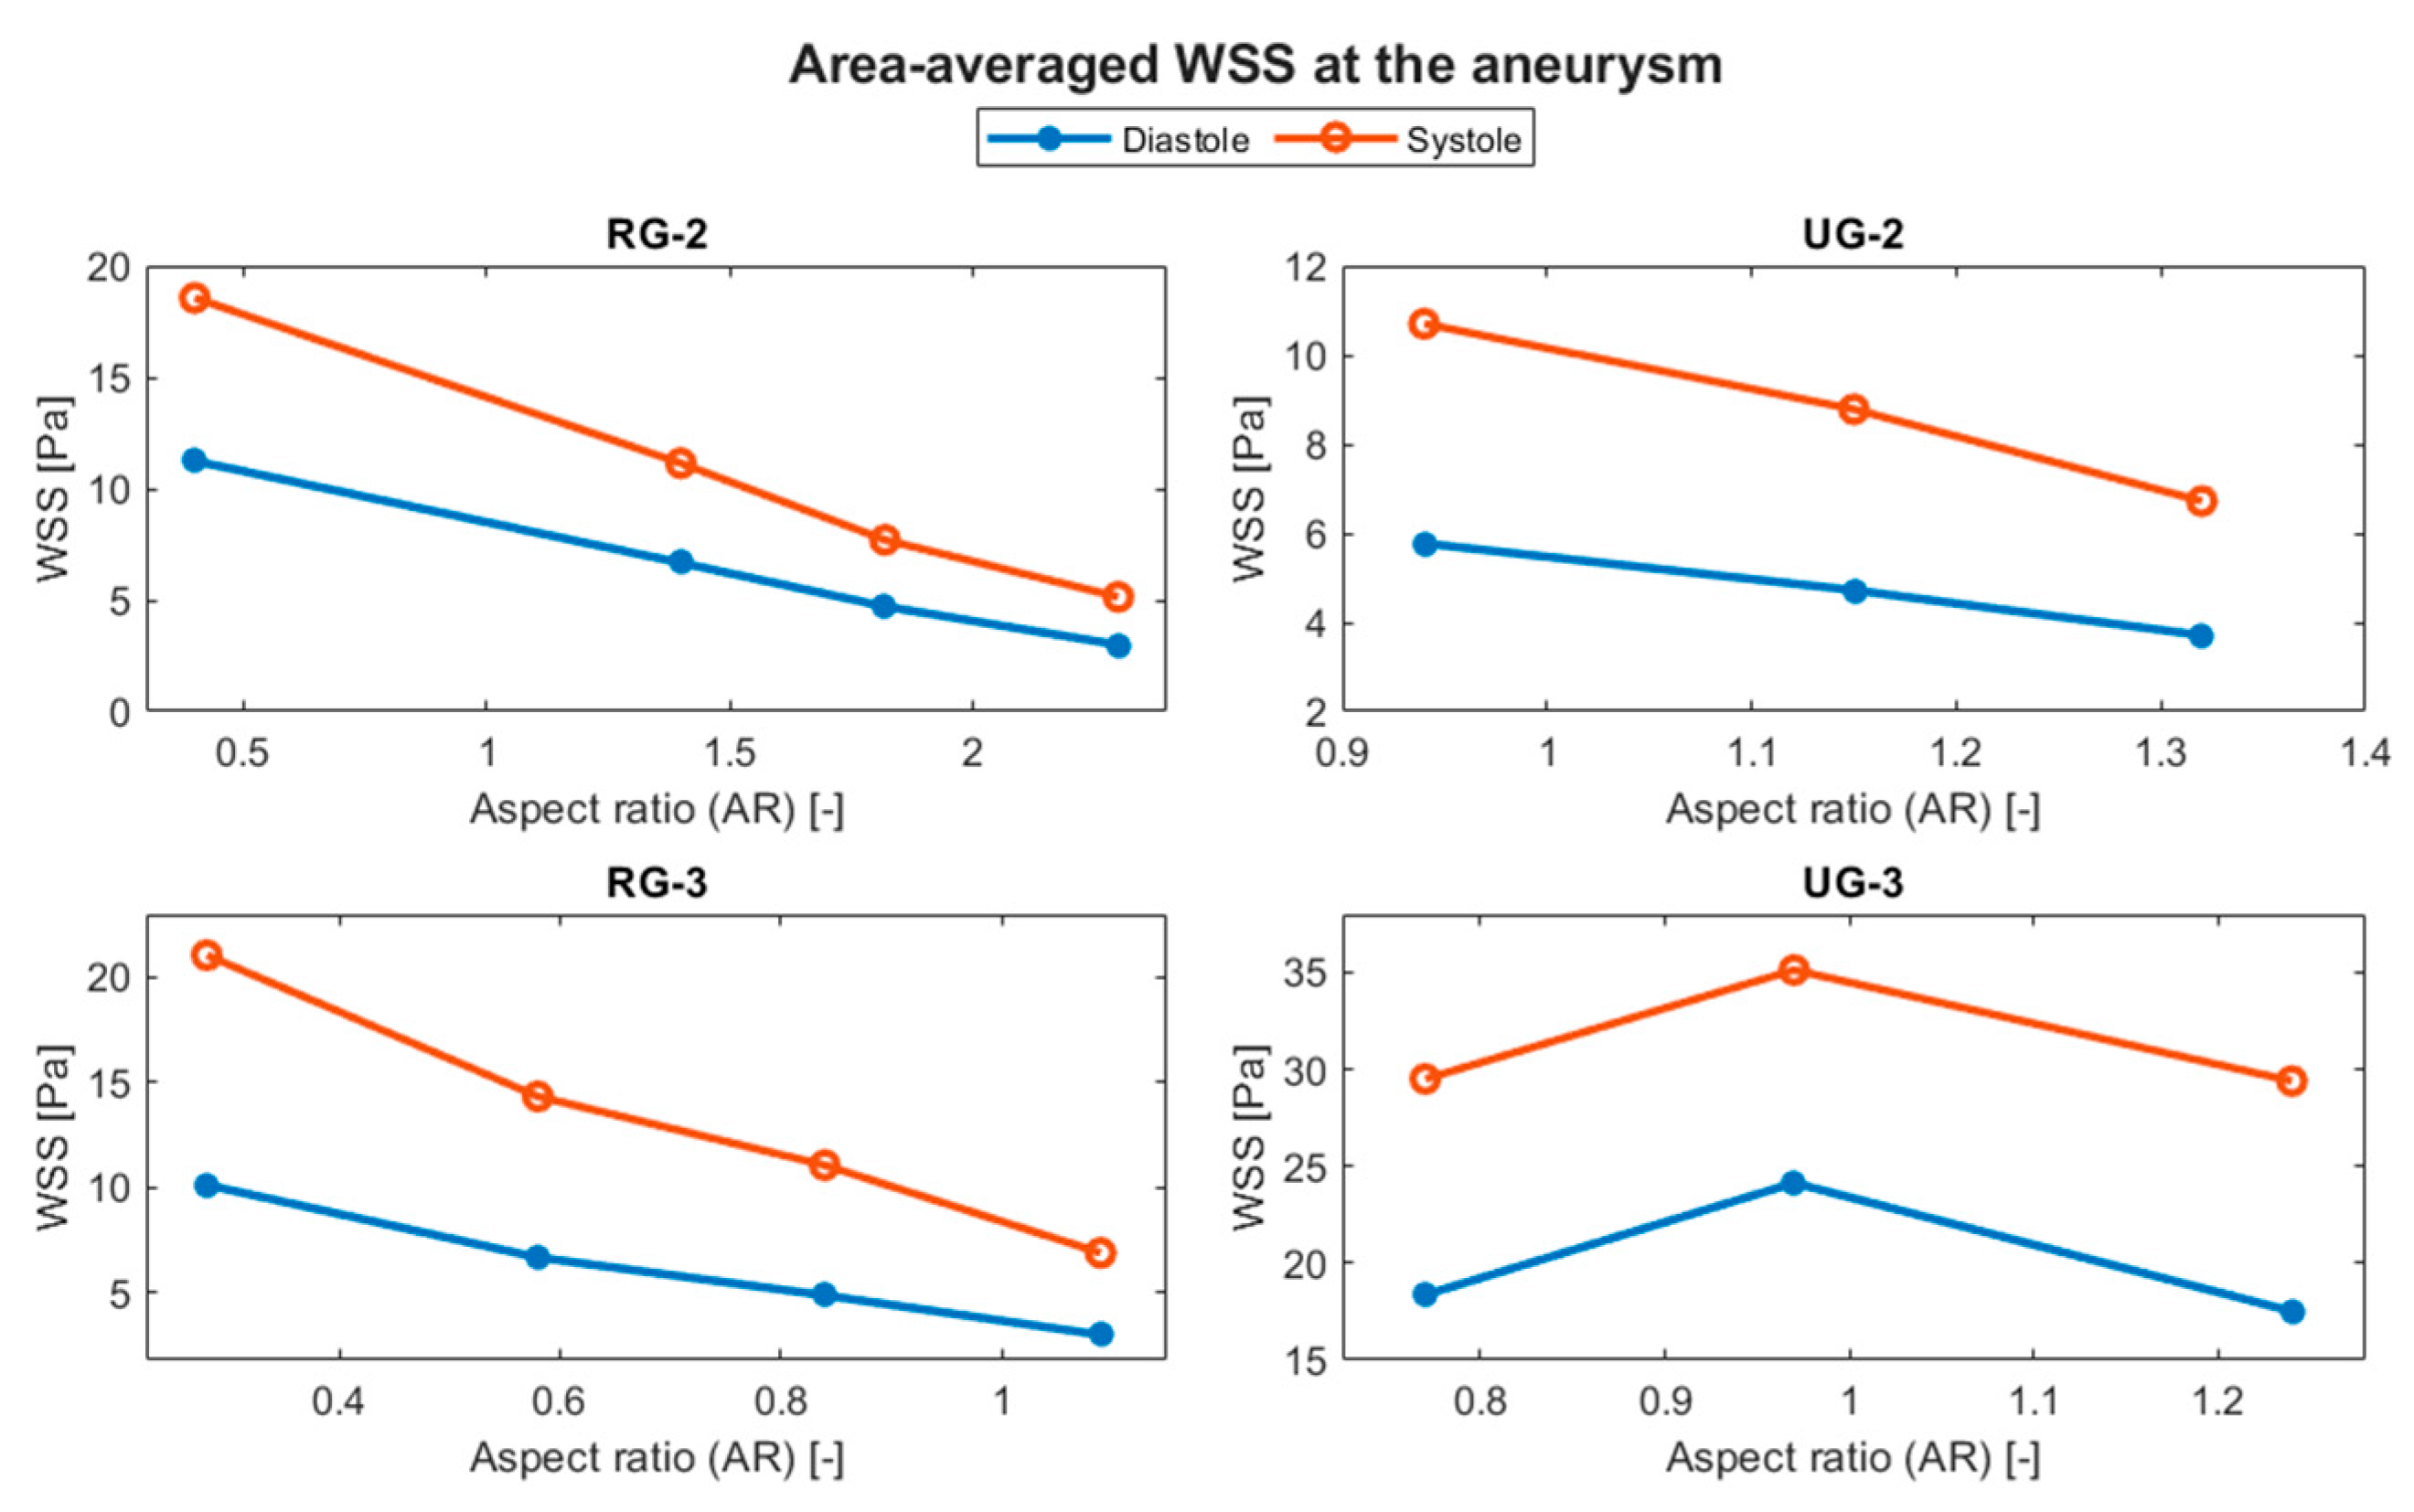
Figure 14.
Evolution of the average displacement at the aneurysm with respect to the AR.
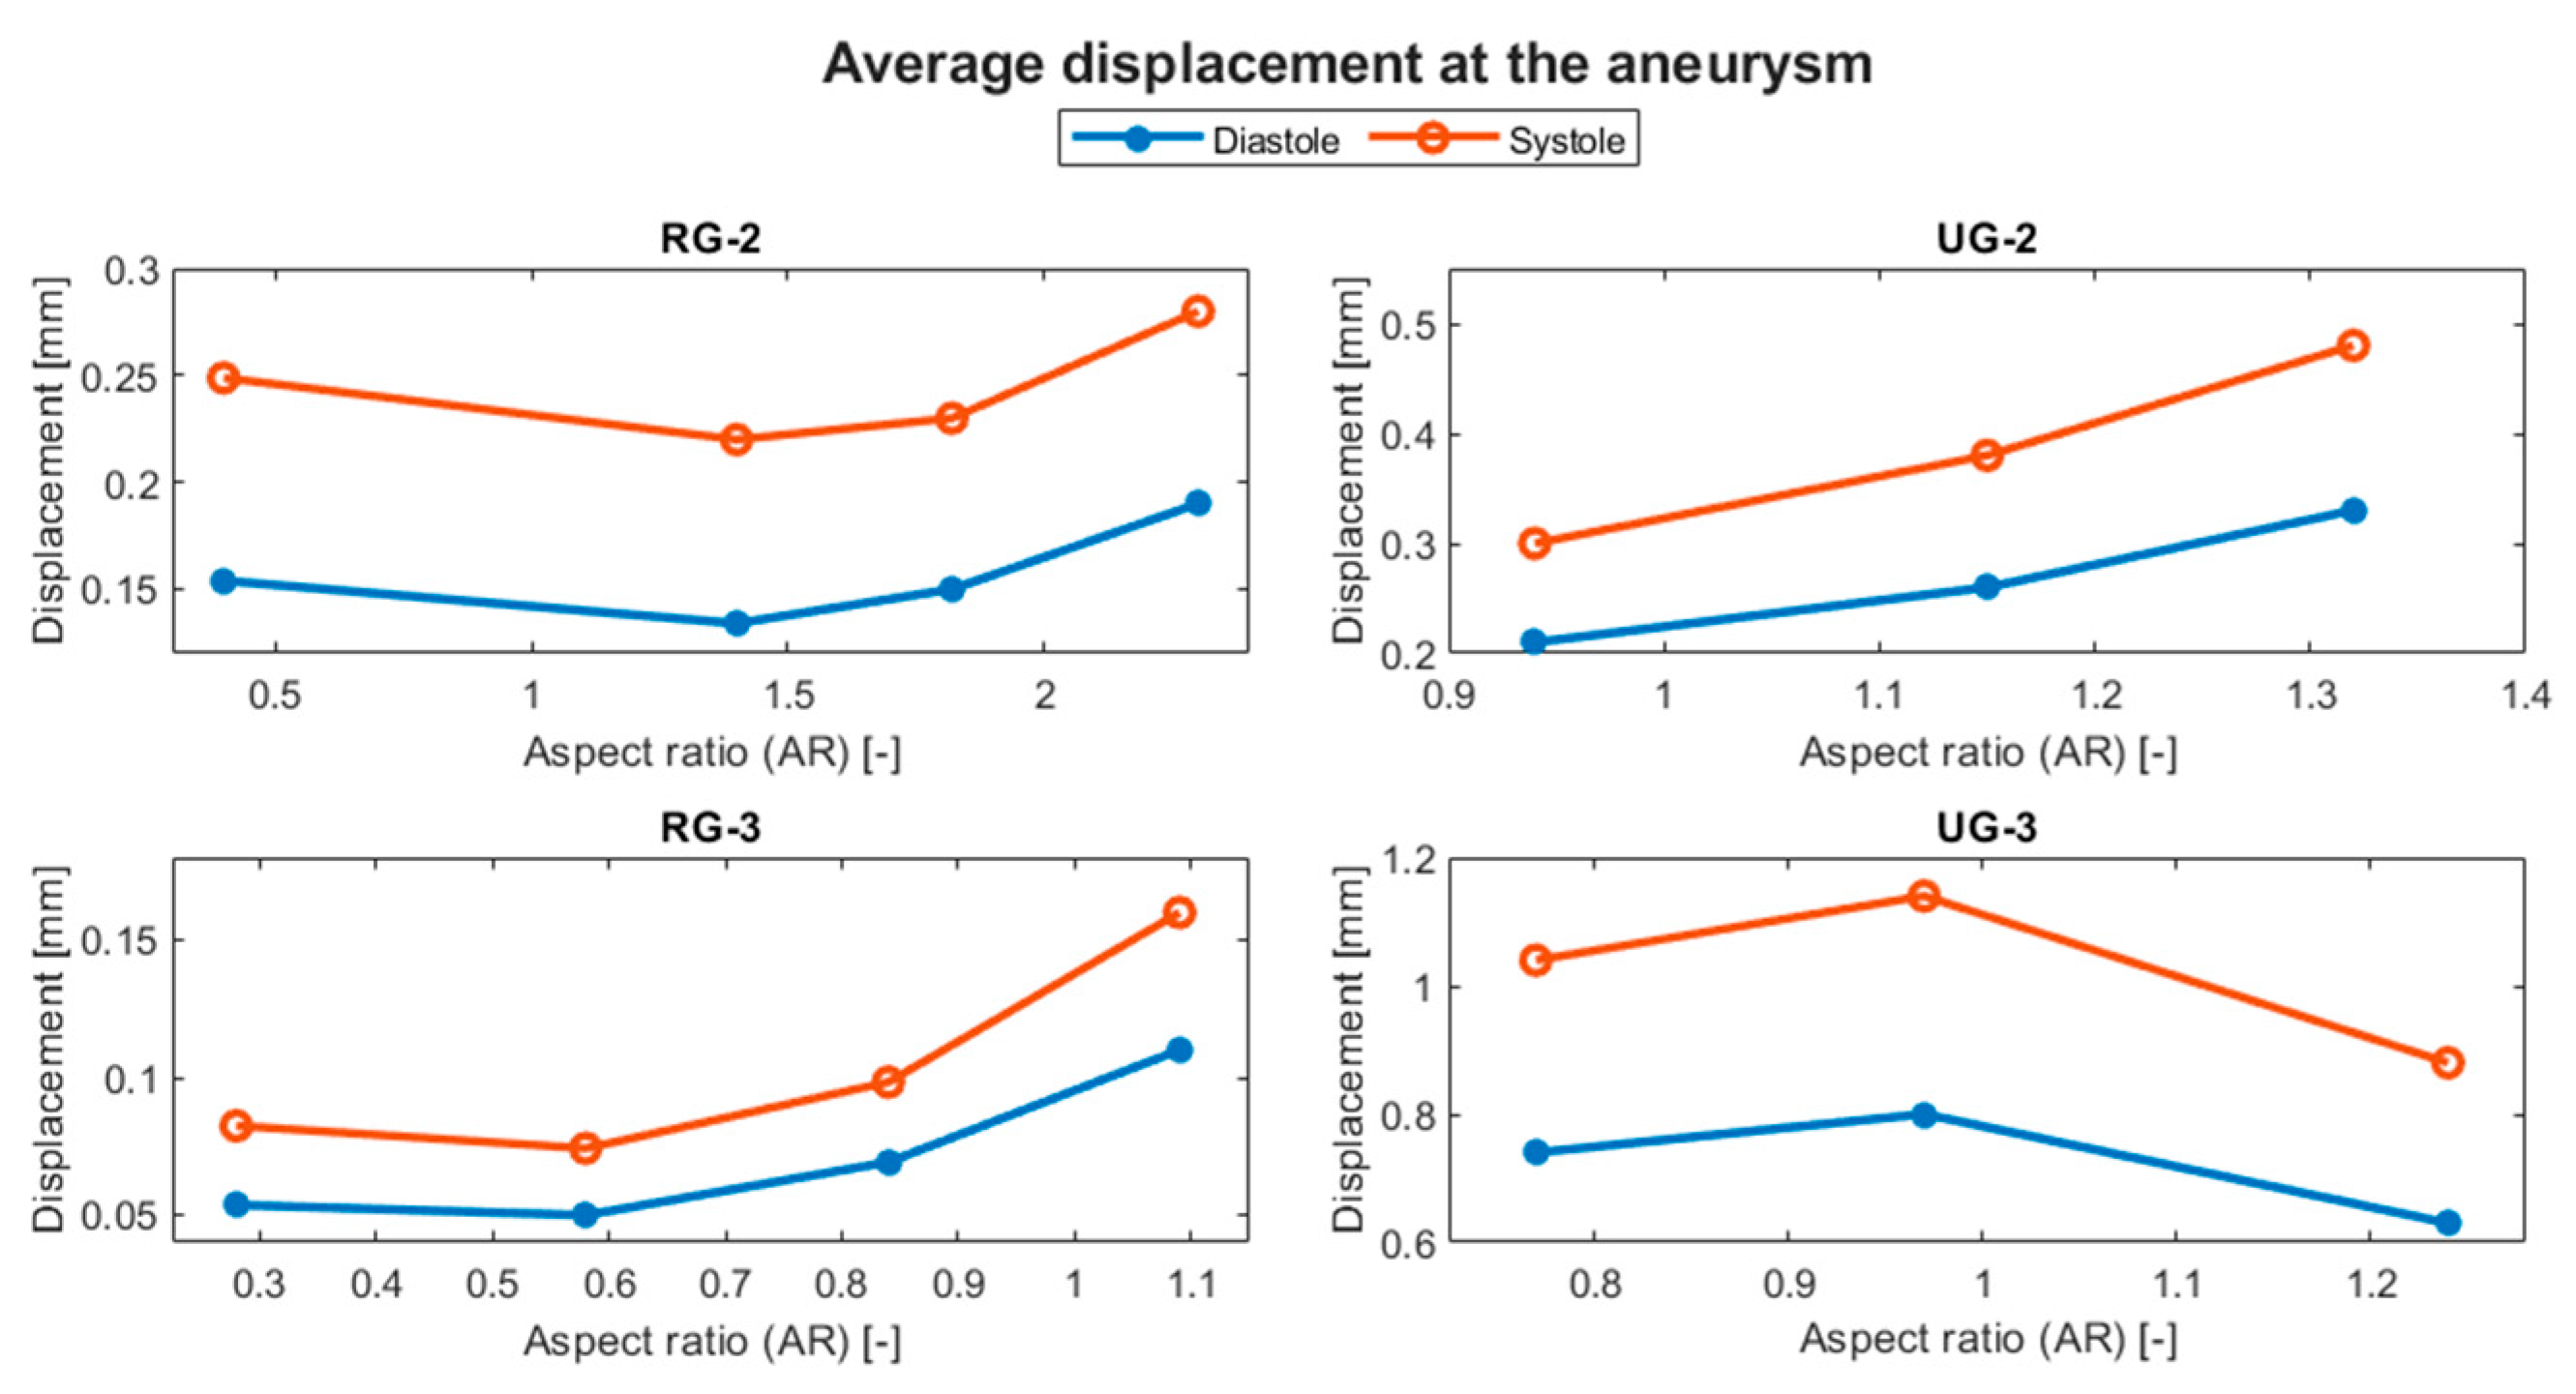
Figure 15.
Evolution of the average Von Mises stress at the aneurysm with respect to the AR.
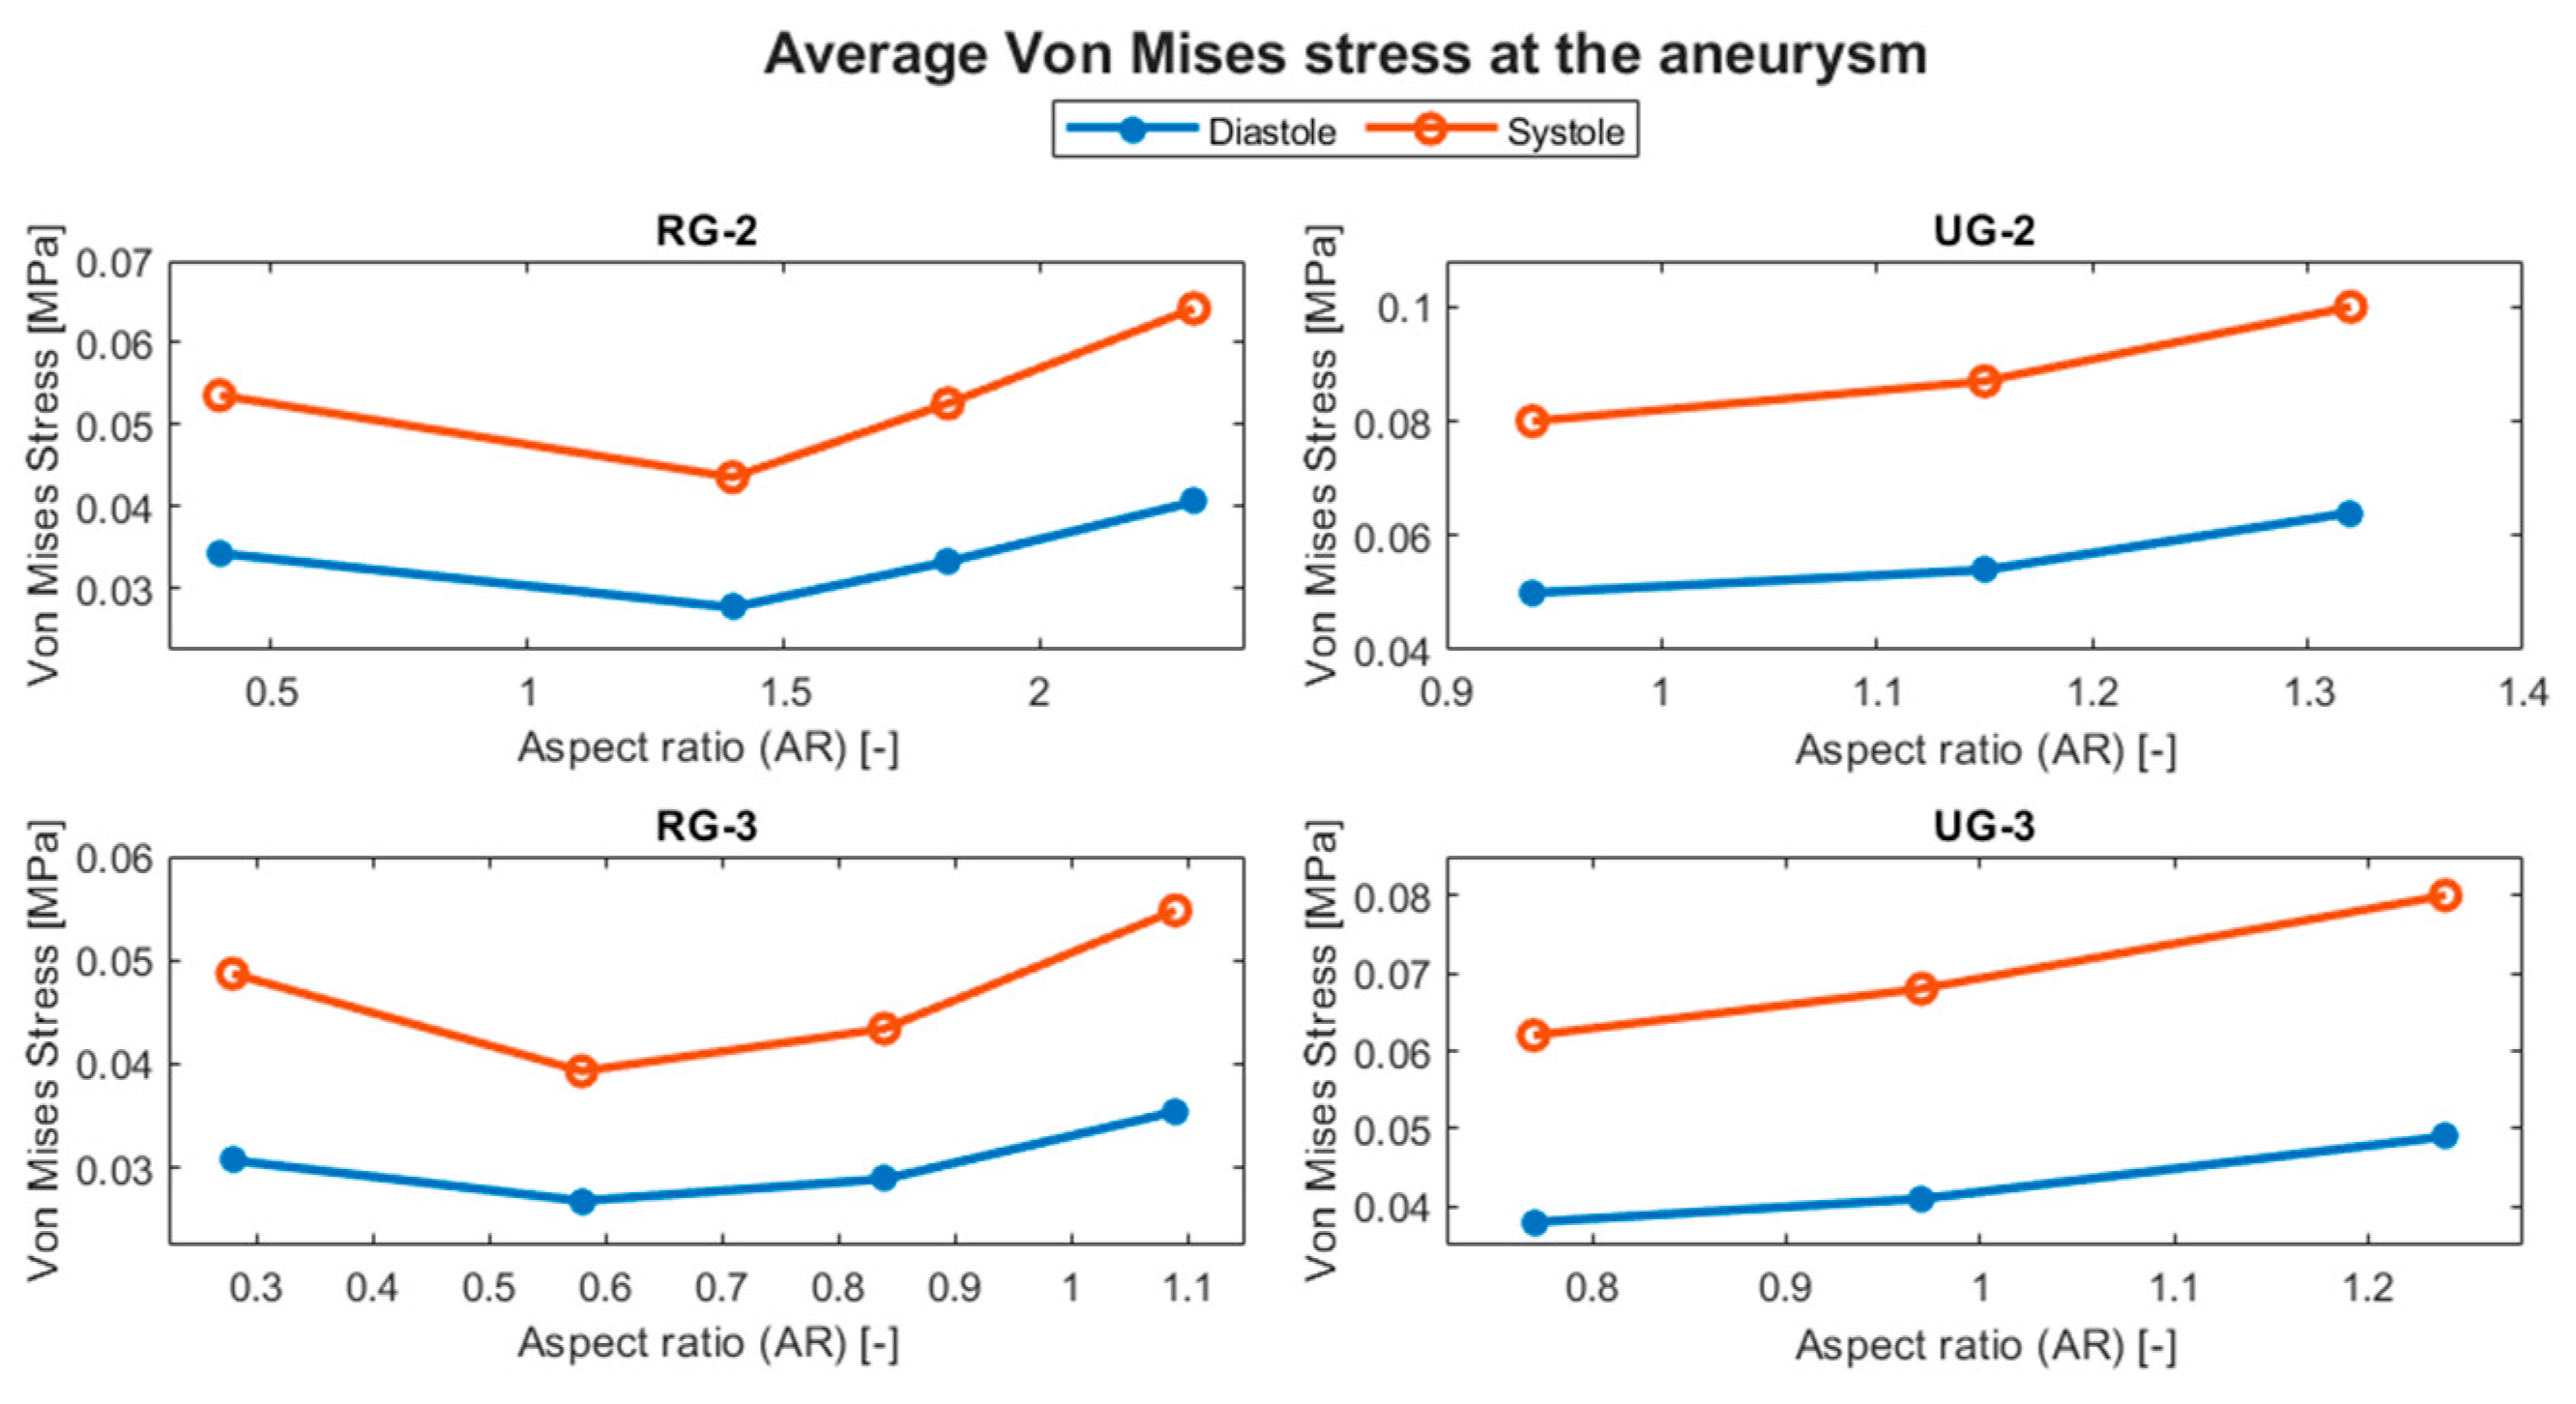
Figure 16.
Von Mises stress distribution contours during systole for RG-3 geometry and its a) IV, b) III, c) II, and d) I sizes.
Figure 16.
Von Mises stress distribution contours during systole for RG-3 geometry and its a) IV, b) III, c) II, and d) I sizes.
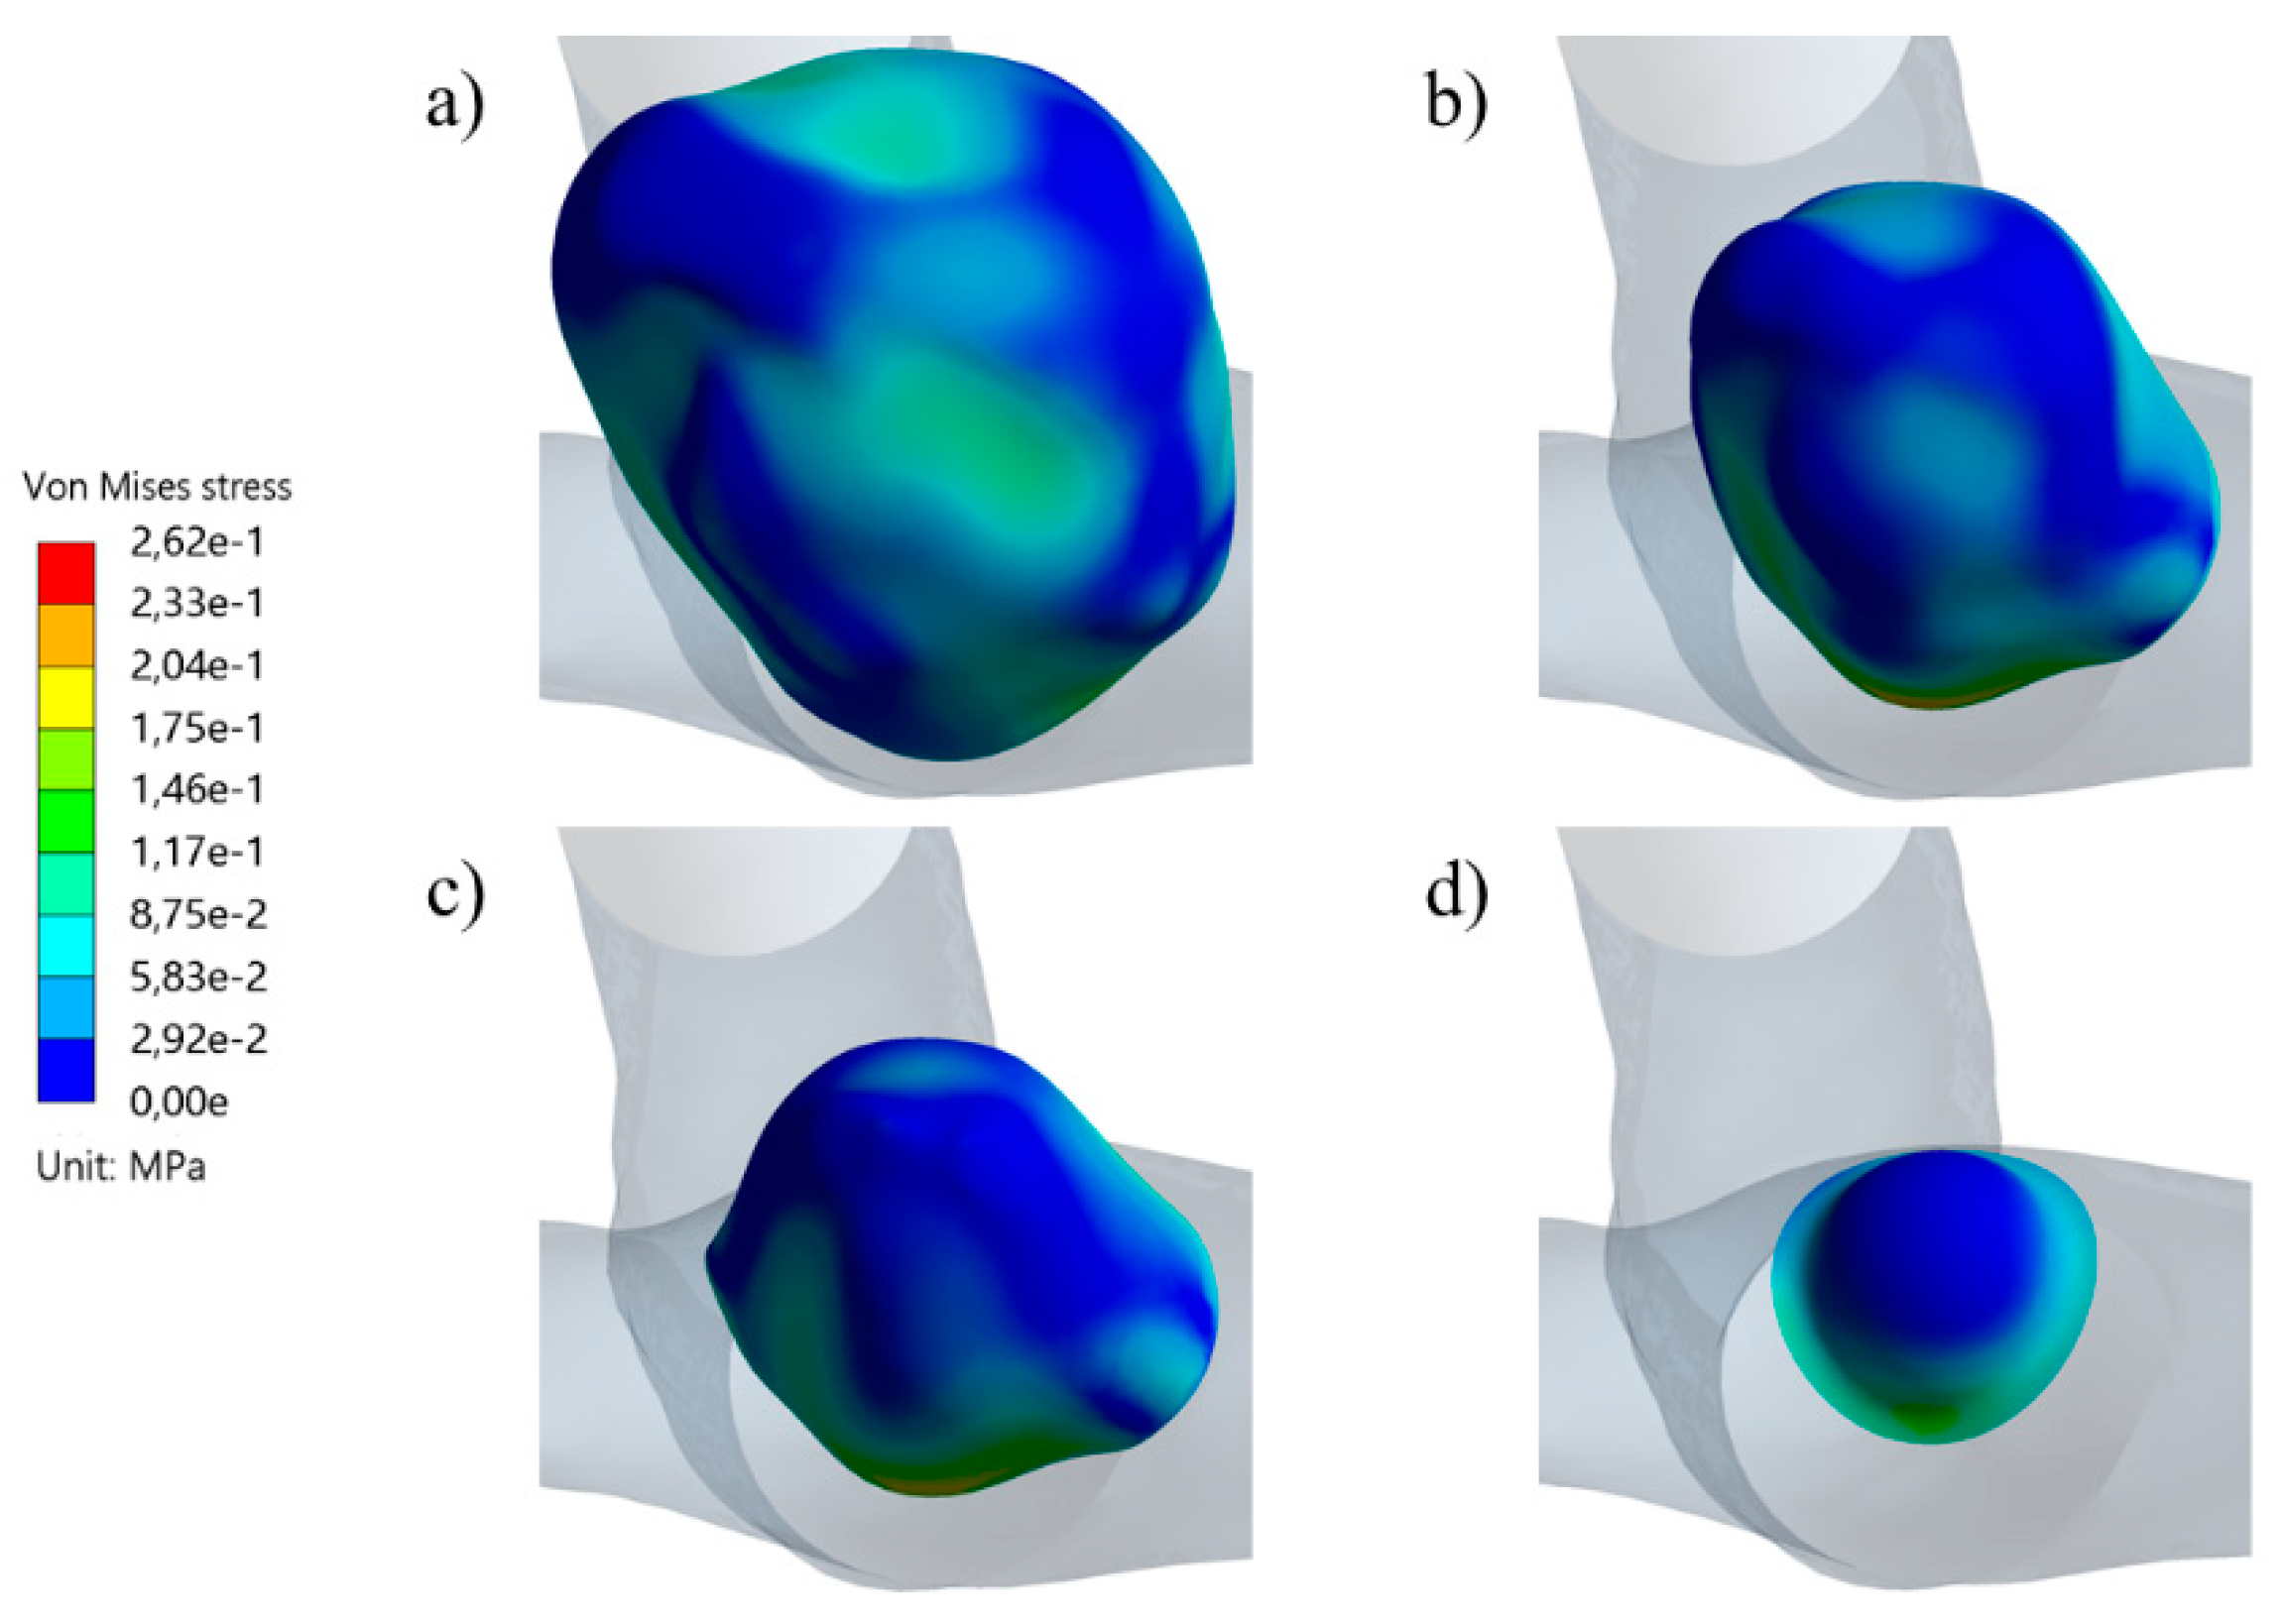
Figure 17.
Von Mises stress distribution contours during systole for UG-3 geometry and its a) III, b) II, and c) I sizes.
Figure 17.
Von Mises stress distribution contours during systole for UG-3 geometry and its a) III, b) II, and c) I sizes.
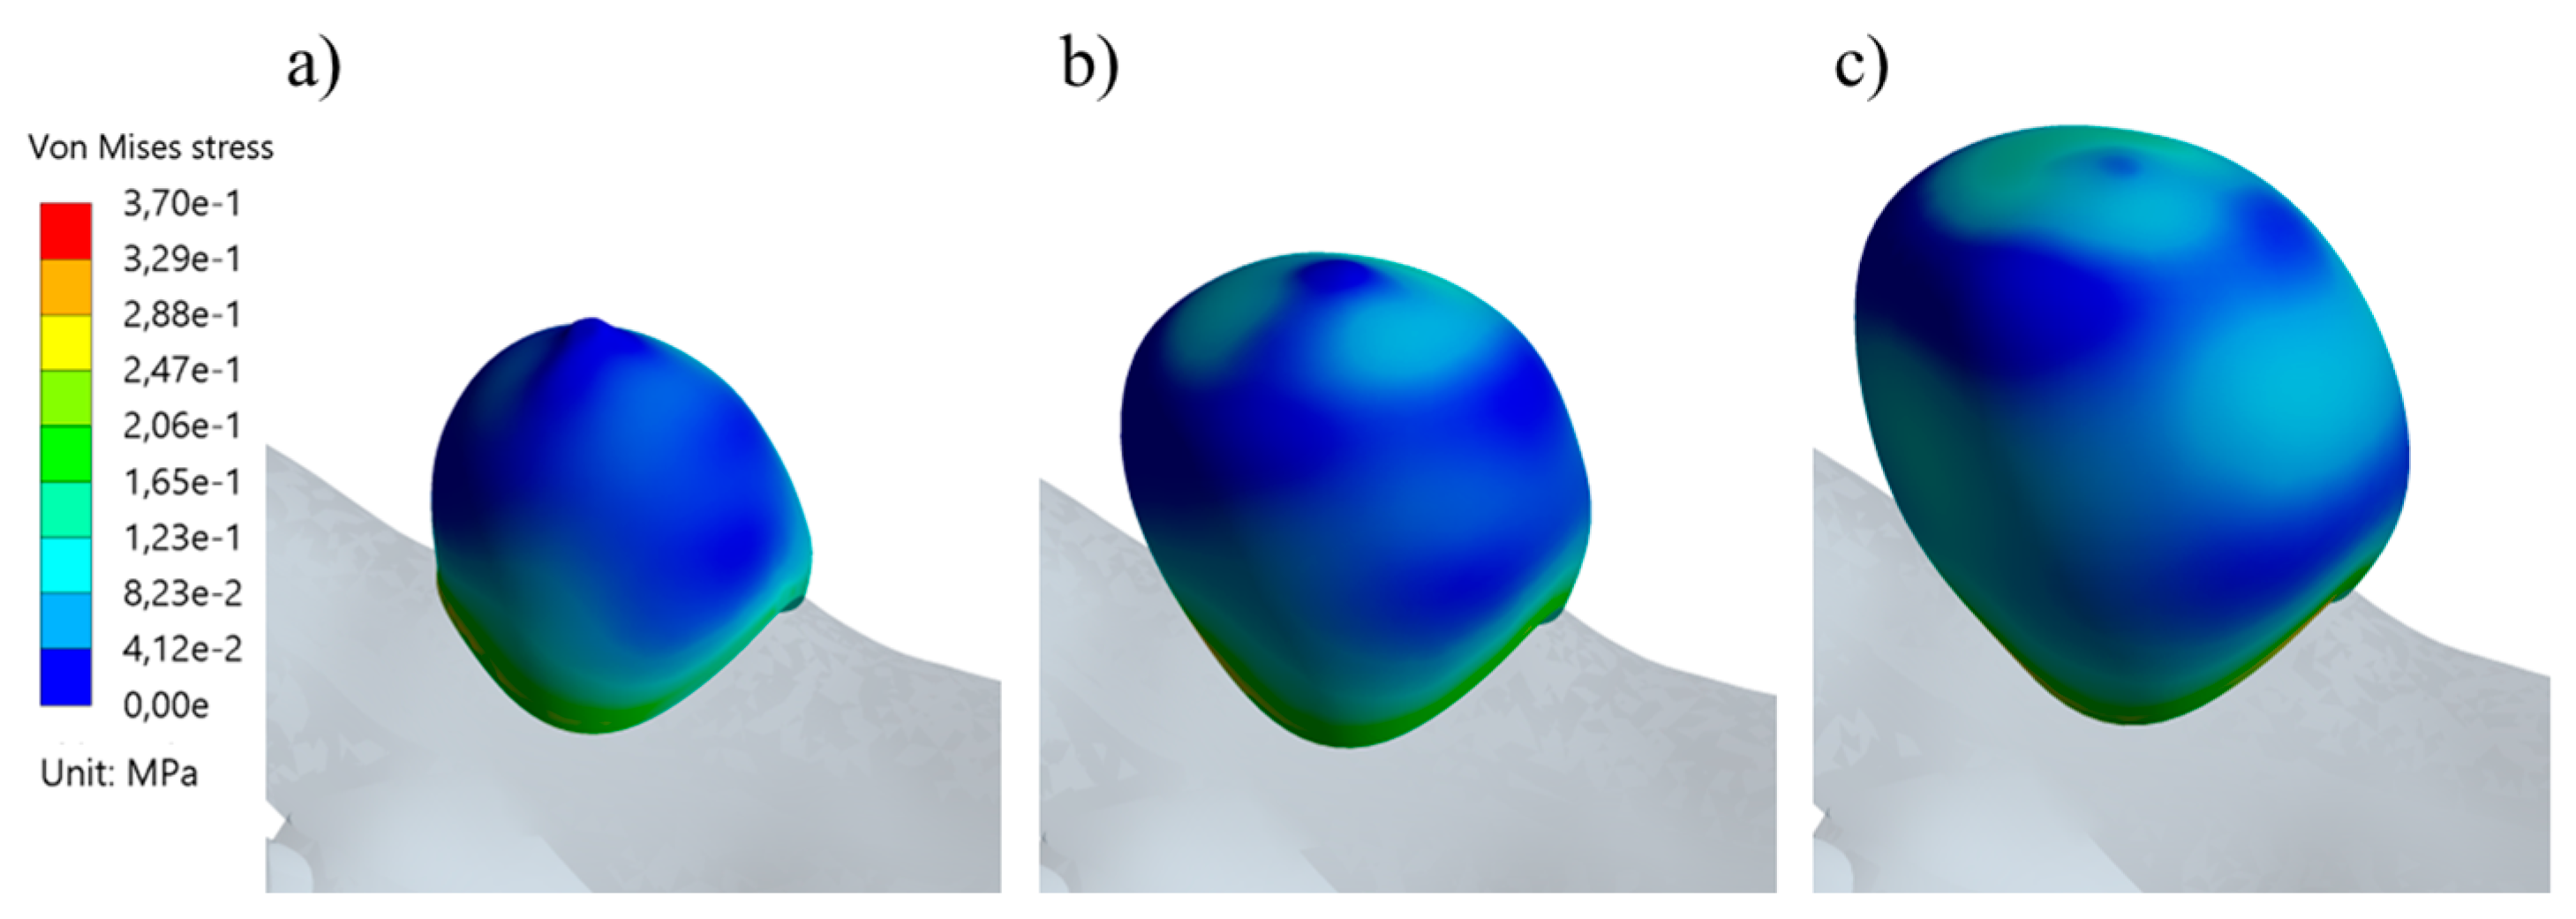
Figure 18.
TAWSS distribution contours for geometries with the removed aneurysm. In a) RG-1, b) UG-1, c) RG-2, and d) UG-2.
Figure 18.
TAWSS distribution contours for geometries with the removed aneurysm. In a) RG-1, b) UG-1, c) RG-2, and d) UG-2.
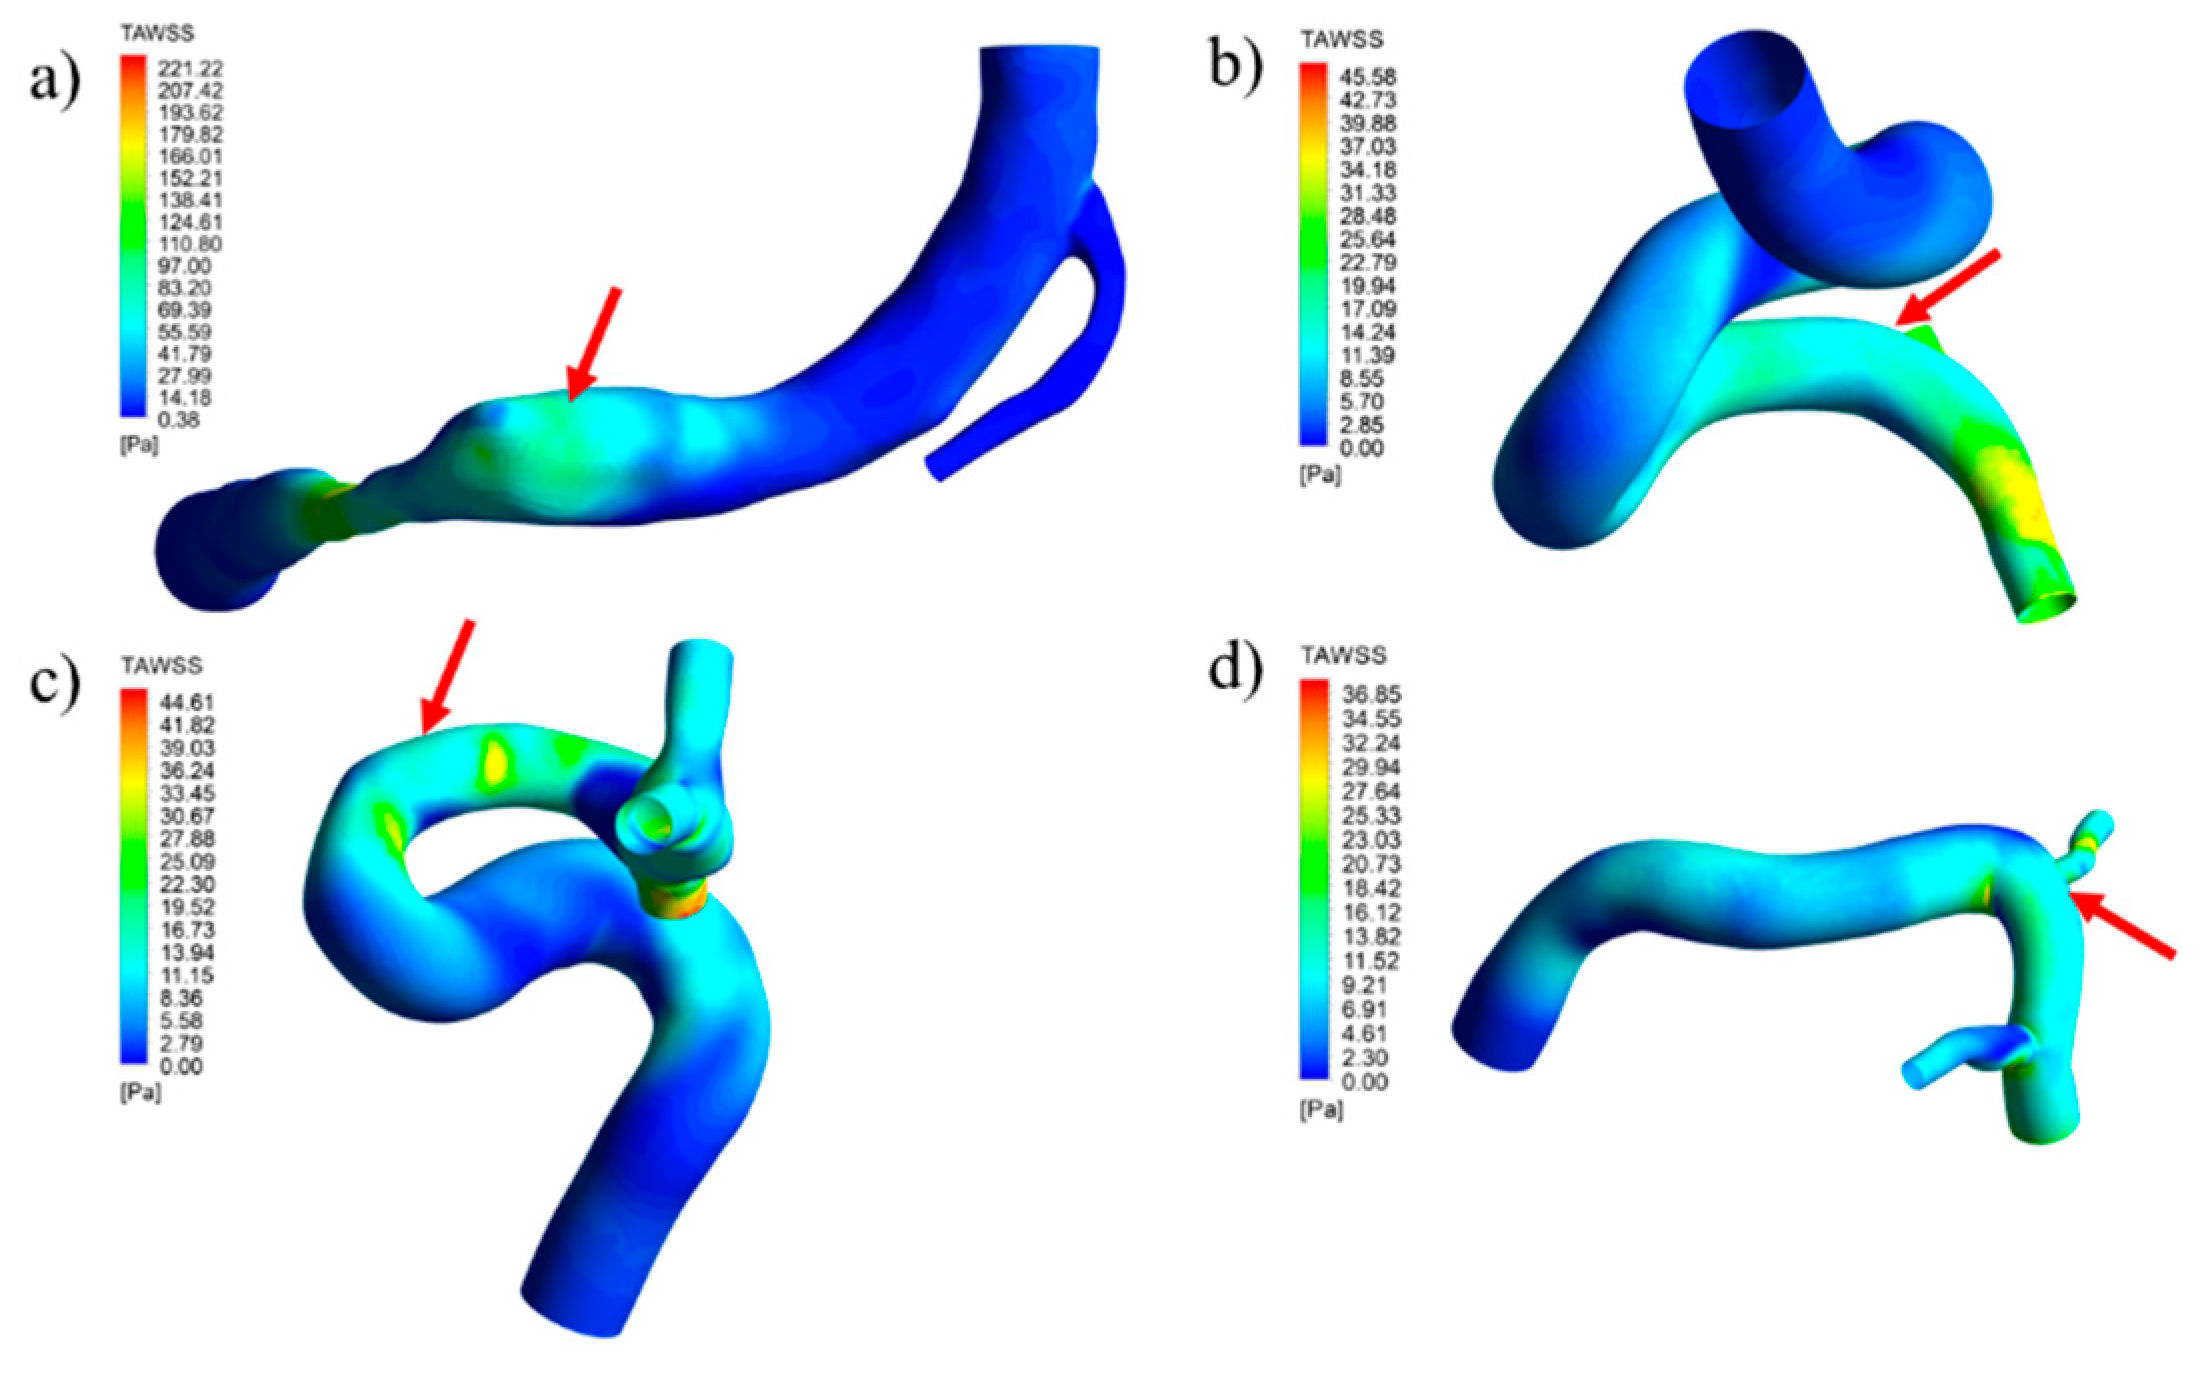
Figure 19.
Pressure distribution contours during systole for geometries with the removed aneurysm. In a) RG-1, b) UG-1, c) RG-2, and d) UG-2.
Figure 19.
Pressure distribution contours during systole for geometries with the removed aneurysm. In a) RG-1, b) UG-1, c) RG-2, and d) UG-2.
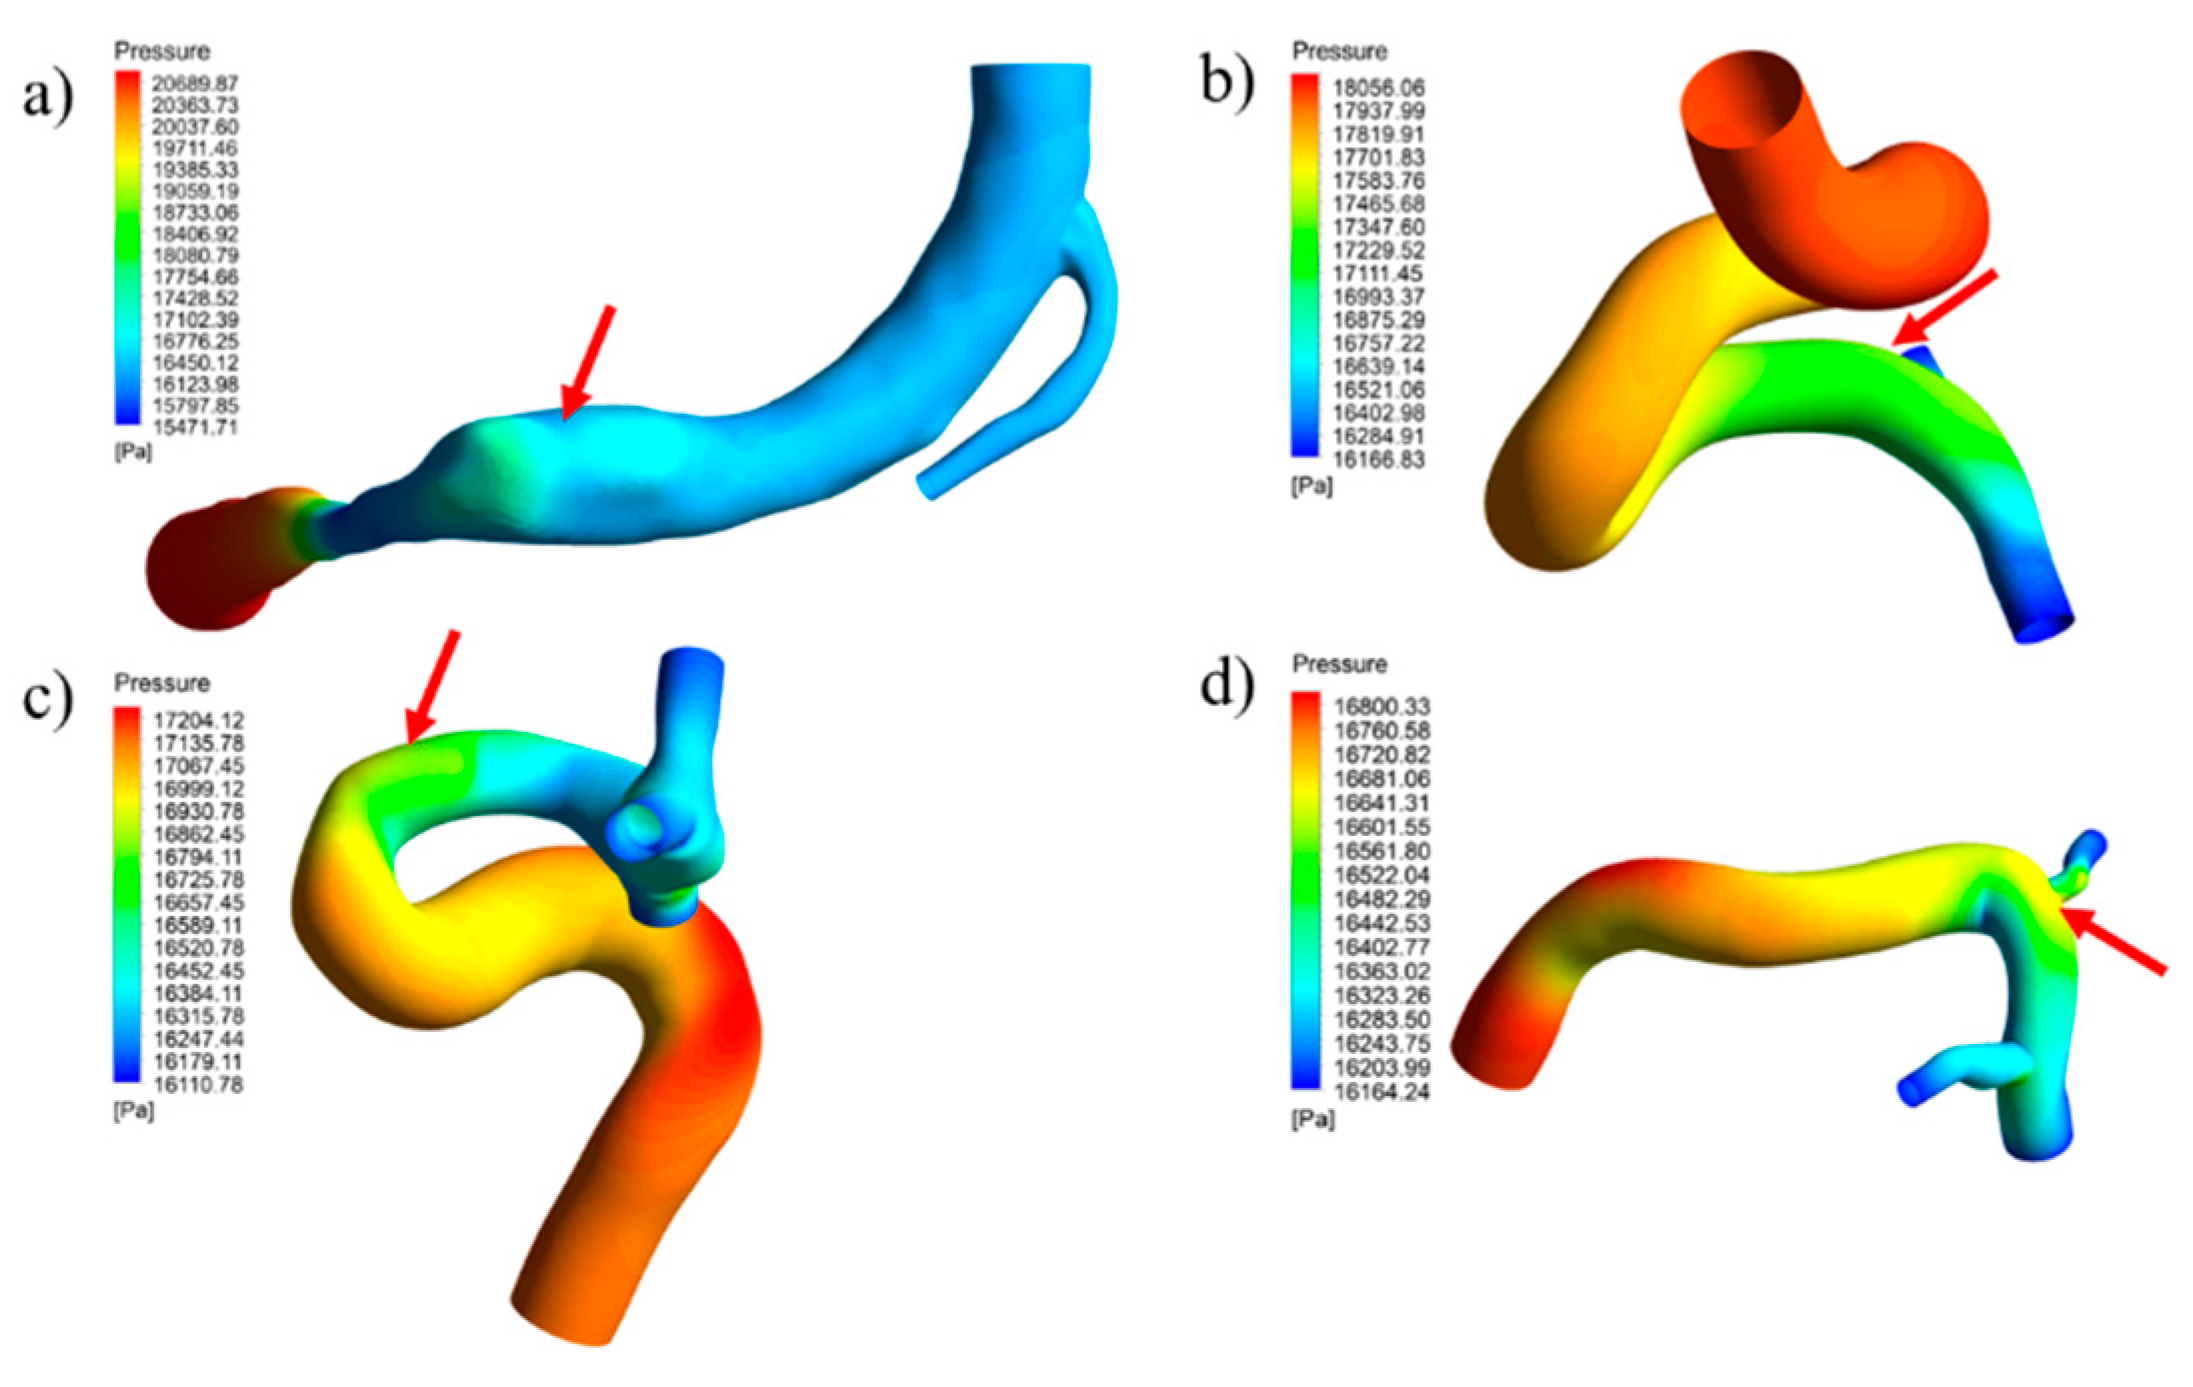
Figure 20.
Blood flow at the aneurysm region for geometries a) RG-1 and b) UG-1.
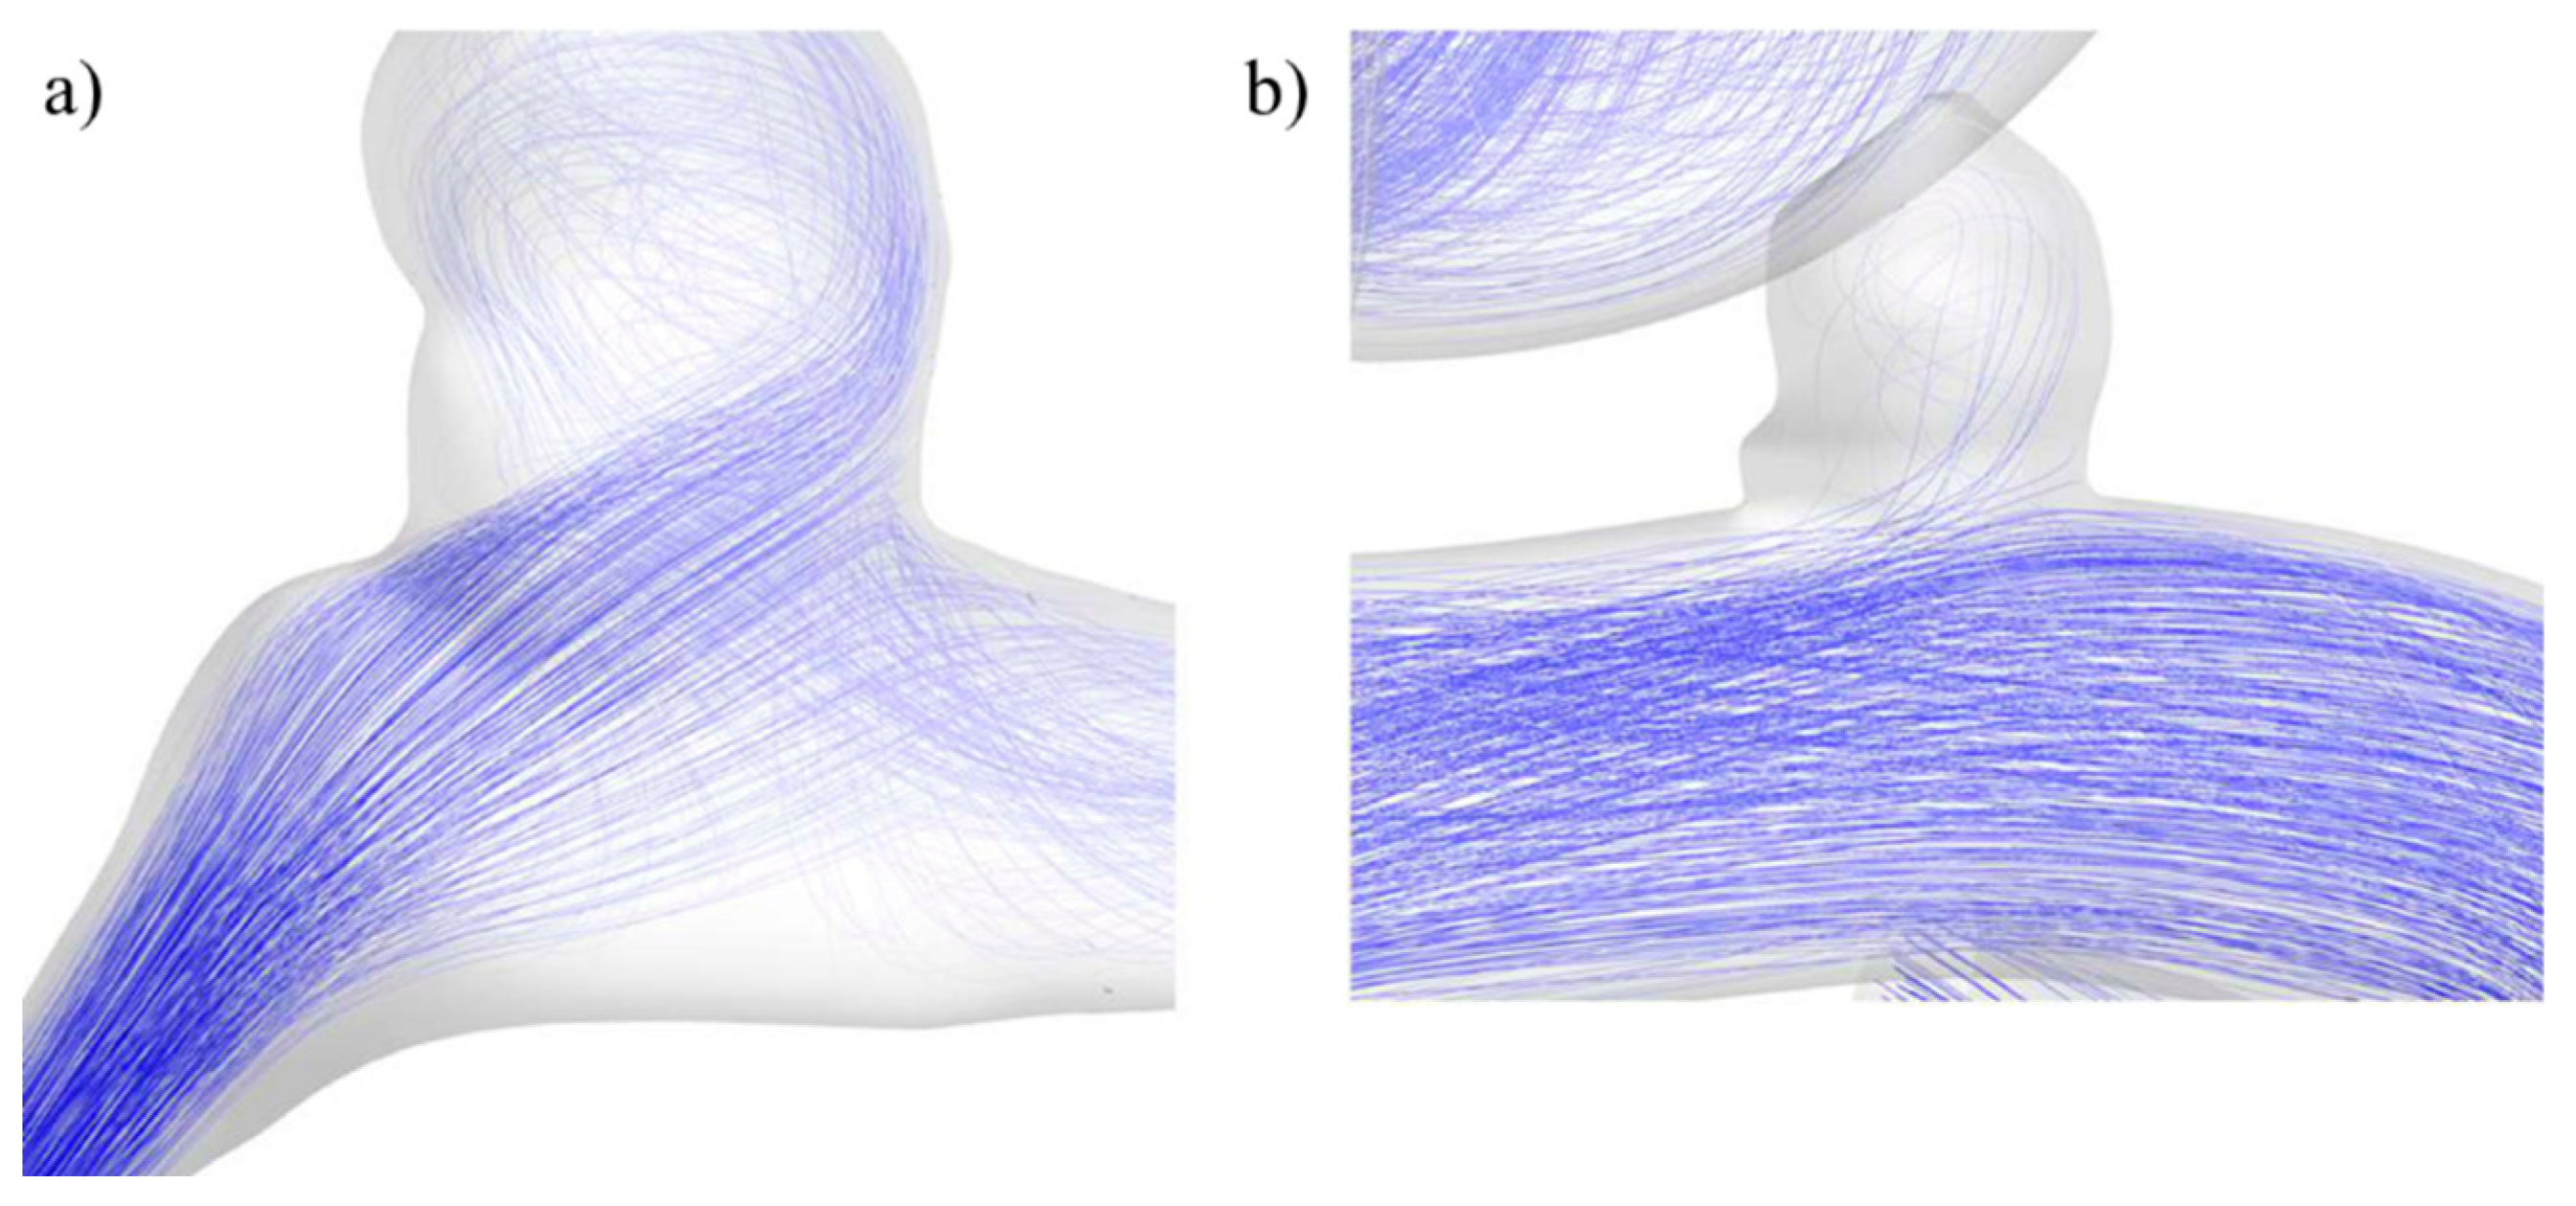
Figure 21.
Blood flow at the aneurysm region for UG-3 a) I, b) II, and c) III sizes.
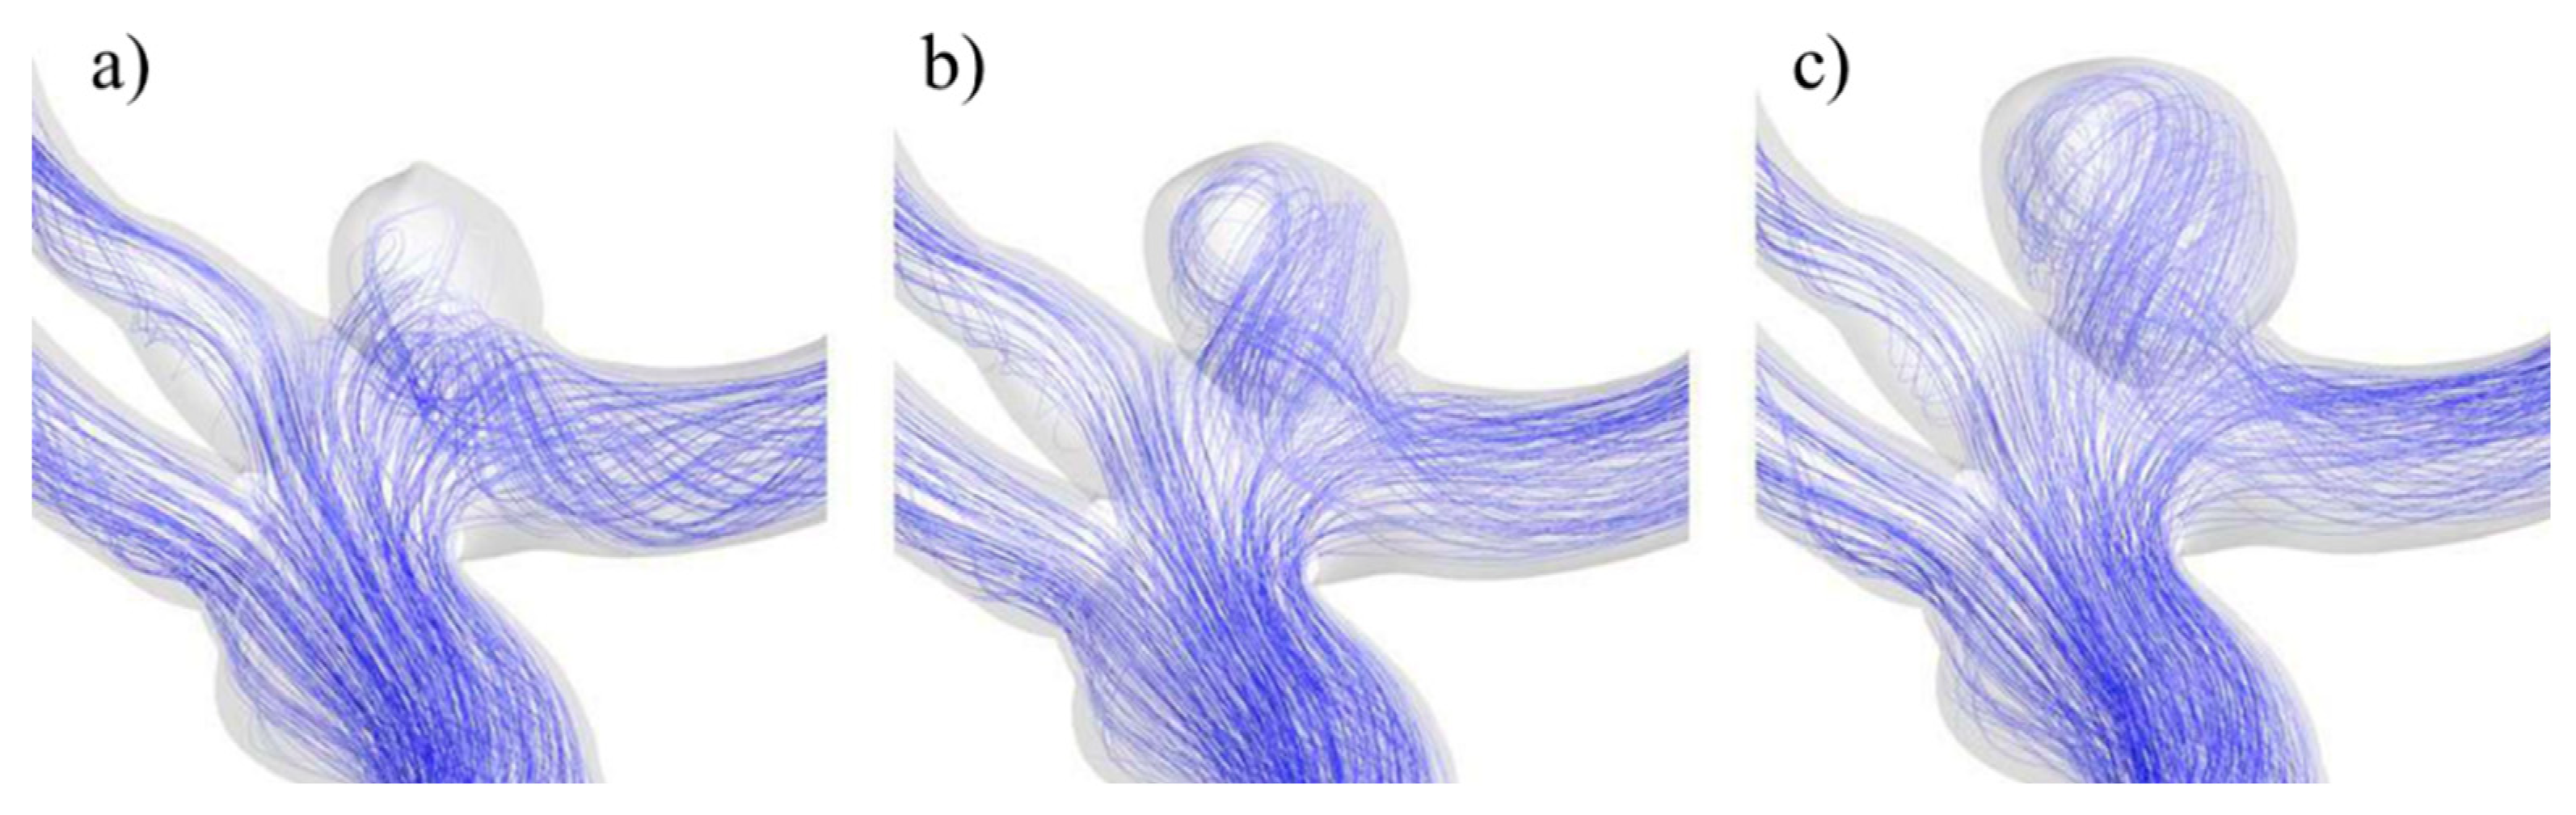
Figure 22.
Location of the imported aneurysm on the TAWSS distribution.
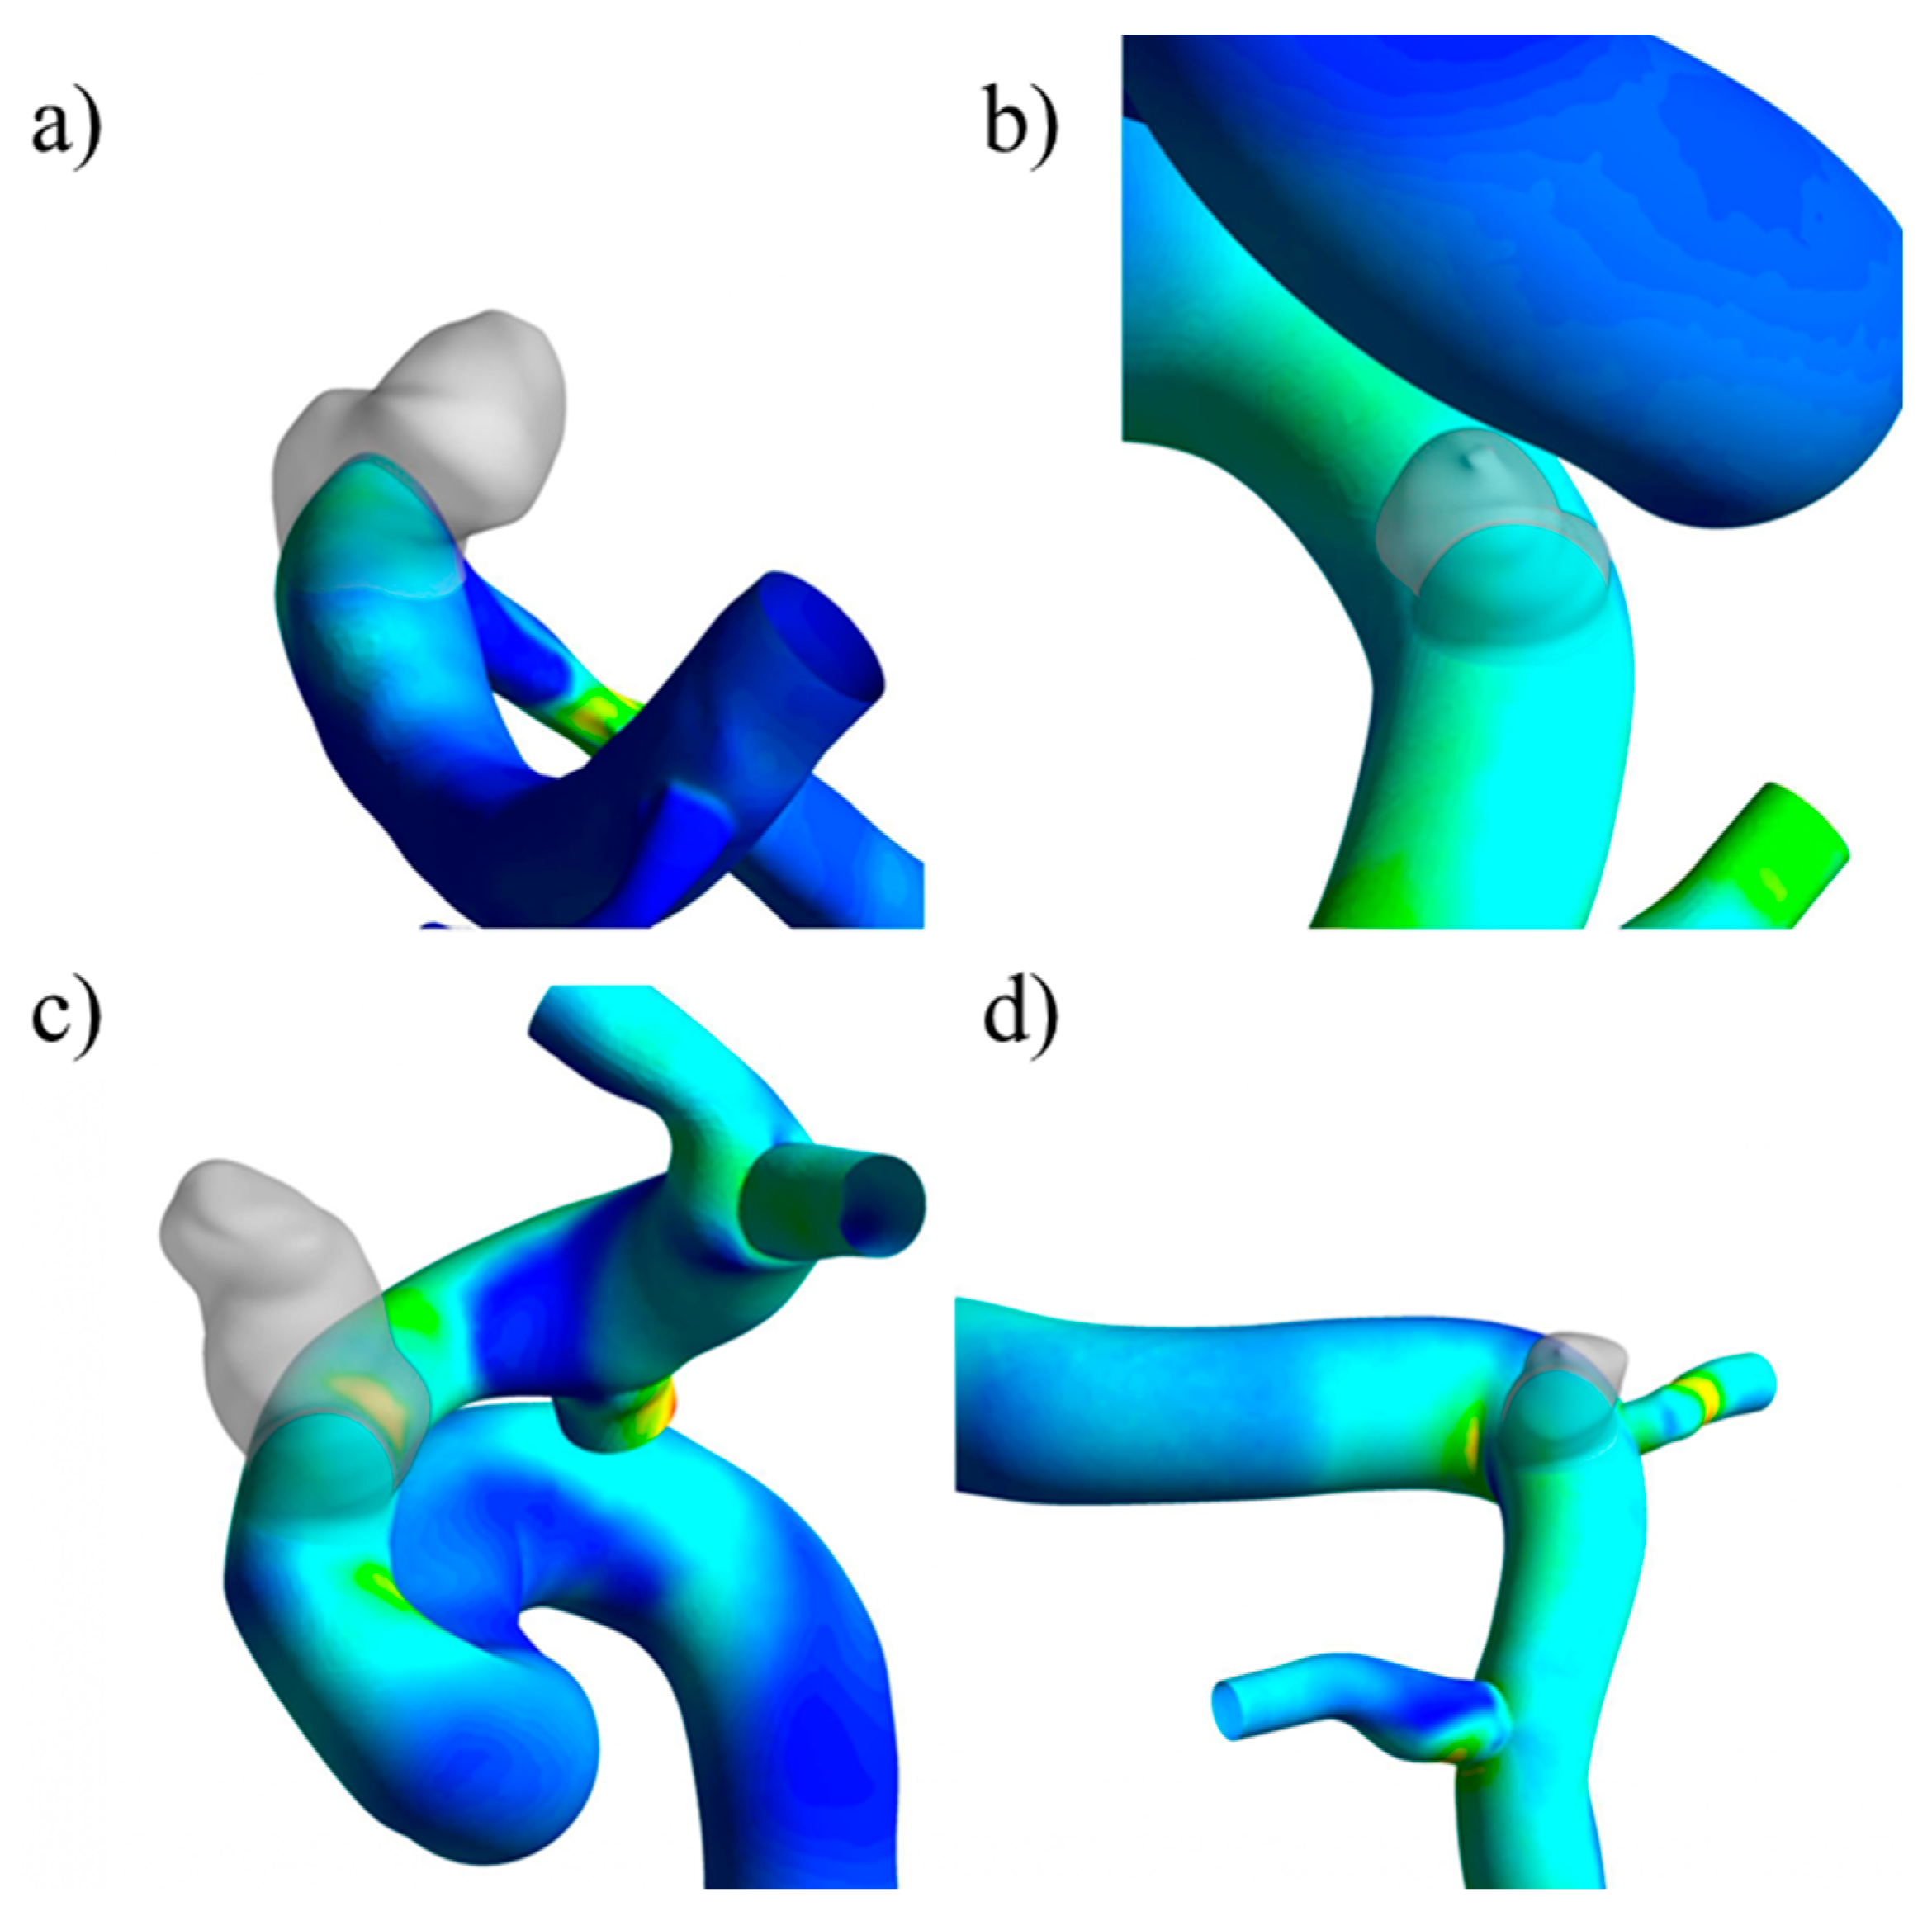

Table 1.
Rupture status, type, location and total volume of each geometry.
| Geometry | Rupture | Type | Location | Volume [mm3] |
|---|---|---|---|---|
| RG-1 | Yes | Lateral | ACA | 57 |
| RG-2 | Yes | Lateral | ICA | 583 |
| RG-3 | Yes | Terminal | ACA | 121 |
| UG-1 | No | Lateral | ICA | 775 |
| UG-2 | No | Lateral | ICA | 831 |
| UG-3 | No | Terminal | MCA | 1150 |
Table 2.
Displacement and Von Mises stress evolution obtained for the mesh tests and their percentage difference with respect to the 0.15 mm element size.
Table 2.
Displacement and Von Mises stress evolution obtained for the mesh tests and their percentage difference with respect to the 0.15 mm element size.
| Element size [mm] | Displacement [mm] | D015[%] | Von Mises stress [MPa] | D015 [%] |
|---|---|---|---|---|
| 0.50 | 0.39 | 2.63 | 0.13 | -7.14 |
| 0.40 | 0.39 | 2.63 | 0.14 | 0.00 |
| 0.35 | 0.39 | 2.63 | 0.13 | -7.14 |
| 0.30 | 0.39 | 2.63 | 0.14 | 0.00 |
| 0.25 | 0.39 | 2.63 | 0.14 | 0.00 |
| 0.20 | 0.39 | 2.63 | 0.14 | 0.00 |
| 0.15 | 0.38 | - | 0.14 | - |
Table 3.
Percentage differences for the Von Mises stress at the aneurysm with respect to the 0.35 [mm] wall thickness.
Table 3.
Percentage differences for the Von Mises stress at the aneurysm with respect to the 0.35 [mm] wall thickness.
| Case | Aneurysm thickness [mm] | Average Von Mises stress difference [%] | |
|---|---|---|---|
| Diastole | Systole | ||
| RG-1 | 0.2 | 75.9 | 79.5 |
| 0.1 | 244.8 | 263.6 | |
| UG-1 | 0.2 | 82.5 | 87.5 |
| 0.1 | 200.0 | 212.5 | |
Table 4.
Percentage differences for the displacement at the aneurysm with respect to the 0.35 [mm] wall thickness.
Table 4.
Percentage differences for the displacement at the aneurysm with respect to the 0.35 [mm] wall thickness.
| Case | Aneurysm thickness [mm] | Average displacement difference [%] | |
|---|---|---|---|
| Diastole | Systole | ||
| RG-1 | 0.2 | 57.1 | 50.0 |
| 0.1 | 142.9 | 120.0 | |
| UG-1 | 0.2 | -4.2 | -5.4 |
| 0.1 | -11.3 | -11.8 | |
Table 5.
Percentage variation of the WSS at the aneurysm dome with respect to the original size.
| Case | Size variation | Area-averaged WSS difference [%] | |
|---|---|---|---|
| Diastole | Systole | ||
| RG-2 | III | 57.5 | 49.8 |
| II | 123.1 | 116.7 | |
| I | 275.9 | 261.1 | |
| RG-3 | III | 62.7 | 60.4 |
| II | 122.7 | 107.8 | |
| I | 237.7 | 205.2 | |
| UG-2 | III | -35.7 | -37.2 |
| II | -18.2 | -17.9 | |
| UG-3 | III | -4.6 | -0.4 |
| II | -31.4 | 19.0 | |
Table 6.
Percentage variation of the average displacement at the aneurysm dome with respect to the original size.
Table 6.
Percentage variation of the average displacement at the aneurysm dome with respect to the original size.
| Case | Size variation | Average displacement difference [%] | |
|---|---|---|---|
| Diastole | Systole | ||
| RG-2 | III | -21.1 | -17.9 |
| II | -29.3 | -21.4 | |
| I | -19.0 | -11.1 | |
| RG-3 | III | -37.1 | -38.6 |
| II | -54.6 | -53.6 | |
| I | -51.3 | -48.5 | |
| UG-2 | III | 57.1 | 60.0 |
| II | 23.8 | 26.7 | |
| UG-3 | III | -21.3 | -22.8 |
| II | 9.6 | 9.6 | |
Table 7.
Percentage variation of the average Von Mises stress at the aneurysm dome with respect to the original size.
Table 7.
Percentage variation of the average Von Mises stress at the aneurysm dome with respect to the original size.
| Case | Size variation | Average Von Mises stress difference [%] | |
|---|---|---|---|
| Diastole | Systole | ||
| RG-2 | III | -19.5 | -17.2 |
| II | -31.7 | -31.3 | |
| I | -17.1 | -15.6 | |
| RG-3 | III | -17.1 | -21.8 |
| II | -22.9 | -29.1 | |
| I | -11.4 | -10.9 | |
| UG-2 | III | 28.0 | 25.0 |
| II | 8.0 | 8.7 | |
| UG-3 | III | 28.9 | 29.0 |
| II | 7.9 | 9.7 | |
Table 8.
Comparison between pre-aneurysm and aneurysm states in the TAWSS variation for lateral geometries.
Table 8.
Comparison between pre-aneurysm and aneurysm states in the TAWSS variation for lateral geometries.
| Case | TAWSS [Pa] | |||
|---|---|---|---|---|
| RG-1 | RG-2 | UG-1 | UG-2 | |
| Aneurysm | 20.7 | 3.6 | 7.8 | 7.7 |
| Pre-Aneurysm | 83.2 | 13.9 | 14-2 | 11.5 |
| Difference | -75.1% | -74.1% | -45.1% | -33.0% |
Disclaimer/Publisher’s Note: The statements, opinions and data contained in all publications are solely those of the individual author(s) and contributor(s) and not of MDPI and/or the editor(s). MDPI and/or the editor(s) disclaim responsibility for any injury to people or property resulting from any ideas, methods, instructions or products referred to in the content. |
© 2024 by the authors. Licensee MDPI, Basel, Switzerland. This article is an open access article distributed under the terms and conditions of the Creative Commons Attribution (CC BY) license (https://creativecommons.org/licenses/by/4.0/).
Copyright: This open access article is published under a Creative Commons CC BY 4.0 license, which permit the free download, distribution, and reuse, provided that the author and preprint are cited in any reuse.