Submitted:
16 June 2024
Posted:
17 June 2024
You are already at the latest version
Abstract
Arsenic is a prevalent environmental pollutant with recognized carcinogenic properties. Liver fibrosis is a frequent consequence of arsenic poisoning, with the activation of hepatic stellate cells (HSCs) being a central event. Solute Carrier Family 7 Member 11 (SLC7A11), a pivotal regulator of ferroptosis, may be involved in the process of arsenic-induced liver fibrosis. This study utilized lentiviral vector-mediated SLC7A11 silencing in LX-2 cells (a type of human hepatic stellate cells) to establish an SLC7A11 knockout cell model, which was then exposed to sodium arsenite (NaAsO2). Protein interactions were assessed through Protein Immunoprecipitation (IP), and protein levels were evaluated via Western blot analysis. It was found that NaAsO2 decreased cellular Fe2+ levels and nuclear receptor co-activator 4 (NCOA4) expression, with SLC7A11 silencing reversing these effects. Additionally, IP analysis revealed an interaction between Beclin1 and SLC7A11 proteins in LX-2 cells exposed to NaAsO2. Silencing SLC7A11 attenuated the reduction in Tumor Protein p53(P53), and p-mammalian target of rapamycin (p-mTOR) protein levels, along with the rise in Beclin1, Phosphorylated adenosine monophosphate activated protein kinase (p-AMPK), α-smooth muscle actin (α-SMA) and Fibroblast activation protein-α (FAP) induced by NaAsO2. Consequently, SLC7A11 silencing promoted cellular ferroptosis, reduced autophagy levels through the P53/AMPK/mTOR pathway, and inhibited HSC activation by NaAsO2, potentially mitigating liver fibrosis.
Keywords:
inorganic arsenic
; liver fibrosis
; ferroptosis
; autophagy
1. Introduction
Arsenic is a significant environmental pollutant found widely in nature and is recognized internationally as a carcinogen [1]. Arsenic contamination poses a worldwide health challenge. [2]. Exposure to arsenic can result in various adverse health effects, causing a range of clinical complications [3]. Prolonged exposure to inorganic arsenic (iAs) can result in skin lesions, peripheral nervous system symptoms, and impact multiple organs and tissues. The liver is particularly vulnerable to the toxic and carcinogenic effects of arsenic, contributing to liver damage, fibrosis, cirrhosis, and cancer [4-7]. The pathogenic mechanism of arsenic involves epigenetic changes, oxidative stress, apoptosis, autophagy, ferroptosis, and more [8-13]. Recent research indicates that autophagy and ferroptosis are closely linked to the toxic effects of arsenic and play crucial roles in its carcinogenic mechanism.
Autophagy is a cellular recycling mechanism that plays a crucial role in upkeep by breaking down flawed or clumped proteins, discarding worn-out organelles such as mitochondria, endoplasmic reticulum, and peroxisomes, and destroying internal microbes[14]. Excessive autophagy in cells of tumors or cardiovascular diseases has been extensively documented in recent years and can be classified as endoplasmic reticulum autophagy, mitophagy, and macroautophagy [15,16]. Additionally, autophagy can facilitate various forms of cell death, for instance necrosis, apoptosis, and ferroptosis [17].
Ferroptosis, first proposed by Dixon et al. in 2012, constitutes a form of programmed cell death that is dependent on iron. It is discernible from apoptosis, pyroptosis, and autophagy due to its unique morphological, biochemical, and genetic properties. [18]. The condition is marked by excessive iron within cells and the buildup of iron-dependent lipid peroxides. Several key regulators of ferroptosis have been characterized, such as nuclear factor erythroid 2-related factor 2 (NRF2), ferroptosis suppressor protein 1 (FSP1), glutathione peroxidase 4 (GPX4), and the Xc- system (comprising the SLC7A11 and SLC3A2 subunits) [19-22]. SLC7A11, also referred to as xCT, functions as a cystine/glutamate antiporter essential for importing cystine to support glutathione biosynthesis and antioxidant defense mechanisms. This transporter is commonly overexpressed in different types of human cancers [23]. The human SLC7A11 gene is positioned at the chromosomal location 4q28.3, with orthologs found in all vertebrates [24]. The light chain subunit SLC7A11 and the heavy chain subunit SLC3A2 (CD98hc or 4F2hc) together form the system Xc- [25]. SLC7A11, as the functional subunit of the Xc- system, not only defends against oxidative stress and ferroptosis as an important oncogenic protein but also influences the malignant behavior of cancer, the tumor microenvironment, the body's immune response, syndromes related to cancer, and the sensitivity of treatment [26]. Its physiological activity primarily involves regulating the redox state, ferroptosis, and intercellular signaling. Inhibiting SLC7A11 indirectly inactivates GPX4 by reducing cystine input and limiting GSH synthesis, leading to increased toxic lipid ROS levels. The role of SLC7A11 in fibrosis regulation is controversial, with certain research indicating that its upregulation can inhibit fibrotic pathways and slow the formation of tissue fibrosis, while other research has reached opposite conclusions [27,28]. Lv T et al. [29] found that SLC7A11 decreases the levels of reactive oxygen species (ROS) as well as enhances the activity of α-ketoglutarate (αKG)/prolyl hydroxylase (PHD), leading to AMPK pathway activation. Furthermore, by stimulating the AMPK-mitophagy axis, SLC7A11 boosts HSCs activation, which contributes to liver injury and fibrosis progression. On the other hand, studies by Yuan S et al. [30] have shown that sorafenib triggers ferroptosis in HSCs via the HIF-1α/SLC7A11 pathway, leading to a reduction in liver damage and fibrosis. Additionally, Liu G et al. [31] found that Wogonoside treatment of HSC-T6 cells was found to induce ferroptosis, with a decrease in SLC7A11 levels, which alleviated the level of liver fibrosis. However, the precise mechanisms through which SLC7A11, ferroptosis, and autophagy interplay in arsenic-induced liver fibrosis remain incompletely understood.
In our investigation, we inhibited the SLC7A11 expression in LX-2 cells and induced cell activation utilizing iAs3+.We examined the impact of ferroptosis and the P53/AMPK/mTOR autophagy pathway on LX-2 cell activation caused by arsenic. Our findings provide insights into changes in ferroptosis and autophagy-related proteins during arsenic-induced HSC activation. These results lay the groundwork for further exploration of liver fibrosis and present novel perspectives. Additionally, they may have significant implications for regions still heavily contaminated by arsenic.
2. Materials and Methods
2.1. Materials
Sodium arsenite (NaAsO2) (Beijing No.3 Chemical Reagent Factory, China), fetal bovine serum (FND500, Excell Bio, China), Pancreatic enzymes, high-glucose medium, penicillin-streptomycin bispecific antibody solution (C11995500BT, 15070-063, Gibco, USA), Dimethyl sulfoxide (DMSO) (D2650, Sigma, USA), PBS Phosphate-Buffered Saline Powder (ZLI-9062, Beijing Zhong Shan -Golden Bridge Biological Technology CO.LTD, China), FerroOrange probe (F374, Dongren Chemical Technology (Shanghai) Co., Ltd., C hina)RIPA lysis buffer (AR0105, Boster Biological Technology co.ltd, China), Protease inhibitor PMSF, pre-stained protein marker (AR1178, PR1910, Solarbio, China), Electrotransfer buffer, Electrophoresis buffer (Solarbio, China), BCA Protein Assay Kit (DQ111-01, TransGen Biotech, China), β-mercaptoethanol (0482-100mL, Amresco, China), sodium dodecyl sulfate (SDS), Tris(hydroxymethyl)aminomethane (Tris), acrylamide, bisacrylamide (A100227, A600194, A501033, A600025, Sangon, China), SLC7A11 Antibody, Goat anti rabbit IgG H&L (HRP), Immunoprecipitation (IP) Kit (ab307601, ab97051, ab206996, Abcam, UK), Beclin1 Antibody, P53 Antibody (11306-1-AP, 60283-2-Ig, Proteintech, China), NCOA4 Antibody, Ultra-sensitive ECL chemiluminescence kit (PA5-96398, 34580, Thermo Fisher, USA), p-mTOR Antibody, p-AMPK Antibody, α-SMA Antibody, FAP Antibody (AF3423, AF3308, AF1032, AF5344, Affinity Biosciences, China), β-actin Antibody (100166-MM10, Sino Biological Inc., China), skimmed milk powder (Bio-RAD, USA), LV-SLC7A11/LV-NC, HitransG P (Shanghai Genechem Co.,Ltd., China)
2.2. Cell Culture and Grouping
LX-2 cells (CL-0560, Wuhan Procell Biotech Co., Ltd., China) were cultured in complete medium prepared with DMEM high-glucose medium, fetal bovine serum, and double antibiotics (containing penicillin 80 U/mL and streptomycin 0.08 mg/mL) in a ratio of 45:5:0.5. The cells were incubated at 37°C with 5% CO2. After being transfected with lentivirus and confirmed successful by Western blotting, the cells were subjected to NaAsO2. The experiment was categorized into the following groups: blank control group, NaAsO2 group, NaAsO2+sh-NC group, and NaAsO2+sh-SLC7A11 group. According to the half-maximal inhibitory concentration and optimal exposure results obtained from previous experiments of the research group, combined with the characteristics of chronic low-dose exposure to endemic arsenic poisoning, the sodium arsenite exposure dose was set at 5 μmol/L, with an exposure time of 72 hours.
2.3. Cell Transfection
The LX-2 cells, which have a fusion rate of approximately 80%, were digested with trypsin and then prepared into a cell suspension. Subsequently, these cells were seeded into a 96-well plate and cultured at 37°C with 5% CO2 for a period of 24 hours. When the cells reached a confluence of 20-30%, we reserved space for the addition of virus solution, according to the manual for the recombinant lentiviral vector. Based on the cells' Multiplicity of Infection (MOI) and virus titer, we added the appropriate amount of virus. The calculation formula is: virus volume = (MOI × cell number) / virus titer. Then, 100 μL/well was added to the 96-well plate, totaling 16 wells. Among them, 3 wells served as the blank control group. After a duration of 16 to 24 hours at 37°C, the cells were guided to reach a fusion ratio within the range of 40% to 50%. The virus was thawed on ice before use, and it gradually melted on the ice surface. Using pre-cooled PBS, we diluted the virus to a titer of 1×10⁸ TU/mL (MOI=100), 5×10⁷ TU/mL (MOI=50), 1×10⁷ TU/mL (MOI=10), and 1×10⁶ TU/mL (MOI=1), with each concentration being 50 μL. We discarded the supernatant in each well and replaced it with complete culture medium. We then added virus and virus infection enhancer (HitransG P) to mix and continued to culture. During the 8-12 hours following infection, we continued to use complete medium to culture the cells and carefully observed any morphological changes. If the cell morphology changed, we recommended changing the culture medium 8 hours in advance to ensure normal cell growth. During the 3rd to 4th day of culture, we could change the medium according to the cell growth to maintain cell activity. Approximately 72 hours after infection, we observed the cells under a microscope. We selected cells with an infection efficiency of about 80%, with only virus added and a virus titer of (1×10⁸ TU/mL, MOI=100). Under these conditions, the cell growth was good, and we used this concentration to infect the cells.
2.4. Detection of Fe2+ with FerroOrange Probe
Follow the guidelines to create the FerroOrange working solution. Collect the cells from each group, perform cell culture on glass slides, and after the cells have adhered, discard the original culture medium. Clean the cells with serum-free medium three times. Prepare the 1μM FerroOrange working solution and treat the cells with it, then incubate them at 37°C with 5% CO2 for half an hour. Subsequently, stain the cell nuclei with DAPI and examine the cells under a confocal microscope, using an excitation wavelength of 543nm and detecting the emission at 580nm.
2.5. Western Blot
Collect LX-2 cells that have been transfected or treated with sodium arsenite. Collect the cell pellets and add protease inhibitor (PMSF) and RIPA lysis buffer in a ratio of 1:100 to EP tubes. Incubate on ice and centrifuge at 16,000×g to extract total cellular proteins. Determine the protein content of the target gene using the BCA method. Adjust the protein concentration in the samples using loading buffer to maintain uniformity, boil for 10 minutes, load the samples, and then perform polyacrylamide gel electrophoresis until the bromophenol blue dye migrates to the bottom. Transfer the proteins onto a membrane at a constant speed on ice. Following incubation with non-fat dry milk to block non-specific binding, the primary antibodies targeting the protein should be diluted at ratios of either 1:1000, 1:2000, 1:4000, 1:8000, or 1:5000, and incubate at 4°C overnight. Incubate with 1:2000 horseradish peroxidase-conjugated secondary antibody at room temperature. Visualize the proteins using a chemiluminescence substrate (Enhanced chemiluminescence, ECL) and analyze the protein gray values using Image J software (version 1.54d).
2.6. Protein Immunoprecipitation, IP
Collect LX-2 cell samples and add RIPA lysis buffer containing a mixture of protease inhibitors to lyse the cells. After centrifugation, the supernatant is collected to obtain total protein. The protein lysate is mixed with either the primary antibody or isotype IgG and incubated at 4°C for a period of 4 hours. Then, protein A/G agarose is added and incubated overnight at 4°C. The beads are washed with PBS and resuspended in SDS-PAGE buffer. After centrifugation, the samples are subjected to protein blot analysis (the experimental procedure is the same as in 2.5). The whole cell lysate serves as the input control, and isotype IgG is used as the Control IgG control group.
2.7. Statistical Analysis
Data were entered into Excel 2020 software and processed using SPSS 25.0 software. For quantitative data that met the normality assumption, the mean ± standard deviation (x̄ ± s) was used to represent the data. When multiple independent sample data sets satisfied the criteria of independence, normality, and homogeneity of variance, one-way analysis of variance (ANOVA) was employed, and pairwise comparisons were conducted using the Least Significant Difference (LSD) method. GraphPad Prism 8.0 was utilized for the visualization of data. Statistical significance was determined at a P-value of less than 0.05, with the significance level α established at 0.05.
3. Result
3.1. LX-2 cell Line Stably Infected with sh-SLC7A11 Lentiviral Vector
After infecting LX-2 cells with sh-SLC7A11 lentiviral vector for 48 hours, the cells were treated with 5 μmol/L sodium arsenite for 72 hours. Fluorescence microscopy was used to observe the fluorescence expression. The results show that both the NC empty vector virus and the sh-SLC7A11 lentivirus successfully infected LX-2 cells, with an infection efficiency of over 80% (Figure 1). Western blotting confirmed the impact of sh-SLC7A11 lentiviral vector infection in LX-2 cells. The results revealed increased SLC7A11 protein levels in the NaAsO2 group and the NaAsO2+sh-NC group compared to the blank control group. Moreover, the NaAsO2+sh-SLC7A11 group exhibited decreased SLC7A11 protein levels compared to the NaAsO2 group, with statistically significant differences (P<0.05). These experiments demonstrated successful infection of LX-2 cells by the sh-SLC7A11 virus, leading to the successful construction of an SLC7A11 silenced cell model (Figure 2, Table 1).
3.2. SLC7A11 Silencing Can Reduce the Level of Sodium Arsenite-Induced Activation of Human Hepatic Stellate Cells
Western Blot analysis was utilized to assess the changes in activated protein levels within LX-2 cells. The findings indicated that, in comparison to the control group, the expression of FAP and α-SMA proteins significantly increased in the NaAsO2 group, NaAsO2+sh-NC group (P<0.05), indicating an elevation in LX-2 cell activation following sodium arsenite treatment. Moreover, a decrease in the expression levels of FAP and α-SMA proteins was observed in the NaAsO2+sh-SLC7A11 group compared to the NaAsO2 group (P<0.05). Additionally, the expression of FAP and α-SMA protein decreased in the NaAsO2+sh-SLC7A11 group compared to the NaAsO2+sh-NC group (P<0.05). These results suggest that silencing SLC7A11 led to a reduction in LX-2 cell activation induced by sodium arsenite treatment (Figure 3, Table 2).
3.3. SLC7A11 Silencing Promotes Sodium Arsenite-Induced Ferroptosis in LX-2 Cells
To assess the impact of silencing SLC7A11 on ferroptosis levels in LX-2 cells treated with sodium arsenite, we utilized the FerroOrange fluorescent probe to measure intracellular Fe2+ content and conducted Western Blot analysis to evaluate the expression of NCOA4, a key ferroptosis indicator protein. Our findings revealed a decrease in Fe2+ content across all arsenic-treated groups, with a notable inhibition of this decrease in the SLC7A11 silenced group compared to the other arsenic-treated groups (P<0.05). The changes in the relative expression levels of NCOA4 protein were consistent with the changes in Fe2+ content (P<0.05) (refer to Figure 4, Figure 5 and Figure 6 and Table 3). The results indicate that SLC7A11 silencing promotes the occurrence of ferroptosis, and since NCOA4 is also a key regulator of iron autophagy, silencing SLC7A11 may promote ferroptosis by activating the iron autophagy pathway in LX-2 cells.
3.4. IP Experiment Validates the Interaction between Beclin1 and SLC7A11 Proteins in Sodium Arsenite-Treated LX-2 Cells
Following a 72-hour treatment of LX-2 cells with NaAsO2, total protein was extracted from the cells. Immunoprecipitation (IP) was then carried out using cell lysates containing Beclin1 antibodies, followed by Western blot analysis for SLC7A11. This experiment was repeated three times. From the figures, the Input group should show positive bands, the IgG-IP group negative bands, and the Beclin1-IP group positive bands. The findings suggest that sodium arsenite is capable of inducing an interaction between Beclin1 and SLC7A11 proteins in LX-2 cells (refer to Figure 7).
3.5. The Impact of SLC7A11 Silencing on the Expression of Beclin1 and the Autophagy Pathway Proteins P53/AMPK/mTOR in LX-2 Cells Treated with Sodium Arsenite
Beclin1 serves as an autophagy-related marker, while the P53/AMPK/mTOR pathway is recognized as an autophagy-related pathway. In this study, Western Blot analysis was employed to assess the expression levels of Beclin1 and the proteins involved in the autophagy-related pathway, namely P53/AMPK/mTOR, in LX-2 cells subjected to sodium arsenite treatment following SLC7A11 silencing. The results demonstrated a notable increase in Beclin1 and p-AMPK protein levels across all arsenic-treated groups compared to the control group. Conversely, the rise in Beclin1 and p-AMPK protein levels was significantly impeded in the SLC7A11 silenced group relative to the other arsenic-treated groups (P<0.05). On the other hand, the expression levels of P53 and p-mTOR proteins exhibited a decrease in all arsenic-treated groups compared to the control group. Notably, in the SLC7A11 silenced group, the reduction in P53 and p-mTOR protein levels was markedly inhibited compared to the other arsenic-treated groups (P<0.05). These findings suggest that sodium arsenite treatment triggers the activation of the P53/AMPK/mTOR autophagy pathway in LX-2 cells, thereby promoting autophagy. However, silencing of SLC7A11 hinders this pathway, resulting in a reduction in autophagy levels within the cells (Figure 8, Table 4).
4. Discussion
The objective of this research aimed to investigate the regulatory mechanisms of SLC7A11 in the process of NaAsO2-induced activation of HSCs. Our preliminary findings suggest that changes in SLC7A11 expression during the activation of LX-2 cells induced by sodium arsenite are associated with ferroptosis and autophagy. Silencing SLC7A11 may enhance ferroautophagy and trigger ferroptosis, ultimately reducing the activation of LX-2 cells. Furthermore, we observed an interaction between SLC7A11 and Beclin1, a crucial autophagy regulator. SLC7A11 modulates cellular autophagy through the P53/AMPK/mTOR pathway, influencing the level of cell activation. This research offers novel insights into the prevention and treatment of endemic arseniasis, particularly liver diseases resulting from arsenic exposure.
In this study, we used LX-2 cells as the experimental subject to investigate the effects of As3+ on the activation of HSCs. Based on the previous studies conducted by our research group, the concentration of arsenic exposure was determined. The Western blot analysis demonstrated an increase in the expression of fibrosis markers, α-SMA and FAP proteins, indicating that exposure to sodium arsenite led to the activation of LX-2 cells. Prolonged exposure to arsenic can cause a series of liver damage, such as liver enlargement, liver fibrosis, liver cirrhosis, and even hepatocellular carcinoma[5]. The activation of HSCs is a pivotal event in fibrosis and plays an important role in the onset and progression of liver disorders [32].
To investigate the regulatory role of SLC7A11 in arsenic-induced liver fibrosis, our initial plan was to manipulate the expression of SLC7A11 in LX-2 cells by either silencing or overexpressing it. However, after conducting a thorough literature review, we discovered that LX-2 cells inherently exhibit high levels of SLC7A11 expression, making the impact of SLC7A11 gene overexpression less than ideal. Consequently, we opted to proceed with SLC7A11 gene knockdown. Using lentiviral transfection, we successfully established a SLC7A11-silenced LX-2 cell model. Western blot analysis disclosed that the suppression of SLC7A11 led to the inhibition of FAP and α-SMA protein expression in arsenic-exposed LX-2 cells, thereby impeding their activation process. Furthermore, our findings demonstrated that SLC7A11 knockdown could counteract the reduction in cellular Fe2+ levels and NCOA4 expression induced by sodium arsenite, suggesting that knocking down SLC7A11 may induce ferroptosis and mitigate liver fibrosis. Emerging studies have underscored the crucial involvement of ferroptosis in a multitude of illnesses and malignancies [33]. For instance, Han Z et al. [34] identified SLC7A11 as a crucial regulatory gene involved in the attenuation of CCl4-induced liver injury by luteolin in HepG2 cells. Luteolin was shown to inhibit ferroptosis mediated by SLC7A11, thereby ameliorating liver injury caused by carbon tetrachloride. Similarly, Li WT et al. [35] discovered that SLC7A11 is upregulated in esophageal squamous cell carcinoma (ESCC), and blocking SLC7A11 with Erastin can diminish the malignant phenotype of ESCC cells and downregulate key molecules associated with ferroptosis, such as GPX4 and DHODH. Consequently, inhibiting SLC7A11 may decelerate the multiplication of esophageal squamous cell carcinoma cells. Liu M et al. [36] discovered that activating AMPK can remove senescent cells in diabetic wounds by triggering ferritinophagy through NCOA4. This process also reverses the resistance of fibroblasts in diabetic mouse wounds to ferroptosis, ultimately enhancing the healing of the wounds. Ferritinophagy often participates in promoting ferroptosis[37]. Our study also identified the presence of ferritinophagy. The inhibition of SLC7A11 was observed to enhance ferroptosis by inducing the ferritinophagy pathway in LX-2 cells via NCOA4. This finding confirms the significant role of SLC7A11 in controlling ferroptosis.
Beclin1 has recently been identified as a bifunctional modulator of ferroptosis and autophagy. Research indicates that Beclin1 facilitates ferroptosis through direct binding to SLC7A11 and suppressing its activity [38]. Lin L et al. [39] demonstrated that ginsenoside Rb1 (GRb1) triggers hepatic stellate cell ferroptosis by acting on the BECN1/SLC7A11 axis to mitigate liver fibrosis. In a separate study, Liu J et al. [40] discovered that activation of the Nrf2 signaling pathway can inhibit ferroptosis by inducing autophagy to interfere with the engagement of SLC7A11 and BECN1, thereby promoting the membrane translocation of SLC7A11 and the synthesis of GSH. Therefore, we performed IP analysis on LX-2 cells treated with sodium arsenite to examine the interaction between these proteins. Our results revealed that Beclin1 and SLC7A11 proteins indeed associate with each other. Additionally, we observed that knocking down SLC7A11 suppressed the upregulated expression of Beclin1 in arsenic-treated LX-2 cells. The potential mechanism suggests that autophagy may suppress ferroptosis in the presence of arsenic. When SLC7A11 is downregulated, it leads to inhibition of Beclin1 expression, subsequently suppressing autophagy and enhancing ferroptosis. This results in decreased activation of LX-2 cells and a slower progression of fibrosis, aligning with findings from previous studies. The BECN1/SLC7A11 pathway is essential in controlling autophagy and ferroptosis, thereby alleviating liver fibrosis.
Autophagy is a key player in liver physiology and pathology, and its dysfunction or dysregulation has been linked to a range of liver diseases [41]. Cao Y et al. [42] found that macrophages induce autophagy in HSCs through the PGE2/EP4 pathway, thereby exacerbating liver fibrosis in mice with non-alcoholic fatty liver disease. Furthermore, Meng D [43] noted that carvedilol mitigates liver fibrosis by inhibiting autophagy and promoting apoptosis in HSCs. Previous research by our group has revealed that inorganic arsenic can induce autophagy, thereby promoting liver fibrosis [44]. Recent studies suggest that SLC7A11 may be involved in the autophagy process. Mukhopadhyay S[45]demonstrated that autophagy plays a role in regulating SLC7A11 to maintain cysteine homeostasis in pancreatic cancer, and Ke Y et al. [46] found that decreased expression of SLC7A11 can inhibit cell autophagy as a competitive endogenous RNA, leading to drug resistance in ovarian cancer and reduced survival rates. The P53/AMPK/mTOR pathway is a well-established autophagy pathway, with research indicating its close association with ferroptosis [47-50]. Our experimental results demonstrate that sodium arsenite decreases the levels of p53 and p-mTOR in LX-2 cells, while increasing the level of p-AMPK. Suppression of SLC7A11 expression is shown to reverse these effects. These findings suggest that sodium arsenite may induce autophagy and inhibit ferroptosis through activation of the P53/AMPK/mTOR pathway. Conversely, silencing SLC7A11 modulates the P53/AMPK/mTOR pathway, leading to decreased autophagy levels and increased ferroptosis, ultimately reducing the activation of HSCs and inhibiting liver fibrosis.
5. Conclusion
This research indicates the participation of both ferroptosis and autophagy in the activation of hepatic stellate cells induced by arsenic. The gene SLC7A11 is implicated in both autophagy and ferroptosis processes. Inhibiting SLC7A11 enhances ferroptosis while reducing autophagy levels through modulation of the P53/AMPK/mTOR pathway, ultimately inhibiting the activation of human hepatic stellate cells induced by sodium arsenite. The activation level of these pathways shows promise in alleviating liver fibrosis to some extent. This research provides initial insights into the interplay between ferroptosis and autophagy in arsenic-induced liver fibrosis, highlighting the significance of targeting SLC7A11 in this context. These findings hold considerable value for further investigations into liver diseases associated with arsenic exposure.
Author Contributions
S.W. designed and supervised the study. W.D. and L.Z. contributed to the experimental progress and manuscript writing. F.H. conducted data analysis and revised the manuscript. All authors have reviewed and approved the final version of the manuscript.
Funding
This research was funded by National Natural Science Foundation of China (82160650).
Institutional Review Board Statement
Not applicable.
Informed Consent Statement
Not applicable.
Data Availability Statement
Data from this study may be accessed upon reasonable request from the corresponding author.
Conflicts of Interest
The authors declare no conflict of interest.
References
- Chen, Q.Y.; Costa, M. Arsenic: A Global Environmental Challenge. Annu Rev Pharmacol Toxicol 2021, 61, 47-63. [CrossRef]
- Hassan, Z.; Westerhoff, H.V. Arsenic Contamination of Groundwater Is Determined by Complex Interactions between Various Chemical and Biological Processes. Toxics 2024, 12. [CrossRef]
- Martínez-Castillo, M.; García-Montalvo, E.A.; Arellano-Mendoza, M.G.; Sánchez-Peña, L.D.C.; Soria Jasso, L.E.; Izquierdo-Vega, J.A.; Valenzuela, O.L.; Hernández-Zavala, A. Arsenic exposure and non-carcinogenic health effects. Hum Exp Toxicol 2021, 40, S826-s850. [CrossRef]
- Choiniere, J.; Wang, L. Exposure to inorganic arsenic can lead to gut microbe perturbations and hepatocellular carcinoma. Acta Pharm Sin B 2016, 6, 426-429. [CrossRef]
- Yang, H.; Mo, M.; Yang, L.; Yu, J.; Li, J.; Cheng, S.; Sun, B.; Xu, B.; Zhang, A.; Luo, H. A Novel Quinazoline Derivative Prevents and Treats Arsenic-Induced Liver Injury by Regulating the Expression of RecQ Family Helicase. Int J Mol Sci 2023, 24. [CrossRef]
- Li, W.; Jiang, X.; Qian, H.; Li, X.; Su, J.; Zhang, G.; Li, X. Associations of arsenic exposure with liver injury in US adults: NHANES 2003-2018. Environ Sci Pollut Res Int 2023, 30, 48260-48269. [CrossRef]
- Liu, J.; Waalkes, M.P. Liver is a target of arsenic carcinogenesis. Toxicol Sci 2008, 105, 24-32. [CrossRef]
- Medda, N.; De, S.K.; Maiti, S. Different mechanisms of arsenic related signaling in cellular proliferation, apoptosis and neo-plastic transformation. Ecotoxicol Environ Saf 2021, 208, 111752. [CrossRef]
- Reichard, J.F.; Puga, A. Effects of arsenic exposure on DNA methylation and epigenetic gene regulation. Epigenomics 2010, 2, 87-104. [CrossRef]
- Flora, S.J. Arsenic-induced oxidative stress and its reversibility. Free Radic Biol Med 2011, 51, 257-281. [CrossRef]
- Medda, N.; Patra, R.; Ghosh, T.K.; Maiti, S. Neurotoxic Mechanism of Arsenic: Synergistic Effect of Mitochondrial Instability, Oxidative Stress, and Hormonal-Neurotransmitter Impairment. Biol Trace Elem Res 2020, 198, 8-15. [CrossRef]
- Chen, Y.; Liu, X.; Zhang, Q.; Wang, H.; Zhang, R.; Ge, Y.; Liang, H.; Li, W.; Fan, J.; Liu, H.; et al. Arsenic induced autophagy-dependent apoptosis in hippocampal neurons via AMPK/mTOR signaling pathway. Food Chem Toxicol 2023, 179, 113954. [CrossRef]
- Aschner, M.; Skalny, A.V.; Martins, A.C.; Sinitskii, A.I.; Farina, M.; Lu, R.; Barbosa, F., Jr.; Gluhcheva, Y.G.; Santamaria, A.; Tinkov, A.A. Ferroptosis as a mechanism of non-ferrous metal toxicity. Arch Toxicol 2022, 96, 2391-2417. [CrossRef]
- Glick, D.; Barth, S.; Macleod, K.F. Autophagy: cellular and molecular mechanisms. J Pathol 2010, 221, 3-12. [CrossRef]
- Debnath, J.; Gammoh, N.; Ryan, K.M. Autophagy and autophagy-related pathways in cancer. Nat Rev Mol Cell Biol 2023, 24, 560-575. [CrossRef]
- Klionsky, D.J.; Petroni, G.; Amaravadi, R.K.; Baehrecke, E.H.; Ballabio, A.; Boya, P.; Bravo-San Pedro, J.M.; Cadwell, K.; Cecconi, F.; Choi, A.M.K.; et al. Autophagy in major human diseases. Embo j 2021, 40, e108863. [CrossRef]
- Liu, S.; Yao, S.; Yang, H.; Liu, S.; Wang, Y. Autophagy: Regulator of cell death. Cell Death Dis 2023, 14, 648. [CrossRef]
- Dixon, S.J.; Lemberg, K.M.; Lamprecht, M.R.; Skouta, R.; Zaitsev, E.M.; Gleason, C.E.; Patel, D.N.; Bauer, A.J.; Cantley, A.M.; Yang, W.S.; et al. Ferroptosis: an iron-dependent form of nonapoptotic cell death. Cell 2012, 149, 1060-1072. [CrossRef]
- Imai, H.; Matsuoka, M.; Kumagai, T.; Sakamoto, T.; Koumura, T. Lipid Peroxidation-Dependent Cell Death Regulated by GPx4 and Ferroptosis. Curr Top Microbiol Immunol 2017, 403, 143-170. [CrossRef]
- Dong, H.; Qiang, Z.; Chai, D.; Peng, J.; Xia, Y.; Hu, R.; Jiang, H. Nrf2 inhibits ferroptosis and protects against acute lung injury due to intestinal ischemia reperfusion via regulating SLC7A11 and HO-1. Aging (Albany NY) 2020, 12, 12943-12959. [CrossRef]
- Maiorino, M.; Conrad, M.; Ursini, F. GPx4, Lipid Peroxidation, and Cell Death: Discoveries, Rediscoveries, and Open Issues. Antioxid Redox Signal 2018, 29, 61-74. [CrossRef]
- Jiang, X.; Stockwell, B.R.; Conrad, M. Ferroptosis: mechanisms, biology and role in disease. Nat Rev Mol Cell Biol 2021, 22, 266-282. [CrossRef]
- Koppula, P.; Zhuang, L.; Gan, B. Cystine transporter SLC7A11/xCT in cancer: ferroptosis, nutrient dependency, and cancer therapy. Protein Cell 2021, 12, 599-620. [CrossRef]
- Lewerenz, J.; Hewett, S.J.; Huang, Y.; Lambros, M.; Gout, P.W.; Kalivas, P.W.; Massie, A.; Smolders, I.; Methner, A.; Pergande, M.; et al. The cystine/glutamate antiporter system x(c)(-) in health and disease: from molecular mechanisms to novel therapeutic opportunities. Antioxid Redox Signal 2013, 18, 522-555. [CrossRef]
- Lee, J.; Roh, J.L. SLC7A11 as a Gateway of Metabolic Perturbation and Ferroptosis Vulnerability in Cancer. Antioxidants (Basel) 2022, 11. [CrossRef]
- Lin, W.; Wang, C.; Liu, G.; Bi, C.; Wang, X.; Zhou, Q.; Jin, H. SLC7A11/xCT in cancer: biological functions and therapeutic implications. Am J Cancer Res 2020, 10, 3106-3126.
- Wang, C.; Zhou, J.; Wang, S.; Liu, Y.; Long, K.; Sun, T.; Zhi, W.; Yang, Y.; Zhang, H.; Zhao, Y.; et al. Guanxining injection alleviates fibrosis in heart failure mice and regulates SLC7A11/GPX4 axis. J Ethnopharmacol 2023, 310, 116367. [CrossRef]
- Sharbeen, G.; McCarroll, J.A.; Akerman, A.; Kopecky, C.; Youkhana, J.; Kokkinos, J.; Holst, J.; Boyer, C.; Erkan, M.; Goldstein, D.; et al. Cancer-Associated Fibroblasts in Pancreatic Ductal Adenocarcinoma Determine Response to SLC7A11 Inhibition. Cancer Res 2021, 81, 3461-3479. [CrossRef]
- Lv, T.; Fan, X.; He, C.; Zhu, S.; Xiong, X.; Yan, W.; Liu, M.; Xu, H.; Shi, R.; He, Q. SLC7A11-ROS/αKG-AMPK axis regulates liver inflammation through mitophagy and impairs liver fibrosis and NASH progression. Redox Biol 2024, 72, 103159. [CrossRef]
- Yuan, S.; Wei, C.; Liu, G.; Zhang, L.; Li, J.; Li, L.; Cai, S.; Fang, L. Sorafenib attenuates liver fibrosis by triggering hepatic stellate cell ferroptosis via HIF-1α/SLC7A11 pathway. Cell Prolif 2022, 55, e13158. [CrossRef]
- Liu, G.; Wei, C.; Yuan, S.; Zhang, Z.; Li, J.; Zhang, L.; Wang, G.; Fang, L. Wogonoside attenuates liver fibrosis by triggering hepatic stellate cell ferroptosis through SOCS1/P53/SLC7A11 pathway. Phytother Res 2022, 36, 4230-4243. [CrossRef]
- Tsuchida, T.; Friedman, S.L. Mechanisms of hepatic stellate cell activation. Nat Rev Gastroenterol Hepatol 2017, 14, 397-411. [CrossRef]
- Chen, X.; Kang, R.; Kroemer, G.; Tang, D. Broadening horizons: the role of ferroptosis in cancer. Nat Rev Clin Oncol 2021, 18, 280-296. [CrossRef]
- Han, Z.; Batudeligen; Chen, H.; Narisu; Anda; Xu, Y.; Xue, L. Luteolin attenuates CCl4-induced hepatic injury by inhibiting ferroptosis via SLC7A11. BMC Complement Med Ther 2024, 24, 193. [CrossRef]
- Li, W.T.; Jin, X.; Song, S.J.; Wang, C.; Fu, C.; Jiang, W.; Bai, J.; Shi, Z.Z. Blocking SLC7A11 attenuates the proliferation of esophageal squamous cell carcinoma cells. Anim Cells Syst (Seoul) 2024, 28, 237-250. [CrossRef]
- Liu, M.; Wei, X.; Zheng, Z.; Xie, E.; Yu, Q.; Gao, Y.; Ma, J.; Yang, L. AMPK activation eliminates senescent cells in diabetic wound by inducing NCOA4 mediated ferritinophagy. Mol Med 2024, 30, 63. [CrossRef]
- Yu, J.; Zhang, Y.; Zhu, Q.; Ren, Z.; Wang, M.; Kong, S.; Lv, H.; Xu, T.; Xie, Z.; Meng, H.; et al. A mechanism linking ferroptosis and ferritinophagy in melatonin-related improvement of diabetic brain injury. iScience 2024, 27, 109511. [CrossRef]
- Song, X.; Zhu, S.; Chen, P.; Hou, W.; Wen, Q.; Liu, J.; Xie, Y.; Liu, J.; Klionsky, D.J.; Kroemer, G.; et al. AMPK-Mediated BECN1 Phosphorylation Promotes Ferroptosis by Directly Blocking System X(c)(-) Activity. Curr Biol 2018, 28, 2388-2399.e2385. [CrossRef]
- Lin, L.; Li, X.; Li, Y.; Lang, Z.; Li, Y.; Zheng, J. Ginsenoside Rb1 induces hepatic stellate cell ferroptosis to alleviate liver fibrosis via the BECN1/SLC7A11 axis. J Pharm Anal 2024, 14, 100902. [CrossRef]
- Liu, J.; Huang, C.; Liu, J.; Meng, C.; Gu, Q.; Du, X.; Yan, M.; Yu, Y.; Liu, F.; Xia, C. Nrf2 and its dependent autophagy activation cooperatively counteract ferroptosis to alleviate acute liver injury. Pharmacol Res 2023, 187, 106563. [CrossRef]
- Qian, H.; Chao, X.; Williams, J.; Fulte, S.; Li, T.; Yang, L.; Ding, W.X. Autophagy in liver diseases: A review. Mol Aspects Med 2021, 82, 100973. [CrossRef]
- Cao, Y.; Mai, W.; Li, R.; Deng, S.; Li, L.; Zhou, Y.; Qin, Q.; Zhang, Y.; Zhou, X.; Han, M.; et al. Macrophages evoke autophagy of hepatic stellate cells to promote liver fibrosis in NAFLD mice via the PGE2/EP4 pathway. Cell Mol Life Sci 2022, 79, 303. [CrossRef]
- Meng, D.; Li, Z.; Wang, G.; Ling, L.; Wu, Y.; Zhang, C. Carvedilol attenuates liver fibrosis by suppressing autophagy and promoting apoptosis in hepatic stellate cells. Biomed Pharmacother 2018, 108, 1617-1627. [CrossRef]
- Huang, F.; Ding, G.; Yuan, Y.; Zhao, L.; Ding, W.; Wu, S. PTEN Overexpression Alters Autophagy Levels and Slows Sodium Arsenite-Induced Hepatic Stellate Cell Fibrosis. Toxics 2023, 11. [CrossRef]
- Mukhopadhyay, S.; Biancur, D.E.; Parker, S.J.; Yamamoto, K.; Banh, R.S.; Paulo, J.A.; Mancias, J.D.; Kimmelman, A.C. Autophagy is required for proper cysteine homeostasis in pancreatic cancer through regulation of SLC7A11. Proc Natl Acad Sci U S A 2021, 118. [CrossRef]
- Ke, Y.; Chen, X.; Su, Y.; Chen, C.; Lei, S.; Xia, L.; Wei, D.; Zhang, H.; Dong, C.; Liu, X.; et al. Low Expression of SLC7A11 Confers Drug Resistance and Worse Survival in Ovarian Cancer via Inhibition of Cell Autophagy as a Competing Endogenous RNA. Front Oncol 2021, 11, 744940. [CrossRef]
- Jiang, L.; Kon, N.; Li, T.; Wang, S.J.; Su, T.; Hibshoosh, H.; Baer, R.; Gu, W. Ferroptosis as a p53-mediated activity during tumour suppression. Nature 2015, 520, 57-62. [CrossRef]
- Wang, S.J.; Ou, Y.; Jiang, L.; Gu, W. Ferroptosis: A missing puzzle piece in the p53 blueprint? Mol Cell Oncol 2016, 3, e1046581. [CrossRef]
- Lee, H.; Zandkarimi, F.; Zhang, Y.; Meena, J.K.; Kim, J.; Zhuang, L.; Tyagi, S.; Ma, L.; Westbrook, T.F.; Steinberg, G.R.; et al. Energy-stress-mediated AMPK activation inhibits ferroptosis. Nat Cell Biol 2020, 22, 225-234. [CrossRef]
- Han, D.; Jiang, L.; Gu, X.; Huang, S.; Pang, J.; Wu, Y.; Yin, J.; Wang, J. SIRT3 deficiency is resistant to autophagy-dependent ferroptosis by inhibiting the AMPK/mTOR pathway and promoting GPX4 levels. J Cell Physiol 2020, 235, 8839-8851. [CrossRef]
Figure 1.
Expression of fluorescence in LX-2 cells infected with sh-SLC7A11 lentivirus vector. under fluorescence microscopy.
Figure 1.
Expression of fluorescence in LX-2 cells infected with sh-SLC7A11 lentivirus vector. under fluorescence microscopy.
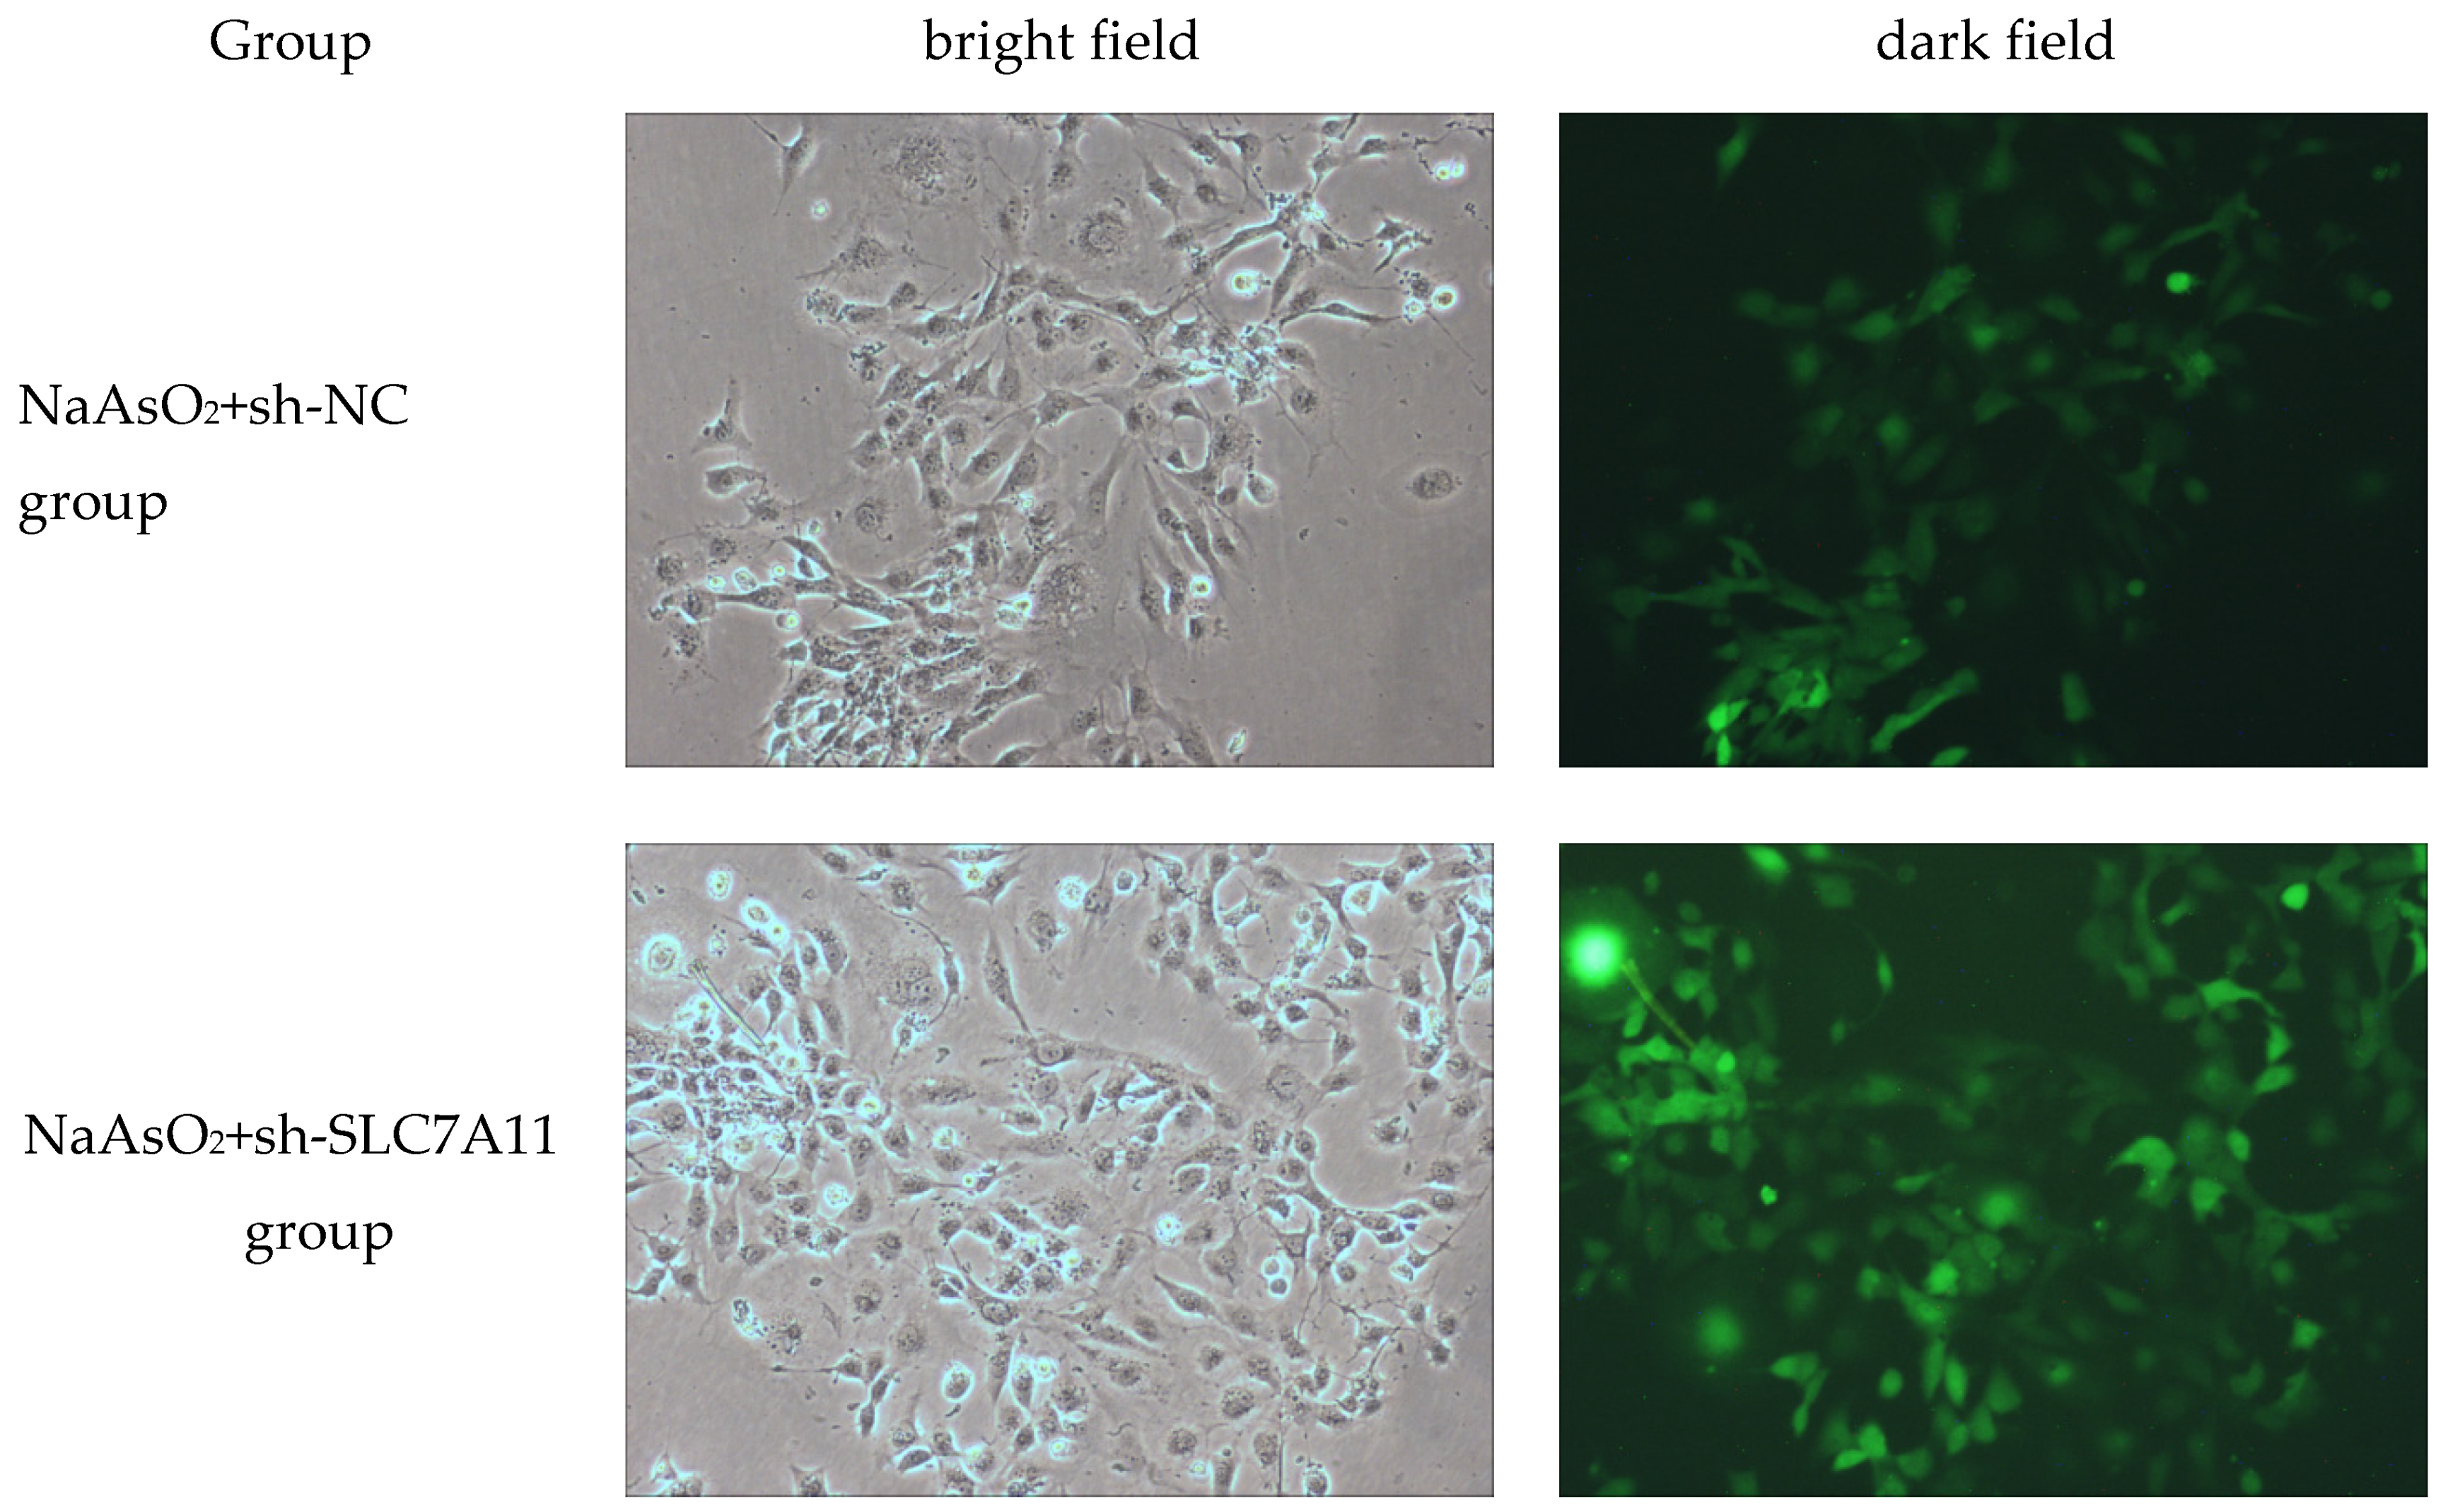
Figure 2.
Relative protein levels of SLC7A11 in LX-2 cells after silencing SLC7A11 (n=3). Note: Figure 2A) Protein banding pattern, lanes 1-4 represent the blank control group, NaAsO2 group, NaAsO2+sh-NC group, and NaAsO2+sh-SLC7A11 group, respectively; Figure 2B) Relative expression levels of SLC7A11 protein, a: Compared with the blank control group, P<0.05; b: Compared with the NaAsO2 group, P<0.05; c: Compared with the NaAsO2+sh-NC group, P<0.05.
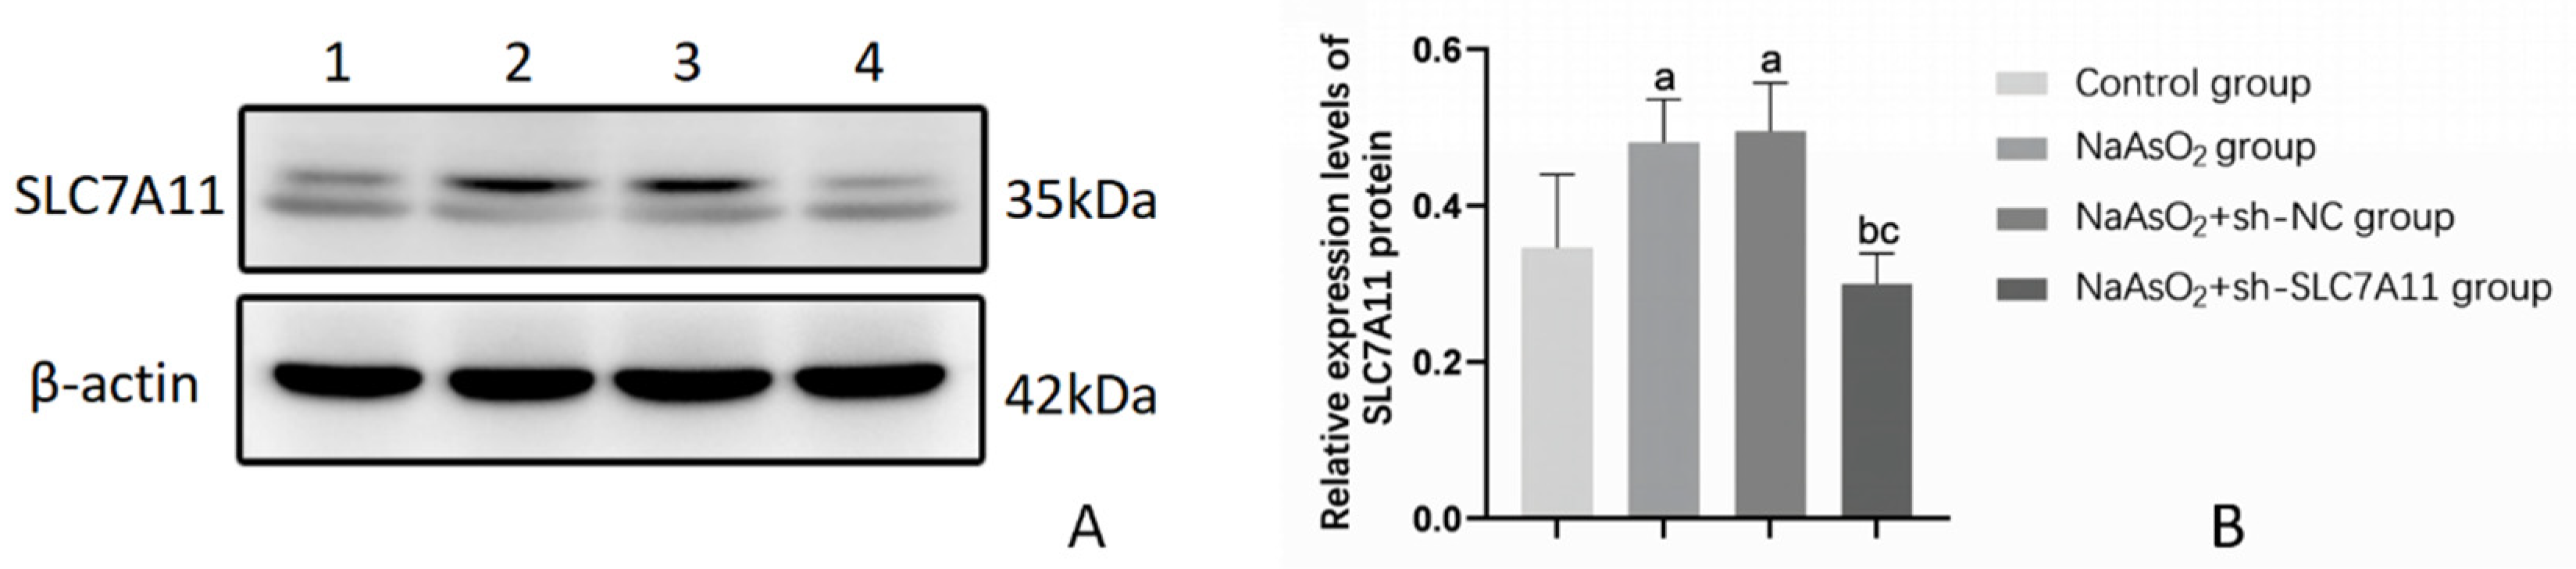
Figure 3.
Protein levels of FAP and α-SMA in LX-2 cells after silencing SLC7A11 (n=3). Note: Figure 3A) Protein banding pattern, lanes 1-4 represent the blank control group, NaAsO2 group, NaAsO2+sh-NC group, and NaAsO2+sh-SLC7A11 group, respectively; Figure 3B) Relative expression levels of FAP and α-SMA protein, a: Compared with the blank control group, P<0.05; b: Compared with the NaAsO2 group, P<0.05; c: Compared with the NaAsO2+sh-NC group, P<0.05.

Figure 4.
FerroOrange fluorescent probe detect Fe2+.
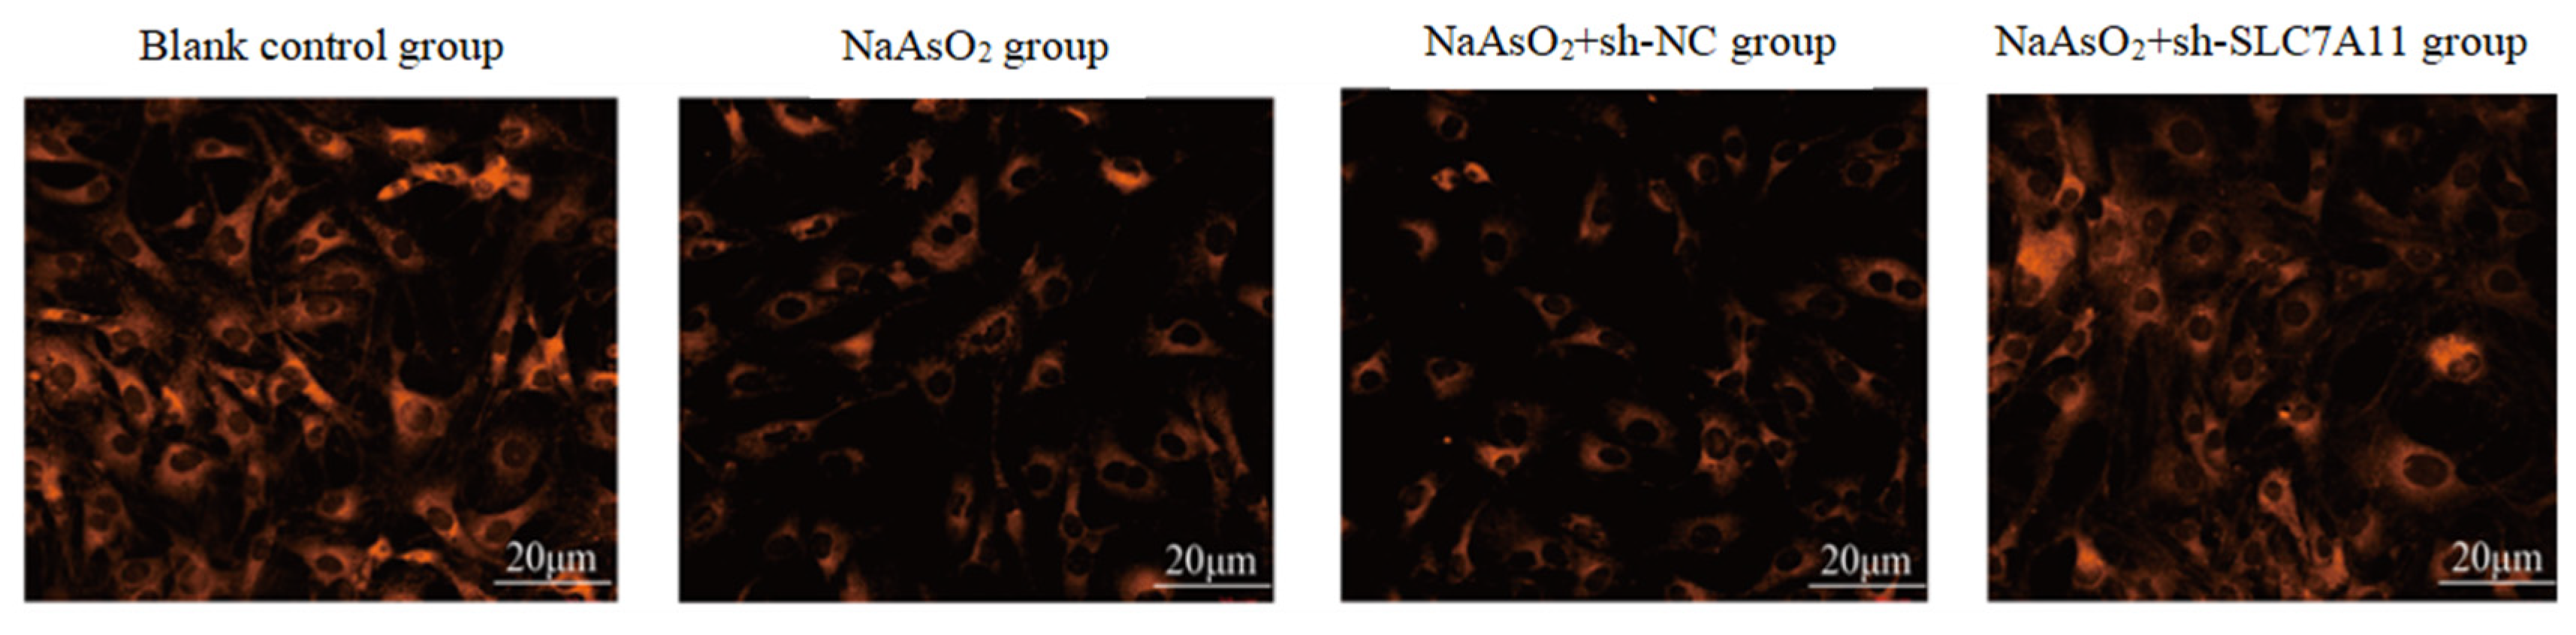
Figure 5.
Histogram of FerroOrange fluorescence intensity. Note: a: Compared with the blank control group, P<0.05; b: Compared with the NaAsO2 group, P<0.05; c: Compared with the NaAsO2+sh-NC group, P<0.05.
Figure 5.
Histogram of FerroOrange fluorescence intensity. Note: a: Compared with the blank control group, P<0.05; b: Compared with the NaAsO2 group, P<0.05; c: Compared with the NaAsO2+sh-NC group, P<0.05.
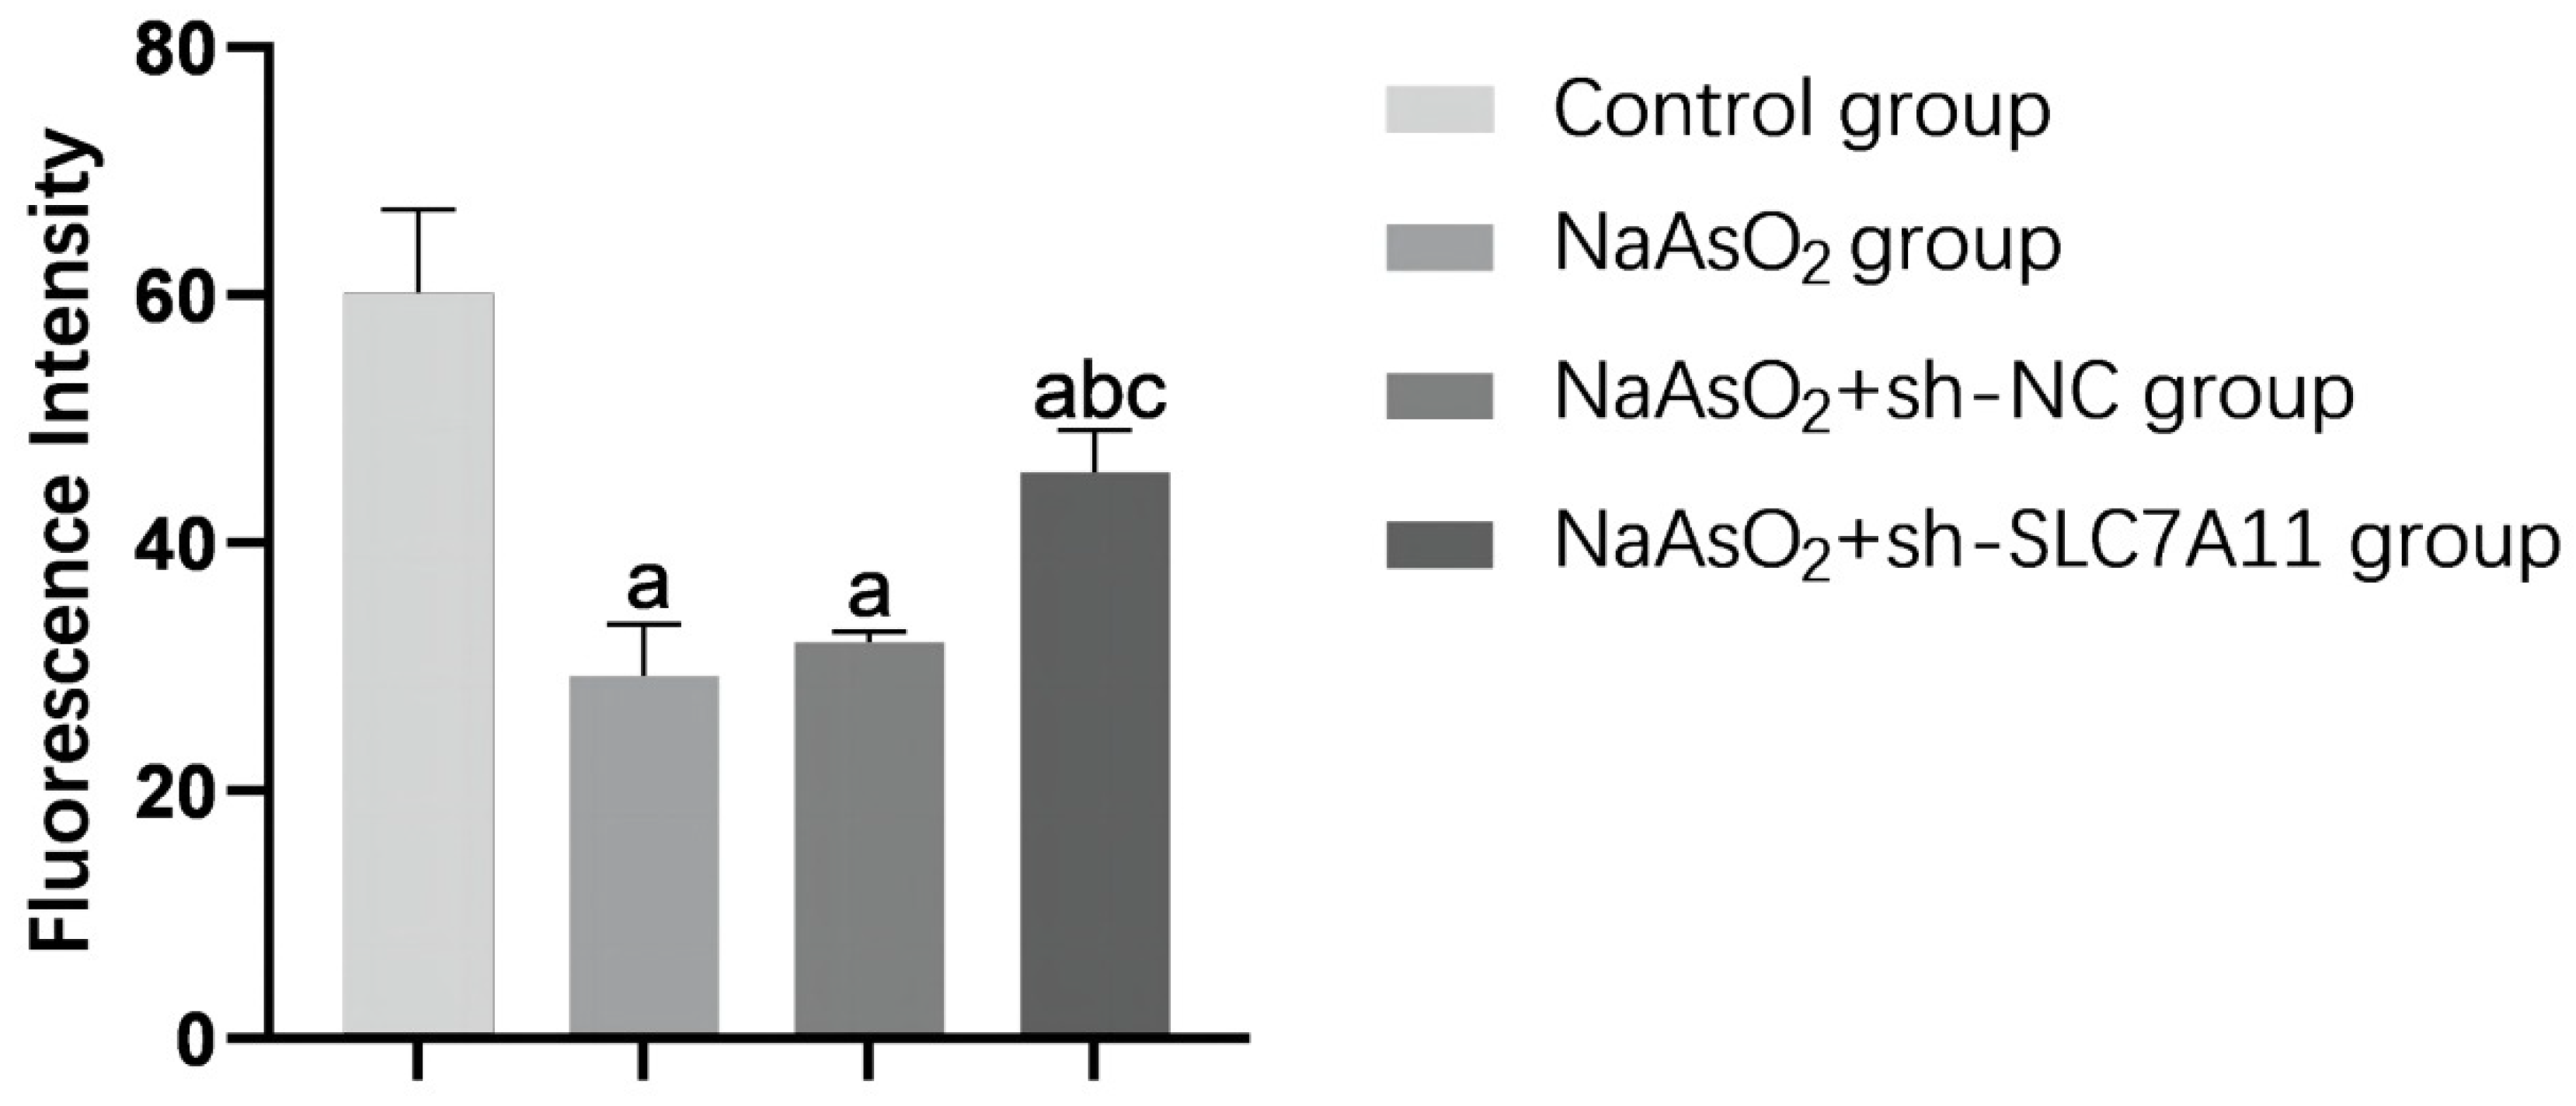
Figure 6.
Protein levels of NCOA4 in LX-2 cells after silenceing SLC7A11 (n=3). Note: Figure 6A) Protein banding pattern, lanes 1-4 represent the blank control group, NaAsO2 group, NaAsO2+sh-NC group, and NaAsO2+sh-SLC7A11 group, respectively; Figure 6B) Relative expression levels of NCOA4 protein, a: Compared with the blank control group, P<0.05; b: Compared with the NaAsO2 group, P<0.05; c: Compared with the NaAsO2+sh-NC group, P<0.05.
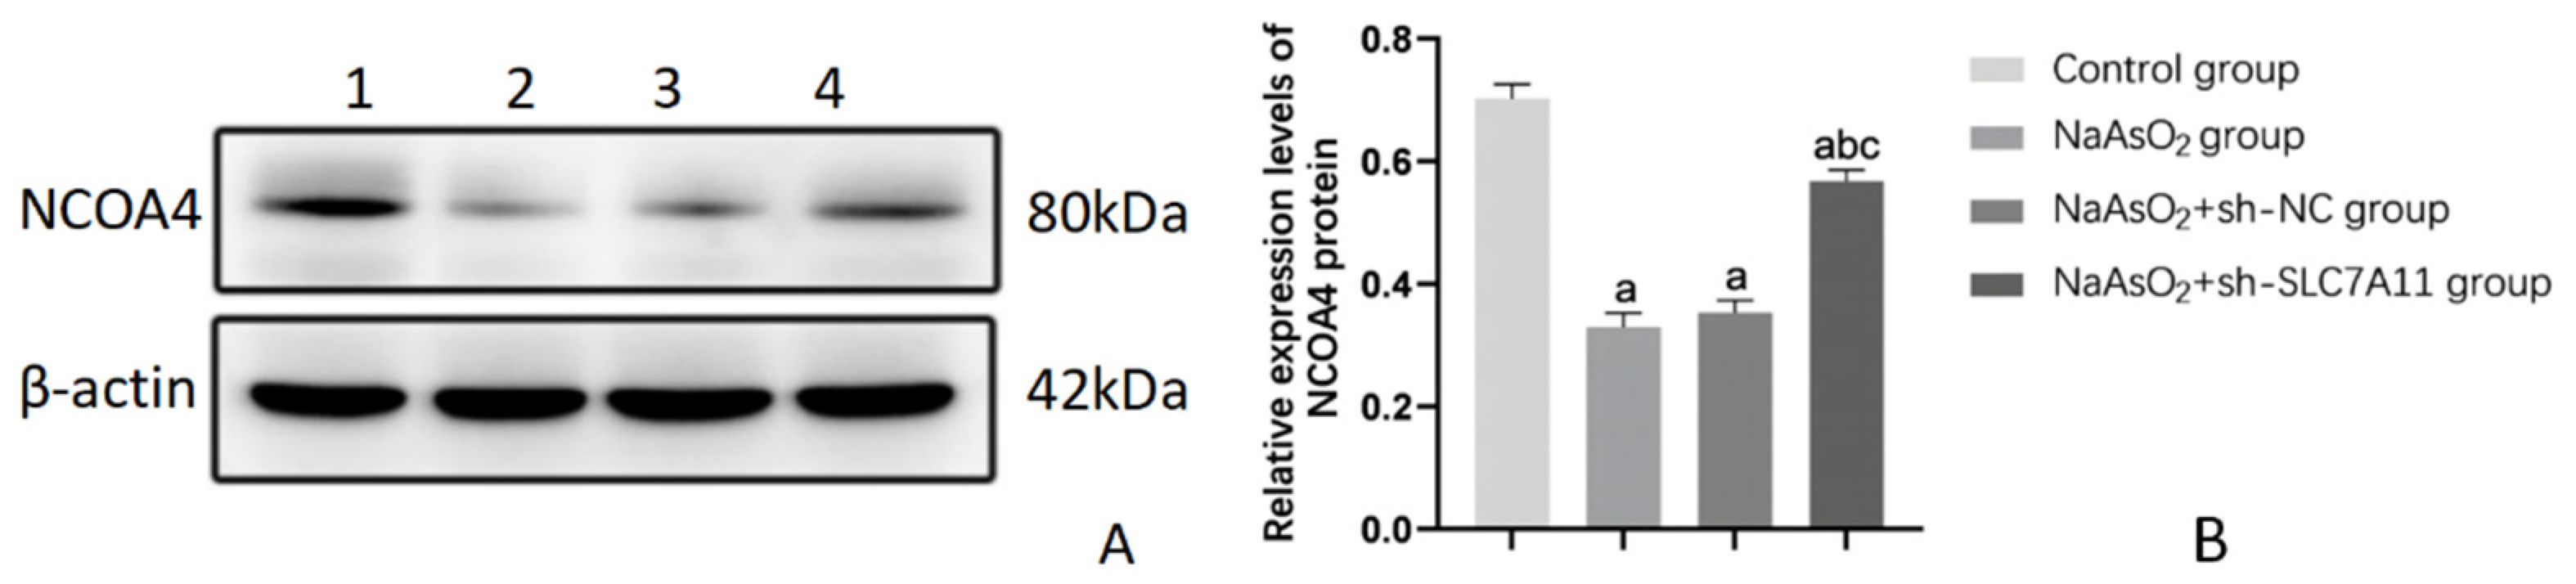
Figure 7.
IP analysis of Beclin1-SLC7A11 formation in the indicated cells following 5 μmol/L NaAsO2 treatment for 72 h.
Figure 7.
IP analysis of Beclin1-SLC7A11 formation in the indicated cells following 5 μmol/L NaAsO2 treatment for 72 h.
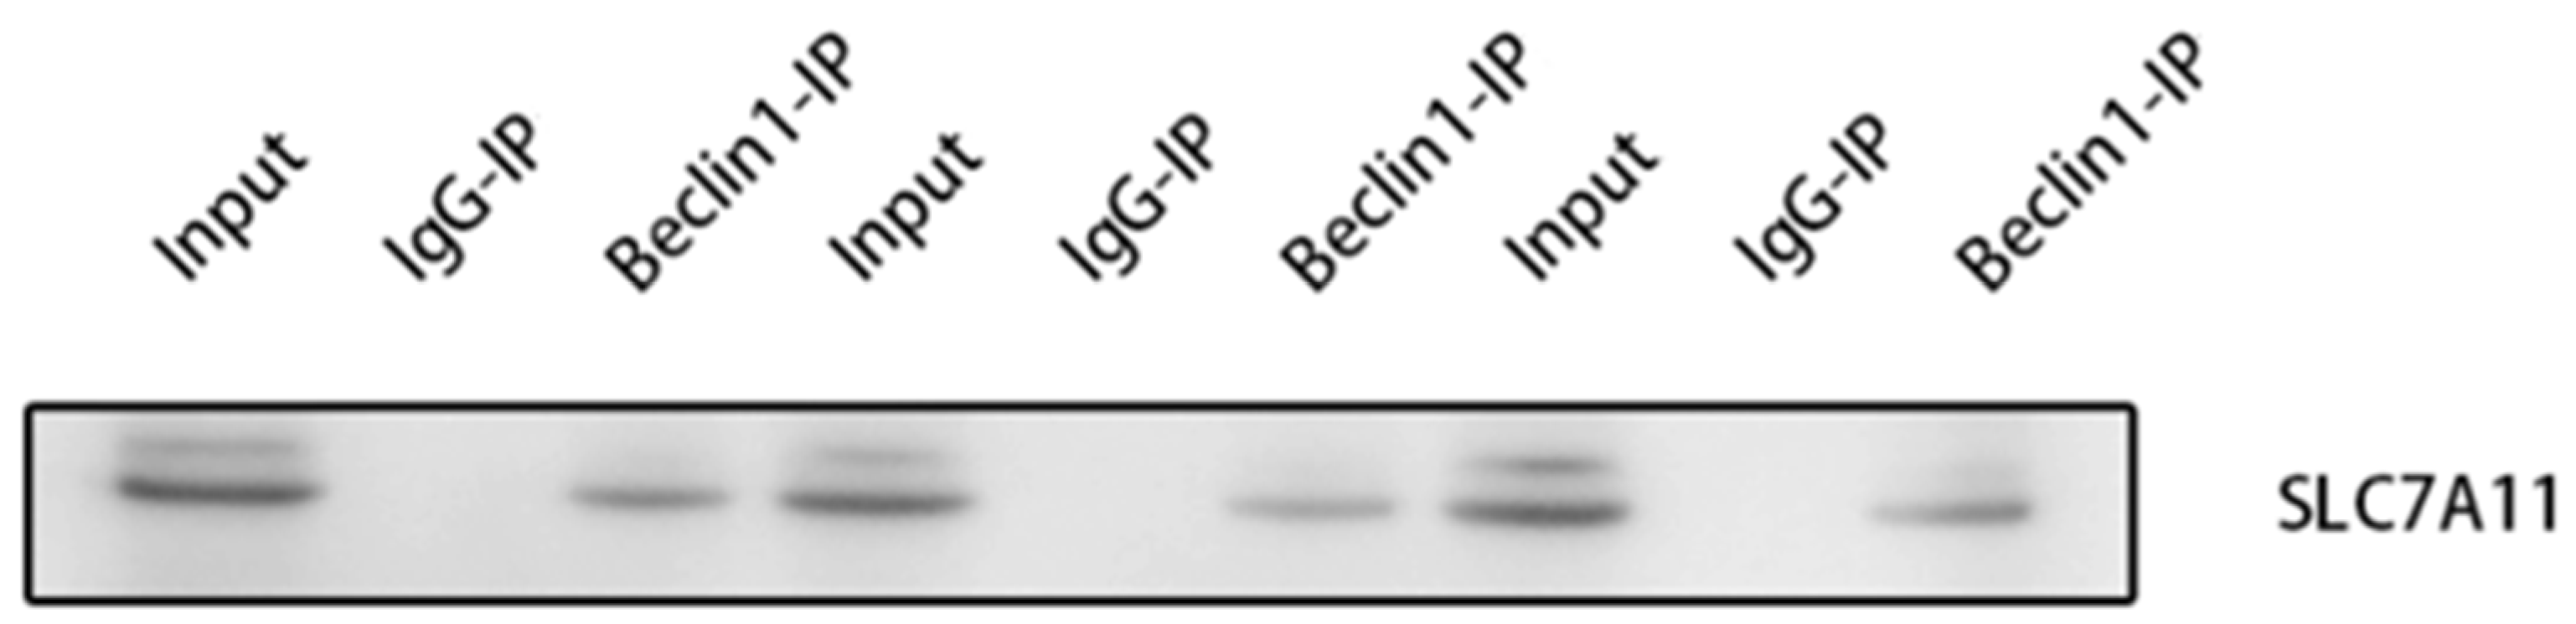
Figure 8.
The effect of SLC7A11 silencing on the Beclin1 and P53/AMPK/mTOR pathway related proteins in LX-2 cells (n=3). Note: Figure 8A) Protein banding pattern, lanes 1-4 represent the blank control group, NaAsO2 group, NaAsO2+sh-NC group, and NaAsO2+sh-SLC7A11 group, respectively; Figure 11B) Relative expression levels of Beclin1, P53, p-AMPK, and p-mTOR proteins, a: Compared with the blank control group, P<0.05; b: Compared with the NaAsO2 group, P<0.05; c: Compared with the NaAsO2+sh-NC group, P<0.05.
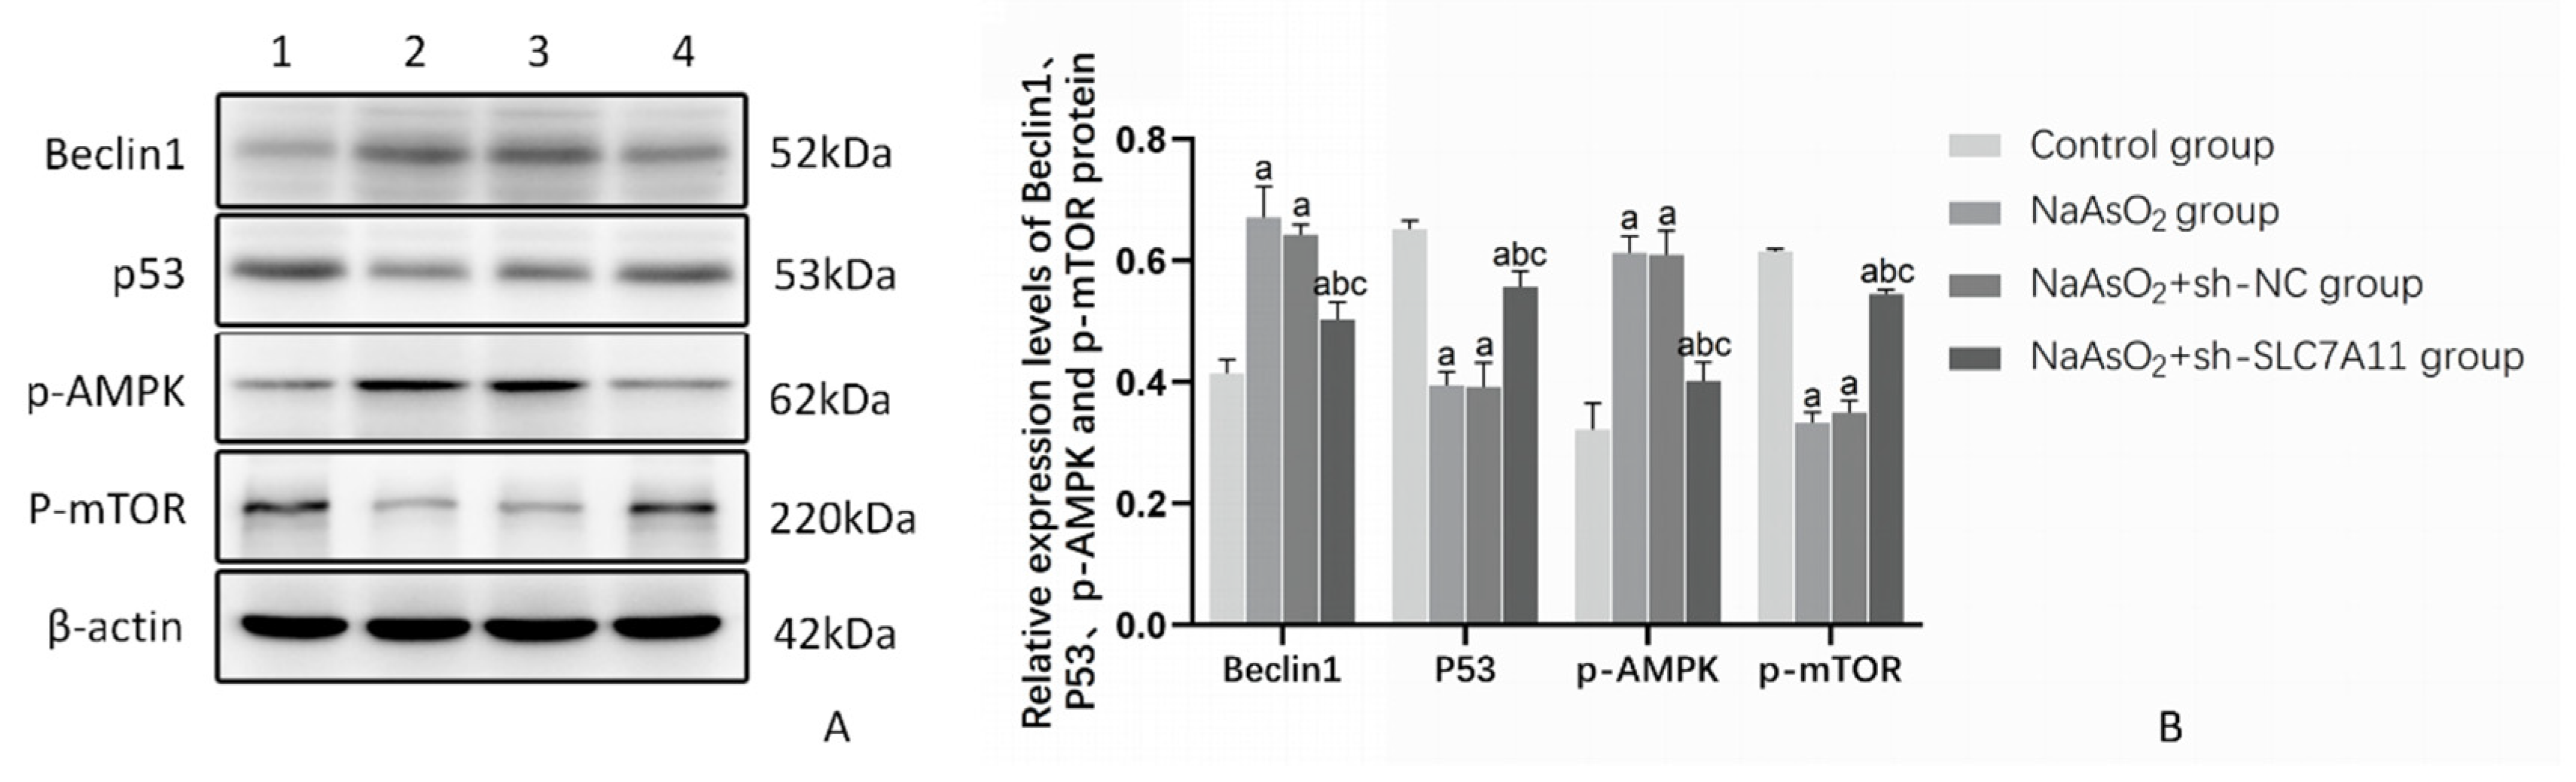

Table 1.
Protein levels of SLC7A11 in LX-2 cells after sh-SLC7A11 lentiviru infection (n=3).
| Group | SLC7A11 |
|---|---|
| Blank control group | 0.346±0.094 |
| NaAsO2 group | 0.481±0.055a |
| NaAsO2+sh-NC group | 0.495±0.062a |
| NaAsO2+sh-SLC7A11 group | 0.300±0.039 bc |
| F | 6.612 |
| P | <0.05 |
Note: a: Compared with the blank control group, P<0.05; b: Compared with the NaAsO2 group, P<0.05; c: Compared with the NaAsO2+sh-NC group, P<0.05.
Table 2.
Protein levels of FAP and α-SMA in LX-2 cells after silencing SLC7A11 (n=3).
| Group | FAP | α-SMA |
|---|---|---|
| Blank control group | 0.319±0.033 | 0.295±0.016 |
| NaAsO2 group | 0.532±0.065a | 0.611±0.018a |
| NaAsO2+sh-NC group | 0.543±0.054a | 0.578±0.030a |
| NaAsO2+sh-SLC7A11 group | 0.425±0.038abc | 0.354±0.063bc |
| F | 13.544 | 56.141 |
| P | <0.05 | <0.001 |
Note: a: Compared with the blank control group, P<0.05; b: Compared with the NaAsO2 group, P<0.05; c: Compared with the NaAsO2+sh-NC group, P<0.05.
Table 3.
The levels of Fe2+ and NCOA4 in LX-2 cells after silencing SLC7A11(n=3).
| Group | Fe2+ | NCOA4 |
|---|---|---|
| Blank control group | 60.140±6.734 | 0.702±0.024 |
| NaAsO2 group | 29.223±4.241a | 0.330±0.022a |
| NaAsO2+sh-NC group | 31.940±0.866a | 0.353±0.020a |
| NaAsO2+sh-SLC7A11 group | 45.670±3.399 abc | 0.568±0.018abc |
| F | 32.082 | 218.524 |
| P | <0.001 | <0.001 |
Note: a: Compared with the blank control group, P<0.05; b: Compared with the NaAsO2 group, P<0.05; c: Compared with the NaAsO2+sh-NC group, P<0.05.
Table 4.
The effect of SLC7A11 silencing on the expression of Beclin1 and P53/AMPK/mTOR pathway related proteins in LX-2 cells (n=3).
Table 4.
The effect of SLC7A11 silencing on the expression of Beclin1 and P53/AMPK/mTOR pathway related proteins in LX-2 cells (n=3).
| Group | Beclin1 | P53 | p-AMPK | p-mTOR |
|---|---|---|---|---|
| Blank control group | 0.414±0.023 | 0.652±0.014 | 0.322±0.043 | 0.615±0.004 |
| NaAsO2 group | 0.671±0.051a | 0.394±0.023a | 0.613±0.027a | 0.333±0.017a |
| NaAsO2+sh-NC group | 0.643±0.016a | 0.392±0.040a | 0.610±0.039a | 0.350±0.020a |
| NaAsO2+sh-SLC7A11 group | 0.503±0.029 abc | 0.557±0.025abc | 0.402±0.030abc | 0.545±0.007abc |
| F | 41.354 | 66.256 | 52.181 | 325.502 |
| P | <0.001 | <0.001 | <0.001 | <0.001 |
Note: a: Compared with the blank control group, P<0.05; b: Compared with the NaAsO2 group, P<0.05; c: Compared with the NaAsO2+sh-NC group, P<0.05.
Disclaimer/Publisher’s Note: The statements, opinions and data contained in all publications are solely those of the individual author(s) and contributor(s) and not of MDPI and/or the editor(s). MDPI and/or the editor(s) disclaim responsibility for any injury to people or property resulting from any ideas, methods, instructions or products referred to in the content. |
© 2024 by the authors. Licensee MDPI, Basel, Switzerland. This article is an open access article distributed under the terms and conditions of the Creative Commons Attribution (CC BY) license (http://creativecommons.org/licenses/by/4.0/).
Copyright: This open access article is published under a Creative Commons CC BY 4.0 license, which permit the free download, distribution, and reuse, provided that the author and preprint are cited in any reuse.


