Submitted:
12 June 2024
Posted:
13 June 2024
You are already at the latest version
Abstract
Emission trading schemes (ETSs) have become vital tools in striving toward global emission reduction objectives and promoting a sustainable economy. This paper empirically investigates the impact of market conditions on interconnectedness within precious metals, clean energy, green bonds, and carbon markets, focusing on China and the EU ETSs as the study subjects. A TVP-VAR-based asymmetric connectedness approach is adopted to capture the evolving relationships between the variables of interest in the time–frequency domain. The empirical findings reveal that: First, time-varying asymmetric connectedness and spillover effects among clean energy, precious metals, green bonds, and carbon markets are identified in both time and frequency domains under diverse market conditions, with long-term connectedness asymmetry being particularly sensitive, although spillovers exhibit variations. Second, the role and intensity of net transmitters or receivers vary across market conditions and frequency domains, indicating the complex and nuanced nature of market interactions. The EU ETS demonstrates a higher level of connectivity with global markets for clean energy, precious metals, and green bonds when compared to the Chinese ETS. However, it also shows greater susceptibility to fluctuations in market conditions. These results have significant implications for both investors striving to build sustainable diversified portfolios and regulators endeavoring to craft effective policies for risk regulation and sustainable development.
Keywords:
spillover effects
; carbon emission
; energy market
; sustainability
; financial market stability
; climate change
1. Introduction
As we entered the 21st century, climate change has not only increased the incidence of natural calamities (including tropical cyclones, ocean acidification, extreme temperatures, storm surges, landslides, and glacial melting) but has also presented significant challenges to global responses, including investor sentiment and regulatory policies on carbon emissions (Bolton & Kacperczyk, 2021; Duan et al., 2022). Numerous governments and organizations have endeavored to implement carbon markets as part of their strategies to address climate change sustainably. ETS, recognized as a market-driven policy tool aimed at mitigating greenhouse gas emissions, has been promoted by an expanding array of nations and regions (ICAP, 2024).
Initiated in 2005, the EU ETS stands as the first international carbon market worldwide, claiming to have the most extensive array of participating nations (Ao et al., 2023; Hartvig et al., 2023). It has evolved into the world’s largest by monetary value, second-biggest by regulated emissions, and possibly the most sophisticated ETS through international carbon market cooperation (Bai & Okullo, 2023). Besides, China, recognized as the world’s largest energy consumer and carbon emitter, has actively pursued market mechanisms to mitigate its carbon emissions (Maheen et al., 2023; Deng et al., 2023). China faces the dual challenge of meeting international emission reduction commitments while addressing domestic needs for sustainable development and environmental protection. This requires mitigating global carbon emissions and tackling internal environmental and economic issues arising from extensive energy consumption (Li et al., 2020). In 2013, China initiated carbon trading pilot programs in eight regions, namely Shenzhen, Shanghai, Beijing, Guangdong, Tianjin, Hubei, Fujian, and Chongqing (Lin & Zhang, 2022; Yu et al., 2023). Notably, the 2014 initiation of the EU–China ETS Project signified pivotal collaboration between the EU and China in tackling carbon emissions. In 2021, China formally instituted a unified national ETS, representing a major step in enforcing its carbon emission regulations (Xu & Salem, 2021; Chen et al., 2023a). Forecasts by Li et al. (2019) and the IEA (2020) anticipate that the Chinese ETS could become the world’s largest once fully operational, potentially exceeding the scale of the EU ETS. Additionally, the convergence of these jurisdictions may lead to a joint market, capitalizing on their historical interaction. The establishment of a China–EU ETS linkage would mark a significant milestone in global cooperation on climate change (Wang et al., 2024a). Therefore, it also underscores the pressing demand for research on dynamics between the Chinese and the EU ETSs to facilitate a joint ETS.
Carbon trading has evolved into more than just a means of mitigating carbon emissions and facilitating sustainability. It has also emerged as a financial instrument that attracts a diverse range of investors and facilitates interaction with other capital markets. This shift is driven by globalization and the increasing financialization of carbon (Zhu et al., 2019; Wu et al., 2020). Recent researches show an increasing linkage between carbon markets and various financial markets, including energy, metals, and green bonds markets (Duan et al., 2021; Jiang & Chen, 2022; Liu et al., 2023). Consequently, the interconnectedness of these markets facilitates the swift transmission of risks, leading to contagion and an escalation of systemic risk. Intuitively, both energy consumption and industrial metal usage contribute to an increase in carbon emissions. As a financial tool for mobilizing capital for green transitions and sustainable development, green bonds are experiencing robust growth globally, particularly in China. The existence of green bonds can foster the adoption of emerging green technologies and reinforce the objective of transitioning towards a sustainable and decarbonized economy (Monasterolo & Raberto, 2018; Mishra et al., 2023). There is a substantial amount of ongoing interest in researching risk spillover effects in the green bonds market because of the industry’s increasing liquidity and improved exchange of information with other financial markets. (Dai et al., 2023; Wei et al., 2023a; Umar et al., 2024). Besides, while studies typically concentrate on ETS within single regions, predominantly the EU (Zheng et al., 2022; Guo et al., 2023; Wang et al., 2024b), it’s imperative to explore interactions between EU and Chinese ETSs due to their profound significance and in the future the global nature of climate change. Thus, thoroughly examining interconnectivity and risk transmission within these four markets is crucial. Additionally, analyzing the differential risk spillovers of the Chinese and EU ETSs when interacting with the other three markets is essential for formulating risk mitigation policies and advancing sustainability.
Motivated by the above, we utilize an asymmetric connectedness approach based on time-varying parameter vector autoregression (TVP-VAR) to construct a clean energy-precious metal-green bond-carbon system and analyze asymmetric spillover effects in both the time and frequency domains. This research reveals intriguing findings. First, the study reveals time-varying asymmetric spillover effects among clean energy, precious metals, green bonds, and carbon markets, evident in both time and frequency domains, with a notable sensitivity to long-term connectedness asymmetry, yet the spillover asymmetry demonstrates variability. Second, it highlights the varying role and intensity of net transmitters or receivers across market conditions and frequency domains, indicating the intricate nature of market interactions. Third, the EU ETS demonstrates stronger integration with global clean energy, precious metals, and green bonds markets compared to Chinese carbon markets, with roles fluctuating across time, frequency, and market conditions.
This paper primarily contributes and innovates in the following three areas: First, this study develops a comprehensive analytical framework encompassing clean energy, precious metals, green bonds, and carbon markets. It systematically investigates the risk transmission among these sustainability-related markets, offering a novel perspective for stability and sustainability research. Second, the paper introduces the asymmetric TVP-VAR connectedness approach to carbon market research in both the time and frequency domains. To the best of our knowledge, no study has addressed asymmetry in the frequency domain within such a system. Thirdly, this paper undertakes a comparison of ETSs in the EU and China, pinpointing key distinctions and providing valuable insights to propel advancements in sustainability-related markets.
2. Literature Review
Environmental sustainability and financial market stability are of interest to policymakers and market regulators in existing literature (Yu et al., 2024a). This interest has intensified following the 2008 global financial crisis and the escalating degradation of the global environment in recent decades. The spillover effect among these diverse markets has become intertwined to an unprecedented extent due to escalated systemic risk. Mohamad Taghvaee et al. (2022) and Liang et al. (2024) present a new perspective on integrated sustainability by incorporating the sustainability of spillover effects into the traditional pillars of social, environmental, and economic aspects. Specifically, the academic community is increasingly focusing on the differences between traditional and sustainable assets from a financial aspect, as discussed by Duan et al. (2023). Additionally, Liu et al. (2023b) have demonstrated that sustainable investment strategies that incorporate sustainability elements can mitigate spillover effects across various financial markets. Meanwhile, studies by Iqbal et al. (2022) and Zhang et al. (2022) explore the financial contagion among sustainability-related markets.
Extensive research related to risk spillovers concerning carbon markets has been undertaken with a notable focus on energy markets (Xu, 2021; Tiwari et al., 2022; Hwang et al., 2023) and metals (Chen et al., 2022b; Zhou et al., 2022). Some studies have explored both pairwise spillover dynamics between these three markets (Hanif et al., 2021; Yahya et al., 2023; Li et al., 2023) and analyses involving all three simultaneously (Zhou et al., 2022; Jiang & Chen, 2022b). The connectedness is intricate and varied with short-term connectedness being the primary contributor (Adekoya et al., 2021; Wu et al., 2022). Some studies identify carbon markets as recipients (Jiang et al., 2023; Wang et al., 2024b), while others emphasize their role as spillover net transmitters (Ding et al., 2022; Su et al., 2023). Additionally, research by Ding et al. (2022) and Liu et al. (2023a) indicates that the carbon market’s nature may evolve over time. In addition, Lyu & Scholtens (2024) identify specific non-recurring major events and propose that carbon market spillovers are susceptible to such occurrences.
Remarkably, the prevailing literature has extensively investigated the reciprocal relationship and risk spillover effects between carbon and green bonds markets. Tiwari et al. (2022) and Guo et al. (2023) posit green bonds as net receivers, while Wu & Qin (2024) propose them as net transmitters. However, very limited research has paid attention to the relationship between the green bonds market and the energy or metal markets (Zhang et al., 2023a; Chen et al., 2023b). Hence, considering the hedging effect of green bonds and the impact of green finance on conventional industries, there emerges a research gap in thoroughly examining risk spillover across these four markets.
Building on the aforementioned literature, we posit the first hypothesis:
Hypothesis 1.
The risk spillover effects between the carbon market and clean energy, precious metals, and green bonds markets demonstrate time-varying dynamics and undergo significant changes during major events in both the time and frequency domains.
Asymmetry is currently a prominent topic of interest in market risk spillovers. Studies explore the asymmetry of risk spillovers in the time domain and demonstrate that this asymmetry has a strong time-varying feature, especially when subjected to major event shocks (Zeng et al., 2021; Wang et al., 2023). For instance, Wu & Qin (2024) demonstrate varied asymmetry directions across carbon, clean energy, and green bonds markets in China. Negative spillovers to clean energy markets dominate, while positive spillovers to carbon and green bonds markets surpass negative ones. Furthermore, Wu & Jiang (2023) noted a pronounced increase in positive spillovers between clean energy and Chinese carbon markets compared to negative ones during the Sino–U.S. trade conflict and the COVID-19 pandemic. Conversely, the Russia–Ukraine conflict exhibits a more notable rise in negative spillovers than positive ones. Qiao et al. (2023) have uncovered dynamic asymmetry between the EU ETS and the nonrenewable energy market. Additionally, comparative research conducted by Gao et al. (2023) mentions that the EU ETS displays more significant asymmetry over time compared to the Chinese ETS.
Despite these insights within the time domain, a research gap exists regarding the investigation of asymmetries across diverse frequencies (short, medium, and long term) and their disparities compared to the time domain as Furuoka et al. (2023) indicate the asymmetry are varied in the short and long run. The asymmetry literature predominantly centers on the Chinese carbon and energy markets, with scant attention given to metals and green bonds. Moreover, there’s a dearth of comparative studies scrutinizing the variance in asymmetry between the Chinese and EU ETSs.
Consequently, we put forward the second hypothesis:
Hypothesis 2.
The risk spillovers between ETS in the EU or China, and clean energy, precious metal, and green bonds markets show time-varying asymmetry in both the time and frequency domains, exhibiting consistent characteristics. In comparison to normal spillovers, bad spillovers are intensified, while good spillovers are weakened.
Comparative studies on carbon markets, particularly the EU and Chinese ETS, have gained substantial academic interest (Sun et al., 2020; Wang & Dou, 2023; Zhang et al., 2023b). Lyu & Scholtens (2024) propose that the integration of the international carbon markets is weak and the EU ETS continues to be a net transmitter. Dong et al. (2024) find that the Chinese carbon market displays notable, imbalanced spillover effects, and tends to be a net receiver. Guo & Feng (2021) suggest that the spillover effects among Chinese carbon emissions trading pilots are relatively constrained. Although there are regional differences, according to Wang et al. (2024a), China typically demonstrates higher levels of liquidity and lower volatility compared to the EU. However, they note that the interconnectedness between the Chinese and EU ETSs is relatively low. On the other hand, Gao et al. (2023) suggest that the EU ETS is riskier compared to the Chinese ETS but exhibits more stable prices. Additionally, they find that the Chinese carbon market is less responsive to changes in uncertainty compared to its European counterpart.
In terms of spillovers between the carbon market and the energy market, Liu et al. (2023) and Ding et al. (2022) note that the EU ETS experiences a shift from being a net risk receiver to becoming a transmitter. The energy market, crucial for the global economy, includes both traditional sources (e.g., coal, oil, natural gas) and a shift towards cleaner, sustainable options like solar and wind power. Hanif et al. (2021) establish that in the EU ETS-renewable energy system, the carbon market mainly receives spillovers from clean energy indices. Meanwhile, Wu et al. (2022) find that the Chinese ETS receives negative risk spillovers from non-renewable energy markets. In the Chinese ETS, clean energy is emphasized by Xu (2021) as the main source of risk spillovers, while Tiwari et al. (2022) identify clean energy as a net transmitter of shocks in the EU ETS. Moreover, Xu (2021) further notes regional differences in spillovers within China, highlighting Shenzhen as more affected than Hubei markets. Notably, Jiang et al. (2023) consider both clean and non-renewable energy, highlighting that within Chinese carbon markets, non-renewable energy operates as a net recipient, while clean energy emerges as the primary transmitter.
Carbon dioxide emissions in the metal industry predominantly stem from energy consumption during production, significantly impacting economic sustainability. Metal market spillover effects are often studied alongside energy market spillovers. Zhou et al. (2022) emphasize significant risk spillovers among energy, nonferrous metal, and carbon markets, marked by dynamic features. Chen et al. (2022b) identify heterogeneous spillover effects across these markets, focusing on the EU ETS as their study subject. Jiang & Chen (2022a) assert that metal markets, particularly copper and silver, hold greater explanatory power for fluctuations in the Chinese carbon market. Meanwhile, Chen et al. (2023b) indicate a strong connection between China’s nonferrous metal and green bonds markets, showing no clear asymmetry under extreme market conditions. Moreover, even in extreme market conditions, Chinese green bonds provide nonferrous metal and crude oil futures portfolios with modest hedging benefits that remain stable across a range of allocation strategies. While Wang et al. (2023) and Wu & Qin (2024) contend that green bonds function as risk transmitters from the perspectives of the EU ETS and the Chinese market, respectively, Tiwari et al. (2022) propose that green bonds are net receivers from clean energy within the EU ETS perspective.
Therefore, we ultimately present the hypothesis:
Hypothesis 3.
The EU ETS exhibits stronger connections with other markets than the Chinese ETS, accompanied by more pronounced and volatile spillovers. Additionally, it displays greater time-varying asymmetry across both time and frequency domains.
As for methodology, current research predominantly utilizes copula (Xu, 2021), GARCH (Zeng et al., 2021; Wu & Jiang, 2023; Yu et al., 2024b), and VAR (Chen et al., 2022b; Song et al., 2022; Wang et al., 2023) based models for assessing financial market spillovers, yet the former two methods cannot capture dynamics across various frequency domains. Additionally, amidst heightened global economic uncertainty, comprehending the intricate, non-linear interplay between carbon and financial markets is paramount. The spillover index method, employing a constant coefficient linear VAR model, faces challenges in elucidating spillover effects and dynamic evolution across diverse markets (You et al., 2024). In contrast, to overcome these shortcomings, the widely adopted TVP-VAR model with DY or BK methods in our paper excels in analyzing time-varying connectedness in both time and frequency domains (Guo et al., 2023; Jiang et al., 2023; Meng et al., 2023).
3. Data
For the precious metals market, we utilize the S&P Global Precious Metals Index (Vn & Bo, 2022). For the clean energy market, this study uses the S&P Global Clean Energy Index (Reboredo & Ugolini, 2020), and the S&P Green Bond Index (Mzoughi et al., 2022; Lorente et al., 2023) as a representative for the green bonds market. Using aggregate index over sectoral index provides a holistic view of these markets. Besides, the aggregate index can capture macroeconomic factors aligned with policymakers’ needs for sustainable development considering the policy-driven feature of the carbon market and it also diversifies segmental risks, in line with investor preferences for sustainable investing.
We choose the ICE EUA futures contract prices as a proxy for the EU carbon market (Wei et al., 2023b; Gao et al., 2023). In the context of the Chinese carbon market, we rely on data from the Shenzhen (launched on June 18, 2013) and Hubei (launched on April 2, 2014) carbon markets as proxies (Xu, 2021; Wu et al., 2023). Shenzhen’s carbon trading market is selected for two main reasons. The Shenzhen carbon trading pilot program is distinguished as one of China’s earliest and comparatively well-established initiatives, as emphasized by Cong & Lo (2017) and Qi et al. (2023). Furthermore, Chen et al. (2022a) note a robust correlation between Shenzhen and other carbon markets throughout China, thereby affording a comprehensive insight into carbon price fluctuations within the country. Similarly, the Hubei carbon market is chosen due to its significant reliance on secondary industries and coal-based economy, which closely mirrors the national energy structure. Moreover, the Hubei market enjoys substantial participation from both institutional and individual investors, with individual contributions accounting for over one-third of total turnover. Remarkably, the Hubei market stands out as the foremost pilot ETS in China, distinguished by its considerable trading volume, enduring operation, strong social capital, and active involvement of incorporated firms (Lyu & Scholtens, 2024). Furthermore, the choice of Hubei over Shenzhen also considers the geographic scope, with Hubei representing a province-level market and Shenzhen representing a city-level market. This differentiation facilitates comparisons across various regional carbon markets within China.
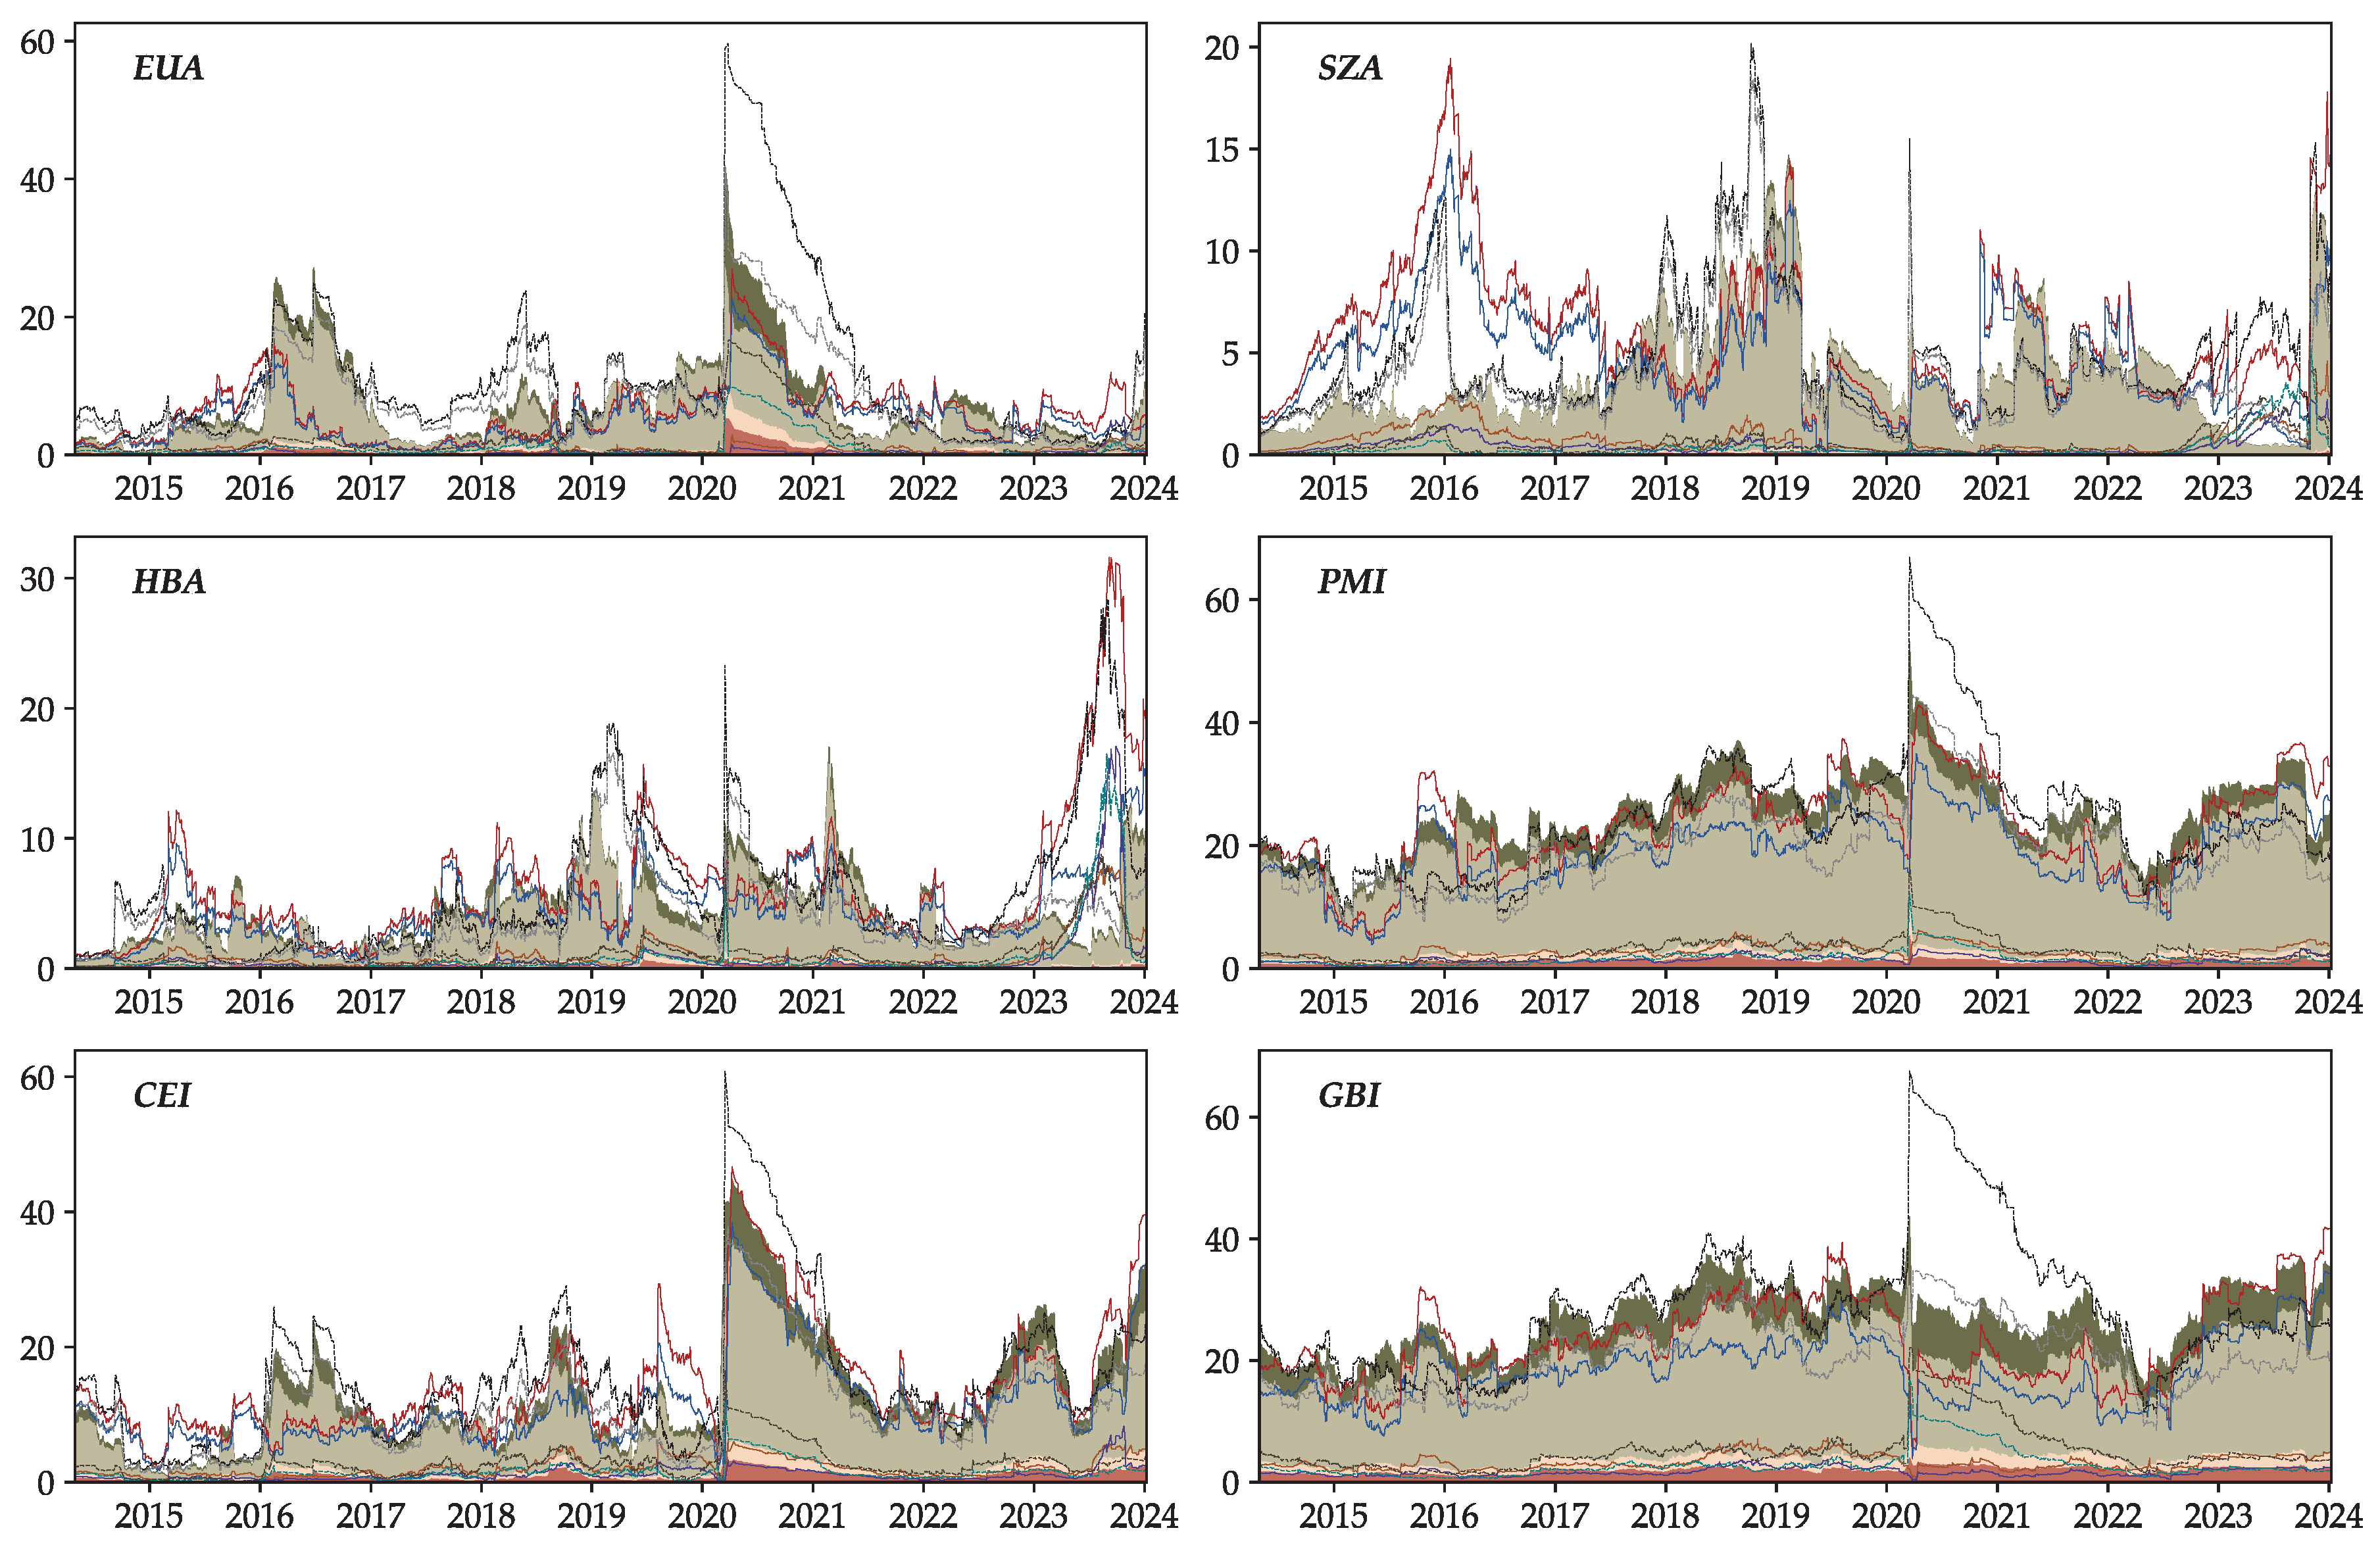
The details of our dataset are presented in Table 1 as a summary. Throughout the observed period from May 2014 to September 2023, major events including the US–China trade conflict, the COVID-19 pandemic, and the Ukraine–Russia military tensions occurred. These events had a substantial influence on financial markets, offering valuable insights into the risk contagion within the studied market, largely attributed to the induced volatility. Simultaneously, this enables us to filter out some of the initial price instabilities observed in the Chinese carbon market. All data are transformed into the logarithmic difference form, calculated as . The R package "ConnectednessApproach" (Gabauer, 2022) serves as the primary tool for conducting modeling tasks.
Table 2 provides summary statistics for the return series. Our analysis reveals that, on average, most returns are positive except for GBI, and EUA exhibiting the most pronounced positive returns. Additionally, all series display significant skewness and leptokurtic distribution, as evidenced by the J–B test statistics, indicating none of the returns follows a normal distribution. It is noteworthy that SZA demonstrates high volatility and the most positive skewness, whereas EUA exhibits the most negative skewness, with HBA displaying minimal skewness. Moreover, we observe that all series display stationarity, autocorrelation, and heteroskedasticity at the 1% significance level. The collected statistics endorse our decision to utilize the TVP-VAR model with heteroscedastic variance-covariances to capture interdependencies across all series. Table 3 displays the Kendall correlations, offering a nonparametric assessment of the unconditional correlation between the indices. The positive correlations among PMI, CEI, and GBI indicate common economic factors or reciprocal responses to global market events, while EUA similarly shows positive correlations. While HBA shows positive correlations with PMI and CEI, it exhibits a weak negative correlation with GBI. In contrast, SZA displays notably negative correlations with the three markets, especially GBI, suggesting potential avenues for diversification to mitigate risks.
4. Methodology
We introduce an innovative asymmetric TVP-VAR time–frequency connectedness framework, merging the methodologies of Adekoya et al. (2022) and Chatziantoniou et al. (2023). The latter integrates the approach of Baruník & Křehlík (2018) with Antonakakis et al.’s (2020) synthesis of Diebold & Yilmaz’s (2012) approach and Koop & Korobilis’s (2014) TVP-VAR framework. In order to grasp asymmetrical connectedness, we employ positive and negative returns as the basis of our methodology, with the goal of unraveling the intricate mechanisms behind volatility transmission. Specifically, we employ the TVP-VAR (1) model recommended by the Bayesian Information Criterion (BIC), which can be represented as
where , and indicate dimensional vectors at time t, , and the corresponding error term, respectively. and are the dimensional matrices illustrating the time-varying VAR coefficients and dynamic variance-covariances while and represent dimensional vectors and denotes a dimensional matrix.
4.1. Risk Spillover in the Time Domain
Given that the generalized forecast error variance decomposition (GFEVD) relies on the Wold representation theorem introduced by Koop et al. (1996) and Pesaran & Shin (1998), it necessitates transforming the fitted TVP-VAR model into its TVP-VMA process as . Then, the H-step-ahead GFEVD can be defined as
Notice that when , is the proportion of H-step-ahead forecast error variance in variable j attributed to the shocks from variable k. To ensure that the total of each row equals 1, signifying that all variables collectively explain 100% of variable j’s forecast error variance, we normalize each element by dividing it by the sum of the row as
with , . Employing the GFEVD, we calculate the total connectedness index (TCI) as defined in Eq. (5) to assess the forecasting variance attributed to other variables within the system. Research by Gabauer (2021) has demonstrated that the TCI can be deconstructed into the pairwise connectedness index (PCI), which gauges the interconnections between j and k, as outlined in Eq. (6).
The FROM spillover index quantifies the directional connectedness of variable j received from other elements in the system:
The TO spillover index quantifies the directional connectedness from variable j to other elements in the system:
By computing the difference between the total directional connectedness FROM other variables and the total directional connectedness TO other variables, we obtain the NET total directional connectedness. This index acts as an indicator of the impact that variable j exerts on the examined network:
Ultimately, the net pairwise directional connectedness (NPDC) index delineates the directional connectedness between variables j and k as follows:
4.2. Risk Spillover in the Frequency Domain
Up to this point, our focus has been on evaluating connectedness within the time domain. Baruník & Křehlík (2018) introduced the BK model for measuring connectedness in the frequency domain. Based on the frequency response function , the spectral density of at frequency is defined as
where is obtained by the Fourier transformation of the TVP-VMA(∞), in which . Following this, the generalized causation spectrum across the frequencies , which quantifies the spillover effect of the j-th variable resulting from shocks in the k-th variable, is calculated as follows:
where signifies the component of variable j’s spectrum at frequency induced by variable k. Then, the share of frequency for variable j’s variance in the weighted function is defined as
where is the power of variable j over frequency . Specifically, a designated frequency band, denoted as , with and is employed. The unnormalized and normalized GFEVD on frequency band d is formulated in Eqs. (14) and (15).
Subsequently, the corresponding measures of connectedness, just like in the time domain, are calculated as follows:
4.3. Asymmetry Measure
Additionally, following Wu & Jiang (2023) and Wu & Qin (2024), we segregate the returns into positive and negative categories, respectively to explore asymmetry:
where and stand for the positive and negative daily returns. In order to facilitate a more nuanced comparison between positive and negative spillovers, this study utilizes the spillover asymmetry measure (SAM) proposed by Baruník et al. (2016). SAM quantifies the degree of asymmetry in spillover effects and is calculated as follows:
Such asymmetry measures are applicable for comparison within the same frequency, but lack comparability across different frequencies. Hence, we normalized them by dividing by the connectedness in normal conditions as Eqs. (28) to (31), which can be interpreted as sensitivity of asymmetry to connectedness.
In this paper, the spillovers between precious metals, clean energy, green bonds, and carbon markets are unveiled using a 20-step ahead forecasting error variance decomposition method to calculate the spillover indexes. The frequency spectrum is dissected into distinct bands: a high-frequency band spanning 5 days for short-term analysis, a medium-frequency band ranging from 5 to 22 days for medium-term examination, and a low-frequency band encompassing periods longer than 22 days for long-term assessment (Baruník & Křehlík, 2018; Zhang et al., 2023c).
5. Empirical Results
5.1. Average Connectedness
We commence by analyzing the average spillover characteristics. Table 4 showcases the findings across three varied market conditions in the time–frequency domain. Panel A presents the situation in the time domain. Under normal conditions, the average connectedness among variables is 13.21%, indicating that cross-impacts are low within these markets. This can be attributed to the following reasons. First, the Chinese carbon market launched late and has a low degree of convergence with the global carbon market, consistent with Lyu & Scholtens (2024). Second, the data employed as proxies for the clean energy, precious metals, and green bonds markets in our study are aggregate indices. At the same time, spillover effects are predominantly focused on the precious metals, green bonds, and clean energy markets. The TO connectedness and FROM connectedness indices of carbon markets are the only ones not exceeding 10%. Among the six variables, PMI and CEI emerge as net transmitters of shocks, while the other variables act as net receivers. Specifically, PMI and HBE exhibit NET directional connectedness indices of 1.17% and , respectively, signifying PMI as the most robust net transmitter and HBE as the most prominent net receiver of shocks. The TO and FROM connectedness indices for Chinese carbon markets are much smaller than those for the EU carbon market. That is to say, precious metals, clean energy, and green bonds markets have a stronger impact on the EU ETS than Chinese ETS. Likewise, the shocks affecting the three markets originate more frequently from the EU ETS than from the Chinese ETS.
To investigate asymmetry, we analyze results obtained using positive and negative returns. TCI under positive and negative conditions is weaker and stronger than the one under normal conditions, respectively. Typically, most investors are risk-averse, and their reactions to market information may be more pronounced in a downturn, influencing the observed results. Interestingly, we find that the roles of the variables switch between the net receiver and net transmitter across market conditions, except for HBA and PMI which remain consistent. Under positive conditions, PMI (1.56%) and EUA (0.29%) are net transmitters and others are receivers with CEI () being the strongest. Under negative conditions, EUA () and HBA () are net receivers and others are transmitters with CEI (1.87%) being the strongest. The shift in strongest net transmitters and receivers indicates clean energy market is sensitive to market conditions. When comparing China and the EU, notable differentials emerge. Specifically, in the negative return scenario, both the EUA and HBA function as net receivers, while SZA operates as a net transmitter. Conversely, in scenarios marked by positive returns, the EUA transitions into a net transmitter, while the remaining two markets shift to become net receivers. In addition, the FROM connectedness of SZA and HBA are slightly higher than EUA, indicating that Chinese ETS are more impacted than the EU ETS in positive conditions.
Furthermore, Panels B to D further list the results of frequency domain connectedness indices. From the perspective of the frequency domain, under normal returns, there is a gradual weakening of TCI across three frequencies decreasing from 11.02% to 1.46% and further to 0.74%. In both positive and negative market conditions, a similar pattern emerges, indicating robust short-term spillover effects among the six variables. These effects can be ascribed to shifts in speculative activity, investor sentiment, and the involvement of day traders. Interestingly, contrary to the findings presented in Panel A, there are substantial changes observed in the roles and intensity of the net transmitters and receivers in the frequency domain compared to their counterparts in the corresponding time domain. However, within the frequency domain, medium and long-term frequencies exhibit the same characteristics in this aspect. It is worth mentioning that under the same market conditions, EUA (receiver), HBA (receiver), and CEI (transmitter) maintained the same role at different frequencies. Also, from the perspective of market conditions, in the short term, TCI under positive and negative conditions are weaker and stronger than normal conditions, respectively, which is consistent with Panel A. Nevertheless, in the medium and long term, TCI under both extreme conditions is higher than the normal ones. In line with the time domain, the role and intensity of the net transmitter and receiver are dependent on market conditions. It is worth mentioning that PMI (transmitter) and HBA (receiver) maintained the same role under different market conditions.
The chord diagrams in Figure 1 provide a clearer depiction of risk spillovers under various market conditions in the time–frequency domain. In general, there’s a strong interplay among clean energy, precious metals, and green bonds, particularly between precious metals and green bonds. The interactions within the three carbon markets are relatively minor, yet they exhibit complexity as they interact with each other. Notably, EUA shows greater spillover effects than other markets in normal and negative conditions. However, in positive market scenarios, all three carbon markets demonstrate similar dynamics, with the EU ETS showing lower long-term spillover effects compared to Chinese markets.
5.2. Dynamic Total Connectedness
To delve deeper into evolving patterns in market linkages and the impact of specific events, we initially explored the time-varying TCI over time and frequencies, as depicted in Figure 2. The total connectedness under normal conditions exhibits time-varying characteristics, fluctuating between values ranging from approximately 5% to as high as approximately 30%. This variability suggests that connectedness is notably contingent on specific events. Moreover, consistent with earlier observations, we observe that dynamic connectedness across different frequencies or market conditions appears to be comparable, as evidenced by significant peaks and troughs manifesting at comparable time intervals. For instance, the level of connectedness within the system exhibited significant increases between 2015 and 2017, as well as in 2018 and early 2020. In addition, short-term connectedness dominates in all different market situations.
Additionally, pronounced discrepancies under different market conditions are evident, with connectedness under negative market conditions consistently predominating across all frequencies throughout the study period. In a testament to this observation, Figure 3 and Figure 4 present asymmetry and normalized asymmetry measures, respectively, and the results of KS tests presented in Table 5 confirm such significant asymmetry. Asymmetry shows strong time-varying characteristics in both the time and frequency domains. Starting in 2020, TCI under negative market conditions far exceeds that under positive conditions, indicating a dominance of connectedness based on negative returns throughout the study period. The significant increase in asymmetry during this period may be attributed to the COVID-19 pandemic. Some normalized asymmetry measures exceed 1, which is even greater than the connectedness under normal conditions. This implies that market conditions significantly influence the risk spillovers between these markets and underscore the importance of considering market conditions in risk analysis. The long-term normalized asymmetry exhibits pronounced sensitivity, suggesting a greater likelihood of asymmetry in long-term connectedness. Conversely, the sensitivity to short-term asymmetry is relatively low, and the overall sensitivity to the normalized asymmetry of both short-run and long-run connectedness closely aligns. Furthermore, the examination of normalized asymmetry concerning PCI, NET, and NPDC, as depicted in Figures A1 to A3, serves to bolster the validity of our findings.
5.3. Dynamic Pairwise Connectedness
Figure 5 and Figure 6 depict pairwise connectedness and asymmetry among the markets, separately. From the time domain, the prevailing connectedness among the three carbon markets predominantly remains at or below 10%, indicating a weak interrelationship among them. When viewed through the lens of frequency, short-term spillovers consistently dominate across all market conditions.
The pairwise correlations between the Hubei and Shenzhen carbon markets and other markets are not strong, indicating a low degree of integration between China’s ETS and international markets, likely due to policy differences. In contrast, the correlation between EUA and other international markets is notably high. For instance, the pairwise connectedness between EUA and CEI can reach 40% under normal market conditions. Regarding connectedness among clean energy, precious metals, and green bonds markets, precious metals, and green bonds exhibit the strongest and relatively stable connectedness, characterized by greater asymmetry. Remarkably, the COVID-19 pandemic had a sharp but exceedingly short-lived impact on the connectedness between green bonds and other markets. Additionally, the connectedness with precious metals experienced a significant decrease afterward under normal conditions. Conversely, the pandemic had a more dramatic and longer-lasting impact on the connectedness between precious metals and clean energy markets.
In the context of asymmetry, connectedness based on positive and negative returns demonstrates greater magnitudes and longer-lasting effects at certain times compared to normal market conditions. For example, the EUA-SZA nexus in 2016, and the PMI-GBI, and EUA-PMI nexuses in early 2020 suggest substantial asymmetry during these periods. The Shenzhen ETS boasted the highest trading volume in 2016 and its interconnection with the EU ETS has grown stronger as measures to control carbon emissions have been reinforced. In 2020, the impact of COVID-19 exacerbated market tumult, prompting a remarkable surge in the perception of precious metals as a safe-haven asset. Concurrently, the increase in economic uncertainty has prompted investors to pay more attention to sustainable development and heighten capital inflows into both the international carbon market and the green bonds market. The descriptive statistics concerning the normalized asymmetry of PCI are delineated within the upper triangle of each panel in Table 6. Upon careful examination, it becomes apparent that the long-term asymmetry inherent in pairwise connections exhibits both the highest average and volatility, consistent with asymmetry in total connectedness. It suggests that the extent of asymmetry in long-term pairwise connections significantly contributes to the overall network dynamics.
5.4. Dynamic Net Directional Connectedness
The results of the NET are depicted in Figure 7, illustrating the time-varying role of a variable as a net receiver or net transmitter throughout the study period within the network. The net directional connectedness is explicitly time-dependent. time–frequency decomposition reveals the predominant influence of the short-run component on connectedness, which is in line with previous findings. Significant discrepancies in net total directional connectedness under different market conditions are observed, and the asymmetric outcomes are illustrated in Figure 8.
From 2015 to 2017, significant differences in asymmetry between SZA and HBA emerge. SZA exhibits higher net total directional connectedness under negative market conditions, while HBA demonstrates greater strength under positive market conditions. The asymmetry pattern for EUA is somewhat similar to that of HBA. During the COVID-19 pandemic, EUA exhibits a substantial increase in net risk reception under negative market conditions. These differences validate the impact of asymmetry and indicate that Chinese carbon markets not only differ from international carbon markets but also exhibit diverse developmental trends among internal carbon markets. Additionally, in 2020, GBI has a very distinctive situation where the NET obtained by positive returns is negative and it entirely becomes a net receiver. However, presently, the connectedness surpasses that observed under negative market conditions at medium- and long-term time frequencies. Under negative market conditions, notably in the short run, the net total directional connectedness still reaches 20%, acting as a net transmitter. Asymmetry is also verified and the asymmetrical behavior serves to underscore the nuanced dynamics inherent within the green bonds market, highlighting its resilience and adaptability amid fluctuating economic conditions. During COVID-19, PMI experienced a dramatic surge in net volatility transmission based on negative returns, surpassing that based on positive returns. A comparable pattern is evident for CEI as well. Furthermore, the descriptive statistics of normalized NET asymmetry are reported in Table 7 as well. Apart from the PMI in the time domain and the GBI in the medium run, the long-run normalized asymmetry of other markets exhibits the highest magnitude and volatility, as indicated by the absolute mean values and standard deviations.
5.5. Dynamic Net Pairwise Directional Connectedness
To facilitate a more comprehensive understanding, we hereby present the net pairwise spillover effects depicted in Figure 9. Furthermore, the directional spillovers, both to and from other markets, are delineated in Figures A4 and A5, respectively. It is evident from the analysis that the short-term component of NPDC maintains a prevailing influence, consistent with our prior observations.
Under normal market conditions, the behavior of EUA primarily manifests as a net transmitter to Chinese carbon markets for the most part. However, when considering its interactions with other variables, EUA predominantly assumes a net receiver, indicating a substantial influence from markets associated with sustainable development on the broader global carbon market. This dual role suggests that EUA may wield a guiding influence on shifts within the Chinese ETS. On the other hand, in the relationships involving SZA and other markets, the role of SZA continuously alternates between that of a net receiver and a net transmitter. Similarly, HBA also exhibits this fluctuating pattern. This dynamic interplay not only underscores the susceptibility of these markets to spillovers from international market developments but also underscores the noteworthy impact of Chinese carbon markets on the broader landscape of global sustainable development.
The asymmetric effect is further confirmed as shown in Figure 10, with frequent fluctuations in asymmetry observed during the study period, peaking at nearly 20% in the CEI-GBI nexus. During COVID-19, unique variations in asymmetry emerge in the EUA-CEI and PMI-GBI nexuses, indicating differing investor perceptions in the short term versus the medium to long term, suggesting potential shifts in market sentiment over the medium to long term. The descriptive statistics of normalized NPDC asymmetry are also given in the lower triangle section of each panel in Table 6. Unlike the NET, the normalized asymmetry of NPDC does not exhibit a consistent trend. For each pair, the asymmetry with the highest magnitude and most volatility may occur either in the frequency or time domain and the highest magnitude may not necessarily coincide with the most volatile.
5.6. Robustness Test
To evaluate the robustness of our findings, we extend our analysis to encompass alternative forecast horizons, specifically including 50-step, 100-step, 150-step, and 200-step-ahead forecasts. Our investigation reveals that the observed dynamic total spillover indices maintain comparable time-varying trends, as exemplified in Figure 11. This consistency across different forecast horizons suggests that the dynamic total spillovers remain resilient and unaffected by variations in forecasting timeframes. Consequently, our results underscore the robustness of our analytical framework in accurately portraying the magnitude and direction of risk spillovers among carbon, clean energy, precious metals, and green bonds markets. For the sake of brevity, we abstain from presenting other spillover indices for alternative forecast horizons. However, it is crucial to note that empirical findings of other spillover indices also demonstrate no significant deviations from our initial analysis, further affirming the reliability and robustness of our results.
6. Conclusions
This paper applies the TVP-VAR-based asymmetric connectedness approach to analyze the evolution of the relationship among clean energy, precious metals, and green bonds and EU–China ETSs across the time and frequency domains. By focusing on risk transmission within these sustainability-related markets, the study aims to explore the intricate relationship between sustainability and stability from a novel perspective. Findings reveal that: First, there are dynamic asymmetric spillover effects evident within the clean energy, precious metals, green bonds, and carbon markets over time and frequency domains, with long-term asymmetry showing notable sensitivity. Under positive and negative market conditions, connectedness exhibits weaker and stronger characteristics, respectively, than normal in the time domain and short-term frequency. Nevertheless, both show elevated levels compared to normal in the medium and long run. Connectedness asymmetry in the long run emerges as the most sensitive, while short-term connectedness exhibits the least sensitivity. Additionally, spillover asymmetry displays variability across the observed domains. Second, the study highlights the variability in the roles and intensities of net transmitters or receivers across diverse market conditions and frequency domains. Specifically, persistent characteristics are observed in PMI and HBA under various market conditions. Notably, features within the frequency domain exhibit marked differences from those in the time domain. However, it is observed that within the frequency domain, medium and long-term characteristics tend to align, with EUA, HBA, and CEI demonstrating significant persistence. Furthermore, the occurrence of major events has the potential to induce shifts in these roles. Third, the EU ETS demonstrates stronger integration with global clean energy, precious metals, and green bonds markets in comparison to Chinese carbon markets. The Hubei carbon market consistently maintains its role as a net receiver across various market conditions in both time and frequency domains, while Shenzhen exhibits fluctuating dynamics, often functioning as a net receiver in the short term but transitioning to a transmitter in the long term. Conversely, the EU ETS typically serves as a net receiver during normal and negative conditions but shifts to a net transmitter in positive conditions. Our comparative study on asymmetric risk transmission between the Chinese and EU carbon markets, as well as global sustainability-related markets, holds significant potential for informing the establishment of a future joint China–EU ETS, thereby advancing sustainability efforts in both regions.
However, our paper has shortcomings. First, for the Chinese carbon market, this paper selects only the two most commonly studied local markets in the literature. The results of this paper may not be generalizable to other markets, and other carbon trading markets are in urgent need of research. Second, for other markets, unlike the literature, which uses specific indices, we use aggregate indices. This also makes our results lack the ability to generalize to market segments. Furthermore, the utilization of only one model raises the need for alternative methods to be employed in order to validate the findings.
In the future, as carbon markets become key drivers of sustainable economic development worldwide, the maturation of Chinese carbon markets across varied geographical locations and policy environments will present significant opportunities to explore spillover dynamics both within China and between the Chinese and EU ETSs. Additionally, researchers will have the ability to broaden their investigations to include more countries or regions, enabling cross-country comparisons and a deeper understanding of the interactions between energy, metal, green bonds, and carbon markets. Such efforts focused on sustainability will greatly enhance our understanding and influence policy decisions in environmental economics and sustainable finance.
Author Contributions
Conceptualization, J.C. and H.X.; methodology, H.X.; software, H.X.; validation, J.C.; formal analysis, J.C. and H.X.; investigation, J.C. and H.X.; resources, P.Y.; data curation, J.C.; writing—original draft preparation, J.C. and H.X.; writing—review and editing, P.Y.; visualization, H.X.; supervision, P.Y.; project administration, P.Y.; funding acquisition, P.Y. All authors have read and agreed to the published version of the manuscript.
Funding
This research received no external funding.
Data Availability Statement
The links for all data used in this article have been presented.
Conflicts of Interest
The authors declare no conflict of interest.
Appendix A
Figure A1.
Normalized asymmetry of PCI. Notes: The vertical axis is restricted to a range of to exclude extreme values. Refer to Figure 4 for the legend.
Figure A1.
Normalized asymmetry of PCI. Notes: The vertical axis is restricted to a range of to exclude extreme values. Refer to Figure 4 for the legend.
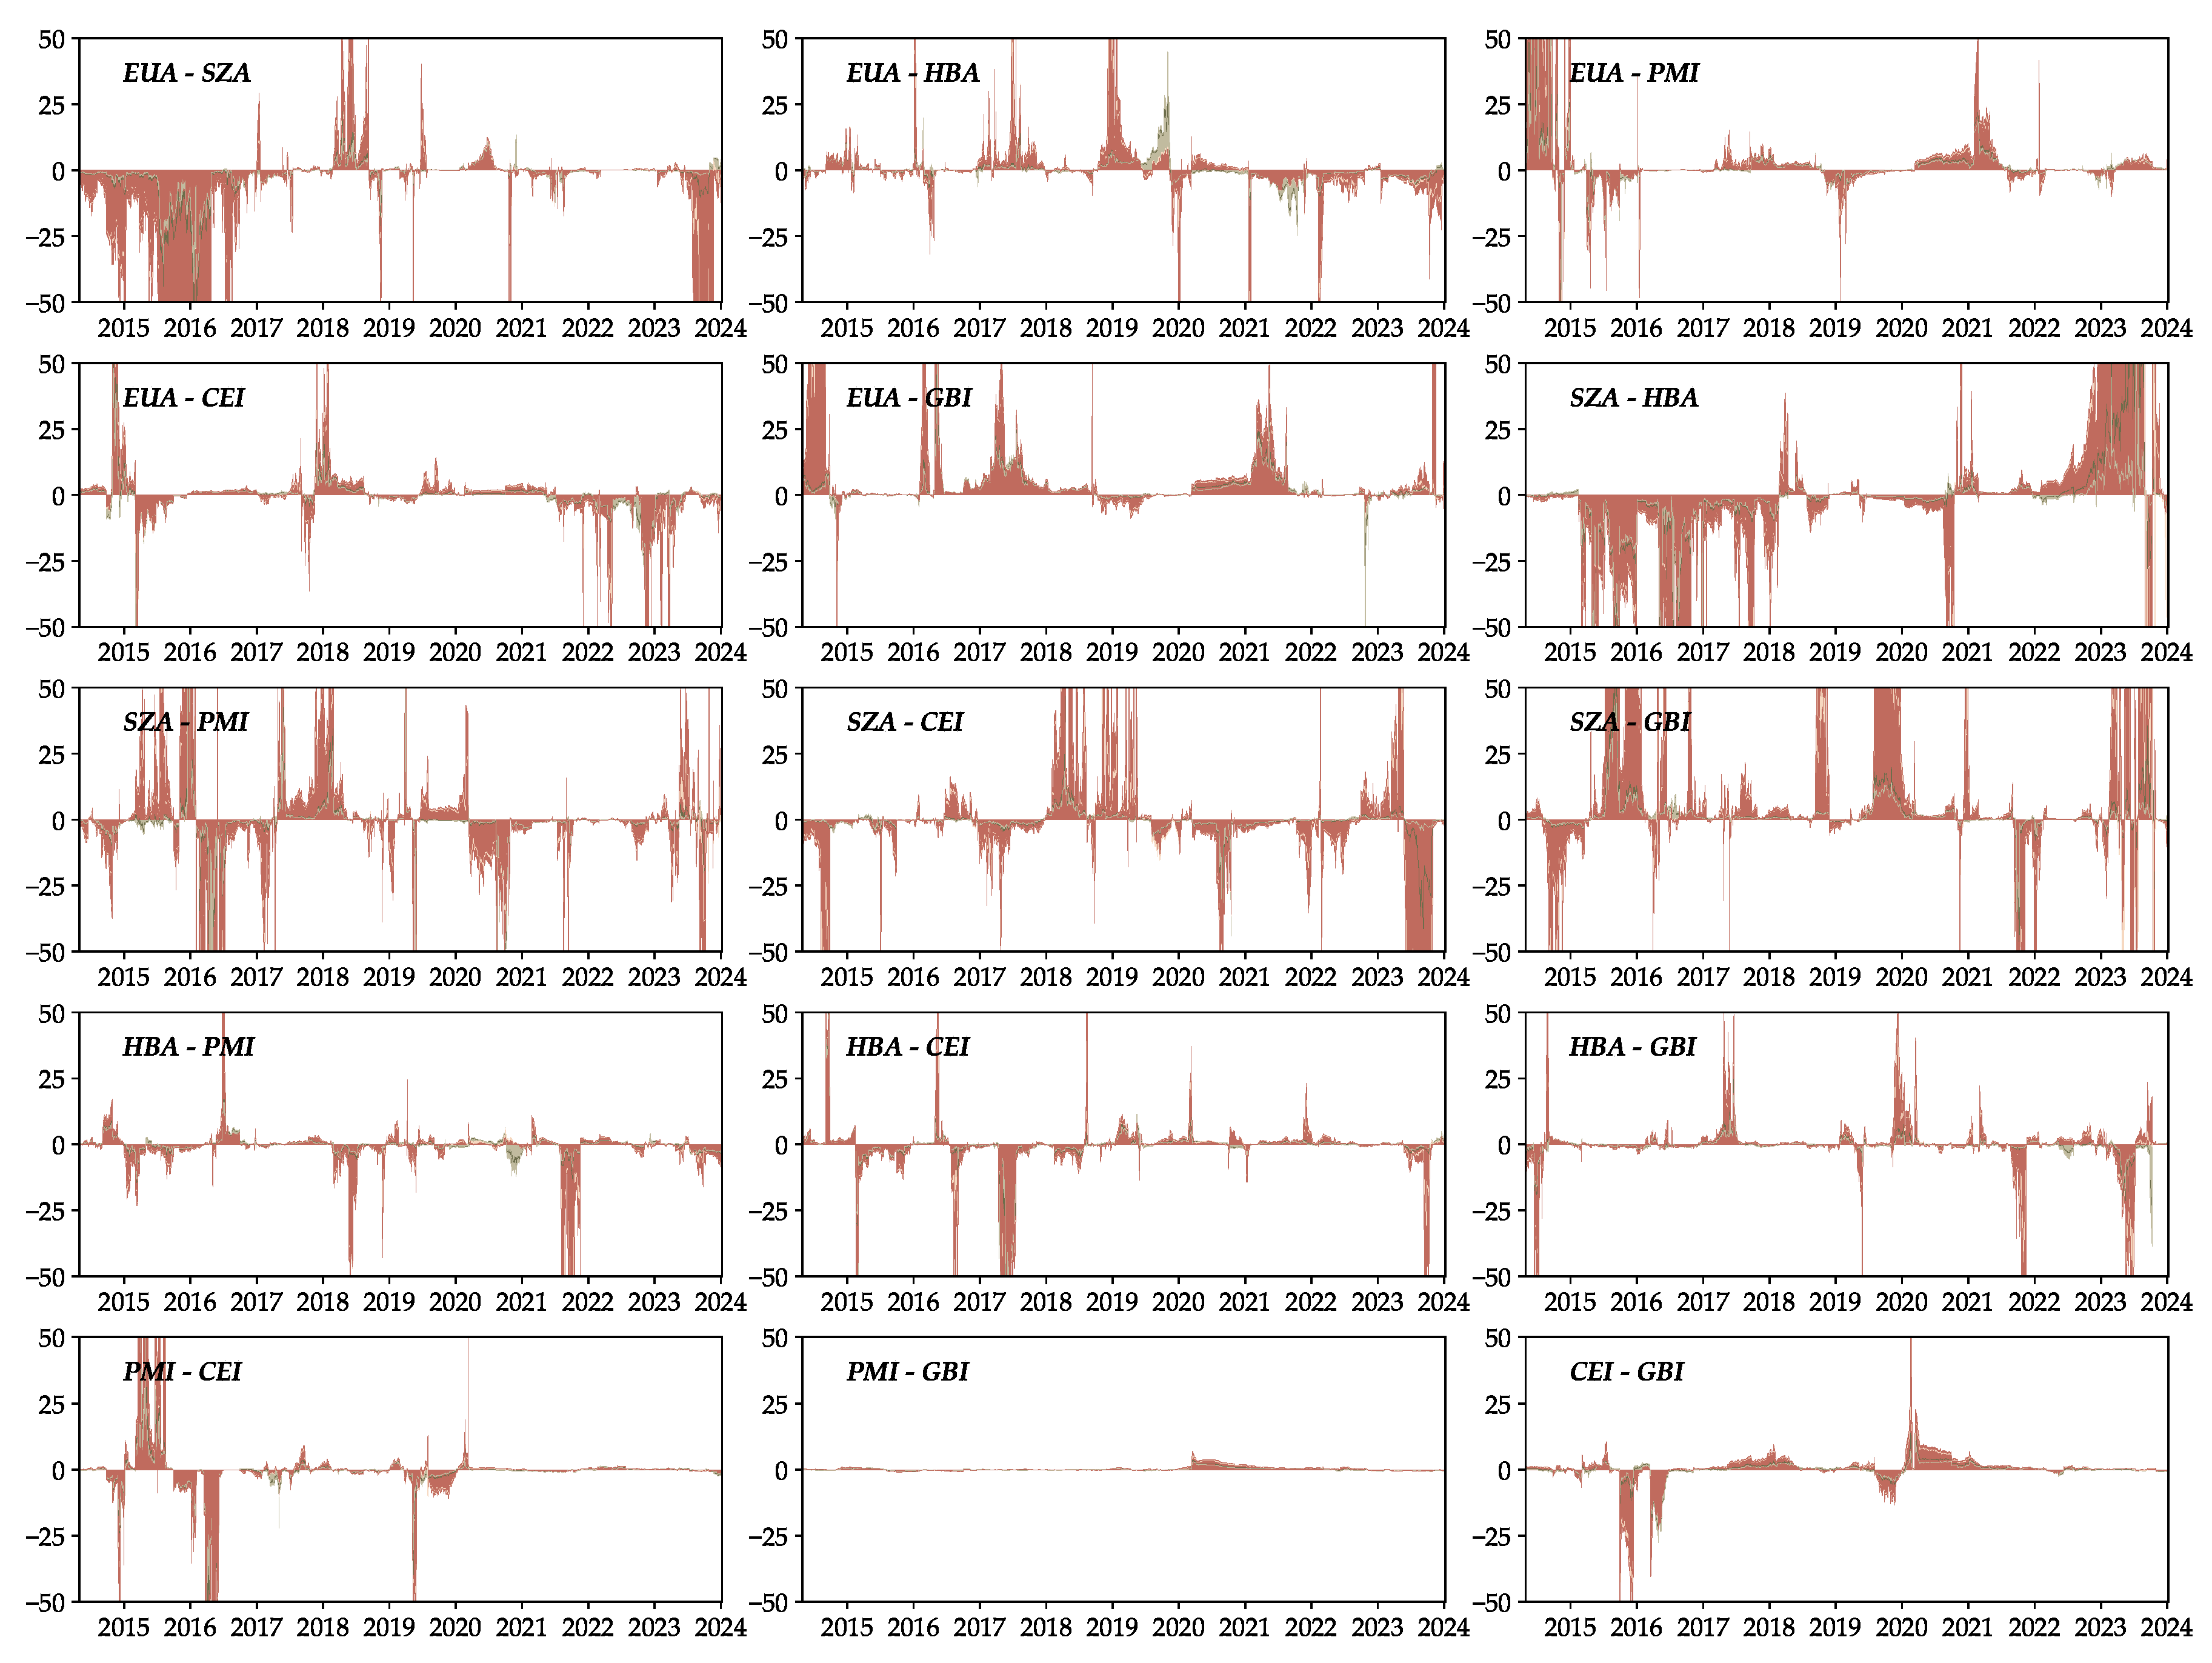
Figure A2.
Normalized asymmetry of NET. Notes: See notes in Figure A1.
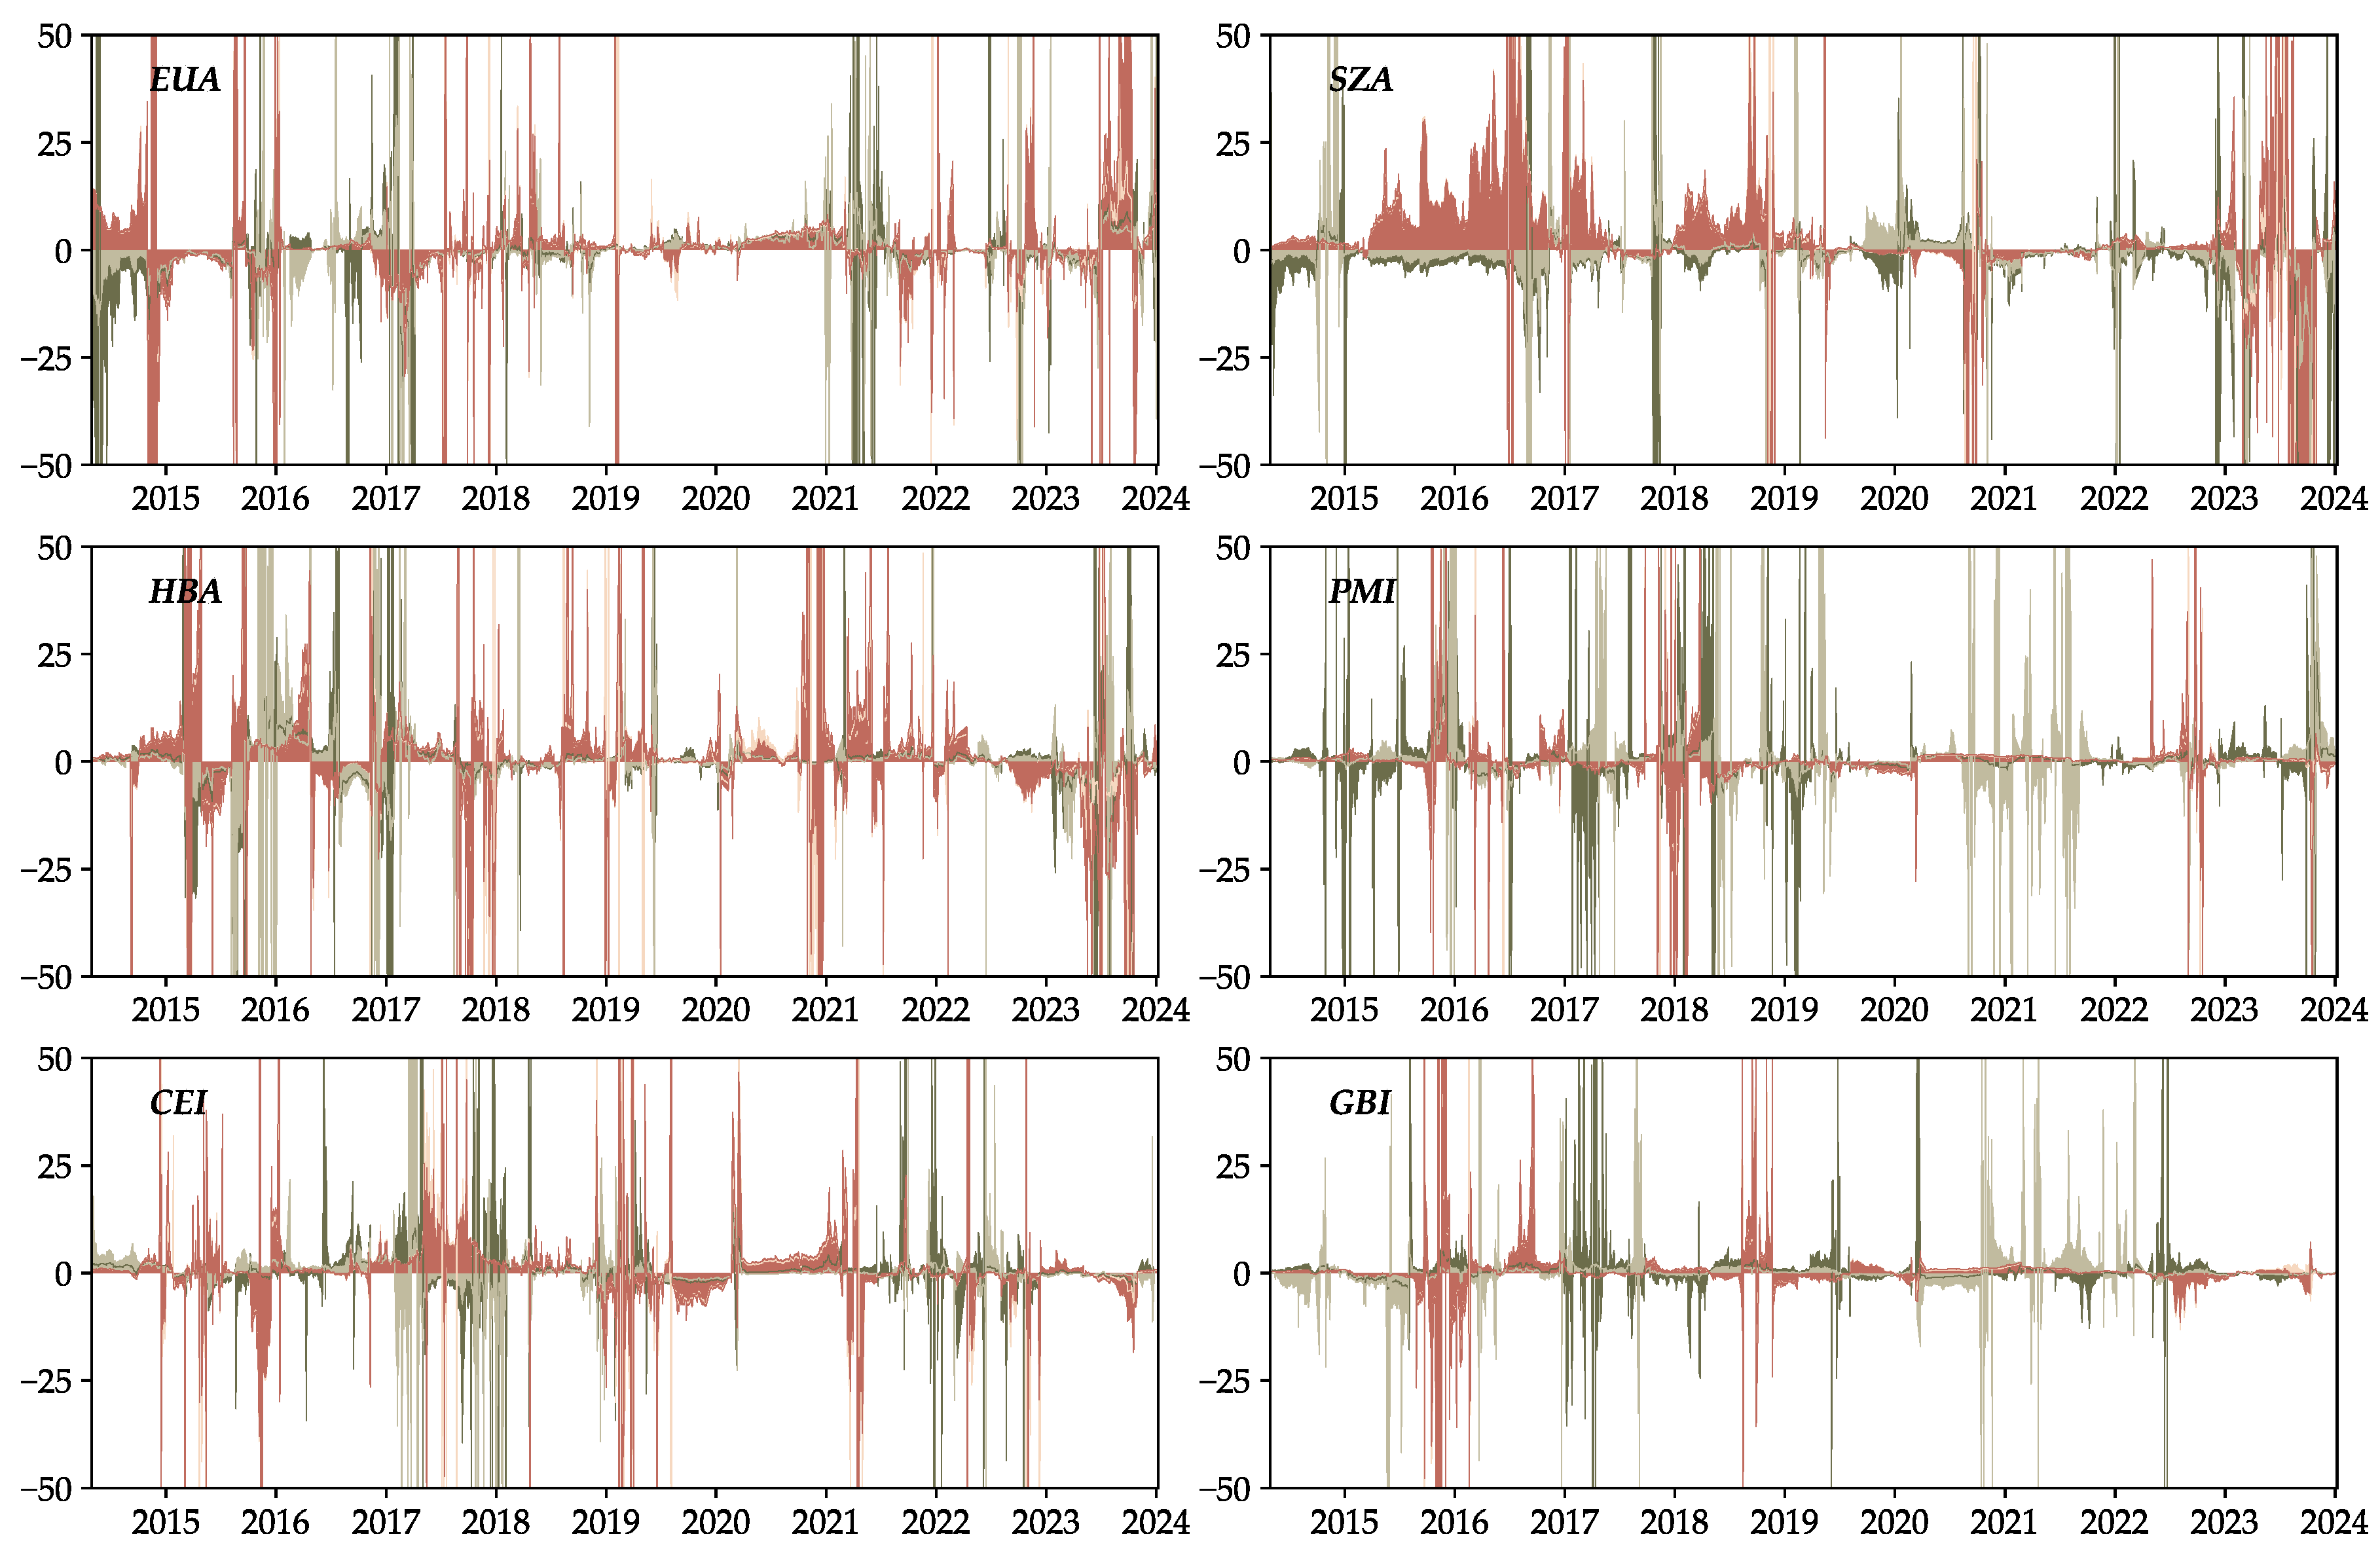
Figure A3.
Normalized asymmetry of NPDC. Notes: See notes in Figure A1.
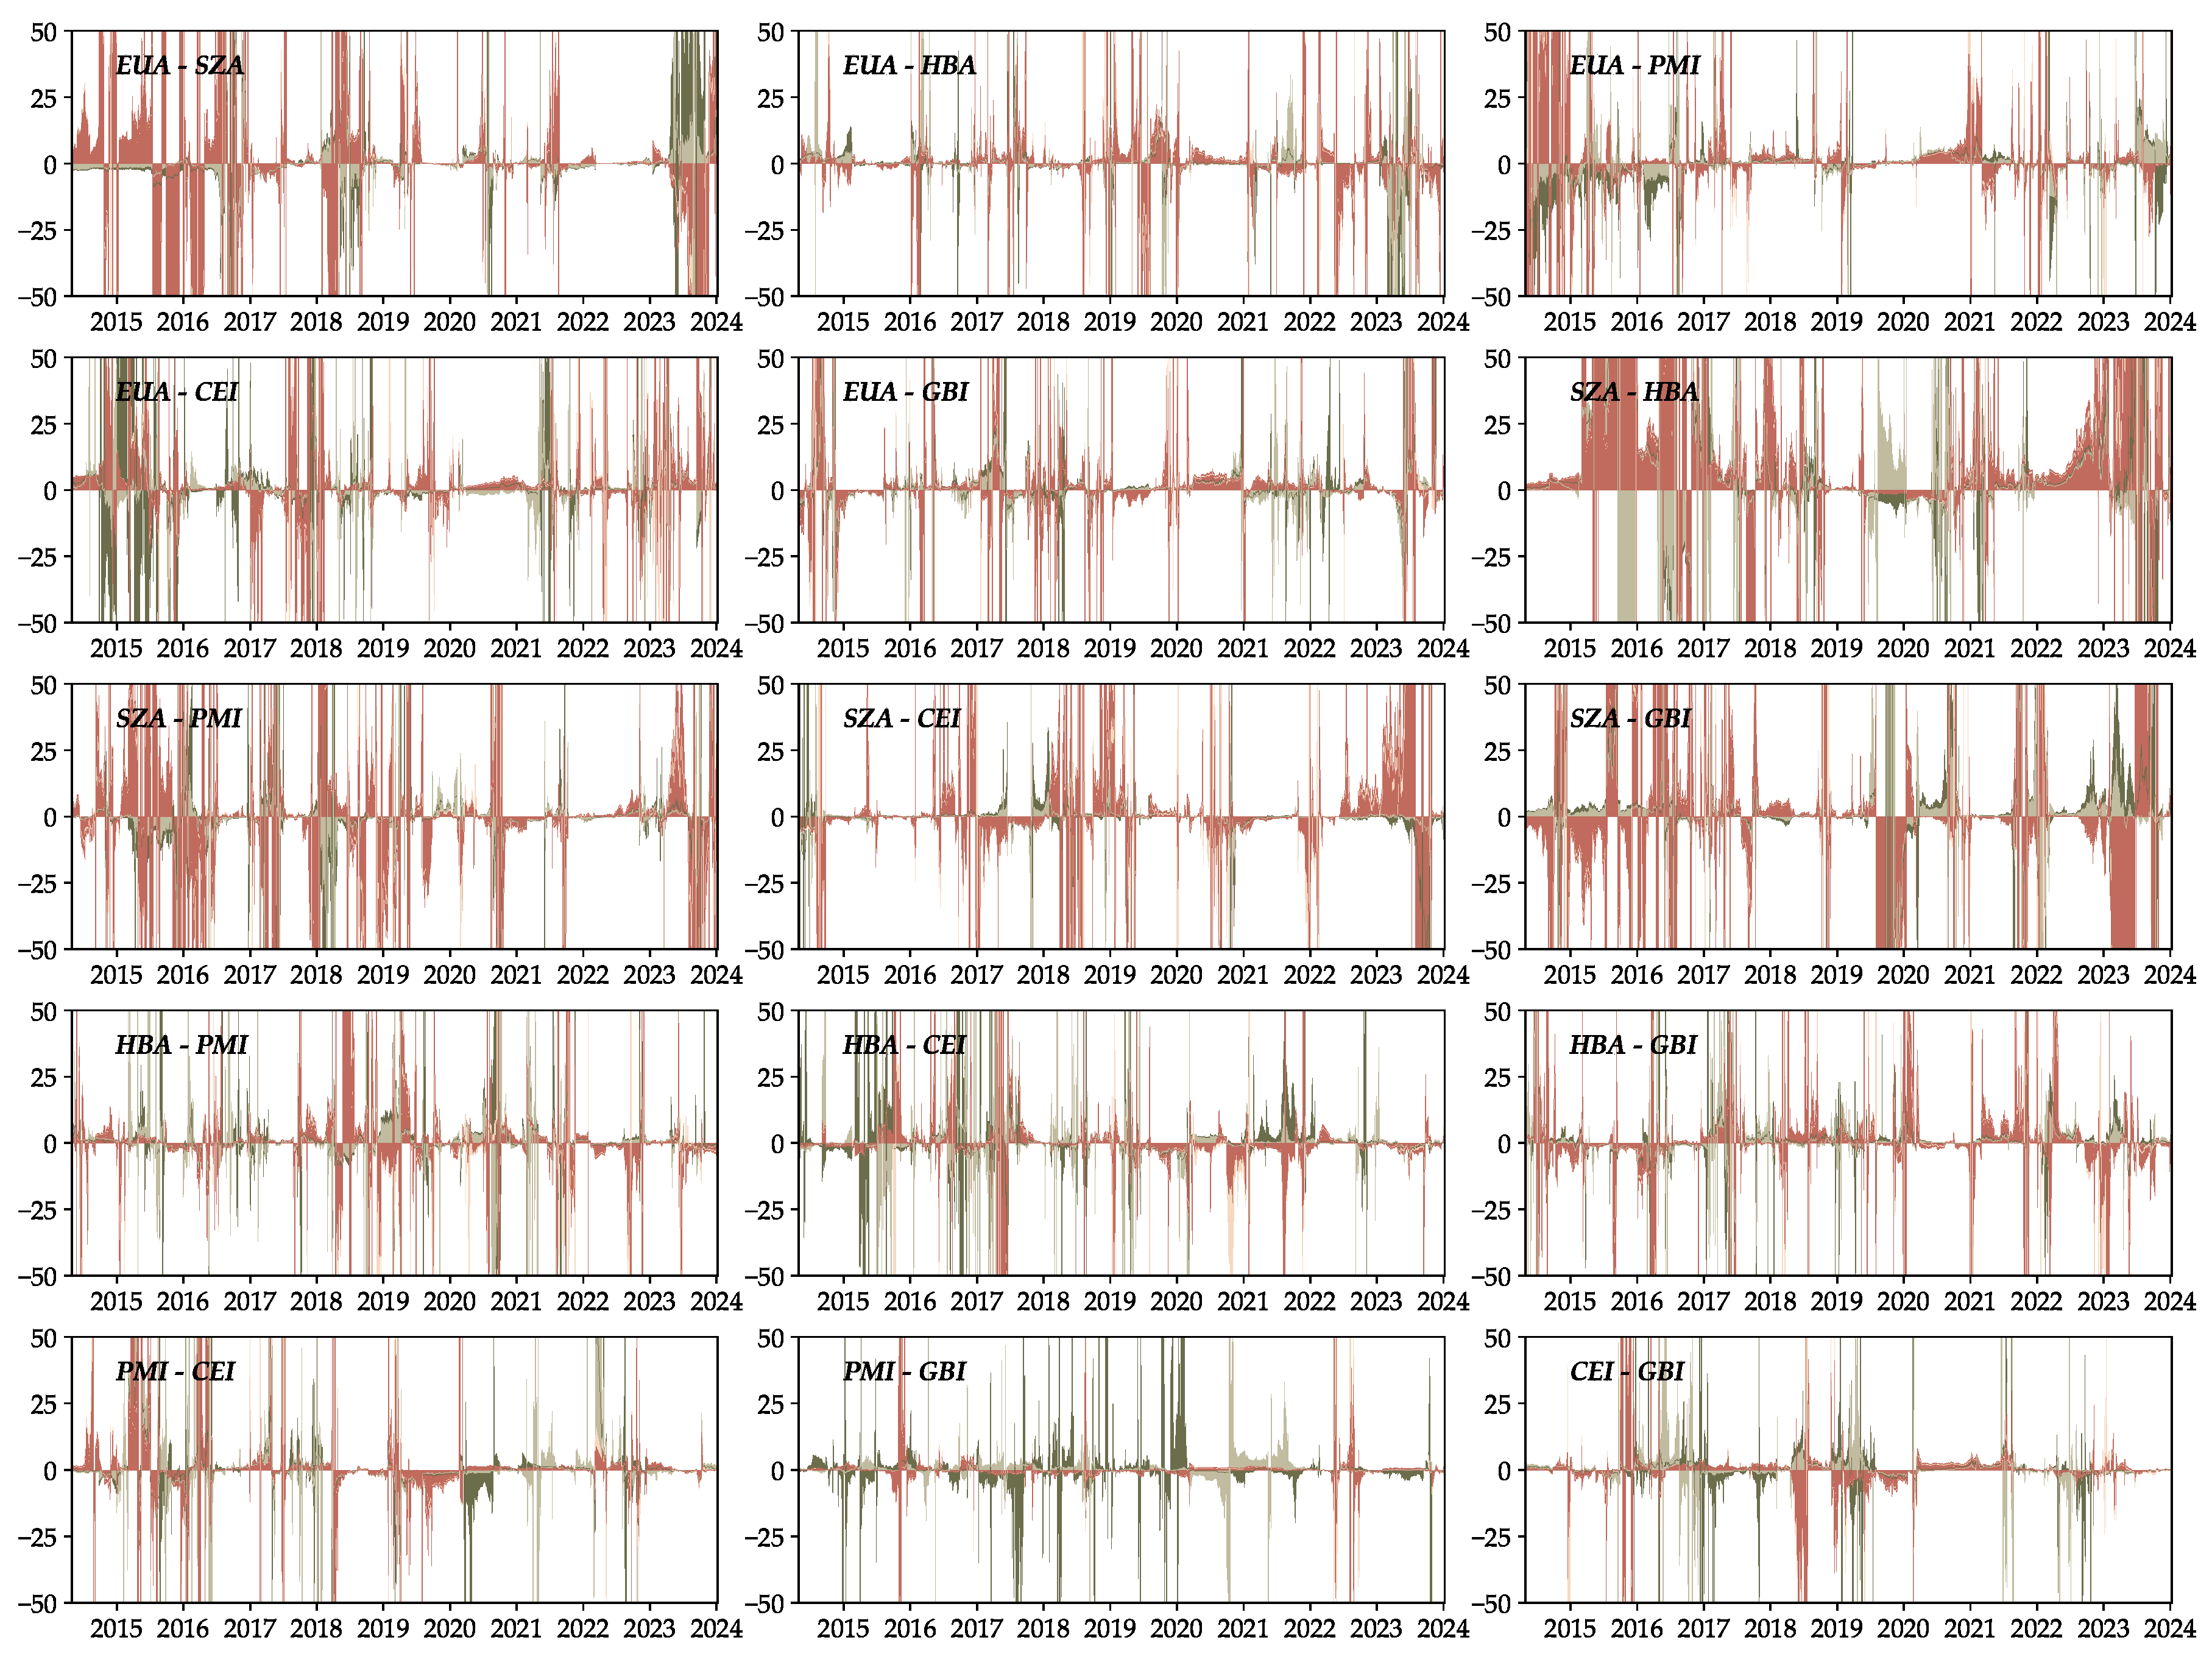
Figure A4.
Time-varying directional spillovers TO other markets. Notes: Refer to Figure 2 for the legend.
Figure A4.
Time-varying directional spillovers TO other markets. Notes: Refer to Figure 2 for the legend.
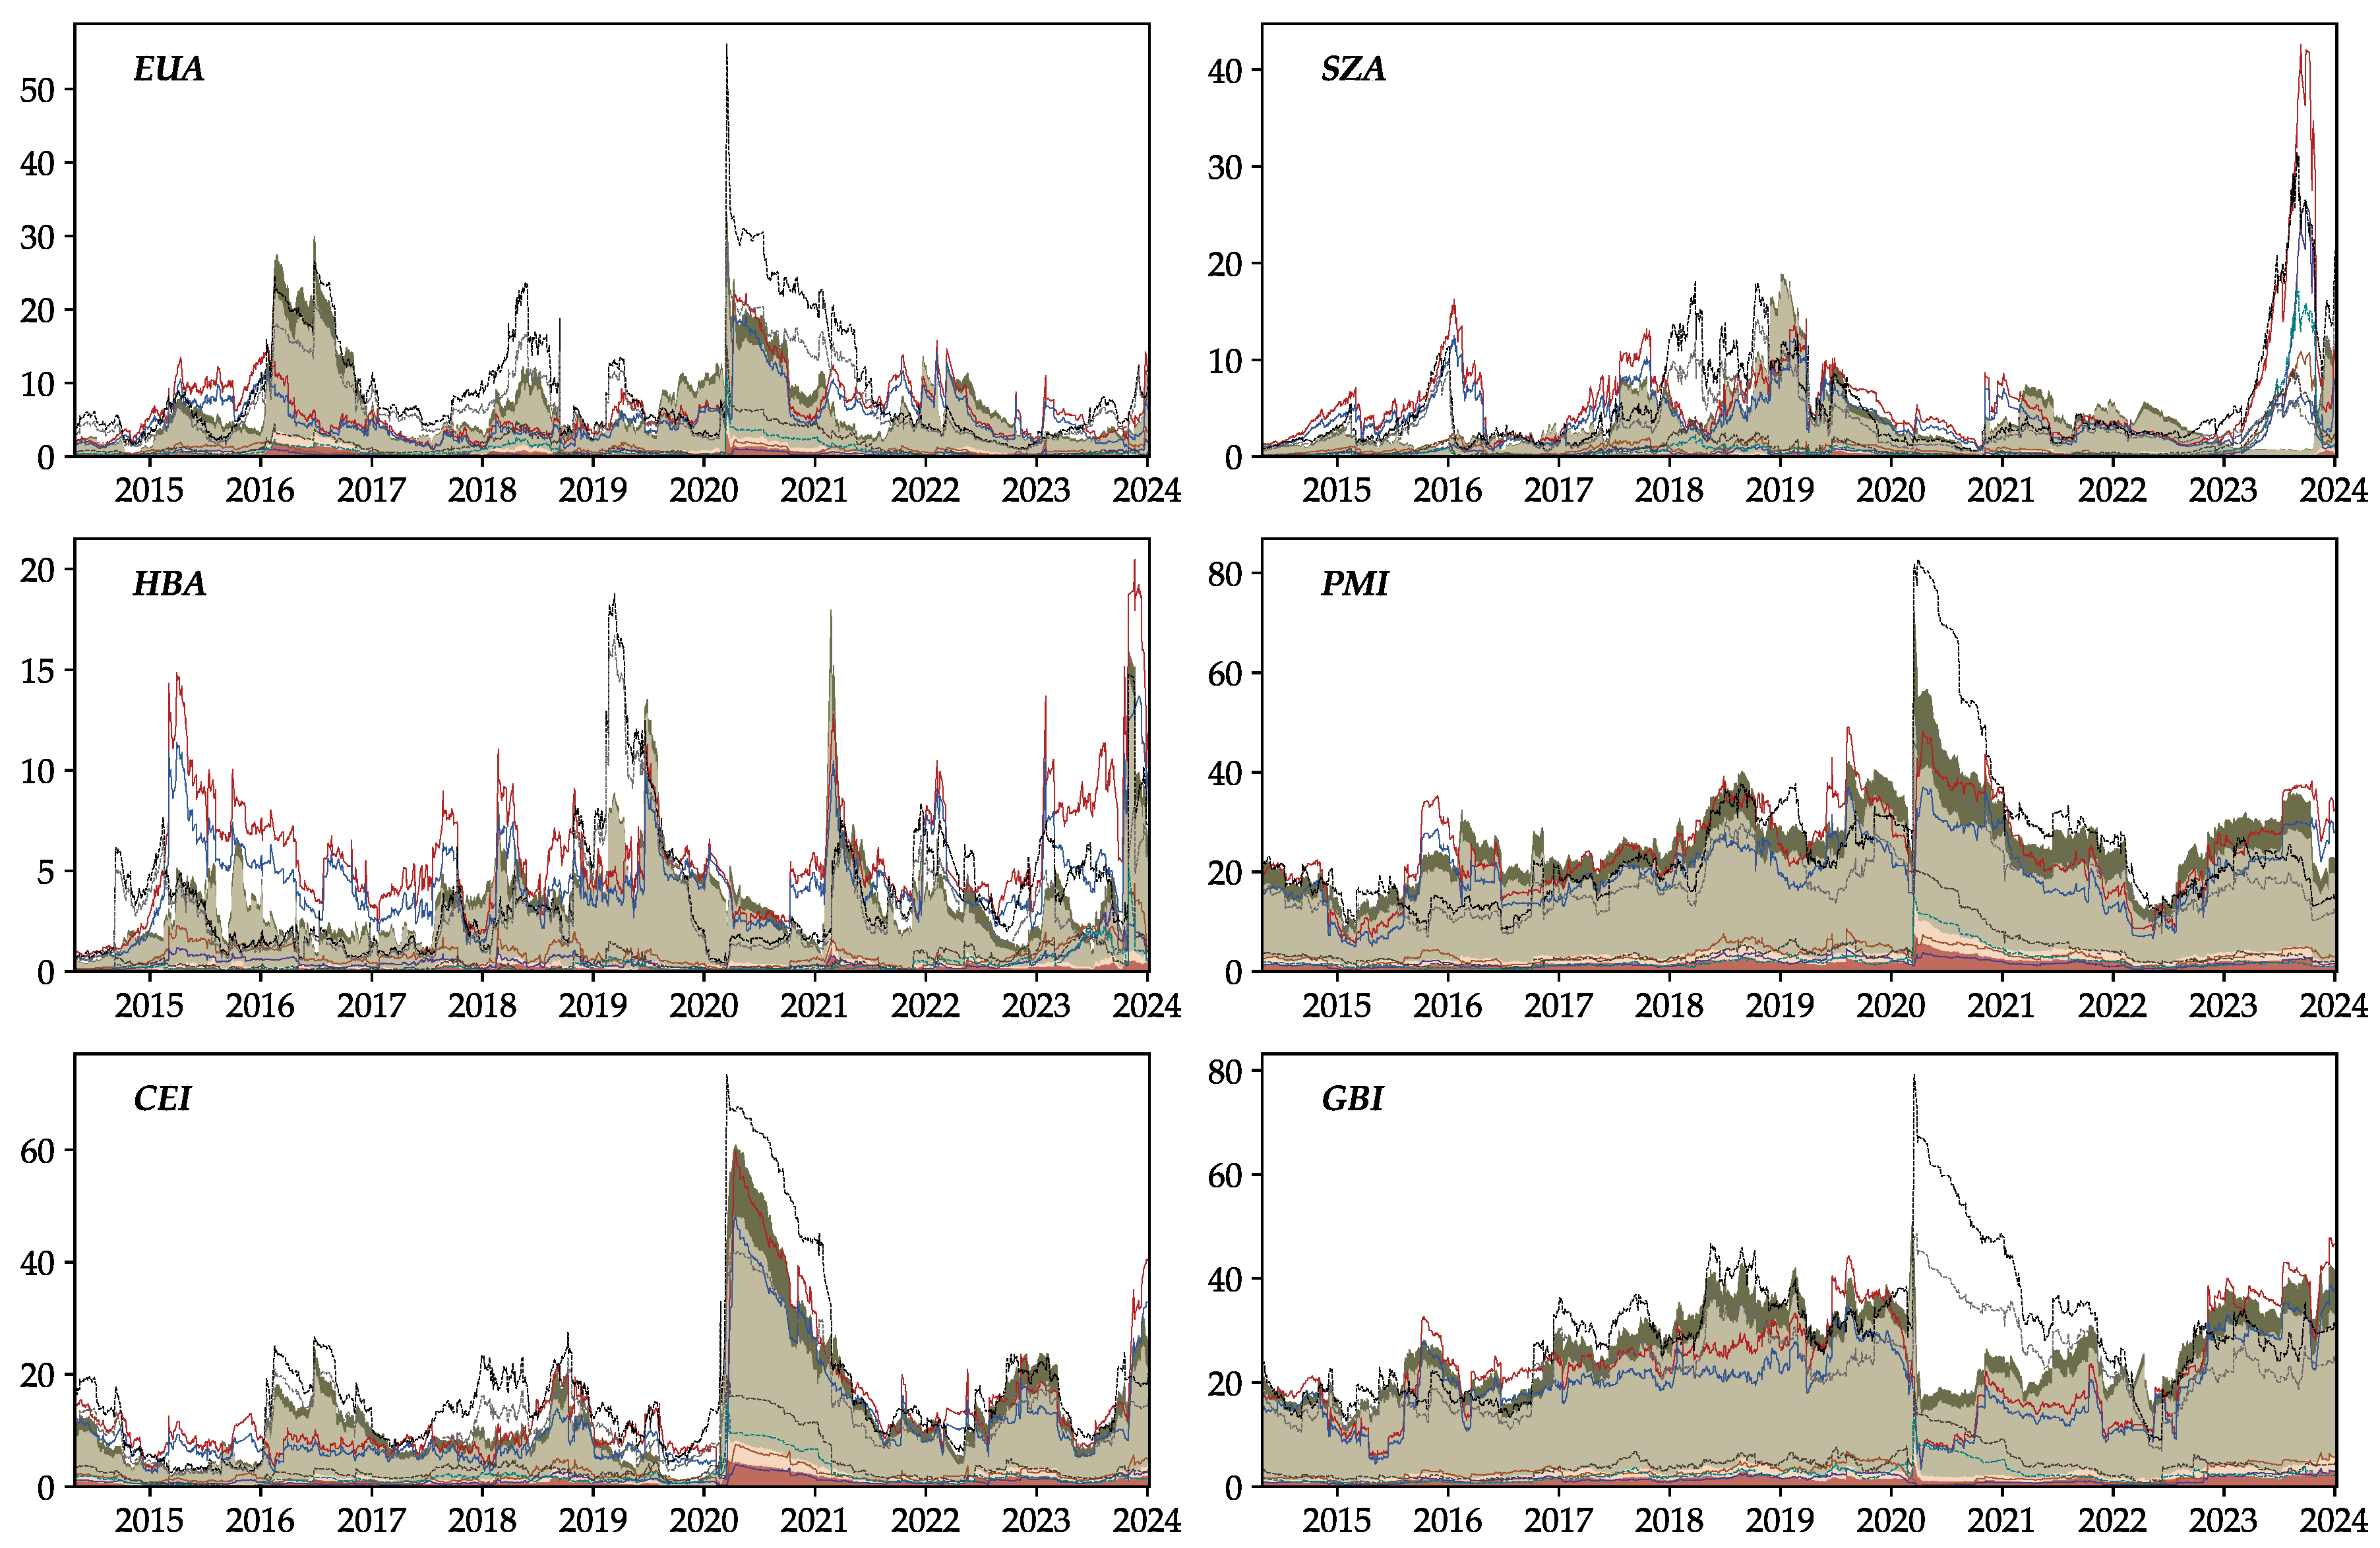
Figure A5.
Time-varying directional spillovers FROM other markets. Notes: Refer to Figure 2 for the legend.
Figure A5.
Time-varying directional spillovers FROM other markets. Notes: Refer to Figure 2 for the legend.
References
- Adekoya, O. B., Akinseye, A. B., Antonakakis, N., Chatziantoniou, I., Gabauer, D., & Oliyide, J. (2022). Crude oil and Islamic sectoral stocks: Asymmetric TVP-VAR connectedness and investment strategies. Resources Policy, 78, 102877. [CrossRef]
- Adekoya, O. B., Oliyide, J. A., & Noman, A. (2021). The volatility connectedness of the EU carbon market with commodity and financial markets in time- and frequency-domain: The role of the U.S. economic policy uncertainty. Resources Policy, 74, 102252. [CrossRef]
- Antonakakis, N., Chatziantoniou, I., & Gabauer, D. (2020). Refined Measures of Dynamic Connectedness based on Time-Varying Parameter Vector Autoregressions. Journal of Risk and Financial Management, 13(4). [CrossRef]
- Ao, Z., Fei, R., Jiang, H., Cui, L., & Zhu, Y. (2023). How can China achieve its goal of peaking carbon emissions at minimal cost? A research perspective from shadow price and optimal allocation of carbon emissions. Journal of Environmental Management, 325, 116458. [CrossRef]
- Bai, Y., & Okullo, S. J. (2023). Drivers and pass-through of the EU ETS price: Evidence from the power sector. Energy Economics, 123, 106698. [CrossRef]
- Baruník, J., Kočenda, E., & Vácha, L. (2016). Asymmetric connectedness on the U.S. stock market: Bad and good volatility spillovers. Journal of Financial Markets, 27, 55–78. [CrossRef]
- Baruník, J., & Křehlík, T. (2018). Measuring the Frequency Dynamics of Financial Connectedness and Systemic Risk. Journal of Financial Econometrics, 16(2), 271–296. [CrossRef]
- Bolton, P., & Kacperczyk, M. (2021). Do investors care about carbon risk? Journal of Financial Economics, 142(2), 517–549. [CrossRef]
- Chatziantoniou, I., Gabauer, D., & Gupta, R. (2023). Integration and risk transmission in the market for crude oil: New evidence from a time-varying parameter frequency connectedness approach. Resources Policy, 84, 103729. [CrossRef]
- Chen, H., Xu, C., & Peng, Y. (2022a). time–frequency connectedness between energy and nonenergy commodity markets during COVID-19: Evidence from China. Resources Policy, 78, 102874. [CrossRef]
- Chen, J., Liang, Z., Ding, Q., & Liu, Z. (2022b). Quantile connectedness between energy, metal, and carbon markets. International Review of Financial Analysis, 83, 102282. [CrossRef]
- Chen, X. H., Tee, K., Elnahass, M., & Ahmed, R. (2023a). Assessing the environmental impacts of renewable energy sources: A case study on air pollution and carbon emissions in China. Journal of Environmental Management, 345, 118525. [CrossRef]
- Chen, Y., Wei, Y., Bai, L., Zhang, J., & Wang, Z. (2023b). Connectedness and hedging effects among China’s nonferrous metal, crude oil and green bond markets: An extreme perspective. Finance Research Letters, 58, 104041. [CrossRef]
- Cong, R., & Lo, A. Y. (2017). Emission trading and carbon market performance in Shenzhen, China. Applied Energy, 193, 414–425. [CrossRef]
- Dai, Z., Zhang, X., & Yin, Z. (2023). Extreme time-varying spillovers between high carbon emission stocks, green bond and crude oil: Evidence from a quantile-based analysis. Energy Economics, 118, 106511. [CrossRef]
- Deng, J., Zheng, Y., Zhang, Y., Liu, C., & Pan, H. (2023). Dynamic Spillovers between Carbon Price and Power Sector Returns in China: A Network-Based Analysis before and after Launching National Carbon Emissions Trading Market. Energies, 16(14), Article 14. [CrossRef]
- Ding, Q., Huang, J., & Zhang, H. (2022). time–frequency spillovers among carbon, fossil energy and clean energy markets: The effects of attention to climate change. International Review of Financial Analysis, 83, 102222. [CrossRef]
- Dong, Q., Zhao, Y., Ma, X., & Zhou, Y. (2024). Risk spillover between carbon markets and stock markets from a progressive perspective: Measurements, spillover networks, and driving factors. Energy Economics, 129, 107228. [CrossRef]
- Duan, H., Yuan, D., Cai, Z., & Wang, S. (2022). Valuing the impact of climate change on China’s economic growth. Economic Analysis and Policy, 74, 155–174. [CrossRef]
- Duan, K., Ren, X., Shi, Y., Mishra, T., & Yan, C. (2021). The marginal impacts of energy prices on carbon price variations: Evidence from a quantile-on-quantile approach. Energy Economics, 95, 105131. [CrossRef]
- Duan, X., Xiao, Y., Ren, X., Taghizadeh-Hesary, F., & Duan, K. (2023). Dynamic spillover between traditional energy markets and emerging green markets: Implications for sustainable development. Resources Policy, 82, 103483. [CrossRef]
- Elliott, G., Rothenberg, T., & Stock, J. H. (1996). Efficient Tests for an Autoregressive Unit Root. Econometrica, 64, 813-836.
- Fisher, T. J., & Gallagher, C. M. (2012). New Weighted Portmanteau Statistics for Time Series Goodness of Fit Testing. Journal of the American Statistical Association, 107(498), 777–787. [CrossRef]
- Furuoka, F., Yaya, O. S., Ling, P. K., Al-Faryan, M. A. S., & Islam, M. N. (2023). Transmission of risks between energy and agricultural commodities: Frequency time-varying VAR, asymmetry and portfolio management. Resources Policy, 81, 103339. [CrossRef]
- Gabauer, D. (2021). Dynamic measures of asymmetric & pairwise connectedness within an optimal currency area: Evidence from the ERM I system. Journal of Multinational Financial Management, 60, 100680. [CrossRef]
- Gabauer, D. (2022). ConnectednessApproach: Connectedness Approach. https://CRAN.R-project.org/package=ConnectednessApproach.
- Gao, Q., Zeng, H., Sun, G., & Li, J. (2023). Extreme risk spillover from uncertainty to carbon markets in China and the EU—A time varying copula approach. Journal of Environmental Management, 326, 116634. [CrossRef]
- Guo, L.-Y., & Feng, C. (2021). Are there spillovers among China’s pilots for carbon emission allowances trading? Energy Economics, 103, 105574. [CrossRef]
- Guo, X., Wang, Y., Hao, Y., & Zhang, W. (2023). Spillover effect among carbon bond market, carbon stock market and energy stock market: Evidence from China. Finance Research Letters, 58, 104521. [CrossRef]
- Hanif, W., Arreola Hernandez, J., Mensi, W., Kang, S. H., Uddin, G. S., & Yoon, S.-M. (2021). Nonlinear dependence and connectedness between clean/renewable energy sector equity and European emission allowance prices. Energy Economics, 101, 105409. [CrossRef]
- Hartvig, Á. D., Pap, Á., & Pálos, P. (2023). EU Climate Change News Index: Forecasting EU ETS prices with online news. Finance Research Letters, 54, 103720. [CrossRef]
- Hwang, Q., Yao, M., Li, S., Wang, F., Luo, Z., Li, Z., & Liu, T. (2023). Risk Spillovers between China’s Carbon and Energy Markets. Energies, 16(19), Article 19. [CrossRef]
- ICAP. (2024). Emissions Trading Worldwide: 2024 ICAP Status Report. International Carbon Action Partnership. https://icapcarbonaction.com/en/publications/emissions-trading-worldwide-2024-icap-status-report.
- IEA. (2020). China’s Emissions Trading Scheme. IEA. https://www.iea.org/reports/chinas-emissions-trading-scheme.
- Iqbal, N., Naeem, M. A., & Suleman, M. T. (2022). Quantifying the asymmetric spillovers in sustainable investments. Journal of International Financial Markets, Institutions and Money, 77, 101480. [CrossRef]
- Jarque, C. M., & Bera, A. K. (1980). Efficient tests for normality, homoscedasticity and serial independence of regression residuals. Economics Letters, 6(3), 255–259. [CrossRef]
- Jiang, W., & Chen, Y. (2022a). The time–frequency connectedness among carbon, traditional/new energy and material markets of China in pre- and post-COVID-19 outbreak periods. Energy, 246, 123320. [CrossRef]
- Jiang, W., & Chen, Y. (2022b). The time–frequency connectedness among metal, energy and carbon markets pre and during COVID-19 outbreak. Resources Policy, 77, 102763. [CrossRef]
- Jiang, W., Dong, L., & Liu, X. (2023). How does COVID-19 affect the spillover effects of green finance, carbon markets, and renewable/non-renewable energy markets? Evidence from China. Energy, 281, 128351. [CrossRef]
- Koop, G., & Korobilis, D. (2014). A new index of financial conditions. European Economic Review, 71, 101–116. [CrossRef]
- Koop, G., Pesaran, M. H., & Potter, S. M. (1996). Impulse response analysis in nonlinear multivariate models. Journal of Econometrics, 74(1), 119–147. [CrossRef]
- Li, H., Li, Y., & Zhang, H. (2023). The spillover effects among the traditional energy markets, metal markets and sub-sector clean energy markets. Energy, 275, 127384. [CrossRef]
- Li, M., Weng, Y., & Duan, M. (2019). Emissions, energy and economic impacts of linking China’s national ETS with the EU ETS. Applied Energy, 235, 1235–1244. [CrossRef]
- Li, Y., Nie, D., Li, B., & Li, X. (2020). The Spillover Effect between Carbon Emission Trading (CET) Price and Power Company Stock Price in China. Sustainability, 12(16). [CrossRef]
- Liang, Y., Jin, X., & Taghvaee, V. (2024). Sustainable development spillover effects among selected Asian countries: Analysis of integrated sustainability perspective. Socio-Economic Planning Sciences, 91, 101781. [CrossRef]
- Lin, B., & Zhang, C. (2022). The overall and time-varying efficiency test for the carbon market in China. Journal of Environmental Management, 322, 116072. [CrossRef]
- Liu, J., Hu, Y., Yan, L.-Z., & Chang, C.-P. (2023a). Volatility spillover and hedging strategies between the European carbon emissions and energy markets. Energy Strategy Reviews, 46, 101058. [CrossRef]
- Liu, M., Guo, T., Ping, W., & Luo, L. (2023b). Sustainability and stability: Will ESG investment reduce the return and volatility spillover effects across the Chinese financial market? Energy Economics, 121, 106674. [CrossRef]
- Lorente, D. B., Mohammed, K. S., Cifuentes-Faura, J., & Shahzad, U. (2023). Dynamic connectedness among climate change index, green financial assets and renewable energy markets: Novel evidence from sustainable development perspective. Renewable Energy, 204, 94–105. [CrossRef]
- Lyu, C., & Scholtens, B. (2024). Integration of the international carbon market: A time-varying analysis. Renewable and Sustainable Energy Reviews, 191, 114102. [CrossRef]
- Maheen, R., Cai, L., Zhang, Y. S., & Zhao, M. (2023). Quantitative analysis of carbon dioxide emission reduction pathways: Towards carbon neutrality in China’s power sector. Carbon Capture Science & Technology, 7, 100112. [CrossRef]
- Meng, B., Wei, B., Yang, M., & Kuang, H. (2023). Measuring the time–frequency spillover effect among carbon markets and shipping energy markets: A global perspective. Energy Economics, 128, 107133. [CrossRef]
- Mishra, T., Park, D., Parhi, M., Uddin, G. S., & Tian, S. (2023). A memory in the bond: Green bond and sectoral investment interdependence in a fractionally cointegrated VAR framework. Energy Economics, 121, 106652. [CrossRef]
- Mohamad Taghvaee, V., Assari Arani, A., & Agheli, L. (2022). Sustainable development spillover effects between North America and MENA: Analyzing the integrated sustainability perspective. Environmental and Sustainability Indicators, 14, 100182. [CrossRef]
- Monasterolo, I., & Raberto, M. (2018). The EIRIN Flow-of-funds Behavioural Model of Green Fiscal Policies and Green Sovereign Bonds. Ecological Economics, 144, 228–243. [CrossRef]
- Mzoughi, H., Urom, C., & Guesmi, K. (2022). Downside and upside risk spillovers between green finance and energy markets. Finance Research Letters, 47, 102612. [CrossRef]
- Pesaran, H. H., & Shin, Y. (1998). Generalized impulse response analysis in linear multivariate models. Economics Letters, 58(1), 17–29. [CrossRef]
- Qi, H., Wu, T., Chen, H., & Lu, X. (2023). time–frequency connectedness and cross-quantile dependence between carbon emission trading and commodity markets: Evidence from China. Resources Policy, 82, 103418. [CrossRef]
- Qiao, S., Dang, Y. J., Ren, Z. Y., & Zhang, K. Q. (2023). The dynamic spillovers among carbon, fossil energy and electricity markets based on a TVP-VAR-SV method. Energy, 266, 126344. [CrossRef]
- Reboredo, J. C., & Ugolini, A. (2020). Price spillovers between rare earth stocks and financial markets. Resources Policy, 66, 101647. [CrossRef]
- Song, X., Wang, D., Zhang, X., He, Y., & Wang, Y. (2022). A comparison of the operation of China’s carbon trading market and energy market and their spillover effects. Renewable and Sustainable Energy Reviews, 168, 112864. [CrossRef]
- Su, C.-W., Pang, L.-D., Qin, M., Lobonţ, O.-R., & Umar, M. (2023). The spillover effects among fossil fuel, renewables and carbon markets: Evidence under the dual dilemma of climate change and energy crises. Energy, 274, 127304. [CrossRef]
- Sun, L., Xiang, M., & Shen, Q. (2020). A comparative study on the volatility of EU and China’s carbon emission permits trading markets. Physica A: Statistical Mechanics and Its Applications, 560, 125037. [CrossRef]
- Tiwari, A. K., Aikins Abakah, E. J., Gabauer, D., & Dwumfour, R. A. (2022). Dynamic spillover effects among green bond, renewable energy stocks and carbon markets during COVID-19 pandemic: Implications for hedging and investments strategies. Global Finance Journal, 51, 100692. [CrossRef]
- Umar, Z., Hadhri, S., Abakah, E. J. A., Usman, M., & Umar, M. (2024). Return and volatility spillovers among oil price shocks and international green bond markets. Research in International Business and Finance, 69, 102254. [CrossRef]
- Vn, L., & Bo, N. K. Q. (2022). The relationship between global stock and precious metals under Covid-19 and happiness perspectives. Resources Policy, 77, 102634. [CrossRef]
- Wang, D., & Dou, W. (2023). Research on the synergy mechanism of multiple subjects in global climate governance: Based on the perspective of the evolutionary game of carbon neutral strategy between China, the US, and the EU. Journal of Cleaner Production, 419, 138306. [CrossRef]
- Wang, D., Sun, Y., & Wang, Y. (2024a). Comparing the EU and Chinese carbon trading market operations and their spillover effects. Journal of Environmental Management, 351, 119795. [CrossRef]
- Wang, K.-H., Wang, Z.-S., Yunis, M., & Kchouri, B. (2023). Spillovers and connectedness among climate policy uncertainty, energy, green bond and carbon markets: A global perspective. Energy Economics, 128, 107170. [CrossRef]
- Wang, Y., & Guo, Z. (2018). The dynamic spillover between carbon and energy markets: New evidence. Energy, 149, 24–33. [CrossRef]
- Wang, Y., Liu, S., Abedin, M. Z., & Lucey, B. (2024b). Volatility spillover and hedging strategies among Chinese carbon, energy, and electricity markets. Journal of International Financial Markets, Institutions and Money, 91, 101938. [CrossRef]
- Wei, P., Yuan, K., Ren, X., Yan, C., & Lu, Z. (2023a). Time-varying spillover networks of green bond and related financial markets. International Review of Economics & Finance, 88, 298–317. [CrossRef]
- Wei, Y., Zhang, J., Bai, L., & Wang, Y. (2023b). Connectedness among El Niño-Southern Oscillation, carbon emission allowance, crude oil and renewable energy stock markets: Time- and frequency-domain evidence based on TVP-VAR model. Renewable Energy, 202, 289–309. [CrossRef]
- Wu, Q., Wang, M., & Tian, L. (2020). The market-linkage of the volatility spillover between traditional energy price and carbon price on the realization of carbon value of emission reduction behavior. Journal of Cleaner Production, 245, 118682. [CrossRef]
- Wu, R., & Qin, Z. (2024). Asymmetric volatility spillovers among new energy, ESG, green bond and carbon markets. Energy, 130504. [CrossRef]
- Wu, R., Qin, Z., & Liu, B.-Y. (2022). A systemic analysis of dynamic frequency spillovers among carbon emissions trading (CET), fossil energy and sectoral stock markets: Evidence from China. Energy, 254, 124176. [CrossRef]
- Wu, R., Qin, Z., & Liu, B.-Y. (2023). Connectedness between carbon and sectoral commodity markets: Evidence from China. Research in International Business and Finance, 66, 102073. [CrossRef]
- Wu, X., & Jiang, Z. (2023). Time-varying asymmetric volatility spillovers among China’s carbon markets, new energy market and stock market under the shocks of major events. Energy Economics, 126, 107004. [CrossRef]
- Xu, Y. (2021). Risk spillover from energy market uncertainties to the Chinese carbon market. Pacific-Basin Finance Journal, 67, 101561. [CrossRef]
- Xu, Y., & Salem, S. (2021). Explosive behaviors in Chinese carbon markets: Are there price bubbles in eight pilots? Renewable and Sustainable Energy Reviews, 145, 111089. [CrossRef]
- Yahya, F., Abbas, G., & Lee, C.-C. (2023). Asymmetric effects and volatility transmission from metals markets to solar energy stocks: Evidence from DCC, ADCC, and quantile regression approach. Resources Policy, 82, 103501. [CrossRef]
- You, K., Raju Chinthalapati, V. L., Mishra, T., & Patra, R. (2024). International trade network and stock market connectedness: Evidence from eleven major economies. Journal of International Financial Markets, Institutions and Money, 91, 101939. [CrossRef]
- Yu, P., Xu, H., & Chen, J. (2024a). Can ESG Integration Enhance the Stability of Disruptive Technology Stock Investments? Evidence from Copula-Based Approaches. Journal of Risk and Financial Management, 17(5). [CrossRef]
- Yu, P., Xu, H., & Chen, J. (2024b). Double Asymmetric Impacts, Dynamic Correlations, and Risk Management Amidst Market Risks: A Comparative Study between the US and China. Journal of Risk and Financial Management, 17(3), Article 3. [CrossRef]
- Yu, X., Wan, K., & Du, Q. (2023). Can carbon market policies achieve a “point-to-surface” effect?—Quasi-experimental evidence from China. Energy Policy, 183, 113803. [CrossRef]
- Zeng, S., Jia, J., Su, B., Jiang, C., & Zeng, G. (2021). The volatility spillover effect of the European Union (EU) carbon financial market. Journal of Cleaner Production, 282, 124394. [CrossRef]
- Zhang, H., Gong, Z., Yang, Y., & Chen, F. (2023a). Dynamic connectedness between China green bond, carbon market and traditional financial markets: Evidence from quantile connectedness approach. Finance Research Letters, 58, 104473. [CrossRef]
- Zhang, S., Kaikun, W., Yastrubskyi, M., & Huang, C. (2023b). Carbon emissions from international trade and consumption: Assessing the role of cumulative risk for EU and Chinese economic development. Energy Strategy Reviews, 50, 101219. [CrossRef]
- Zhang, W., He, X., & Hamori, S. (2022). Volatility spillover and investment strategies among sustainability-related financial indexes: Evidence from the DCC-GARCH-based dynamic connectedness and DCC-GARCH t-copula approach. International Review of Financial Analysis, 83, 102223. [CrossRef]
- Zhang, W., He, X., & Hamori, S. (2023c). The impact of the COVID-19 pandemic and Russia-Ukraine war on multiscale spillovers in green finance markets: Evidence from lower and higher order moments. International Review of Financial Analysis. https://api.semanticscholar.org/CorpusID:259713031.
- Zheng, Y., Wen, F., Deng, H., & Zeng, A. (2022). The relationship between carbon market attention and the EU CET market: Evidence from different market conditions. Finance Research Letters, 50, 103140. [CrossRef]
- Zhou, Y., Wu, S., & Zhang, Z. (2022). Multidimensional risk spillovers among carbon, energy and nonferrous metals markets: Evidence from the quantile VAR network. Energy Economics, 114, 106319. [CrossRef]
- Zhu, B., Ye, S., He, K., Chevallier, J., & Xie, R. (2019). Measuring the risk of European carbon market: An empirical mode decomposition-based value at risk approach. Annals of Operations Research, 281(1), 373–395. [CrossRef]
Figure 1.
Average risk spillovers. Note: The risk spillovers from oneself are excluded.
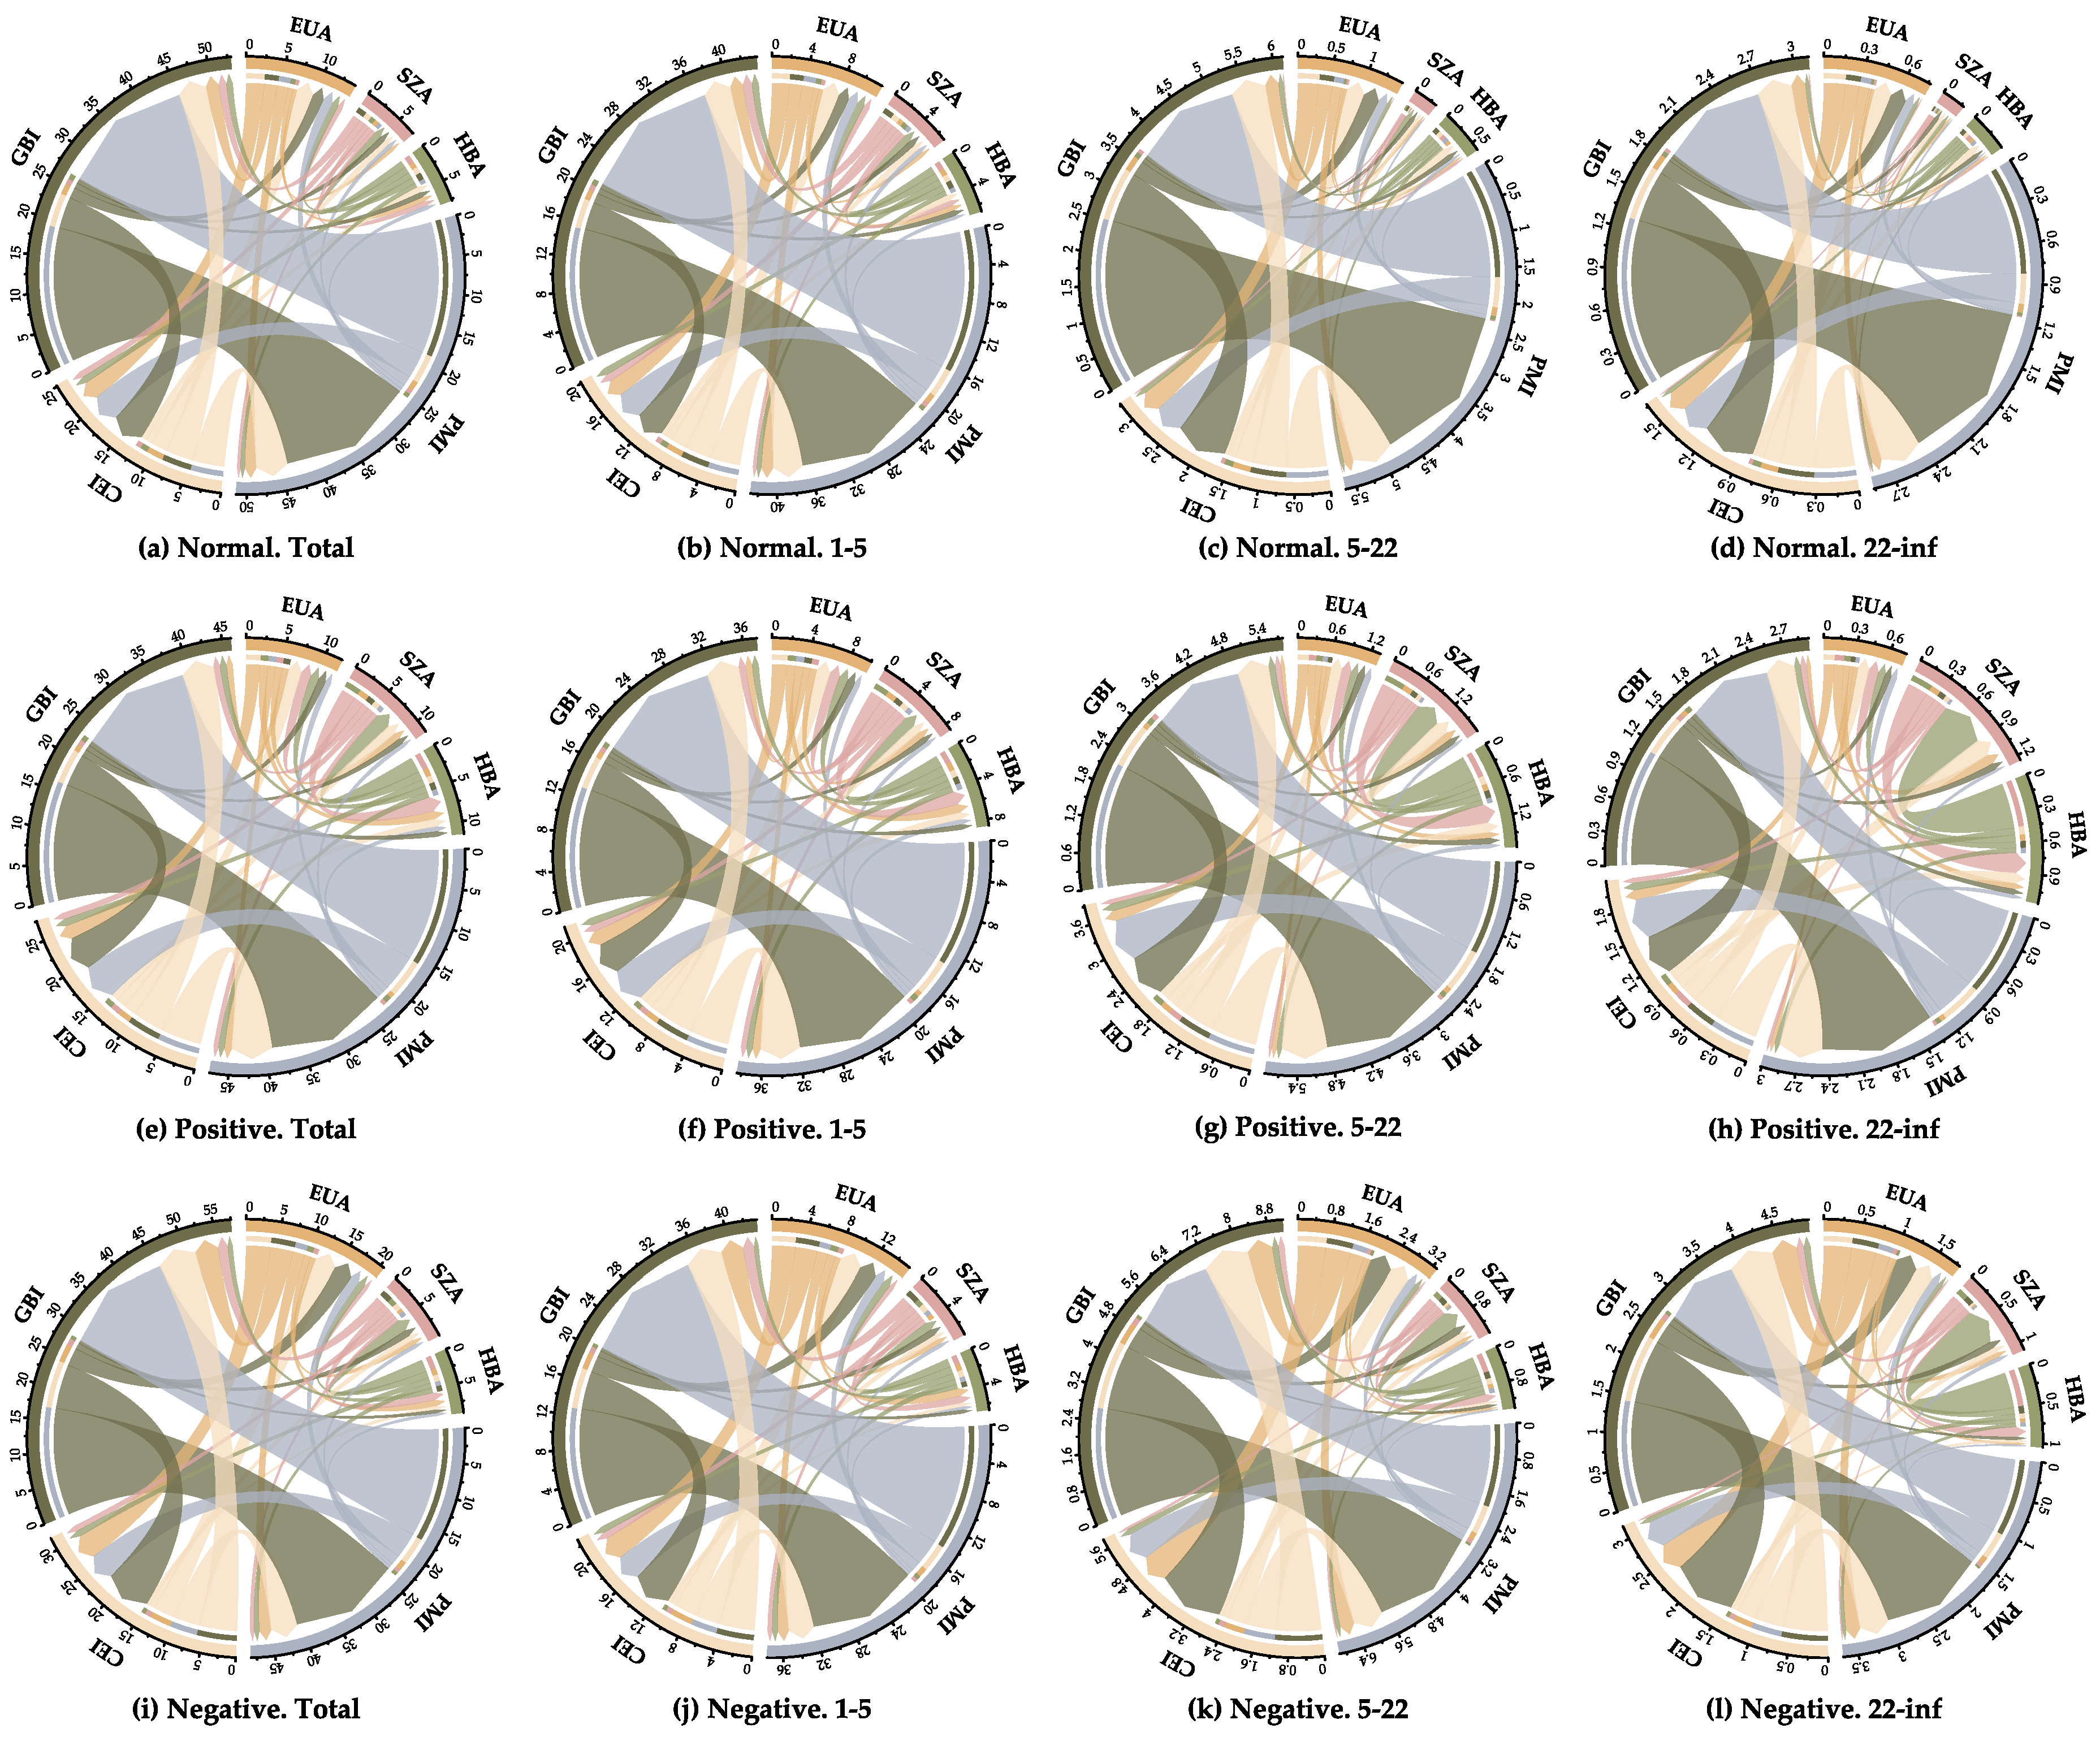
Figure 2.
Time-varying TCI.
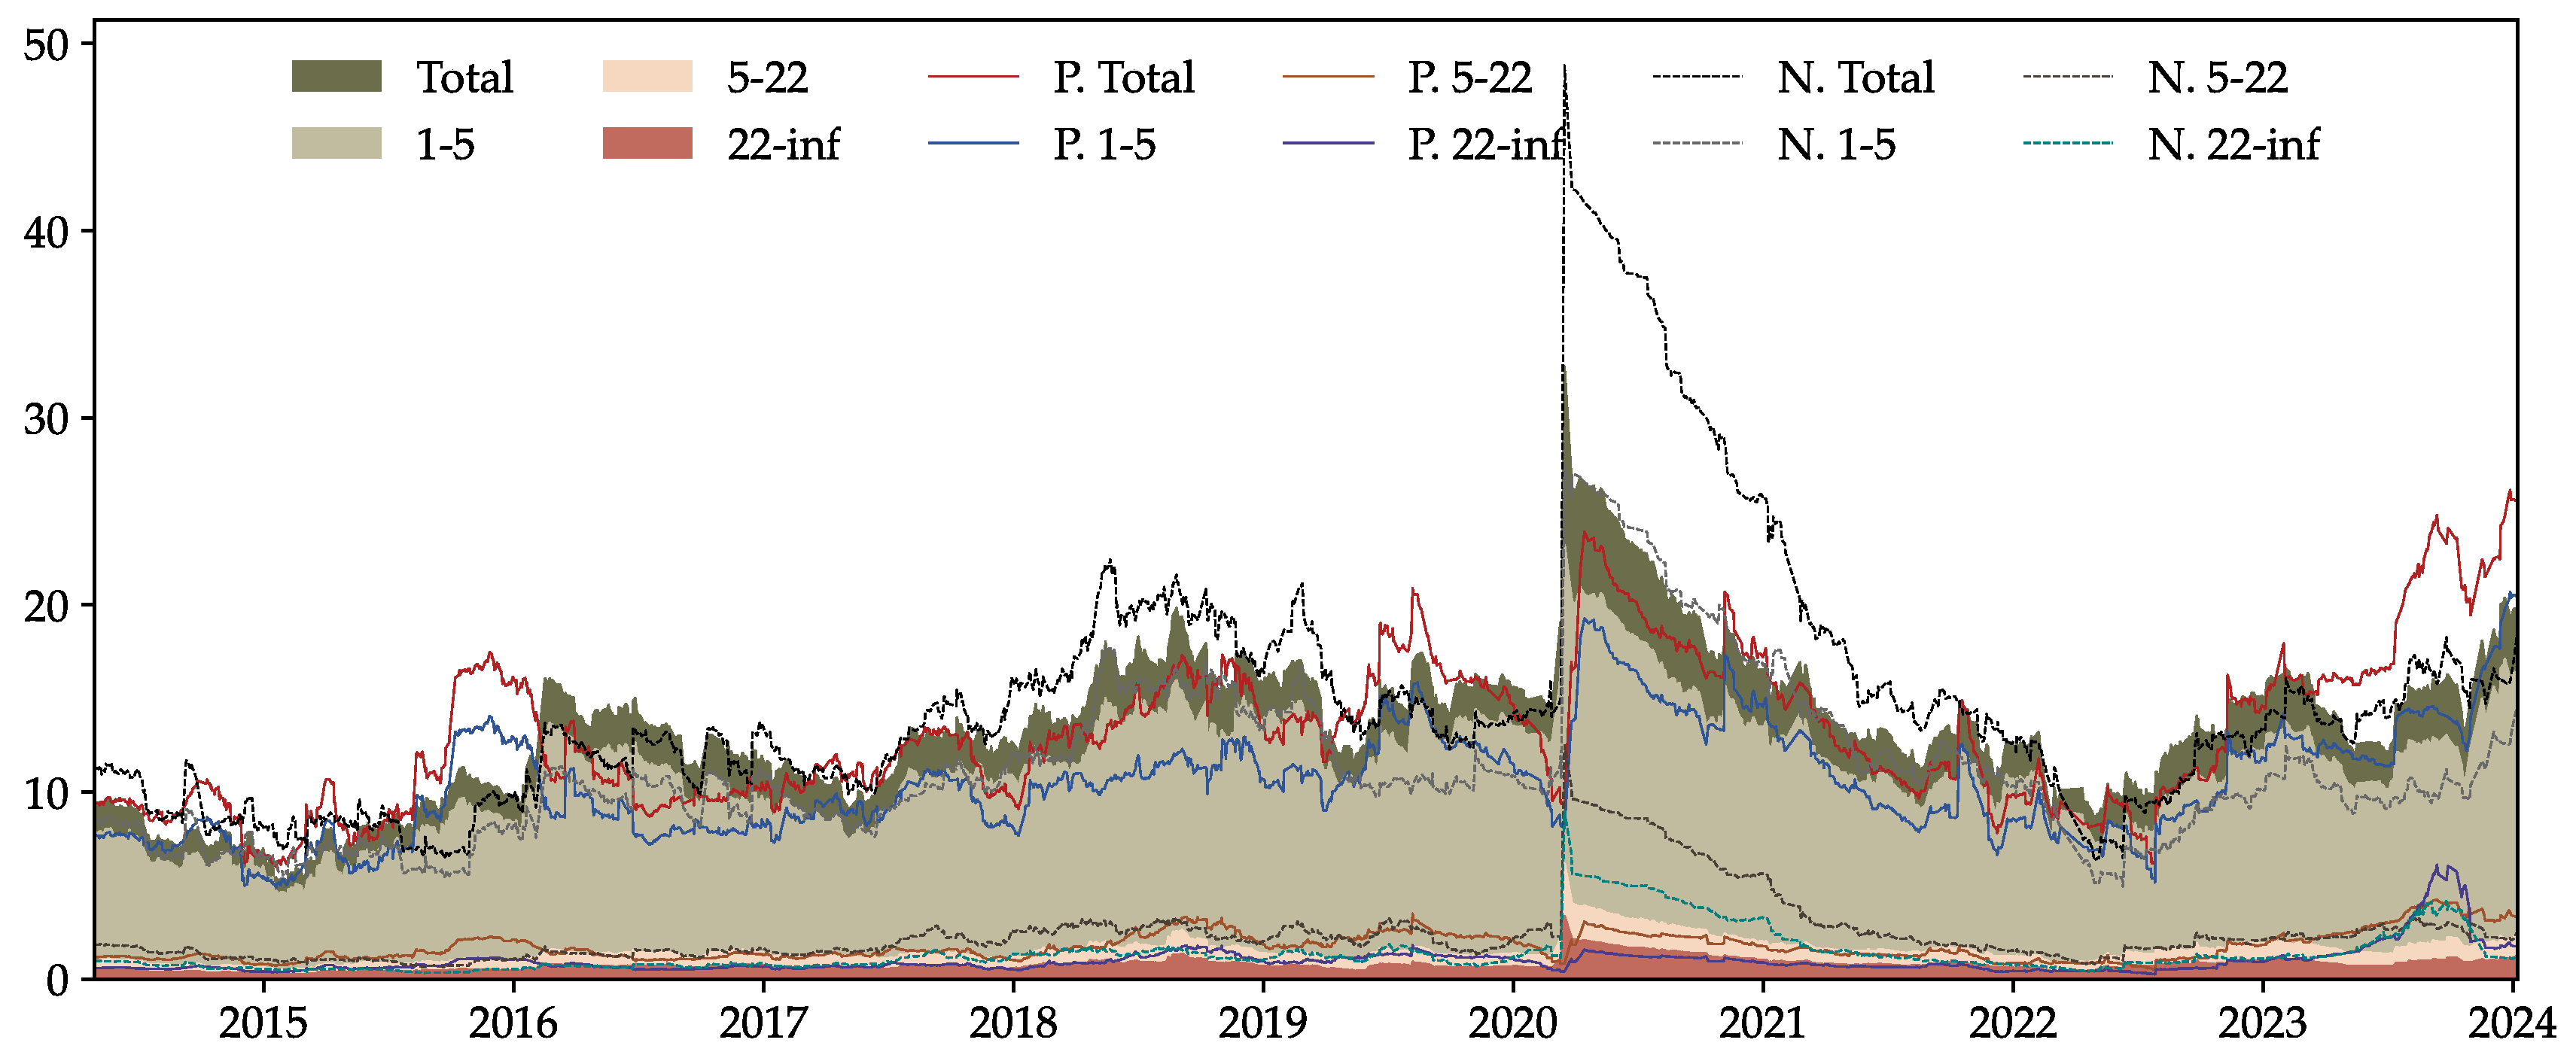
Figure 3.
Asymmetry of TCI.
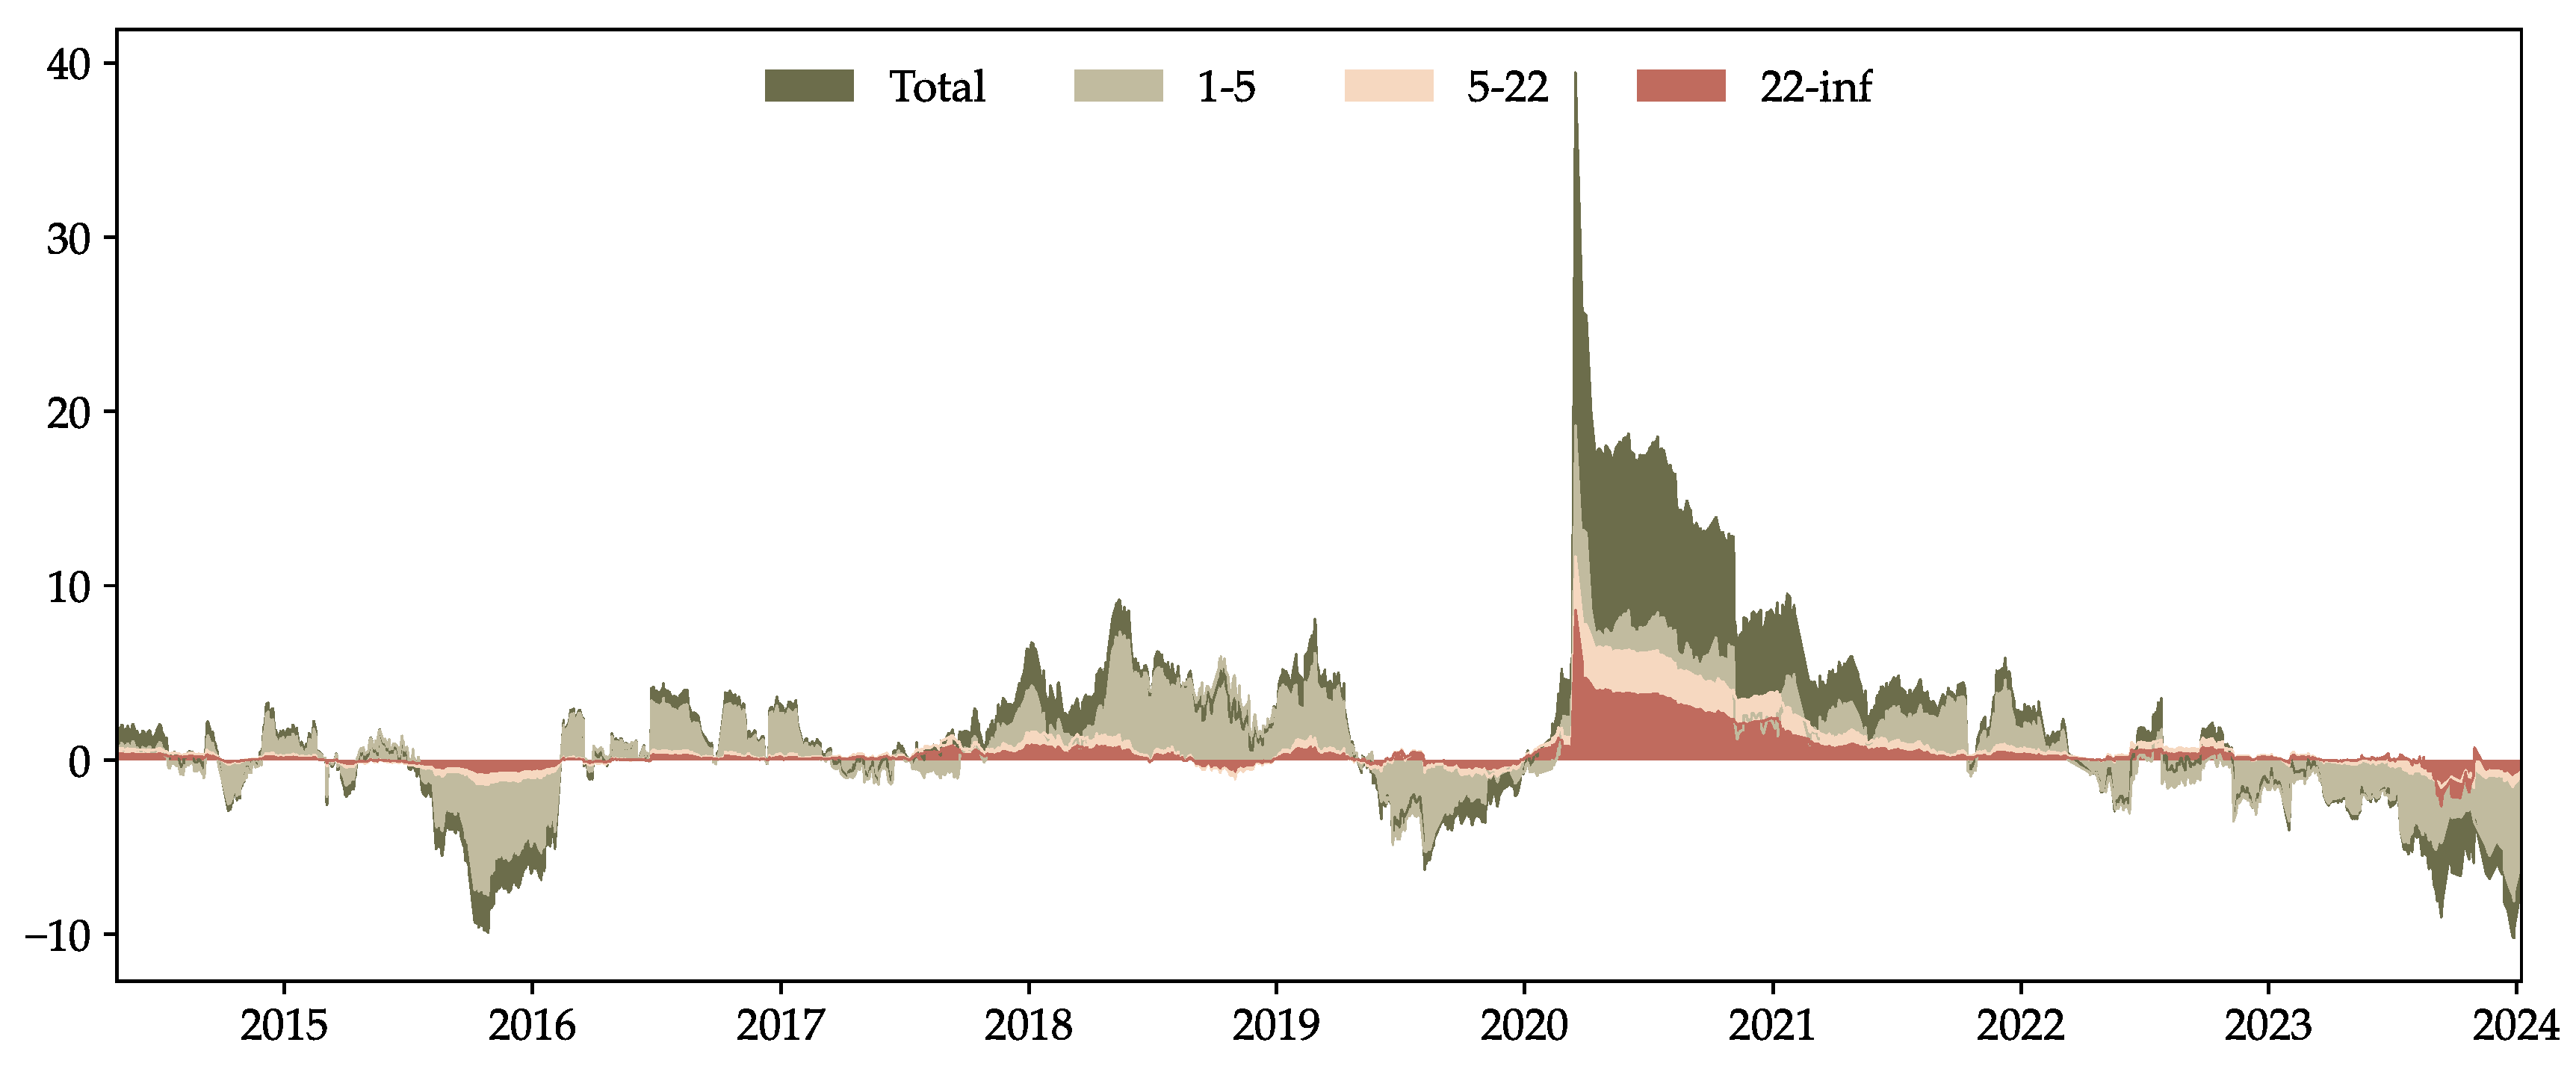
Figure 4.
Normalized asymmetry of TCI.
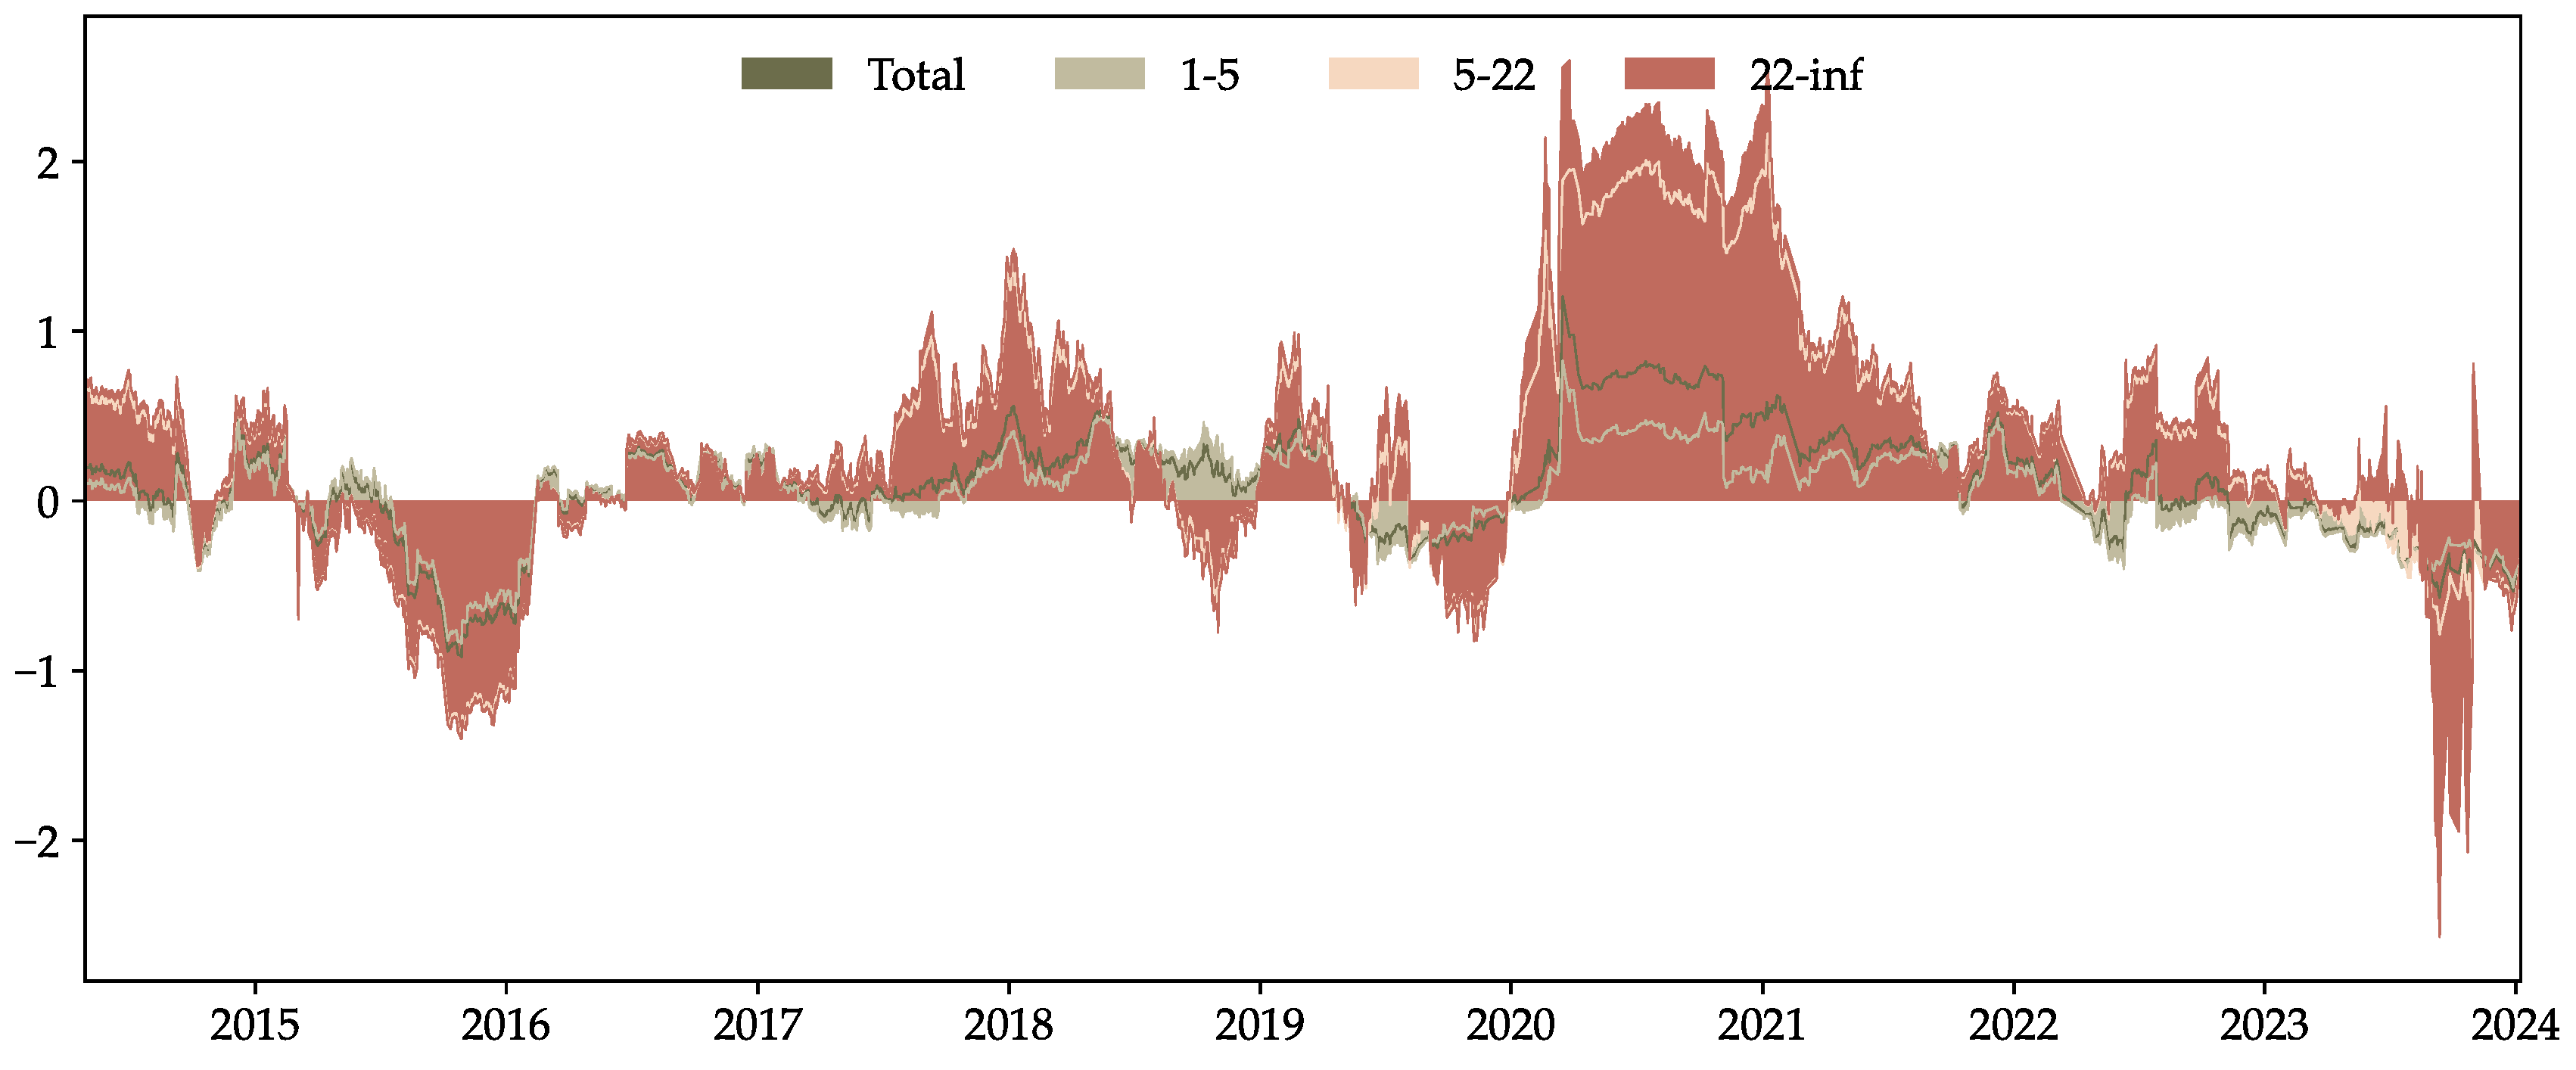
Figure 5.
Time-varying PCI. Notes: Refer to Figure 2 for the legend.
Figure 5.
Time-varying PCI. Notes: Refer to Figure 2 for the legend.
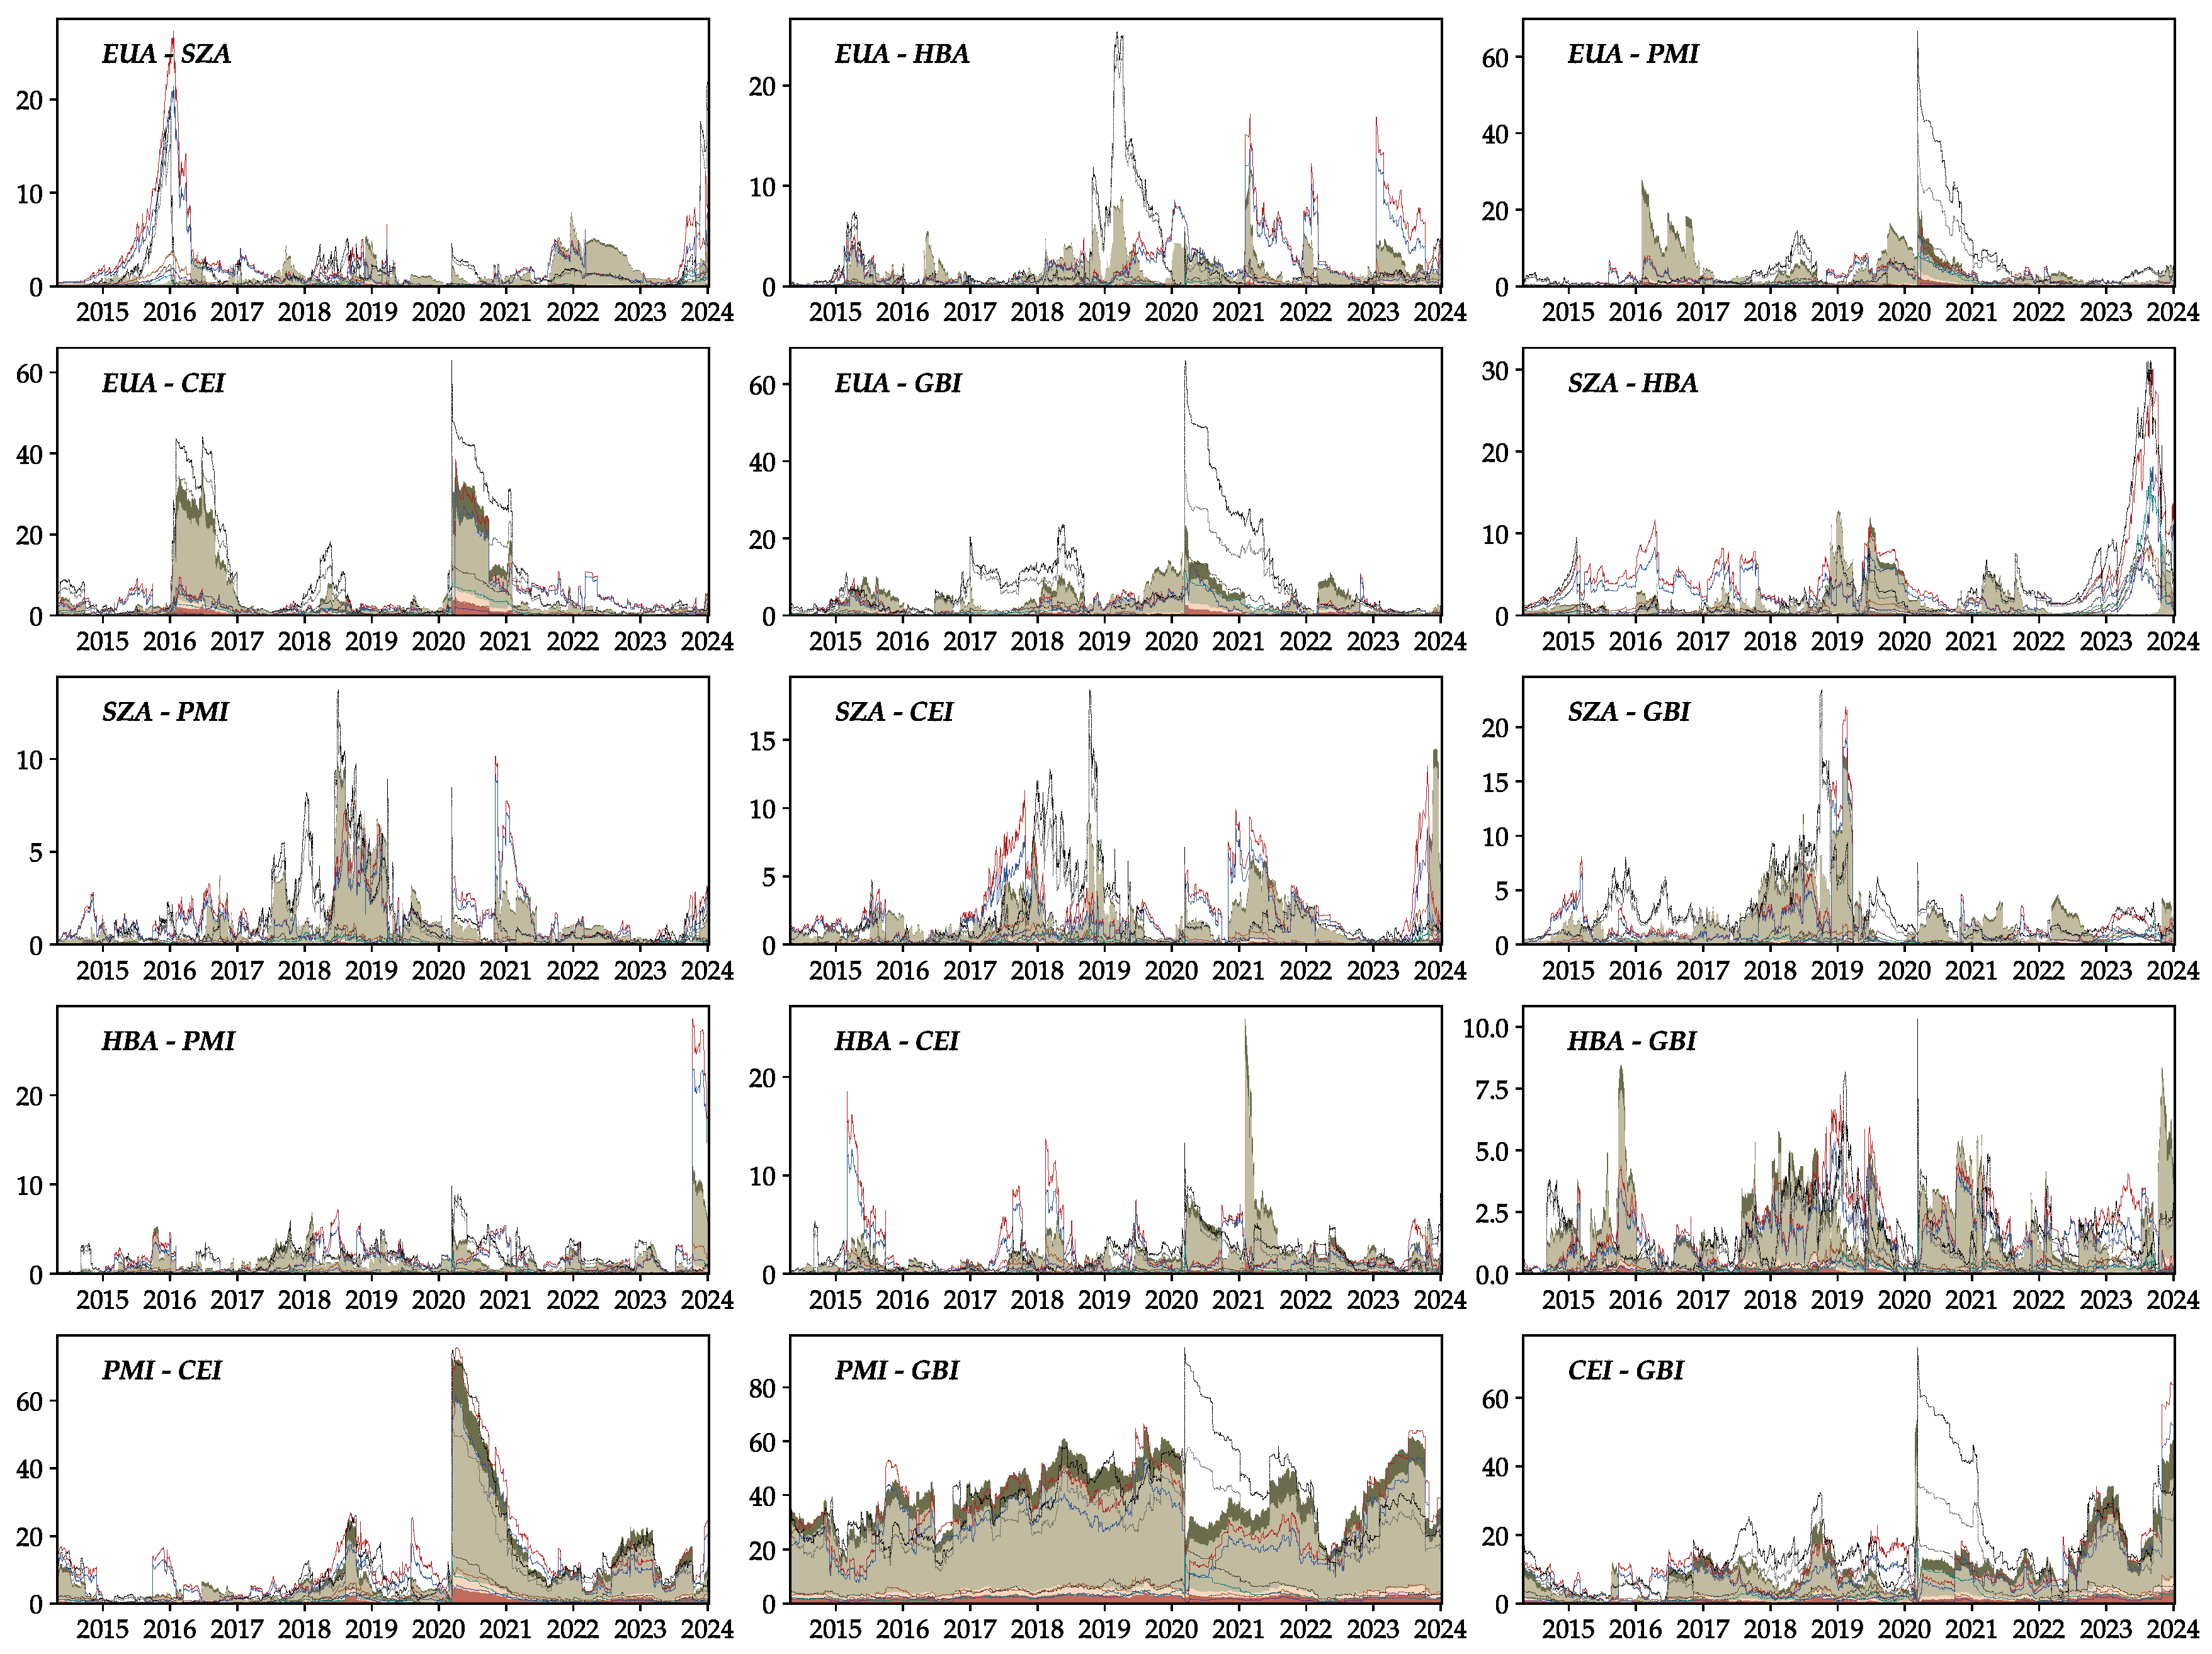
Figure 6.
. Asymmetry of PCI. Notes: Refer to Figure 3 for the legend.
Figure 6.
. Asymmetry of PCI. Notes: Refer to Figure 3 for the legend.
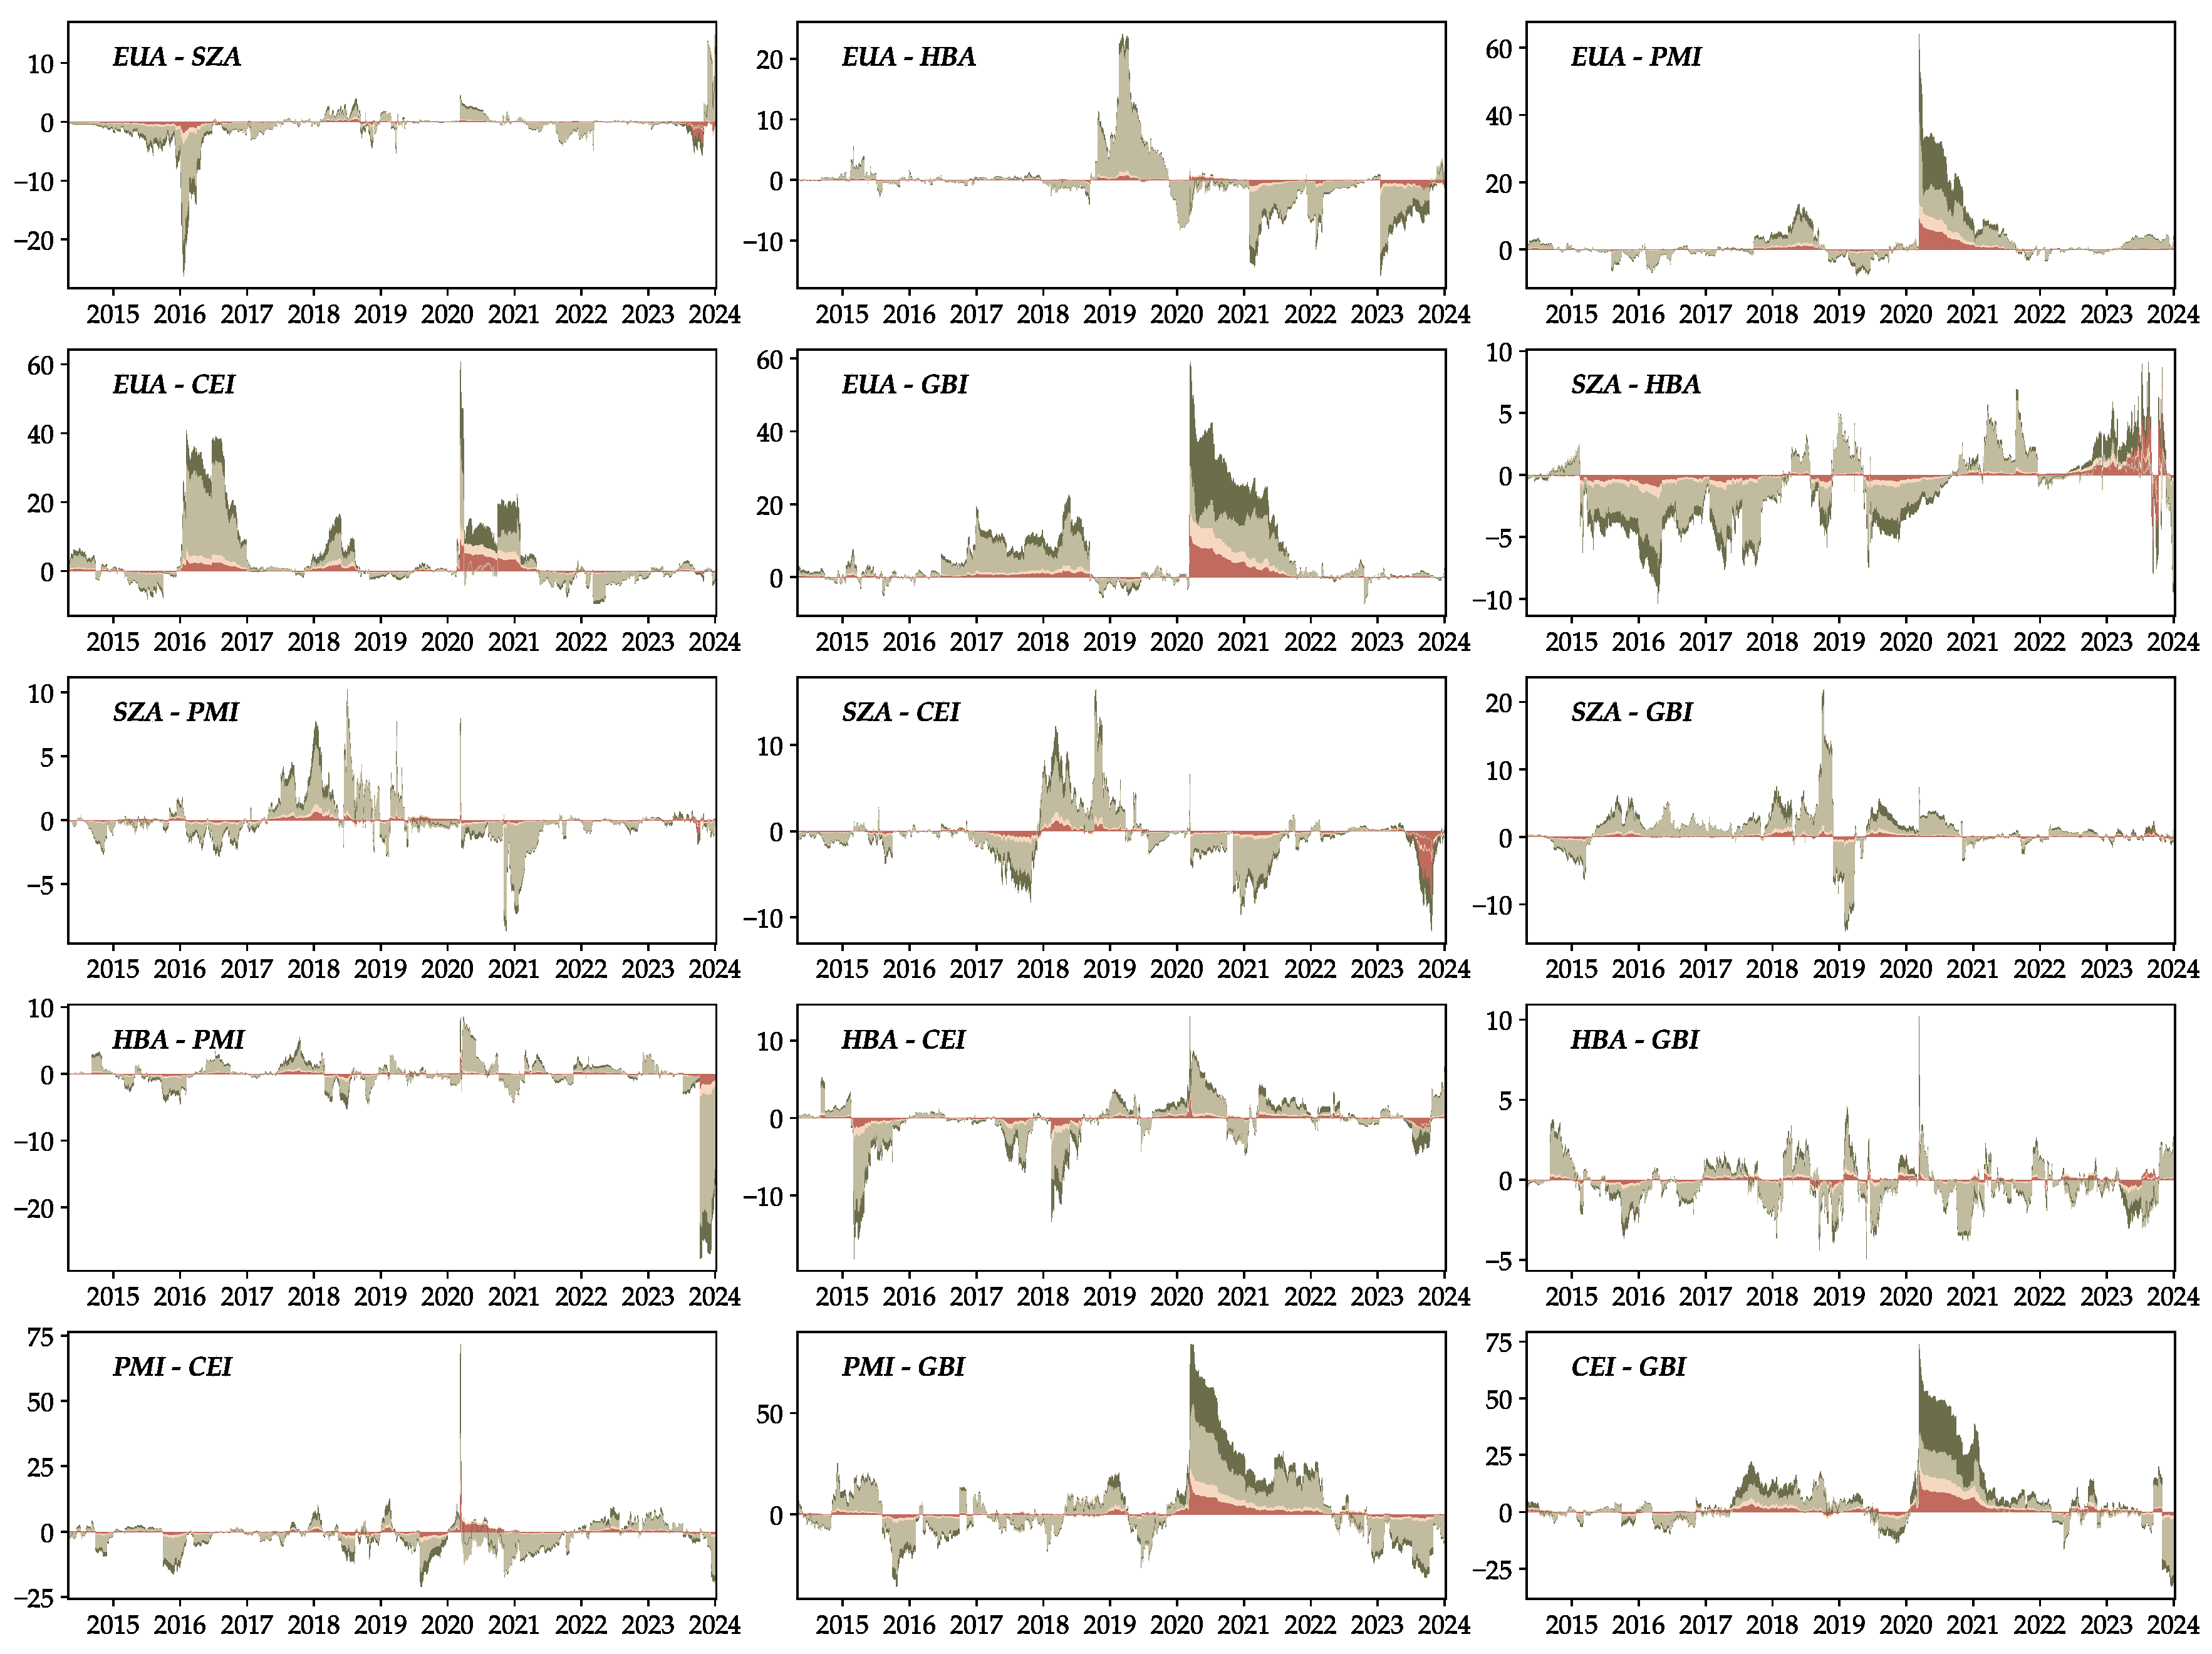
Figure 7.
Time-varying NET. Notes: Refer to Figure 2 for the legend.
Figure 7.
Time-varying NET. Notes: Refer to Figure 2 for the legend.
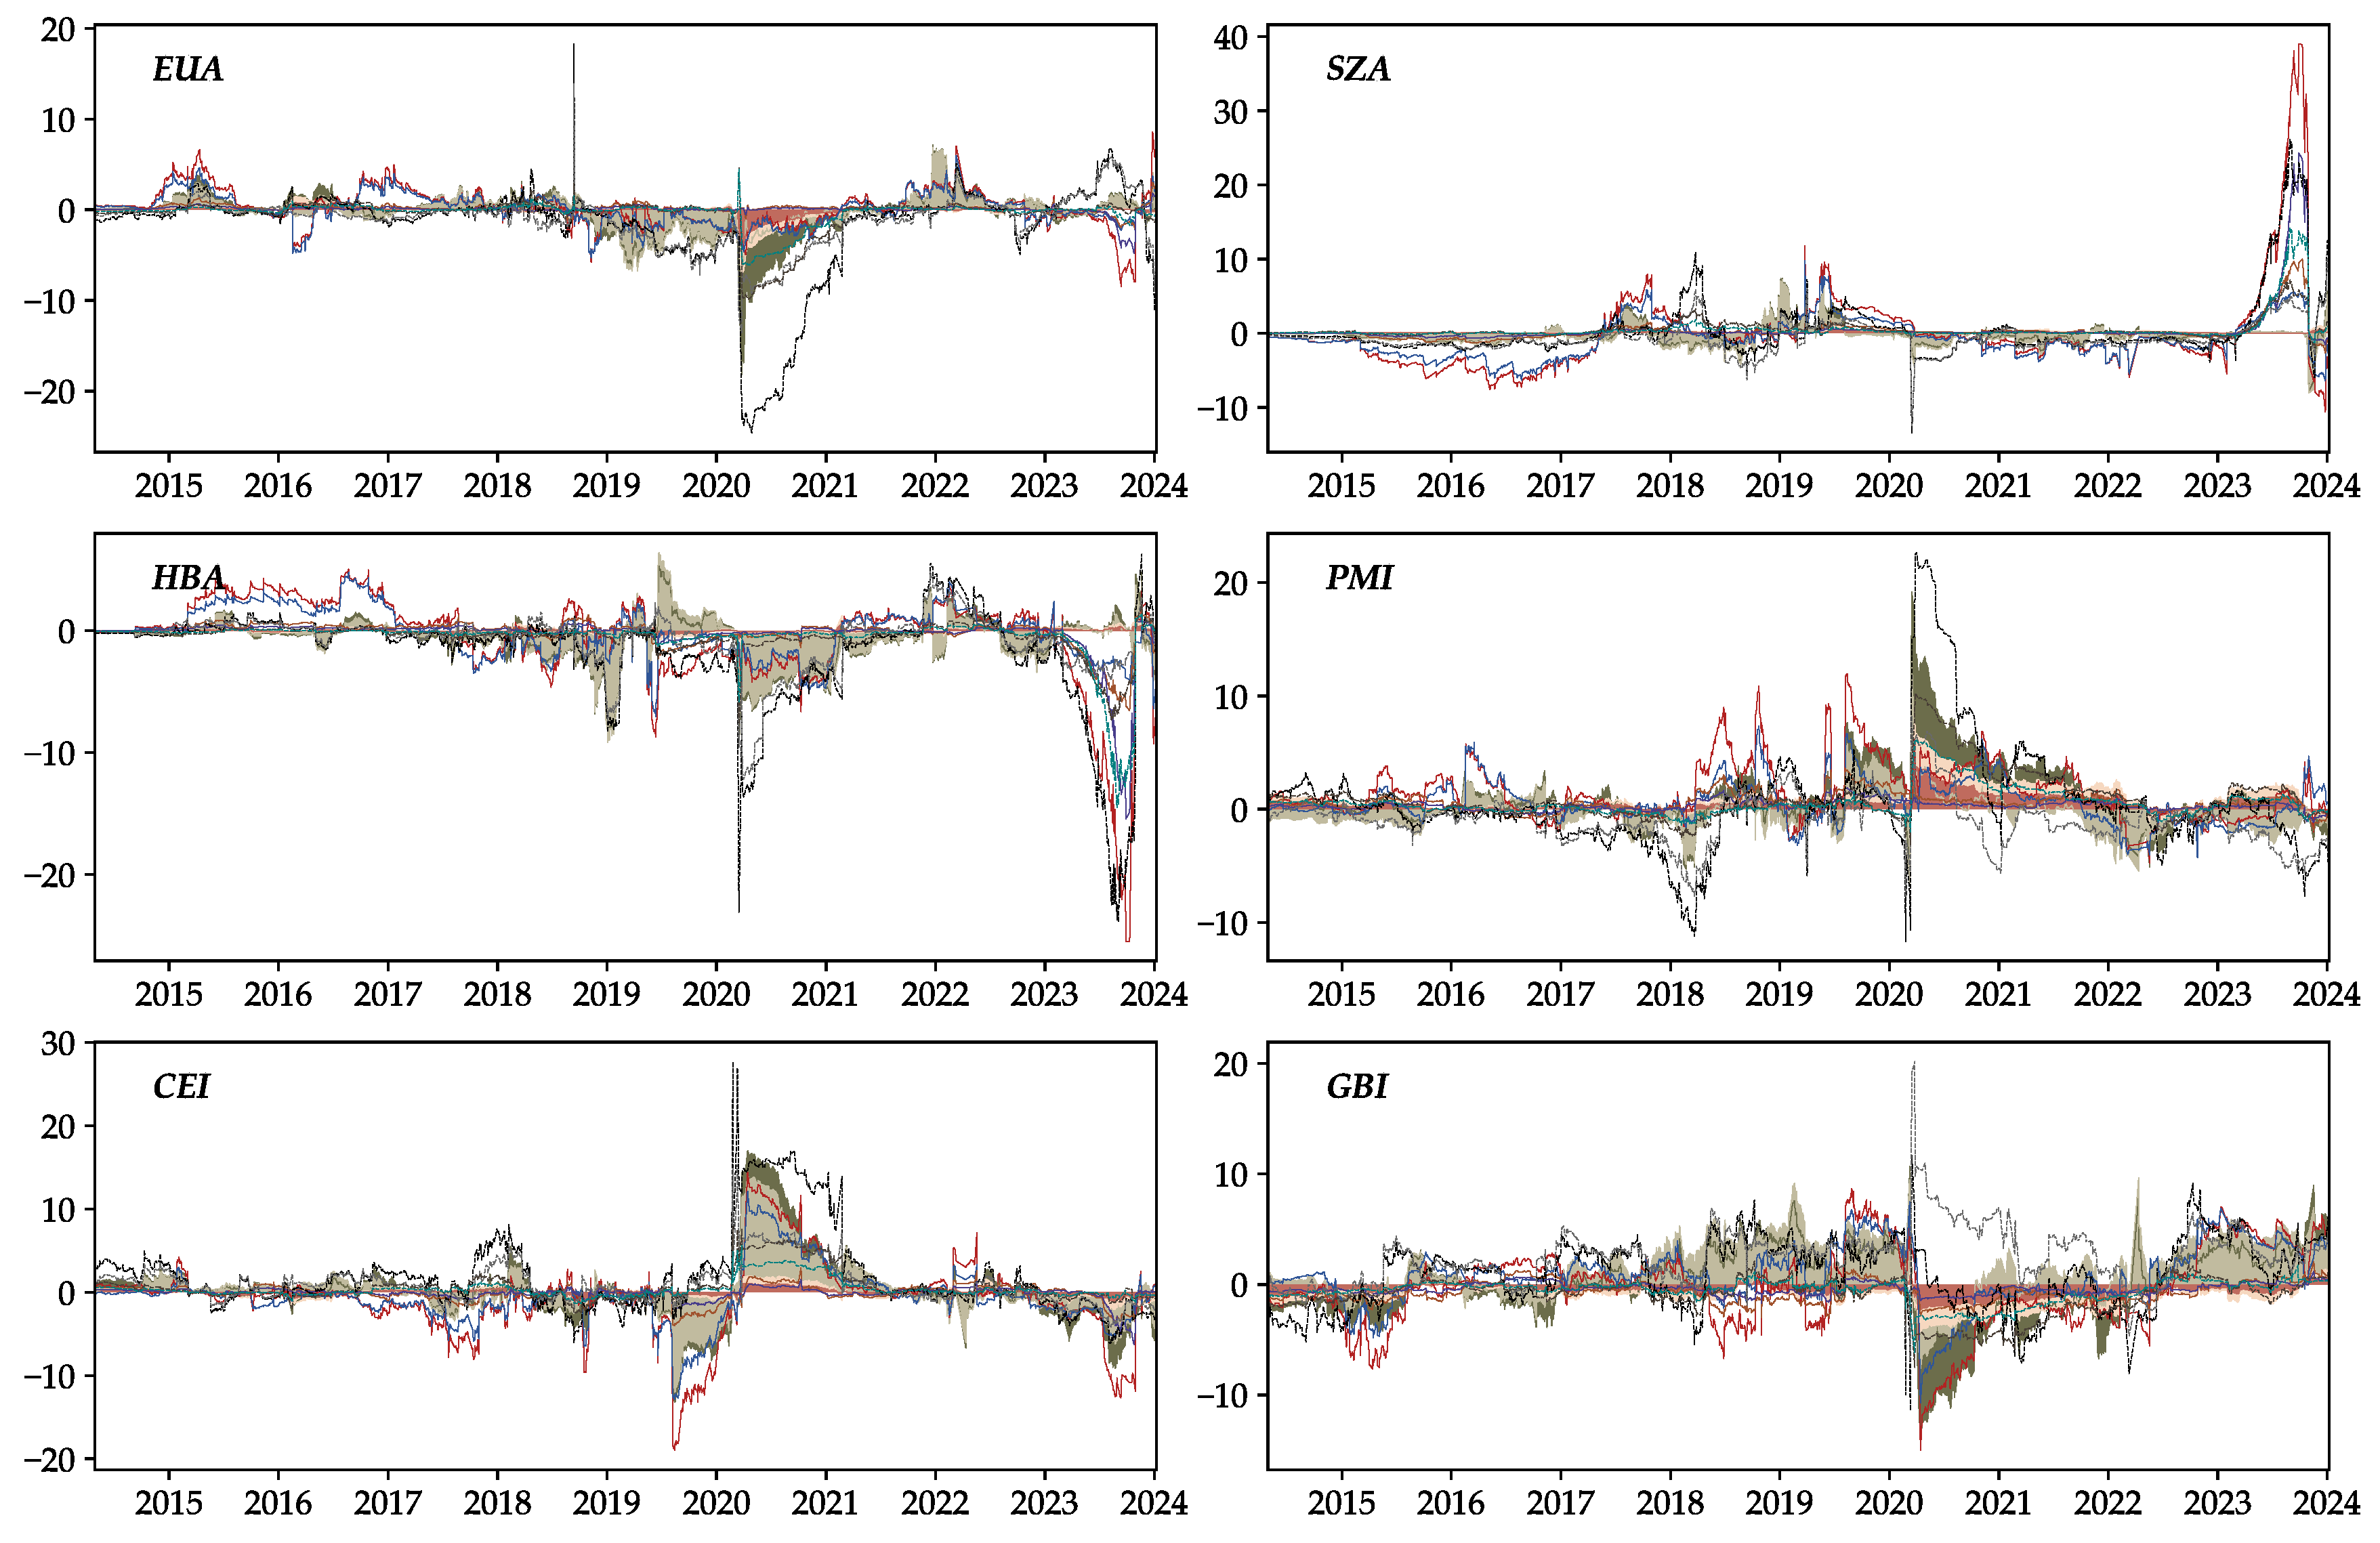
Figure 8.
Asymmetry of NET. Notes: Refer to Figure 3 for the legend.
Figure 8.
Asymmetry of NET. Notes: Refer to Figure 3 for the legend.
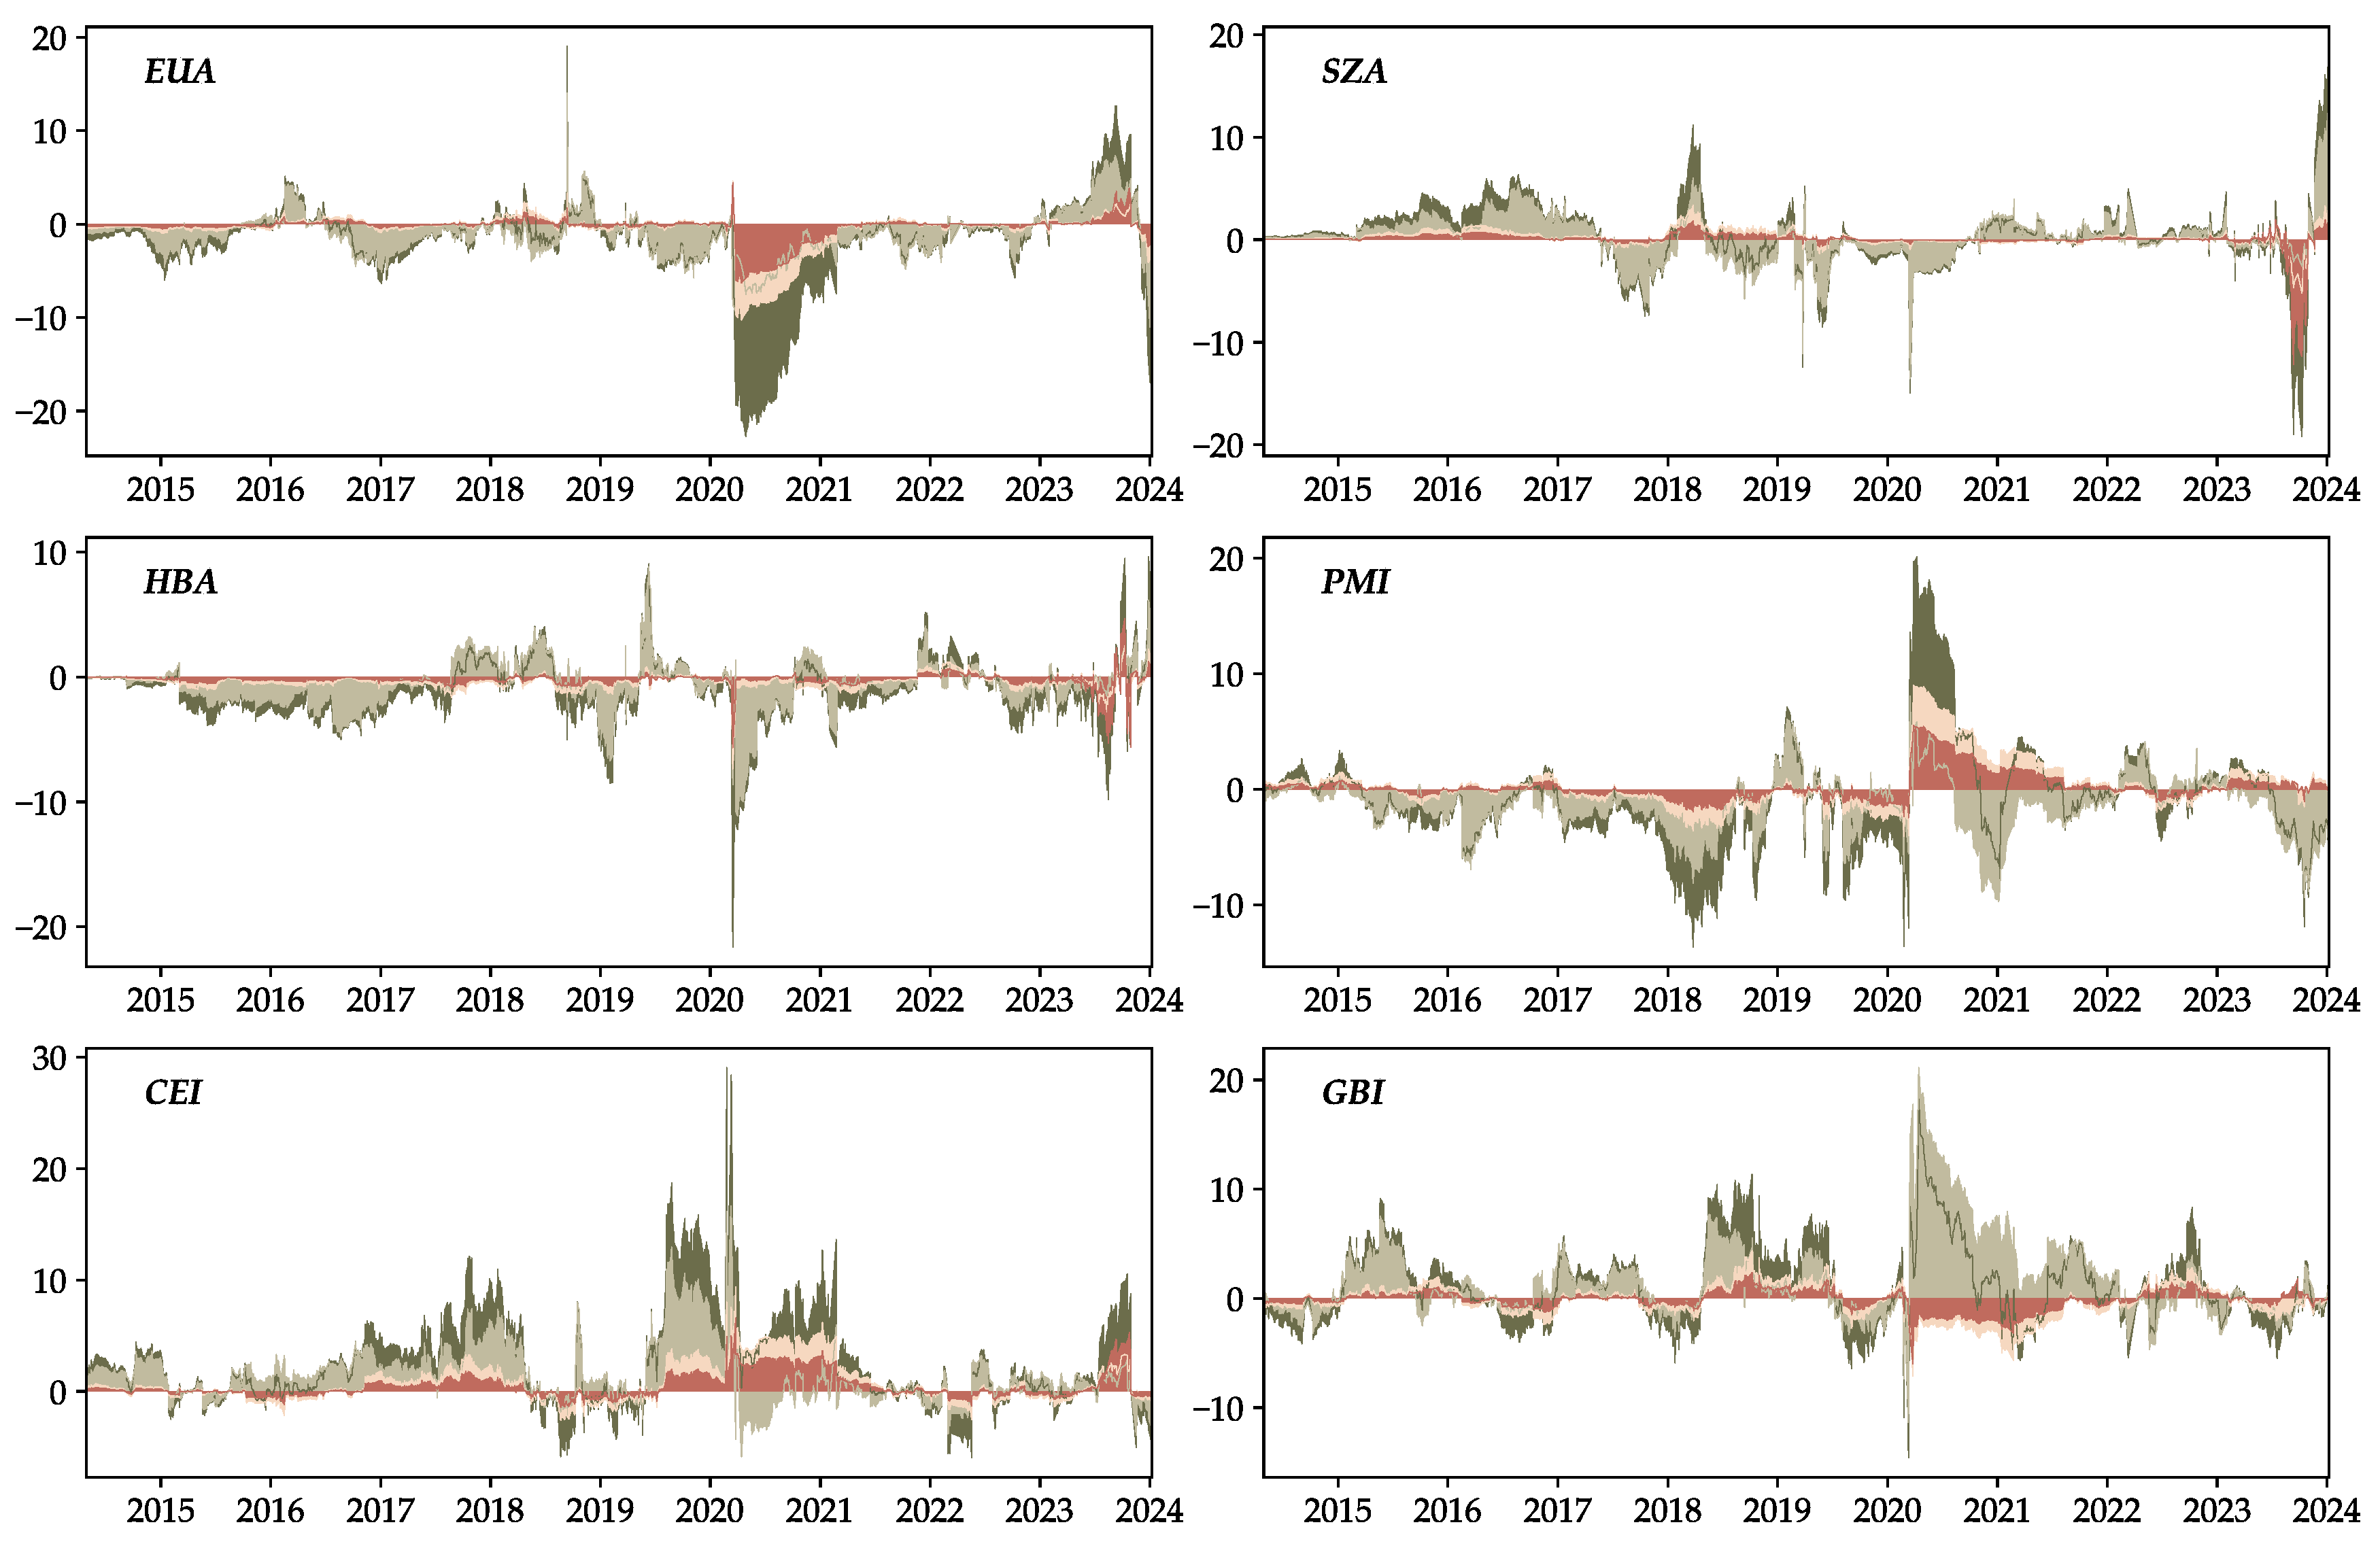
Figure 9.
Time-varying NPDC. Notes: Refer to Figure 2 for the legend.
Figure 9.
Time-varying NPDC. Notes: Refer to Figure 2 for the legend.
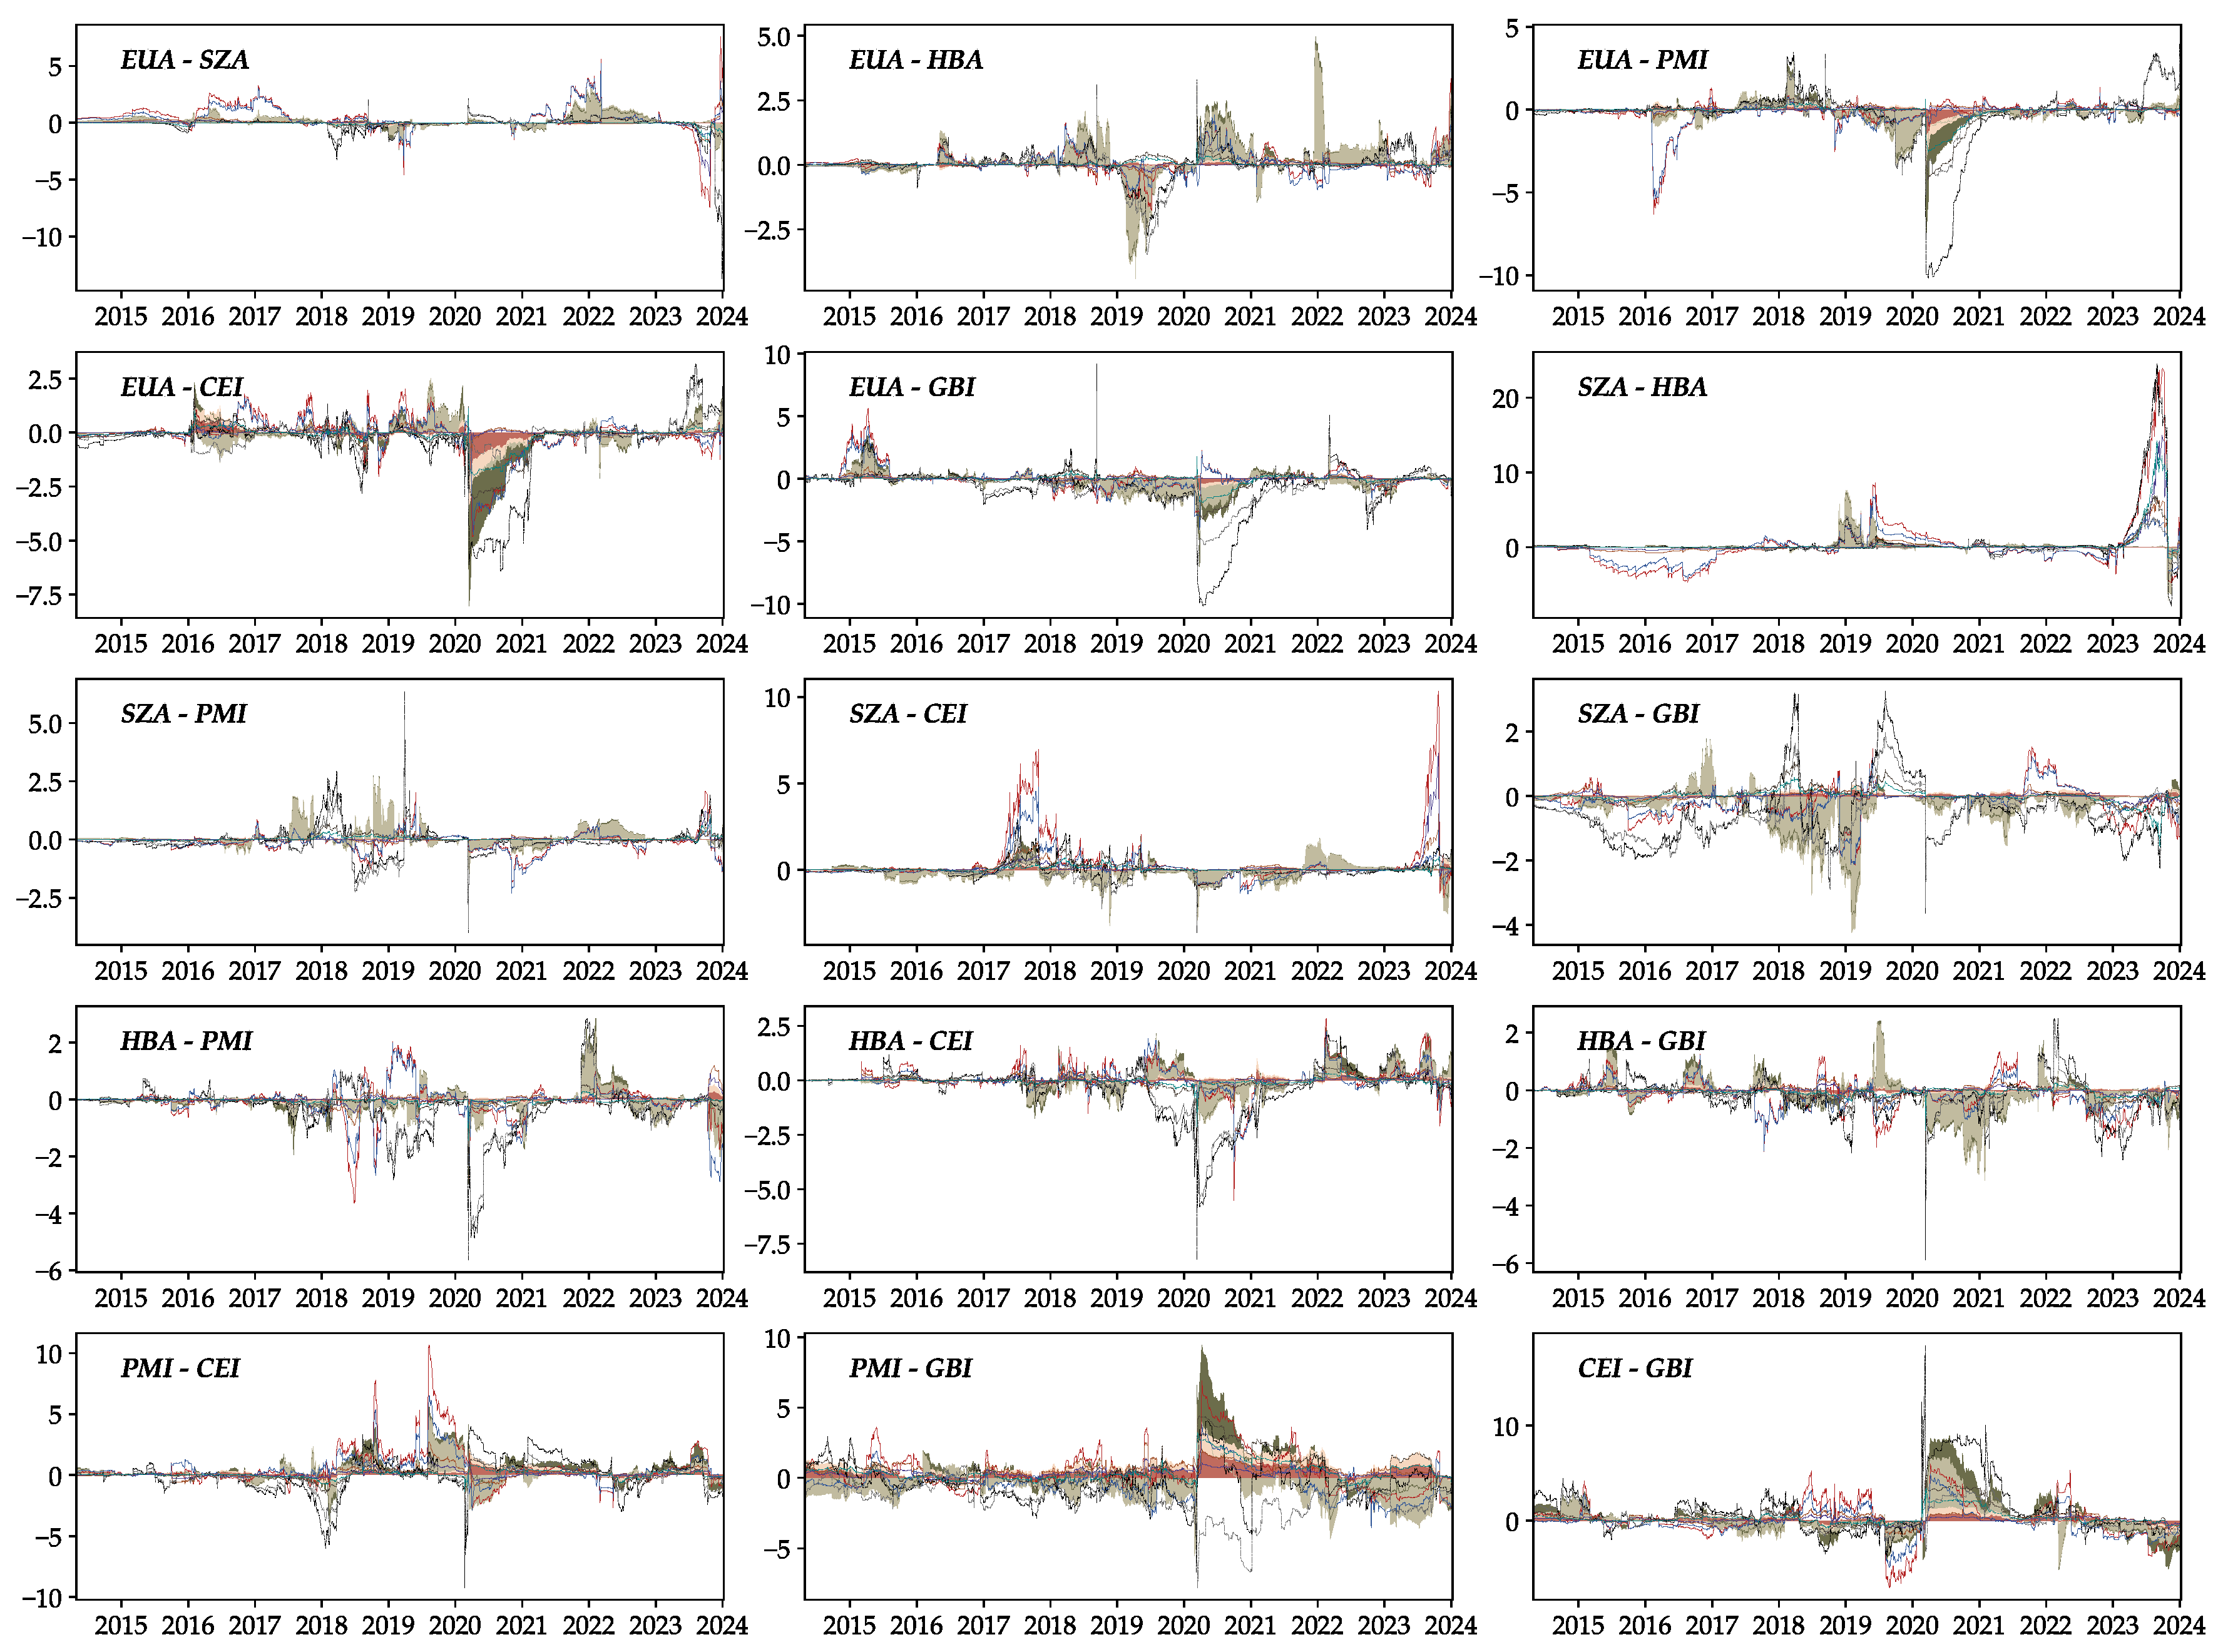
Figure 10.
Asymmetry of NPDC. Notes: Refer to Figure 3 for the legend.
Figure 10.
Asymmetry of NPDC. Notes: Refer to Figure 3 for the legend.
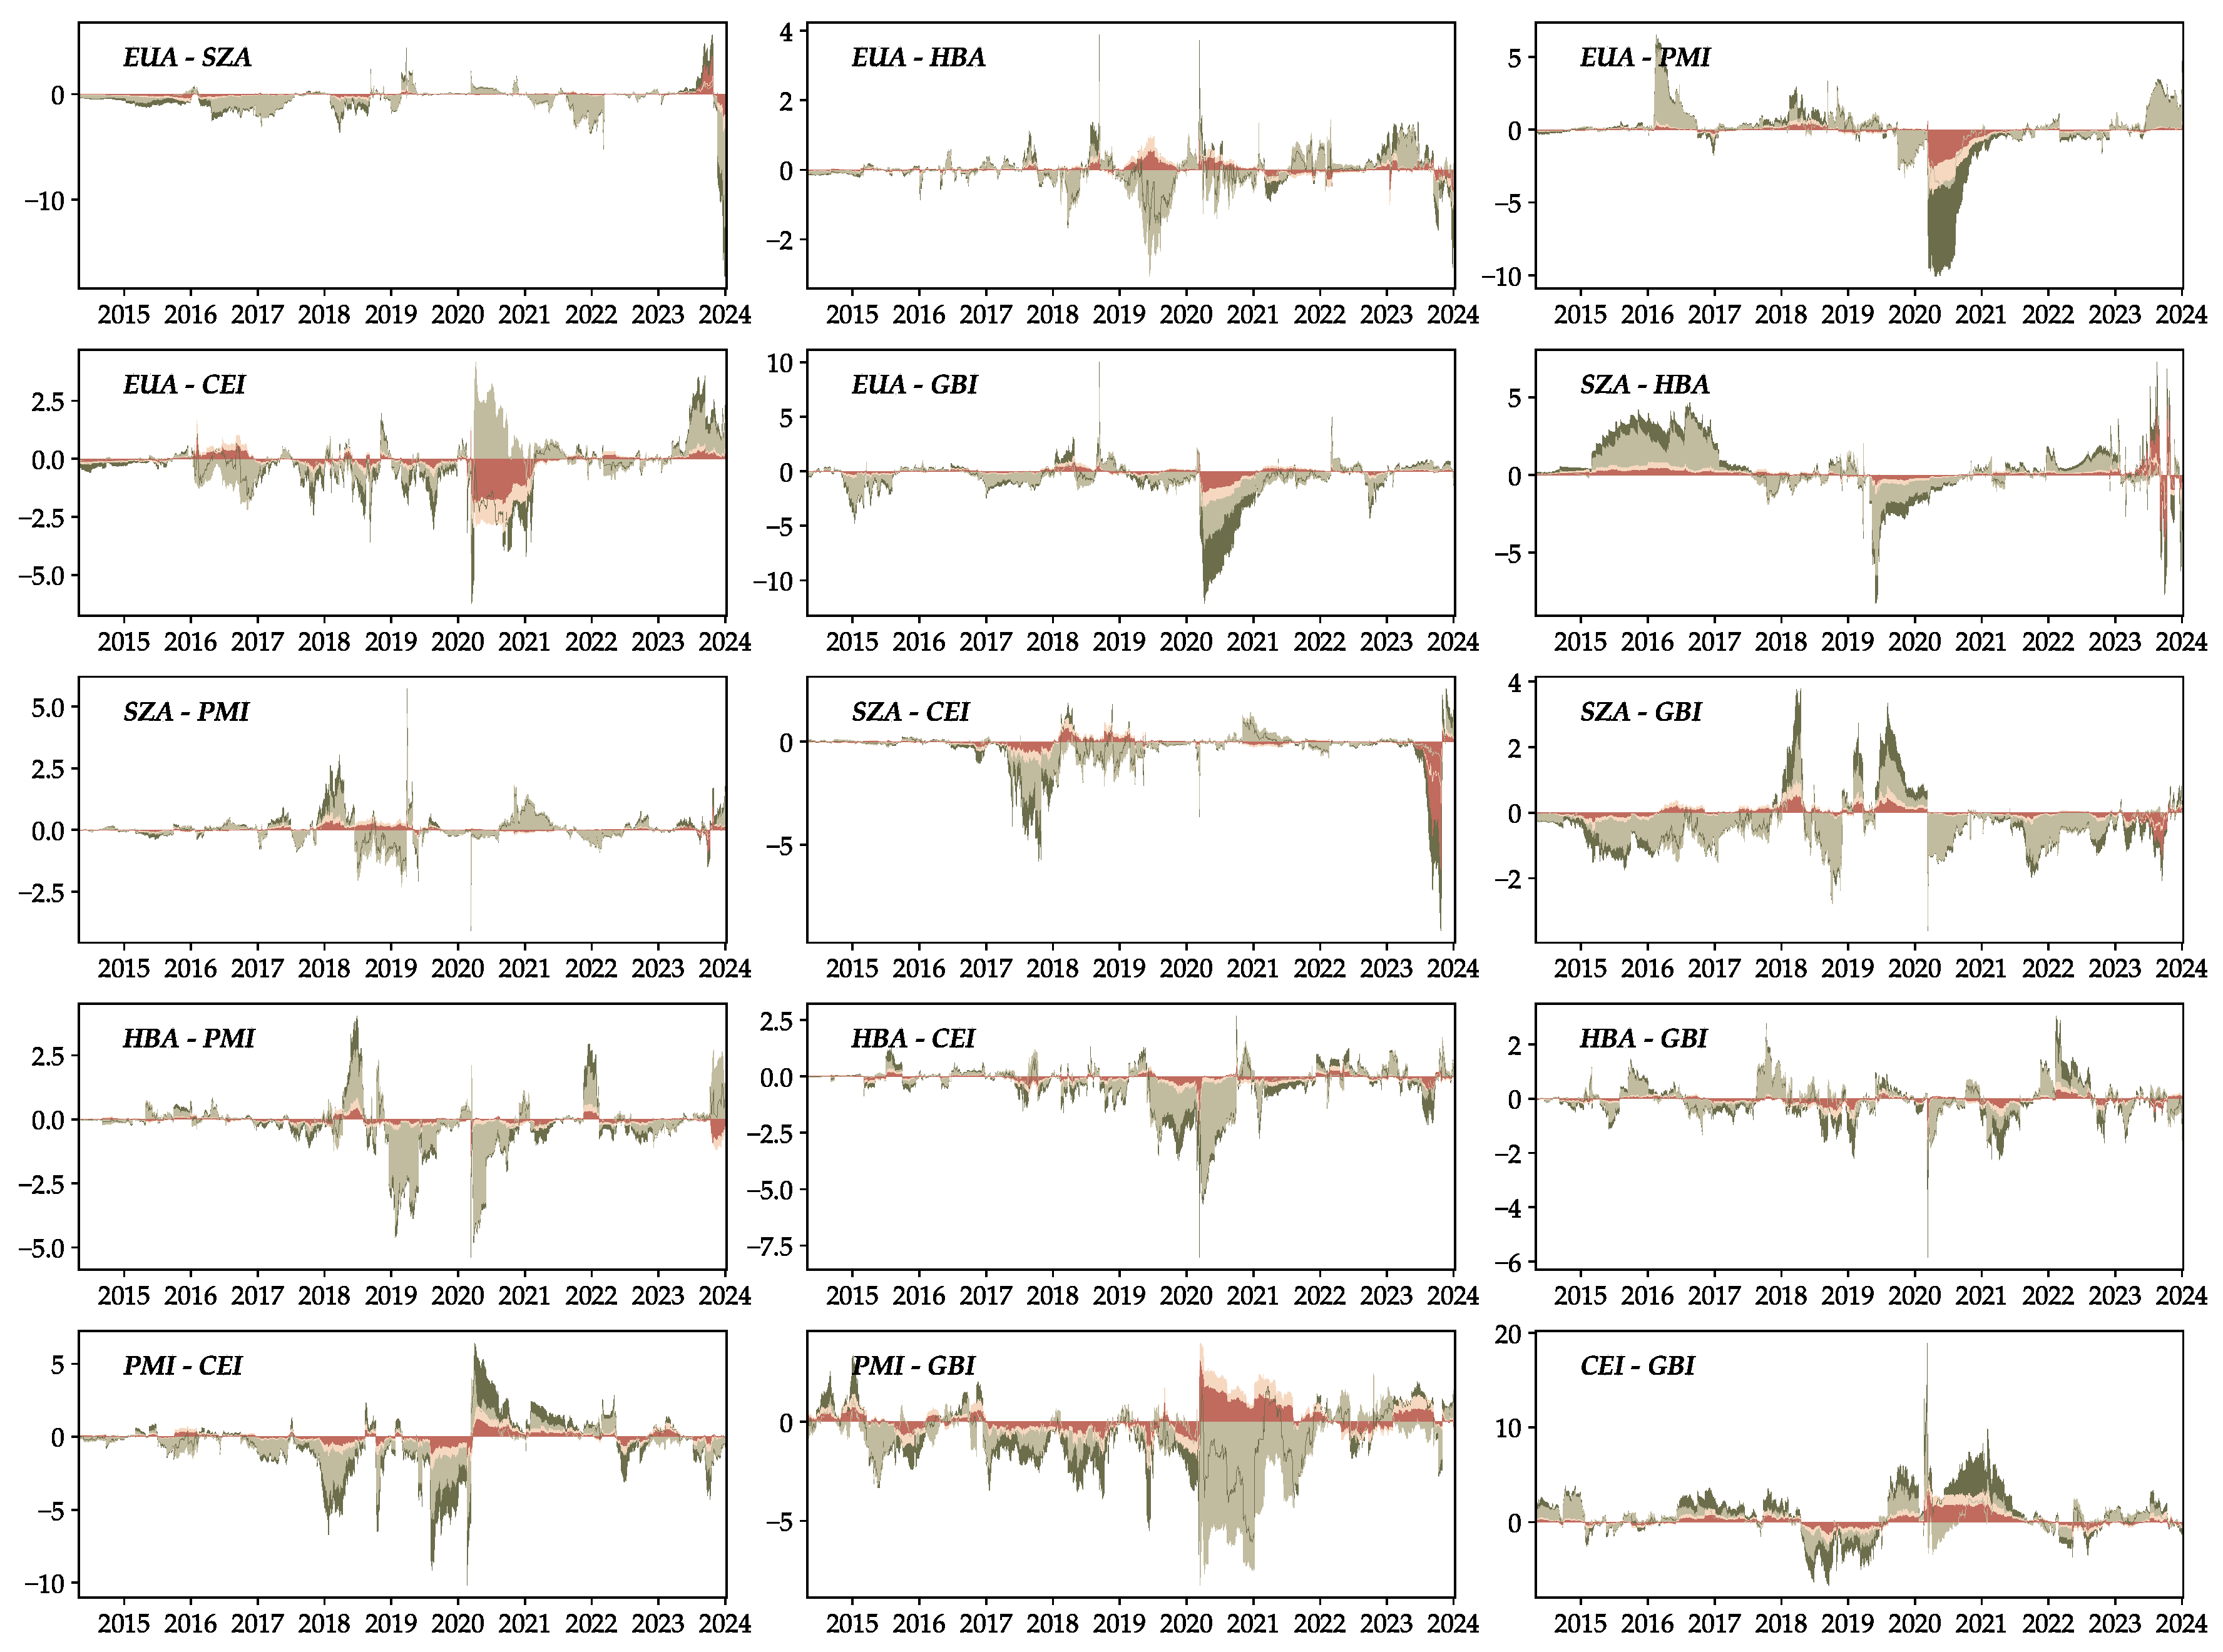
Figure 11.
Time-varying total connectedness with 50, 100, 150, and 200 steps forecast horizons. Notes: Refer to Figure 2 for the legend.
Figure 11.
Time-varying total connectedness with 50, 100, 150, and 200 steps forecast horizons. Notes: Refer to Figure 2 for the legend.
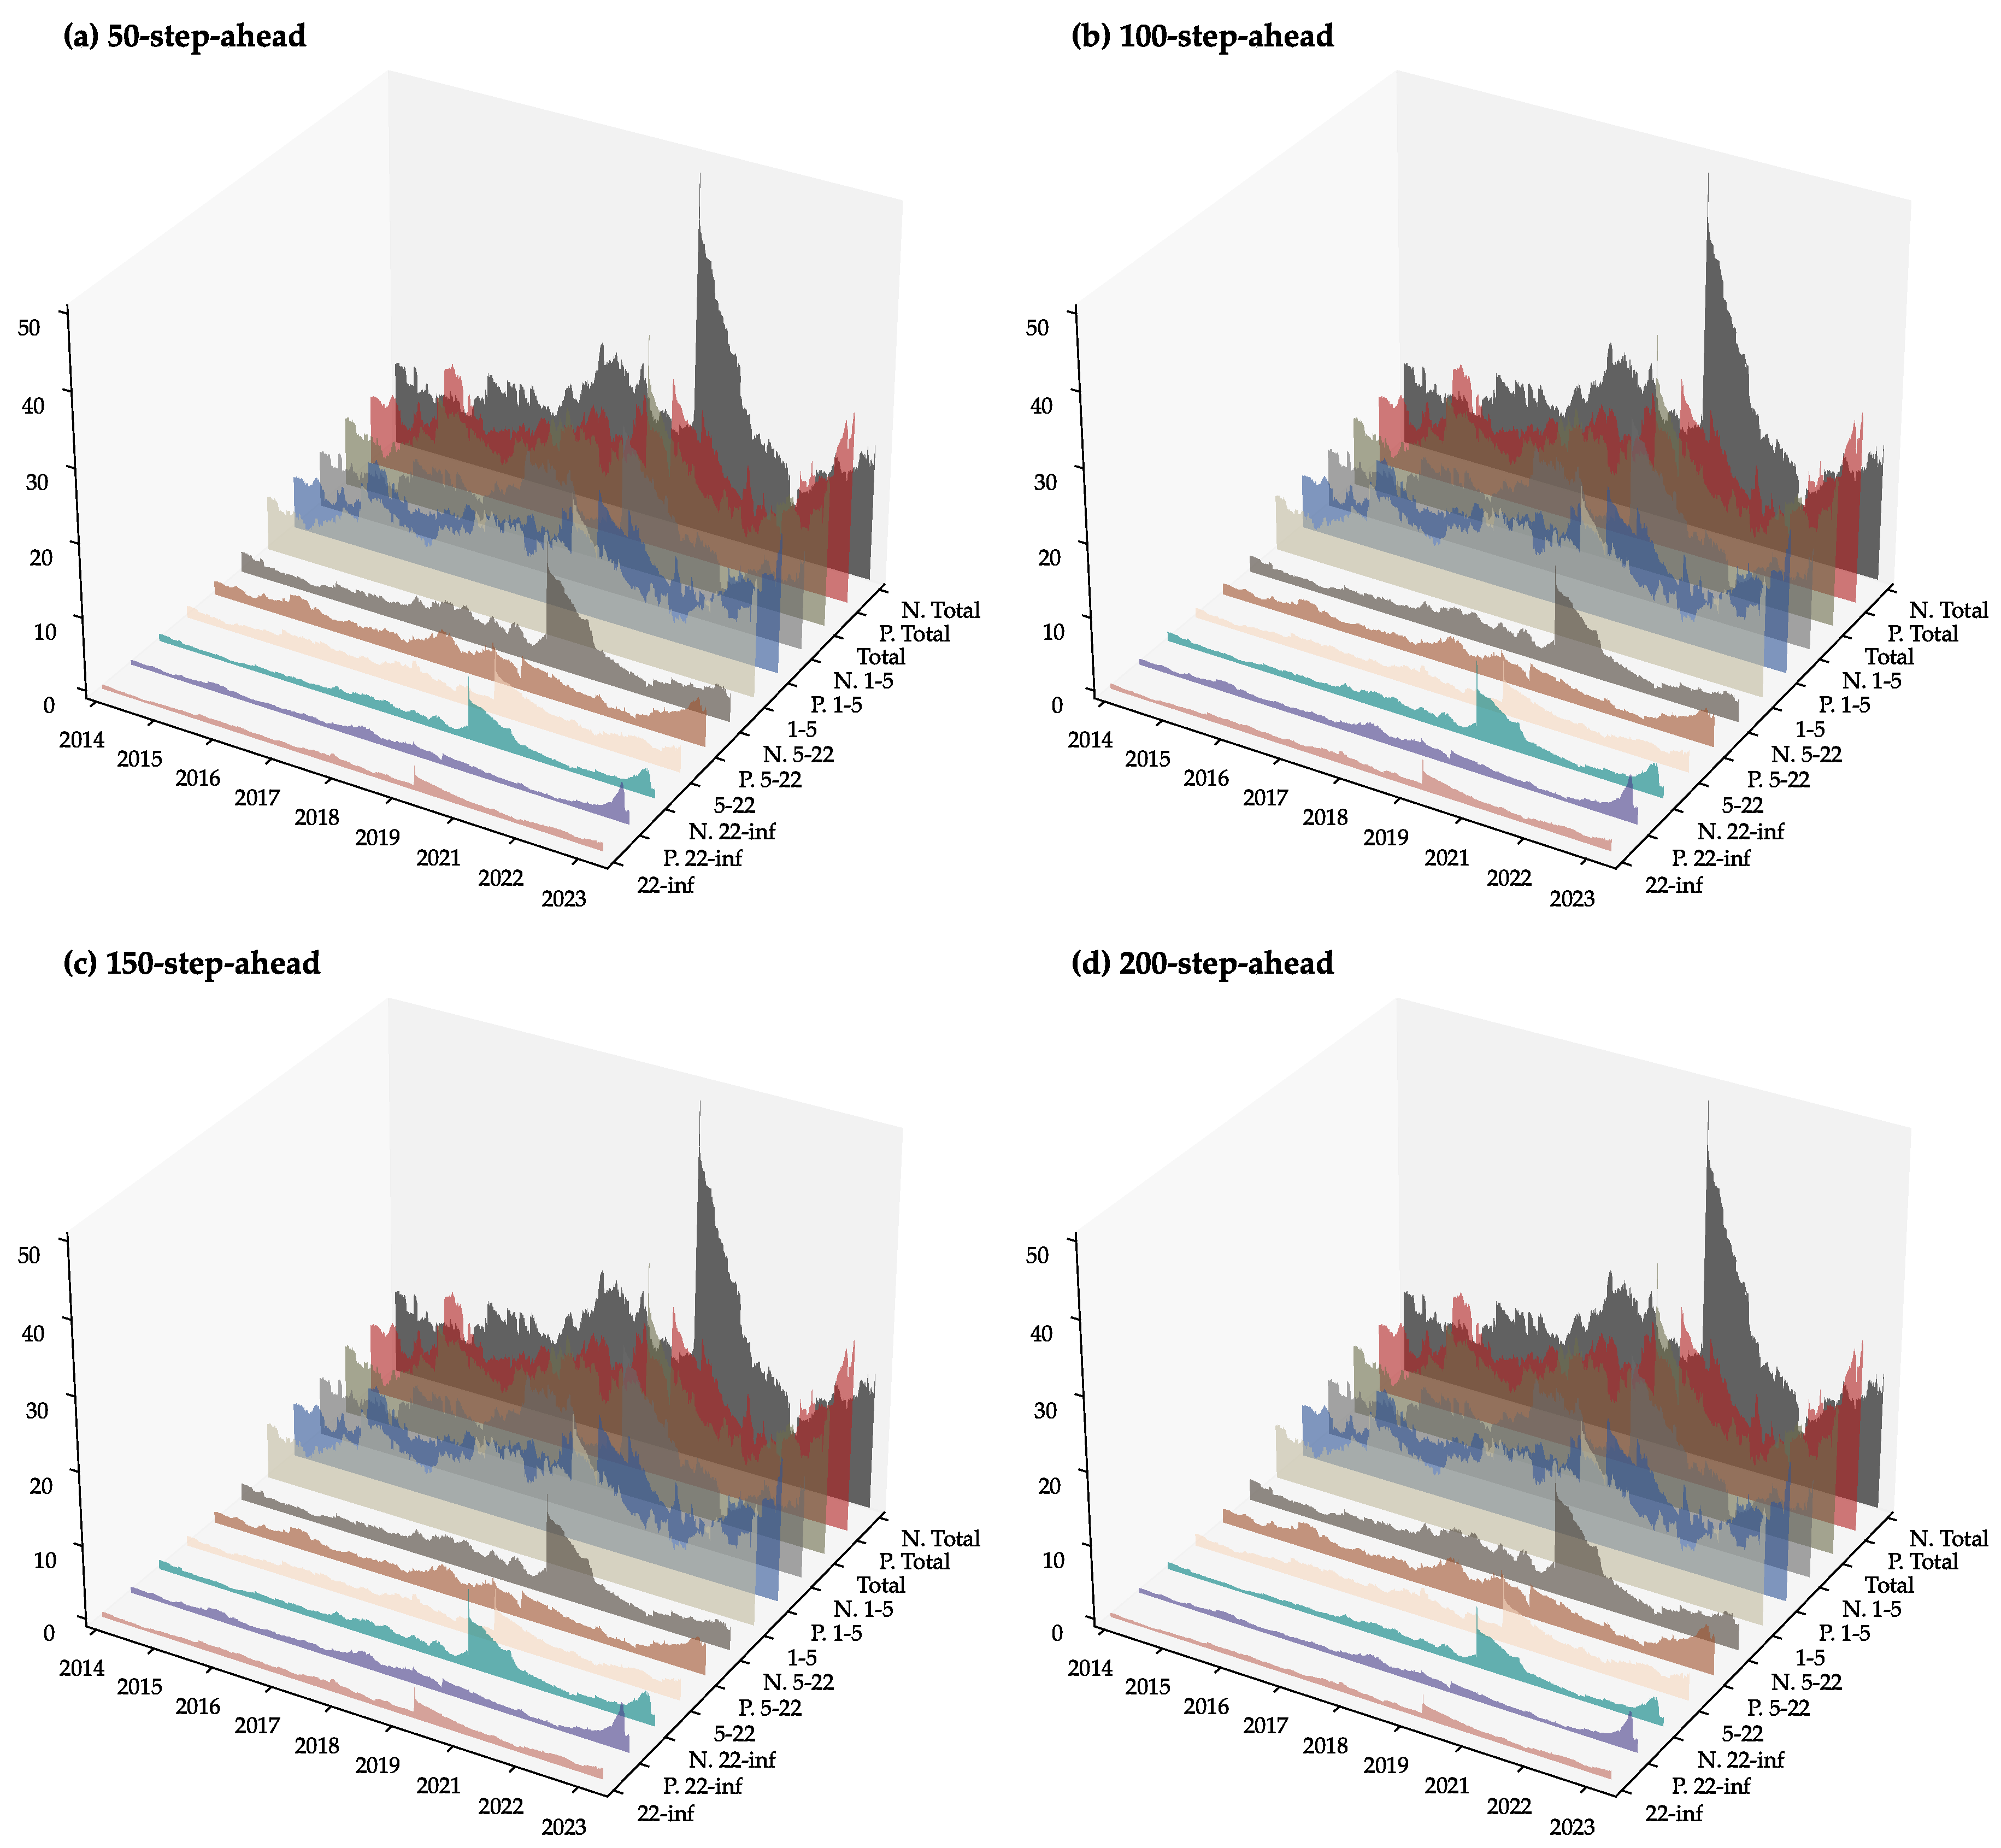

Table 1.
Summary of variables.
| Variables | Abbreviation | Market | Source |
|---|---|---|---|
| EU ETS Allowance Prices | EUA | EU carbon market | Bloomberg database |
| Shenzhen Carbon Allowance Prices | SZA | Shenzhen carbon market | Wind database |
| Hubei Carbon Allowance Prices | HBA | Hubei carbon market | Wind database |
| S&P GSCI Precious Metals Index | PMI | Global precious metals market | www.spglobal.com/spdji/ |
| S&P Global Clean Energy Index | CEI | Global clean energy market | www.spglobal.com/spdji/ |
| S&P Green Bond Index | GBI | Global green bonds market | www.spglobal.com/spdji/ |
Table 2.
Descriptive statistics.
| Mean | Max. | Min. | Std. Dev. | Skew. | Kurt. | J–B | ERS | Q(10) | Q2(10) | |
|---|---|---|---|---|---|---|---|---|---|---|
| EUA | 0.125 | 27.649 | −24.547 | 3.066 | −0.208 | 10.138 | 8919.170*** | −23.453*** | 29.043*** | 215.790*** |
| SZA | 0.013 | 247.948 | −237.715 | 34.016 | 0.230 | 18.898 | 30948.489*** | −70.609*** | 692.993*** | 1746.455*** |
| HBA | 0.024 | 19.976 | −12.751 | 2.882 | 0.095 | 5.086 | 2245.303*** | −48.954*** | 35.188*** | 701.708*** |
| PMI | 0.020 | 11.104 | −11.267 | 1.043 | 0.018 | 15.539 | 20913.564*** | −46.647*** | 43.008*** | 1087.280*** |
| CEI | 0.016 | 14.633 | −19.436 | 1.680 | −0.544 | 19.840 | 34194.889*** | −39.267*** | 52.224*** | 242.810*** |
| GBI | −0.003 | 4.282 | −3.768 | 0.423 | 0.165 | 13.789 | 16478.825*** | −41.838*** | 39.330*** | 159.663*** |
Notes: J–B represents the Jarque & Bera (1980) normality test, ERS denotes the Elliott et al. (1996) unit-root test, and Q(10) and Q2(10) refer to the Fisher & Gallagher (2012) weighted Portmanteau test statistics. *** indicates significance at 1% level.
Table 3.
Kendall correlation matrix.
| EUA | SZA | HBA | PMI | CEI | GBI | |
|---|---|---|---|---|---|---|
| EUA | 1.000 | −0.121 | 0.685 | 0.508 | 0.536 | 0.133 |
| SZA | −0.121 | 1.000 | −0.034 | −0.081 | −0.006 | −0.467 |
| HBA | 0.685 | −0.034 | 1.000 | 0.378 | 0.510 | −0.011 |
| PMI | 0.508 | −0.081 | 0.378 | 1.000 | 0.524 | 0.331 |
| CEI | 0.536 | −0.006 | 0.510 | 0.524 | 1.000 | 0.236 |
| GBI | 0.133 | −0.467 | −0.011 | 0.331 | 0.236 | 1.000 |
Table 4.
Average connectedness.
| Normal conditions | Positive conditions | Negative conditions | |||||||||||||||||||
|---|---|---|---|---|---|---|---|---|---|---|---|---|---|---|---|---|---|---|---|---|---|
| EUA | SZA | HBA | PMI | CEI | GBI | FROM | EUA | SZA | HBA | PMI | CEI | GBI | FROM | EUA | SZA | HBA | PMI | CEI | GBI | FROM | |
| Panel A: Total | |||||||||||||||||||||
| EUA | 92.79 | 0.51 | 0.69 | 1.62 | 2.57 | 1.83 | 7.21 | 94.07 | 0.98 | 1.13 | 1.03 | 1.93 | 0.86 | 5.93 | 88.83 | 0.79 | 1.02 | 1.87 | 3.87 | 3.63 | 11.17 |
| SZA | 0.68 | 96.21 | 0.68 | 0.46 | 0.87 | 1.11 | 3.79 | 1.44 | 94.05 | 2.00 | 0.70 | 0.88 | 0.93 | 5.95 | 0.63 | 95.15 | 1.17 | 0.62 | 0.88 | 1.55 | 4.85 |
| HBA | 0.92 | 0.99 | 95.76 | 0.60 | 0.87 | 0.86 | 4.24 | 1.17 | 2.17 | 94.04 | 0.80 | 0.95 | 0.88 | 5.96 | 1.05 | 1.92 | 94.57 | 0.80 | 0.90 | 0.76 | 5.43 |
| PMI | 1.37 | 0.59 | 0.51 | 74.94 | 3.93 | 18.67 | 25.06 | 0.80 | 0.56 | 0.71 | 77.10 | 5.06 | 15.76 | 22.90 | 1.48 | 0.54 | 0.47 | 76.09 | 4.14 | 17.28 | 23.91 |
| CEI | 2.41 | 0.75 | 0.90 | 4.46 | 87.57 | 3.91 | 12.43 | 1.81 | 1.28 | 1.02 | 5.65 | 85.82 | 4.41 | 14.18 | 3.38 | 0.88 | 0.55 | 4.19 | 85.03 | 5.98 | 14.97 |
| GBI | 1.56 | 0.76 | 0.69 | 19.09 | 4.47 | 73.43 | 26.57 | 0.99 | 0.73 | 0.70 | 16.28 | 4.57 | 76.74 | 23.26 | 2.86 | 0.99 | 0.49 | 16.95 | 7.06 | 71.65 | 28.35 |
| TO | 6.93 | 3.60 | 3.46 | 26.23 | 12.70 | 26.37 | 79.29 | 6.21 | 5.73 | 5.55 | 24.46 | 13.39 | 22.85 | 78.18 | 9.40 | 5.12 | 3.71 | 24.42 | 16.84 | 29.19 | 88.68 |
| Inc. Own | 99.72 | 99.81 | 99.23 | 101.17 | 100.27 | 99.80 | TCI | 100.29 | 99.77 | 99.58 | 101.56 | 99.21 | 99.58 | TCI | 98.23 | 100.27 | 98.27 | 100.51 | 101.87 | 100.84 | TCI |
| NET | |||||||||||||||||||||
| Panel B: Short-term frequency, 1 to 5 days | |||||||||||||||||||||
| EUA | 79.99 | 0.45 | 0.63 | 1.39 | 2.06 | 1.51 | 6.03 | 80.12 | 0.74 | 0.95 | 0.90 | 1.65 | 0.75 | 4.99 | 74.30 | 0.61 | 0.94 | 1.31 | 2.77 | 2.65 | 8.28 |
| SZA | 0.67 | 91.17 | 0.63 | 0.44 | 0.84 | 1.08 | 3.67 | 1.16 | 78.81 | 1.46 | 0.61 | 0.76 | 0.77 | 4.75 | 0.55 | 79.69 | 0.84 | 0.55 | 0.78 | 1.30 | 4.02 |
| HBA | 0.83 | 0.89 | 84.28 | 0.53 | 0.77 | 0.76 | 3.78 | 0.97 | 1.27 | 77.17 | 0.67 | 0.75 | 0.70 | 4.35 | 0.87 | 0.96 | 76.61 | 0.65 | 0.69 | 0.52 | 3.69 |
| PMI | 1.16 | 0.56 | 0.43 | 64.82 | 3.25 | 16.20 | 21.61 | 0.63 | 0.47 | 0.58 | 65.44 | 3.90 | 13.31 | 18.89 | 1.16 | 0.41 | 0.41 | 65.27 | 3.08 | 14.27 | 19.33 |
| CEI | 1.99 | 0.66 | 0.73 | 3.51 | 71.50 | 3.11 | 10.00 | 1.51 | 0.88 | 0.75 | 4.39 | 69.22 | 3.56 | 11.08 | 2.62 | 0.64 | 0.42 | 3.02 | 66.70 | 4.22 | 10.93 |
| GBI | 1.20 | 0.67 | 0.59 | 15.30 | 3.27 | 61.70 | 21.03 | 0.81 | 0.58 | 0.54 | 12.96 | 3.42 | 64.57 | 18.29 | 2.01 | 0.73 | 0.39 | 12.82 | 4.53 | 57.51 | 20.47 |
| TO | 5.85 | 3.23 | 3.01 | 21.17 | 10.20 | 22.66 | 66.11 | 5.07 | 3.93 | 4.27 | 19.52 | 10.47 | 19.09 | 62.36 | 7.20 | 3.35 | 3.00 | 18.35 | 11.85 | 22.97 | 66.71 |
| Inc. Own | 85.83 | 94.39 | 87.29 | 85.99 | 81.70 | 84.36 | TCI | 85.19 | 82.74 | 81.44 | 84.96 | 79.69 | 83.66 | TCI | 81.50 | 83.04 | 79.61 | 83.63 | 78.54 | 80.48 | TCI |
| NET | |||||||||||||||||||||
| Panel C: Medium-term frequency, 5 to 22 days | |||||||||||||||||||||
| EUA | 8.53 | 0.04 | 0.04 | 0.15 | 0.33 | 0.21 | 0.78 | 9.28 | 0.14 | 0.11 | 0.09 | 0.19 | 0.07 | 0.60 | 9.63 | 0.11 | 0.06 | 0.36 | 0.70 | 0.63 | 1.86 |
| SZA | 0.01 | 3.39 | 0.03 | 0.01 | 0.02 | 0.02 | 0.08 | 0.18 | 9.50 | 0.34 | 0.06 | 0.08 | 0.10 | 0.76 | 0.06 | 9.57 | 0.19 | 0.04 | 0.06 | 0.15 | 0.50 |
| HBA | 0.05 | 0.07 | 7.67 | 0.05 | 0.07 | 0.07 | 0.30 | 0.13 | 0.46 | 11.13 | 0.09 | 0.13 | 0.12 | 0.92 | 0.12 | 0.46 | 11.82 | 0.10 | 0.14 | 0.15 | 0.97 |
| PMI | 0.14 | 0.02 | 0.05 | 6.75 | 0.45 | 1.64 | 2.30 | 0.12 | 0.06 | 0.08 | 7.76 | 0.76 | 1.63 | 2.65 | 0.21 | 0.09 | 0.04 | 7.19 | 0.69 | 1.98 | 3.00 |
| CEI | 0.28 | 0.06 | 0.12 | 0.63 | 10.65 | 0.53 | 1.61 | 0.20 | 0.23 | 0.17 | 0.83 | 10.98 | 0.57 | 2.01 | 0.50 | 0.15 | 0.08 | 0.75 | 12.04 | 1.13 | 2.62 |
| GBI | 0.24 | 0.06 | 0.07 | 2.51 | 0.79 | 7.80 | 3.67 | 0.12 | 0.10 | 0.10 | 2.20 | 0.76 | 8.08 | 3.28 | 0.55 | 0.17 | 0.07 | 2.70 | 1.63 | 9.29 | 5.11 |
| TO | 0.72 | 0.25 | 0.30 | 3.35 | 1.65 | 2.47 | 8.74 | 0.75 | 0.98 | 0.81 | 3.27 | 1.92 | 2.49 | 10.22 | 1.44 | 0.98 | 0.44 | 3.95 | 3.22 | 4.04 | 14.06 |
| Inc. Own | 9.25 | 3.64 | 7.97 | 10.11 | 12.30 | 10.27 | TCI | 10.04 | 10.48 | 11.94 | 11.03 | 12.90 | 10.57 | TCI | 11.07 | 10.55 | 12.26 | 11.14 | 15.26 | 13.33 | TCI |
| NET | |||||||||||||||||||||
| Panel D: Long-term frequency, longer than 22 days | |||||||||||||||||||||
| EUA | 4.27 | 0.02 | 0.02 | 0.08 | 0.17 | 0.11 | 0.40 | 4.67 | 0.10 | 0.06 | 0.04 | 0.10 | 0.04 | 0.34 | 4.89 | 0.07 | 0.03 | 0.20 | 0.39 | 0.35 | 1.04 |
| SZA | 0.01 | 1.66 | 0.01 | 0.01 | 0.01 | 0.01 | 0.04 | 0.10 | 5.73 | 0.20 | 0.03 | 0.05 | 0.06 | 0.44 | 0.03 | 5.89 | 0.14 | 0.02 | 0.03 | 0.10 | 0.33 |
| HBA | 0.03 | 0.03 | 3.81 | 0.02 | 0.03 | 0.03 | 0.15 | 0.07 | 0.45 | 5.74 | 0.05 | 0.07 | 0.06 | 0.69 | 0.06 | 0.50 | 6.14 | 0.05 | 0.07 | 0.09 | 0.77 |
| PMI | 0.07 | 0.01 | 0.02 | 3.37 | 0.23 | 0.82 | 1.15 | 0.06 | 0.03 | 0.04 | 3.90 | 0.39 | 0.82 | 1.35 | 0.11 | 0.05 | 0.02 | 3.63 | 0.37 | 1.03 | 1.58 |
| CEI | 0.14 | 0.03 | 0.06 | 0.32 | 5.42 | 0.27 | 0.82 | 0.11 | 0.17 | 0.10 | 0.43 | 5.62 | 0.28 | 1.09 | 0.26 | 0.08 | 0.04 | 0.41 | 6.29 | 0.62 | 1.42 |
| GBI | 0.12 | 0.03 | 0.03 | 1.28 | 0.41 | 3.94 | 1.87 | 0.06 | 0.06 | 0.05 | 1.12 | 0.39 | 4.08 | 1.69 | 0.30 | 0.09 | 0.04 | 1.43 | 0.90 | 4.85 | 2.76 |
| TO | 0.36 | 0.13 | 0.15 | 1.71 | 0.85 | 1.24 | 4.44 | 0.39 | 0.82 | 0.46 | 1.67 | 1.00 | 1.26 | 5.60 | 0.77 | 0.79 | 0.27 | 2.12 | 1.77 | 2.18 | 7.90 |
| Inc. Own | 4.64 | 1.79 | 3.96 | 5.08 | 6.27 | 5.18 | TCI | 5.06 | 6.55 | 6.21 | 5.57 | 6.62 | 5.35 | TCI | 5.66 | 6.68 | 6.41 | 5.75 | 8.07 | 7.03 | TCI |
| NET | |||||||||||||||||||||
Notes: TO and FROM indicate spillovers transmitted to and received from other markets, respectively. Positive NET values indicate net spillover transmitters, while negative values denote net spillover receivers.
Table 5.
Asymmetric tests of risk spillovers.
| EUA | SZA | HBA | PMI | CEI | GBI | FROM | |
|---|---|---|---|---|---|---|---|
| Panel A: Total | |||||||
| EUA | 0.192*** | 0.224*** | 0.128*** | 0.181*** | 0.349*** | 0.262*** | |
| SZA | 0.440*** | 0.275*** | 0.192*** | 0.236*** | 0.307*** | 0.209*** | |
| HBA | 0.071*** | 0.397*** | 0.047** | 0.115*** | 0.162*** | 0.159*** | |
| PMI | 0.139*** | 0.055*** | 0.240*** | 0.153*** | 0.123*** | 0.078*** | |
| CEI | 0.177*** | 0.213*** | 0.213*** | 0.179*** | 0.263*** | 0.145*** | |
| GBI | 0.287*** | 0.423*** | 0.117*** | 0.298*** | 0.164*** | 0.249*** | |
| TO | 0.188*** | 0.216*** | 0.392*** | 0.141*** | 0.239*** | 0.317*** | TCI |
| NET | 0.270*** | 0.272*** | 0.360*** | 0.208*** | 0.315*** | 0.230*** | 0.132*** |
| Panel B: Short-term frequency, 1 to 5 days | |||||||
| EUA | 0.201*** | 0.254*** | 0.123*** | 0.164*** | 0.356*** | 0.259*** | |
| SZA | 0.387*** | 0.268*** | 0.209*** | 0.188*** | 0.319*** | 0.253*** | |
| HBA | 0.110*** | 0.316*** | 0.046** | 0.100*** | 0.240*** | 0.196*** | |
| PMI | 0.157*** | 0.082*** | 0.183*** | 0.177*** | 0.108*** | 0.103*** | |
| CEI | 0.188*** | 0.210*** | 0.141*** | 0.266*** | 0.167*** | 0.161*** | |
| GBI | 0.365*** | 0.417*** | 0.047** | 0.431*** | 0.156*** | 0.166*** | |
| TO | 0.177*** | 0.249*** | 0.407*** | 0.164*** | 0.198*** | 0.260*** | TCI |
| NET | 0.291*** | 0.228*** | 0.232*** | 0.388*** | 0.355*** | 0.332*** | 0.108*** |
| Panel C: Medium-term frequency, 5 to 22 days | |||||||
| EUA | 0.198*** | 0.068*** | 0.149*** | 0.263*** | 0.367*** | 0.268*** | |
| SZA | 0.375*** | 0.332*** | 0.077*** | 0.233*** | 0.228*** | 0.272*** | |
| HBA | 0.168*** | 0.420*** | 0.104*** | 0.114*** | 0.103*** | 0.096*** | |
| PMI | 0.138*** | 0.167*** | 0.284*** | 0.105*** | 0.151*** | 0.102*** | |
| CEI | 0.224*** | 0.232*** | 0.267*** | 0.159*** | 0.383*** | 0.219*** | |
| GBI | 0.202*** | 0.150*** | 0.207*** | 0.193*** | 0.129*** | 0.386*** | |
| TO | 0.253*** | 0.175*** | 0.408*** | 0.081*** | 0.280*** | 0.341*** | TCI |
| NET | 0.279*** | 0.221*** | 0.482*** | 0.162*** | 0.141*** | 0.147*** | 0.216*** |
| Panel D: Long-term frequency, longer than 22 days | |||||||
| EUA | 0.183*** | 0.076*** | 0.149*** | 0.265*** | 0.364*** | 0.275*** | |
| SZA | 0.369*** | 0.333*** | 0.073*** | 0.230*** | 0.215*** | 0.272*** | |
| HBA | 0.180*** | 0.417*** | 0.115*** | 0.119*** | 0.104*** | 0.077*** | |
| PMI | 0.127*** | 0.172*** | 0.269*** | 0.099*** | 0.152*** | 0.106*** | |
| CEI | 0.228*** | 0.202*** | 0.266*** | 0.160*** | 0.392*** | 0.231*** | |
| GBI | 0.193*** | 0.159*** | 0.206*** | 0.191*** | 0.130*** | 0.388*** | |
| TO | 0.256*** | 0.166*** | 0.408*** | 0.083*** | 0.294*** | 0.365*** | TCI |
| NET | 0.291*** | 0.217*** | 0.486*** | 0.168*** | 0.150*** | 0.146*** | 0.220*** |
Notes: The upper triangle of each panel conducts KS tests for PCI asymmetry, while the lower triangle examines NPDC asymmetry. The NET row contains KS tests for NET asymmetry, excluding the KS test under TCI.
Table 6.
Asymmetric tests of risk spillovers.
| EUA | SZA | HBA | PMI | CEI | GBI | ||
|---|---|---|---|---|---|---|---|
| Panel A: Total | |||||||
| EUA | 0.056 | 1.823 | 2.731 | ||||
| (7.208) | (4.008) | (10.365) | (13.614) | (5.656) | |||
| SZA | 1.642 | 2.201 | |||||
| (469.343) | (50.156) | (14.257) | (7.837) | (6.652) | |||
| HBA | |||||||
| (35.078) | (551.326) | (2.542) | (14.224) | (2.880) | |||
| PMI | 0.062 | 0.149 | |||||
| (25.654) | (63.720) | (63.590) | (21.759) | (0.569) | |||
| CEI | 6.073 | 5.833 | |||||
| (163.909) | (822.000) | (4588.445) | (33.818) | (3.367) | |||
| GBI | 1.880 | 19.138 | 4.152 | ||||
| (75.256) | (440.914) | (660.510) | (258.623) | (44.683) | |||
| Panel B: Short-term frequency, 1 to 5 days | |||||||
| EUA | 0.105 | 1.503 | 2.386 | ||||
| (5.742) | (4.446) | (8.917) | (14.963) | (5.252) | |||
| SZA | 1.643 | ||||||
| (251.385) | (10.820) | (11.798) | (7.474) | (5.008) | |||
| HBA | 21.291 | ||||||
| (851.015) | (206.559) | (2.516) | (13.492) | (2.493) | |||
| PMI | 15.178 | 0.109 | |||||
| (25.262) | (80.009) | (628.530) | (19.921) | (0.502) | |||
| CEI | 2.397 | 0.000 | 0.677 | ||||
| (53.755) | (13.041) | (102.693) | (34.835) | (3.175) | |||
| GBI | 0.264 | 0.734 | 0.699 | ||||
| (36.661) | (136.414) | (100.262) | (23.196) | (34.499) | |||
| Panel C: Medium-term frequency, 5 to 22 days | |||||||
| EUA | 0.621 | 13.253 | 8.806 | ||||
| (159.840) | (20.151) | (103.907) | (13.275) | (41.381) | |||
| SZA | 9.168 | 70.576 | 12.768 | ||||
| (541.258) | (1067.214) | (307.256) | (61.512) | (56.077) | |||
| HBA | 1.244 | 197.321 | |||||
| (133.299) | (4453.886) | (16.158) | (22.844) | (13.217) | |||
| PMI | 11.530 | 0.876 | 0.299 | ||||
| (235.485) | (451.127) | (52.208) | (65.766) | (0.839) | |||
| CEI | 0.536 | 3.215 | 8.652 | 0.005 | |||
| (149.243) | (357.248) | (601.823) | (3842.855) | (6.802) | |||
| GBI | 22.079 | 0.938 | 0.693 | ||||
| (371.302) | (917.825) | (1342.444) | (24.584) | (43.353) | |||
| Panel D: Long-term frequency, longer than 22 days | |||||||
| EUA | 3.068 | 188.264 | 17.619 | ||||
| (221.400) | (51.064) | (4243.979) | (18.885) | (118.116) | |||
| SZA | 399.432 | 19.717 | |||||
| (750.031) | (5446.581) | (30240.279) | (252.803) | (93.750) | |||
| HBA | 17.496 | 2481.718 | 3.051 | ||||
| (836.386) | (87194.804) | (69.549) | (27.129) | (281.259) | |||
| PMI | 1.296 | 0.344 | |||||
| (7175.578) | (11228.974) | (85.785) | (544.413) | (0.933) | |||
| CEI | 0.129 | ||||||
| (608.847) | (895.519) | (396.044) | (541.431) | (7.513) | |||
| GBI | 3.704 | ||||||
| (294.649) | (571.114) | (525.142) | (27.524) | (22.772) | |||
Notes: The upper triangle of each panel depicts descriptive statistics for the normalized asymmetry of PCI, while the lower triangle examines descriptive statistics for the normalized asymmetry of NPDC. The values without parentheses represent the mean, while those within parentheses denote the standard deviation.
Table 7.
Descriptive statistics of normalized asymmetry of NET.
| Market | time–frequency | Mean | Std. Dev. |
|---|---|---|---|
| EUA | Total | 102.856 | |
| 1-5 | 42.801 | ||
| 5-22 | 3.136 | 91.799 | |
| 22-inf | 3.710 | 139.489 | |
| SZA | Total | 80.137 | |
| 1-5 | 21.513 | ||
| 5-22 | 133.848 | ||
| 22-inf | 588.055 | ||
| HBA | Total | 263.661 | |
| 1-5 | 4.323 | 101.360 | |
| 5-22 | 125.318 | ||
| 22-inf | 14.547 | 665.414 | |
| PMI | Total | 4.837 | 147.478 |
| 1-5 | 2.276 | 167.110 | |
| 5-22 | 37.930 | ||
| 22-inf | 0.498 | 24.093 | |
| CEI | Total | 1.004 | 18.606 |
| 1-5 | 1.215 | 36.654 | |
| 5-22 | 0.002 | 35.557 | |
| 22-inf | 7.850 | 205.978 | |
| GBI | Total | 0.828 | 18.350 |
| 1-5 | 0.719 | 25.269 | |
| 5-22 | 1.136 | 57.696 | |
| 22-inf | 1.131 | 46.345 |
Disclaimer/Publisher’s Note: The statements, opinions and data contained in all publications are solely those of the individual author(s) and contributor(s) and not of MDPI and/or the editor(s). MDPI and/or the editor(s) disclaim responsibility for any injury to people or property resulting from any ideas, methods, instructions or products referred to in the content. |
© 2024 by the authors. Licensee MDPI, Basel, Switzerland. This article is an open access article distributed under the terms and conditions of the Creative Commons Attribution (CC BY) license (http://creativecommons.org/licenses/by/4.0/).
Copyright: This open access article is published under a Creative Commons CC BY 4.0 license, which permit the free download, distribution, and reuse, provided that the author and preprint are cited in any reuse.


