
Submitted:
07 June 2024
Posted:
10 June 2024
You are already at the latest version
Abstract
Label-free optical biosensors such as interferometers can provide comparable limit of detection to widely used enzyme-linked immunosorbent assays, while minimizing the number of steps and reducing false positives/ negatives. In 2020, authors reported a novel optofluidic Young interferometer (YI) that can provide real-time spatial information on refractive index changes occurring along the length of sensor and reference channels. Herein, we exploited these features of the YI to study interactions of biomolecules with recognition elements immobilized in selected regions of agarose gel in the sensor channel. We showed that the YI is well suited for biosensing of an exemplar biomolecule, streptavidin, in the absence and presence of bovine serum albumin interferent. Equally, we coupled the YI with electrokinetic transport to reduce the time for biosensing.
Keywords:
Young interferometer
; electrokinetic
; microfluidics
; biosensing
; streptavidin
1. Introduction
Historically, detection of biomolecules has been achieved using labelled techniques with Enzyme-Linked Immunosorbent Assay (ELISA) being the gold-standard method offering a limit of detection of 1 pM [1]. ELISA, however, is time consuming because of multiple adding and washing steps, and the use of labels increases the probability of false positives/ negatives. In the last two decades, label-free biosensors have emerged that can not only overcome the limitations of labelled techniques but in some cases offer the same limit of detection as their labelled predecessors. In contrast to their predecessors, label-free biosensors detect biomolecules based on a universal property such as the refractive index (RI) [2,3] and mass [4].
Label-free optical biosensors rely on changes in RI for the detection of biomolecules. Among label-free optical biosensors, interferometers offer the lowest limit of detection. A common type of interferometer is a Young interferometer (YI) where incoming light is split into two beams. One of the light beams interacts with a sample solution and the other with a reference solution. The two beams then interact with each other to produce a periodic pattern of intensity called interference fringes. The position of these interference fringes shifts as the RI of sample solution changes. RI is proportional to the concentration of sample solutions, and hence analyte concentration can be determined by measuring shifts in interference fringes.
The majority of the YIs measure either a RI change at a single point or an average change in RI over a specific distance. In contrast, in 2020, we reported a novel YI for real-time imaging of RI changes along the length of microfluidic channels [5]. Furthermore, the majority of the YIs are based on integrated optics where the two light beams travel in waveguides and only the evanescent field interacts with sample/ reference solutions [6,7,8]. In contrast, the YI reported by the authors was optofluidic where light beams interacted with the entire depth of solutions in sample and reference channels of a microfluidic device [5].
There has been a significant growth in microfluidic devices including those based on electrokinetic forces for rapid transport and separation of electrically charged biomolecules, proteins and DNA [9,10]. The detection of biomolecules in microfluidic electrokinetic devices is typically performed using absorbance, fluorescence, and mass spectrometry. There are so far only two reports of the integration of electrokinetic transport with interferometry detection. One of these was by the authors where the optofluidic YI was coupled with electrokinetic transport to study migration of a model protein under an applied electric field [5]. The other report was by Yang et al. [11] who monitored the electrokinetic separation of proteins using a Mach-Zehnder interferometer (MZI).
Our previous work [5] reported the basic principle of a novel optofluidic YI and showed that our YI can be used to study electrokinetic transport of a protein. Herein, for the first time, we showed that our optofluidic YI integrated with electrokinetic transport is suited for biosensing. We filled the sample and reference channels of our microfluidic device with a hydrogel with recognition elements immobilized in specific regions of the hydrogel in the sample channel. We showed the biosensing capabilities of our optofluidic YI using streptavidin as a biomolecular analyte and biotin as recognition element. To show that biosensing is selective, we used bovine serum albumin (BSA) as an interferent and detected streptavidin in the presence of BSA.
2. Experimental
2.1. Chemicals and Materials
3 mm thick clear poly (methyl methacrylate) (PMMA) sheets were purchased from RS Components (Corby, UK). 275 µm thick double-sided tape (3M 7961MP) was bought from Cadillac Plastics (Swindon, UK). Agarose (A9539), biotin hydrazide (B7639), sodium phosphate monobasic, sodium phosphate dibasic, fluorescein, and bovine serum albumin (BSA, A7638) were bought from Sigma-Aldrich. Sodium (meta)periodate (NaIO4) and 1 N hydrochloric acid were bought from VWR. Streptavidin (2-0203-100) was bought from IBA Lifesciences.
2.2. Synthesis of Functionalized Agarose
2% (w:v) agarose solution was prepared in 10 mM phosphate buffer, pH 5.3, and dissolved by placing the solution on a hotplate at 120°C while being stirred with a magnetic bar. The agarose solution was cooled to 70°C. To oxidize hydroxide groups in agarose to aldehydes, equal volumes of 2% (w:v) agarose solution and 40 mM NaIO4 solution were reacted for 45 min at 70°C in darkness. The solution was gelled by cooling to room temperature. The hydrogel was washed in 10 mM phosphate buffer, pH 5.3 for 4-6 h and then in 10 mM phosphate buffer, pH 6.2 overnight. The activated hydrogel was melted by heating to 70°C and reacted with 2 mM biotin hydrazide for 2 h to obtain biotin functionalized agarose. The solution was gelled by cooling to room temperature, washed in the buffer used to prepare sample solutions. Agarose hydrogel was melted again by heating and the solution was used to fill selected regions of channels in microfluidic devices.
2.3. Fabrication of Microfluidic Devices
Microfluidic devices were made by sandwiching a doubled-sided adhesive film between 38.1 mm long and 25.4 mm wide PMMA sheets. The top PMMA sheet had through-holes to act as fluidic reservoirs. The double-sided adhesive was laser cut to form sensor and reference channels each with a width and length of 1 mm and 10 mm, respectively. The center-to-center distance between the channels was 2 mm (see insets in Figure 1).
2.4. Instrumentation
A schematic of our YI instrumentation is provided in Figure 1. Laser light of peak wavelength 532 nm (RLD 532-1-3, Roithner Lasertechnik) was passed through a beam expander (Comar Optics) to increase the diameter of the beam to 25 mm. Subsequently, the beam was passed through a Fresnel biprism with an apex angle of 179° (3B Scientific) to split it into two beams, which were passed through a cylindrical lens (Comar Optics) with a focal length of 120 mm to obtain two wedge shaped beams separated by 2.17 mm. The distance between the Fresnel biprism and the cylindrical lens was ~325 mm. The microfluidic device was placed 120 mm away from the cylindrical lens. The electrodes, which were made of 0.1 mm thick stainless-steel sheet, were immersed in the reservoirs of the channels. Mirrors (PFSQ10-03-F01, Thorlabs) were used to fold the beam to reduce the footprint of the set-up. The interferogram was captured using a 6.6 Mpixel CMOS camera (PL-B781, Pixelink) with 10.5 mm by 7.7 mm imaging region. The size of each pixel was 3.5 µm by 3.5 µm. The long axis of the camera was aligned parallel to the length of the channels to maximize length of the channel to be imaged. The camera was placed ~680 mm away from the microfluidic device. Voltage was applied across the length of the channels using a power supply (PS350, Stanford Research Systems).
3. Results and Discussion
3.1. Working Principle of the YI
In our YI (see Figure 1), light beams passed through the sensor and reference channels and then combined in space to produce a periodic pattern of intensity (I(s,y)) (see inset in Figure 1) given by Equation 1 [5].
Here, I0 is the intensity of the incoming beam, d is the distance between the two beams, λ is wavelength, D is the distance between microfluidic device and camera, s is the distance along the camera and Δφ(y) is the phase difference between the sensor and reference channels at distance y along their length and is given by Equation 2 [5] where h is the depth of the channels and Δn(y) is the RI difference between the sensor and reference channels. The optical pathlength of our YI is determined by h and can be easily tailored.
As proteins are introduced at location y in the sensor channel, Δn(y) changes, causing Δφ(y) and the position of interference fringes at y to change. To obtain Δφ(y), we extracted intensity distribution along s at the selected y and applied fast Fourier transform [5]. By measuring Δφ(y), we were able to measure RI differences as low as 2.04×10⁻⁶ per mm [5]. We can analyze interference fringes along channel length recorded at different times to obtain RI difference profile versus space and time.
3.2. Electrokinetic Transport of Streptavidin Using the YI
As binding between biomolecular analytes and recognition elements can be influenced by pH of buffer solutions [12], we studied electrokinetic transport of streptavidin at different pH values. Microfluidic devices with sensor and reference channels filled with 1% (w:v) untreated agarose were used. The reservoirs of the reference channel and a reservoir of the sensor channel were filled with 10 mM phosphate buffer. The other reservoir of the sensor channel was filled with 20 µM streptavidin prepared in the buffer. When 10 V was applied across the channel length, streptavidin was electrokinetically transported because it is electrically charged at buffer pH.
The phase difference versus channel length and time for the protein in 10 mM phosphate buffer, pH 3 is shown in Figure 2 (a). As time progressed, the protein travelled in the channel. Thus, the change in RI and the phase difference was propagated along the channel length. Similar studies were performed on the protein in 10 mM phosphate buffer, pH 7 and 9. The direction of travel of streptavidin at pH 3 was reversed compared to pH 7 and 9 as it has an isoelectric point of ~5 [13]. The distance and time at which the phase difference changed to 50% of its maximum value were calculated for streptavidin prepared in buffers of pH 3, 7 and 9 (see Figure 2 (b)). The slope of the best fit line provided the electrokinetic velocity of the protein, which at pH 3 was 8.1×10⁻³ mm/s, at pH 7 was −12.2×10⁻³ mm/s, and pH 9 was −15.0×10⁻³ mm/s.
3.3. Electrokinetic Transport Coupled YI for Biosensing
We used microfluidic devices with the reference channel filled with 1% (w:v) untreated agarose and the sensor channel contained a plug of functionalized agarose sandwiched between untreated agarose (both: 1% (w:v)). To determine the width of the plug, fluorescein was added to the solution of functionalized agarose, injected in the sensor channel, and fluorescence images were taken (see inset in Figure 3). In Figure 3, the region with high gray scale value corresponds to the plug of functionalized agarose containing fluorescein. Based on Figure 3, the full width half maximum (FWHM) of the functionalized agarose plug was 2.5±0.5 mm (repeats = 5).
Subsequently, 20 µM streptavidin prepared in 10 mM phosphate buffer, pH 3 was electrokinetically transported in the sensor channel containing a plug of biotin functionalized agarose between untreated agarose. Figure 4 (a) shows that initially streptavidin travelled from one end of the channel to the other. In this initial phase, instead of travelling through the hydrogel, streptavidin might have leaked through gaps in the sensor channel. These gaps are introduced because the hydrogel was not chemically bonded to the top and bottom PMMA surfaces of the channel and hence can detach as it solidifies. Subsequently, streptavidin flowed through the hydrogel in the channel and accumulated in the region of the channel containing the biotin functionalized agarose plug.
After a buffer wash was done, streptavidin stayed bound to the biotin functionalized agarose plug as illustrated in Figure 4. This is because the interactions between streptavidin and biotin are one of the strongest with a dissociation constant of ~10 fM. The phase difference in regions upstream and downstream of the biotin functionalized plug (black and blue traces in Figure 4 (b)) after buffer wash returned to the value at time =0, indicating that streptavidin did not bind to untreated agarose. The average phase difference between 2500 s to end was plotted with respect to distance to determine the FWHM of the plug of bound streptavidin. The FWHM of the bound streptavidin plug was ~3.1 mm, which was comparable to the FWHM of the agarose plug determined by fluorescence images.
Sensing of streptavidin at pH 7 and 9 were also studied. However, the phase difference after buffer wash in the region corresponding to biotin functionalized agarose was low (<0.4 versus 1 radian at pH 3). This was unexpected because biotin and streptavidin binding is strong over a wide pH range.
3.4. Effect of Interferents on Sensing of Streptavidin
Figure 5 shows streptavidin sensing in the presence of BSA. Figure 5 (a) shows that the phase difference increased as BSA was electrokinetically transported in the sensor channel but returned to the values observed at time = 0 after a buffer wash. Thus, BSA did not bind to biotin functionalized and untreated agarose. However, as shown in Figure 5 (b), if a mixture of BSA and streptavidin was electrokinetically transported, there was a permanent increase in the phase difference in the region of the sensor channel with biotin functionalized agarose plug.
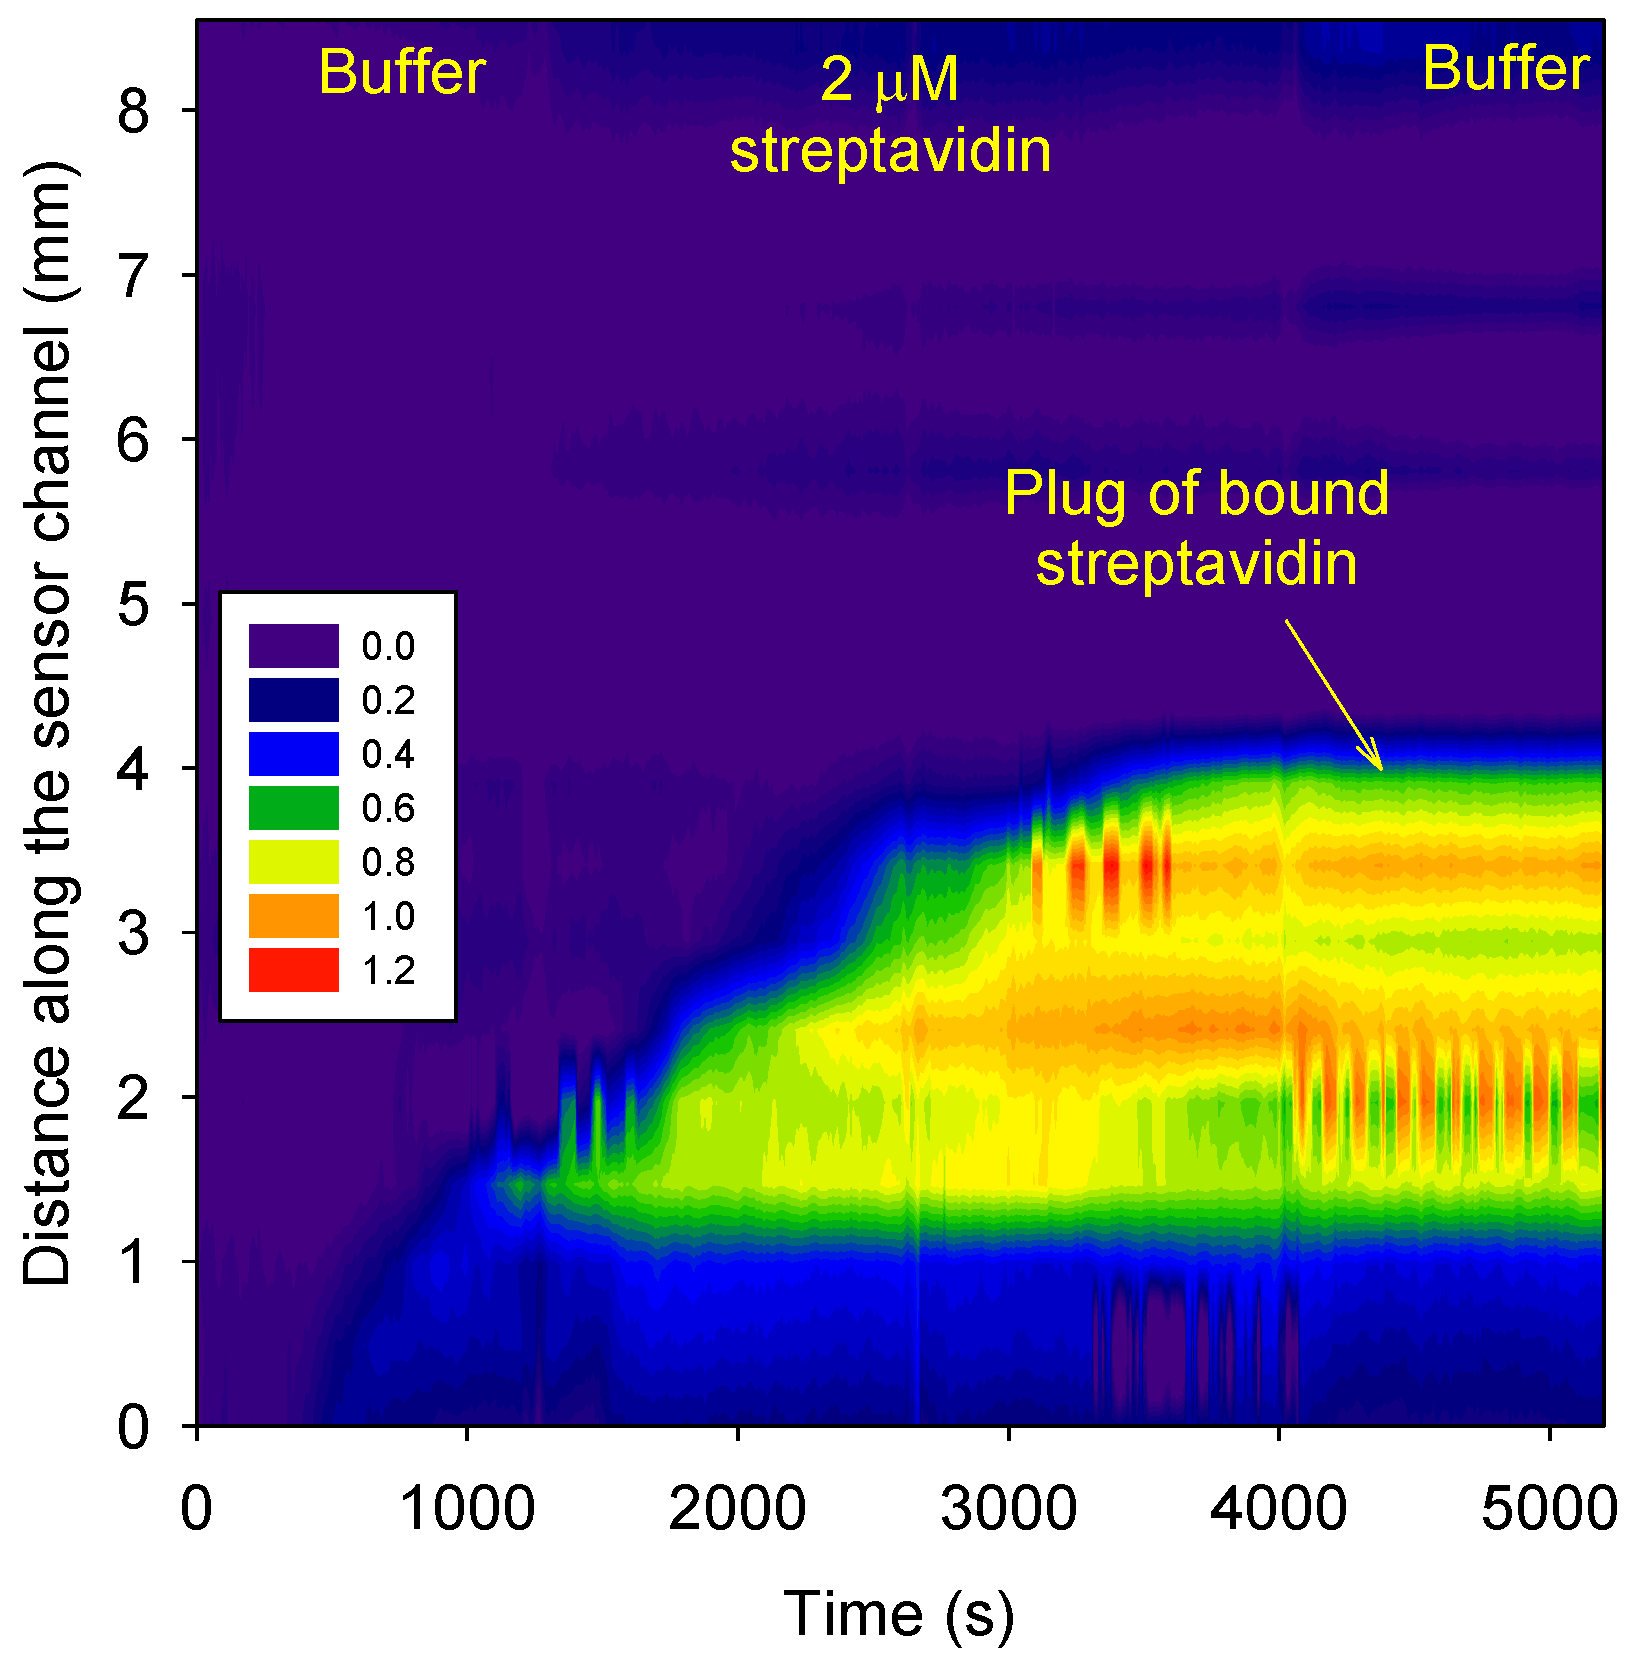
3.5. Quantification of Streptavidin
Figure 6 shows that 2 µM streptavidin in 10 mM phosphate buffer, pH 3 accumulated in the biotin functionalized agarose plug. None of the streptavidin could travel beyond the biotin functionalized agarose plug. A comparison of Figure 4 and Figure 6 shows that the phase change in the biotin functionalized agarose plug after buffer wash was ~1 radians for both 20 and 2 µM streptavidin. This is because the concentration of biotin in the plug was ~24 µM. Hence at the selected concentrations of streptavidin, all the immobilized biotins would have bound to streptavidin because of the low dissociation constant (KD).
The RI LOD of our optofluidic YI is 2.04×10⁻⁶ RIU per mm of the optical pathlength [5]. In this work, we used 275 µm deep channels and the protein RI increment is 0.185 ml/g [14]. Thus, the LOD of our YI for streptavidin is ~0.6 µM. In theory, our optofluidic YI should be able to detect 2.5 fM streptavidin in biotin functionalized agarose. However, experimentally, this could not be achieved. The dynamic range is limited by the KD between the analyte and recognition element, not by the YI because phase unwrapping allows essentially detection of unlimited changes in RI provided they do not happen suddenly.
3.5. Comparison with State-of-the-Art Interferometers
Table 1 highlights that the RI LOD of our optofluidic YI is comparable or better than bimodal waveguides and MZI. The RI LOD of our optofluidic YI is two orders of magnitude higher than the waveguide YI. The current analysis time for our optofluidic YI is comparable to the state-of-the-art devices but can be significantly reduced by increasing the voltage used for electrokinetic transport. Furthermore, RI imaging capability of our YI implies that different recognition elements can be immobilized along the length of channels for multiplexed sensing without having to make arrays of devices. Finally, our YI was made of PMMA and double-sided tape and by laser cutting rather than expensive materials and semiconductor fabrication methods. Hence, the cost per device of our optofluidic YI is lower than the state-of-the-art interferometers.
5. Conclusions
An optofluidic Young interferometer (YI) coupled with electrokinetic transport was applied for biosensing of an exemplar biomolecule, streptavidin, in the absence and presence of bovine serum albumin interferent. While electrokinetic forces allowed rapid transport of samples, the YI provided temporal and spatial information on the concentration and interactions of biomolecules with recognition elements.
Author Contributions
Conceptualization, R.G.; methodology, R.G. and E.L.; validation, R.G. and E.L.; formal analysis, R.G. and E.L.; investigation, E.L.; resources, R.G.; data curation, R.G. and E.L.; writing—original draft preparation, R.G.; writing—review and editing, R.G.; visualization, X.X.; supervision, R.G.; project administration, R.G.; funding acquisition, R.G. All authors have read and agreed to the published version of the manuscript.
Funding
This research was funded by RG acknowledges funding from the Engineering and Physical Sciences Research Council (Grant EP/N02074X/2) and University of Birmingham.
Data Availability Statement
The original contributions presented in the study are included in the article/supplementary material, further inquiries can be directed to the corresponding author/s.
Conflicts of Interest
The authors declare no conflicts of interest.
References
- Luan E., Shoman H., Ratner D.M., Cheung K.C., Chrostowski L. Silicon photonic biosensors using label-free detection. Sensors, 2018, 18, article 3519, pp 1-42. [CrossRef]
- Gupta R., Goddard N.J. Leaky waveguides (LWs) for chemical and biological sensing - a review and future perspective, Sensors and Actuators B, 2020, 322, article 128628, pp 1-23.
- Angelopoulou M., Kakabakos S., Petrou P., Label-free biosensors based onto monolithically integrated onto silicon optical transducers, Chemosensors, 2018, 6, article 52, pp 1-27. [CrossRef]
- Cooper M.A. Label-free biosensors: techniques and applications. 2009: Cambridge University Press.
- Gupta R., Labella E., Goddard N.J. An optofluidic young interferometer sensor for real-time imaging of refractive index in µTAS applications, Sensors and Actuators B, 2020, 321, article 128491, pp 1-8. [CrossRef]
- Misiakos K., Raptis I., Makarona E., Botsialas A., Salapatas A., Oikonomou P., Psarouli A., Petrou P., Kakabakos S., Tukkiniemi K. All-silicon monolithic Mach-Zehnder interferometer as a refractive index and bio-chemical sensor, Optics Express, 2014, 22, pp 26803-26813. [CrossRef]
- Bruck R., Melnik E., Muellner P., Hainberger R., Lämmerhofer M. Integrated polymer-based Mach-Zehnder interferometer label-free streptavidin biosensor compatible with injection molding, Biosensors and Bioelectronics, 2011, 26, pp 3832-3837. [CrossRef]
- Wang M., Uusitalo S., Liedert C., Hiltunen J., Hakalahti L., Myllylä R. Polymeric dual-slab waveguide interferometer for biochemical sensing applications, Applied Optics, 2012, 51, pp 1886-1893. [CrossRef]
- Dawod M., Arvin N.E., Kennedy R.T. Recent advances in protein analysis by capillary and microchip electrophoresis, Analyst, 2017, 142, pp 1847-1866. [CrossRef]
- Li Y., Feng X., Du W., Li Y., Liu B.F. Ultrahigh-throughput approach for analyzing single-cell genomic damage with an agarose-based microfluidic comet array, Analytical Chemistry, 2013, 85, pp 4066-4073. [CrossRef]
- Yang X., Zhou M., Li S., Liu Z., Yang J., Xu H., Yuan T., Qi X., Li H., Yuan L. On-line dynamic detection in the electrophoretic separation by tapered optical fiber interferometer, Sensors and Actuators B: Chemical, 2016, 242, pp 667-672. [CrossRef]
- Dejaegere A., Choulier L., Lafont V., De Genst E., Altschuh D. Variations in antigen-antibody association kinetics as a function of pH and salt concentration: a QSAR and molecular modeling study, Biochemistry, 2005, 44, pp 14409-14418. [CrossRef]
- Streptavidin, https://www.e-proteins.com/avidin-and-derivatives/streptavidin/, date accessed: 15/02/2024.
- Zhao H., Brown P.H., Schuck P. On the Distribution of protein refractive index increments, Biophysical Journal, 2011, 100, pp 2309-2317. [CrossRef]
- Schmitt K., Schirmer B., Hoffman C., Branderburg A., Meyrueis P. Interferometric biosensor based on planar optical waveguide sensor chips for label-free detection of surface bound bioreactions, Biosensors and Bioelectronics, 2007, 22, pp 2591-2597. [CrossRef]
- Heideman R., Kooyman R., Greve J., Performance of a highly sensitive optical waveguide Mach-Zehnder interferometer immunosensor, Sensors and Actuators B: Chemical, 1993, 10, pp 209-217. [CrossRef]
- Torrijos-Morán L., Lisboa B.D., Soler M., Lechuga L., García-Rupérez J. Integrated optical bimodal waveguide biosensors: principles and applications, Results in Optics, 2022, 9, article 100285, pp 1-15. [CrossRef]
Figure 1.
Schematic of the YI instrumentation where insets show microfluidic devices used in this work and typical interference fringes.
Figure 1.
Schematic of the YI instrumentation where insets show microfluidic devices used in this work and typical interference fringes.
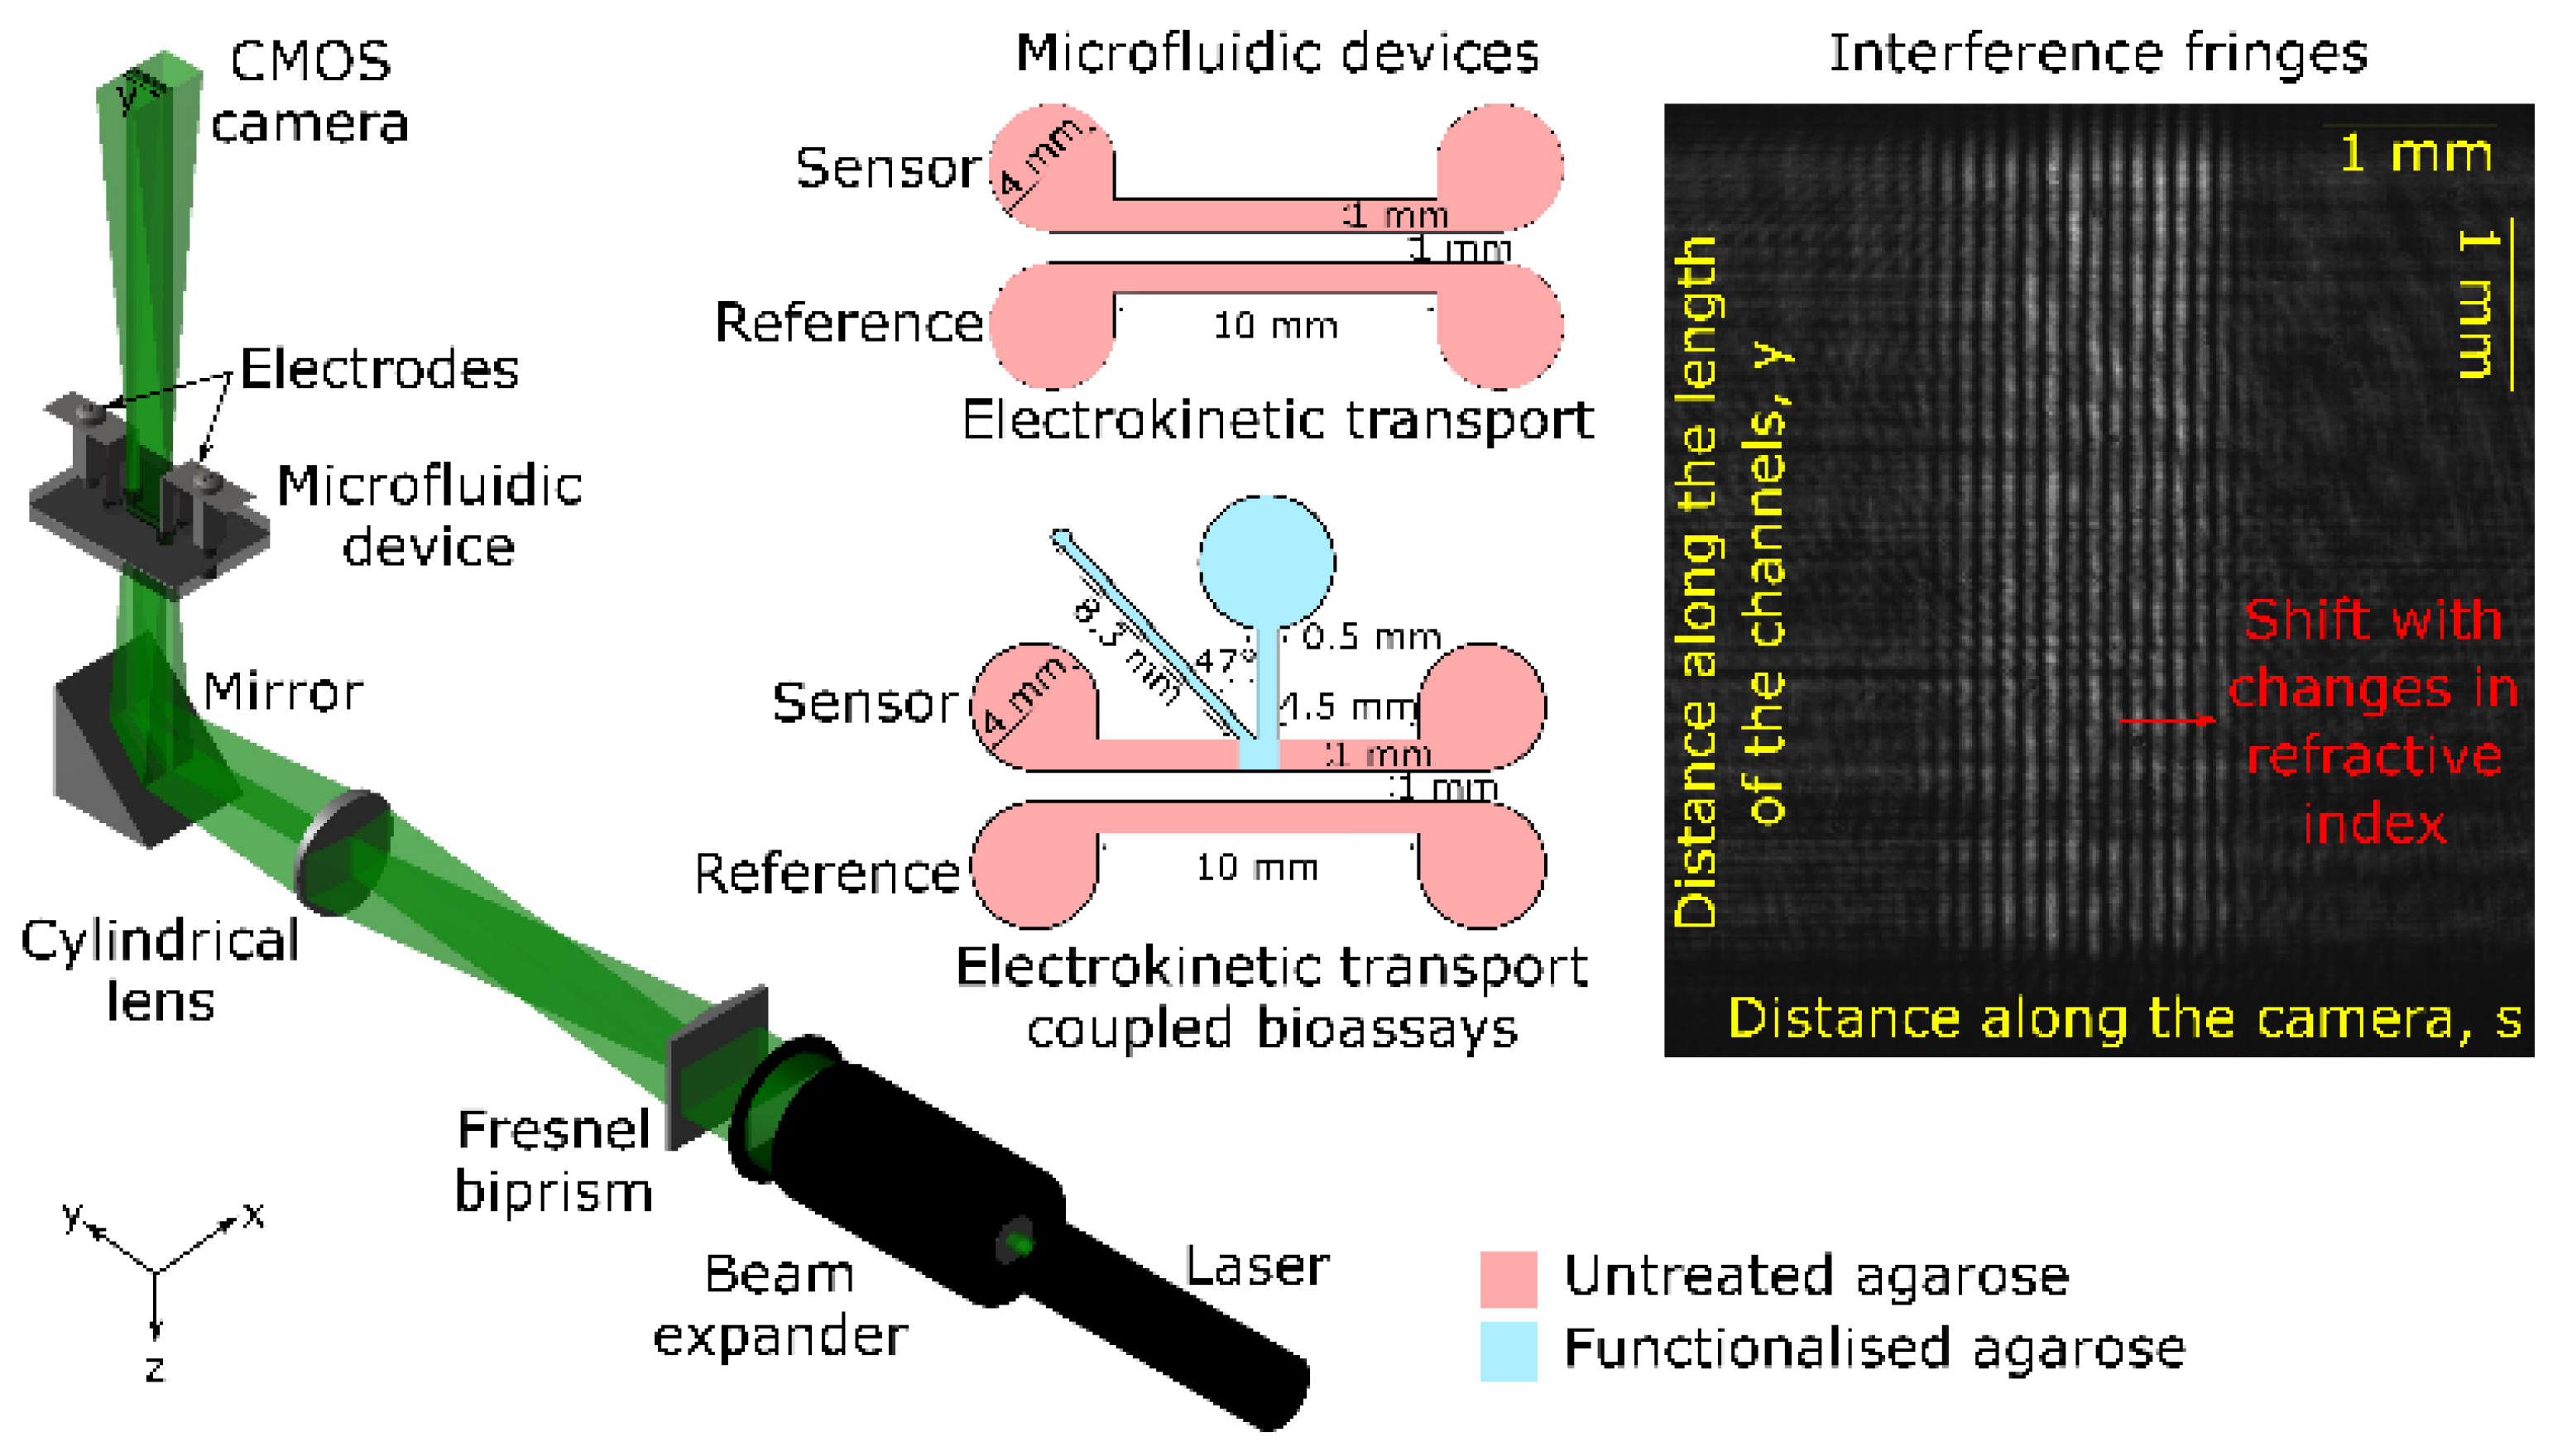
Figure 2.
(a) Phase difference versus channel length and time (arrow shows the direction of travel for protein prepared in buffer at pH 3), and (b) velocity plots of streptavidin in buffers of pH 3, 7 and 9 under 10 V.
Figure 2.
(a) Phase difference versus channel length and time (arrow shows the direction of travel for protein prepared in buffer at pH 3), and (b) velocity plots of streptavidin in buffers of pH 3, 7 and 9 under 10 V.
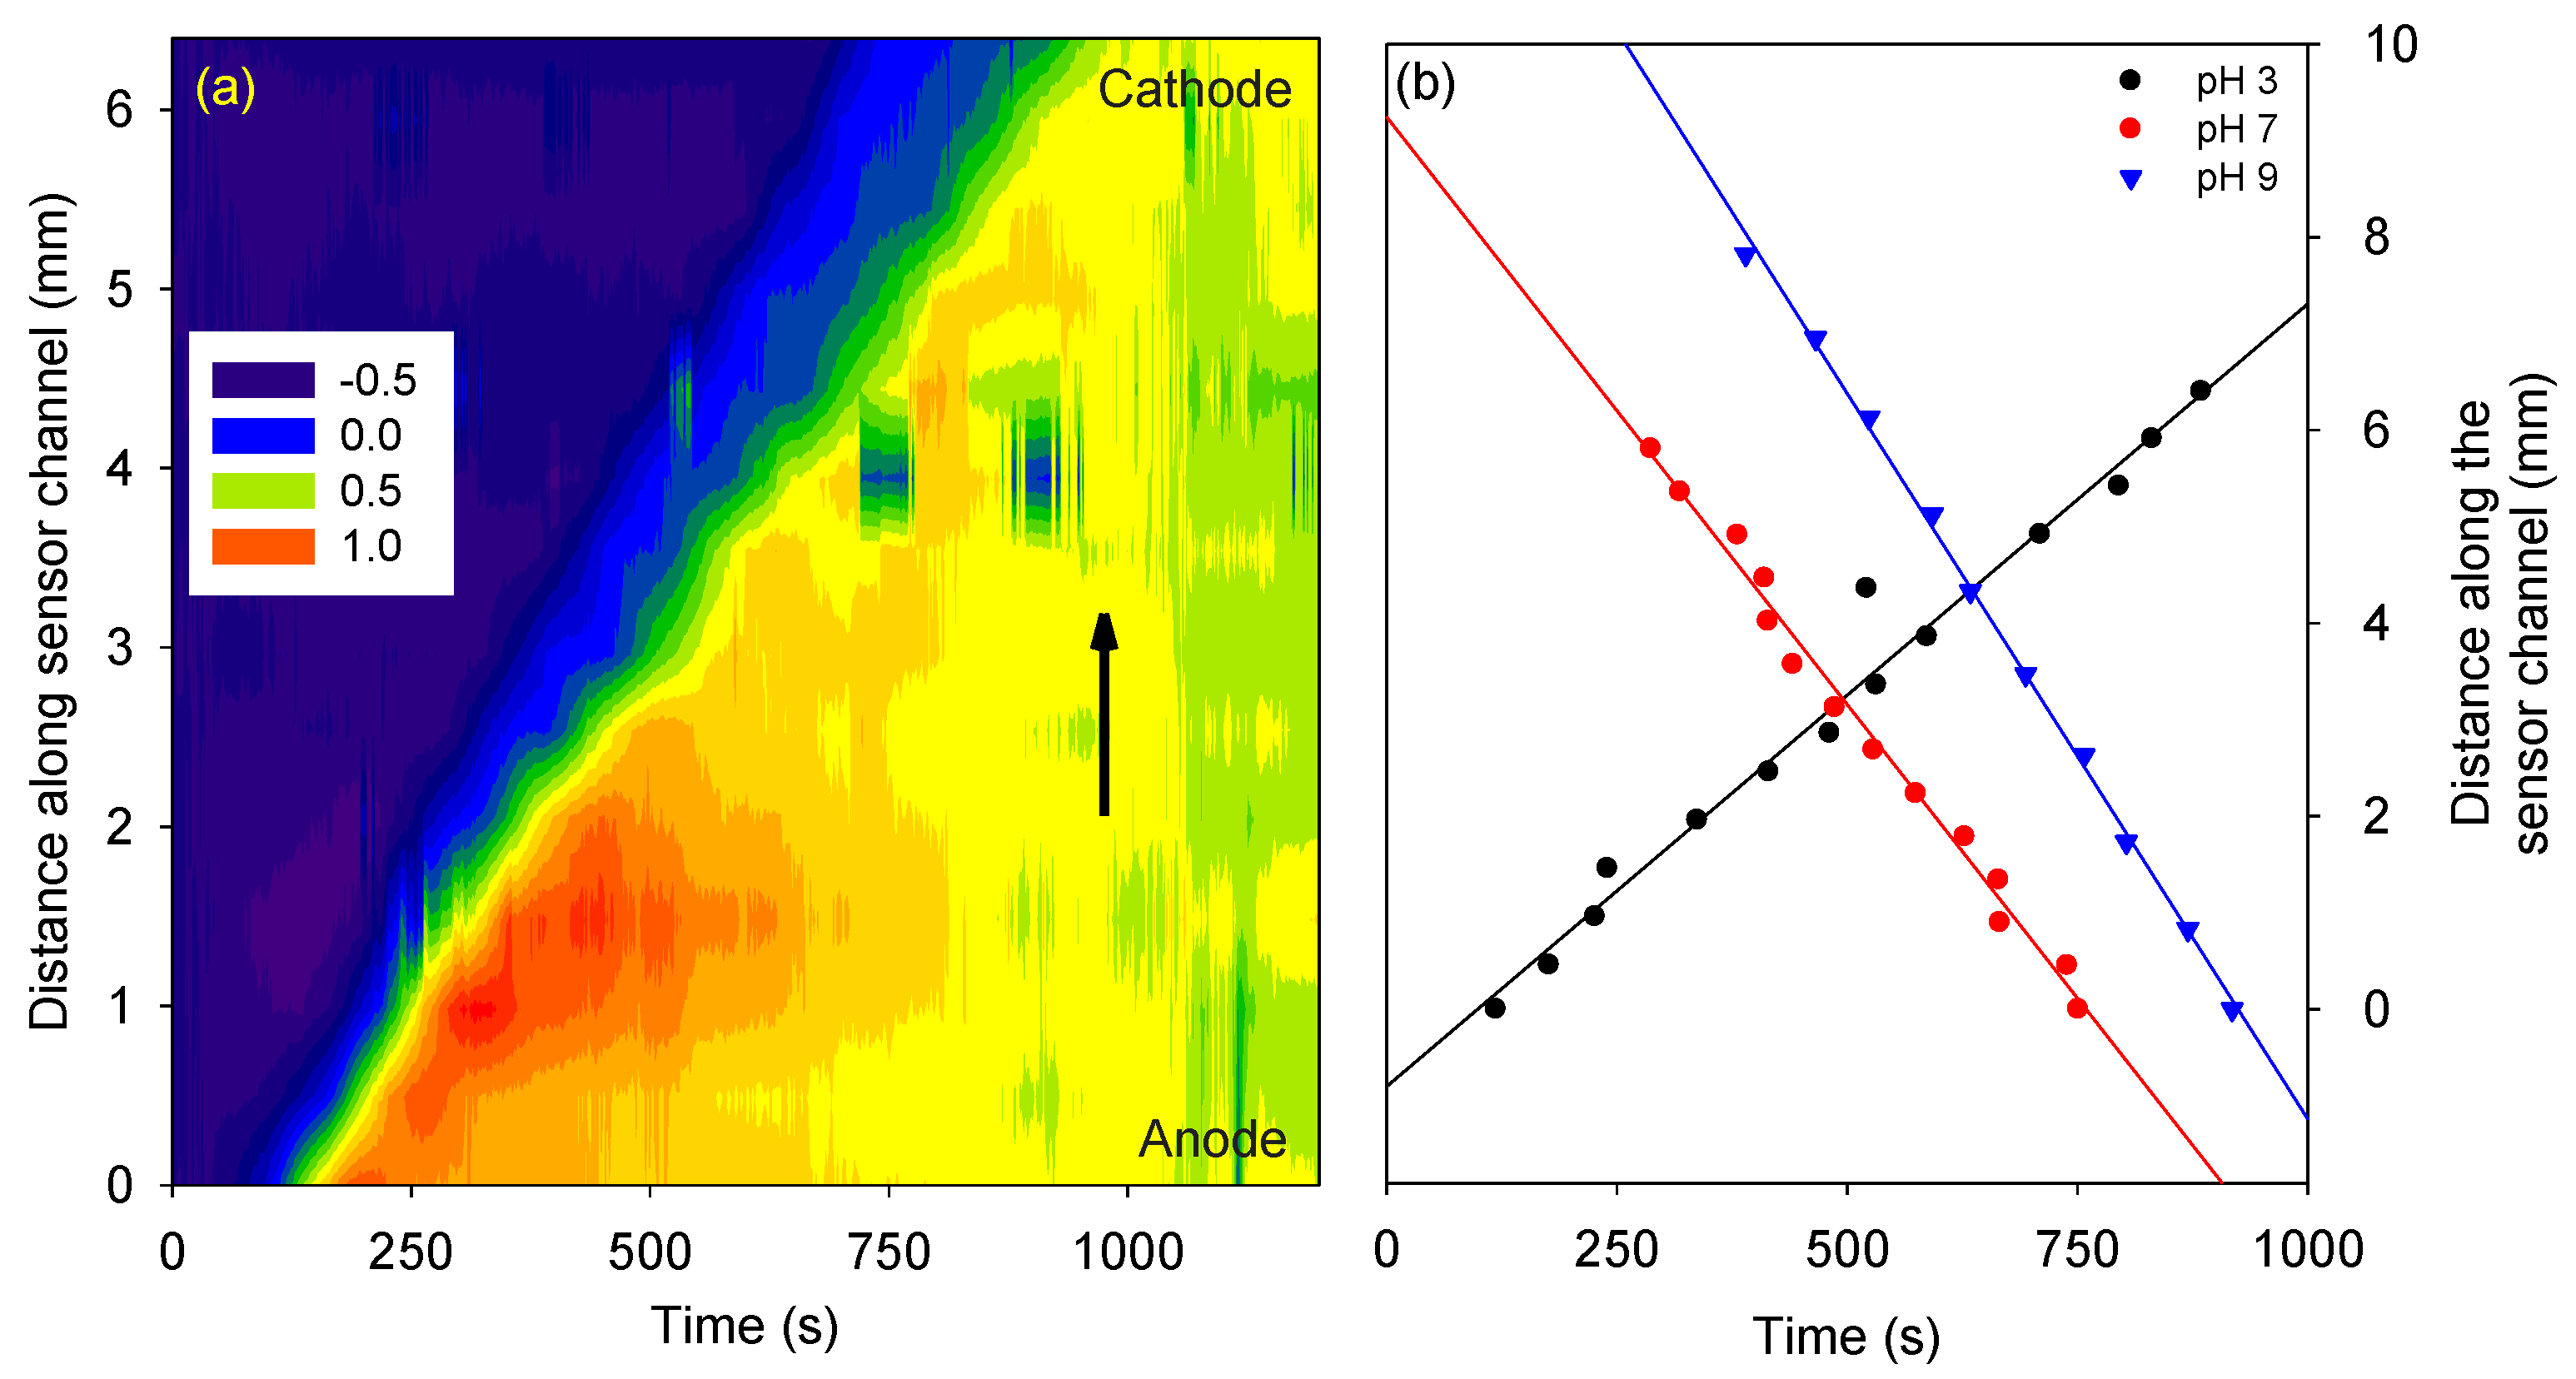
Figure 3.
Gray scale value along the channel length for 5 microfluidic devices where the inset shows a fluorescence image of one of the devices with 1 mm wide sensor channel filled with a plug of functionalized agarose containing fluorescein.
Figure 3.
Gray scale value along the channel length for 5 microfluidic devices where the inset shows a fluorescence image of one of the devices with 1 mm wide sensor channel filled with a plug of functionalized agarose containing fluorescein.
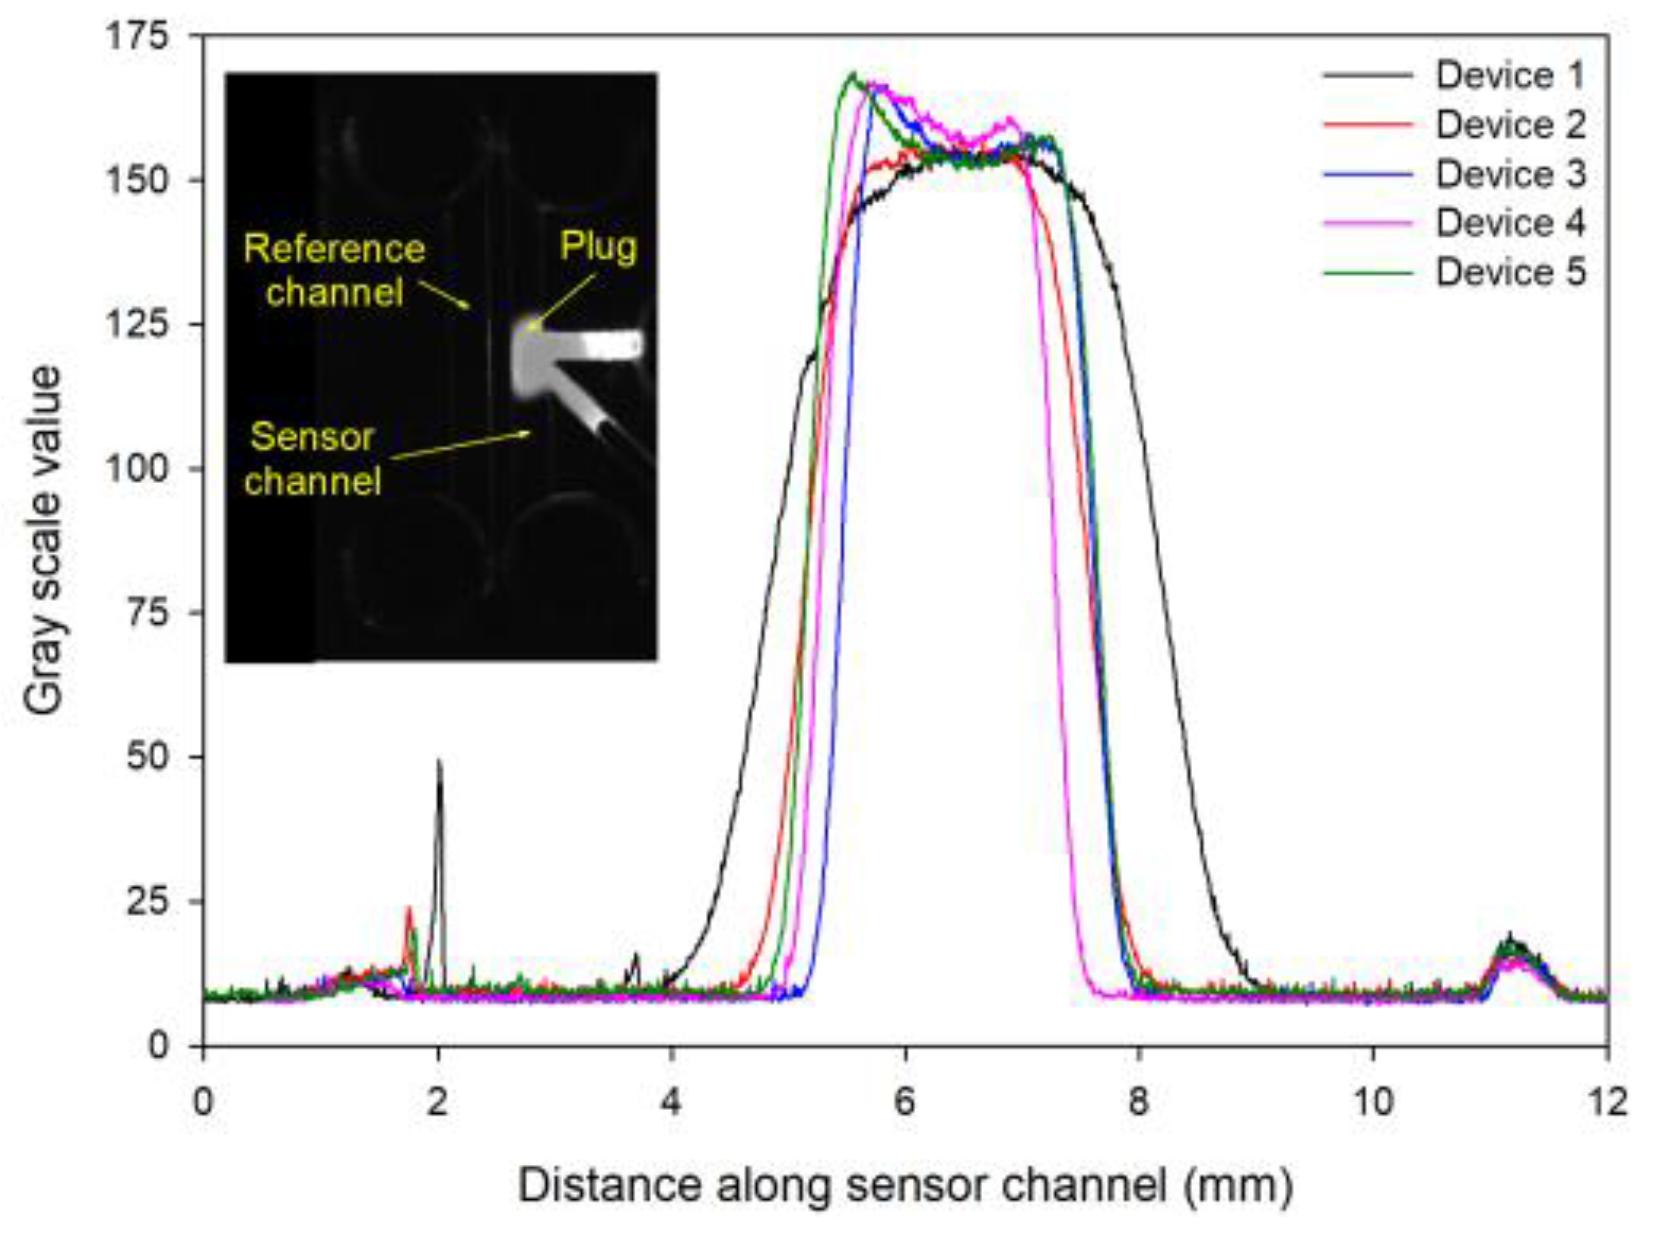
Figure 4.
(a) Phase difference versus channel length and time, and (b) phase versus time at selected distances for buffer-streptavidin-buffer.
Figure 4.
(a) Phase difference versus channel length and time, and (b) phase versus time at selected distances for buffer-streptavidin-buffer.
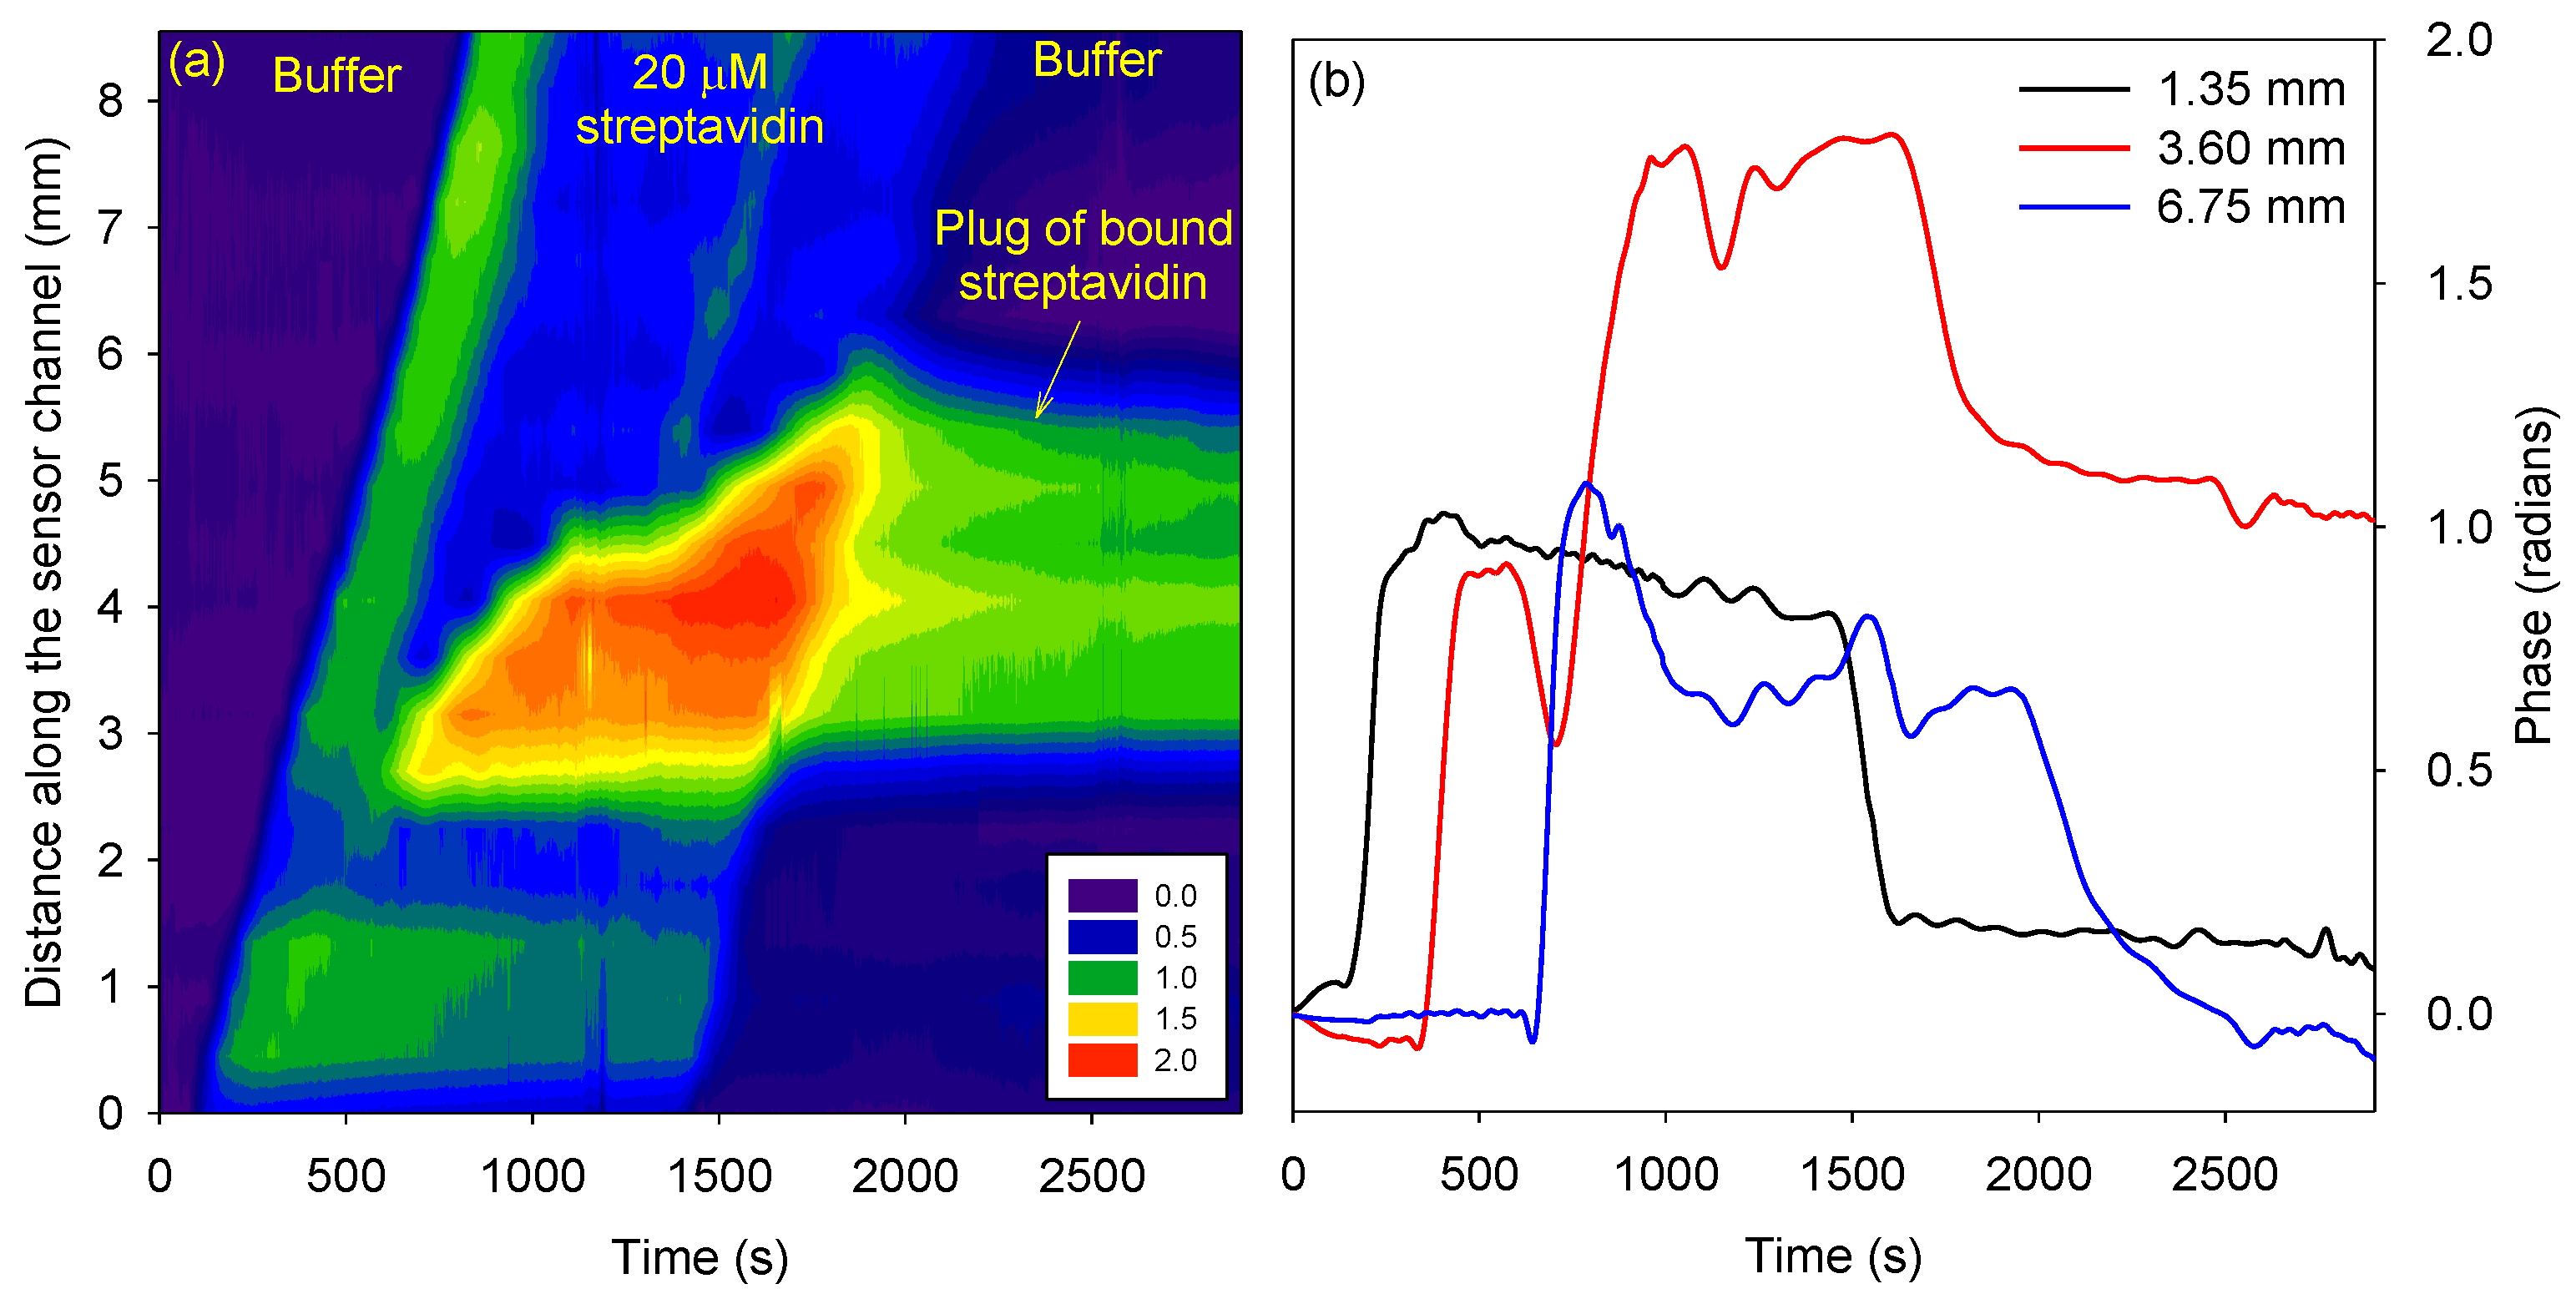
Figure 5.
Phase difference versus channel length and time for (a) buffer-BSA-buffer, and (b) buffer-(BSA and streptavidin)-buffer.
Figure 5.
Phase difference versus channel length and time for (a) buffer-BSA-buffer, and (b) buffer-(BSA and streptavidin)-buffer.
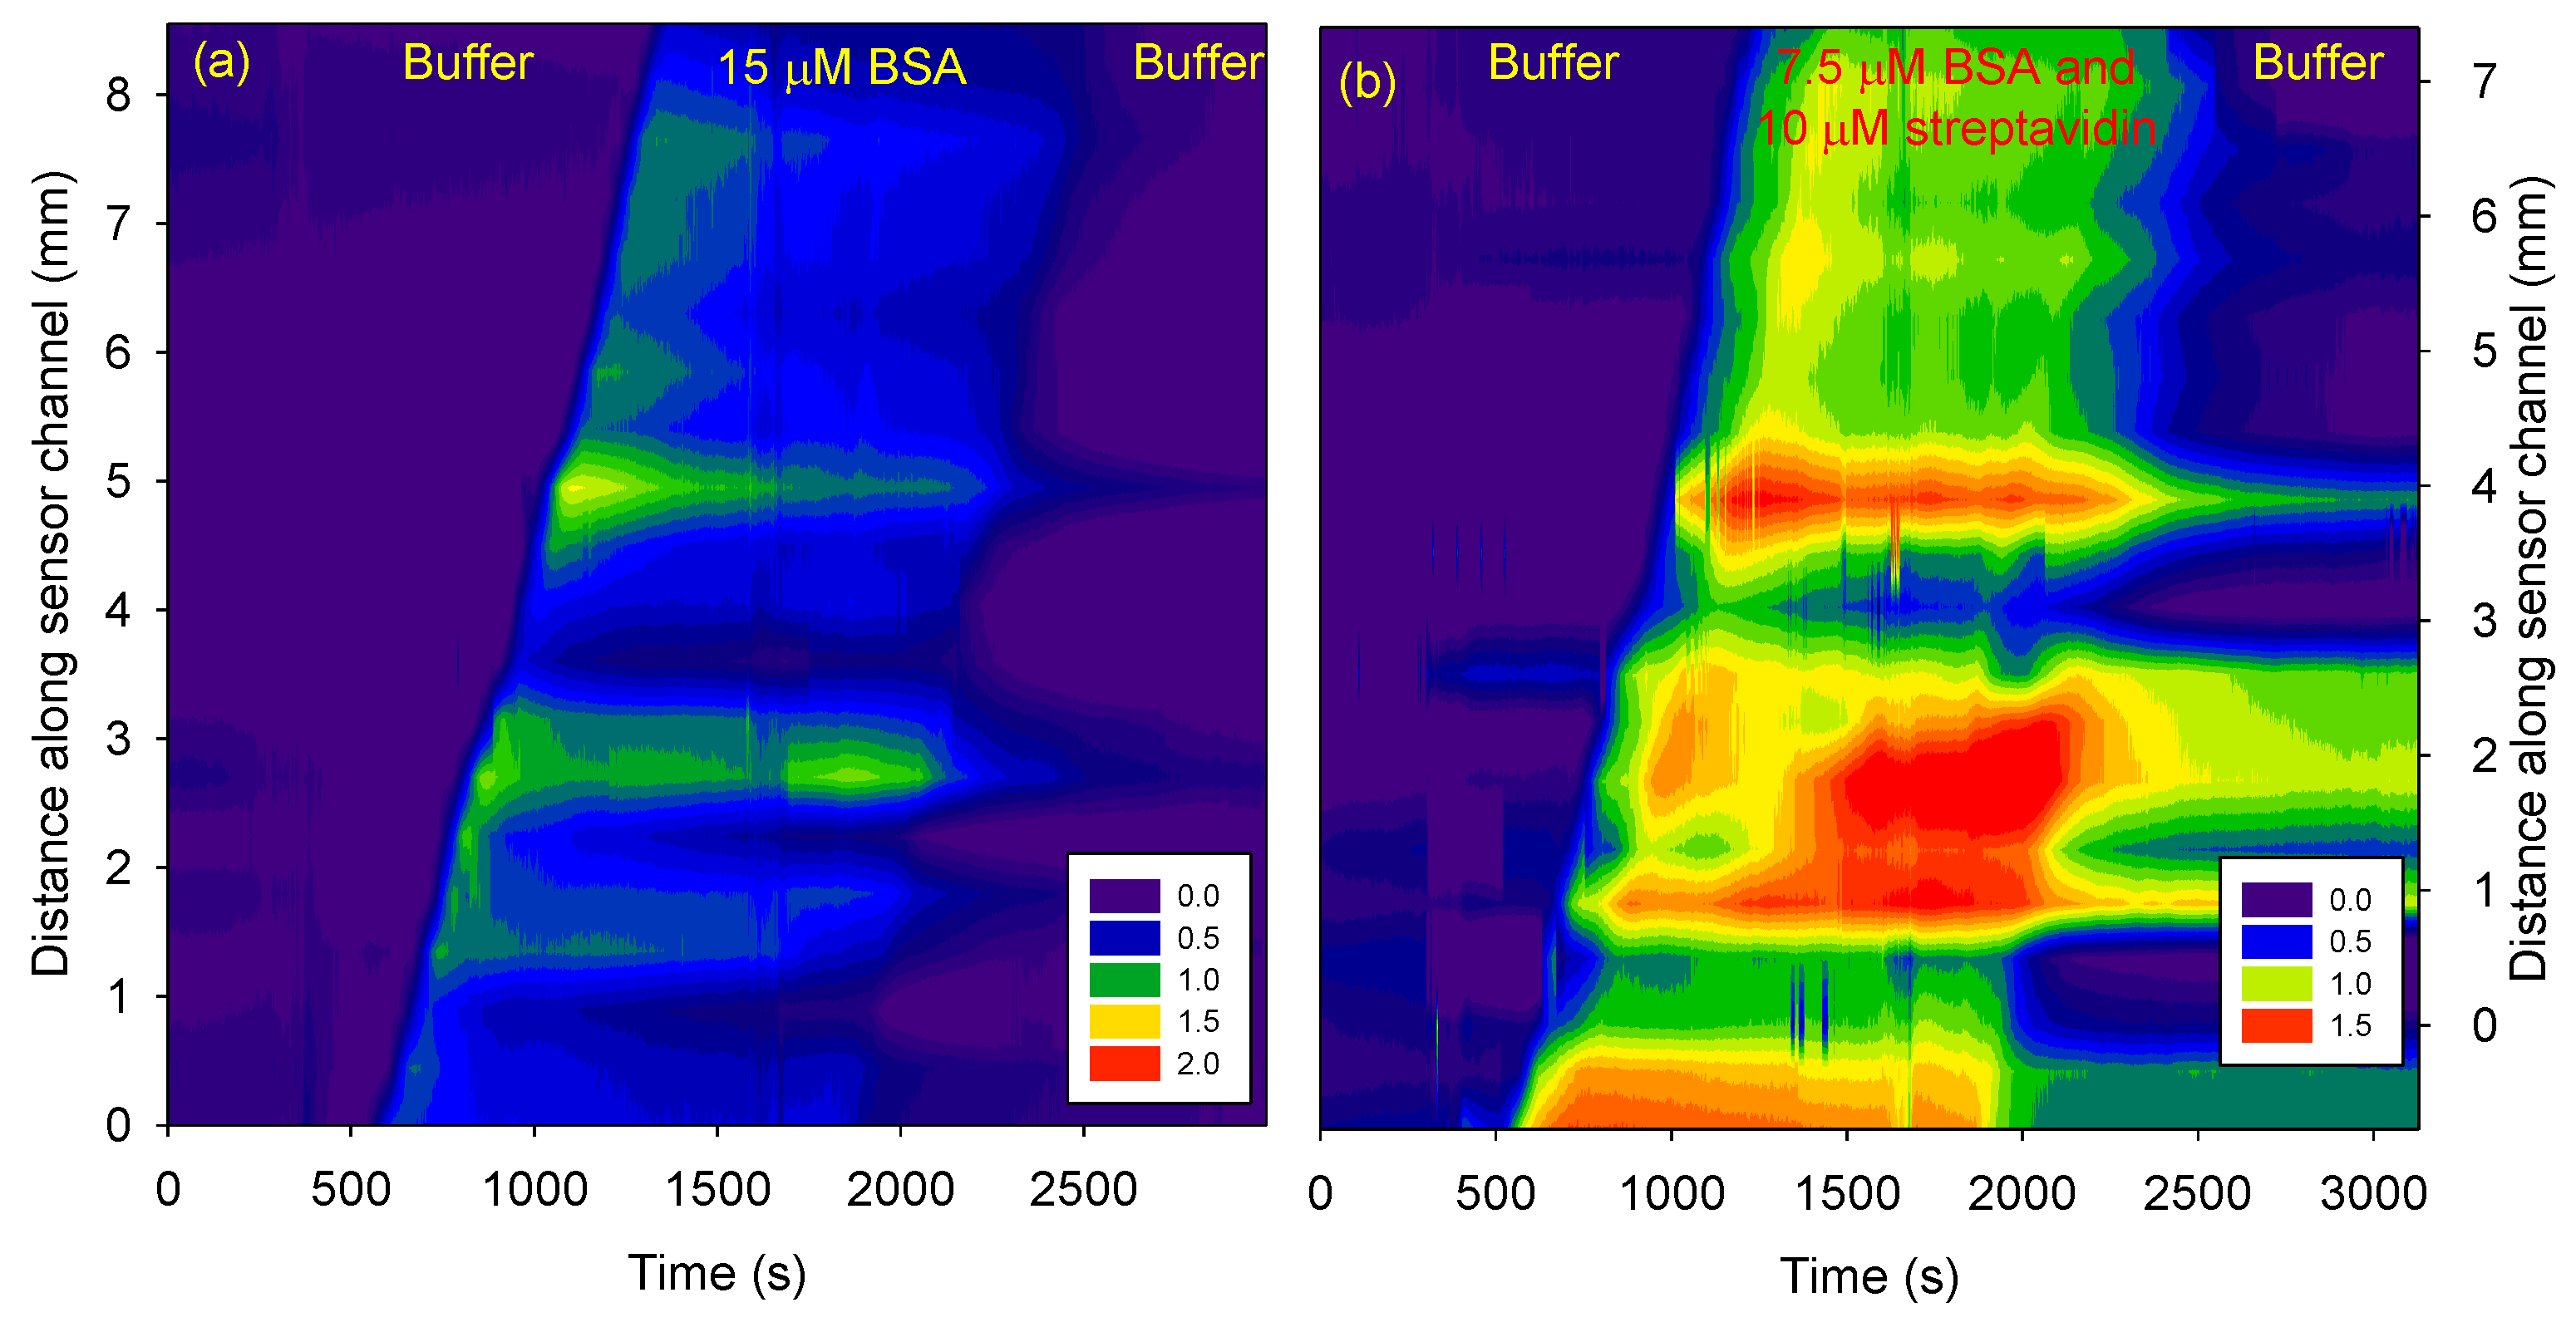
Figure 6.
Phase difference versus channel length and time.

Disclaimer/Publisher’s Note: The statements, opinions and data contained in all publications are solely those of the individual author(s) and contributor(s) and not of MDPI and/or the editor(s). MDPI and/or the editor(s) disclaim responsibility for any injury to people or property resulting from any ideas, methods, instructions or products referred to in the content. |
© 2024 by the authors. Licensee MDPI, Basel, Switzerland. This article is an open access article distributed under the terms and conditions of the Creative Commons Attribution (CC BY) license (http://creativecommons.org/licenses/by/4.0/).
Copyright: This open access article is published under a Creative Commons CC BY 4.0 license, which permit the free download, distribution, and reuse, provided that the author and preprint are cited in any reuse.


