
Submitted:
03 June 2024
Posted:
03 June 2024
You are already at the latest version
Abstract
This study introduces an integrated method for managing process risks in a Business Process Reengineering (BPR) project, using Robust Data Envelopment Analysis (RDEA) and machine learning (ML). The goal is to prioritize risks based on three standard factors of PFMEA: Severity, Occurrence, and Detection (S-O-D), and incorporating two additional factors (Breakdown Cost and Breakdown Duration) seen as undesirable outputs. The model also accounts for the effect of uncertainty on expert-estimated values by applying disturbance percentages in the linear PFMEA-RDEA model. A machine learning model is proposed to predict new values if partial or total modifications have been made to the processes. The approach was implemented in an au-tomotive sector company, and the results showed the impact of uncertainty on values by com-paring different approaches such as RPN, PFMEA-DEA, and PFMEA-RDEA. A new reduced risk categorization was achieved, who allowed for decision-makers to focus on necessary actions for reengineering.
Keywords:
BPR
; DEA
; RDEA
; Machine Learning
; FMEA
; PFMEA
; Risk Prioritization
; ANN
1. Introduction
Globalization has significantly transformed the business world, leading to rapid changes in operations and client demands. In this dynamic environment, commercial organizations face intense competition and significant challenges. The demands of the modern business environment highlight the necessity of adopting robust strategies to drive radical improvements in operational performance, efficiency and value creation. [1] Companies that fail to implement changes, often imposed by customers or the general environment, have a risk to lose their competitiveness and might even disappear from the market. [2] Business process management therefore serves as a systematic approach essential for accomplishing work and achieving set objectives [3].
Reorganizing and redesigning traditional business processes are key steps for manufacturing organizations aiming to improve operational efficiency, adapt to changing market demands, and maintain or boost their competitive advantage. Business Process Reengineering (BPR) is recognized as the best method in response to these needs. Its main goals are to cut costs, meet deadlines, and enhance the overall quality of manufacturing. If implemented correctly, it is the only method capable of delivering exceptional results. [4,5] Currently, BPR is the most popular approach for driving changes and has garnered considerable attention from academics and practitioners. [6,7,8,9] Numerous studies have revealed that implementing BPR is highly risky, with 80% of projects failing. [10,11] Other research shows that the success rate of BPR projects is only 30%. [7,12] Additionally, 70% of projects do not achieve the expected outcomes. [13] The challenge of defining success factors creates significant difficulties in developing frameworks and methodologies. Moreover, implementing a robust risk management strategy is crucial. [14]
Numerous methods exist for assessing risks, yet an effective evaluation technique must be customized and simple to reflect the specific activities, culture, processes, and other characteristics of an organization. Risk assessment involves a methodical approach to determining both quantitative and qualitative risks tied to hazardous processes, materials, activities, or events that could impact humans, materials, equipment, and the environment.[15] Among the various methods for risk assessment, FMEA (Failure Mode and Effects Analysis) is distinguished by its proactive approach to identifying potential issues, as opposed to reactive methods. FMEA entails the identification of possible problems and the assessment of their associated risks, followed by both formulation and implementation of corrective measures to minimize or eliminate these risks. Numerous studies employing FMEA utilize the conventional-RPN (Risk Priority Number) to identify and prioritize risks. [16,17,18] This score directs improvement initiatives towards risks possess a higher RPN, although potentially less severe, compared to other risks with a lower RPN. [19] Traditional FMEA incorporates just three metrics” SOD” (Severity, Occurrence, and Detection) as the key elements for calculating the RPN in risk assessments, which present a limit for the traditional RPN’s effectiveness. Consequently, in employing FMEA for evaluating process risks, it is essential to include additional factors beyond the classic S-O-D metrics. To surmount the FMEA limitations, this study has integrated two extra variables: the cost and the duration of process breakdown. Nonetheless, based on the specific nature of the risk and the circumstances of its occurrence, these additional variables can fluctuate and introduce a level of uncertainty that can make prioritization unreliable and even impractical when fixed values are assigned to these variables.
DEA (Data Envelopment Analysis) is extensively utilized to evaluate the efficiency of Decision-Making Units (DMUs) across diverse sectors, aiming to boost organizational performance in various activity areas. [20] DEA has also been employed in evaluating organizational risks. [21] There has been considerable investigation into deterministic DEA methods to understand the connection between various risk facets and efficiency. DEA enhances the analysis and assessment of an organization's risk levels in activities by either extending or incorporating other methodologies, thereby assigning an appropriate prioritization score. [22] A notable drawback of DEA and linear programming models is their reliance on deterministic data that match nominal values, which overlooks the impact of data uncertainty on the model's effectiveness. [23] Consequently, robust optimization has emerged as an effective and reliable solution, presenting a strong alternative to stochastic programming and sensitivity analysis. [24]
When an organization uses DEA to assess risks and has already evaluated the risk level for a large number of Decision-Making Units (DMUs), reapplying DEA can lead to different results. [25] This happens because DEA uses data that evolve over time to perform the internal evaluation of DMUs. If it's necessary to recalculate only certain DMUs based on their new efficiency to represent their updated risk level, managers often reapply the DEA methodology in its entirety. This can change the efficiency scores of all DMUs, which can cause confusion in the process of decision-making, especially for risk treatment. Hence, this research introduces a ML (Machine Learning) approach to forecast new risk levels using efficiency scores. While earlier methods have merged DEA and ML to assess the efficiency of DMUs across different fields, their application in risk management remains unexplored. Risk treatment and monitoring are crucial components of risk management, involving the choice of suitable treatment strategies and the evaluation of their effectiveness, respectively. [26] To improve the risk management process, it is essential to devise effective methods and tools that can predict the potential outcomes of treatment strategies, leading to a more robust and comprehensive approach. AI (Artificial Intelligence) manifests itself like a useful methodology to monitor the impact of strategy variations on predicted variables. [27] For example, neural networks are a powerful tool in terms of risk monitoring. [28,29] There are two key advantages to using neural networks for estimation or prediction tasks. First, they are capable of processing large volumes of data for output estimation. Second, they can provide high accuracy in predictions. Moreover, the operational speed of neural networks is fast. [30]
To address all these issues, this study proposes an approach based on robust-DEA (RDEA) to obtain efficiency scores that prioritize risks, taking as inputs the critical factors of RPN from the FMEA process as well as the cost and duration of process downtime as undesirable outputs. This can provide reliable and realistic data that enable decision-makers to make informed decisions during the reengineering of the operational processes in question. The application of neural network models for forecasting in risk treatment and analyzing is another result of this study. The proposed approach has been applied to the assessment of process risks in an automotive spare parts company, and the results have been analyzed.
2. Literature Review
2.1. BPR
BPR has been a popular topic since it first came up in the early 1990s. Both researchers and professionals have explored its importance, methods, effects, and what makes it successful. [31]
BPR started in the early 1990s as an innovative method to rethink and revamp business processes for substantial improvements in areas like cost, quality, service, and speed. [32] Reengineering involves a thorough reengineering of business processes. [33] BPR is seen as a strategy where processes are reshaped to maximize an organization's effectiveness. [34] Another description of BPR is a management approach focused on completely revamping or replacing inefficient procedures to achieve significant results. [35] This method can be applied to one or several processes. According to Bhaskar, BPR is customized for each organization, so they use it in their own way to meet their specific goals. This approach works for businesses of all sizes, whether they are in manufacturing or services.[36]
BPR is a complete overhaul of a business, changing everything from processes and technologies to organizational structures, values and management systems. The aim is to greatly improve performance throughout the company. BPR needs to work together with other parts of the organization, use advanced technology, and incorporate different methods. It doesn't work well on its own. IT plays a key role in BPR by providing the tools needed for major improvements in how the organization functions, although its role can sometimes be misunderstood. [37,38]
To complete Successfully an implementation projects is a commendable feat for any team. Nonetheless, business process re-engineering projects frequently experience varying degrees of success. This inconsistency often stems from the application of best practices or standards from other industries without adequately considering the specific needs of the targeted industry. Notably, around 70% of these projects fail, due to the lack of an appropriate framework or methodology. [9]
Many factors affect the outcome of a project. These factors are important for predicting whether a project will succeed or fail. BPR projects come with their own risks. Whether BPR is successful depends on several key factors. [39].
By reviewing research, we have identified eleven main factors that determine the success of BPR projects and have pinpointed the major reasons why BPR projects fail.[40]
Although numerous factors influence the success of BPR projects, the human element is the most crucial. [41] Leveraging data and analytics to guide decision-making throughout the project can significantly impact its success. By understanding the variables that contribute to success or failure, and using data science and machine learning techniques, it becomes possible to predict the outcomes of a BPR project.
The re-engineering process is structured into stages, where the output from one stage serves as the input for the next. Before any implementation can begin, both the diagnostic and transformation steps must be completed allowing little room for flexibility. Numerous frameworks and strategies have been devised for carrying out BPR, with a common concern among practitioners being the choice of methodology or model to follow. It has been observed that many companies engaging in BPR tend to adopt conventional methodologies that use linear lifecycle models, influenced by traditional practices in engineering and software development. These approaches have faced criticism for their inconsistency and the variability of their stages. [42]
A comprehensive six-phase framework BPR was introduced.[43] The first phase requires top management to acknowledge their goals and motivations while committing fully to the initiative. In the second phase, management must establish a clear vision and set objectives to guide the company's activities. The third phase involves benchmarking to assess current processes and identify critical issues, establishing a baseline for the BPR project. The fourth phase entails conducting a pilot study to determine necessary resources and the extent of changes required. The fifth phase, implementation, is vital and necessitates support from middle managers and top management to lead, adjust reward systems, realign structures, educate employees, and implement IT for successful integration. Effective and ongoing communication throughout the organization is crucial to mitigate resistance. The final phase focuses on monitoring and evaluating the project, tracking progress, and identifying areas for adjustment.
Other researchers have explored the development of frameworks to aid in selecting appropriate BPR modeling methods in response to heightened competition and a dynamic business environment. [44] Successful BPR planning requires comprehensive information and the right tools. BPM (Business Process Modeling) is highlighted as a technique for describing and analyzing business processes, with various methods and software available to assist practitioners and researchers in designing BPM.
BPR is a distinctive, one-time event and should be, like any critical project, managed, as it is essential for the future of an organization. It involves phases of analysis, design, and implementation, as depicted in the flow diagram in Figure 1. [45]
The goal of this BPR framework and methodology is to assist organizations in their efforts. The stages of the model are detailed below:
In the phase of analysis, it is crucial to prepare for change by thoroughly understanding market and the requirements of customers. This step involves a detailed examination of current internal processes to determine their effectiveness in achieving competitive performance levels. Benchmarking against industry best practices is often included in this phase. Early in the process, decisions are made regarding which processes are most suitable for reengineering and which areas require immediate focus. It's noted that one of the most frequently suggested research areas for addressing the challenges of implementing BPR projects is the application of risk management and its techniques before, during, and after the project phases. [45]
2.2. Risk Management and Methodologies
Risk is present in almost every aspect of life. People try to reduce it, sometimes intentionally and sometimes because they have to, although completely getting rid of it is not possible. In the industrial world, the pursuit of significant investment returns has led to the development of many analysis methods.
To begin discussing risk and how it's managed, it's important to first understand what risk means. The term "risk" doesn’t have a single, fixed definition; its meaning varies across different fields like business, social contexts, economics, safety, investment, military, and politics. [46] In project management, risk is usually defined as the chance that something might happen that could either help (as an opportunity) or hurt (as a threat) the goals of a project. However, for those working in the field, managing risk mainly involves finding and reducing potential dangers. In the context of business process reengineering, risk follows the ISO 31000 standard definition: "the effect of uncertainty on objectives." [47] This effect refers to any variation from what was expected, whether good or bad. These objectives can be diverse, covering financial, time-related, technical, commercial, environmental aspects, and more, and can apply to different levels of operation such as strategic, organizational, product, or process levels.
In the context of enterprise operations, risk management typically entails four key activities: (i) risk identification, which determines the events that could adversely affect operational goals; (ii) risk assessment, an ongoing process that encompasses risk analysis and risk evaluation; (iii) risk treatment, the response to identified risks; and (iv) risk monitoring to oversee risk dynamics over time [26,48,49]. The risk management process advances to risk evaluation, where the magnitude and priority of each risk are determined based on benchmarking criteria set within the defined context [49]. The third stage, risk treatment, involves devising, choosing, and executing a plan of action. This pivotal phase necessitates the identification of suitable strategies to address the risks, particularly those deemed unacceptable after evaluation [50]. Finally, risk monitoring involves the ongoing oversight and reassessment of risk sources, as well as the effectiveness of risk treatment strategies. This step is critical because risk is dynamic, not static, necessitating periodic adjustments to management approaches as circumstances change [26].
Risk management frameworks usually integrate both quantitative and qualitative methods for identifying and assessing risks. These two approaches can sometimes produce conflicting recommendations in practice. [52] When ample data is available quantitative methods for assessments are favored, but such comprehensive data is often lacking. In these instances, while qualitative methods alone may not be ideal, developing a combined model to enhance qualitative risk management becomes essential. Techniques like Multiple Criteria Decision-Making have been employed in various situations involving risk and uncertainty, supporting the structured approach of risk management. [52,53].
2.3. FMEA
In recent years, several risk assessment methods have been developed, including FMEA. Originally introduced in the aerospace industry, FMEA focuses on identifying potential failures and their consequences to prevent defects, enhance safety, and boost customer satisfaction [54,55]. This method has gained widespread acceptance across various industries due to its utility for designers [55,57]. FMEA is a qualitative technique used in risk management and decision-making [58]. It prioritizes potential failures by assigning a RPN to each one [59]. The RPN is instrumental in improving production or services by managing, reducing, or eliminating failures. A higher RPN indicates a more urgent need for corrective or preventive measures [60]. The RPN is derived by multiplying three factors (S*O*D) denotes the frequency of a potential failure, "S" reflects the severity of its impact, and "D" gauges the likelihood of detecting the failure before it leads to further problems [61].
To prioritize risks in FMEA, a weight-restricted DEA method is used in a pressurized water reactor power plant. [62] other Studies combined a fuzzy belief TOPSIS approach with FMEA to enhance risk assessment in steel production. [63] other authors introduced a hybrid method that combines Grey Relational Analysis and interval DEA, and applicate it to process failure analysis for assessing and prioritizing risks in auto parts manufacturing processes. [64] Another approach by involves a new hybrid model using FMEA, TOPSIS, AHP and GRA for risk assessment in the production of automotive dust caps. [65] Razi and Hoseini conducted a study on clustering and classification in a production process and introduced a new method of FMEA by grouping failure modes using a KOHNEN neural network and SBM-DEA model to assessed them within their classes.[66]
In 2017, a study utilized a combination of TOPSIS and FMEA for risk analysis [67]. In place of the RPN, an ELECTRE TRI-based method was used to categorize failure modes in dairy manufacturing, considering the importance and uncertainty of risk factors [68]. A novel approach introduced in 2018 combined FMEA, extended MULTIMOORA, And AHP within a fuzzy environment to assess risks in the steel industry [69]. Another hybrid method merged Fault Tree Analysis (FTA) with FMEA, applied recursively in a metal printing additive manufacturing system [70]. Additionally, a strategy integrating FMEA with RDEA aimed at managing Health, Safety, and Environment (HSE) risks by targeting undesirable outputs [71]. Further studies highlighted productivity improvements in automotive manufacturing through the combined use of GRA and FMEA, while another methodology incorporated QFD, VSM, plant layout, and fuzzy FMEA to select lean tools in manufacturing organizations [72,73].
2.4. PFMEA
FMEA is a prevalent technique used to detect and mitigate defects and failures in systems by evaluating their impact on performance and implementing measures to reduce their likelihood and consequences. There are four primary types of FMEA: System FMEA, Design FMEA, Process FMEA (PFMEA), and Machinery FMEA. PFMEA specifically targets potential failure factors in production or assembly processes, aiming to decrease product failure rates early in the product lifecycle by addressing defects. In this method, the most critical failures are identified based on team member insights, resulting in a prioritized list of potential issues. Corrective and preventive actions are then devised and executed either prior to or during the process. Consequently, PFMEA is regarded as a dynamic document that must be continuously updated with recent changes and actions, including those implemented post-production and any new RPNs [74].
As mentioned earlier, the RPN is determined by multiplying the factors of “ SOD” as part of the PFMEA process. Each factor is rated on a scale from 1 to 10, with 1 representing the lowest risk and 10 the highest. For severity, a higher score indicates a "very dangerous" failure. For occurrence, it signifies the failure is "almost certain to happen," and for detection, it means the failure is "unlikely to be recognized" [75].
2.5. DEA
Research has highlighted several issues with the RPN used in the FMEA model [61]. The calculation method for RPN can lead to misleading statistics, and it fails to consider the interconnections between failure modes, especially in complex systems with numerous components [76,77].
While FMEA is a valuable risk assessment tool, it does not consider the relative importance of the “SOD” factors. To address this, many Multi-Criteria Decision-Making (MCDM) techniques have been used to evaluate failure modes and enhance FMEA outcomes, DEA. DEA evaluates the relative performance of different Decision-Making Units (DMUs). In this context, potential risks or failure modes in FMEA are treated as DMUs, with the S-O-D ratings from FMEA serving as inputs for the DEA. This integration forms a cohesive model combining FMEA and DEA [78].
In FMEA, risk factor weights are often assigned directly or confirmed through expert judgment. MCDM methods such as AHP and ANP are established techniques for this purpose [79]. DEA, however, offers an alternative method for assigning weights, enhancing FMEA by improving the assessment capabilities and providing precise information on factors like Severity, Occurrence, and Detection. Unlike other methods, DEA does not rely on subjective judgments about the relative importance of risk factor weights. Instead, it determines weights based on the interrelationships within the process [59]. The efficiency of a DMU is measured by comparing its performance to the best-performing unit, calculated as the ratio of the weighted sum of outputs to the weighted sum of inputs [80]. Additionally, DEA assesses the importance of risk factors through their weights and ranks failure modes by considering both the direct effects of individual failure indices and their impact relative to the efficiency scores of other DMUs. This makes DEA effective for adjusting the weights of risk factors by accounting for both indirect and direct relationships among failure modes [81]. The core principle of DEA is to optimize weights for each DMU to maximize the output-to-input ratio while ensuring the ratios of all DMUs remain close to one.
2.6. Machine Learning in Risk Management
ML can be applied across various fields such as approximation, statistics, algorithm complexity, analysis, and probability. Recent progress in deep learning, a subset of ML, has produced outstanding results. ML algorithms simulate human learning behaviors to gain new knowledge and continuously improve prediction accuracy [25] .
ML, as a part of AI, leverages the rapid expansion of data. It excels in predictive and classification analytics, essential for making informed decisions based on data [81]. ML is increasingly influential in business, with numerous applications already in place and many more in development. [82]
The core function of ML is to use algorithms to analyze and learn from data, allowing these algorithms to make predictions on new data, thus aiding decision-making for various scenarios. ML encompasses unsupervised, semi-supervised, supervised, and intensive learning methods. Supervised learning, one of the most common approaches, trains neural networks on known data patterns for tasks such as classification and regression [25].
In predictive tasks, ML algorithms utilize historical data to forecast future events, improving their accuracy as they process more data. [83] This predictive accuracy is vital for effective performance.
In the business sector, ML has been particularly useful in risk management, such as assessing and predicting risk probabilities. For instance, ML has significantly impacted the financial sector, managing risks like credit, liquidity, operational, and market risks. Studies have demonstrated its application in banking risk management [84].
Additionally, ML has been employed in risk management systems to enhance investment portfolio performance by predicting potential losses. [8] ML's capabilities also extend to industrial risk assessment, where, for example, deep neural networks have been used to evaluate risks in scenarios such as oil and gas drilling operations [86].
Moreover, ML's predictive capabilities support evidence-based decision-making in the construction industry, enabling the development of proactive strategies based on dynamic risk factors. This facilitates more effective project risk management [87].
3. Proposed Approach
3.1. RDEA
DEA techniques for handling uncertain data were first introduced in 1978 twith aiming to assess the relative efficiency of distribution companies [88]. This non-parametric method creates a piecewise linear efficiency frontier, derived from the most efficient companies, to evaluate the relative efficiency of other firms. DEA is widely used in the electricity sector due to its straightforward application and ease of interpretation.
Within this context, two modeling options are available: constant returns to scale (CRS) and variable returns to scale (VRS). The CRS model assumes that companies can scale their operations proportionally to achieve the optimal firm size. In contrast, the VRS model offers greater flexibility by comparing the productivity of companies with others of similar operational scale. In the conventional DEA, a group of DMUs is established, using inputs to produce outputs where m and s represent, , respectively, the number of inputs and outputs. For a DMU j, represents the ith input used, and represents the rth output produced:
In this model, and represent the weights assigned to outputs and inputs, respectively. The multiplier formulation for an input-oriented approach that assumes constant returns to scale (CRS) is depicted in model (2):
As previously noted, DEA results and rankings are unreliable when data are uncertain. In real-world scenarios, it is often difficult to obtain precise data for inputs and outputs in DEA applications. Traditional operational research modeling methods that address uncertainty typically rely on a complete description in terms of probabilities. However, uncertainty is often completely overlooked in many models. Recently, the emergence of robust optimization has offered another alternative to sensitivity analysis and linear programming. [89,90] The initial approach was introduced in 1973, who proposed a model that handles uncertainty on a column-by-column basis. This model tended to be overly conservative, adjusting the optimal solution to maintain feasibility. [90]
Although the Soyster method from 1973 offers the highest level of protection. In practice it is the most conservative. while robust solutions are more resilient, in general, to uncertainty and parameter change, they often have a worse objective function value compared to solutions obtained by standard linear optimization. A study in 2000 propose the following robust problem [91]:
Under the data uncertainty model, the probability of violating constraint i is at most compared to Model (3), The Model (4) is robust and less conservative as every feasible solution for Model (4) is also viable for Model (3).
A new approach proposed a nonlinear formulation: [89]
For the ith constraint of the standard problem, the expression . represents the set of coefficients, with j ∈, which are subject to parameter uncertainty; in this scenario, , j ∈ fluctuates within a symmetric distribution centered around the nominal coefficient within the bounds. A parameter is introduced for each i as a robustness budget, which takes values in [0, ∣ and serves to modulate the robustness of the methodology relative to the conservatism of the resulting solution. Practically, it's improbable that every , j ∈, will vary simultaneously. The objective is to protect the solution against scenarios where up to of these coefficients might alter, specifically one coefficient changes by (. In other words, the nature will only allow a subset of the coefficients to change to adversely affect the solution. In this case, the robust solution will certainly be feasible. Furthermore, the robust solution maintains a high probability of feasibility even if the extent of changes surpasses .
A linear formulation of the model is:
If takes an integer value, constraint i will be protected by the following expression:
By using the duality form and applying it to model (2), we get the following linear model:
where and are dual variables, represent percentage of perturbation in and z the efficiency of risk under consideration.
In this study, the model is solved with Pulp python library for linear programing and python solver.
3.2. ML APPLICATION
Supervised learning algorithms allow machine learning models to learn autonomously from a set of data. Among the many models developed recently are artificial neural networks. Through the input layer, it receives a data sample, then undergoes operations with activation functions in the hidden layers, and finally produces a corresponding target category through its output layer [25,93].
Figure 2, illustrates a basic structure of an artificial neural network (ANN). It includes the neural connections, the biases allocated to each neuron, and the weights assigned to these connections, depicting a multi-layer model [25]. Neuron k is defined by two equations [94]:
Where is the set of inputs and the neuron weights, is the computation outcome of weights inputs, is the bias term, f is the activation function and is the output.
In this research, N risks are analyzed, where each risk j is characterized by five inputs (O, S, D, BDCOST, BDDURATION). Additionally, each risk j is associated with a target variable, which is the score determined through RDEA. The combination of the weighted inputs and the RDEA score forms a mapping relationship via an activation function. y examining N risks with specified inputs and corresponding RDEA score outputs, the weights and the bias term can be identified using equations (9) and (10) throughout the model training process. [25].
In this study a Random Forest Regressor with 100 trees was used to predict the RDEA scores from the input features. Using a random seed for reproducibility, the dataset was split into training 90% and test 10%. We configured A Multi-Layer Perceptron Regressor to determine its architecture dynamically with an optimization through Particle Swarm Optimization (PSO). The mean squared error (MSE) of predictions aimed to minimize on the test set based on the PSO, by adjusting the number of neurons and learning rate of the MLP. The PSO was implemented with social and specific cognitive parameters who optimize the configuration of the MLP model. To ensure computational efficiency, The search space was constrained to [1,100] for the number of neurons.
4. Case study
The proposed approach, shown in Figure 3, was implemented in a plastic injection company operating in the automotive sector with the aim of obtaining a robust score for process risks in order to redesign and enhance performance. Initially, the BPR team was formed, incorporating members of the AMDEC PROCESS team. Based on the existing AMDEC register, costs and process downtime were determined as scores according to the approach defined in Table 2.
Potential process risks identified during the execution of the BPR method were added to the already defined risks. The primary goal of BPR is to reduce costs and delays, which is why these will not be considered as desirable outputs for DEA but rather as undesirable outputs [95]. The new values for outputs according to the Seiford and Zhu approach are calculated and presented in Table 3. The three approaches—RPN, Conventional DEA, and RDEA—will be applied and compared. The proposed ML model will be applied with the role of predicting new scores in case of improvements applied and also predicting scores for new risks.
It's important to note that the FMEA method is initially designed for preventive measures. Therefore, some process risks may not manifest within an organization. Additionally, the costs and duration of treatments can vary based on individuals' physical and mental conditions. As a result, the output values of the DEA model, established from field studies under the supervision of BPR-TEAM and PFMEA-TEAM, contain a degree of uncertainty. Due to this data uncertainty, using conventional DEA for evaluating and prioritizing risks is considered unreliable. Therefore, to accommodate data uncertainty, enhance solution robustness, and address the limitations of the RPN score, adopting the score based on the PFMEA-RDEA method to classify risk is a recommendation.
To apply RDEA effectively, it is essential first to set the values of (j = 1, 2, …, n) and for each constraint. When a constraint experiences less uncertainty, complete protection becomes crucial. Given that uncertainty impacts both output parameters across all constraints, the values of (j = 1, 2, …, n) and are established at 2 to guarantee comprehensive protection against this uncertainty. In such cases, if all parameters shift to their least favorable conditions, the model remains fully protected against uncertainties.
The regression model to predict values is implemented using Python and several machine learning libraries.’ sklearn.model_selection’ is used to split the data into training and testing sets. ‘sklearn.ensemble’ imports the RandomForestRegressor. ‘numpy ‘is a library for advanced numerical operations. ‘sklearn.neural_network’ imports the MLPRegressor. ‘pyswarms’ is a library for particle swarm optimization, used here to optimize the hyperparameters of the neural network.
5. Results
To categorize process risks, the methods PFMEA, DEA-PFMEA, and RDEA-PFMEA are each applied independently. The traditional FMEA method ranks risks by using RPN scores, which are calculated by multiplying the input values from Table 3 and considering only the S-O-D values for the final scores. Table 4 shows the prioritization of identified risks based on these RPN scores.
Based on the RPN score, as shown in the table, risk 51 with an RPN of 210 has the highest priority, followed by risks 52, 53, and 4, with RPN scores of 180, 135, and 108, respectively. Risks 14 and 38 have the lowest priority, each with a score of 24. By adding the outputs BD-COTS and BD-DURATION to the three inputs S-O-D, and applying the DEA-PFMEA approach with undesirable outputs, a different priority ranking is generated, the priority of risk 51 becomes 20, while risks 52, 53, and 54 receive the following priorities: 12, 9, and 53 respectively. As for risks 14 and 38, they become more prioritized, ranking at 6. With this approach the first priority is related to risk 50 followed by risks 11 and 12. Now the lowest priority is related to risk 1, this shows the effect of breakdown cost and the breakdown duration. The comparison between the priorities of RPN scores and DEA-PFMEA scores is presented in the following figure.
In the following step, the perturbation level should be considered for outputs. Initially, this is applied to two outputs of the RDEA model withe1 = e2 = 0.5, later, the perturbation levels are set to and . The initial percentages are chosen randomly to demonstrate the effect of perturbation on the outputs. The latter percentages were selected and approved by the FMEA and BPR team involved in this study.
As Table 4 shows, the order of priorities has changed, demonstrating the strong impact of uncertainty on the data, represented by the percentages of perturbations on the undesirable outputs of the system. Risks 11, 12, 35, and 37 become the highest priority, followed by other risks. Another advantage is that the classification categories have been reduced, providing a clearer picture of the project's risk status. This serves as a more robust decision-making tool for redesigning the studied process, thereby planning the necessary action plan to address these risks and enhance the process's performance, aligning with the initial goal of the BPR method.
The following figures present comparisons of the scores obtained by the different approaches applied in this study.
There's a significant volatility in the RPN scores, which could indicate that this method is highly sensitive to the specific risk factors for each risk. The PFMEA-RDEA method appears more conservative, potentially smoothing out extreme variations seen in RPN due to its consideration of perturbations in the model.
The conventional PFMEA-DEA method shows substantial fluctuations in risk priorities. The PFMEA-RDEA method, with specific perturbation percentage, provides a more moderate distribution of risk priorities. This method does not reach as high as the conventional PFMEA- DEA in most cases, suggesting a more tempered response to the perceived risk severity.
This comparison highlights how small changes in perturbation parameters within the same methodological framework can lead to different prioritizations of risks. This could influence strategic decisions in environments where understanding and mitigating risks are crucial for operational performance and efficiency.
The comparison of these risk assessment methods illustrates how each method interprets and prioritizes risks differently based on its underlying assumptions and calculations. The RPN method tends to highlight risks more dramatically. In contrast, a more balanced and potentially more realistic view of risk priorities is offered by the approach PFMEA- DEA and PFMEA-RDEA methods offer a more balanced and potentially more realistic view of risk priorities, suitable for environments where resources must be allocated efficiently.
Using the proposed ANN model, the obtained MSE is 0.002145834611031225, which indicates high performance. Therefore, the designed artificial neural network model is useful for prediction purposes. The main goal of this study is to develop methods to predict modified risk values when process reengineering strategies are implemented. This allows for the generation of new scores that aid in managing the BPR project to avoid surprises.
There is a high degree of overlap between the two lines, indicating a good general agreement between the predicted and actual values across most samples. The close tracking between the predicted and actual values in most parts of the graph suggests that the machine learning model is performing well. However, the instances of under-prediction are due to insufficiency of training data.
6. Discussion and Conclusion
This study introduces a new integrated risk analysis approach PFMEA-RDEA-ML, designed to prioritize process risks in a Business Process Reengineering project by introducing BD-COST and BD-DURATION as undesirable outputs to the conventional PFMEA-DEA system. This pushes the analysis to another dimension, allowing for the consideration of uncertainty by integrating coefficients of perturbation on the parameter values of the system, typically based on expert judgment.
As mentioned in the literature review, over 70% of projects fail, and among the reasons are the inapplicability of management strategies, including RM, as well as the failure to consider various factors during the analysis; as shown in the figure, risk prioritization using the RPN approach differs completely from prioritization according to other approaches. This approach enables decision-makers to have a clearer and more multidimensional view of process management and reengineering, given the verified relationship of added parameters with operational performance. Additionally, the rapid development of machine learning prediction algorithms provides the possibility of continuous execution of this approach, thus allowing for the automatic generation of new scores and priorities once partial or complete reengineering actions of processes have been established. The application of this approach in a company operating in the highly competitive automotive sector has highlighted the distinction and observation of the effect of integrating new parameters in risk analysis and also the perception of the uncertainty effect modeled by the disturbance percentages in the RDEA model.
Author Contributions
Conceptualization, R.H. and M.M. and L.A.; methodology R.H. and M.M. and L.A.; software, R.H. and M.M. and L.A.; validation, R.H. and M.M. and L.A.; formal analysis R.H. and M.M. and L.A.; investigation, R.H. and M.M. and L.A.; resources, R.H. and M.M. and L.A.; data curation, R.H. and M.M. and L.A.; writing—original draft preparation, R.H.; writing—review and editing, R.H. and M.M. and L.A.; visualization, R.H.; supervision, M.M. and L.A.; project administration, M.M. and L.A.; funding acquisition, R.H. and M.M. and L.A. All authors have read and agreed to the published version of the manuscript.
Funding
This research received no external funding
Data Availability Statement
Data available on request due to restrictions.
Conflicts of Interest
The authors declare no conflicts of interest.
References
- Harmon, P. Business Process Change: A Business Process Management Guide for Managers and Process Professionals; Morgan Kaufmann, Publishers: Burlington, MA, USA, 2019. [Google Scholar]
- Nisar, Q.A.; Ahmad, S.; Ahmad, U. Exploring factors that contribute to success of business process reengineering and impact of business process reengineering on organizational performance: A qualitative descriptive study on banking sector at Pakistan. Asian Journal of Multidisciplinary Studies 2014, 2, 219–224. http://ajms.co.in/sites/ajms/index.php/ajms/article/viewFile/405/365. [Google Scholar]
- Tsakalidis, G.; Vergidis, K. Towards a Comprehensive Business Process Optimization Framework. 2017 IEEE 19th Conference on Business Informatics (CBI), Thessaloniki, Greece, 24–27 July 2017; IEEE: Piscataway, NJ, USA, 2017; Volume 1, pp. 129–134. [Google Scholar]
- Ghanadbashi, S.; Ramsin, R. Towards a method engineering approach for business process reengineering. IET Softw. 2016, 10, 27–44. [Google Scholar] [CrossRef]
- Weerakkody, V.; Janssen, M.; Dwivedi, Y.K. Transformational change and business process reengineering (BPR): Lessons from the British and Dutch public sector. Gov. Inf. Q. 2011, 28, 320–328. [Google Scholar] [CrossRef]
- Erim, A.; Vayvay, O. Is the business process reengineering (BPR) proved itself to be a trustable change management approach for multinational corporations’ case studies from the literature. Journal of Aeronautics and Space Technologies 2010, 4, 23–30. [Google Scholar]
- Wu, F. Business process reengineering: Strategic tool for managing organizational change an application in a multinational company. International Journal of Business and Management 2012, 7, 89–112. [Google Scholar] [CrossRef]
- Razalli, M.R.; Ringim, K.J.; Hasnan, N.; Hassan, M.G. A Framework of Best Practices in Managing Business Reengineering for Islamic. J. Adv. Manag. Sci. 2015. [Google Scholar] [CrossRef]
- Bhaskar, H.L. A critical analysis of information technology and business process reengineering. Int. J. Prod. Qual. Manag. 2016, 19, 98. [Google Scholar] [CrossRef]
- Chiplunkar, C.; Deshmukh, S.; Chattopadhyay, R. Application of principles of event related open systems to business process reengineering. Comput. Ind. Eng. 2003, 45, 347–374. [Google Scholar] [CrossRef]
- Hussain, M. , Saleh, M., Akbar, S. and Jan, Z. (2014) ‘Factors affecting readiness for business process reengineering-developing and proposing a conceptual model’, European Journal of Business and Management, Vol. 6, No. 1, pp.55–60 [online] http://www.iiste.org/Journals/index.php/EJBM/article/view/10208/10424.
- Habib, M.N. and Shah, A. (2013) ‘Business process reengineering: Literature review of approaches and applications’, Proceedings of 3rd Asia-Pacific Business Research Conference, 25–26 February, Kuala Lumpur, Malaysia, pp.1–25, ISBN: 978-1-922069-19-1.
- Alghamdi, H.A.; King Abdulaziz University; Alfarhan, M. A.; Al-Ghamdi, A.A.-M. BPR: Evaluation of Existing Methodologies and Limitations. Int. J. Comput. Trends Technol. 2014, 7, 224–227. [Google Scholar] [CrossRef]
- Bhaskar, H.L. Business process reengineering framework and methodology: a critical study. Int. J. Serv. Oper. Manag. 2018, 29, 527. [Google Scholar] [CrossRef]
- Covello, V.T. , Merkhoher, M.W., 2013. Risk Assessment Methods: Approaches for Assessing Health and Environmental Risks. Springer Science & Business Media.
- Arabian-Hoseynabadi, H.; Oraee, H.; Tavner, P. Failure Modes and Effects Analysis (FMEA) for wind turbines. Int. J. Electr. Power Energy Syst. 2010, 32, 817–824. [Google Scholar] [CrossRef]
- Feili, H.R.; Akar, N.; Lotfizadeh, H.; Bairampour, M.; Nasiri, S. Risk analysis of geothermal power plants using Failure Modes and Effects Analysis (FMEA) technique. Energy Convers. Manag. 2013, 72, 69–76. [Google Scholar] [CrossRef]
- Trafialek, J.; Kolanowski, W. Application of Failure Mode and Effect Analysis (FMEA) for audit of HACCP system. Food Control. 2014, 44, 35–44. [Google Scholar] [CrossRef]
- Rezaee, M.J.; Yousefi, S.; Babaei, M. Multi-stage cognitive map for failures assessment of production processes: An extension in structure and algorithm. Neurocomputing 2017, 232, 69–82. [Google Scholar] [CrossRef]
- An, Q.; Meng, F.; Ang, S.; Chen, X. A new approach for fair efficiency decomposition in two-stage structure system. Oper. Res. 2018, 18, 257–272. [Google Scholar] [CrossRef]
- Yan, L.; Tong, W.; Hui, D.; Zongzhi, W. Research and Application on Risk Assessment DEA Model of Crowd Crushing and Trampling Accidents in Subway Stations. Procedia Eng. 2012, 43, 494–498. [Google Scholar] [CrossRef]
- Rezaee, M.J.; Salimi, A.; Yousefi, S. Identifying and managing failures in stone processing industry using cost-based FMEA. Int. J. Adv. Manuf. Technol. 2017, 88, 3329–3342. [Google Scholar] [CrossRef]
- Sadjadi, S.; Omrani, H. Data envelopment analysis with uncertain data: An application for Iranian electricity distribution companies. Energy Policy 2008, 36, 4247–4254. [Google Scholar] [CrossRef]
- Bertsimas, D.; Sim, M. The Price of Robustness. Oper. Res. 2004, 52, 35–53. [Google Scholar] [CrossRef]
- Zhu, N.; Zhu, C.; Emrouznejad, A. A combined machine learning algorithms and DEA method for measuring and predicting the efficiency of Chinese manufacturing listed companies. J. Manag. Sci. Eng. 2020, 6, 435–448. https://www.sciencedirect.com/science/article/pii/S2096232020300469?via%3Dih. [Google Scholar] [CrossRef]
- Fan, Y.; Stevenson, M. ‘‘A review of supply chain risk management: Definition, theory, and research agenda,’’ Int. J. Phys. Distrib. Logistics Manage., vol. 48, no. 3, pp. 205–230, Mar. 2018.
- Abidoye, R.B.; Chan, A.P.; Abidoye, F.A.; Oshodi, O.S. Predicting property price index using artificial intelligence techniques. Int. J. Hous. Mark. Anal. 2019, 12, 1072–1092. [Google Scholar] [CrossRef]
- Sun, T. (.; Sales, L.J. Predicting Public Procurement Irregularity: An Application of Neural Networks. J. Emerg. Technol. Account. 2018, 15, 141–154. [Google Scholar] [CrossRef]
- Zhang, W.; Feng, X.; Goerlandt, F.; Liu, Q. Towards a Convolutional Neural Network model for classifying regional ship collision risk levels for waterway risk analysis. Reliab. Eng. Syst. Saf. 2020, 204, 107127. [Google Scholar] [CrossRef]
- Salehi, V.; Veitch, B.; Musharraf, M. Measuring and improving adaptive capacity in resilient systems by means of an integrated DEA-Machine learning approach. Appl. Ergon. 2019, 82, 102975. [Google Scholar] [CrossRef] [PubMed]
- Yin, G. BPR Application. Mod. Appl. Sci. 2010, 4, p96. [Google Scholar] [CrossRef]
- Hammer, M.; Champy, J. Reengineering the corporation: A manifesto for business revolution. Bus. Horizons 1993, 36, 90–91. [Google Scholar] [CrossRef]
- Hammer, M. (1990) ‘Reengineering work: don’t automate, obliterate’, Harvard Business Review, Vol. 68, No. 4, pp.104–112 [online] http://www3.uma.pt/filipejmsousa/ge/Hammer,%201990.pdf.
- Kontio, J. (2007) ‘Business process re-engineering: A case study at Turku University of Applied Sciences’, Proc. of European and Mediterranean Conference on Information Systems, pp.24–26.
- Setegn, D. , Ensermu, M. and Moorthy, P.K. (2013) ‘Assessing the effect of business process reengineering on organizational performance: A case study of Bureau of Finance and Economic Development (BOFED), Oromia Regional State, Ethiopia’, Researchers World, Vol. 4, No. 1, pp.115–123.
- Bhaskar, Hari Lal and Singh, R.P., Business Process Reengineering: A Recent Review (14). Bhaskar, H.L., and Singh, R.P. (2014). Business process reengineering: A recent review. Global Journal of Business Management, 8(2), 24-51., Available at SSRN: https://ssrn.com/abstract=3331568. 20 December.
- Eke, G.J. and Achilike, A.N. (2014) ‘Business process reengineering in organizational performance in Nigerian banking sector’, Academic Journal of Interdisciplinary Studies, Vol. 3, No. 5, pp.113–124. https://doi.org/10.5901/ajis.2014.v3n5p113.
- Mlay, S.V. , Zlotnikova, I. and Watundu, S. (2013) ‘A quantitative analysis of business process reengineering and organizational resistance: The case of Uganda’, The African Journal of Information Systems, Vol. 5, No. 1, pp.1–26.
- Jamali, G. Business Process Reengineering Implementation: Developing a Causal Model of Critical Success Factors. Int. J. e-Education, e-Business, e-Management e-Learning 2011, 1, 354–358. [Google Scholar] [CrossRef]
- Al-Anqoudi, Y.; Al-Hamdani, A.; Al-Badawi, M.; Hedjam, R. Using Machine Learning in Business Process Re-Engineering. Big Data Cogn. Comput. 2021, 5, 61. [Google Scholar] [CrossRef]
- Omidi, A.; Khoshtinat, B. Factors Affecting the Implementation of Business Process Reengineering: Taking into Account the Moderating Role of Organizational Culture (Case Study: Iran Air). Procedia Econ. Finance 2016, 36, 425–432. [Google Scholar] [CrossRef]
- Hussein, B.; Hammoud, M.; Bazzi, H.; Haj-Ali, A. PRISM-Process Reengineering Integrated Spiral Model: An Agile Approach to Business Process Reengineering (BPR). Int. J. Bus. Manag. 2014, 9, p134. [Google Scholar] [CrossRef]
- Motwani, J.; Kumar, A.; Jiang, J.; Youssef, M. Business process reengineering. Int. J. Oper. Prod. Manag. 1998, 18, 964–977. [Google Scholar] [CrossRef]
- Luo, W.; Tung, Y.A. A framework for selecting business process modeling methods. Ind. Manag. Data Syst. 1999, 99, 312–319. [Google Scholar] [CrossRef]
- Bhaskar, H.L. (2018) ‘Business process reengineering framework and methodology: A critical study’, Int. J. Services and Operations Management, Vol. 29, No. 4, pp.527–556.
- Project Management Institute. (2009a). A Guide to the Project Management Body of Knowledge: PMBOK Guide (4nd.). Newtown Square, Pennsylvania: Project Management Institute.
- International Standard. (2009a). ISO 31000:2009, Risk management ISO 31000:2009. USA: International Standard.
- Duhamel, F.; Carbone, V.; Moatti, V. The impact of internal and external collaboration on the performance of supply chain risk management. Int. J. Logist. Syst. Manag. 2016, 23, 534. [Google Scholar] [CrossRef]
- Purdy, G. ‘‘ISO 31000: 2009—Setting a new standard for risk management,’’ Risk Anal. Int. J., vol. 30, no. 6, pp. 881–886, 2010.
- Lyon, B.K.; Popov, G. Risk treatment strategies: Harmonizing the hierarchy of controls and inherently safer design concepts. Prof. Saf., vol. 64, no. 5, pp. 34–43, 2019.
- Cox, L.A.; Babayev, D.; Huber, W. ‘‘Some limitations of qualitative risk rating systems,’’ Risk Anal., vol. 25, no. 3, pp. 651–662, Jun. 2005.
- de Almeida, A.T.; Alencar, M.H.; Garcez, T.V.; Ferreira, R.J.P. A systematic literature review of multicriteria and multi-objective models applied in risk management. IMA J. Manag. Math. 2017, 28, 153–184. [Google Scholar] [CrossRef]
- Kaewfak, K.; Huynh, V.-N.; Ammarapala, V.; Ratisoontorn, N. A Risk Analysis Based on a Two-Stage Model of Fuzzy AHP-DEA for Multimodal Freight Transportation Systems. IEEE Access 2020, 8, 153756–153773. [Google Scholar] [CrossRef]
- Bowles, J.B.; Peláez, C. Fuzzy logic prioritization of failures in a system failure mode, effects and criticality analysis. Reliab. Eng. Syst. Saf. 1995, 50, 203–213. [Google Scholar] [CrossRef]
- Wang, Y.-M.; Chin, K.-S.; Poon, G.K.K.; Yang, J.-B. Risk evaluation in failure mode and effects analysis using fuzzy weighted geometric mean. Expert Syst. Appl. 2009, 36, 1195–1207. [Google Scholar] [CrossRef]
- Chang, K.-H.; Cheng, C.-H. Evaluating the risk of failure using the fuzzy OWA and DEMATEL method. J. Intell. Manuf. 2011, 22, 113–129. [Google Scholar] [CrossRef]
- Rakesh, R.; Jos, B.C.; Mathew, G. FMEA analysis for reducing breakdowns of a sub system in the life care product manufacturing industry. International Journal of Engineering Science and Innovative Technology 2013, 2, 218–225. [Google Scholar]
- Liu, H.-C.; Liu, L.; Liu, N.; Mao, L.-X. Risk evaluation in failure mode and effects analysis with extended VIKOR method under fuzzy environment. Expert Syst. Appl. 2012, 39, 12926–12934. [Google Scholar] [CrossRef]
- Chin, K.-S.; Wang, Y.-M.; Poon, G.K.K.; Yang, J.-B. Failure mode and effects analysis by data envelopment analysis. Decis. Support Syst. 2009, 48, 246–256. [Google Scholar] [CrossRef]
- Chang, D.S.; Chung, J.H.; Sun, K.L.; Yang, F.C. A Novel Approach for Evaluating the Risk of Health Care Failure Modes. J. Med Syst. 2012, 36, 3967–3974. [Google Scholar] [CrossRef] [PubMed]
- Chang, D.S.; Sun, K.L.P. Applying DEA to enhance assessment capability of FMEA. Int. J. Qual. Reliab. Manag. 2009, 26, 629–643. [Google Scholar] [CrossRef]
- Garcia, P.A.D.A. , Junior, L. A. ( 23(3), 500–507.
- Vahdani, B.; Salimi, M.; Charkhchian, M. A new FMEA method by integrating fuzzy belief structure and TOPSIS to improve risk evaluation process. Int. J. Adv. Manuf. Technol. 2015, 77, 357–368. [Google Scholar] [CrossRef]
- Baghery, M.; Yousefi, S.; Rezaee, M.J. Risk measurement and prioritization of auto parts manufacturing processes based on process failure analysis, interval data envelopment analysis and grey relational analysis. J. Intell. Manuf. 2016, 29, 1803–1825. [Google Scholar] [CrossRef]
- Sakthivel, G. , & Ikua, B.W. (2017). Failure mode and effect analysis using fuzzy analytic hierarchy process and GRA TOPSIS in manufacturing industry. International Journal of Productivity and Quality Management 2017, 22, 466–484. [Google Scholar]
- Razi, F.F. , & Hoseini, E. ( 21(1), 45–71.
- Ahmadi, M. , Molana, S.M.H., & Sajadi, S.M. (2017). A hybrid FMEA-TOPSIS method for risk management, case study: Esfahan Mobarakeh Steel Company. International Journal of Process Management and Benchmarking, 7(3), 397–408.
- Certa, A.; Enea, M.; Galante, G.M.; La Fata, C.M. ELECTRE TRI-based approach to the failure modes classification on the basis of risk parameters: An alternative to the risk priority number. Comput. Ind. Eng. 2017, 108, 100–110. [Google Scholar] [CrossRef]
- Fattahi, R.; Khalilzadeh, M. Risk evaluation using a novel hybrid method based on FMEA, extended MULTIMOORA, and AHP methods under fuzzy environment. Saf. Sci. 2018, 102, 290–300. [Google Scholar] [CrossRef]
- Peeters, J.; Basten, R.; Tinga, T. Improving failure analysis efficiency by combining FTA and FMEA in a recursive manner. Reliab. Eng. Syst. Saf. 2018, 172, 36–44. [Google Scholar] [CrossRef]
- Yousefi, S.; Alizadeh, A.; Hayati, J.; Baghery, M. HSE risk prioritization using robust DEA-FMEA approach with undesirable outputs: A study of automotive parts industry in Iran. Saf. Sci. 2018, 102, 144–158. [Google Scholar] [CrossRef]
- Baynal, K.; Sari, T.; Akpinar, B. Risk management in automotive manufacturing process based on FMEA and grey relational analysis: A case study. Adv. Prod. Eng. Manag. 2018, 13, 69–80. [Google Scholar] [CrossRef]
- Kumar, M.B.; Parameshwaran, R. Fuzzy integrated QFD, FMEA framework for the selection of lean tools in a manufacturing organisation. Prod. Plan. Control. 2018, 29, 403–417. [Google Scholar] [CrossRef]
- Liu, H.-C.; Liu, L.; Liu, N. Risk evaluation approaches in failure mode and effects analysis: A literature review. Expert Syst. Appl. 2013, 40, 828–838. [Google Scholar] [CrossRef]
- Chin, K.-S.; Wang, Y.-M.; Poon, G.K.K.; Yang, J.-B. Failure mode and effects analysis by data envelopment analysis. Decis. Support Syst. 2009, 48, 246–256. [Google Scholar] [CrossRef]
- Liu, H.-C.; You, J.-X.; Lin, Q.-L.; Li, H. Risk assessment in system FMEA combining fuzzy weighted average with fuzzy decision-making trial and evaluation laboratory. Int. J. Comput. Integr. Manuf. 2015, 28, 701–714. [Google Scholar] [CrossRef]
- Wang, Y.-M.; Chin, K.-S.; Poon, G.K.K.; Yang, J.-B. Risk evaluation in failure mode and effects analysis using fuzzy weighted geometric mean. Expert Syst. Appl. 2009, 36, 1195–1207. [Google Scholar] [CrossRef]
- Rezaee, M.J.; Yousefi, S.; Eshkevari, M.; Valipour, M.; Saberi, M. Risk analysis of health, safety and environment in chemical industry integrating linguistic FMEA, fuzzy inference system and fuzzy DEA. Stoch. Environ. Res. Risk Assess. 2020, 34, 201–218. [Google Scholar] [CrossRef]
- Liu, H.-C.; Chen, X.-Q.; Duan, C.-Y.; Wang, Y.-M. Failure mode and effect analysis using multi-criteria decision makin methods: A systematic literature review. Comput. Ind. Eng., vol. 135, pp. 881–897, Sep. 2019.
- Appa, G.; Norman, M.; Stoker, B. Data Envelopment Analysis: The Assessment of Performance. Wiley: Hoboken, NJ, USA, 1991.
- Wu, J.; Chu, J.; Sun, J.; Zhu, Q. DEA cross-efficiency evaluation based on Pareto improvement. Eur. J. Oper. Res. 2016, 248, 571–579. [Google Scholar] [CrossRef]
- Ray, A.; Chaudhuri, A.K. Smart healthcare disease diagnosis and patient management: Innovation, improvement and skill development. Mach. Learn. Appl. 2021, 3, 100011. [Google Scholar] [CrossRef]
- Leo, M.; Sharma, S.; Maddulety, K. Machine Learning in Banking Risk Management: A Literature Review. Risks 2019, 7, 29. [Google Scholar] [CrossRef]
- Zhang, J.; Li, Z.; Pu, Z.; Xu, C. Comparing Prediction Performance for Crash Injury Severity Among Various Machine Learning and Statistical Methods. IEEE Access 2018, 6, 60079–60087. [Google Scholar] [CrossRef]
- Chandrinos, S.K.; Sakkas, G.; Lagaros, N.D. AIRMS: A risk management tool using machine learning. Expert Syst. Appl. 2018, 105, 34–48. [Google Scholar] [CrossRef]
- Paltrinieri, N.; Comfort, L.; Reniers, G. Learning about risk: Machine learning for risk assessment. Saf. Sci. 2019, 118, 475–486. [Google Scholar] [CrossRef]
- Gondia, A.; Siam, A.; El-Dakhakhni, W.; Nassar, A.H. Machine Learning Algorithms for Construction Projects Delay Risk Prediction. J. Constr. Eng. Manag. 2020, 146. [Google Scholar] [CrossRef]
- Charnes, A.; Cooper, W.W.; Rhodes, E. Measuring the efficiency of decision making units. Eur. J. Oper. Res. 1978, 2, 429–444. [Google Scholar] [CrossRef]
- Bertsimas, D.; Sim, M. The Price of Robustness. Oper. Res. 2004, 52, 35–53. [Google Scholar] [CrossRef]
- Ben-Tal, A. Nemirovski. 1999. Robust solutions to uncertain programs. Oper. Res. Lett. 25 1–13.
- Soyster, A.L. Technical Note—Convex Programming with Set-Inclusive Constraints and Applications to Inexact Linear Programming. Oper. Res. 1973, 21, 1154–1157. [Google Scholar] [CrossRef]
- Ben-Tal, A.; Nemirovski, A. Robust solutions of Linear Programming problems contaminated with uncertain data. Math. Program. 2000, 88, 411–424. [Google Scholar] [CrossRef]
- Lima-Junior, F.R.; Carpinetti, L.C.R. Predicting supply chain performance based on SCOR® metrics and multilayer perceptron neural networks. Int. J. Prod. Econ. 2019, 212, 19–38. [Google Scholar] [CrossRef]
- Hashemi Fath, A.; Madanifar, F.; Abbasi, M. Implementation of multilayer perceptron (MLP) and radial basis function (RBF) neural networks to predict solution gas-oil ratio of crude oil systems. Petroleum 2020, 6, 80–91. [Google Scholar] [CrossRef]
- Seiford, L.M.; Zhu, J. Modeling undesirable factors in efficiency evaluation. Eur. J. Oper. Res. 2002, 142, 16–20. [Google Scholar] [CrossRef]
Figure 1.
Proposed Framework for study.
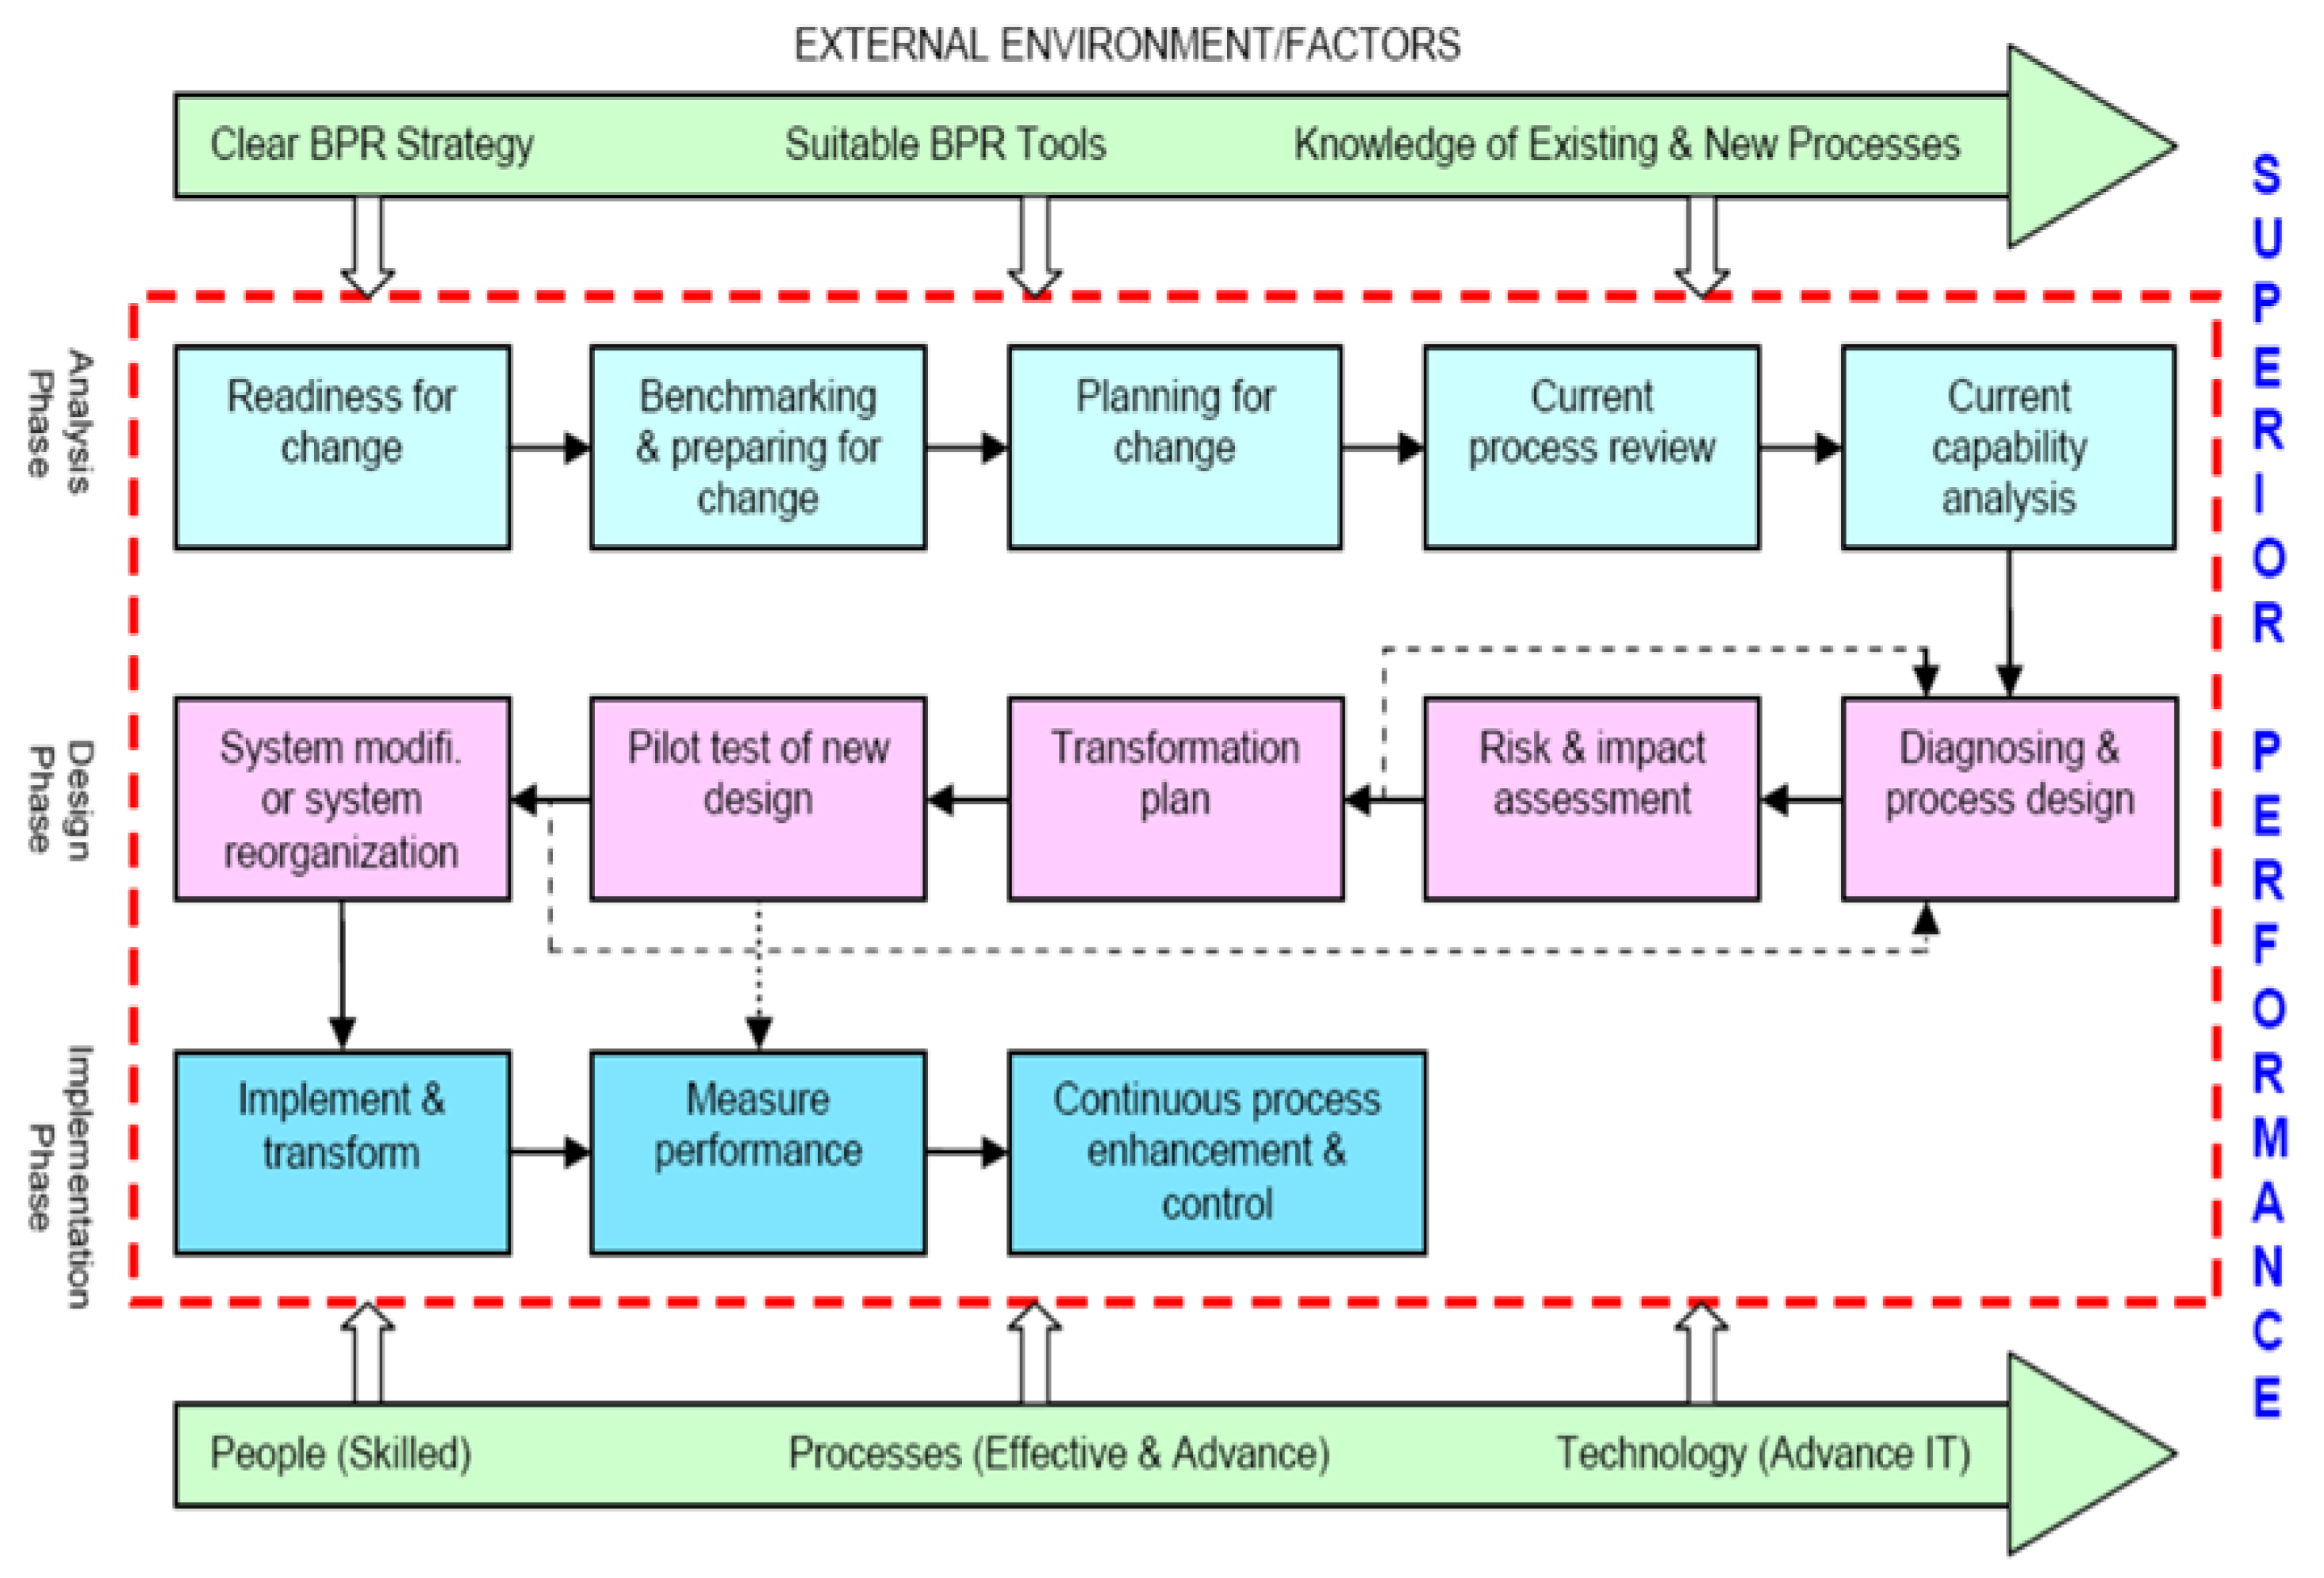
Figure 2.
Architecture of a neural network.
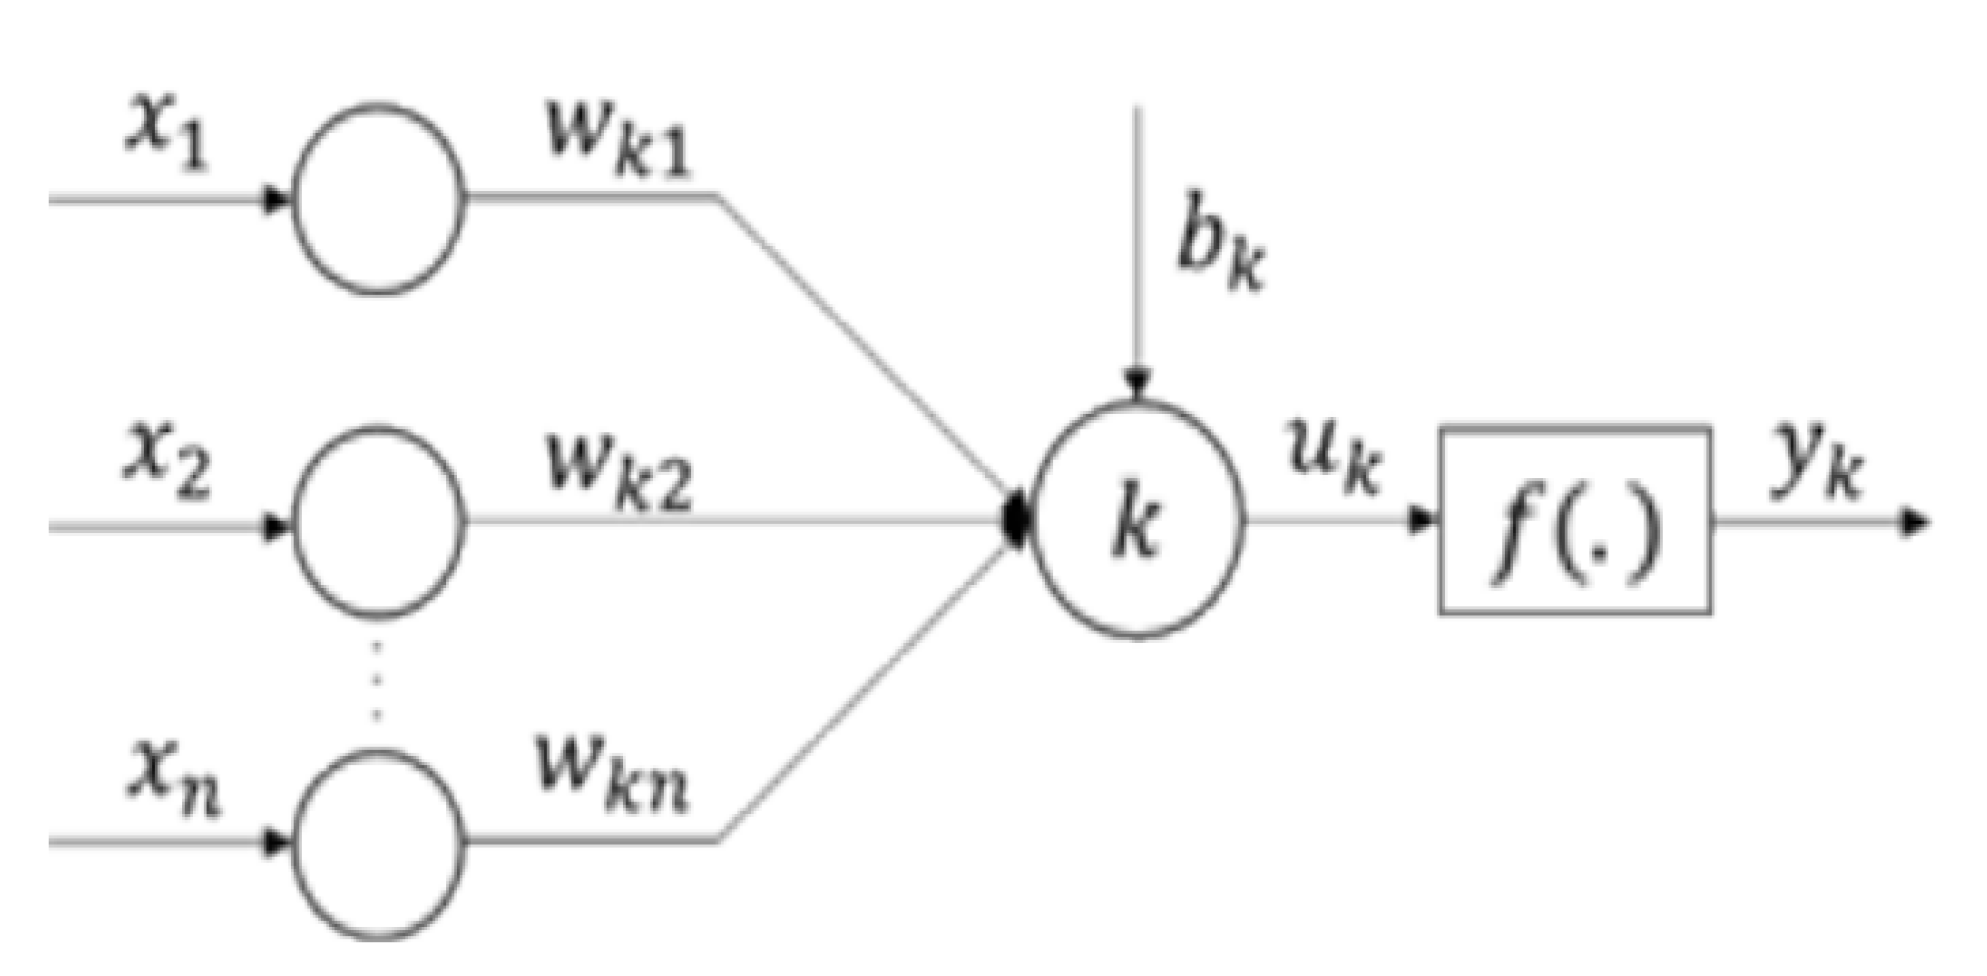
Figure 3.
Proposed Approach.
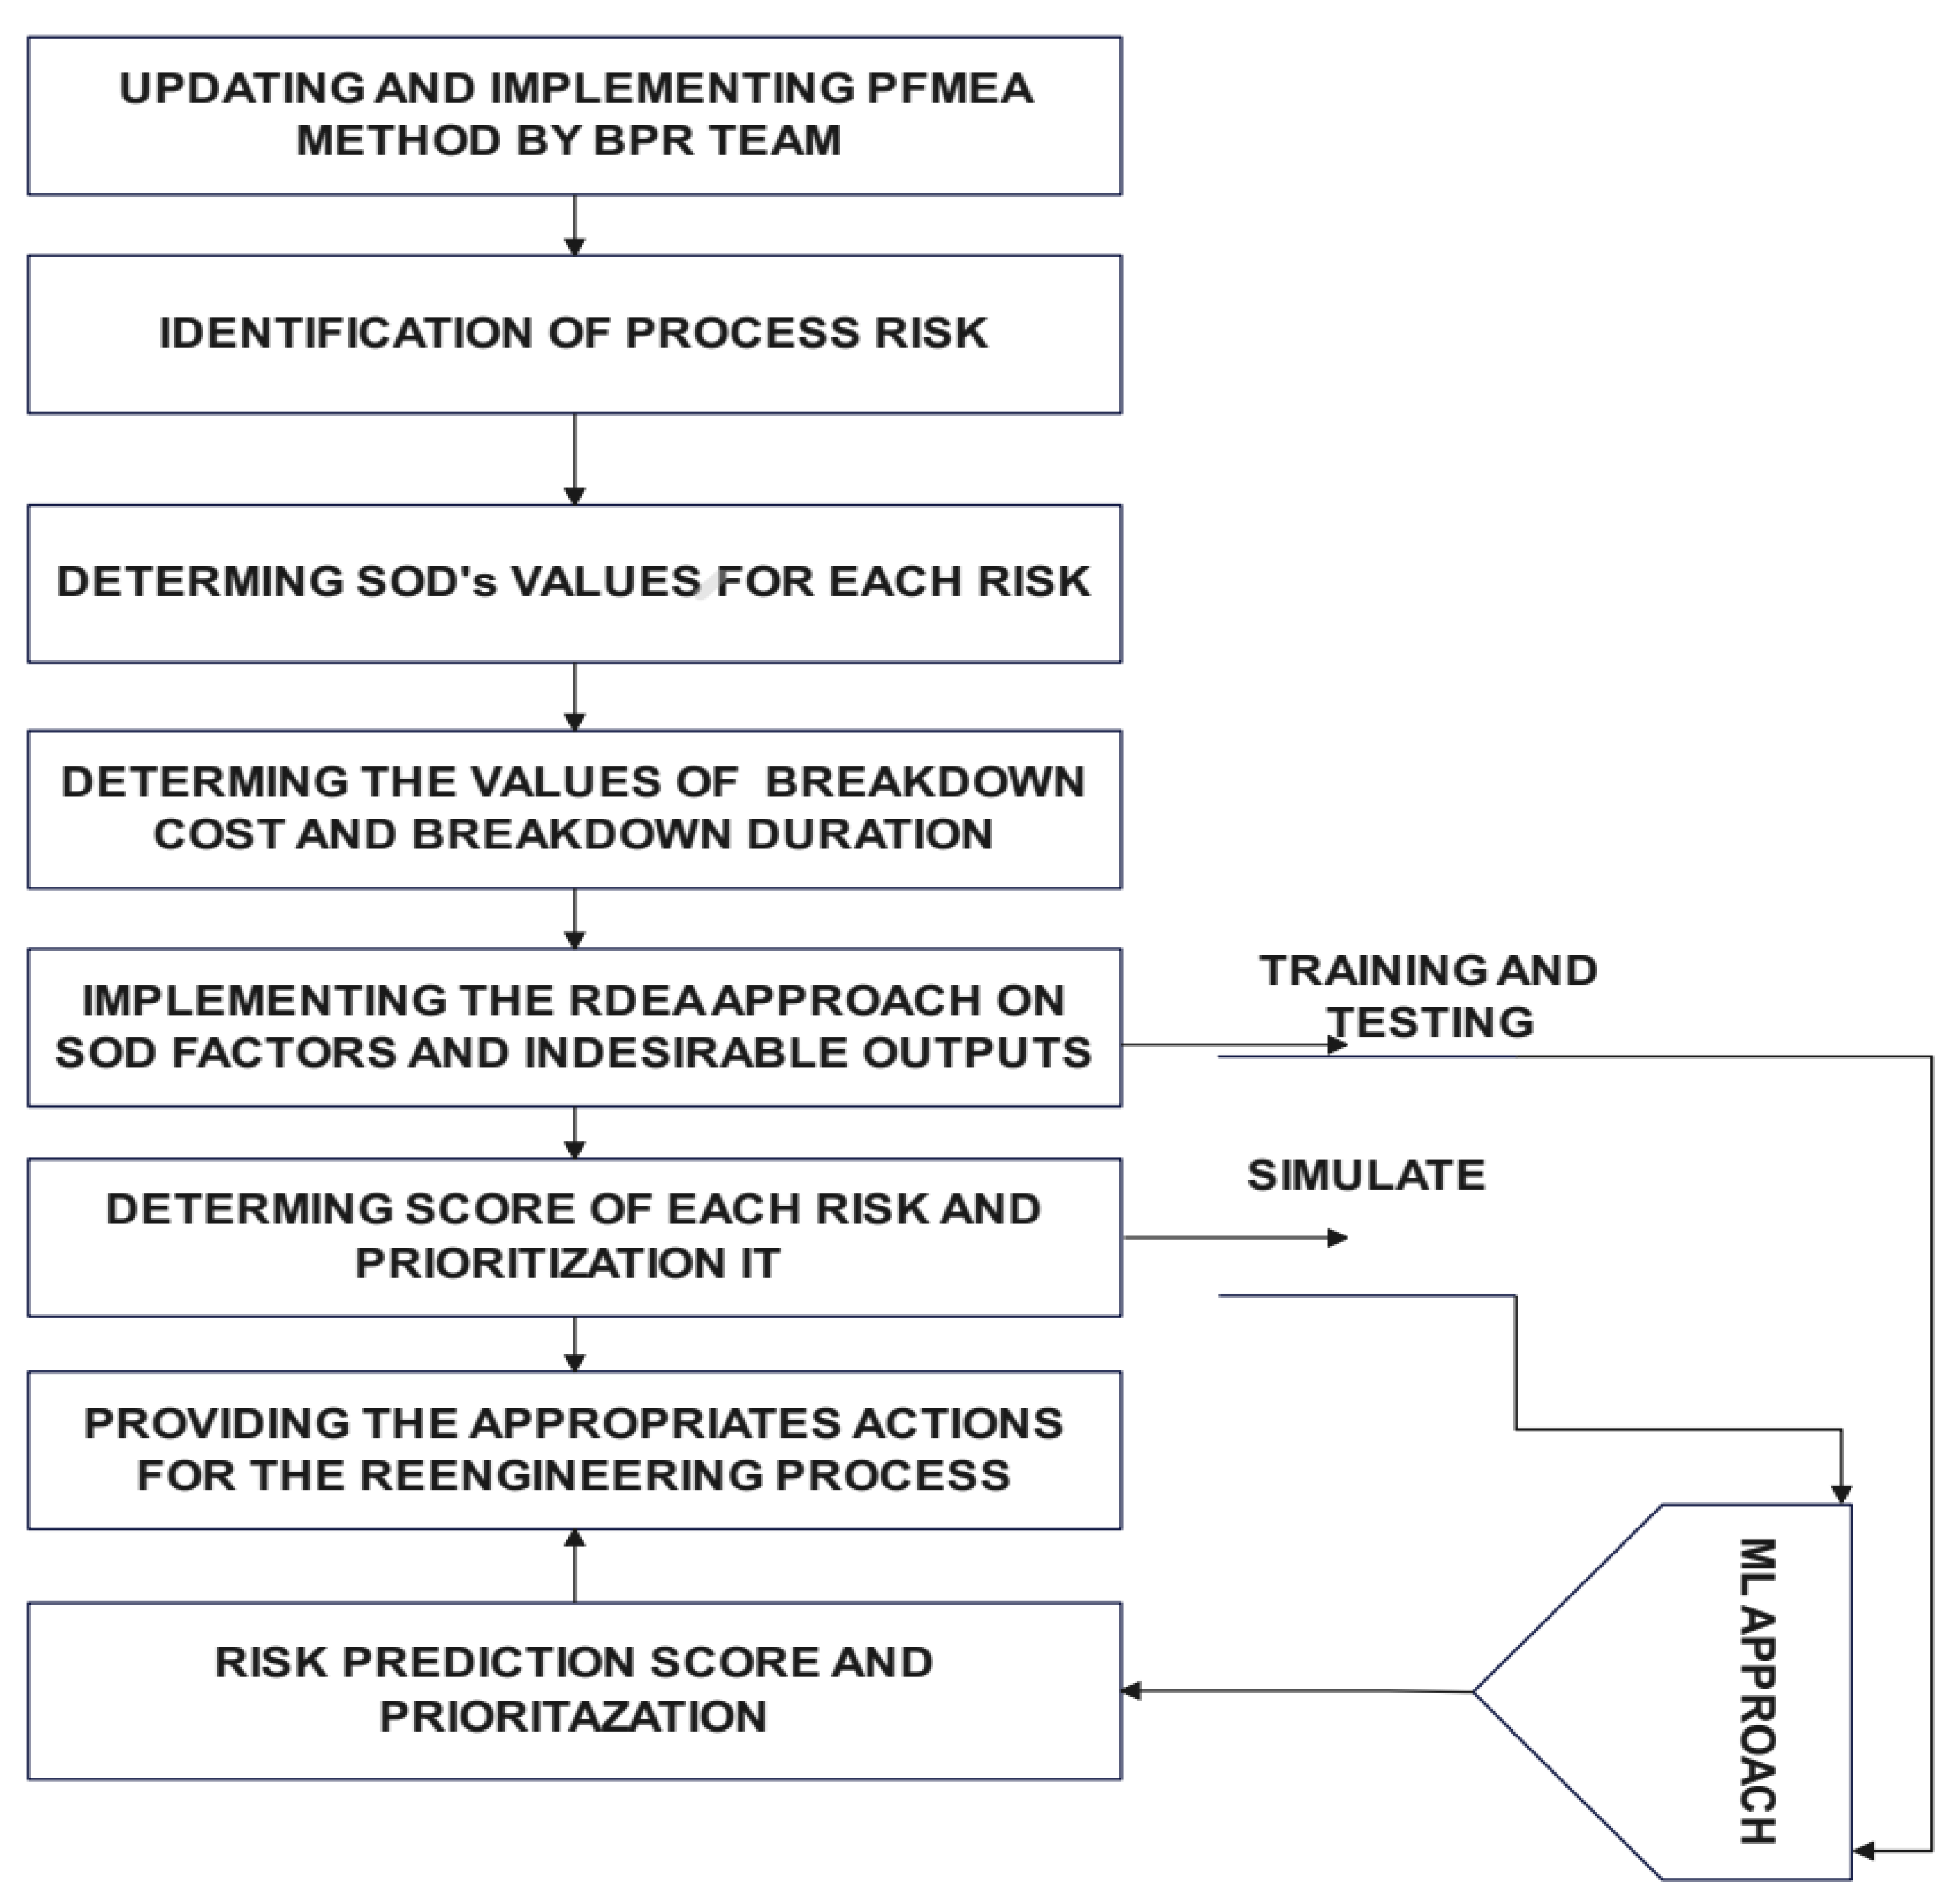
Figure 4.
Prioritization based on score of PFMEA-DEA approach and RPN score.
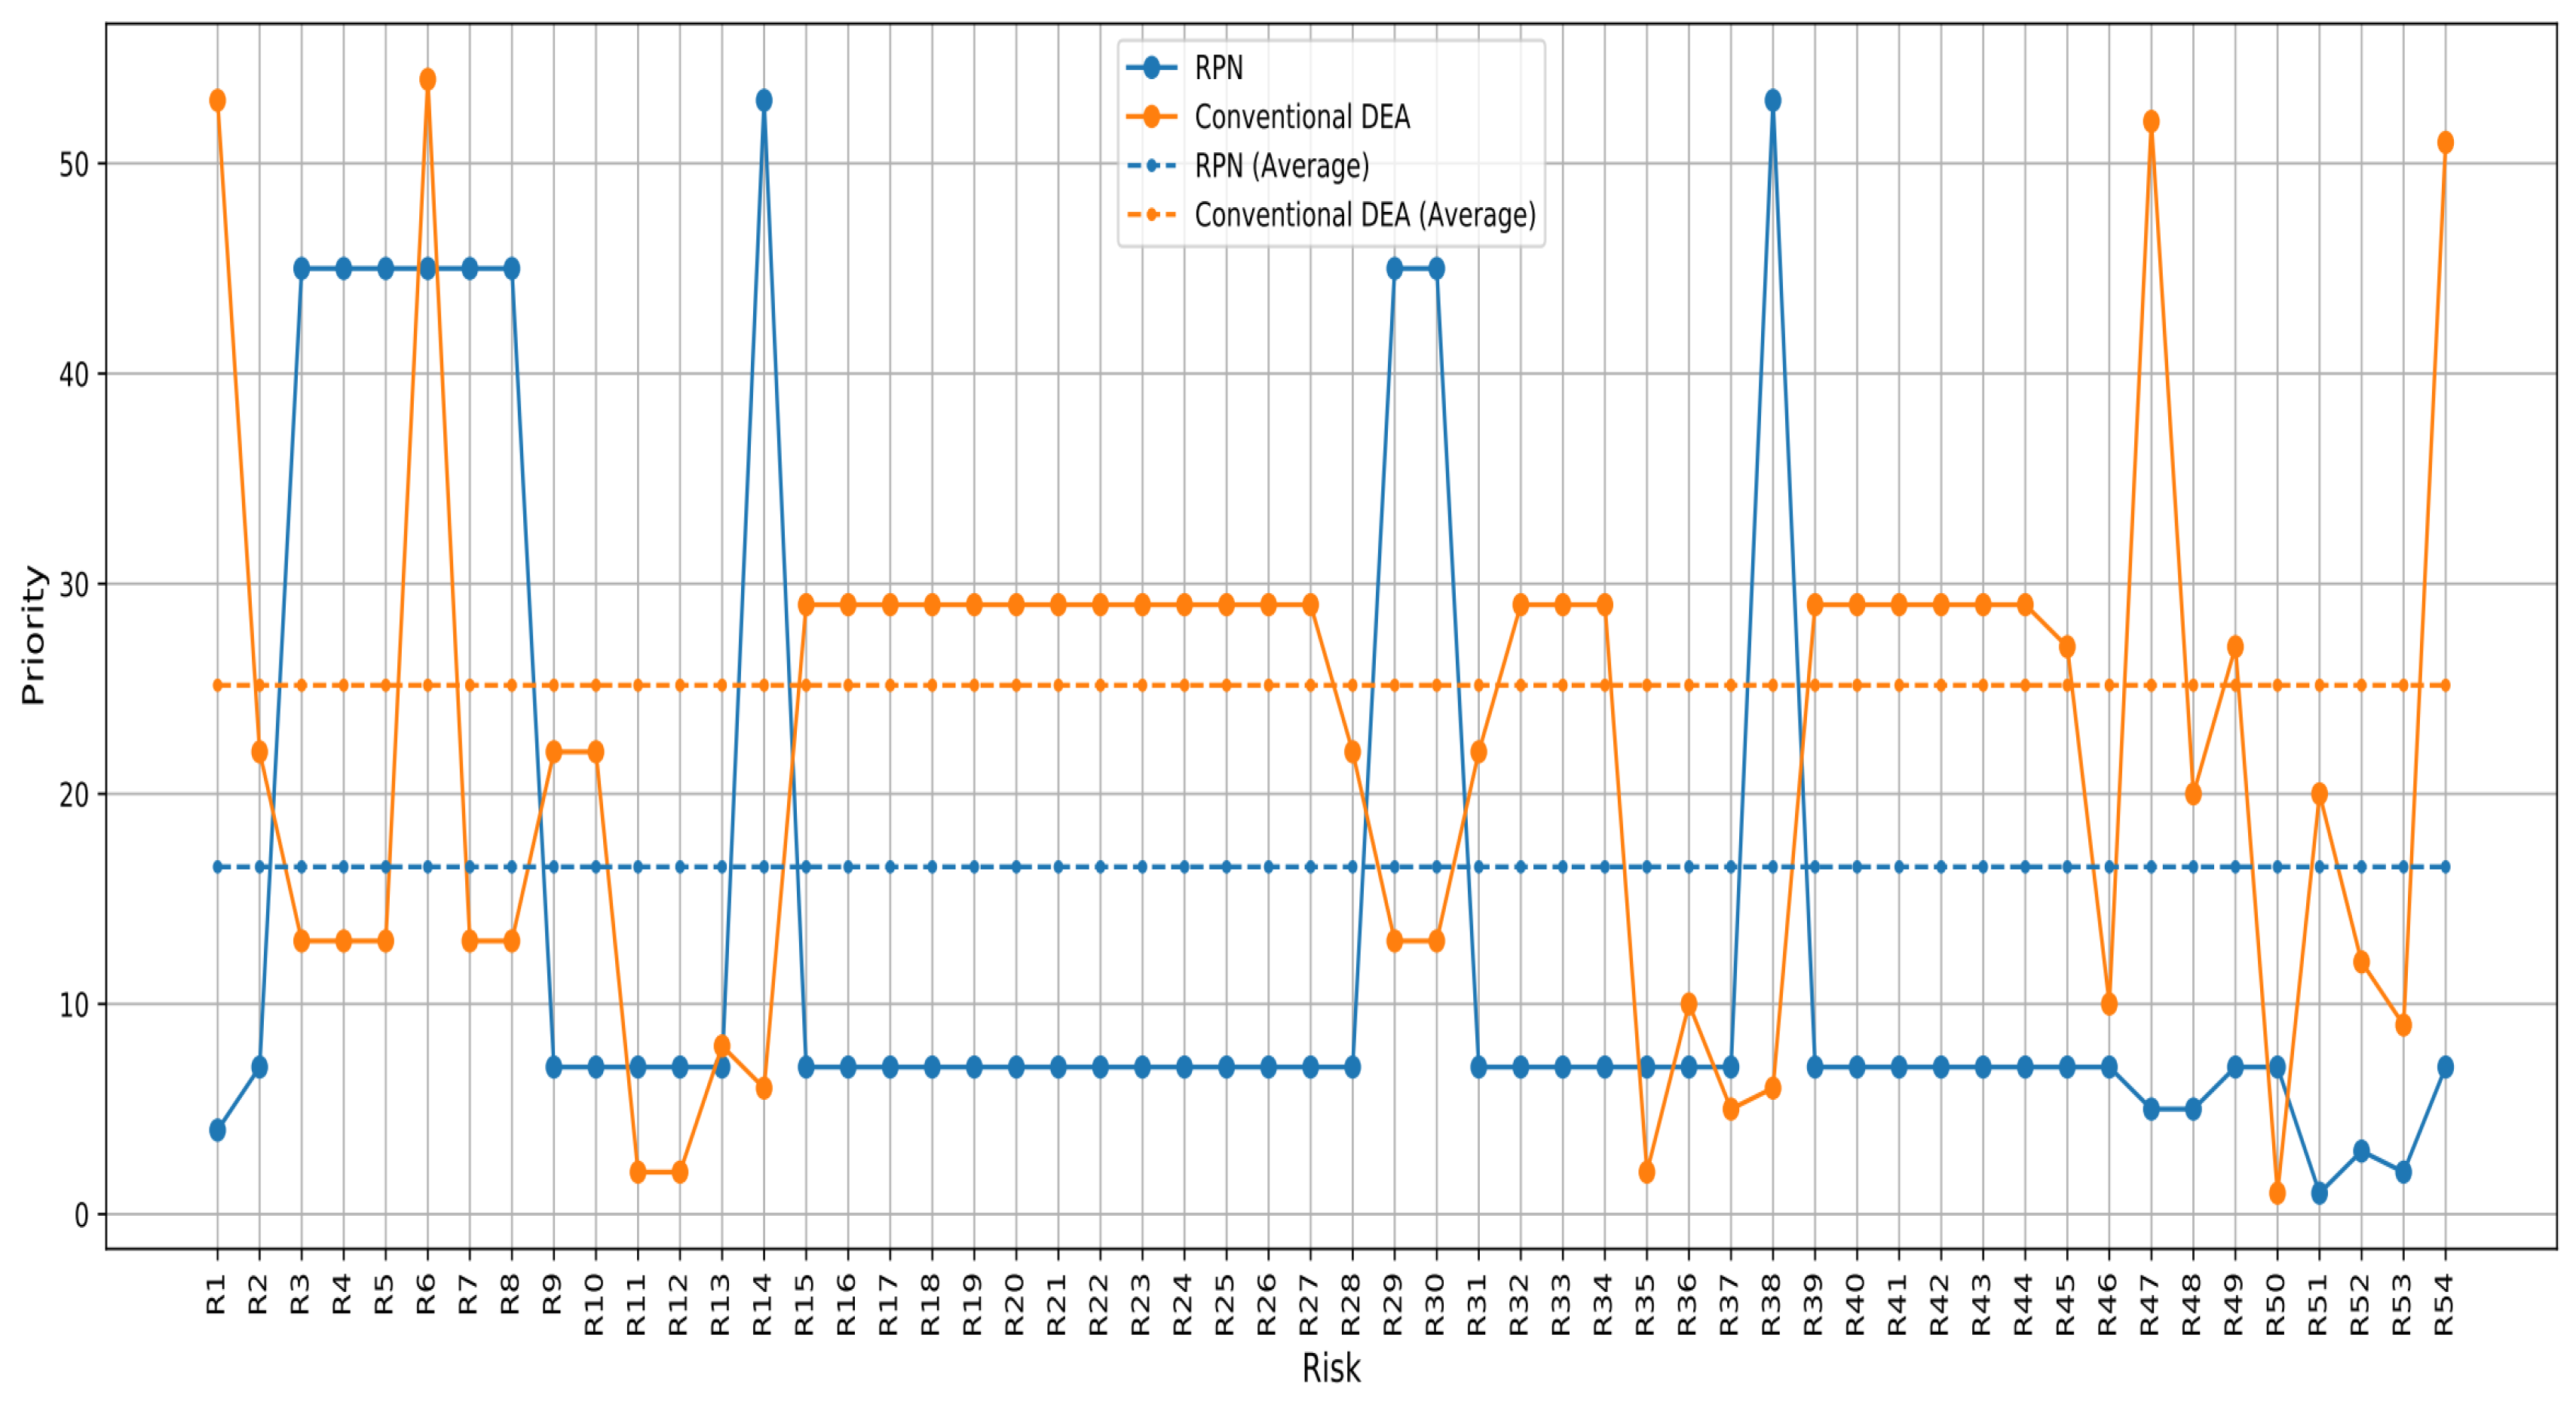
Figure 5.
Prioritization based on score of PFMEA-RDEA approach and RPN score.
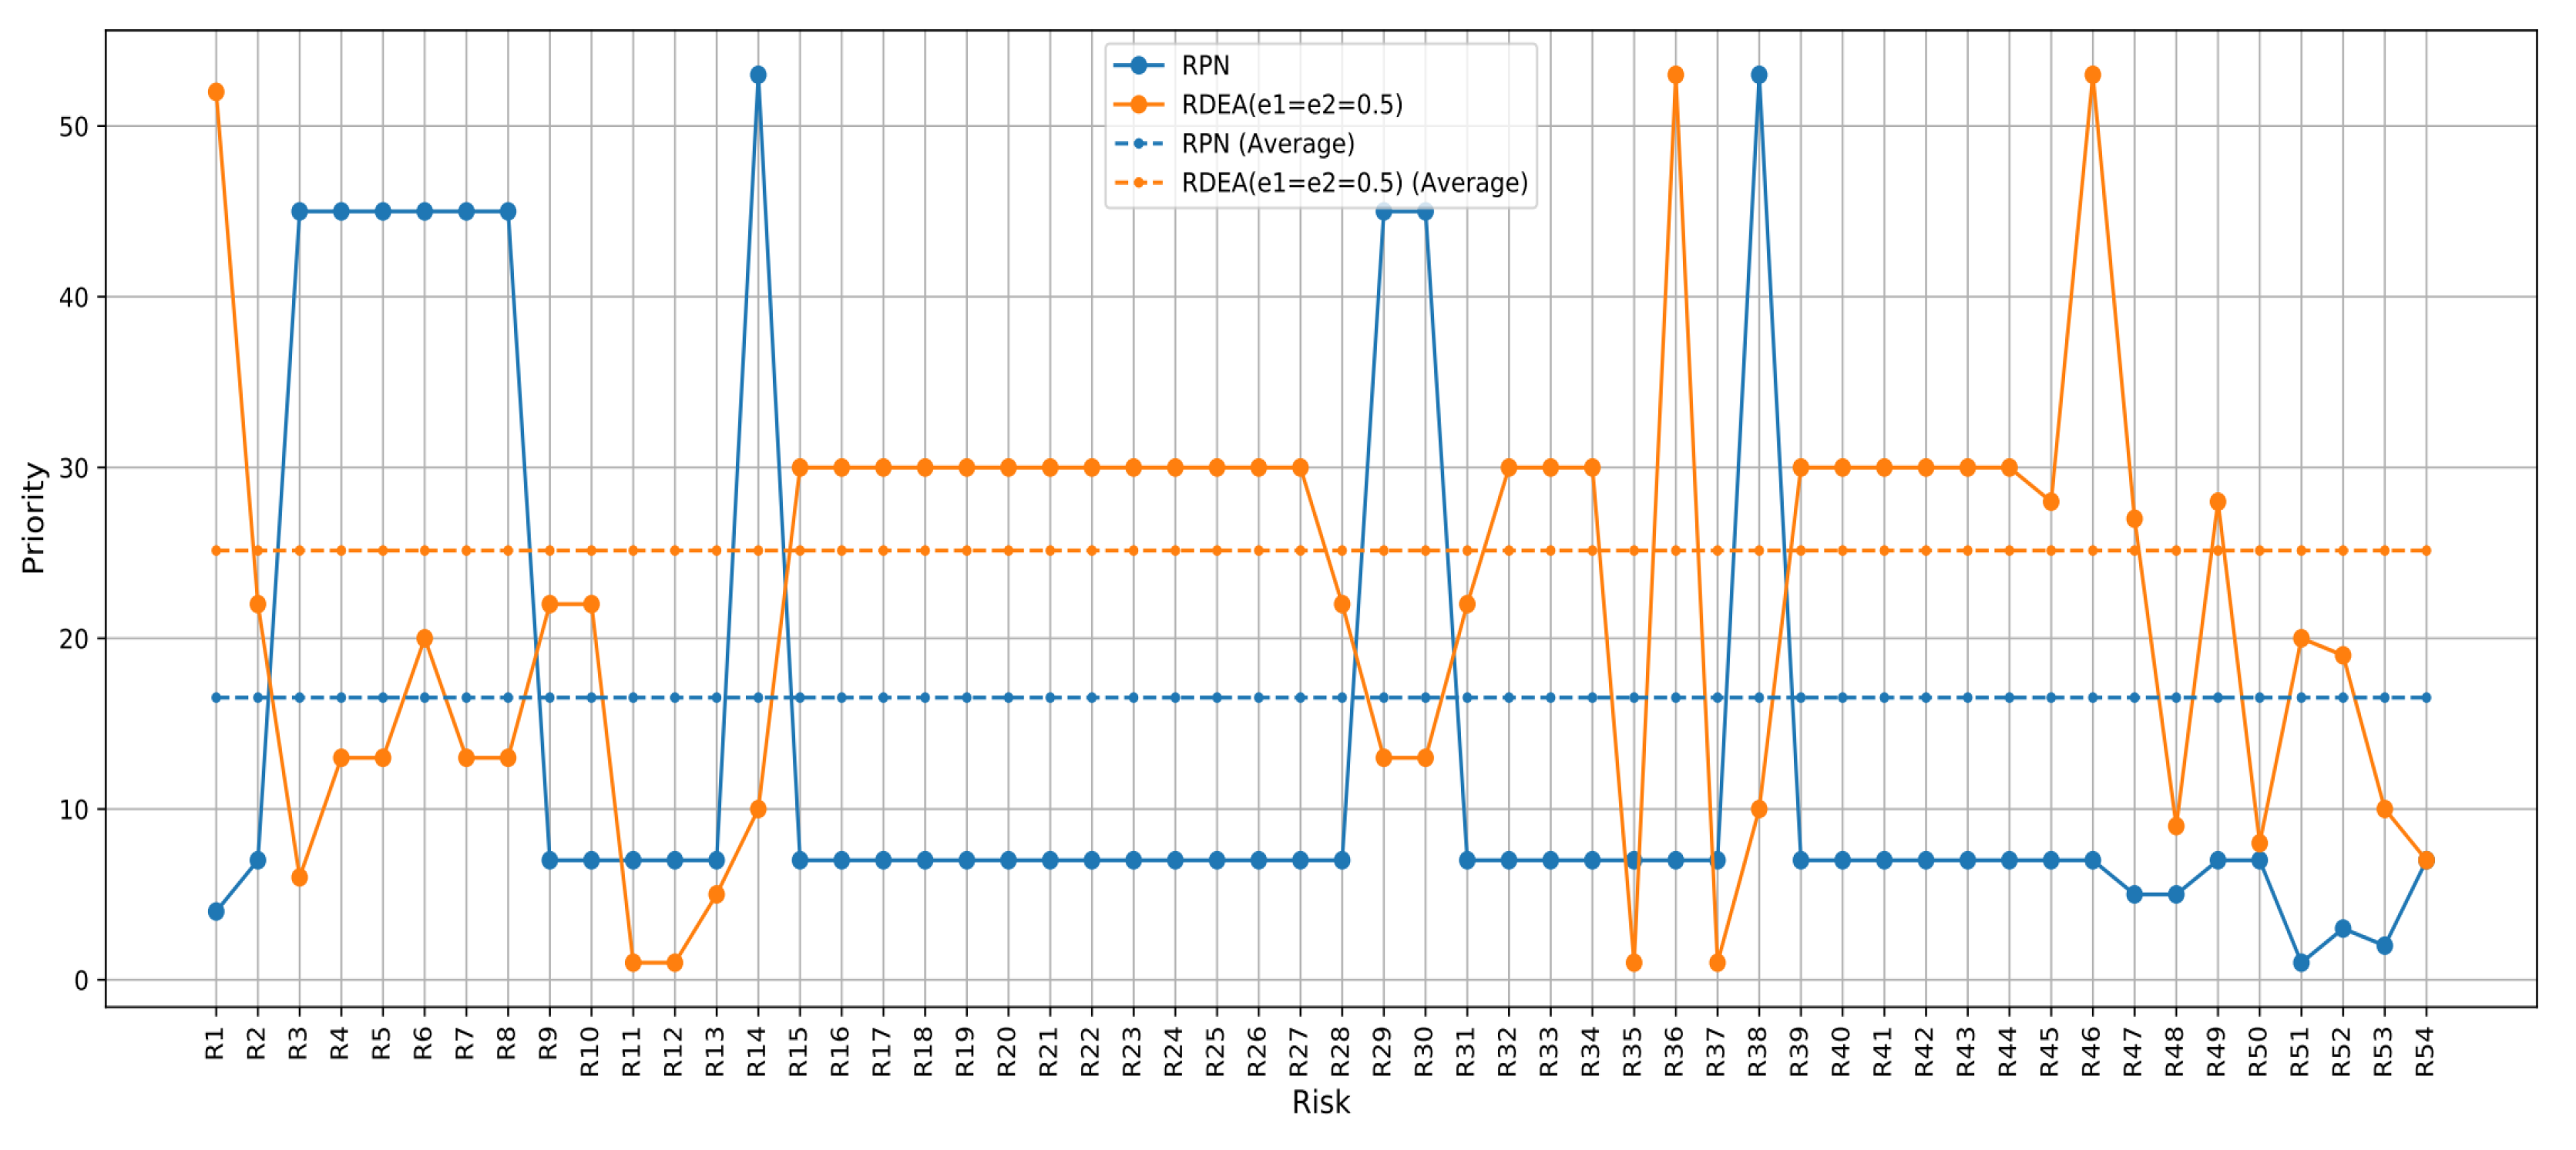
Figure 6.
Prioritization based on score of PFMEA-RDEA approach and PFMEA-DEA score.
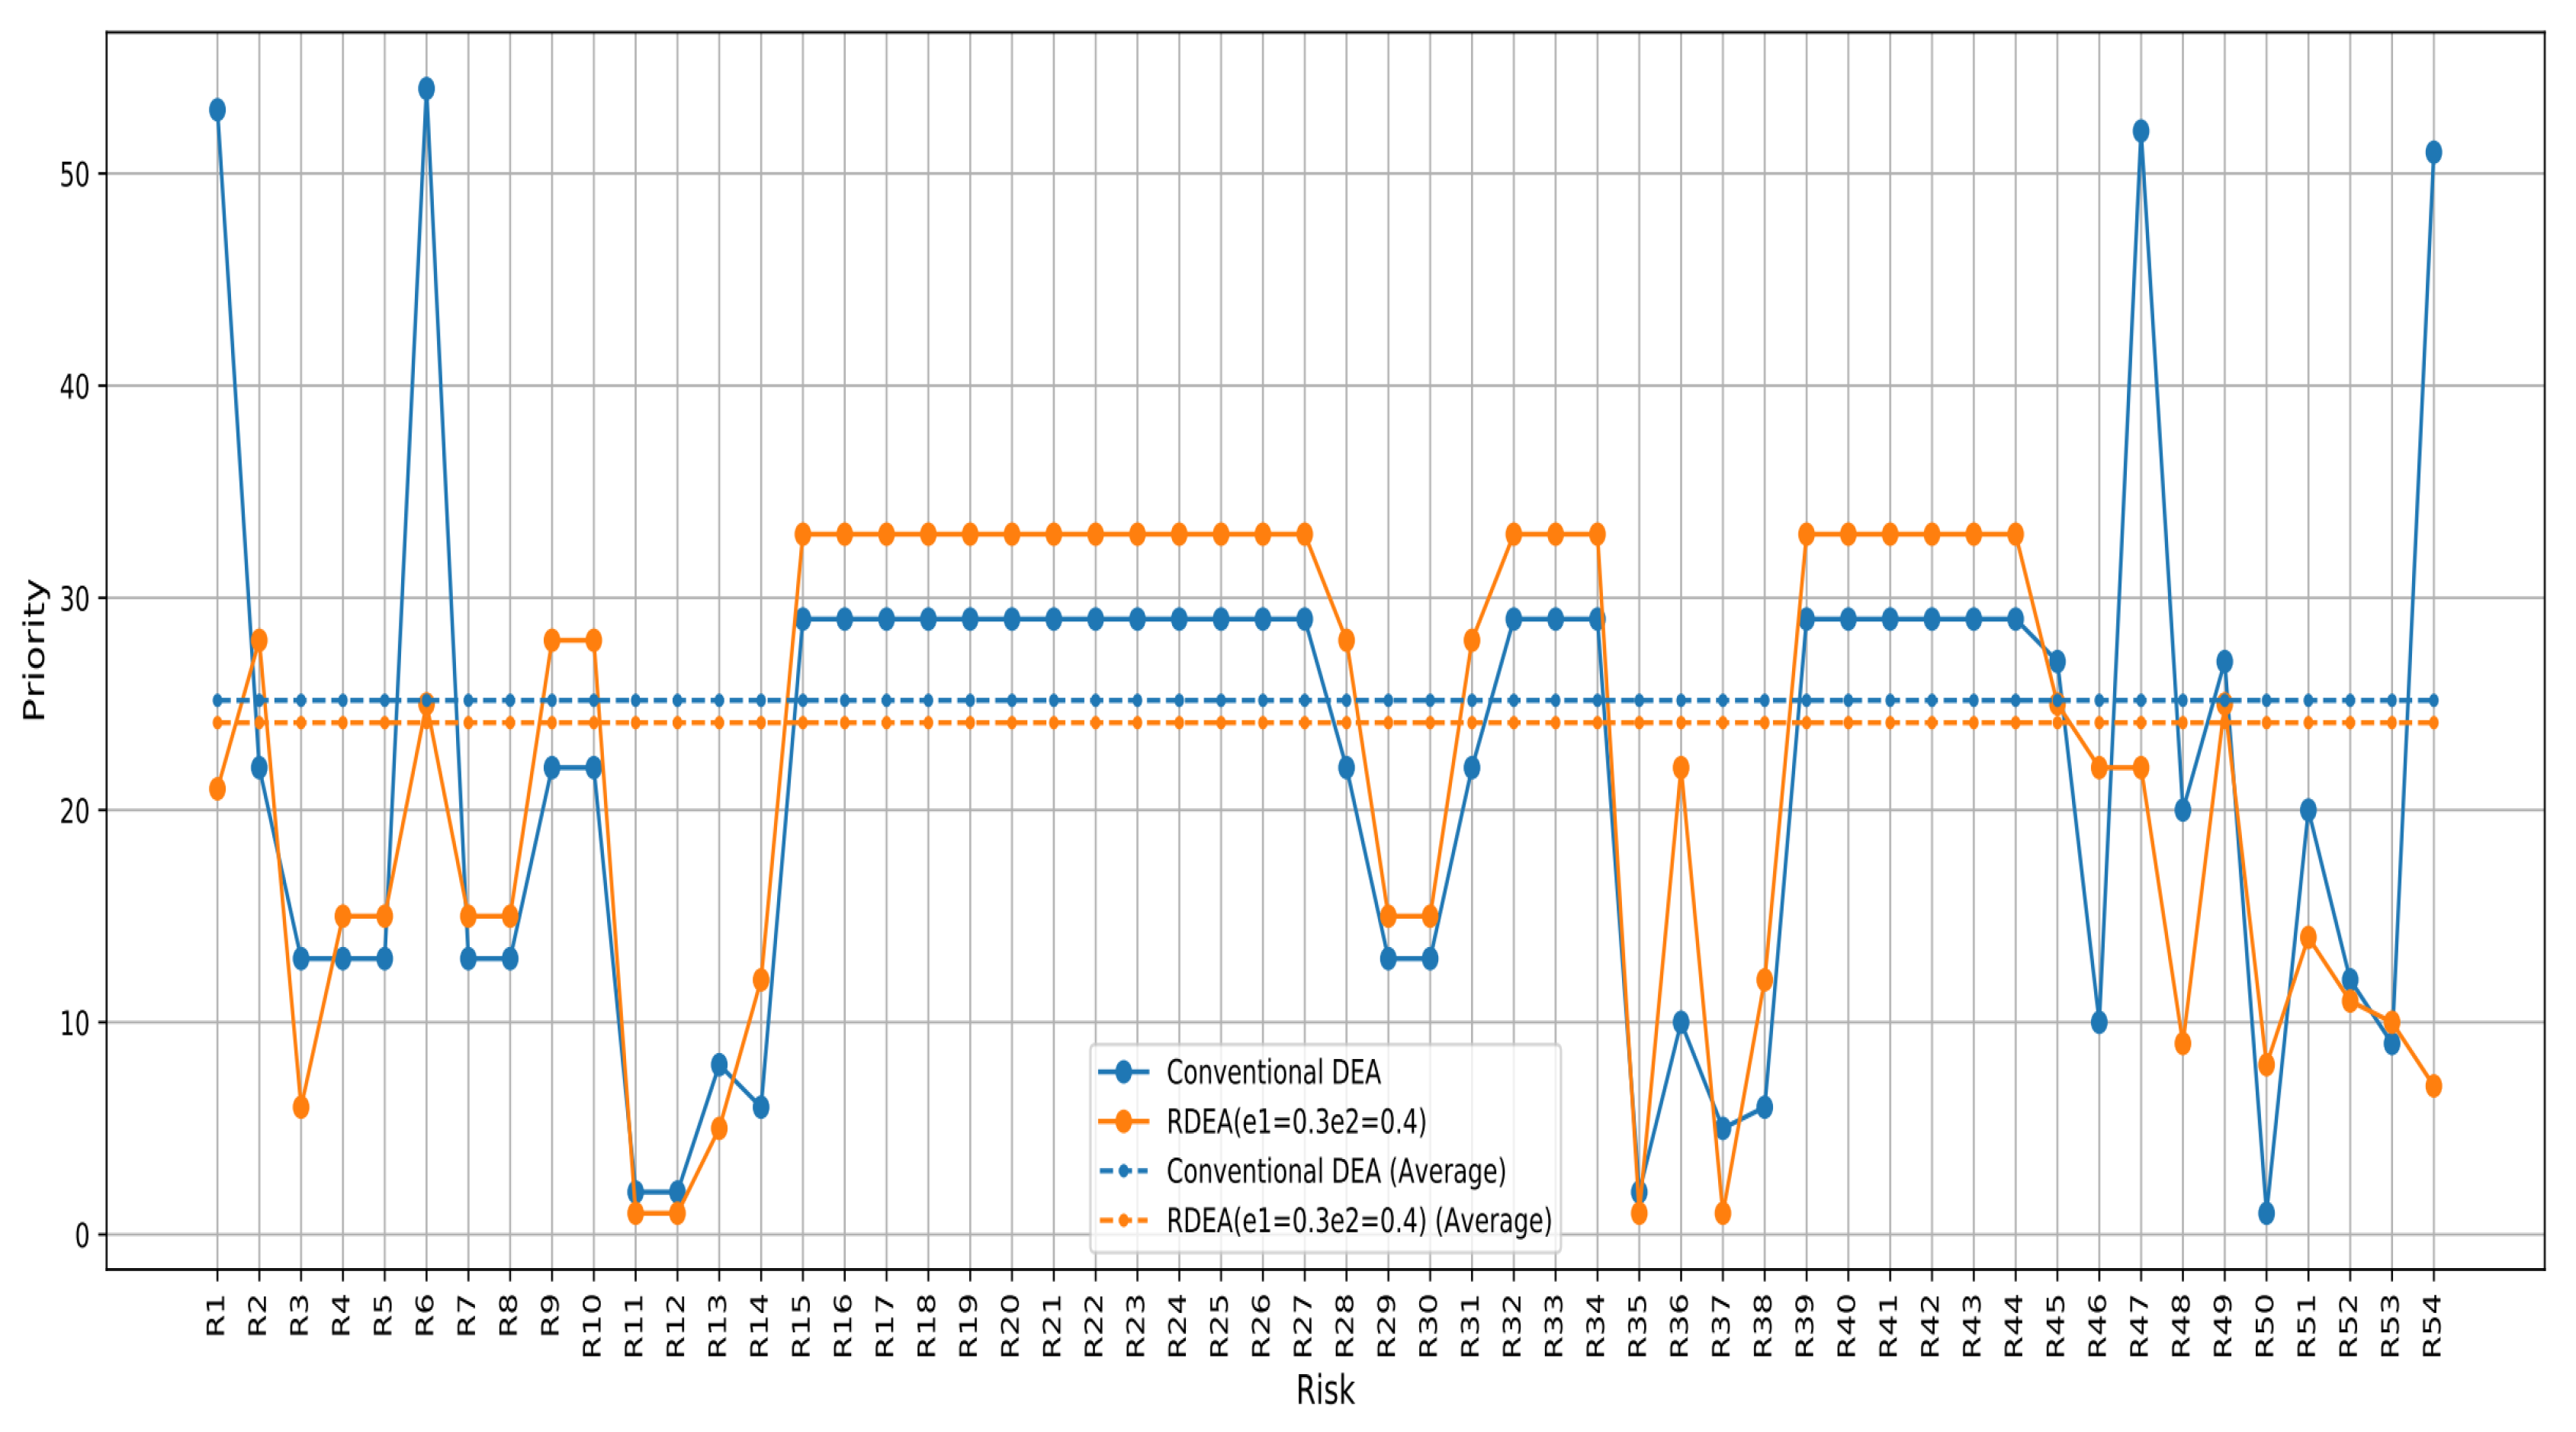
Figure 7.
Prioritization based on score of PFMEA-RDEA approach score with different perturbation percentage.
Figure 7.
Prioritization based on score of PFMEA-RDEA approach score with different perturbation percentage.
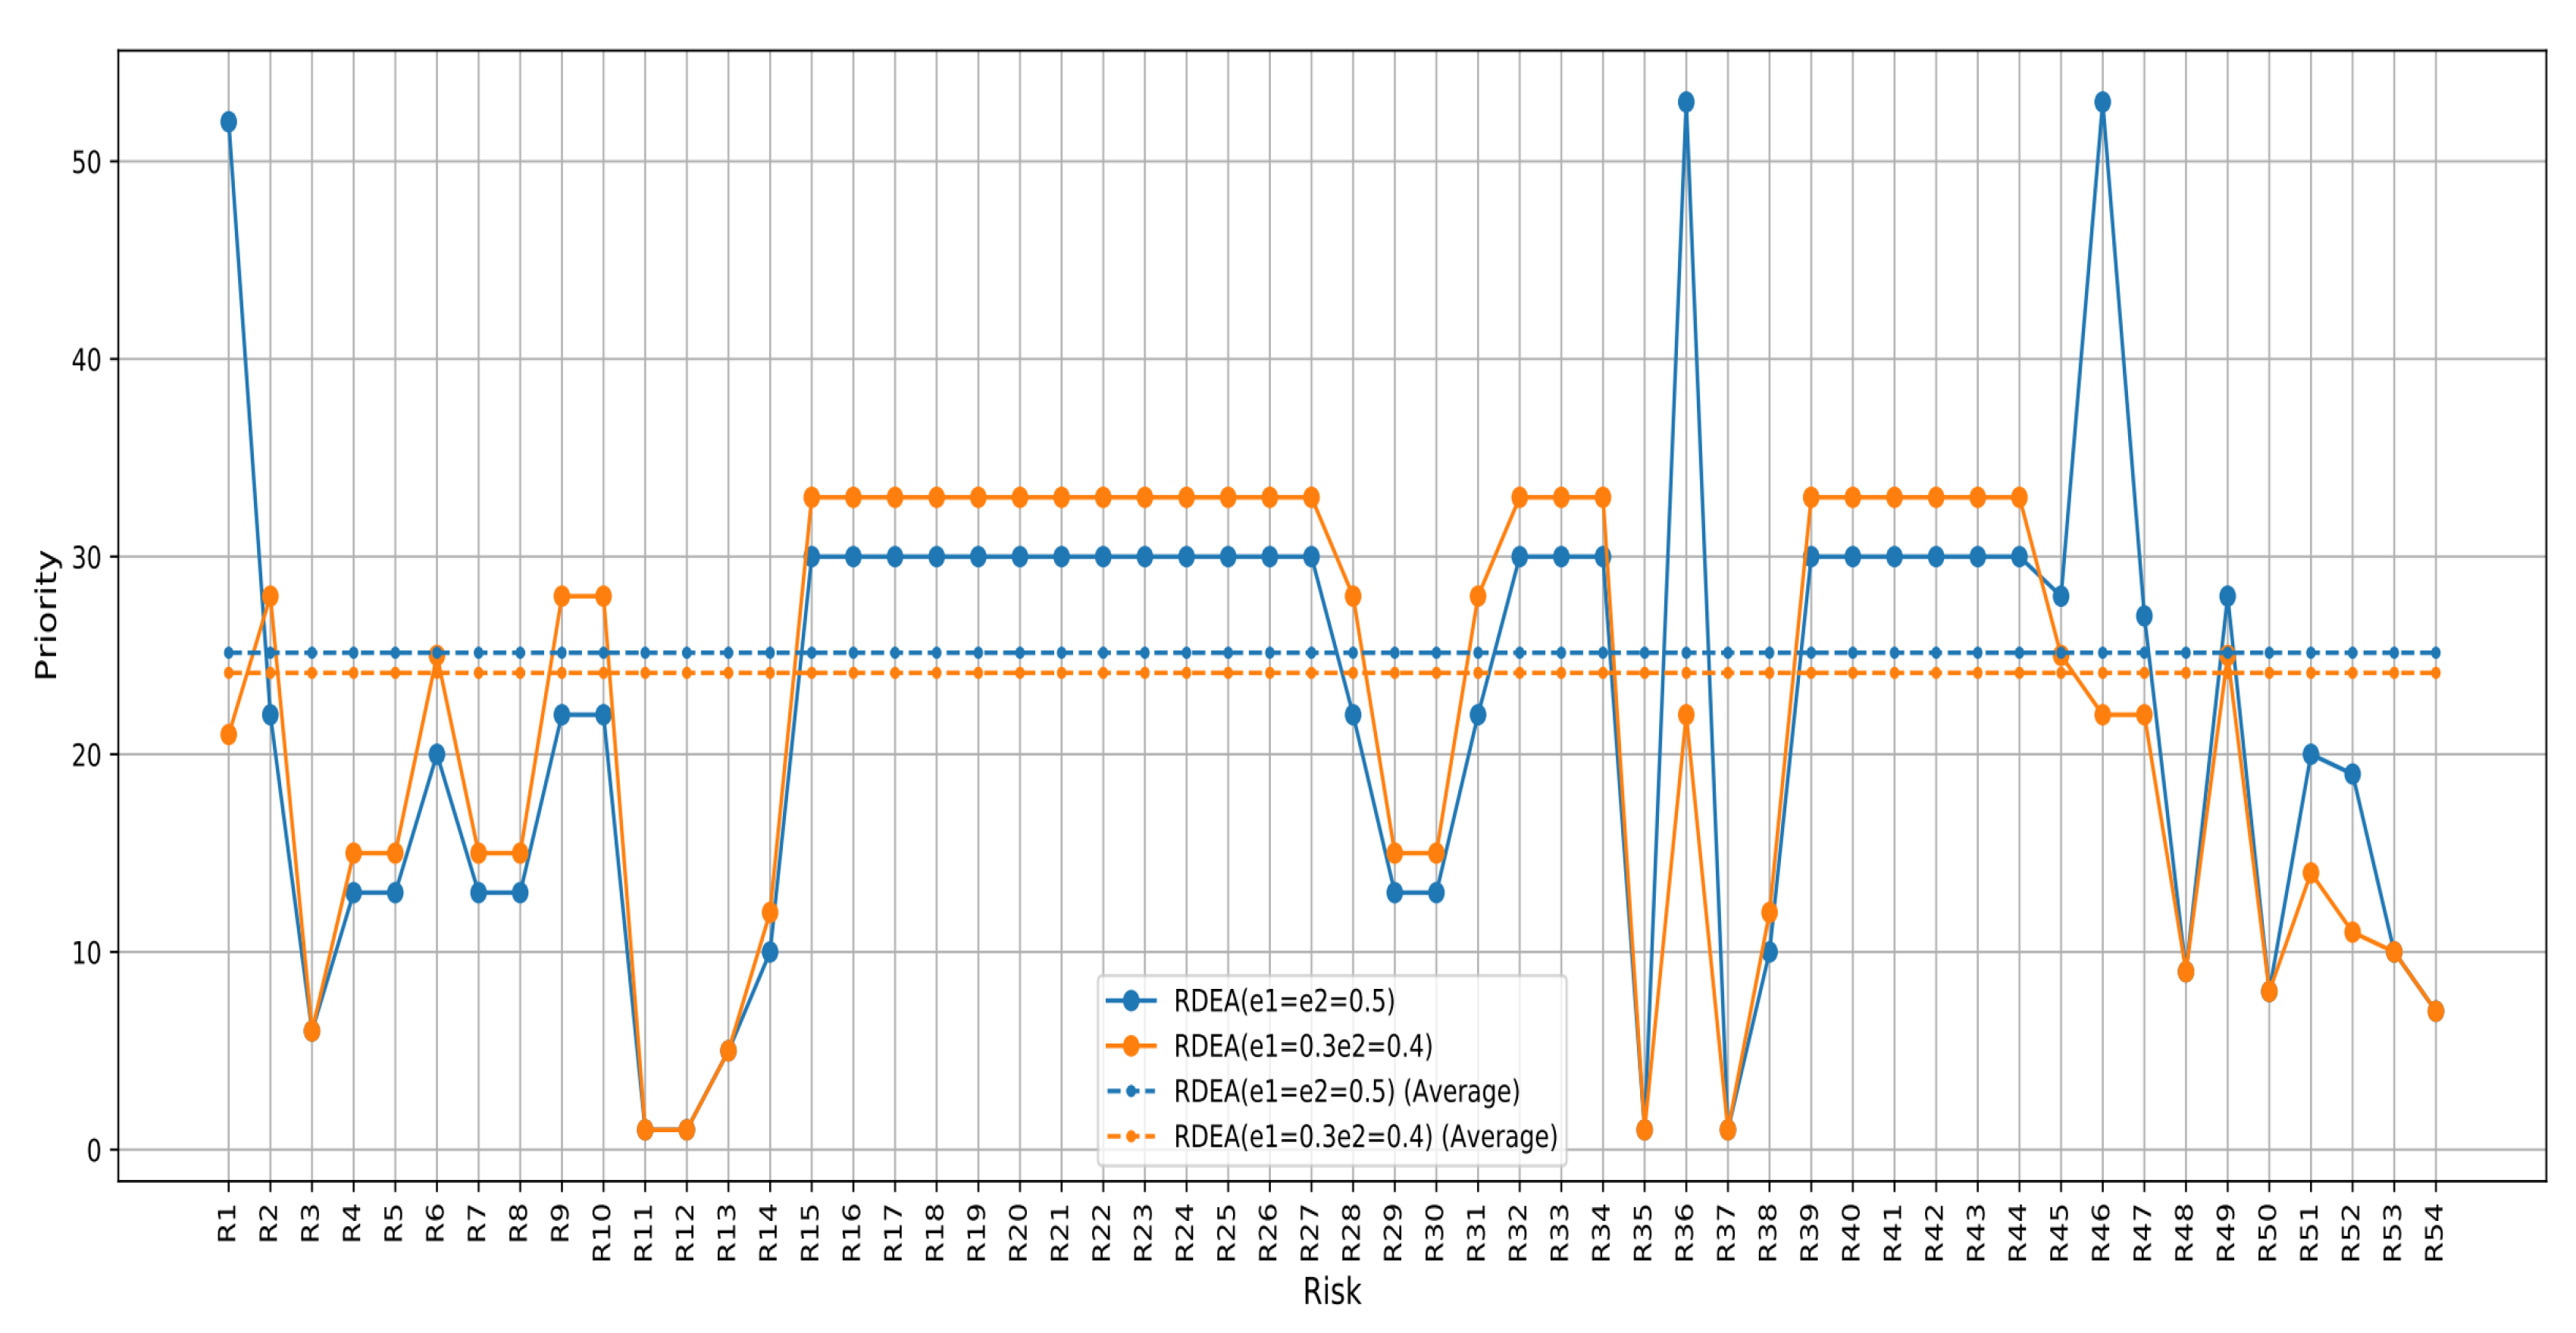
Figure 8.
Prioritization of risks based on score of PFMEA-DEA and PFMEA-RDEA approach score with different perturbation percentage.
Figure 8.
Prioritization of risks based on score of PFMEA-DEA and PFMEA-RDEA approach score with different perturbation percentage.
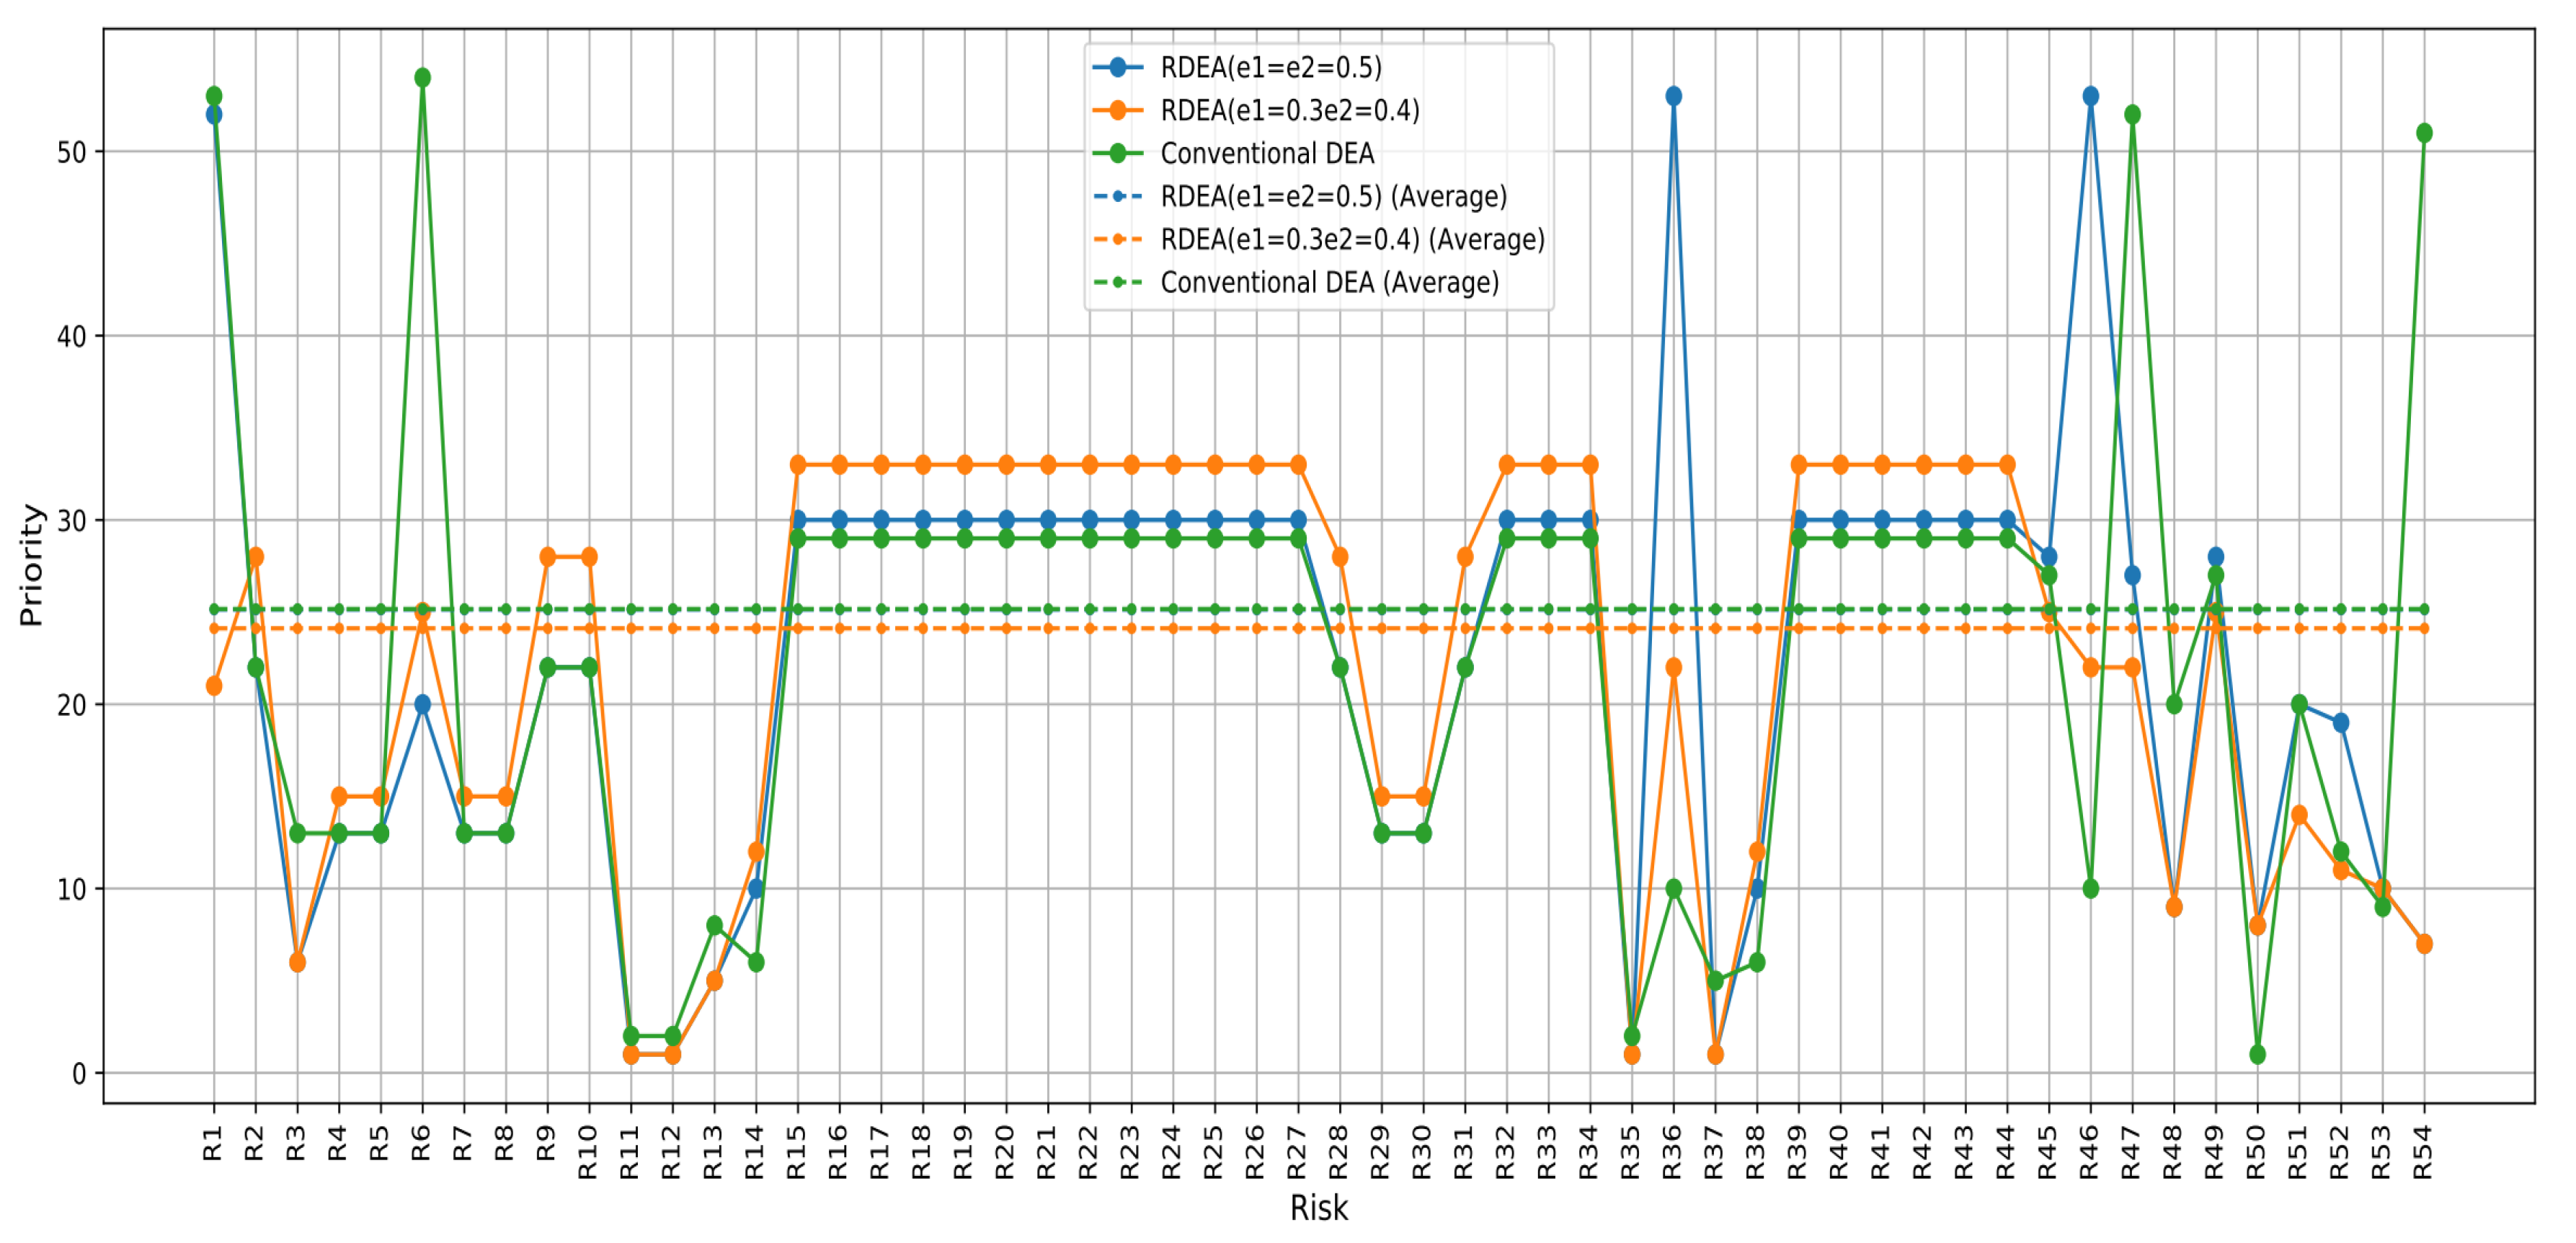
Figure 9.
The average ML efficiency scores.
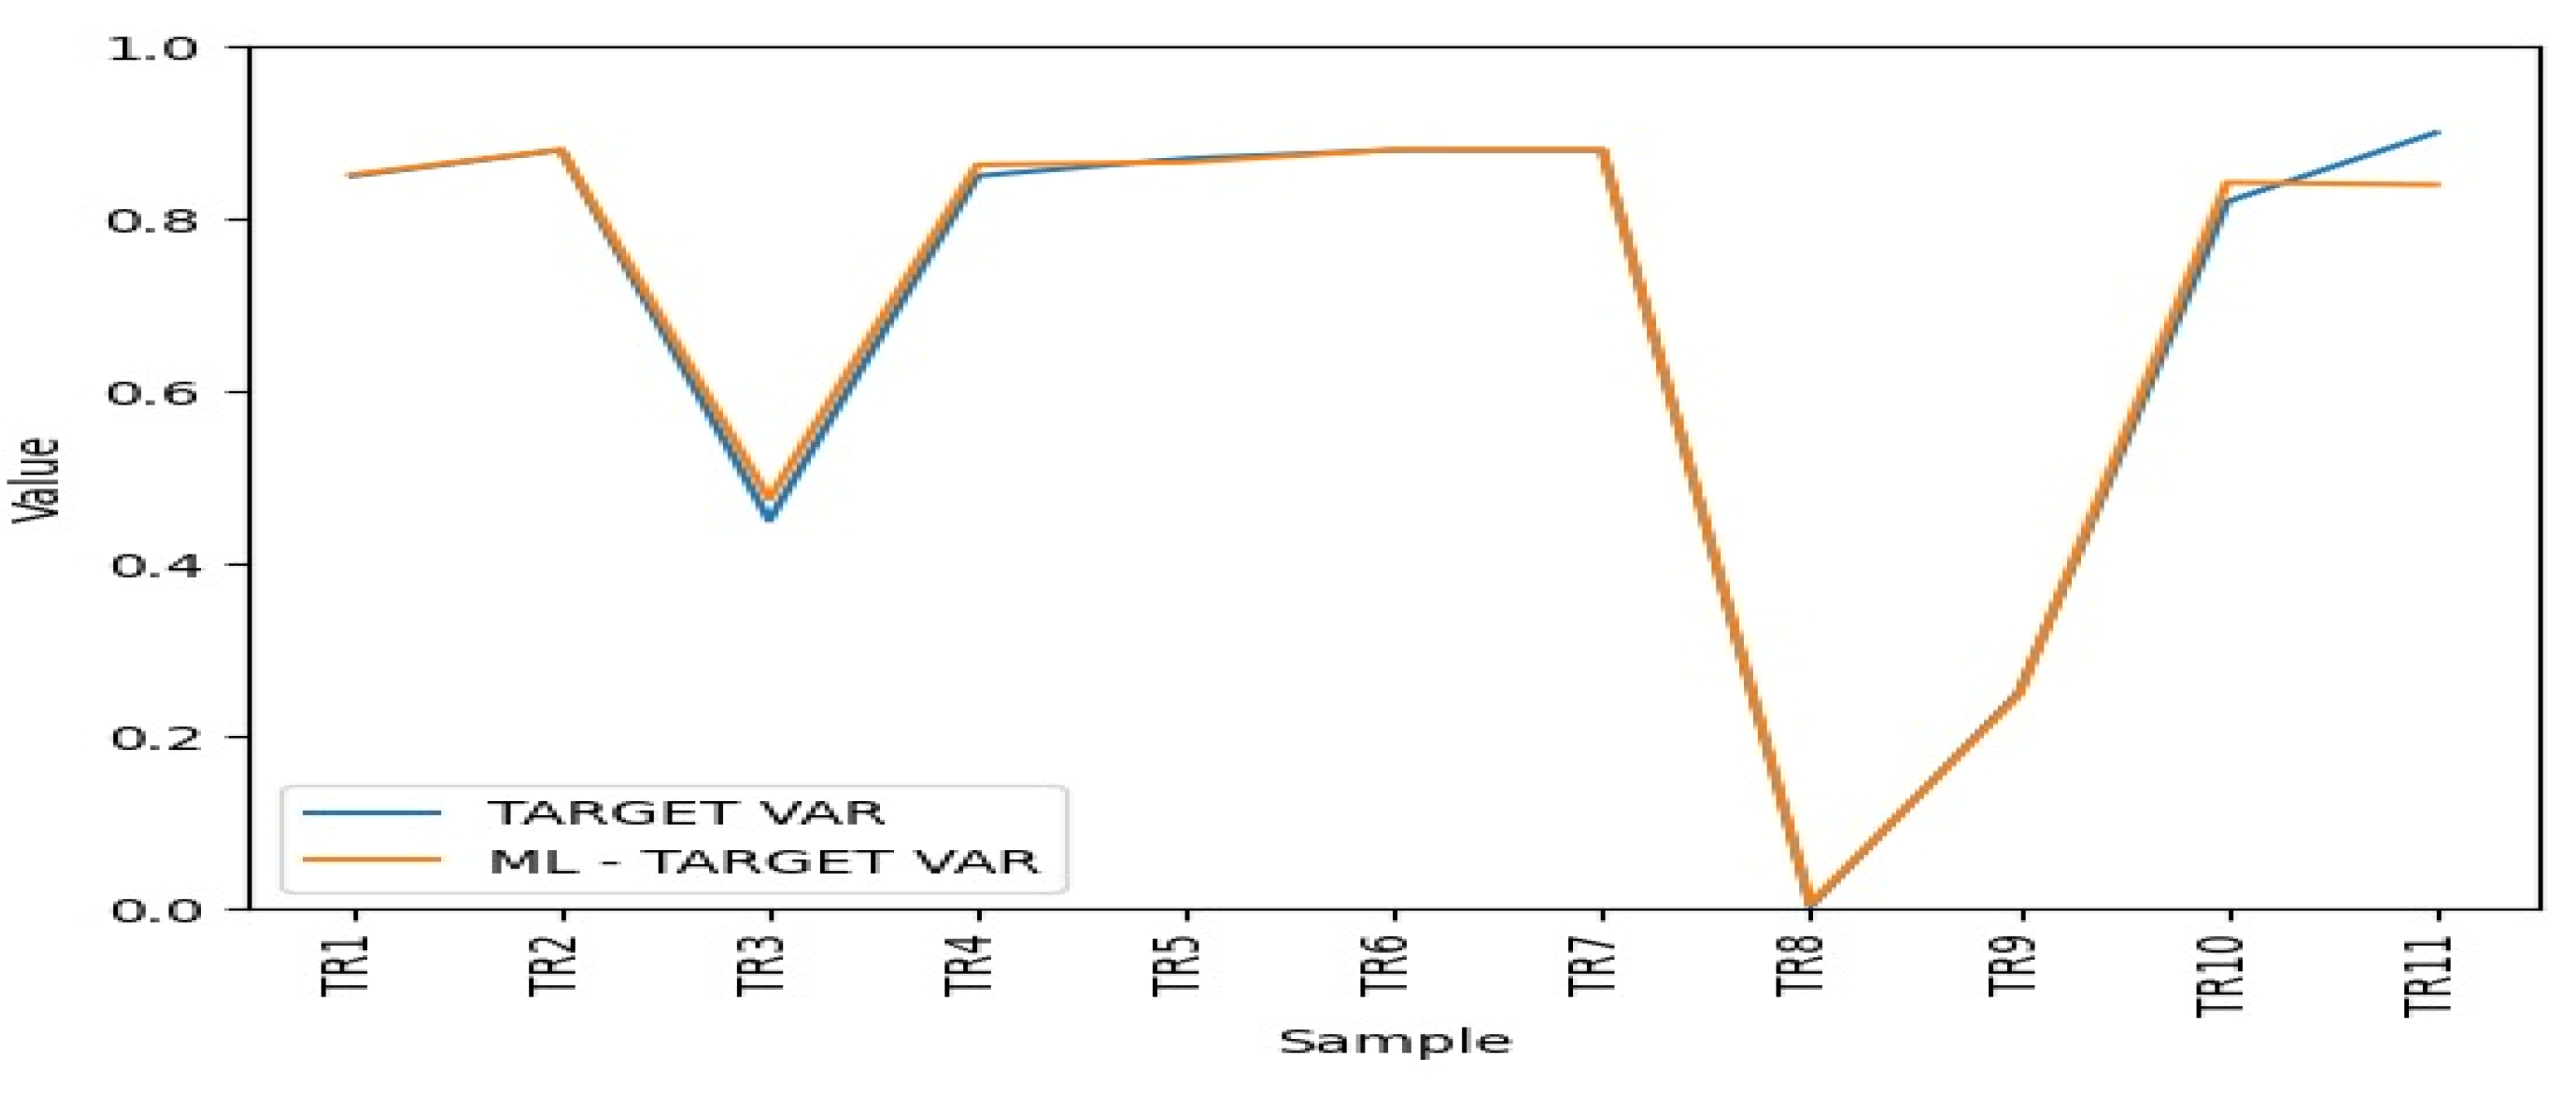
Figure 10.
Average efficiency scores of the proposed approaches.
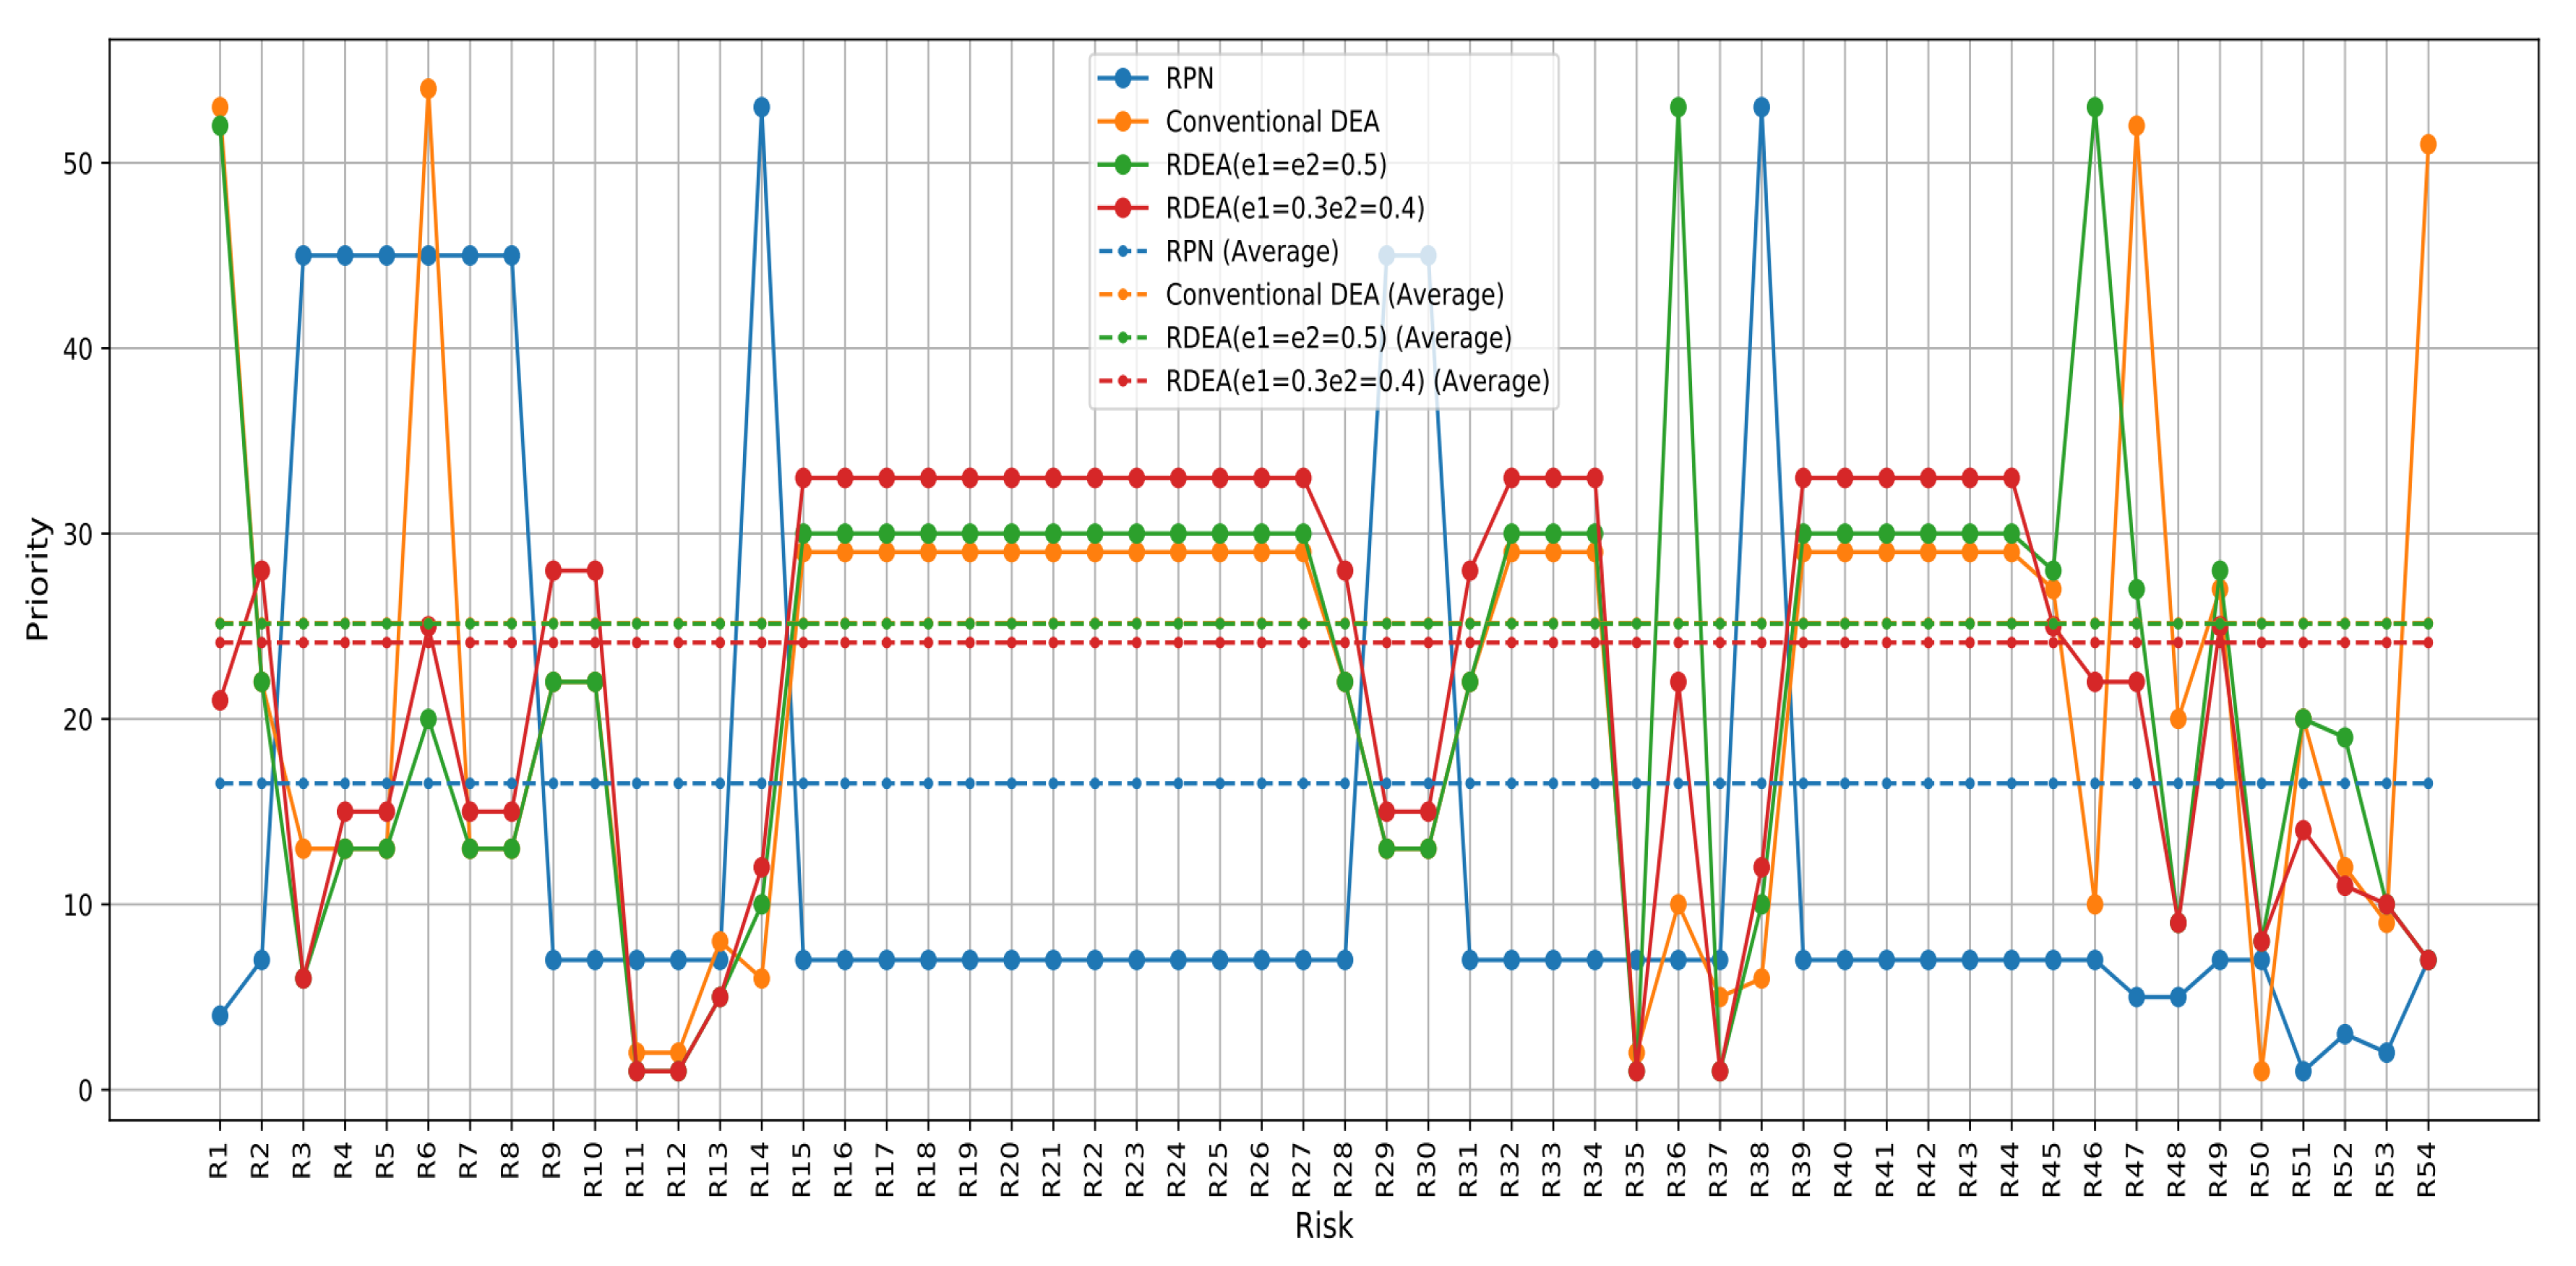

Table 1.
T Success and Failure Factors.
| Category | Factor | Success | Failure | ||
|---|---|---|---|---|---|
| Strategic | Focus to change | Readiness for change, courage and willpower |
Lack of readiness and resistance to change | ||
| Driver | methodology and framework |
selecting the best methodology and framework for the project | Lack of suitable and effective BPR framework and methodology | ||
| Enabler | working environment |
Collaborative and work towards shared objectives and targets |
Lack of collaborative working | ||
| strategic | Top management | Highly engaged, supportive, and committed | Lack of top management commitment |
||
| driver | BPR strategies, IT capabilities (IT integration, IT infrastructure and redesign, etc.) |
Aligned strategies | Lack of reliable advanced technology (IT) |
||
| enabler | Data | Data-driven change based on facts and figures |
Not having sufficient data | ||
| enabler | Culture | Flat and less bureaucratic Structure | Poor leadership style | ||
| enabler | communication | effective communication, motivation |
Lack of communication with all stakeholders | ||
| strategic | financial support |
Adequate financial support | inadequate financial support | ||
| driver | Business needs analysis |
Customer focus |
Inadequate business case: unclear, unreasonable, unrealistic scope, and unjustifiable expectations from the BPR project | ||
| enabler | BPR team | effective and skilled BPR team Training, education, fair reward system Provided to all levels |
Lack of training and education and fair reward |
Table 2.
Score of outputs cost and duration.
| Score | BD-COST (euro) |
BD-DURATION (day) |
|---|---|---|
| 1 2 3 4 5 |
≤100 ]100,500] ]500,3000] ]3000,6000] >6000 |
≤1 ]1,3] ]3,5] ]5,6] >6 |
Table 3.
outputs undesirable values.
| S | O | D | BD-COST | BD-DURATION | INDESIRABLE BD-COST | INDESIRABLE BD-DURATION |
|---|---|---|---|---|---|---|
| 6 9 8 8 8 8 8 8 9 9 6 6 6 6 6 6 6 6 6 6 6 6 6 6 6 6 6 9 8 8 9 6 6 6 6 6 6 6 6 6 6 6 6 6 6 6 6 9 6 6 6 9 9 9 |
6 2 2 2 2 2 2 2 2 2 2 2 2 2 2 2 2 2 2 2 2 2 2 2 2 2 2 2 2 2 2 2 2 2 2 2 2 2 2 2 2 2 2 2 2 2 3 2 2 2 7 3 2 2 |
3 2 2 2 2 2 2 2 2 2 3 3 3 2 3 3 3 3 3 3 3 3 3 3 3 3 3 2 2 2 2 3 3 3 3 3 3 2 3 3 3 3 3 3 3 3 3 3 3 3 5 5 10 2 |
1 1 1 1 1 3 1 1 1 1 3 3 4 1 1 1 1 1 1 1 1 1 1 1 1 1 1 1 1 1 1 1 1 1 3 4 3 1 1 1 1 1 1 1 5 4 1 3 5 4 4 5 5 5 |
1 1 2 1 1 2 1 1 1 1 4 4 4 1 1 1 1 1 1 1 1 1 1 1 1 1 1 1 1 1 1 1 1 1 1 2 1 1 1 1 1 1 1 1 3 2 1 2 3 2 2 2 3 3 |
428 440 440 443 443 433 443 443 440 440 302 302 433 424 427 427 427 427 427 427 427 427 427 427 427 427 427 440 443 443 440 427 427 427 302 255 349 424 427 427 427 427 427 427 427 255 417 437 423 417 418 412 477 447 |
155 182 182 179 179 180 179 179 182 182 107 107 182 180 173 173 173 173 173 173 173 173 173 173 173 173 173 182 179 179 182 173 173 173 107 125 131 180 173 173 173 173 173 173 173 125 173 173 173 169 170 171 123 73 |
Table 4.
Risk Prioritization by using PFMEA-RDEA Approach.
| Risks | RPN | Conventional DEA | RDEA(e1=e2=0.5) | RDEA(e1=0.3e2=0.4) | ||||||
|---|---|---|---|---|---|---|---|---|---|---|
| Score | Priority | Score | Priority | Score | Priority | Score | Priority | |||
| R1 R2 R3 R4 R5 R6 R7 R8 R9 R10 R11 R12 R13 R14 R15 R16 R17 R18 R19 R20 R21 R22 R23 R24 R25 R26 R27 R28 R29 R30 R31 R32 R33 R34 R35 R36 R37 R38 R39 R40 R41 R42 R43 R44 R45 R46 R47 R48 R49 R50 R51 R52 R53 R54 |
108 36 32 32 32 32 32 32 36 36 36 36 36 24 36 36 36 36 36 36 36 36 36 36 36 36 36 36 32 32 36 36 36 36 36 36 36 24 36 36 36 36 36 36 36 36 54 54 36 36 210 135 180 36 |
4 7 45 45 45 45 45 45 7 7 7 7 7 53 7 7 7 7 7 7 7 7 7 7 7 7 7 7 45 45 7 7 7 7 7 7 7 53 7 7 7 7 7 7 7 7 5 5 7 7 1 3 2 7 |
0.87 0.77 0.65 0.65 0.65 0.89 0.65 0.65 0.77 0.77 0.18 0.18 0.45 0.38 0.81 0.81 0.81 0.81 0.81 0.81 0.81 0.81 0.81 0.81 0.81 0.81 0.81 0.77 0.65 0.65 0.77 0.81 0.81 0.81 0.18 0.57 0.23 0.38 0.81 0.81 0.81 0.81 0.81 0.81 0.8077 0.5700 0.8541 0.71 0.8077 0.09998 0.71 0.6 0.54381 0.843221 |
53 22 13 13 13 54 13 13 22 22 2 2 8 6 29 29 29 29 29 29 29 29 29 29 29 29 29 22 13 13 22 29 29 29 2 10 5 6 29 29 29 29 29 29 27 10 52 20 27 1 20 12 9 51 |
0.9000000000000004 0.8300000000000001 0.5 0.7999999999999998 0.7999999999999998 0.8200000000000003 0.7999999999999998 0.7999999999999998 0.8300000000000001 0.8300000000000001 0.05252000000000123 0.0525200000000123 0.1999999999999993 0.7699999999999996 0.8999999999999986 0.8999999999999986 0.8999999999999986 0.8999999999999986 0.8999999999999986 0.8999999999999986 0.8999999999999986 0.8999999999999986 0.8999999999999986 0.8999999999999986 0.8999999999999986 0.8999999999999986 0.8999999999999986 0.8300000000000001 0.7999999999999998 0.7999999999999998 0.8300000000000001 0.8999999999999986 0.8999999999999986 0.8999999999999986 0.05252000000000123 0.9199999999999999 0.05252000000000123 0.7699999999999996 0.8999999999999986 0.8999999999999986 0.8999999999999986 0.8999999999999986 0.8999999999999986 0.8999999999999986 0.8769999999999989 0.9199999999999999 0.8655000000000008 0.7403200000000005 0.8769999999999989 0.6589999999999989 0.8240000000000016 0.8000000000000007 0.7654899999999998 0.5413899999999998 |
52 22 6 13 13 20 13 13 22 22 1 1 5 10 30 30 30 30 30 30 30 30 30 30 30 30 30 22 13 13 22 30 30 30 1 53 1 10 30 30 30 30 30 30 28 53 27 9 28 8 20 19 10 7 |
0.8500000000000003 0.8800000000000001 0.44999999999999996 0.8499999999999999 0.8499999999999999 0.8700000000000003 0.8499999999999999 0.8499999999999999 0.8800000000000001 0.8800000000000001 0.0025200000000012157 0.0025200000000012157 0.2499999999999993 0.8199999999999996 0.8999999999999986 0.8999999999999986 0.8999999999999986 0.8999999999999986 0.8999999999999986 0.8999999999999986 0.8999999999999986 0.8999999999999986 0.8999999999999986 0.8999999999999986 0.8999999999999986 0.8999999999999986 0.8999999999999986 0.8800000000000001 0.8499999999999999 0.8499999999999999 0.8800000000000001 0.8999999999999986 0.8999999999999986 0.8999999999999986 0.0025200000000012157 0.8699999999999999 0.0025200000000012157 0.8199999999999996 0.8999999999999986 0.8999999999999986 0.8999999999999986 0.8999999999999986 0.8999999999999986 0.8999999999999986 0.8769999999999989 0.8699999999999999 0.8655000000000008 0.7403200000000005 0.8769999999999989 0.6589999999999989 0.8240000000000016 0.8000000000000007 0.7654899999999998 0.5413899999999998 |
21 28 6 15 15 25 15 15 28 28 1 1 5 12 33 33 33 33 33 33 33 33 33 33 33 33 33 28 15 15 28 33 33 33 1 22 1 12 33 33 33 33 33 33 25 22 22 9 25 8 14 11 10 7 |
||
Table 5.
The average efficiency scores based on the criteria.
| RDEA Score | ML Score | ERROR |
|---|---|---|
| 0.8500000000000003 0.8800000000000001 0.44999999999999996 0.8499999999999999 0.8700000000000003 0.8800000000000001 0.8800000000000001 0.0025200000000012157 0.2499999999999993 0.8199999999999996 0.8999999999999986 |
0.8514999999999994 0.8804196522776031 0.4746742857142863 0.8628437016205744 0.8658000000000005 0.8804196522776031 0.8804196522776031 0.0049948000000000015 0.2475252 0.8423190166500167 0.8398135963221486 |
0.001 0.0004 0.02 0.01 0.005 0.0005 0.0005 0.002 0.002 0.01 0.05 |
Disclaimer/Publisher’s Note: The statements, opinions and data contained in all publications are solely those of the individual author(s) and contributor(s) and not of MDPI and/or the editor(s). MDPI and/or the editor(s) disclaim responsibility for any injury to people or property resulting from any ideas, methods, instructions or products referred to in the content. |
© 2024 by the authors. Licensee MDPI, Basel, Switzerland. This article is an open access article distributed under the terms and conditions of the Creative Commons Attribution (CC BY) license (http://creativecommons.org/licenses/by/4.0/).
Copyright: This open access article is published under a Creative Commons CC BY 4.0 license, which permit the free download, distribution, and reuse, provided that the author and preprint are cited in any reuse.


