
Submitted:
31 May 2024
Posted:
31 May 2024
You are already at the latest version
Abstract
In order to make full use of the complementarity of existing navigation systems to improve the navigation and positioning accuracy, this paper investigates the visual/INS integrated navigation system based on the factor graph optimization (FGO) algorithm. In the traditional visual/INS integrated navigation system, there is often the problem of image blurring due to the rapid change of light and shadow captured by the vision sensor and the attitude change of the carrier, which leads to the decrease of the positioning accuracy of the combined navigation system. Therefore, this paper firstly introduces Retinex algorithm and BID algorithm to carry out the design of image de-blurring method; then implements the visual/INS integrated navigation algorithm based on the factor graph optimization method; finally, the experimental scheme is designed, comparative experiments are carried out, and the researched method is verified by using the public dataset. The experimental results show that the combined navigation algorithm realized in this paper has high accuracy, and its positioning accuracy is improved by 40% compared with visual positioning.
Keywords:
Visual/INS integrated navigation
; Image de-blurring
; Factor graph optimization (FGO)
; Nonlinear optimization
; Multi-sensor fusion
1. Introduction
Since the navigation and positioning information is the basic information to realize the functions of control, obstacle avoidance, path planning, the research on navigation and positioning system has become a research hotspot in the field of unmanned vehicle. Users' demands for navigation and positioning systems are mainly: high accuracy, high reliability, high real-time and high availability. Currently, there are three main types of navigation and positioning systems: 1) Global Navigation Satellite System (GNSS), which has high positioning accuracy, stable error, and can provide continuous real-time high-precision positioning information in the outdoor open area, but it is easily affected by the environmental impacts such as building obstruction and wall reflections; 2) Inertial Navigation System (INS), which has good anti-interference ability, high short-term accuracy, but the error accumulation is fast; 3) visual navigation and positioning system, which can provide rich environmental information and can directly estimate the position, but is easily affected by environmental interference. Because of the limitations of the above navigation systems, multi-sensor fusion localization technology came into being [1].
Multi-sensor fusion localization refers to synthesizing information from different sensors describing a certain target or environmental feature to achieve high-precision localization. This technique can overcome the limitations of using single sensor information for positioning, make full use of the complementary nature of each information source, and continuously and robustly output high-precision navigation information. The more mature data fusion algorithms can be summarized as filter-based methods and optimization-based methods [2,3]. Data fusion based on filtering commonly used Extended Kalman Filter (EKF), the method in the Jacobian matrix linearization stage, only retains the Taylor series first-order information, can not make full use of the historical information and the EKF storage and the state volume is the relationship between the square growth, is not suitable for large-scale scenarios [4] . Optimization-based methods use IMU data and image measurements to jointly minimize the residuals to obtain the optimal estimate, and jointly optimize the information of all moments of the system to make the system's position estimation more accurate. [5]. Compared with the filter-based method, this method has stronger robustness and higher positioning accuracy. It is able to improve navigation accuracy by iteratively reducing the linearization error and using all historical information for optimization.
Compared with GNSS, INS and visual sensors have the advantages of small size, light weight and low power consumption. [6] In this paper, a stereo camera is chosen as the visual sensor, and the visual/INS integrated navigation technology is investigated by using the factor graph optimization method.
5. Experimental Verification
5.1 Image De-blurring Algorithm Validation
In order to verify the effectiveness of the image de-blurring algorithm proposed in this paper, three sets of images were selected from different public datasets for image de-blurring. Evaluation was conducted based on de-blurring results before and after image processing, image standard deviation, average gradient of the images, and feature point extraction and matching.
Using image standard deviation and average gradient to evaluate image quality is a common practice. Standard deviation and average gradient are commonly used indicators to verify image quality. Among them: the standard deviation reflects the degree of dispersion of the image pixel values from the mean value, the larger the standard deviation indicates the better the quality of the image; the average gradient reflects the clarity of the image and the texture changes, the larger the average gradient indicates the clearer the image is [15]. Calculate the standard deviation and average gradient of each group of image original and processed by algorithm as shown in Table 1 and Table 2.
As can be seen from Table 1, the standard deviation of the three groups of images after de-blurring is greater than the standard deviation before de-blurring, indicating that the image de-blurring algorithm proposed in this paper has a better de-blurring ability.
As can be seen from Table 2, the average gradient of the three groups of images after de-blurring is larger than the average gradient before de-blurring, indicating that the clarity of the images processed by the image de-blurring algorithm proposed in this paper has been improved.
Table 3 and table 4 give the matching and time required for extracting and matching the ORB feature points of the original images and the three groups of images processed by the proposed algorithm in this paper, and Fig. 7 shows the feature matching interface before and after de-blurring the first group of images visualized by OpenCV [16].
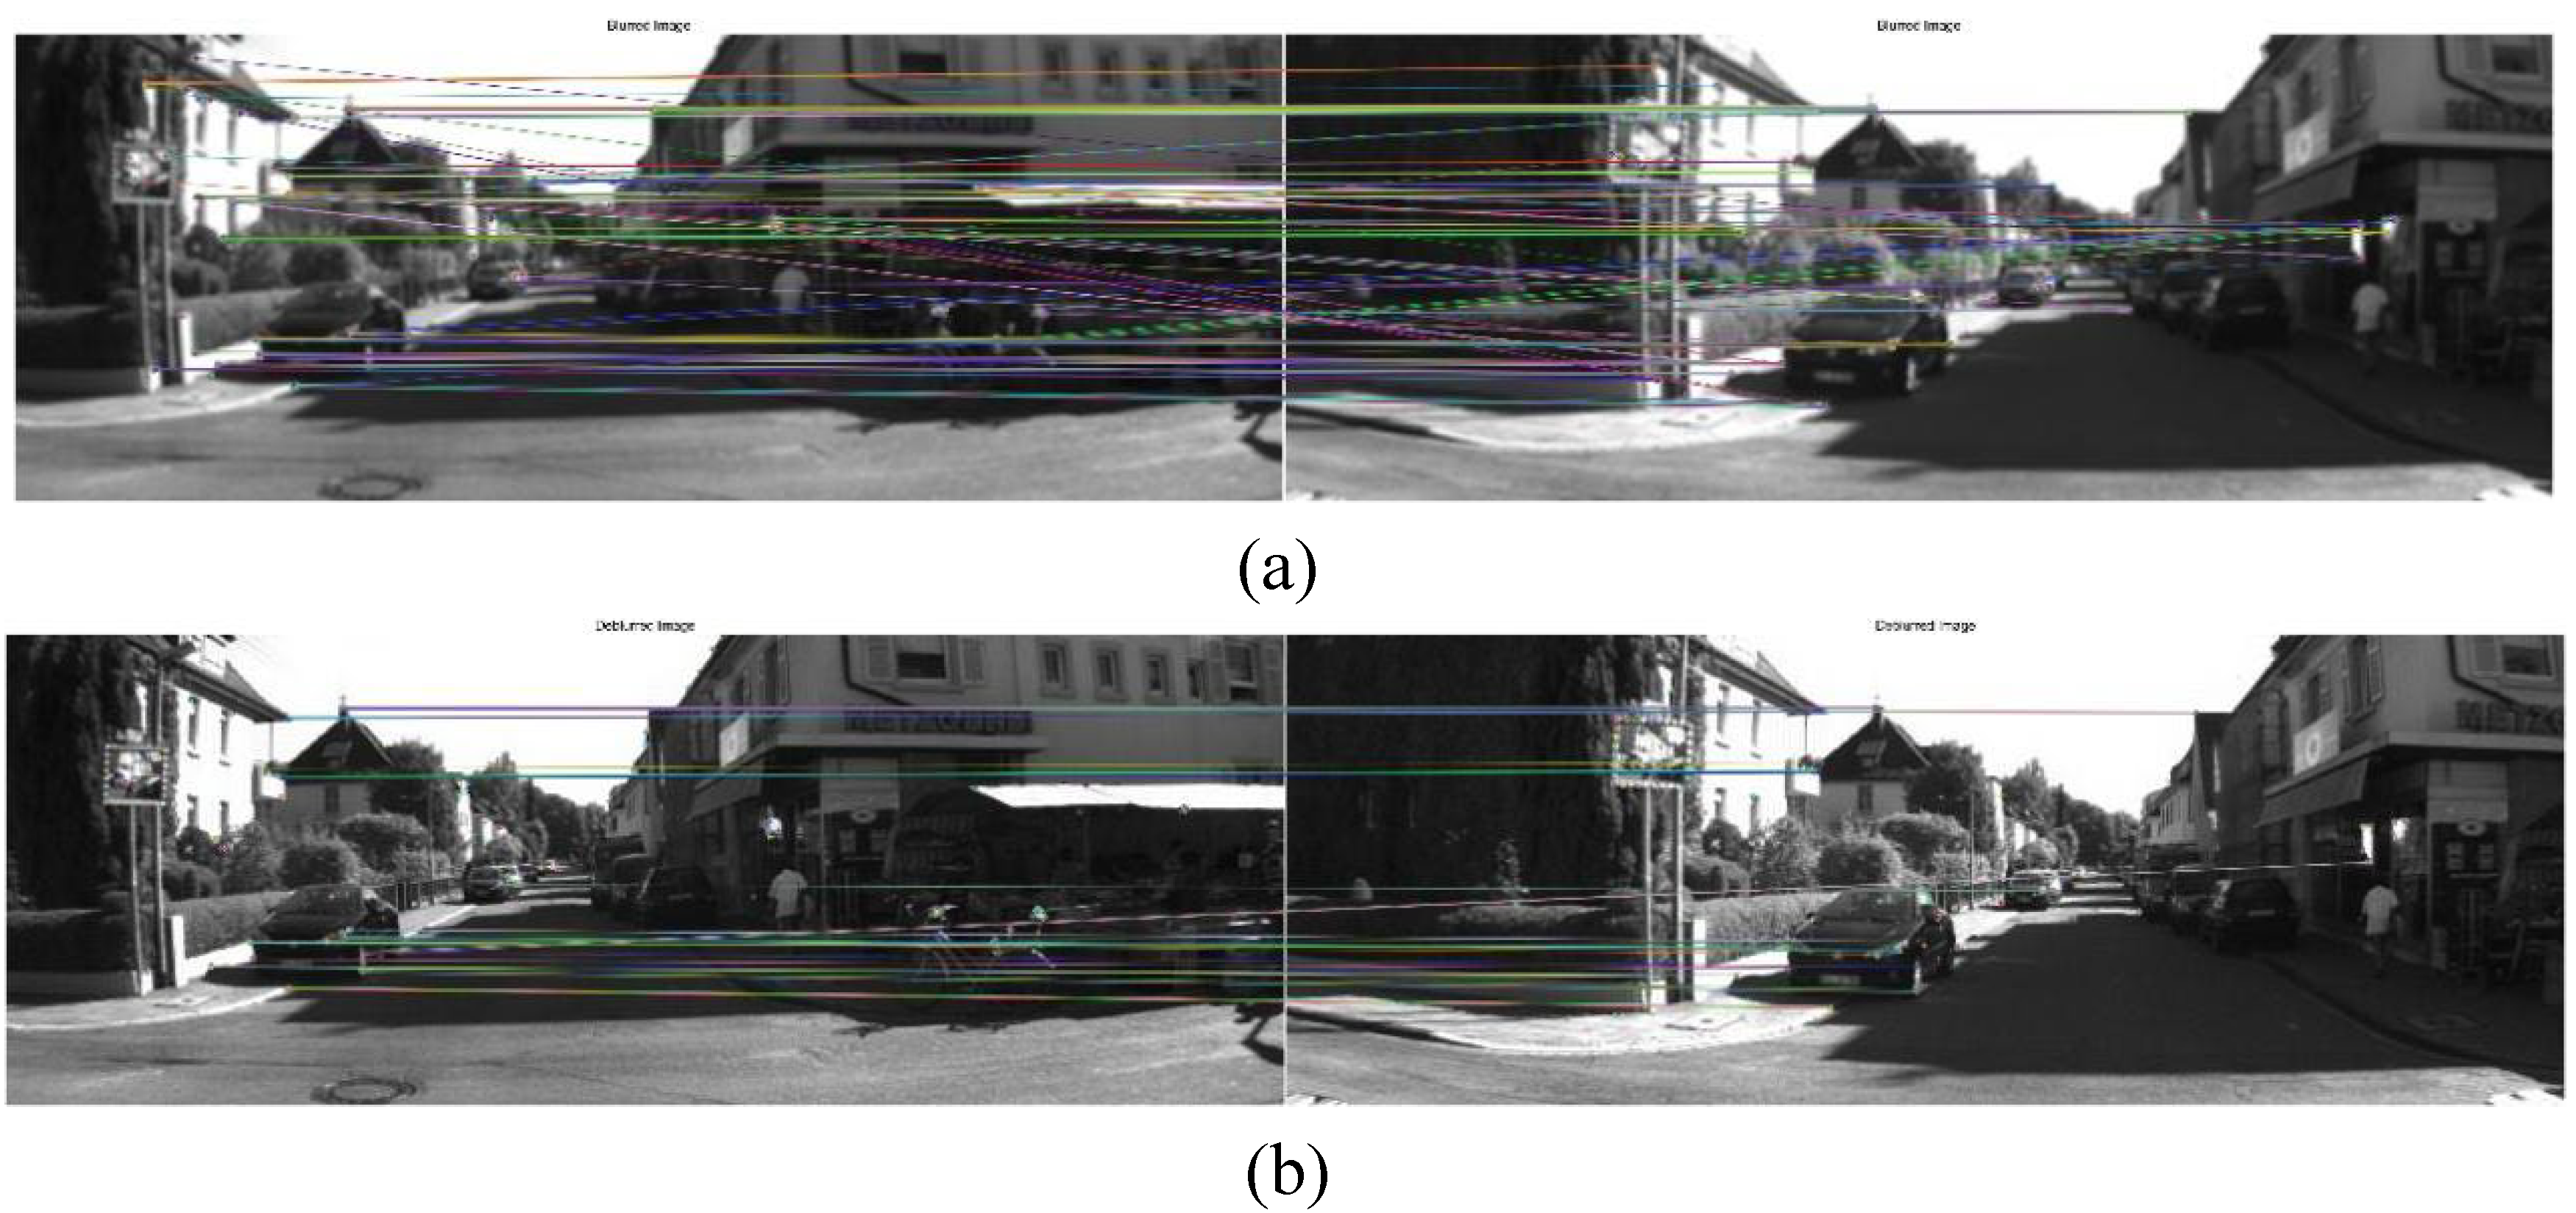
Figure 7.
The feature matching of the first group of images before and after de-blurring(a)Image feature matching before de-blurring;(b)Image feature matching after de-blurring.From the results of feature extraction and matching, it can be observed that the logarithm of feature matching pairs and the time required for feature matching after deblurring three sets of images are smaller than before deblurring. This indicates that the image deblurring algorithm proposed in this paper can effectively improve the efficiency and accuracy of feature matching.
Figure 7.
The feature matching of the first group of images before and after de-blurring(a)Image feature matching before de-blurring;(b)Image feature matching after de-blurring.From the results of feature extraction and matching, it can be observed that the logarithm of feature matching pairs and the time required for feature matching after deblurring three sets of images are smaller than before deblurring. This indicates that the image deblurring algorithm proposed in this paper can effectively improve the efficiency and accuracy of feature matching.
5.2. Validation of Visual/INS Integrated Navigation Algorithm Performance
To validate the positioning accuracy of the visual/INS integrated navigation based on factor graph optimization proposed in this paper, simulation experiments are conducted using open source datasets.
The dataset used in this paper is the EuRoC MAV dataset, which is collected from an AscTec Firefly UAV equipped with a stereo camera and an IMU. The camera model is MT9V034 with a frame rate of 20 Hz, and the IMU model is ADIS16448 with a frame rate of 200 Hz. The motion trajectory of the UAV was measured using a total station and motion capture system, with positioning accuracy at the sub-millimeter level, serving as ground truth for evaluating the positioning accuracy of the system proposed in this paper. The MH_01 dataset with rich texture was selected for validation. The physical diagram of the data collection platform is shown in Figure 8.
The single visual localization algorithm and the visual/INS integrated localization algorithm were run on the above data sequences to analyze the localization effect of each algorithm. The comparison graph of its localization results with the true value trajectory is shown in Figure 9.
From Figure 9 and Table 5, it can be seen that the algorithm in this paper can accurately track the estimated trajectory truth value, and its average absolute position error is about 0.02m, which is about 40% higher than that of the single visual navigation; the root mean square error is about 0.02m, which is about 45% higher than that of the single visual navigation; and the maximum error is not exceeded by 0.08m. In conclusion, the visual/INS integrated localization system designed in this paper can effectively tracking the carrier position state, and has higher positioning accuracy and higher robustness than the single vision localization system.
6. Conclusions
In order to overcome the limitations of single navigation system positioning and better meet the user's demand for positioning accuracy, this paper designs a vision/INS integrated navigation algorithm based on factor graph optimization. Firstly, to address the problem of decreased positioning accuracy of combined navigation due to image blurring in traditional visual/INS integrated navigation, the Retinex algorithm combined with the BID algorithm is used to de-blur the image; then, by deriving the objective function of the factor graph optimization, the nonlinear optimization problem is transformed into a least-squares problem and the LM algorithm is used to obtain the minimum error with multiple iterations, so as to realize the optimization of combined visual/INS navigation algorithm based on factor graph optimization, which results in the optimal navigation accuracy. of the vision/INS integrated navigation algorithm to optimize the navigation accuracy. Finally, experimental validation is carried out using public datasets, and the results show that the vision/INS integrated navigation algorithm designed in this paper improves the positioning accuracy by about 40% compared with the single vision algorithm, and has high accuracy and robustness.
Author Contributions
Conceptualization, X.C. and Y.W.; methodology, X.C.; software, X.C.; validation, X.C., Y.W.; formal analysis, X.C.; investigation, X.C.; resources, Y.W.; data curation, X.C.; writing—original draft preparation, X.C; writing—review and editing, Y.W.; visualization, X.C.; supervision, Y.W. All authors have read and agreed to the published version of the manuscript.
Data Availability Statement
The data presented in this study are available on request from the
Conflicts of Interest
The authors declare no conflicts of interest.
References
- Dingjie Wang.Research on dynamic initial alignment and real-time information fusion method of GNSS/MIMU combined navigation system [D]. National University of Defense Technology,2013.
- QI Nai-Xin,ZHANG Sheng-Xiu,YANG Xiao-Gang,et al. Improved MSCKF algorithm based on multimode generalization of camera state equation [J]. Journal of Instrumentation,2019,40(05):89-98. [CrossRef]
- PAN Linhao,TIAN Fuqing,YING Wenjian,et al. Monocular camera-IMU external parameter auto-calibration and online estimation for vision-inertial guidance SLAM [J]. Journal of Instrumentation,2019,40(06):56-67. [CrossRef]
- Zhang J. Research on visual inertial localization method in dynamic environment [D]. Xi'an University of Technology,2022. [CrossRef]
- Sibley G, Matthies L, Sukhatme G. A sliding window filter for incremental SLAM [J]. Springer US, 2008: 103-112. [CrossRef]
- YANG Zi-Han,Lai Ji-Zhou,Lv Pin,et al. A robust visual/inertial localization method with parameterizable self-calibration [J]. Journal of Instrumentation,2021,42(07):259-267. [CrossRef]
- Tao Xiaowen. Research on multi-sensor fusion positioning strategy for intelligent vehicles based on graph optimization [D]. Jilin University,2022. [CrossRef]
- FANG Wenhui. Research on key technology of combined vision/inertial navigation for UAVs [D]. Southeast University, 2019. [CrossRef]
- Land E H E. Lightness and retinex theory. [J]. Journal of the Optical Society of America, 1971, 61(1):1-11. [CrossRef]
- Tomasi C, Manduchi R. Bilateral filtering for gray and color images [C]//In Proc. ICCV 1998, 839-846. [CrossRef]
- Gao Xiang. Fourteen lectures on vision SLAM: from theory to practice [M]. Electronic Industry Press, 2017.
- Forster C, Carlone L, Dellaert F, et al. IMU Preintegration on Manifold for Efficient Visual-inertial Maximum-a-Posteriori Estimation [J]. Georgia Institute of Technology, 2015, 33(2): 112-134.
- Lupton T, Sukkarieh S. Visual-inertial-aided navigation for high-dynamic motion in built environments without initial conditions [J]. IEEE Transactions on Robotics, 2011, 28(1): 61-76. [CrossRef]
- S. Leutenegger, S. Lynen, et al. Keyframe-Based Visual-Inertial SLAM Using Nonlinear Optimization [C]//International Journal of Robotics Research, 2015, 34(3): 314-334. [CrossRef]
- QI Huan,SHEN Weihe,CHEN Xi,et al. Image quality assessment based on gradient direction distribution and its application [J]. Aerospace Control,2018,36(06):9-13+24. [CrossRef]
- Bradski G. The openCV library [J]. Dr. Dobb's Journal: Software Tools for the Professional Programmer, 2000, 25(11): 120-123.
Figure 1.
Overall design of the visual/INS integrated navigation programme.
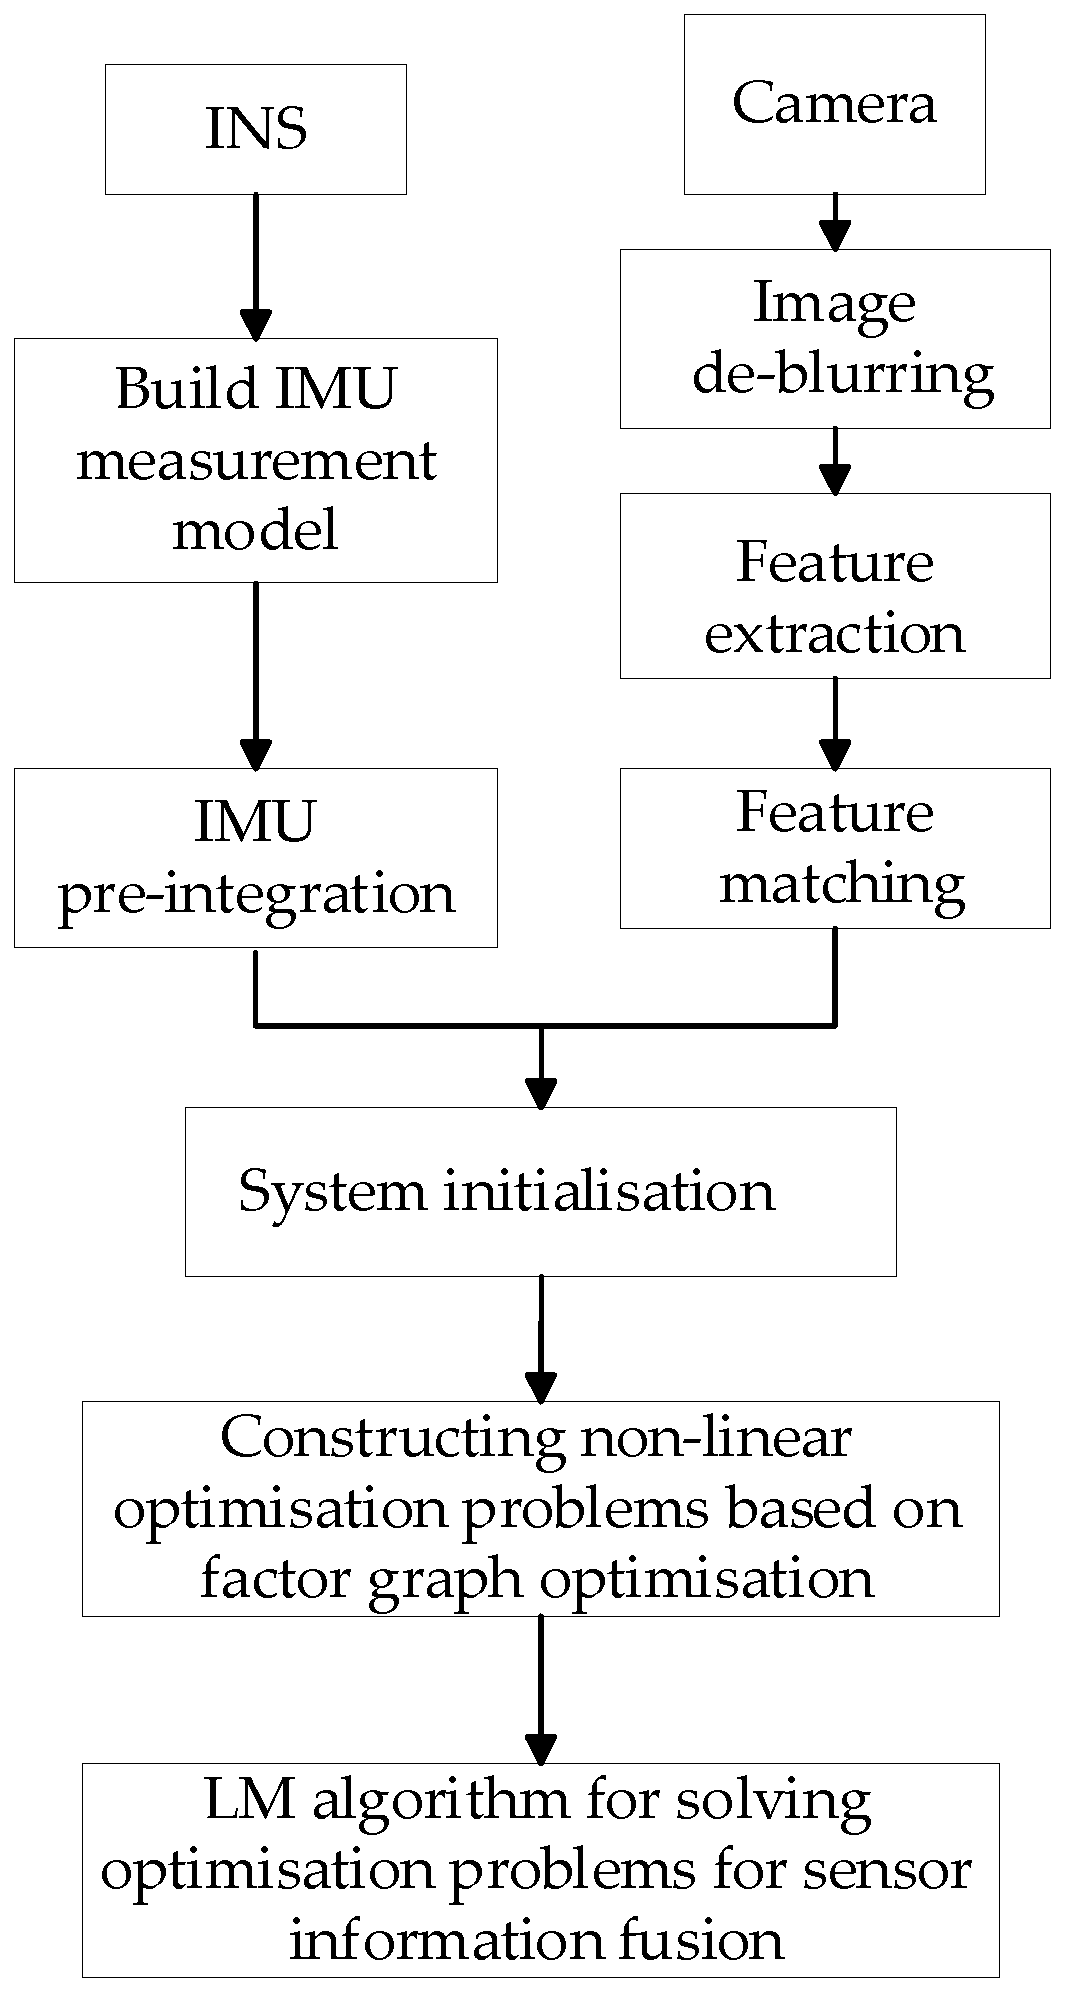
Figure 2.
Schematic diagram of IMU pre-integration.
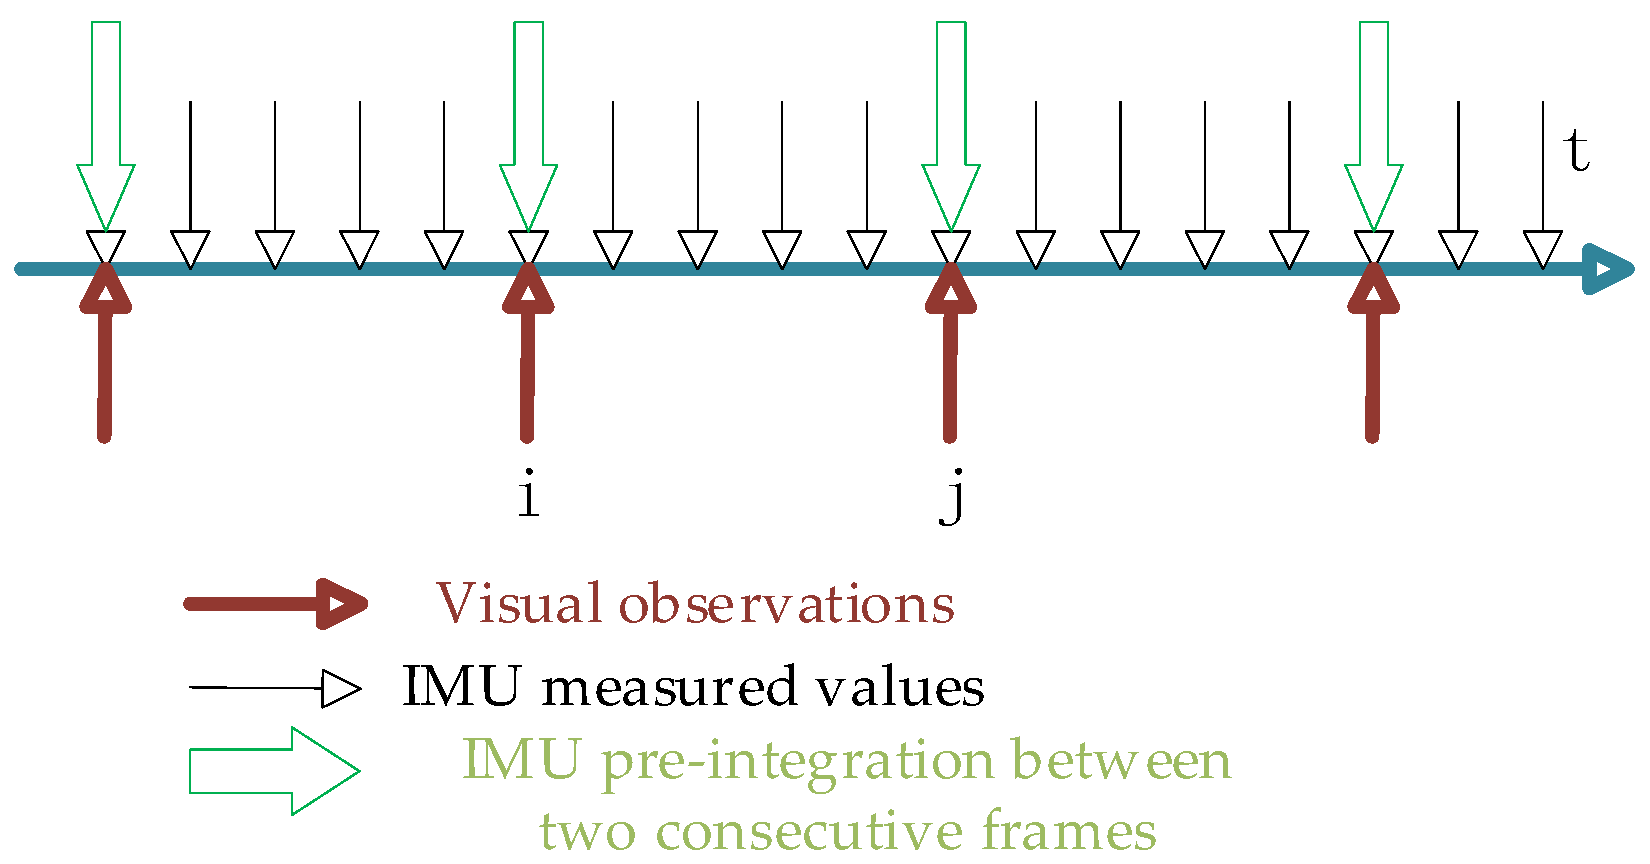
Figure 3.
Schematic diagram of factor graph optimization.
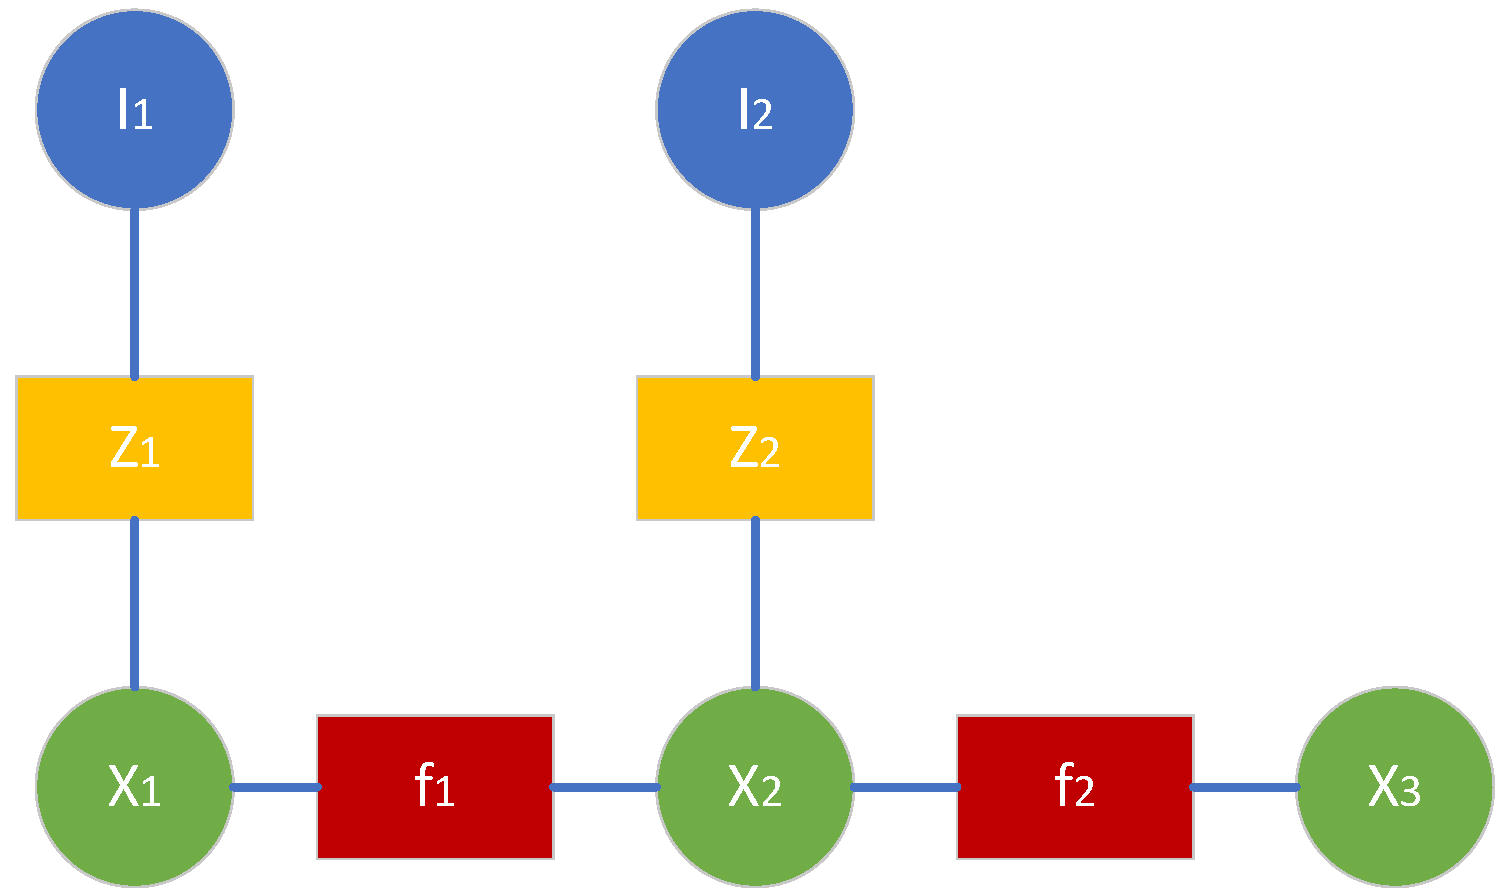
Figure 4.
Comparison of the first set of images before and after de-blurring(a)Image before de-blurring;(b) Image after de-blurring.
Figure 4.
Comparison of the first set of images before and after de-blurring(a)Image before de-blurring;(b) Image after de-blurring.
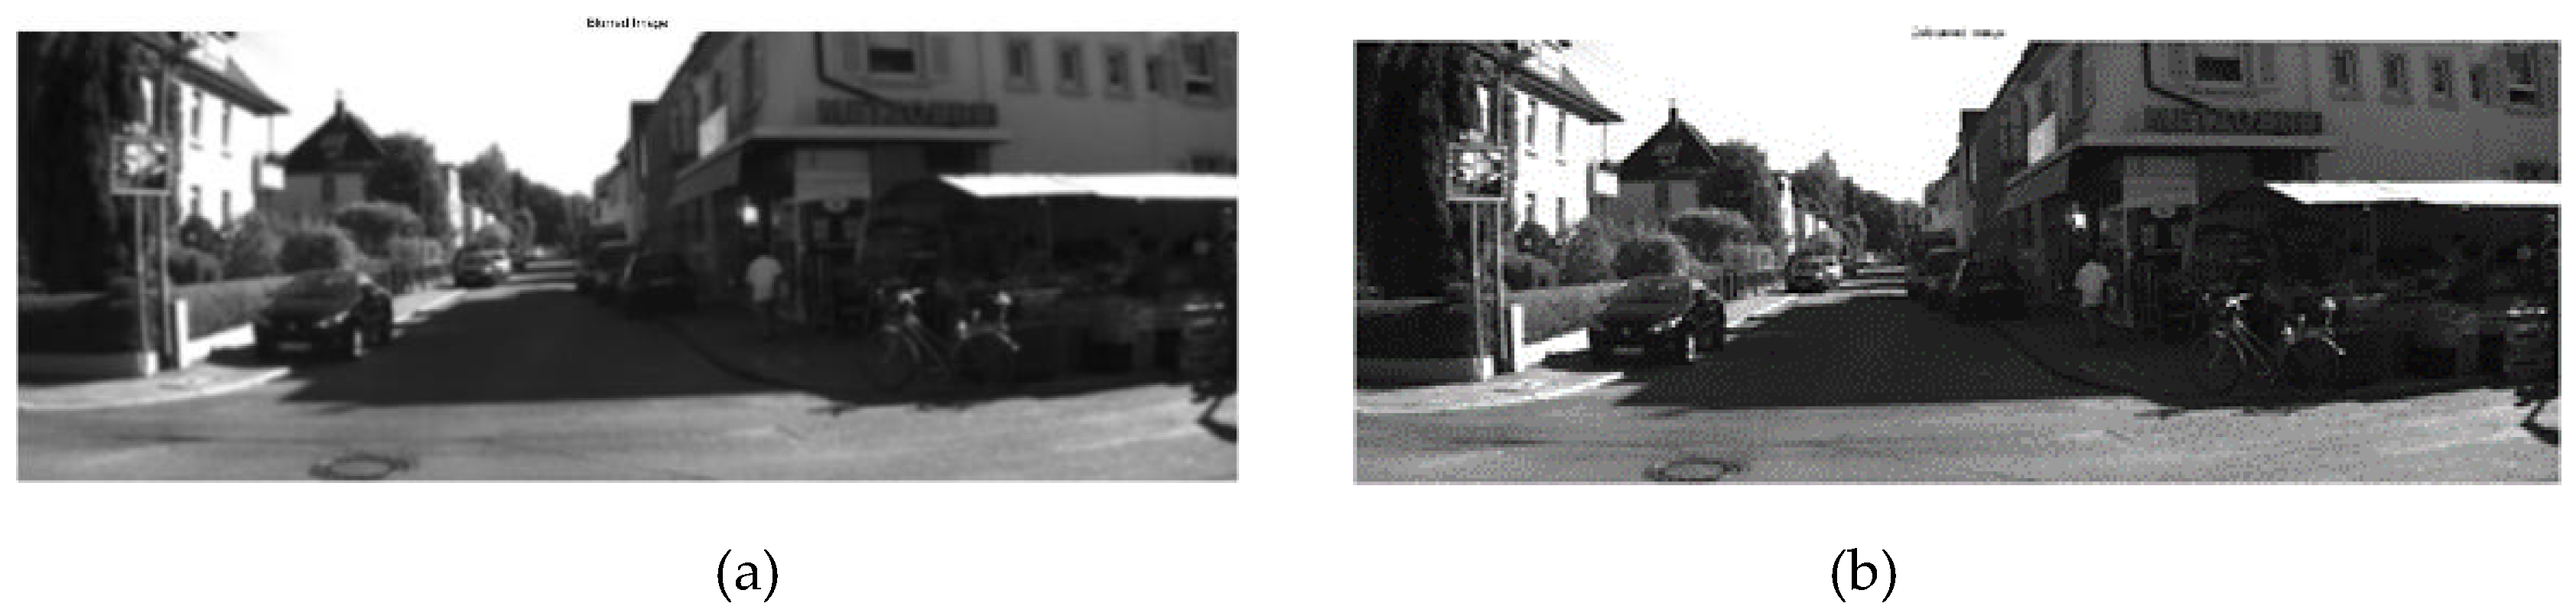
Figure 5.
Comparison of the second set of images before and after de-blurring(a)Image before de-blurring;( b) Image after de-blurring.
Figure 5.
Comparison of the second set of images before and after de-blurring(a)Image before de-blurring;( b) Image after de-blurring.
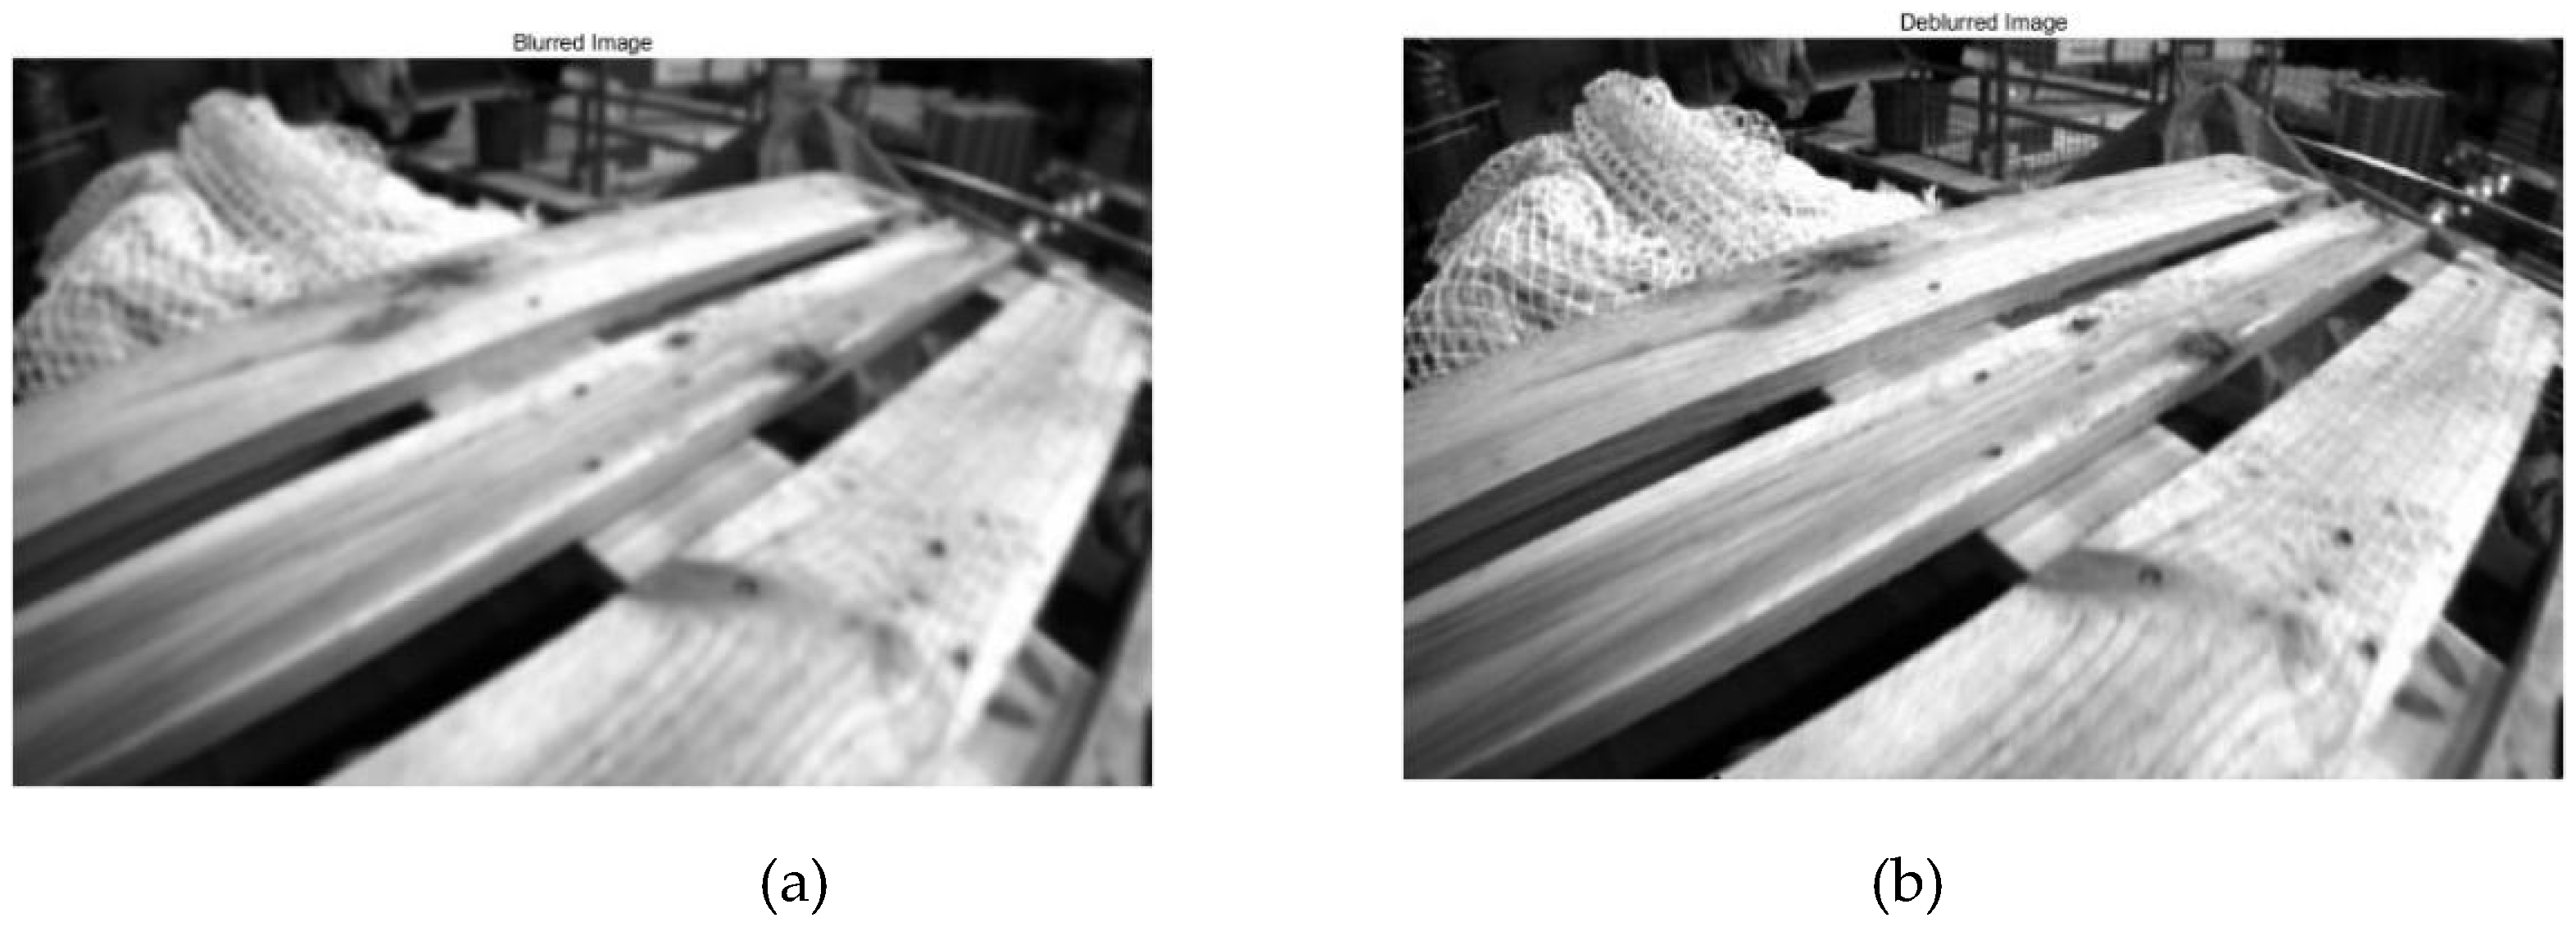
Figure 6.
Comparison of the third set of images before and after de-blurring(a) Image before de-blurring;(b) Image after de-blurring.
Figure 6.
Comparison of the third set of images before and after de-blurring(a) Image before de-blurring;(b) Image after de-blurring.
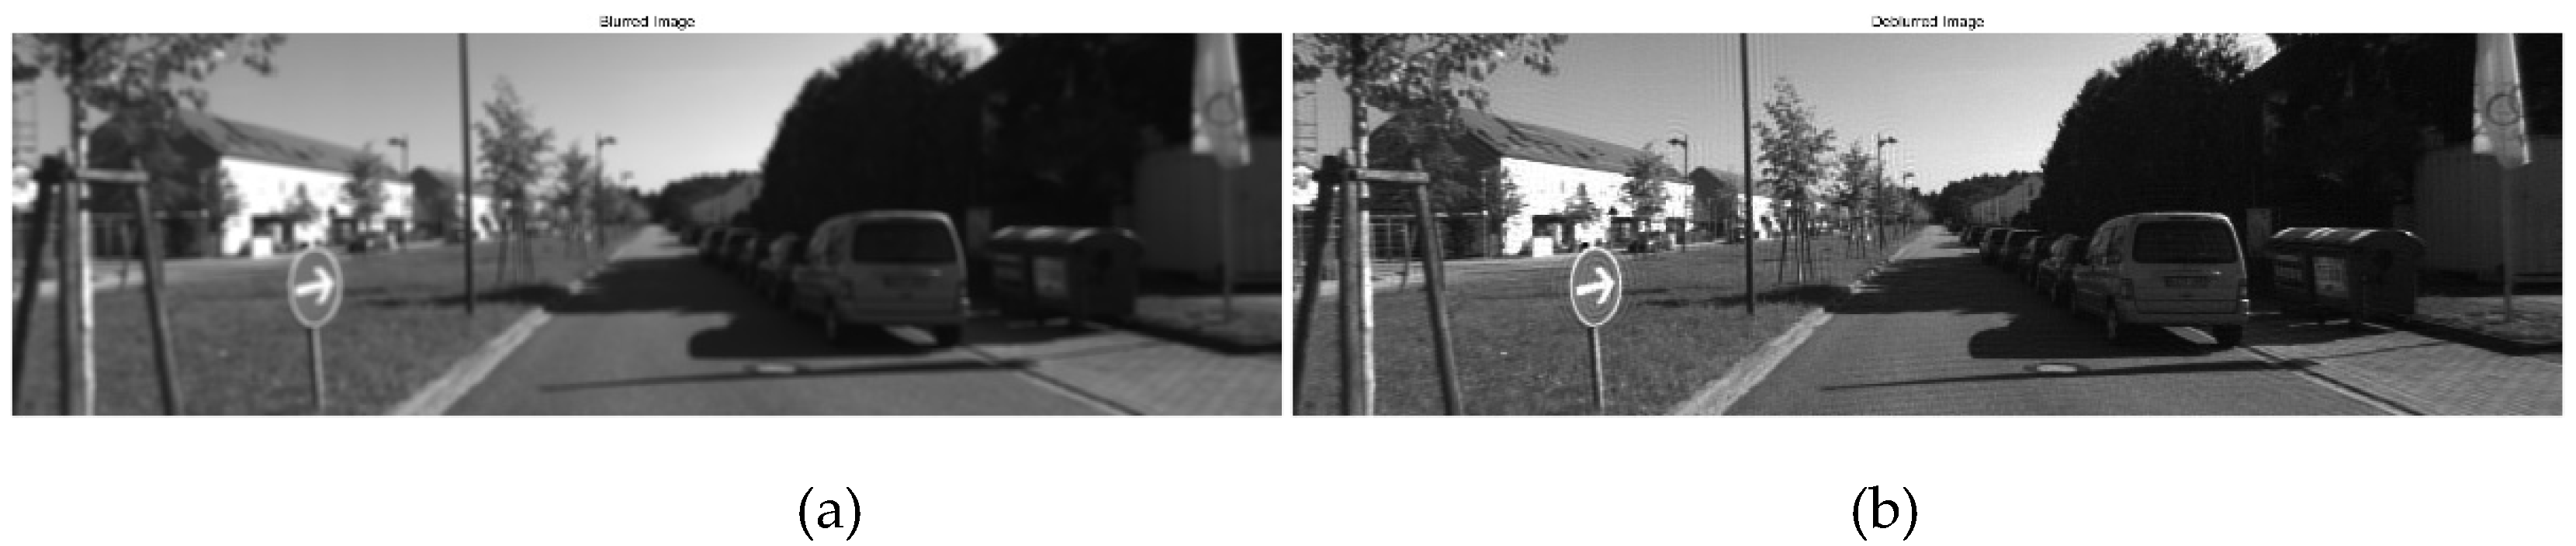
Figure 8.
Physical diagram of the data acquisition platform.
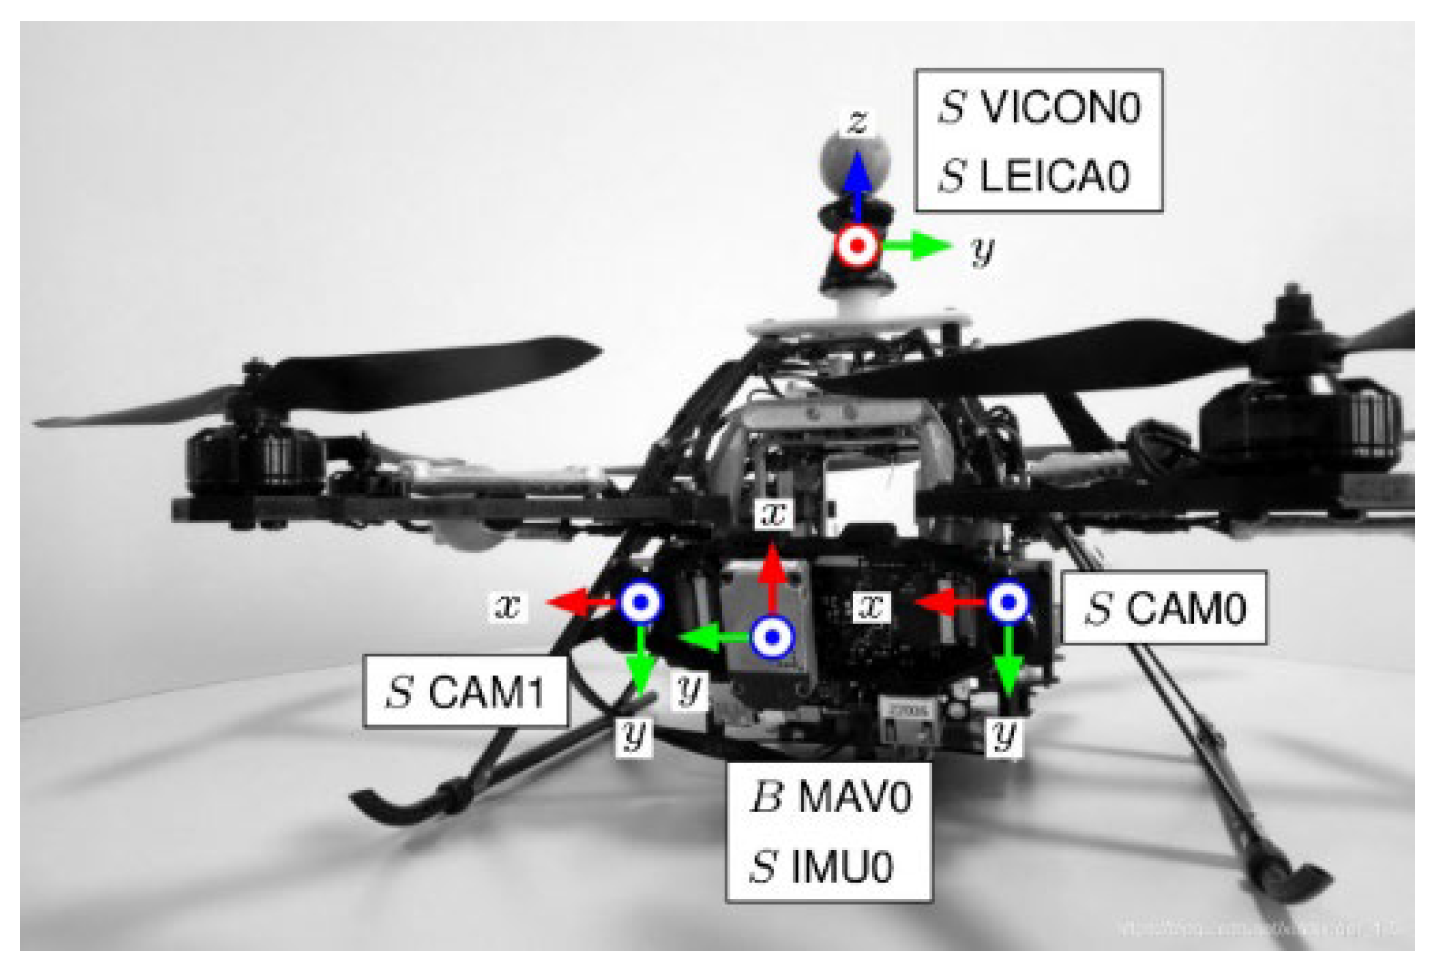
Figure 9.
Trajectory Comparison Chart(a) Single visual localization trajectory map;(b) Visual/INS integrated navigation localization trajectory map
Figure 9.
Trajectory Comparison Chart(a) Single visual localization trajectory map;(b) Visual/INS integrated navigation localization trajectory map
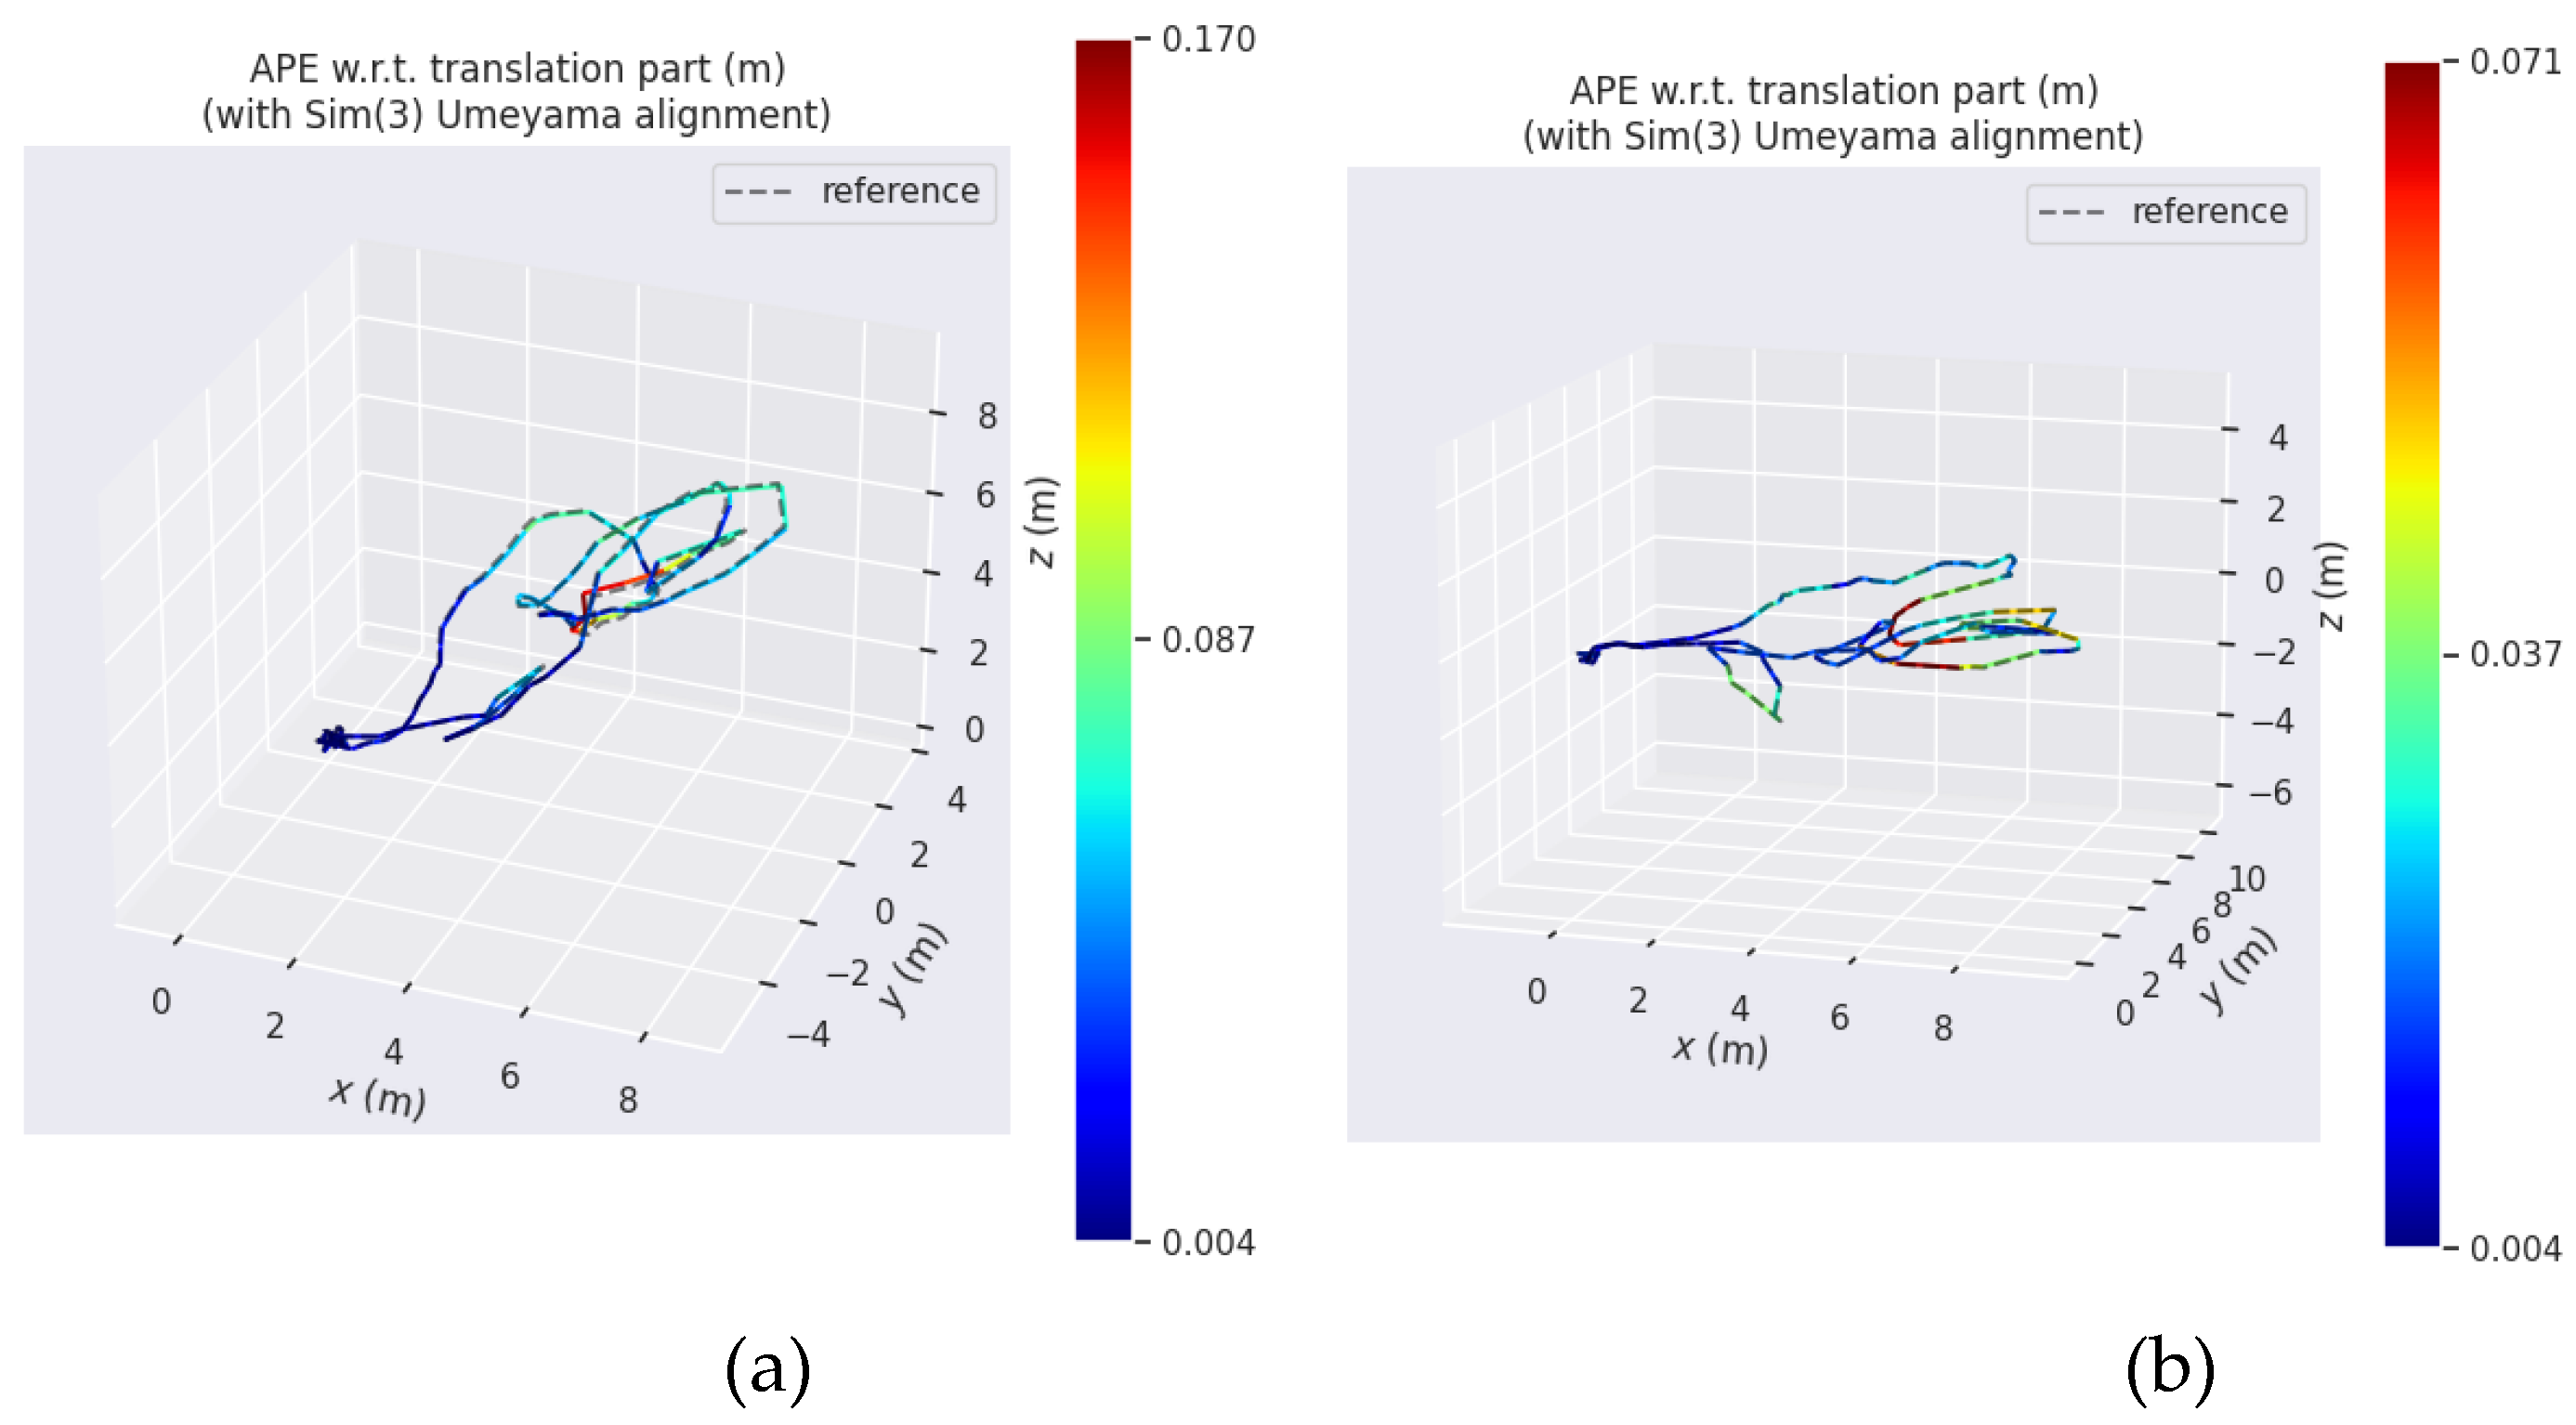
Figure 10.
Trajectory Comparison Chart(a)Single visual localization APE;(b) Visual/INS integrated navigation localization APE.
Figure 10.
Trajectory Comparison Chart(a)Single visual localization APE;(b) Visual/INS integrated navigation localization APE.
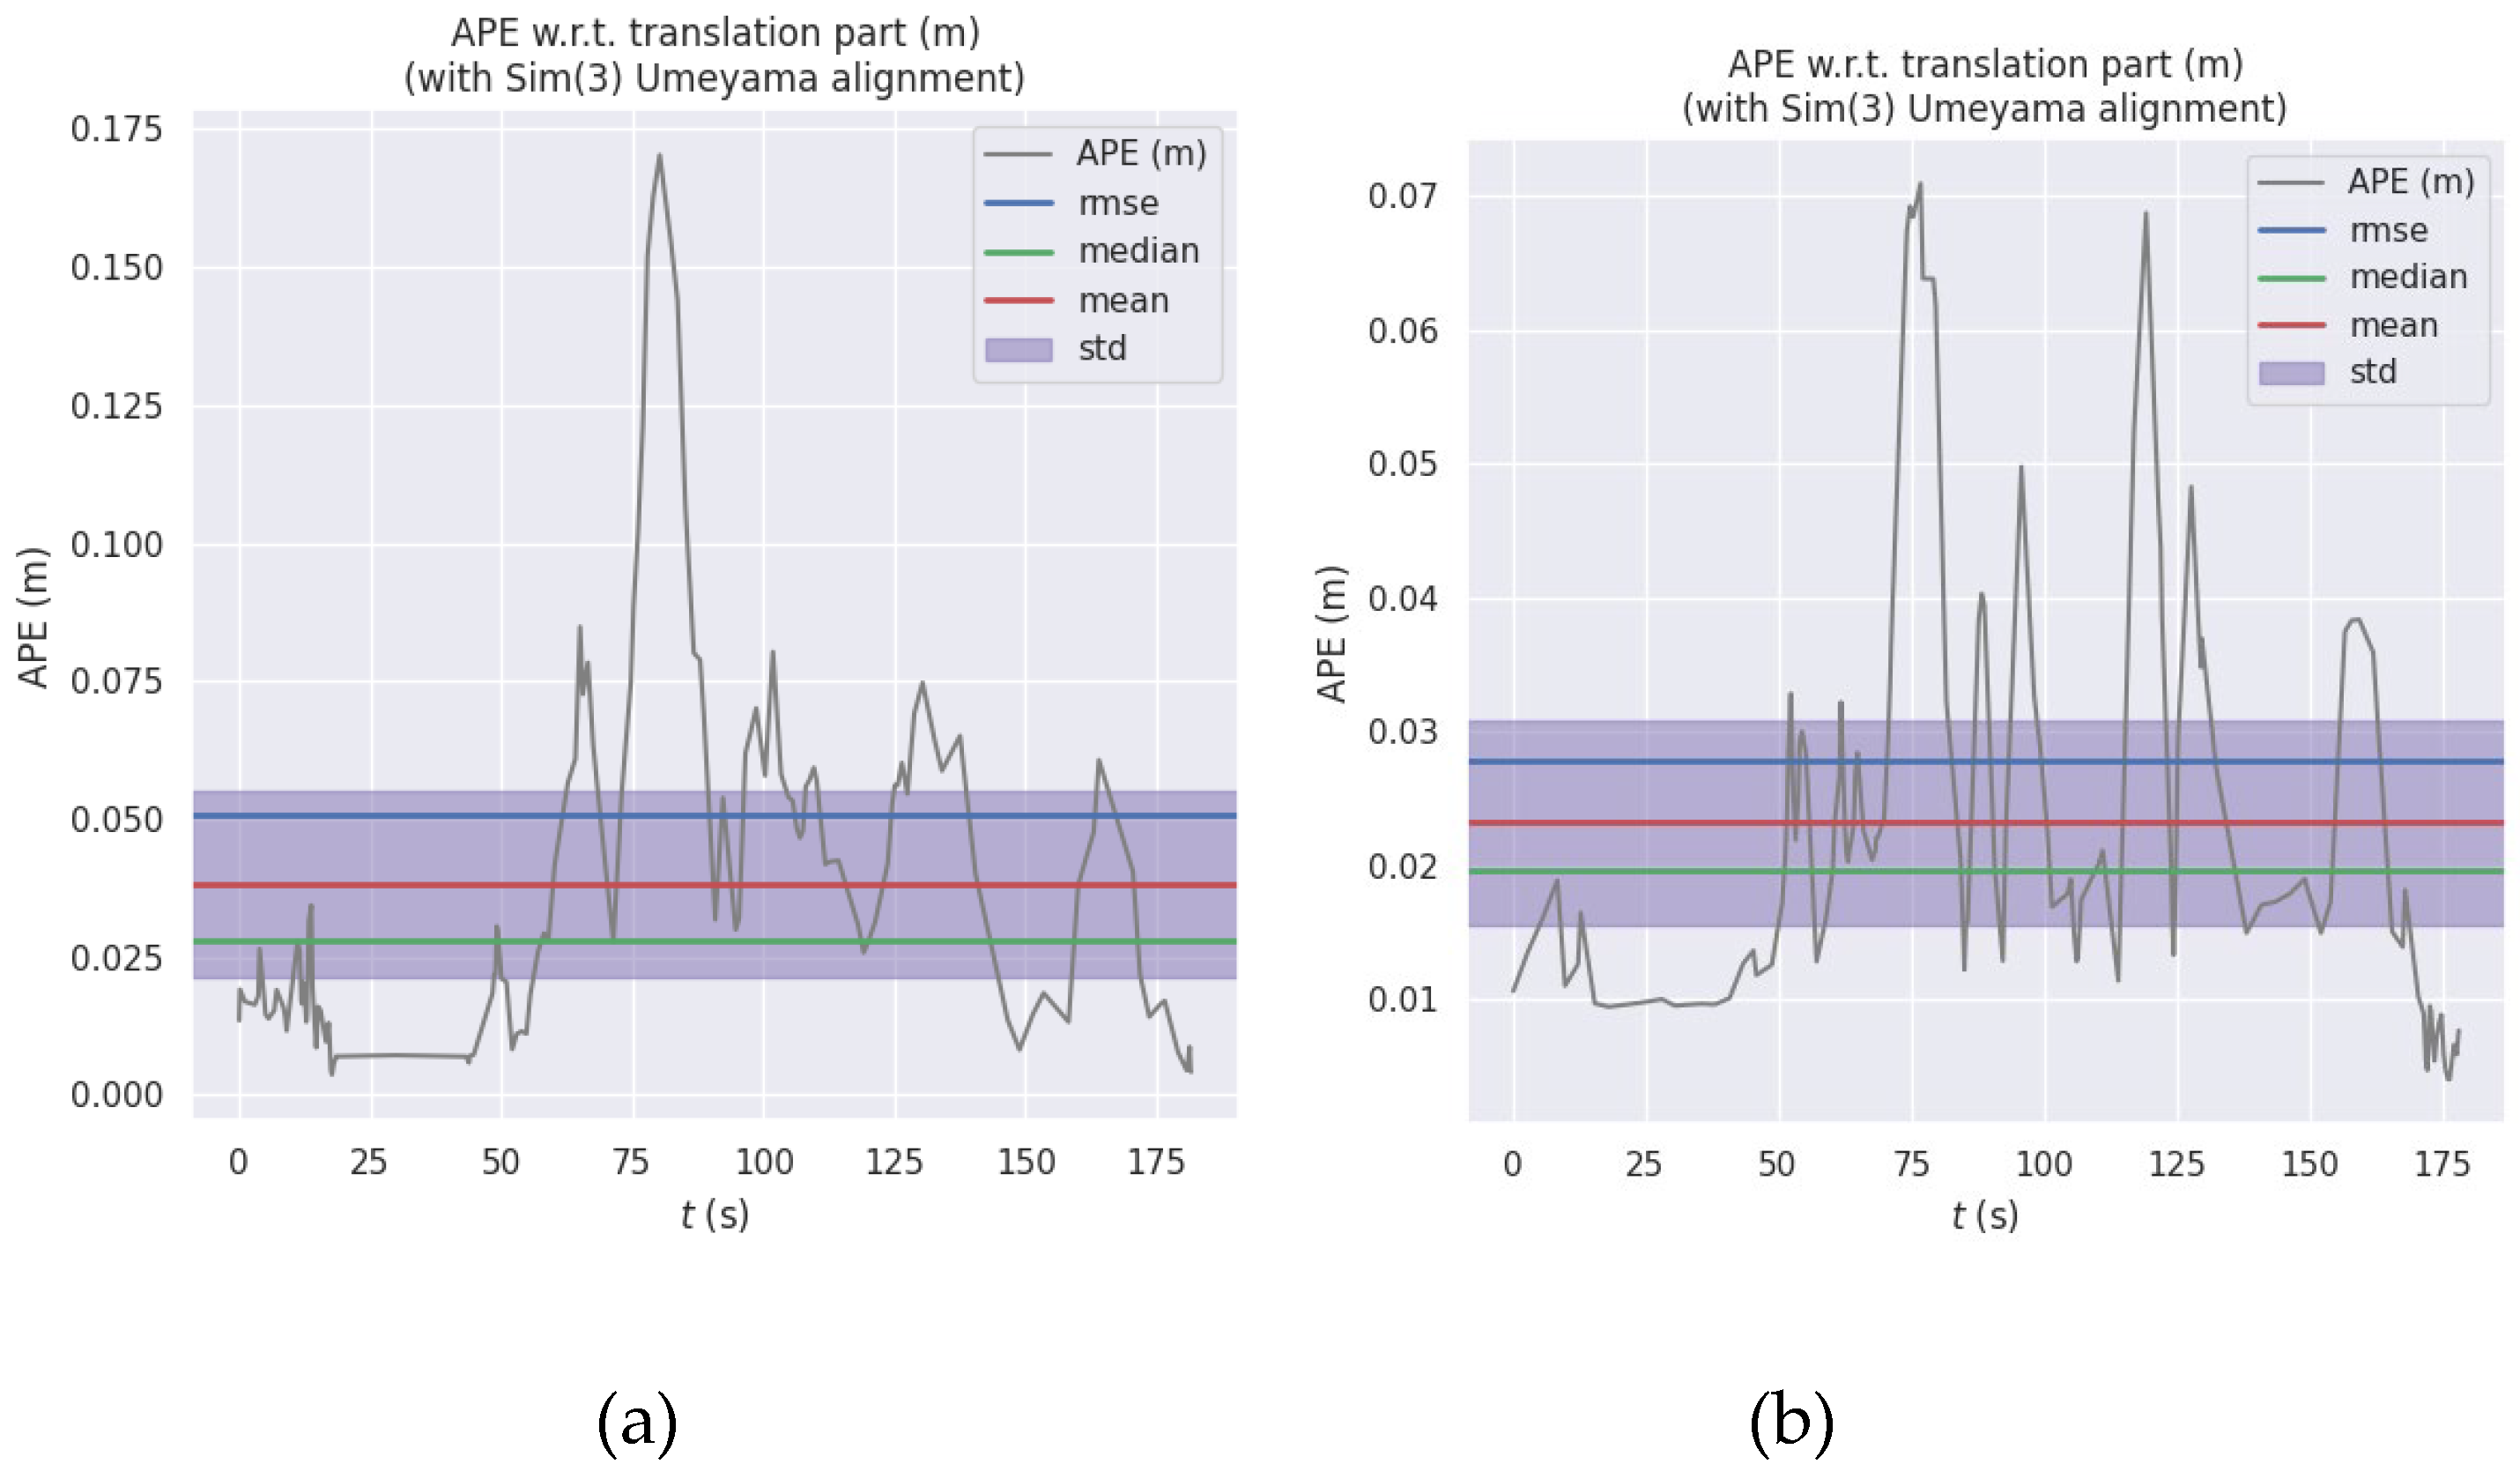

Table 1.
Standard deviation of the image (in pixels).
| De-blurring | De-blurred | |
|---|---|---|
| Group I | 78.8 | 80.3 |
| Group II | 76.3 | 78.1 |
| Group III | 69.6 | 71.1 |
Table 2.
Image average gradient.
| De-blurring | De-blurred | |
|---|---|---|
| Group I | 2.45 | 4.51 |
| Group II | 3.66 | 5.60 |
| Group III | 2.83 | 5.46 |
Table 3.
Results of ORB feature matching results (unit: pair).
| De-blurring | De-blurred | |
|---|---|---|
| Group I | 206 | 58 |
| Group II | 57 | 5 |
| Group III | 201 | 76 |
Table 4.
Time required for image ORB feature matching (unit: ms).
| De-blurring | De-blurred | |
|---|---|---|
| Group I | 0.95 | 0.69 |
| Group II | 0.77 | 0.48 |
| Group III | 0.84 | 0.47 |
Table 5.
Comparison of VIO and VO absolute position error (unit:m).
| VIO | VO | |
|---|---|---|
| max | 0.0709 | 0.170 |
| mean | 0.0232 | 0.0382 |
| min | 0.00407 | 0.00366 |
| rmse | 0.0278 | 0.0508 |
| std | 0.0153 | 0.0335 |
Disclaimer/Publisher’s Note: The statements, opinions and data contained in all publications are solely those of the individual author(s) and contributor(s) and not of MDPI and/or the editor(s). MDPI and/or the editor(s) disclaim responsibility for any injury to people or property resulting from any ideas, methods, instructions or products referred to in the content |
© 2024 by the authors. Licensee MDPI, Basel, Switzerland. This article is an open access article distributed under the terms and conditions of the Creative Commons Attribution (CC BY) license (http://creativecommons.org/licenses/by/4.0/).
Copyright: This open access article is published under a Creative Commons CC BY 4.0 license, which permit the free download, distribution, and reuse, provided that the author and preprint are cited in any reuse.