Submitted:
28 May 2024
Posted:
29 May 2024
You are already at the latest version
Abstract
In this study, a modular multi-step photometric microflow injection analysis (micro-FIA) system for the automatic determination of Cu(II) in a bioreactor has been developed. The system incorporates diverse 3D-printed modules, including a platform formed by a mixer module to mix Cu(II) with hydroxylamine which reduces Cu(II) to Cu(I) linked to a diluter module via a Tesla valve, a chelation mixer module, a disperser module, and a detector module provided by a LED light source at λ= 455 nm and a light dependence resistor (LDR) as a light intensity detector. The system measures the color intensity resulting from the chelation between Cu(I) and neocuproine. The micro-FIA system has demonstrated good capability for automatic and continuous Cu(II) determination, in a wide range of Cu concentrations from 34 to 2000 mg L-1. The device exhibits a good repeatability (coefficient of variation below 2% across the concentration range), good reproducibility, and has an accuracy of around 100% between 600 to 1900 mg·L-1. Real samples were analyzed using both the micro-FIA system and an atomic absorption spectroscopy method, revealing no statistically significant differences. Additionally, a Tesla valve located before the detector substituted a 3-way solenoid valve, eliminating the need for moving parts.
Keywords:
Cu(II)
; 3D-printed microfluidic platform
; micro-FIA
; bioleaching
; e-waste
; circular economy
1. Introduction
The exponential growth of electronic waste (e-waste) in the past few decades, driven by rapid technological advancements and planned obsolescence, has become a pressing global concern. According to the World Health Organization (WHO) [1], e-waste generation has increased by 3-5% annually. This escalating issue necessitates the development of effective e-waste recycling methods, not only to address environmental concerns but also due to the presence in this e-waste of valuable metals like copper, silver, cobalt, lithium, gold, nickel. The recovery of these metals from e-waste holds immense economic potential for various new applications.
Nevertheless, the intricate composition of e-waste, consisting of a complex amalgamation of organic materials, ceramics, and metals, poses significant challenges in the recycling process. The predominant methods employed for metal recovery from e-waste, namely pyrometallurgical and hydrometallurgical processes, incur substantial expense and exert a considerable environmental toll due to their reliance on high temperatures and harsh chemicals. In recent years, alternative recycling technologies that prioritize environmental sustainability have garnered attention. One such approach is bioleaching, which harnesses the activity of specific microorganisms to generate leaching agents capable of extracting metals. Although bioleaching has found success in the mining industry for low-grade ores [2], such as in commercial bio-heap processes [3,4], its potential for large-scale metal recovery from e-waste [5,6] is currently under exploration.
The bioleaching of copper from electronic waste utilizing Acidithiobacillus ferrooxidans has been established as a promising approach [2,3,4,5,6], leveraging the bacteria’s ability to facilitate the oxidation of Fe(II) to Fe(III) under acidic conditions. Fe(III) oxidizes the copper present in the residue to its soluble form Cu(II), while it is reduced to Fe(II). This unique capability enables the continuous process of re-oxidizing Fe(II) to Fe(III) establishing a bioleaching cyclic process [7]. The copper bioleaching process typically encompasses two distinct stages. Initially, the oxidation process takes place within a specialized bioreactor, where microorganisms catalyze the conversion of Fe(II) to Fe(III). Subsequently, the Fe(III) solution, devoid of bacteria, is introduced into a separate reactor containing the e-waste, facilitating the extraction of Cu(II). Accurate control of the Cu(II) concentration during the copper extraction stage is crucial for optimizing the bioleaching process.
At present, several methods can determine Cu(II) or total Cu such as fluorescence [8,9], electroanalytical techniques [10,11,12,13,14,15], potentiometry with ion-selective electrodes [16,17], atomic absorption spectrometry [18,19,20], inductively coupled plasma mass spectrometry (ICP-MS) [21], paper-based microfluidic analytical device [22], atomic fluorescence spectrometry [23], high-performance liquid chromatography [24], mass spectrometry [25], colorimetric and UV/vis spectrometry [26,27,28,29,30,31,32,33,34,35,36,37,38,39,40,41,42,43]. However, these conventional approaches suffer from inherent limitations, such as their labor-intensive nature, lack of automation, dependence on skilled personnel, strict laboratory conditions, and the need for extensive sample preparation, all of which contribute to increased analysis time and potential compromise in the quality data analysis. At another drawback is the limited dynamic range response of these methods, necessitating substantial dilutions for the analysis of high-concentration samples. This poses a significant challenge when quantifying Cu(II) in a bioreactor, where concentrations can reach as high as 3000 mg L-1.
In this sense, the implementation of flow injection analysis (FIA) offers a versatile approach for the monitoring of diverse parameters, such as Cu ions, across complex matrices [44,45]. FIA methods enable real-time and in-situ analysis, facilitating automation and enabling high sample throughput. Despite these advantages, there is a noticeable dearth of published research on the application of FIA for monitoring high Cu(II) concentrations in bioreactors. To bridge this research gap, FIA based on microfluidic platforms fabricated through 3D printing presents a promising solution. This approach offers a high degree of customization and accessibility through the use of computer-aided design (CAD) programs.
The usual detection method is colorimetry, which utilizes a chelating agent to complex with metallic cations, resulting in a colored product. Different chelating agents have been used in the literature. Cuprone allows for direct Cu(II) determination, but it suffers from interferences with other metal ions [34,35]. However, Cu(II) can be determined by reducing it to Cu(I) which has three specific chelators neocuproine, cuproine and bathocuproine [26,28,29,30,31,32,33] without interference from other ions or species presents in the medium.
The main aim of this study is to establish a reliable and versatile microflow injection analysis (micro-FIA) system, which is fully automated and integrated, to effectively monitor and quantify high concentrations of Cu(II) in a bioreactor. The detection of Cu(II) is achieved by implementing a reduction of Cu(II) to Cu(I), followed by the formation of a selective colored complex between Cu(I) and neocuproine, which exhibits an absorption peak at 454 nm [30]. The design of the micro-FIA analyzer has been accomplished using computer-aided design (CAD) software, incorporating narrow microchannels that minimize sample and reagent volumes. These design features will not only contribute to cost savings but also facilitate frequent analyses, enabling real-time determination of Cu(II) concentrations to ensure precise and accurate results.
2. Materials and Methods
2.1. Chemicals and Reagents
In this study, a black, 1.75 mm polylactic acid (PLA) filament was used (LEON 3D, Valverde de la Virgen, Spain). CuSO₄·5H₂O (99%) was obtained from Labkem (Barcelona, Spain), neocuproine hemihydrate (98+%) from Thermoscientfic (Barcelona, Spain), ethanol (96%) from Scharlau (Polinya, Spain), H2SO4 (95-98%) from Panreac (Castellar del Vallès, Spain), sodium acetate (99+%) from T3Q (Sentmenat, Spain) and hydroxylamine hydrochloride (98%) from Panreac (Castellar del Valles, Spain). All chemicals utilized in this study were of analytical reagent grade.
A 6000 mg L-1 stock solution of Cu(II) was prepared by dissolving CuSO₄·5H₂O in aqueous acidic solution at pH=2 obtained by dissolving H2SO4 in deionized water.
The hydroxylamine solution 10% (w/v) was prepared by dissolving hydroxylamine in aqueous acidic solution at pH=2 obtained by dissolving H2SO4 in deionized water.
The chelating reactant solution was prepared by dissolving neocuproine in ethanol. After that, distilled water was added resulting in a 20% solution of ethanol 20% (v/v) and neocuproine 0.15% (w/v).
All solutions were prepared with deionized water for Milli-Q system (Millipore, Billerica, MA, USA).
2.2. Microfluidic 3D Platforms and Modules Design, Printing Conditions and Fabrication
The CAD model design for all the modules and platforms was created using AutoCAD software (Autodesk). The manufacturing of the pieces was carried out using a Prusa i3MK3S+ printer (Prusa Research Prague, Czech Republic). The CAD of the platform 1 formed by two modules (mixer and diluter) connected via a Tesla Valve is shown in Figure S1. The platform 2 is a mixer with a height of 1 mm, which has the same design as that presented in this work [46]. The platform 3 formed by a disperser and a Tesla Valve is shown in Figure S2.
PLA was chosen as the material for printing the modular blocks due to it being affordable, user and eco-friendly. The CAD models were exported as stereolithography (STL) files and opened in the CURA 4.12.1 software. The printing settings were configured within this software environment. Subsequently, CURA generates a G-code file containing the instructions and information necessary for printing the platforms.
The printing conditions for height layers were set as follows: the layer height was set to 0.1 mm and the initial layer height to 0.2 mm, respectively. The wall line count was set to 8, and a retraction distance of 1.6 mm was used. The line width was set to 0.2 mm, and the top/bottom thickness was set to 1 mm. Additionally, 10 bottom and top layers were applied, with the initial printing temperature set to 215 ºC and subsequently reduced to 200 ºC. The temperature of the printer plate was set to 60 ºC. During the CAD design process, it was determined that 4-5 mm separation between the channel and the external wall was sufficient.
2.3. Experimental Setup
The overall configuration of the micro-FIA system is illustrated in Figure 1 showing its key components: (i) the injection system, (ii) the assembled 3D-printed platforms, and (iii) the data acquisition system. Fluids flow was managed by two peristaltic pumps (a and b).
To pump the carrier, reactant and diluent, a peristaltic pump Hyiafex HF-LabV1-III/AMC12(10) from HYGIAFLEX (L’Hospitalet de Llobregat, Barcelona) equipped with 2 mm internal diameter tubing silicon from HYGIAFLEX (L’Hospitalet de Llobregat, Barcelona) was used. A six-way injection valve manufactured by Hamilton Injector MVP (USA) was used for sample injection.
To fill the loop sample and clean the detector, a GILSON Minipuls 3 R4, with a 4-channel head, (Gilson, Villiers-le-Bel, France) peristaltic pump equipped with 1.52 mm internal diameter Tygon®tubing (Ismatec) was used. The ethanol was introduced to the system through a 3D printed Tesla valve design for this proposed in platform 3. The tubes used to connect to six-way injection valve were polytetrafluoroethylene (PTFE) (Tecator, Hohganes, Sweden) with 0.8 mm internal diameter, the sample loop was made with perfluoroalkoxy alkanes (PFA) (VWR, Llinars del Vallés, Barcelona) with 0.5 mm internal diameter.
The experimental operational parameters were fixed as follows. The injection volume (Figure 1c) was 25 µL; the volume of platform 1 including mixer connected through Tesla valve with diluter (Figure 1d) was 363 mm3; platform 2 was only a mixer (Figure 1e); and the volumes of platform 3 which was a disperser that included another Tesla valve (Figure 1f) were 2034 mm3 and 1685 mm3, respectively. The flow rate of solutions was between 0.20 mL/min to 0.39 mL/min: hydroxylamine 10% w/V at 0.20 mL/min, the carrier was a solution at pH=1.8 by H2SO4 at 0.24 mL/min, the diluent was a solution of sodium acetate 0.003 mol/L at 0.24 mL/min and neocuproine at 0.15% in 20%v/v ethanol: water at 0.27 mL/min. The flow rate of ethanol 96% was 0.39 mL/min.
The detection system integrated mainly two elements, a light-emitting diode (LED) (OSB3SA5111A, Transfer Multisort Elektronik, Polonia) emitting light in the wavelength range of 455 nm and a light-dependent resistor (LDR) (PGM5537, Transfer Multisort Elektronik, Polonia).
The 3D-printed modules of the micro-FIA system were connected using polyvinyl chloride (PVC) tubes of variable length and 1.52 mm internal diameter Tygon®tubing (Ismatec) (Figure 1A). The inlet/outlet 3D-modules were designed as described in a previous study [46].
The system analytical response is depicted in Figure 1B, where the peak height is directly proportional with the concentration of Cu(II).
2.4. 3D-Optical Flow-Cell Detector
The detector was designed based on previous studies [46] and its operational principles remain identical. This detector is capable of determining the concentrations of copper, converting light intensity into a proportional electrical signal (mV), and the signal was collected at a rate of 0.1 seconds. The detector consisted of an LDR of 5 mm diameter and an LED emitting at 455 nm. The LED was powered by 3 volts and 20 mA. For the purpose of data acquisition, the LDR was connected to an Arduino UNO and integrated into a voltage divider circuit powered by 5V. In the voltage divider circuit, a 10 kΩ resistance was placed first, followed by the LDR witch resistance decreases as intensity of light increases. This configuration made the measured voltage directly proportional to the absorbance. The voltage was then sent to the computer by the Arduino every 100 ms. The only differences were in the CAD design. The internal diameter of the inlets was 1 mm, the channels measured 1 mm in height and 1 mm in width and the flow cell measured 2 mm in diameter. These changes were implemented to facilitate the flow path and to prevent overpressure. Another modification involved substituting the rectangular supports with cradle-shaped supports, thus eliminating the necessity to employ a flat screwdriver for support removal after printing was completed.
2.5. Micro-FIA Procedure for Copper Determination
The analysis cycle operated in the following manner: Initially, a peristaltic pump (Figure 1b) was used to pump the sample into a six-way valve, set in load mode, (Figure 1c) filling the sample loop (25 µL). Next, the pump stopped, the six-way valve was changed into an injection position and a second peristaltic pump (Figure 1a) was activated to pump reagents (hydroxylamine 10% w/v), diluent (sodium acetate 0.003mol/L) and carrier (solution at pH=1.8 by H2SO4) into the system. Subsequently, the sample was introduced to the platform 1 (Figure 1d) where Cu(II) was reduced to Cu(I) by hydroxylamine since the neocuproine specifically reacts with Cu(I) [26,28,29,30,31,32,33].
As the sample was a suspension from the bioleaching reactor possibly containing high concentrations of Cu(II) (up to 3000 mg L-1), it was directed towards the diluter module using a Tesla valve in the platform 1 (Figure 1d) to prevent any backflow. The purpose of the diluter was to adjust the Cu(II) concentrations within a measurable operational range. The diluted sample with Cu(I) then entered platform 2, which was only a mixer module (Figure 1e), where it reacted with the chelating reagent (0.15% w/v of neocuproine) resulting in an orange color complex whose intensity was directly proportional to the Cu(I) concentration.
The mixture then passed through the disperser module in platform 3 (Figure 1f). The disperser was incorporated into the system to dilute by dispersion the Cu(I)-neocuproine complex and decrease the peak height preventing signal saturation of the detector. Afterwards, the sample entered the 3D-optical flow cell (Figure 1g) where the absorbance of the Cu(I) complex was measured and transformed into electrical signals represented by peak height (mV) (Figure 1i). Finally, the solution was released from the system as waste and the pump was turned off (Figure 1a).
After each measurement, the detector was cleaned to ensure accurate subsequent readings. This cleaning process involved activating the first pump (Figure 1b), which pumped ethanol through the Tesla valve. This valve type has several advantages over a solenoid valve, such as customizable design, longer lifespan, and the absence of moving parts. In this step, the sample loop was filled again for the next measurement.
To control the system, a custom software application was created using LabVIEW 2021. This software was specifically designed to manage the functionality of the 6-way valve through serial communication RS-232. To establish communication with the Arduino UNO, LINX, a software package was installed within LabVIEW. The Arduino UNO was responsible for measuring the voltage at the voltage divider and LabVIEW then processed these signals to determine the peak height and thus the concentration of copper in the sample. Additionally, Arduino UNO was connected to a relay shield 3.0 from seed studio, enabling it to send signals to operate the pumps.
2.6. Spiked and Real Samples
Several real samples were subjected to analysis to validate the functionality of the analyzer. These included medium samples from a bioleaching reactor, water samples from a nearby reservoir (Parc de l’Agulla, Manresa, Spain), leachate obtained from acid digestion of electric scooter batteries, and residual solutions from copper electrodeposition processes. Water from “Parc de l’agulla” and bioleaching samples were filtered using 0.2 μm syringe filters (Chemlab group, Terrassa, Spain) before analysis. All samples were analyzed in triplicate, after the addition of a known concentration of Cu(II).
The samples obtained from copper electrodeposition were diluted using an acidic solution at dilution factors of 1/3, 1/2, and 2/3. From each dilution, two separate aliquots were taken. One aliquot was analyzed directly, while in the other aliquot, 500 mg L-1 Cu(II), were added and then analyzed. The analysis was performed in triplicate.
The results obtained from the micro-FIA system was compared with the standard method using an atomic absorption spectroscopy (PerkinElmer, PinAAcle 500).
3. Results and Discussion
3.1. Design and Optimization of Passive Elements
To maximize the effectiveness of the micro-FIA device outlined in the experimental section, various operational parameters were explored to achieve optimal performance. The main objectives of the design were to extend the dynamic range for copper analysis, enhance mixing efficiency within the analyzer, and improve the stability of the detector and accordingly the precision of the method.
Platform 1 (Figure 1d) consisted of three elements, 1) the reactor for the Cu(II) reduction with hydroxylamine, 2) the Tesla valve to prevent the carrier backflow, and 3) the diluter.
Platform 1. Hydroxylamine mixer. Within the mixer reactor, the chemical reaction between the sample and the reducing agent resulting in the reduction of Cu(II) to Cu(I) took place. The design of the reactor, as presented in Figure S1A and S1B, incorporated two inlets. One entrance was used for introducing the sample, while the other allowed the entry of hydroxylamine. Both inlets measured 0.51 mm in internal diameter. The reactor channel was designed with a combination of linear segments and square turns, to enhance the efficiency of mixing [47]. This design culminated in the Tesla valve, which was incorporated to prevent liquid backflow.
The channels were designed with a height of 0.5 mm and a width of 0.75 mm, and they were seamlessly connected to the reagent channel at a T-junction. Within the mixer, a designated mixing zone (Figure S1B) allowed sufficient time for the complete reaction between the sample and the reagent, enabling the neocuproine to effectively interact with Cu(I) in its copper form. To achieve optimal mixing efficiency, the mixer incorporated a total of 28 90-degree turns. Each turn measured 24 mm in length and 2.85 mm in width, creating flow turbulence within the channel to facilitate thorough sample mixing.
Platform 1. Tesla valve. This passive valve, originally designed by Nikola Tesla [48], was a fluid flow control device that operated on a unique principle without any moving parts. It employed a series of specially designed channels to regulate the flow of fluid in a unidirectional manner creating greater resistance to flow in one direction compared to the opposite direction. This valve is renowned for its simplicity, efficiency, and low maintenance requirements, and its innovative design has made it a popular choice for fluid control in various engineering applications.
Figure 2.
Dimensional labeling of the Tesla Valve in CAD. The units for dimensions are in millimeters.
Figure 2.
Dimensional labeling of the Tesla Valve in CAD. The units for dimensions are in millimeters.
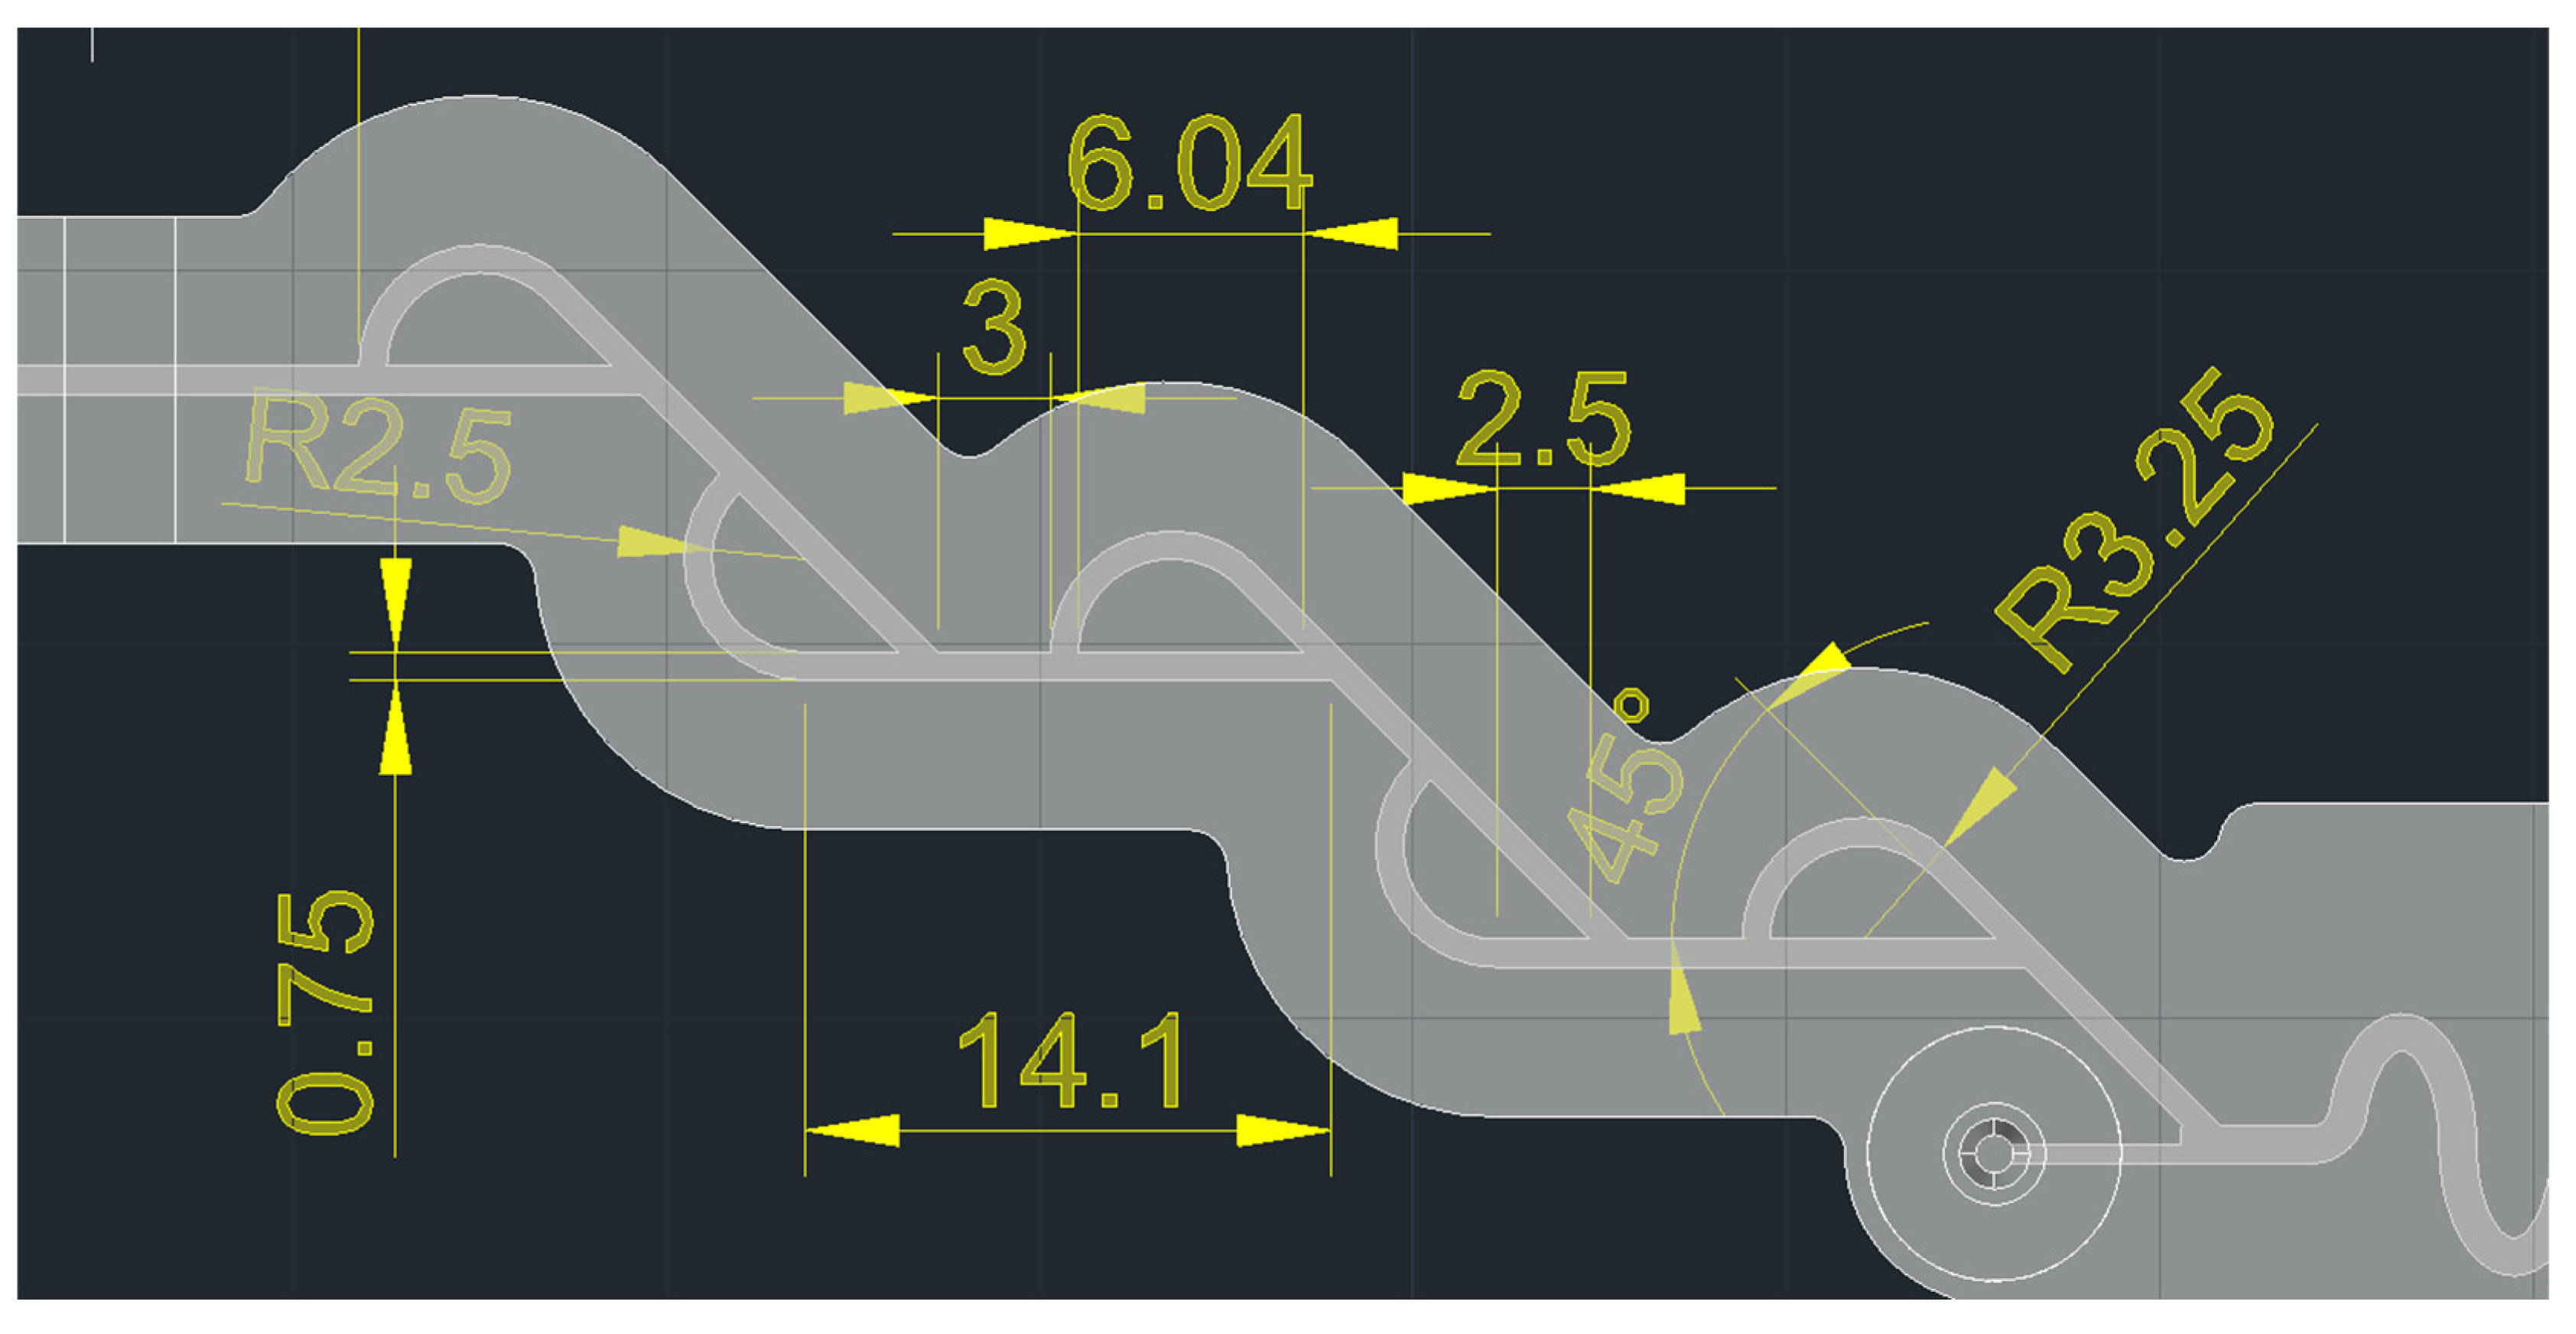
The shape of the Tesla Valve was carefully selected based on mathematical analysis which demonstrated that it achieved the highest-pressure ratio between the two directions [49]. This specific valve shape was chosen to prevent backflow between the hydroxylamine mixer (on platform 1) and the diluter modules (as illustrated in Figure S1A). The Tesla Valve has a height of 0.75 mm, featuring a gradual increase in the channel connecting the mixer and the valve.
Platform 1. Diluter. The diluter module played a crucial role in adjusting sample concentration in the linear response range of the micro-FIA analyzer. Given the anticipated high Cu(II) concentrations in samples from the bioleaching reactor, which could reach up to 3000 mg·L-1 of Cu(II), the dilution step was very important [5]. The design of the diluter, including the diameters of the inlets, outlets, and channels, was carefully considered to facilitate the proper flow of the reaction mixture.
To enhance the dilution process and prevent excessive pressure in the diluter module, a three-point dilution strategy was employed. The diluter’s main channel was divided into two serpentine sections and a straight segment. In each succeeding segment, the internal width of the main channel was increased by 0.5 mm. The size of the sections was carefully picked. The first portion was established to be 43 mm long and 1 mm wide, the second to be 67 mm long and 1.5 mm wide, and the last one 17 mm long and 2 mm wide. Rectangular channels with dimensions of 0.5 mm in width, 0.75 mm in height, and 4 mm in length were used to create the inlet connections. The inlet and outlet diameter dimensions were determined to be 1 mm and 1.5 mm, respectively (Figure S1C).
Platform 2. The reaction between Cu(I) and neocuproine occurred in the mixer, forming an orange chelate that absorbed light at 454 nm. The concentration of copper was directly proportional to the measured absorbance. The reactor included three inlets: one entrance for introducing the diluted sample, while the remaining two entrances were used to introduce the reagent, allowing for an increased reagent ratio. Design and characteristics of this module have been described previously [46].
Platform 3. Disperser with a Tesla valve. The integration of the disperser module was a pivotal advancement in the micro-FIA system design [46]. It played a vital role in enhancing the dispersion of the chelate, leading to a notable reduction in the signal peak height and in the prevention of detector signal saturation. Positioned between the mixing module (Figure 1e) and the 3D-optical microflow cell (Figure 1g), the disperser module featured a main channel with a serpentine shape and additional smaller serpentine segments (Figure 1f). This specific configuration effectively amplified turbulence and facilitated superior dispersion of the colored complex obtained before detection step. The dimensions were carefully selected to minimize any overpressure issues at the output: width of 2 mm and a height of 1 mm, while the inlet and outlet were designed with diameters of 1.5 mm and 2 mm, respectively. For more detailed insights into the design specifics of the disperser module, refer to Figure S2.
Furthermore, a Tesla valve was located at the outlet. This valve enabled the introduction of ethanol for detector cleaning, eliminating the need for an active 3-way electro-valve and preventing flow in the opposite direction. This integration of Tesla valve on the disperser ensured efficient detector maintenance.
3.2. Optimization of Operational Conditions
The complete design and optimization of detector response and characterization is described in the previous work [46]. The baseline obtained was stable while the sample was simultaneously diluting and reacting with reactants in the system. The target analyte was quantified by measuring the signal produced from the formation of a chelate complex between Cu(I) and neocuproine. The magnitude of the signal, which is a voltage, was directly proportional to the concentration of Cu(II) present in the sample. Detection of the signal was accomplished using an LDR positioned within a 3D-optical microflow cell. Signal processing was carried out by an Arduino microcontroller, and the resulting output signal was then transmitted to a computer for subsequent data analysis. The maximum voltage it could measure was about 4 volts as 1 volt is where the baseline usually is. Total analysis and cleaning time were between 9 minutes. To avoid the formation of bubbles that would interfere in the measurements, all solutions were previously sonicated.
3.3. Validation of Microanalyzer Performance
To establish the microanalyzer’s suitability, reliability, and robustness in the ongoing assessment of copper concentration within a bioleaching reactor, a process of validation for micro-FIA was made. The key parameters evaluated were limit of detection (LoD), limit of quantification (LoQ), linear response range, real sample analysis, precision (repeatability and reproducibility) and accuracy. Table 2 shows the results obtained.
3.3.1. Precision
3.3.1.1. Repeatability
The repeatability of the method was evaluated by analyzing two Cu(II) standard solutions of 500 and 1500 mg L-1, six times each on the same day. The mean, standard deviation and experimental coefficient of variation (CV) were calculated for each concentration. The Horwitz coefficient (Cvh) [50] defines the maximum acceptable CV based on the analyte concentration (g mL-1). This relationship is expressed by the equation: Cvh=2(1-0.5·log(C)). Table S1 presents the analytical results for each concentration. It can be seen that the experimental CV was less than 2% and lower than the corresponding Cvh value for the two concentrations. This indicates acceptable repeatability for the method.
3.3.1.2. Reproducibility
A wide range of Cu(II) concentrations (50, 500, 1000, 1500, and 2000 mg L-1) was used to determine the reproducibility. Each concentration was analyzed three times on four separate days (n = 12) (Figure 3A). Mean, standard deviation, and experimental CV were calculated for each concentration. The experimental CV obtained was compared to the acceptable limit of Cvh. Table S2 summarizes the results. The experimental CV remained less than the Cvh across the entire range of concentrations. Consequently, the CV values obtained were considered satisfactory, demonstrating the method’s reproducibility.
3.3.2. Limit of Detection and Limit of Quantification
The determination of the LoD and LoQ followed the signal-to-noise approach, a methodology employed in analytical procedures characterized by inherent baseline noise. The signal-to-noise ratio was established through the analysis of the signal of a blank sample. To compute the LoD and LoQ, a series of 200 measurements of baseline from blank were performed. Subsequently, the mean and standard deviation values were calculated according to the method outlined in reference [51]. The LoD was derived using the formula (X + 3Sb)/S, where X represents the mean of the blank measured, Sb is the standard deviation of the blank mean, and S is the slope of the calibration curve or sensitivity. Similarly, the LoQ was determined employing the equation (X + 10Sb)/S. Employing this methodology, we determined the LoD to be 8.93 mg L-1 and the LoQ to be 34.4 mg L-1. A representation of the baseline and blank signal is presented in Figure 3B.
3.3.3. Linear Response Range
The linearity of the analytical method assessed the relationship between the analyte concentration and the corresponding peak height expressed in volts. The linear response range spanned from the LoQ to the upper concentration of linear range. In this study, linearity was determined by analyzing five different Cu(II) standard solutions in triplicate, with concentrations ranging from 34.4 to 2000 mg L-1. The obtained results were used to create a calibration plot using the least squares method, yielding a high coefficient of determination (R2) of 0.998. This indicated a strong linear correlation between the analyte concentration and the signal response within the pH range of 1.9 to 2.1The equation of the calibration curve (Figure 3C) is Peak height (V)= 0.00079 ± 0.00002 [Cu(II)] + 0.012 ± 0.022.
3.3.4. Accuracy
To evaluate the accuracy of the micro-FIA analyzer, the recovery percentage (%R) was determined as a measure of the agreement between the copper concentration obtained analytically with the microanalyzer and the true value after the sample was spiked. For this purpose, samples obtained from a copper electrodeposition containing different Cu(II) concentrations ranging from about 500 to 1500 mg L-1, were spiked with 500 mg L-1 of Cu(II). Each sample was analyzed three times before and after being spiked. The recovery percentage was calculated as % R = (|Y - X|/500) · 100%, where X represents the Cu(II) concentration before spiking and Y represents the concentration after the addition of a 500 mg L-1. The results are shown in Table 1.
As it is shown in Table 1, recoveries of approximately 100 % were obtained across the concentration range of 600 to 2000 mg L-1. This indicates that the micro-FIA method developed in the present study is accurate within its linear calibration range.
Table 2 provides a comprehensive overview of the quality parameters for our proposed method. It exhibits satisfactory sensitivity with a wide linear response range from 34 to 2000 mg L-1, ideal for real applications. Furthermore, the method’s reproducibility, demonstrated by the standard deviation of measurements across multiple operational days (CV= 3.9 - 7.4%), underscores the analyzer’s reliable and consistent performance in process monitoring.
In order to compare our system with other similar methods, in Table S3 shows the characteristics of other flow analysis methods where different reagents are shown [52,53,54,55,56,57,58,59]. The distinctive feature of our analyzer was its extensive linear response range, setting it apart from alternative automated systems. The maximum ranges found in the literature were 1-170 mg L-1 [53] and (0.4-40 mg L-1), studies which also used neocuproine [52]. Both mentioned studies had LoD of 0.1 mg L-1. However, the lowest LoD found in the literature was 0.005 µg L-1 since the study had a narrow-working range (0.05-8 µg L-1) [54]. Obviously, these LoDs are lower than this work (9 mg L-1) since our linear range was 34 - 2000 mg·L-1. In fact, a comparison with the literature supports this, revealing a three-order-of-magnitude difference between the LoD and the maximum concentration of the linear range in our study and the referenced works [52,53,54,55,56,57,58,59]. As regards selectivity, another parameter to compare, the previously mentioned studies showed good selectivity for determining Cu(II) [52,53,54,55,56,57,58,59]. Nevertheless, among the highly selective methods, one utilized strains of yeast, S. cerevisiae [56], while the other employed neocuproine [52], which is the same chelating agent utilized in this study. Finally, in our study both accuracy (101%) and precision (0.3-1.1 %) were in accordance with the results presented in other studies [57,58], which reported an accuracy of 99% and a precision of 0.64% and 0.46-0.96%, respectively.
3.3.5. Real Sample Applications
To assess the applicability of the micro-FIA system, four real mediums with varying levels of matrix complexity were analyzed: 1) water from Parc de la Agulla in Manresa (Spain), which has a complex composition and high organic matter content; 2) a medium obtained from a bioleaching bioreactor; 3) a leachate obtained from the acid leaching of ion-Li scooter batteries; and 4) a solution obtained from copper electrodeposition. It should be noted that only the third and fourth mediums contained naturally occurring Cu(II).
The samples were analyzed in triplicate using the developed micro-FIA analyzer, and to contrast the results, they were also analyzed by an atomic absorption spectroscopy reference method.
Least-square linear regression and a paired-test were used to statistically analyze the results obtained from the two methods. No significant differences were observed at a 95% confidence level. In the least-square linear regression, the slope and intercept were 0.99 ± 0.03 and 6 ± 31, respectively (Figure S3) (R2= 0.994; n= 10; 95 % confidence level). The calculated t-value was -0.16, while the tabulated t-value was 2.26 (Table 3). The results of both analytical techniques can be found in Table 3.
In order to demonstrate the real-time monitoring capability of the micro-FIA system, it was connected with in-situ reactor designed for copper oxidation from electrical cables using dissolved Fe(III) present in reactor. The analyzer successfully tracked the increasing concentration of dissolved copper as it was oxidized from metallic copper during the process. The quantity of copper wires was around 0.9-1 g in approximately 1 L of solution and 2400 mg L-1 of Fe(III). Measurements were taken at 9-minute intervals (frequency analysis, 7 h-1), providing continuous monitoring and automated analysis of the copper concentration.
In order to validate the suitability of the micro-FIA analyzer for the intended purpose, a comparison was made between the analyzer’s results and those obtained through batch measurements using atomic absorption spectroscopy used as a reference method. The findings of this comparison are visually presented in Figure 4.
The obtained results demonstrate the capability of the micro-FIA system to monitor the concentrations of copper without requiring any prior sample preparation. The system automatically conducted measurements every 9 minutes. The results obtained from both methods were compared, and although slight differences were observed, they were not significant enough to attribute solely to the functionality of our system. Minor errors in dilution could cause these variances to appear, which may become more pronounced during measurement. The advantages over atomic absorption are that it measures automatically without previous sample pretreatment, no manual sample dilution is required, and the analysis frequency is much higher – thereby minimizing possible dilution errors. Furthermore, the system demonstrates high accuracy and selectivity, as evidenced by the high concordance of results between the two methods.
4. Conclusions
In this work, we have developed a modular micro-FIA system using 3D printed platforms to efficiently monitor high copper concentrations in complex samples with the goal of monitoring a bioleaching process. The system was carefully optimized to allow on-line monitoring of copper over a wide range of concentrations, spanning from 34.4 to 2000 mgL-1, while maintaining a low detection limit of 9 mg L-1.
Rigorous validation tests were performed to evaluate precision (repeatability and reproducibility), LoD, LoQ, linear response range, accuracy and applications on real samples. Our results indicate excellent repeatability, with coefficients of variation below Cvh over the entire concentration range, and accuracy consistently close to 100%. In addition, the effectiveness of the system was demonstrated by analyzing four real samples with increasing matrix complexity, obtaining results comparable to those obtained with a reference atomic absorption method, with no significant statistical differences observed and demonstrating the high selectivity of the method.
Collectively, our findings highlight the numerous benefits that arise from the synergistic integration of miniaturization and continuous flow techniques for on-line monitoring of high copper concentrations in complex sample matrices. This innovative approach offers several advantages, including cost reduction through decreased sample and reagent volumes, minimal maintenance requirements, reduced waste disposal, and lower personnel costs. Furthermore, the system’s capability for unattended operation over extended durations enhances its practicality and efficiency to monitor real processes.
Finally, this methodology exhibits adaptability and can be readily tailored to detect various analytes of interest, as demonstrated in previous studies. Subsequently, our future investigations will emphasize evaluating the system’s capacity for simultaneous detection of multiple analytes and its potential applicability in the comprehensive monitoring of bioleaching bioreactors.
Supplementary Materials
The following supporting information can be downloaded at the website of this paper posted on Preprints.org, Figure S1: A) CAD of platform 1 formed by a hydroxylamine mixer module connected to a diluter module via a Tesla valve. B) Dimensional labelling of the hydroxylamine mixer with a height of 0.5 mm. C) Dimensional labeling of the diluter [1] with a height of 0.75 mm. The units for dimensions are in millimeters. Figure S2: Dimensional labeling of the disperser [46] with a height of 1 mm with Tesla valve in CAD. The units for dimensions are in millimeters. Table S1: Results of repeatability of the modular micro-FIA system. Table S2: Results of reproducibility of the modular micro-FIA system. Figure S3: Linear regression test to compare the reference method (atomic absorption) and the proposed micro-FIA analyzer. Table S3: An overview on better reported optical methods for the determination of Cu(II).
Author Contributions
Conceptualization, M.B., C.L and A.D.; methodology, D.R., C.L. and M.B.; validation, D.R. and C.L.; investigation, D.R.; resources, A.D. and M.B.; data curation, D.R., C.L and M.B; writing—original draft preparation, D.R. and C.L.; writing—review and editing, D.R., C.L, A.D. and M.B.; visualization, A.D. and M.B.; supervision, C.L. and M.B.; project administration, A.D.; funding acquisition, A.D. All authors have read and agreed to the published version of the manuscript.
Funding
Project BIOMETAL PID2020-117520RA-I00 funded by MCIN/AEI/10.13039/501100011033, BIOCOLI ACE034/21/000044 funded by ACCIÓ.
Data Availability Statement
The data presented in this study are available upon request from the corresponding author. The data are not publicly available because the repository that is used to keep the data is a private one provided by the university.
Acknowledgments
The authors gratefully acknowledge the UPC for the financial support of a predoctoral grant FPU-UPC, with the collaboration of Banco de Santander.
Conflicts of Interest
The authors declare no conflict of interest.
References
- Laurmaa, V.; Kers, J.; Tall, K.; Mikli, V.; Goljandin, D.; Vilsaar, K.; Peetsalu, P.; Saarna, M.; Tarbe, R.; Zhang, L. Mechanical Recycling of Electronic Wastes for Materials Recovery. TMS Annu. Meet. 2011, 3–10. [Google Scholar] [CrossRef]
- Dorado, A.D.; Solé, M.; Lao, C.; Alfonso, P.; Gamisans, X. Effect of PH and Fe(III) Ions on Chalcopyrite Bioleaching by an Adapted Consortium from Biogas Sweetening. Miner. Eng. 2012, 39, 36–38. [Google Scholar] [CrossRef]
- Dorado Castaño, A.D.; Gamisans Noguera, X.; Solé Sardans, M.; Lao Luque, C.; Benzal Montes, E. Method for the Biological Recovery of Metals in Electric and Electronic Waste 2019.
- Brierley, C.L. Bacterial Succession in Bioheap Leaching. Process Metall. 1999, 9, 91–97. [Google Scholar] [CrossRef]
- Benzal, E.; Solé, M.; Lao, C.; Gamisans, X.; Dorado, A.D. Elemental Copper Recovery from E-Wastes Mediated with a Two-Step Bioleaching Process. Waste and Biomass Valorization 2020, 11, 5457–5465. [Google Scholar] [CrossRef]
- Benzal, E.; Cano, A.; Solé, M.; Lao-Luque, C.; Gamisans, X.; Dorado, A.D. Copper Recovery from PCBs by Acidithiobacillus Ferrooxidans: Toxicity of Bioleached Metals on Biological Activity. Waste and Biomass Valorization 2020, 11, 5483–5492. [Google Scholar] [CrossRef]
- Zhan, Y.; Yang, M.; Zhang, S.; Zhao, D.; Duan, J.; Wang, W.; Yan, L. Iron and Sulfur Oxidation Pathways of Acidithiobacillus Ferrooxidans. World J. Microbiol. Biotechnol. 2019, 35, 60. [Google Scholar] [CrossRef] [PubMed]
- Ma, L.; Liu, G.; Pu, S.; Ding, H.; Li, G. A Highly Selective Fluorescent Chemosensor for Cu2+ Based on a New Diarylethene with Triazole-Linked Fluorescein. Tetrahedron 2016, 72, 985–991. [Google Scholar] [CrossRef]
- Su, Y.; Shi, B.; Liao, S.; Qin, Y.; Zhang, L.; Huang, M.; Zhao, S. Facile Preparation of Fluorescent Polydihydroxyphenylalanine Nanoparticles for Label-Free Detection of Copper Ions. Sensors Actuators, B Chem. 2016, 225, 334–339. [Google Scholar] [CrossRef]
- Gupta, V.K.; Singh, L.P.; Singh, R.; Upadhyay, N.; Kaur, S.P.; Sethi, B. A Novel Copper (II) Selective Sensor Based on Dimethyl 4, 4′ (o-Phenylene) Bis(3-Thioallophanate) in PVC Matrix. J. Mol. Liq. 2012, 174, 11–16. [Google Scholar] [CrossRef]
- Munoz, R.A.A.; Angnes, L. Simultaneous Determination of Copper and Lead in Ethanol Fuel by Anodic Stripping Voltammetry. Microchem. J. 2004, 77, 157–162. [Google Scholar] [CrossRef]
- Kitte, S.A.; Li, S.; Nsabimana, A.; Gao, W.; Lai, J.; Liu, Z.; Xu, G. Stainless Steel Electrode for Simultaneous Stripping Analysis of Cd(II), Pb(II), Cu(II) and Hg(II). Talanta 2019, 191, 485–490. [Google Scholar] [CrossRef] [PubMed]
- Osipova, E.A.; Sladkov, V.E.; Kamenev, A.I.; Shkinev, V.M.; Geckeler, K.E. Determination of Ag(I), Hg(II), Cu(II), Pb(II), Cd(II) by Stripping Voltammetry in Aqueous Solutions Using Complexing Polymers in Conjunction with Membrane Filtration. Anal. Chim. Acta 2000, 404, 231–240. [Google Scholar] [CrossRef]
- Yang, W.; Jaramillo, D.; Gooding, J.J.; Hibbert, D.B.; Zhang, R.; Willett, G.D.; Fisher, K.J. Sub-Ppt Detection Limits for Copper Ions with Gly-Gly-His Modified Electrodes. Chem. Commun. 2001, 1, 1982–1983. [Google Scholar] [CrossRef] [PubMed]
- Mohadesi, A.; Taher, M.A. Voltammetric Determination of Cu(II) in Natural Waters and Human Hair at a Meso-2,3-Dimercaptosuccinic Acid Self-Assembled Gold Electrode. Talanta 2007, 72, 95–100. [Google Scholar] [CrossRef] [PubMed]
- Jain, A.K.; Gupta, V.K.; Sahoo, B.B.; Singh, L.P. Copper(II)-Selective Electrodes Based on Macrocyclic Compounds. Anal. Proc. 1995, 32, 99–101. [Google Scholar] [CrossRef]
- Gupta, V.K.; Ganjali, M.R.; Norouzi, P.; Khani, H.; Nayak, A.; Agarwal, S. Electrochemical Analysis of Some Toxic Metals by Ion–Selective Electrodes. Crit. Rev. Anal. Chem. 2011, 41, 282–313. [Google Scholar] [CrossRef]
- Hsiang, M.C.; Sung, Y.H.; Huang, S. Da Direct and Simultaneous Determination of Arsenic, Manganese, Cobalt and Nickel in Urine with a Multielement Graphite Furnace Atomic Absorption Spectrometer. Talanta 2004, 62, 791–799. [Google Scholar] [CrossRef]
- Cassella, R.J.; Magalhães, O.I.B.; Couto, M.T.; Lima, E.L.S.; Neves, M.A.F.S.; Coutinho, F.M.B. Synthesis and Application of a Functionalized Resin for Flow Injection/F AAS Copper Determination in Waters. Talanta 2005, 67, 121–128. [Google Scholar] [CrossRef]
- Mashhadizadeh, M.H.; Pesteh, M.; Talakesh, M.; Sheikhshoaie, I.; Ardakani, M.M.; Karimi, M.A. Solid Phase Extraction of Copper (II) by Sorption on Octadecyl Silica Membrane Disk Modified with a New Schiff Base and Determination with Atomic Absorption Spectrometry. Spectrochim. Acta - Part B At. Spectrosc. 2008, 63, 885–888. [Google Scholar] [CrossRef]
- Chrastný, V.; Komárek, M. Copper Determination Using ICP-MS with Hexapole Collision Cell. 2009, 63, 512-519. [CrossRef]
- Wu, Q.; He, J.; Meng, H.; Wang, Y.; Zhang, Y.; Li, H.; Feng, L. A Paper-Based Microfluidic Analytical Device Combined with Home-Made SPE Column for the Colorimetric Determination of Copper(II) Ion. Talanta 2019, 204, 518–524. [Google Scholar] [CrossRef]
- Cotton, D.H.; Jenkins, D.R. The Determination of Very Low Concentrations of Copper, Iron and Lead in Hydrocarbon Fuels by Atomic Fluorescence Spectrometry. Spectrochim. Acta Part B At. Spectrosc. 1970, 25, 283–288. [Google Scholar] [CrossRef]
- Hu, Q.; Yang, G.; Zhao, Y.; Yin, J. Determination of Copper, Nickel, Cobalt, Silver, Lead, Cadmium, and Mercury Ions in Water by Solid-Phase Extraction and the RP-HPLC with UV-Vis Detection. Anal. Bioanal. Chem. 2003, 375, 831–835. [Google Scholar] [CrossRef] [PubMed]
- Xiong, X.; Jiang, T.; Zhou, R.; Wang, S.; Zou, W.; Zhu, Z. Microwave Plasma Torch Mass Spectrometry for the Direct Detection of Copper and Molybdenum Ions in Aqueous Liquids. J. Mass Spectrom. 2016, 51, 369–377. [Google Scholar] [CrossRef] [PubMed]
- Harvey, D.G.; Frederick, S. The Copper Reagents: Cuproine, Neocuproine, Bathocuproine; G. Frederick, S., Ed.; 1r ed.; Chemical Company, Columbus: Ohio, 1958;
- Pourbasheer, E.; Morsali, S.; Banaei, A.; Aghabalazadeh, S.; Ganjali, M.R.; Norouzi, P. Design of a Novel Optical Sensor for Determination of Trace Amounts of Copper by UV/Vis Spectrophotometry in the Real Samples. J. Ind. Eng. Chem. 2015, 26, 370–374. [Google Scholar] [CrossRef]
- Gahler, A.R. Colorimetric Determination of Copper with Neo-Cuproine. Anal. Chem. 1954, 26, 577–579. [Google Scholar] [CrossRef]
- Ogawa, T.; Hata, N.; Taguchi, S. Technical Note Selective a N D Sensitive Spectrophotometric Determination of Copper in Water After Collection of Its Bathocuproine Complex on an Organic-Solvent-Soluble Membrane Filter. 1989, 23, 933–936.
- G. FREDERICK SJIITH.; W. H. MCCURDT, J. New Specific in Spectrophotometric Determination of Copper. Anal. Chem. 1952, 24, 371–373. [Google Scholar]
- Smith, G.F.; Wilkins, D.H. New Colorimetric Reagent Specific for Cooper. Anal. Chem. 1953, 25, 510–511. [Google Scholar] [CrossRef]
- Moffett, J.W.; Zika, R.G.; Petasne, R.G. Evaluation of Bathocuproine for the Spectro-Photometric Determination of Copper(I) in Copper Redox Studies with Applications in Studies of Natural Waters. Anal. Chim. Acta 1985, 175, 171–179. [Google Scholar] [CrossRef]
- Hoste, J.; Eeckhout, J.; Gillis, J. Spectrophotometric Determination of Copper with Cuproine. Anal. Chim. Acta 1953, 9, 263–274. [Google Scholar] [CrossRef]
- Rajput, N.; Kadam, V.; Devi, S. Spectrophotometric Determination of Copper (II) Using Cupron in the Presence of Brij 35. Indian J. Chem. 1994, 33A, 1–3. [Google Scholar]
- Wiberley, S.E.; Dunleavy, R.A.; Harley, J.H. Rapid Photometric Determination of Copper in Ferrous Alloys. Anal. Chem. 1950, 22, 170–172. [Google Scholar] [CrossRef]
- Thongkam, T.; Apilux, A.; Tusai, T.; Parnklang, T.; Kladsomboon, S. Thy-AuNP-AgNP Hybrid Systems for Colorimetric Determination of Copper (II) Ions Using UV-Vis Spectroscopy and Smartphone-Based Detection. Nanomaterials 2022, 12. [Google Scholar] [CrossRef] [PubMed]
- Reshetnyak, E.A.; Ivchenko, N.V.; Nikitina, N.A. Photometric Determination of Aqueous Cobalt (II), Nickel (II), Copper (II) and Iron (III) with 1-Nitroso-2-Naphthol-3,6-Disulfonic Acid Disodium Salt in Gelatin Films. Cent. Eur. J. Chem. 2012, 10, 1617–1623. [Google Scholar] [CrossRef]
- Kang, J.H.; Lee, S.Y.; Ahn, H.M.; Kim, C. Sequential Detection of Copper(II) and Cyanide by a Simple Colorimetric Chemosensor. Inorg. Chem. Commun. 2016, 74, 62–65. [Google Scholar] [CrossRef]
- Zhou, F.; Li, C.; Zhu, H.; Li, Y. Simultaneous Determination of Trace Metal Ions in Industrial Wastewater Based on UV–Vis Spectrometry. Optik (Stuttg). 2019, 176, 512–517. [Google Scholar] [CrossRef]
- Turkoglu, O.; Soylak, M. Spectrophotometric Determination of Copper in Natural Waters and Pharmaceutical Samples with Chloro(Phenyl) Glyoxime. J. Chinese Chem. Soc. 2005, 52, 575–579. [Google Scholar] [CrossRef]
- Zhou, F.; Li, C.; Zhu, H.; Li, Y. A Novel Method for Simultaneous Determination of Zinc, Nickel, Cobalt and Copper Based on UV–Vis Spectrometry. Optik (Stuttg). 2019, 182, 58–64. [Google Scholar] [CrossRef]
- Aydin, Z.; Keles, M. Colorimetric Detection of Copper(II) Ions Using Schiff-Base Derivatives. ChemistrySelect 2020, 5, 7375–7381. [Google Scholar] [CrossRef]
- Shen, Q.; Li, W.; Tang, S.; Hu, Y.; Nie, Z.; Huang, Y.; Yao, S. A Simple “Clickable” Biosensor for Colorimetric Detection of Copper(II) Ions Based on Unmodified Gold Nanoparticles. Biosens. Bioelectron. 2013, 41, 663–668. [Google Scholar] [CrossRef] [PubMed]
- Rumori, P.; Cerdà, V. Reversed Flow Injection and Sandwich Sequential Injection Methods for the Spectrophotometric Determination of Copper(II) with Cuprizone. Anal. Chim. Acta 2003, 486, 227–235. [Google Scholar] [CrossRef]
- León, L.; Carbajo, J.; Maraver, J.J.; Mozo, J.D. Sequential Determination of Mono- and Divalent Copper in Water by Flow-Injection Analysis. J. Electrochem. Soc. 2014, 161, H183–H188. [Google Scholar] [CrossRef]
- Ricart, D.; Dorado, A.D.; Lao-Luque, C.; Baeza, M. Microflow Injection Analysis Based on Modular 3D Platforms and Colorimetric Detection for Fe(III) Monitoring in a Wide Concentration Range. Mikrochim. Acta 2023, 191, 3. [Google Scholar] [CrossRef] [PubMed]
- Baeza, M.; Montesinos, J.L.; Alonso, J.; Bartrolí, J. Simple Modeling of the Physical Sample Dispersion Process in Rectangular Meso (Micro) Channels with Pressure-Driven Flows. Anal. Bioanal. Chem. 2009, 393, 1233–1243. [Google Scholar] [CrossRef] [PubMed]
- Nikola Tesla Valvular Conduit (U.S. Patent No. 1,329,559) 1920.
- Abdelwahed, M.; Chorfi, N.; Malek, R. Reconstruction of Tesla Micro-Valve Using Topological Sensitivity Analysis. Adv. Nonlinear Anal. 2019, 9, 567–590. [Google Scholar] [CrossRef]
- Horwitz, W. Evaluation of Analytical Methods Used for Regulation of Foods and Drugs. Anal. Chem. 1982, 54, 67–76. [Google Scholar] [CrossRef]
- McNaught, A.D.; Wilkinson, A. Compendium of Chemical Terminology; IUPAC Nomenclature Books Series (“Color Books”); 2nd editio. Blackwell Science: Oxford, 1997; ISBN 0-86542-6848. [Google Scholar]
- Farhood, A.S.; Taha, D.N. A New Flow Injection System with Merging-Zone Technique for the Determination of Copper(II) by Neocuproine Reagent in Aqueous Solution. Indones. J. Chem. 2022, 22, 770–779. [Google Scholar] [CrossRef]
- Ali, K.J.; Abdul, N.; Hameed, R. Determination of Copper (II) by Glycine in Flow Injection and Sequential Injection Techniques. Acta Chim. Pharm. Indica 2014, 4, 157–169. [Google Scholar]
- Jiatai Wei Catalytic Flow-Injection Determination of Sub-Ppb Copper ( II ) Using the Redox Reaction of Cysteine with Iron ( III ) in the Presence of TPTZ. Anal. Sci. 2003, 19, 731–735. [CrossRef] [PubMed]
- Zenki, M.; Iwadou, Y.; Yokoyama, T. Flow-Injection Analysis of Copper(II) with PAR in the Presence of EDTA. Anal. Sci. 2002, 18, 1077–1079. [Google Scholar] [CrossRef]
- Tag, K.; Riedel, K.; Bauer, H.J.; Hanke, G.; Baronian, K.H.R.; Kunze, G. Amperometric Detection of Cu2+ by Yeast Biosensors Using Flow Injection Analysis (FIA). Sensors Actuators, B Chem. 2007, 122, 403–409. [Google Scholar] [CrossRef]
- Asan, A.; Isildak, I.; Andac, M.; Yilmaz, F. A Simple and Selective Flow-Injection Spectrophotometric Determination of Copper(II) by Using Acetylsalicylhydroxamic Acid. Talanta 2003, 60, 861–866. [Google Scholar] [CrossRef] [PubMed]
- Ohno, S.; Tanaka, M.; Teshima, N.; Sakai, T. Successive Determination of Copper and Iron by a Flow Injection-Catalytic Photometric Method Using a Serial Flow Cell. Anal. Sci. 2004, 20, 171–175. [Google Scholar] [CrossRef] [PubMed]
- Lima, J.L.F.C.; Delerue-Matos, C.; Vaz, M.C.V.F. Automation of Iron and Copper Determination in Milks Using FIA Systems and Colourimetric Detection. Food Chem. 1998, 62, 117–121. [Google Scholar] [CrossRef]
Figure 1.
A) Micro-FIA system diagram to determine Cu(II). a) Peristaltic pump for diluent, carrier and reagent, b) peristaltic pump for ethanol and sample, c) six-way injection valve, d) platform 1 for copper reduction and dilution by adding diluent e) platform 2 for neocuproine reaction, f) platform 3 for complex dilution by dispersion, g) detector and h) analytical signal which is a voltage signal and the peak height is proportional to Cu(II) concentration. B) Diagram and sequences of time to analytical signal.
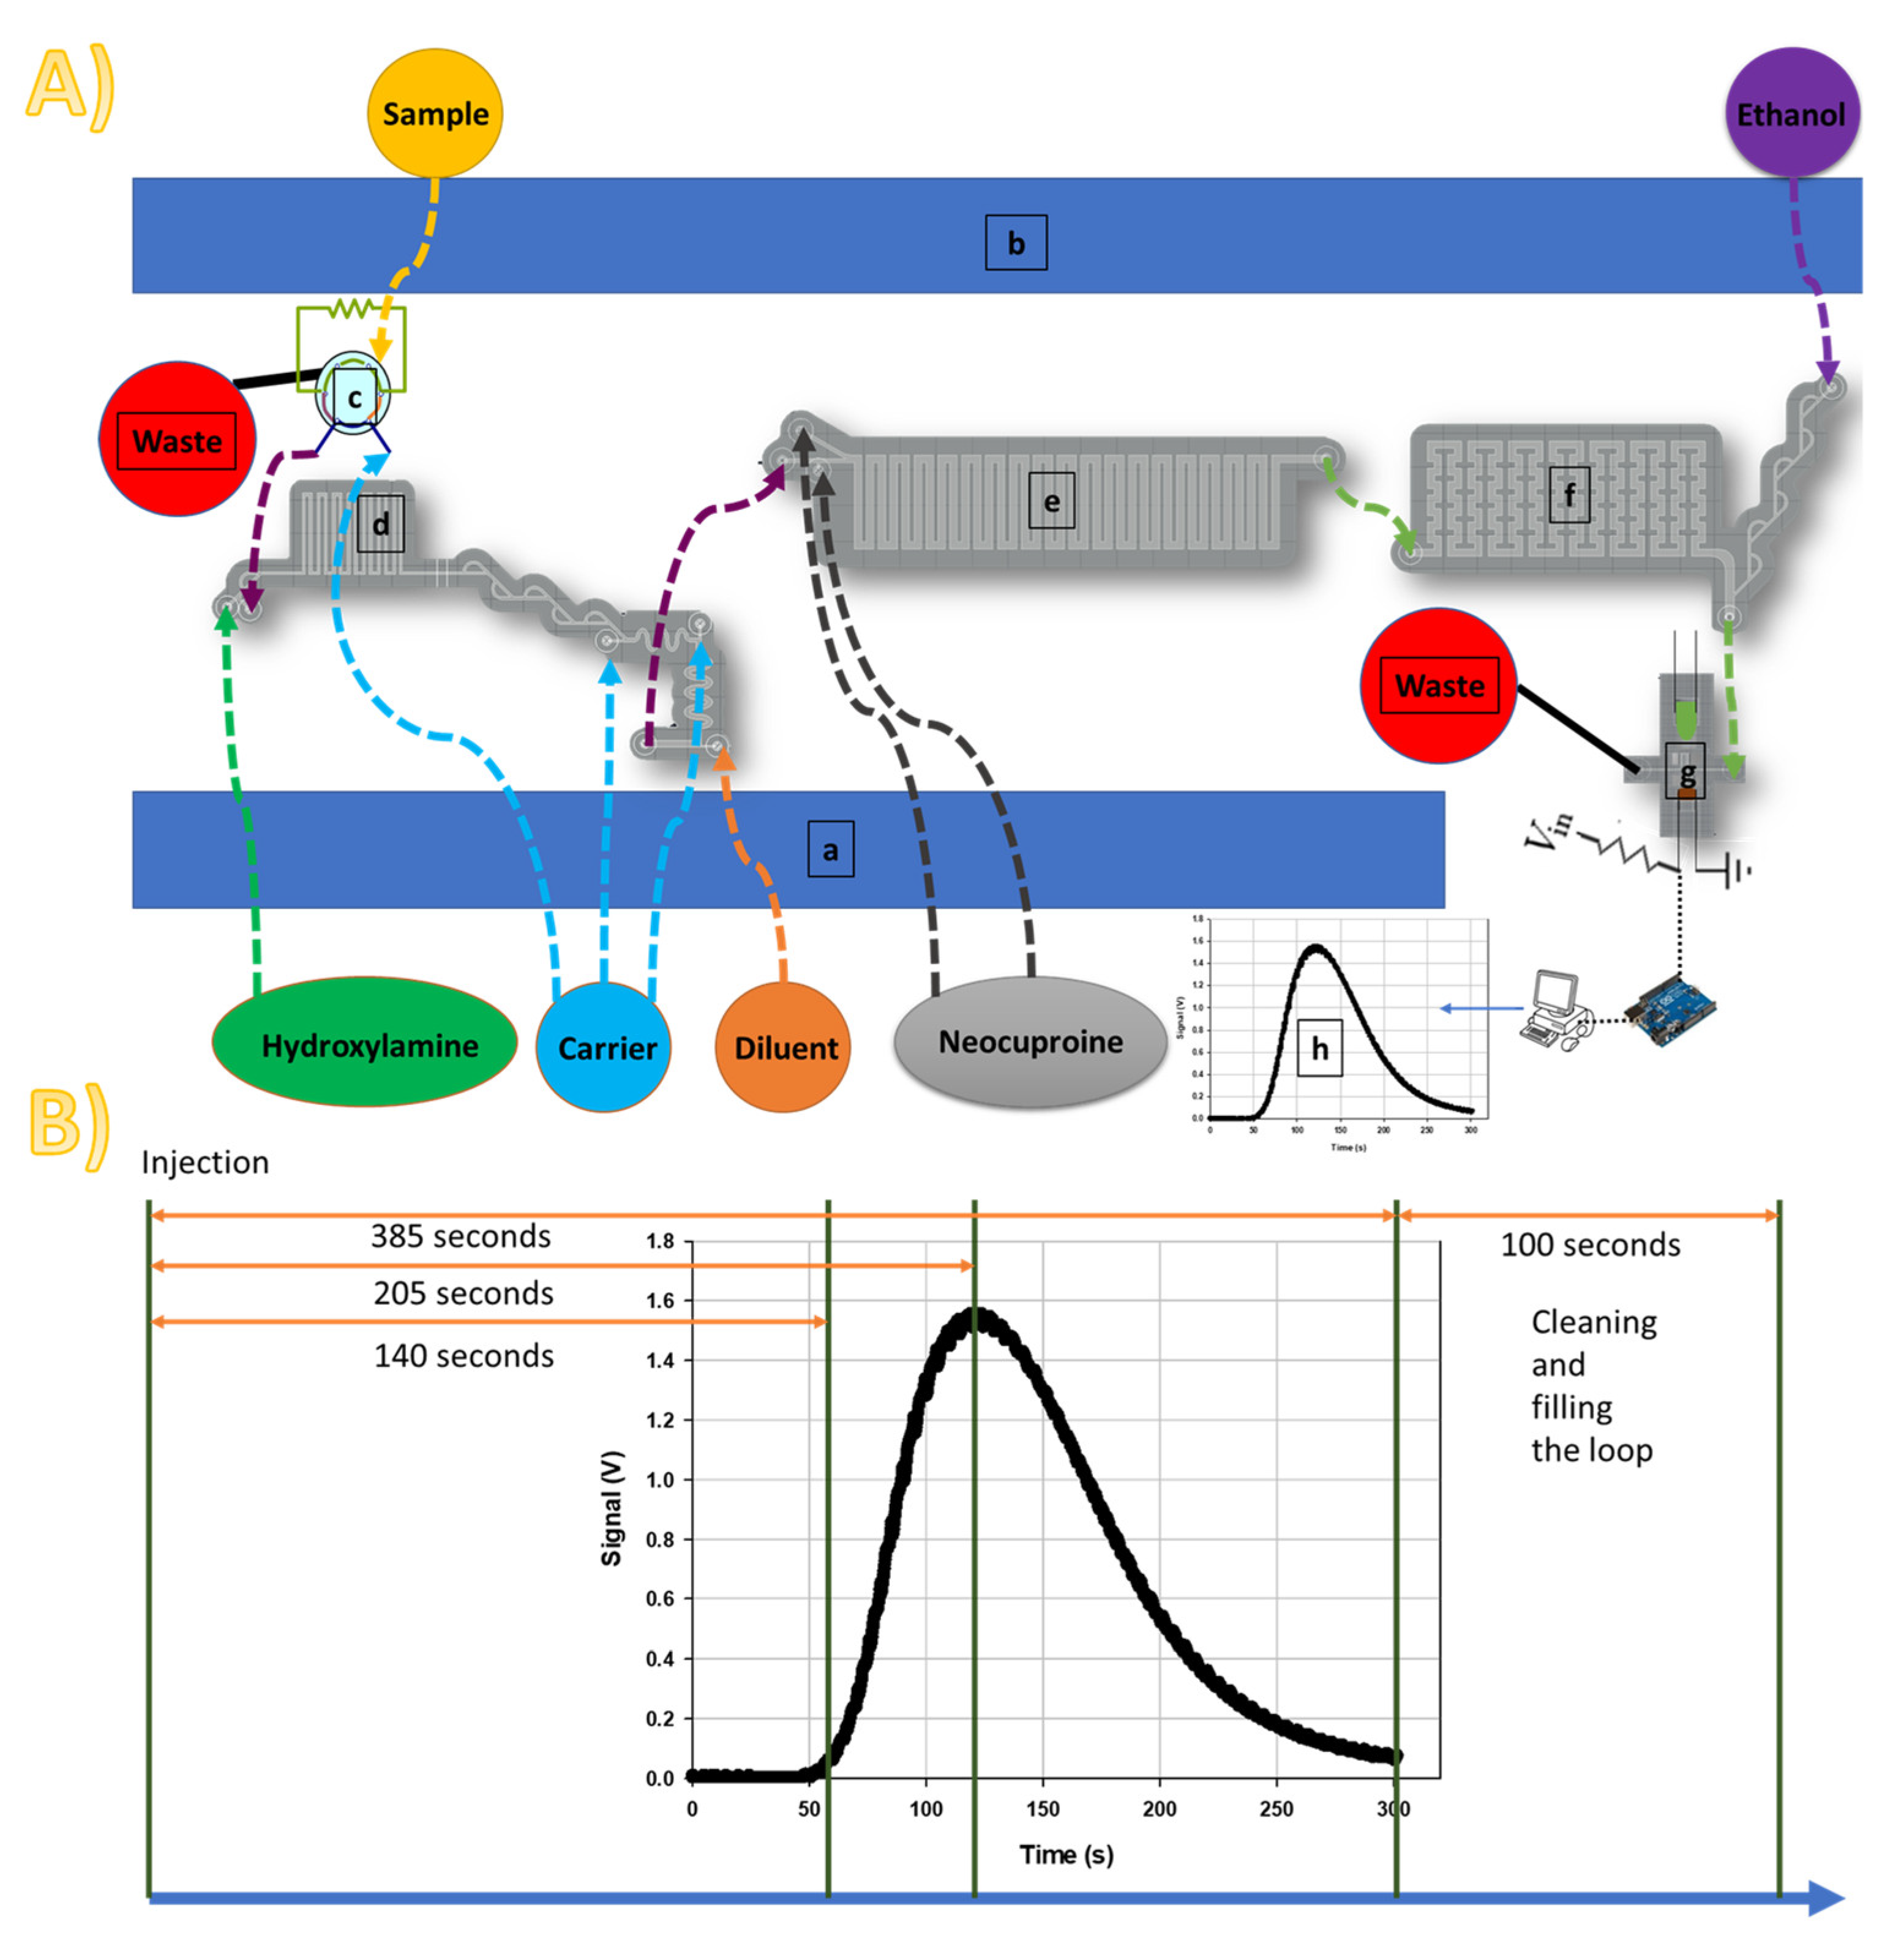
Figure 3.
Calibration performed of Cu(II) in the micro-FIA at optimal conditions. A) Analytical signal (λ= 455 nm) at different concentrations, B) blank and C) calibration plot. The equation of the calibration curve is Peak height (V)= 0.00079 ± 0.00002 [Cu(II)] + 0.01 ± 0.02 (R2=0.998; n=5 by triplicate).
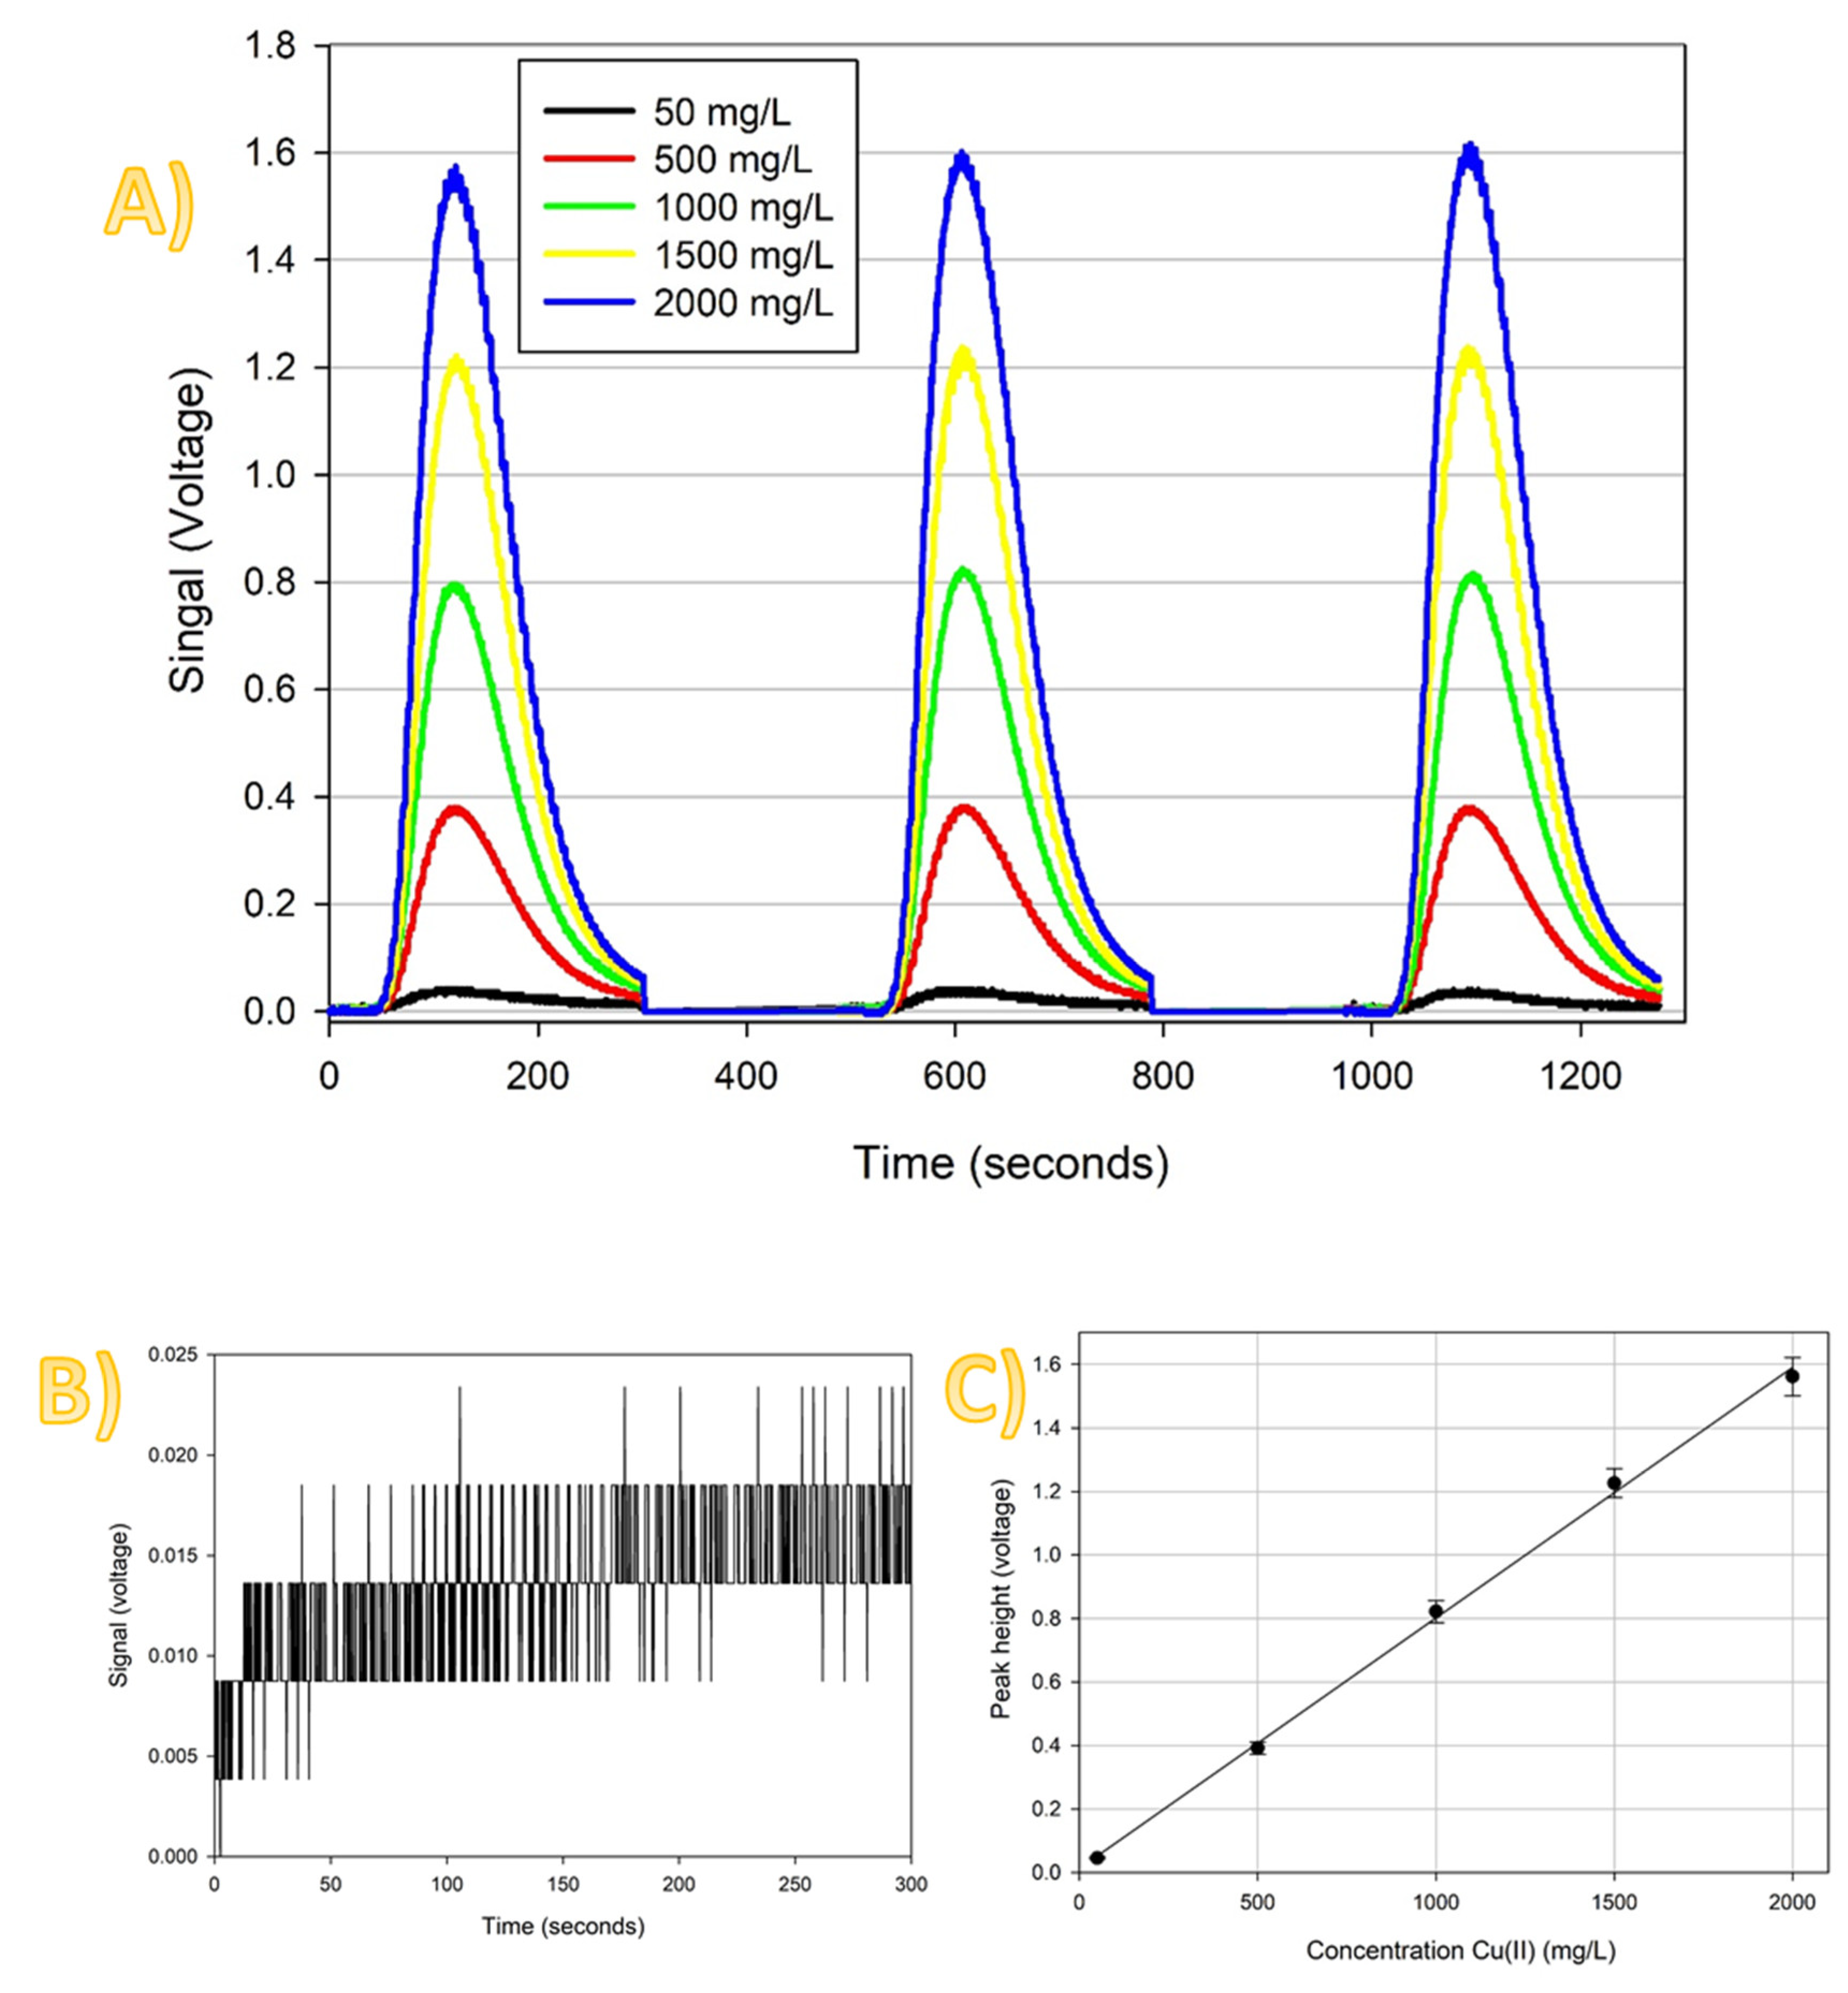
Figure 4.
Comparison between online measurement using novel micro-FIA system (n=1) and batch determination by reference method (atomic absorption) (n=1). Experimental uncertainty is determined for error interpolation.
Figure 4.
Comparison between online measurement using novel micro-FIA system (n=1) and batch determination by reference method (atomic absorption) (n=1). Experimental uncertainty is determined for error interpolation.
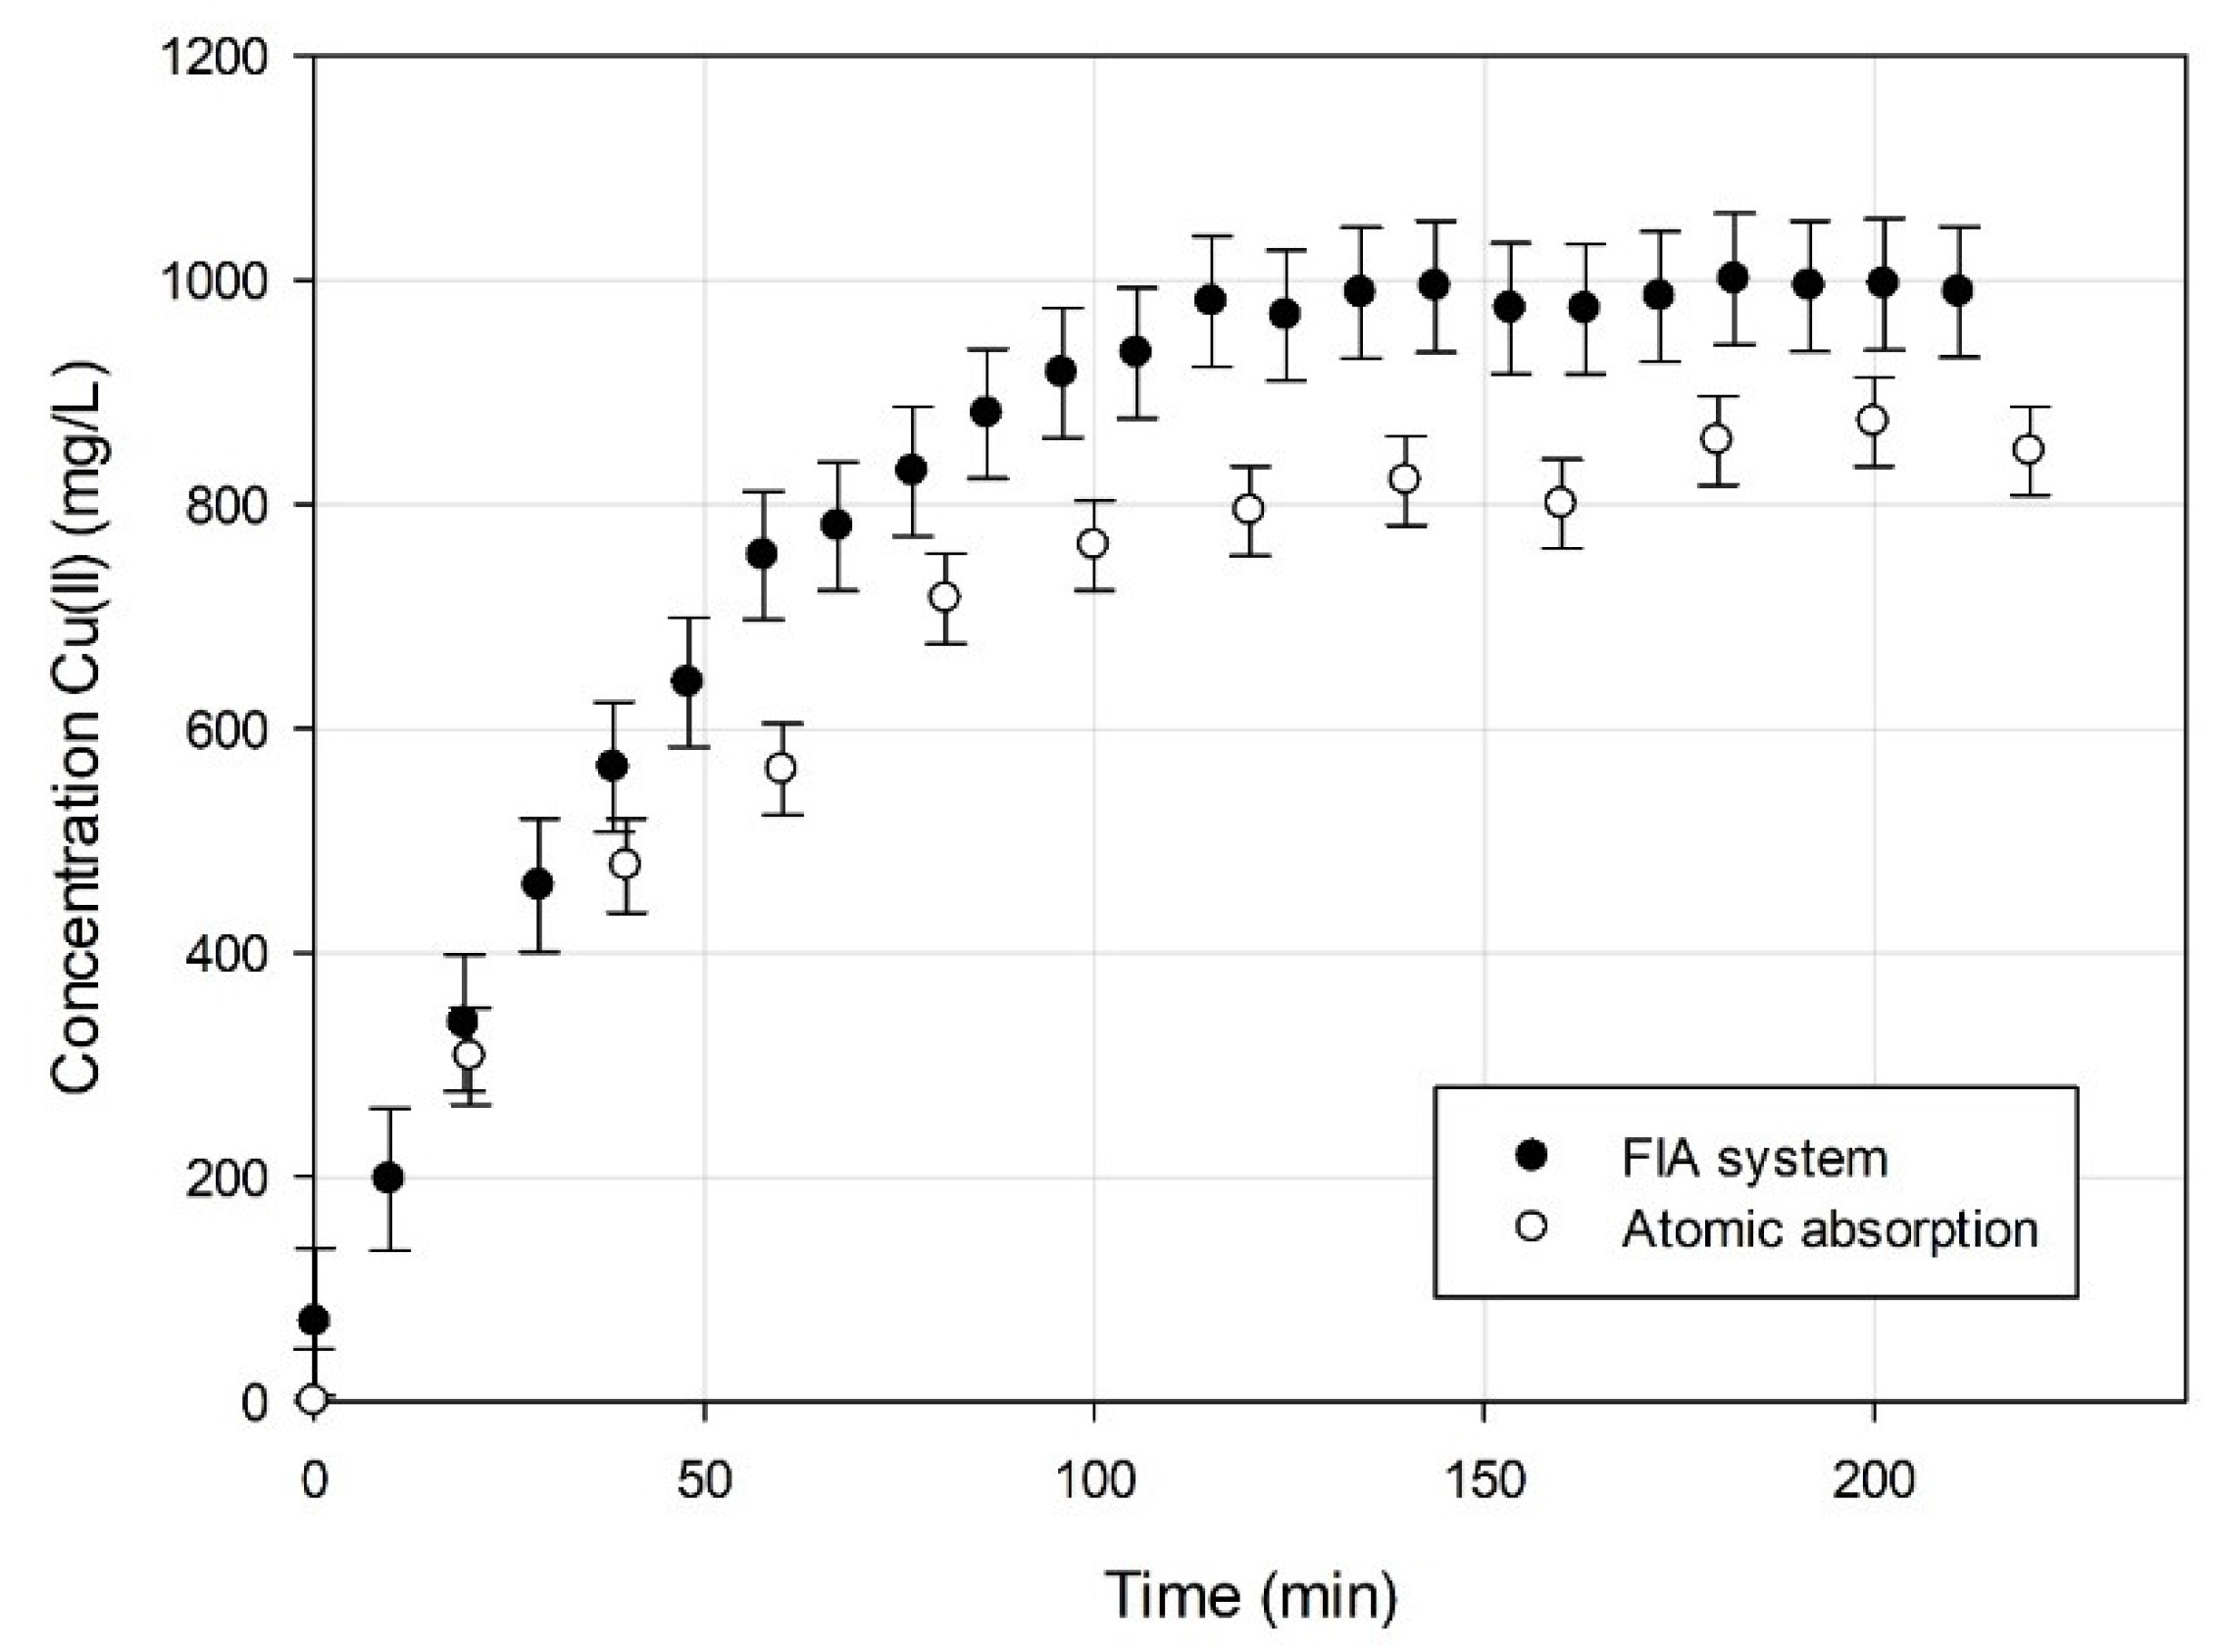

Table 1.
Accuracy results of samples from copper electrodeposition using micro-FIA system.
| Sample | Concentration of copper in samples (mg L-1) | Concentration of copper in spiked samples (mg L-1) | Recovery (%) | ||
|---|---|---|---|---|---|
| Sample 1 | 678 ± 18 | 1193 ± 13 | 103.0 | ||
| Sample 2 | 967 ± 5 | 1464 ± 11 | 99.4 | ||
| Sample 3 | 1380 ± 9 | 1882 ± 22 | 100.4 | ||
Table 2.
Principal parameters of quality of the automatic micro-FIA developed for determination of Cu(II).
Table 2.
Principal parameters of quality of the automatic micro-FIA developed for determination of Cu(II).
| Parameter | Value |
|---|---|
| Sensitivity (V L mg-1) | 0.00078 ± 0.00002 |
| Detection limit (mg L-1) | 9 |
| Quantification limit (mg L-1) | 34 |
| Linear range (mg L-1) | 34 - 2000 |
| Repeatability (CV) (n=6) | 0.3% - 1.1% |
| Reproducibility (CV) (n=12) | 3.9% - 7.4% |
| Selectivity | not interferences [52] |
| Sample throughput (h-1) | 7 |
| Accuracy (R%) | 101 ± 2 |
Table 3.
Results from the micro-FIA system of the different samples compared with the results from atomic absorption as reference method. All samples were analyzing in triplicate. Experimental uncertainty expresses as the standard deviation.
Table 3.
Results from the micro-FIA system of the different samples compared with the results from atomic absorption as reference method. All samples were analyzing in triplicate. Experimental uncertainty expresses as the standard deviation.
| Sample | [Cu(II)] added (mg L-1) |
Copper concentration Micro-FIA (mg L-1) | Copper concentration Atomic absorption (mg L-1) |
|---|---|---|---|
|
Copper electrodeposition |
- | 763 ± 6 | 785 ± 32 |
| - | 1278 ± 16 | 1257 ± 28 | |
| - | 1706 ± 18 | 1698 ± 22 | |
| Leaching of ion-Li scooter batteries | - | 213 ± 14 | 218 ± 7 |
| - | 1131 ± 10 | 1241 ± 28 | |
| Water from lake in “Parc de l’agulla” | 600 | 409 ± 6 | 334 ± 25 |
| 1200 | 1044 ± 9 | 1011 ± 23 | |
| 1800 | 1616 ± 10 | 1619 ± 19 | |
| Bioreactor sample | 100 | 65 ± 2 | 92 ± 2 |
| 1900 | 1819 ± 25 | 1814 ± 10 |
Disclaimer/Publisher’s Note: The statements, opinions and data contained in all publications are solely those of the individual author(s) and contributor(s) and not of MDPI and/or the editor(s). MDPI and/or the editor(s) disclaim responsibility for any injury to people or property resulting from any ideas, methods, instructions or products referred to in the content. |
© 2024 by the authors. Licensee MDPI, Basel, Switzerland. This article is an open access article distributed under the terms and conditions of the Creative Commons Attribution (CC BY) license (http://creativecommons.org/licenses/by/4.0/).
Copyright: This open access article is published under a Creative Commons CC BY 4.0 license, which permit the free download, distribution, and reuse, provided that the author and preprint are cited in any reuse.


