Submitted:
28 May 2024
Posted:
29 May 2024
You are already at the latest version
Abstract
Spray penetration into citrus canopies is critical for adequate coverage and deposition to ensure effective pest control. However, mismatch of air assistance to target canopy characteristics can lead to unintended spray loss through over penetration. To evaluate the effect of air assistance on on-target deposition, two sprayers (surrogates for airflow rates) were used to apply a fluorescent tracer dye solution @ target concentration of 300 ppm to 16 medium foliage density tree blocks in a commercial mandarin orchard. The complete factorial experiment in three replications comprised two ground speeds (1.6 and 4.8 km/h), two disc-core nozzles (TeeJet® D3-25 and D6-45), and either one or two nozzle rows to obtain a wide range of application rates (496 to 9,719 L/ha). Dye deposition significantly decreased with canopy depth (p=<0.001) by nearly 7 times across the 3.4-m-wide canopies but was not significant over 1.2 to 2.2 m sampling height (p=0.867). Deposition obtained with the low airflow rate sprayer was significantly greater (p=<0.001) than that obtained with the high airflow rate sprayer over the dose range likely due to too much air pushing out spray droplets. This study underscores the importance of matching the air assistance of orchard sprayers to the target canopy.
Keywords:
air-assistance
; airblast sprayer
; application rate
; fluorometry
; spray penetration
1. Introduction
California citrus producers mostly use airblast sprayers for pesticide application. These sprayers produce an air jet from each side – using a single or double axial-flow fan – which is intended to carry the spray to the target. The application entails applying spray from both sides of the sprayer onto target tree canopies as an operator drives the sprayer between tree rows [1]. However, while spraying the edge row of the orchard, spray is discharged from only one side of the sprayer toward the tree canopies while nozzles pointing away from the orchard are closed.
Spray penetration into citrus canopies is critical for adequate coverage and deposition to ensure effective pest control. However, while the air assistance also helps the spray droplets to penetrate the target canopies to deposit deep inside the canopy [1,2,3], a mismatch with target canopy characteristics can lead to unintended spray loss through over penetration. Consequently, especially near the edge of the orchard, this can increase the potential for spray droplets to drift from the intended application site to unintended locations [4,5,6].
Therefore, depending on the canopy foliage density, the amount of air can either work for or against the objective of optimizing deposition of the spray within the canopy [7,8,9]. It is the airflow (volume) rate, not merely the air velocity, that affects deposition [10]. Use too little air, and the spray will not penetrate sufficiently; use too much, and the spray will be excessively pushed through the canopy [8]. Using the right amount of air requires making intentional adjustments during sprayer calibration and properly documenting the settings for future reference. Adjustments can be made manually or by using electro-mechanical means if available. Adjusting airflow rate with an electro-mechanical system [7], observed the potential to reduce airblast spray application losses by reducing the airflow.
Airblast sprayers typically have a high and a low gear setting for regulating the fan between two speeds at full throttle, as well as a neutral setting for turning the fan off when needed. Also, the fan speed varies proportionally with the throttle setting. Additionally, the airflow rate per unit travel distance, like the spray application rate, is inversely proportional to the sprayer travel speed [11]. The air volume rate can further be restricted for smaller target canopies by reducing the fan’s inlet size for small target canopies requiring little air-assistance [8].
Most airblast sprayers have a single fan, however, some have two. For the same fan size and fan speed, a two-fan sprayer theoretically discharges twice the air volume of the single-fan sprayer without affecting the spray application rate. However, the difference in air assistance can lead to different extents of canopy penetration and different measures of spray deposition. Hence, the objective of this study was to evaluate by fluorometry the effect of air assistance on on-target deposition using two sprayers (a single-fan and a double-fan sprayer) as surrogates for airflow rates. The results will be used to update extension education resources for California citrus growers. Moreover, the data will be utilized towards validating spray application decision support systems to help growers to optimize their spray application.
2. Materials and Methods
2.1. Spray Field Experiment
To fulfil the above objectives, an airblast spray deposition field investigation was conducted in early December 2020 in a commercial mandarin (Citrus reticulata) orchard located in Exeter, California. Tree rows were oriented in east-west direction. The trees were up to 3.7 m tall (including overgrowth) with 3.4 m canopy width and 0.3 m skirt height on average and having 5.5-m row spacing and 2.4-m tree spacing within rows. Sixteen blocks of trees were selected, each block consisting of about 25 successive trees. Tree blocks were separated within the same row by about 10 successive buffer trees and across rows by two successive buffer rows. Spray treatments as described below were applied to the tree blocks, from the south side of each block. Two ATMOS 41 All-in-one weather sensors fixed at 1.8 m high and connected to Zentra ZL6 dataloggers (METER Group, Inc., Pullman, WA) were installed to record weather data, one centrally inside the orchard and another outside at the northeast corner of the orchard.
Pyranine fluorescent tracer dye solution (@ a target concentration of 300 ppm) was sprayed on tree blocks in a complete factorial experimental design at two ground speeds (1.6 and 4.8 km/h) using two different sizes of ceramic disc-core nozzles (TeeJet® D3-25 and D6-45) on either one or two rows of nozzles in three replications. Two different sprayers were used in the application as surrogates for airflow rate leading to 16 treatments in total. The sprayers were both Air-O-Fan engine-powered sprayers (Air-O-Fan, Reedley, California, USA): a D-39 with a single fan and a D-2/40 with two fans. By design, the D-2/40 sprayer delivered nearly twice the airflow rate at the air outlet of that produced by the D-39 sprayer. Airflow rates were estimated as 48.2 m3/s for the D-39 sprayer and 101.5 m3/s for the D-2/40 sprayer. The D-39 sprayer had two rows of nozzles per side of sprayer each with 9 counts of nozzles whereas the D-2/40 sprayer had three nozzle rows per side, as shown in Figure 1. Figure 2 provides a summary of the treatments used in the experiment while Figure 3 shows the schematic of how the treatments were applied in the orchard. Table 1 provides a summary of the application rates achieved in the different spray treatments. The difference in air volume rates between the sprayers did not affect the application rates.
After applying the spray treatments, three random trees (replicates) were selected for sampling in each block corresponding to a treatment. Sprayed leaf samples were collected at three canopy heights (H1 = 1.2 m; H2 = 1.7 m; H3 = 2.2 m) and four canopy depths (D1 = 0 m; D2 = 0.6 m; D3 = 2.7 m; and D4 = 3.4 m) as indicated in Figure 4, placed in labeled plastic sample bags, and temporarily stored in an ice chest in the field before transporting to the lab to be stored in a refrigerator while awaiting analysis.
2.2. Sample Analysis
The samples were analyzed in the lab by fluorometry [12]. A total of 576 leaf samples (i.e., 3 canopy heights × 4 canopy depths × 16 treatments × 3 replications) were analyzed together with sprayer tank samples. Following the fluorometric analysis, the total area of each leaf sample was also obtained using a leaf area meter (LI-COR Biosciences, Lincoln, NE) (Figure 5) and combined with the fluorometric data to obtain spray deposition in ng/cm2. The deposition data were normalized by tank sample to correspond to 300 ppm concentration. Deposition value from canopy sampling location H2D2 for one replication was carefully evaluated as an outlier, likely due to an unusual measurement error. Being over three times the expected range, it was eliminated from further analysis to prevent undue influence on the data.
2.3. Statistical Analysis
The dye deposition data were organized by treatment and by replication and summary statistics were obtained accordingly for each sampling depth and height, and averaged. Analysis of the main effects and interactions among the application parameters (factors) was performed to generate two-factor interaction plots that were used to examine the effect of the factors on spray deposition. A combination of t-test, two-way analysis of variance (ANOVA), three-way ANOVA, and multiple linear regression (MLR) were performed on the data to help explain the variation in the data. All statistical analyses were done at a significance level of 0.05.
3. Results
Results of the study are discussed subsequently, covering spray deposition ensuing from the spray treatments, effects and interactions of the application variables tested (factors) on deposition, and prevailing weather condition during the experiment and its effect on deposition.
3.1. Spray Deposition
Overall (Figure 6), on-target dye deposition decreased significantly with canopy depth (p=<0.001), based on a 3-way ANOVA, but the decrease was not significant from D1 to D2 (near side) or D3 to D4 (far side) (Figure 6a). The nearside on average received nearly 7 times canopy deposition that at the far side. However, deposition was similar at different heights as there was not a statistically significant difference (p=0.867) in deposition over sampling height (Figure 6b). Deposition obtained with the D-39 sprayer was consistently greater than that obtained with the D-2/40 sprayer at all canopy depths and sampling heights (Figure 7). Despite significance indicated only at the canopy boundary (Figure 7a) and the lowest sampling height (Figure 7b), the overall difference between the sprayers was significant (p=<0.001). There was no significant interaction (p≥0.513) among airflow rate, canopy depth, and sampling height.
Further examination of the mean canopy deposition achieved at different spray application rates is shown in Figure 8. The data show a similar increasing trend for both the D-39 and D-2/40 sprayers. However, spray deposition achieved using the D-2/40 sprayer was consistently lower than that achieved with the D-39 sprayer based on polynomial curve fitting.
3.2. Factor Effects and Interactions
The overall trends in the spray deposition data (LS means) are shown in the matrix of two-factor interaction graphs in Figure 9. It shows that deposition decreased to different extents with increasing airflow rate: at all travel speeds; for both nozzle sizes; and using either one or two nozzle rows. Deposition also decreased with increasing travel speed for all nozzle sizes and using either one or two nozzle rows. However, deposition increased with increasing nozzle size using either one or two nozzle rows. Except for airflow rates, these trends are consistent with the variation in the applied dose based on changing corresponding application variables.
Based on an MLR at a significance level of 0.05, all four factors (airflow rate, travel speed, nozzle size, and nozzle row) were identified as significant factors (p=<0.001) for predicting deposition. Further analysis of the three factors (excluding airflow rate) using a three-way ANOVA at a significance level of 0.05 indicated that the main effects of all three factors could not be properly interpreted since the size of their effects depend upon the level of another factor. This is because of statistically significant interactions between travel speed and nozzle size (p=0.001) and between travel speed and nozzle row (p=0.026), but not between nozzle size and nozzle row (p=0.211).
3.3. Weather Effects
The weather conditions that prevailed inside and outside the orchard during the experiment are summarized in Table 2. Generally, it was cool (air temperature: 17.4±1.16 °C inside; 18.3±1.06 °C outside) and very dry (relative humidity: 33.2±2.94% inside; 27.3±1.9% outside), with low wind speeds (0.43±0.12 m/s inside; 1.02±0.34 m/s outside). With exception of solar radiation which was not significantly different (p=0.9827), there was significant differences (p≤0.0272) between the weather conditions inside and outside the orchard based on corresponding t-tests. As a visual comparison, Figure 10 shows the compass roses for both inside and outside of the orchard during the experiment. Based on an MLR at significance level of 0.05 with application rate and all the weather variables as input factors, none of the weather variables was found to significantly influence the resulting dye deposition (p=0.007).
4. Discussion
The levels of spray deposition inside the target canopy are a function of how much spray material is available to be captured by canopy foliage owing to dispersion and leaf interception at prior depths. Hence, the reduction in deposition over canopy depth as observed indicates that less and less spray material was available for capture deeper and deeper into the canopy. This is indicative of spray penetration as observed by [3,10]. Even without the presence of a target the amount of spray material moved by the air jet decreases drastically from the air outlet due to dispersion, as corroborated by [1,11,13]. While no difference in deposition was observed in this study, decline in deposition over sampling height has been observed in conventional airblast sprayers by others such as [3].
Going back to the basics of airblast spray application, the trend in deposition across canopy depth explains why sprayer calibration is done with the objective of applying spray to half of the target canopy on each side of the sprayer. This means that spray must be applied to the same canopies from both sides to obtain full canopy coverage. The profile of the canopy also needs to be considered in configuring the nozzles to ensure uniformity of deposition over canopy height configuration [14,15].
The superior deposition achieved by the lower airflow rate sprayer implies that fan speed, sprayer airflow rate, or sprayer air speed was significant, meaning that using the much powerful D-2/40 sprayer for the medium foliage trees as against the D-39 sprayer rather increased spray loss. The lower deposition from the higher-air-volume sprayer can be mostly attributed to a loss of spray due to overpenetration. In other words, it appears that the extra push on the spray by the D-2/40 sprayer fan air caused some of the spray that would have otherwise deposited within the canopy to blow through and exit from the far side of the canopy. Such an occurrence near the edge of the orchard row can lead to increased spray drift potential [16,17]. In addition, spray runoff from canopy foliage can partly account for the lower deposition from the higher airflow sprayer at the nearside of the canopy. This assessment agrees with the findings of [11].
The general increasing/decreasing trends in canopy deposition are consistent with the variation in spray application rate (dose) due to changes in factor values, and are consistent with the findings of [18] in olives. Changing any of the three factors varies spray application rate, hence determining the amount of spray that would be available for capture by the target canopy in the first place. However, although increasing application rate increased the canopy deposition, percentage deposition was observed to decrease with increasing application rate. This observation agrees with those of [19] who observed the decreasing trend beyond 2000 L/ha. However, these trends are also based on non-normalized data and do not reflect trends from normalized data such as those of [11].
While the prevailing weather conditions at the time of the spray treatments may have determined the range of deposition achieved, weather did not significantly affect deposition between the different spray treatments.
5. Conclusions
This study underscores the importance of matching the air assistance of orchard sprayers to the target canopy characteristics such that the air does the important work of delivering the spray within the canopy while minimizing the chances of unnecessarily pushing out spray droplets. The results demonstrate that using a higher air assistance in spraying citrus orchards does not necessarily result in superior deposition of the active ingredient. Target canopy characteristics, chiefly foliage density which was visually rated as ‘medium’ in this study, must be taken into consideration. Combined with canopy width (or diameter) as the secondary characteristic to consider, using a higher air assistance to increase penetration deeper into the canopy can inadvertently reduce deposition nearer to the sprayer without significantly increasing deposition at the far side of the canopy. Matching the sprayer air to the canopy size and foliage density optimizes the application and leads to better outcomes. Minimizing overpenetration also reduces the chances for spray drift due to escaped spray droplets that remain airborne and are susceptible to drift by the wind.
Funding
This research was funded by California Department of Pesticide Regulation, grant number 19-PML-G002. The APC was funded by University of California Agriculture and Natural Resources.
Data Availability Statement
Dataset available on request from the authors.
Acknowledgments
Special thanks to the grower cooperator for supporting this work. The author acknowledges the various contributions of the following individuals: Dr. Greg Douhan and Dr. Elizabeth Grafton-Cardwell for support in funding acquisition; and Christian Basulto, Sharon Asakawa, Ruben Chavez, Daniel Cabrera, and David Rodriguez Herrera for field and laboratory support.
Conflicts of Interest
The author declares no conflicts of interest. The funders had no role in the design of the study; in the collection, analyses, or interpretation of data; in the writing of the manuscript; or in the decision to publish the results. The mention of trade names and commercial products is solely for providing specific information and does not imply any recommendation by the author or the University of California.
References
- R. D. Fox, R. C. Derksen, H. Zhu, R. D. Brazee, and S. A. Svensson, “A History of Air-Blast Sprayer Development and Future Prospects,” Trans. ASABE, vol. 51, no. 2, pp. 405–410, 2008. [CrossRef]
- M. Farooq and M. Salyani, “Spray Penetration into the Citrus Tree Canopy from Two Air-Carrier Sprayers.” Accessed: Mar. 30, 2024. [Online]. [CrossRef]
- M. Farooq and M. Salyani, “Modeling of spray penetration and deposition on citrus tree canopies,” Trans. ASAE, vol. 47, no. 3, pp. 619–627, 2004. [CrossRef]
- R. Holownicki, G. Doruchowski, A. Godyn, and W. Swiechowski, “PA—Precision Agriculture: Variation of Spray Deposit and Loss with Air-jet Directions applied in Orchards,” J. Agric. Eng. Res., vol. 77, no. 2, pp. 129–136, Oct. 2000. [CrossRef]
- J. A. S. Bonds, D. Nuyttens, and D. Dekeyser, “Development of a spray drift database and an example of how it has been used to observe the effects of canopy and droplet size on drift profiles in apple orchards,” Asp. Appl. Biol., vol. 132, pp. 385–390, 2016.
- C. Garcerá, E. Moltó, and P. Chueca, “Spray pesticide applications in Mediterranean citrus orchards: Canopy deposition and off-target losses,” Sci. Total Environ., vol. 599–600, pp. 1344–1362, Dec. 2017. [CrossRef]
- N. Pai, M. Salyani, and R. D. Sweeb, “Regulating Airflow of Orchard Airblast Sprayer Based on Tree Foliage Density.” Accessed: Jan. 14, 2024. [Online]. [CrossRef]
- L. R. Khot et al., “Air-assisted sprayer adapted for precision horticulture: Spray patterns and deposition assessments in small-sized citrus canopies,” Biosyst. Eng., vol. 113, no. 1, pp. 76–85, Sep. 2012. [CrossRef]
- P. A. Larbi and F. J. Niederholzer, “Analysis of Advanced Airblast Sprayer Systems for Tree Crop Production,” in 2019 ASABE International Meeting, American Society of Agricultural and Biological Engineers, Jul. 2019. [CrossRef]
- M. Salyani and W. C. Hoffmann, “Air and Spray Distribution from an Air-carrier Sprayer,” Appl. Eng. Agric., vol. 12, no. 5, pp. 539–545. [CrossRef]
- M. Salyani, Y. M. Koo, and R. D. Sweeb, “Spray application variables affect air velocity and deposition characteristics of a tower sprayer,” Fla. Agric. Exp. Stn. J. Ser. No N-01938.
- P. A. Larbi, “Configuration and Assessment of a Submersible Fluorometer for Evaluating Fluorescent Dye Deposition,” J. Test. Eval., vol. 50, no. 3, p. 20210617, May 2022. [CrossRef]
- P. A. Larbi and M. Salyani, “Model to Predict Spray Deposition in Citrus Airblast Sprayer Applications: Part 1. Spray Dispersion,” Trans. ASABE, vol. 55, no. 1, pp. 29–39, 2012. [CrossRef]
- J. M. Randall, “The relationships between air volume and pressure on spray distribution in fruit trees,” J. Agric. Eng. Res., vol. 16, no. 1, pp. 1–31, Mar. 1971. [CrossRef]
- T. Li et al., “Evaluation of the Effects of Airflow Distribution Patterns on Deposit Coverage and Spray Penetration in Multi-Unit Air-Assisted Sprayer,” Agronomy, vol. 12, no. 4, Art. no. 4, Apr. 2022. [CrossRef]
- G. Pergher and R. Gubiani, “The Effect of Spray Application Rate and Airflow Rate on Foliar Deposition in a Hedgerow Vineyard,” J. Agric. Eng. Res., vol. 61, no. 3, pp. 205–216, Jul. 1995. [CrossRef]
- G. Pergher, R. Gubiani, and G. Tonetto, “Foliar deposition and pesticide losses from three air-assisted sprayers in a hedgerow vineyard,” Crop Prot., vol. 16, no. 1, pp. 25–33, Feb. 1997. [CrossRef]
- A. Miranda-Fuentes, A. Rodríguez-Lizana, E. Gil, J. Agüera-Vega, and J. A. Gil-Ribes, “Influence of liquid-volume and airflow rates on spray application quality and homogeneity in super-intensive olive tree canopies,” Sci. Total Environ., vol. 537, pp. 250–259, Dec. 2015. [CrossRef]
- G. P. Cunningham and J. Harden, “Reducing spray volumes applied to mature citrus trees,” Crop Prot., vol. 17, no. 4, pp. 289–292, Jun. 1998. [CrossRef]
Figure 1.
In-progress spray application inside orchard during the study and views of nozzle banks on the two sprayers used.
Figure 1.
In-progress spray application inside orchard during the study and views of nozzle banks on the two sprayers used.
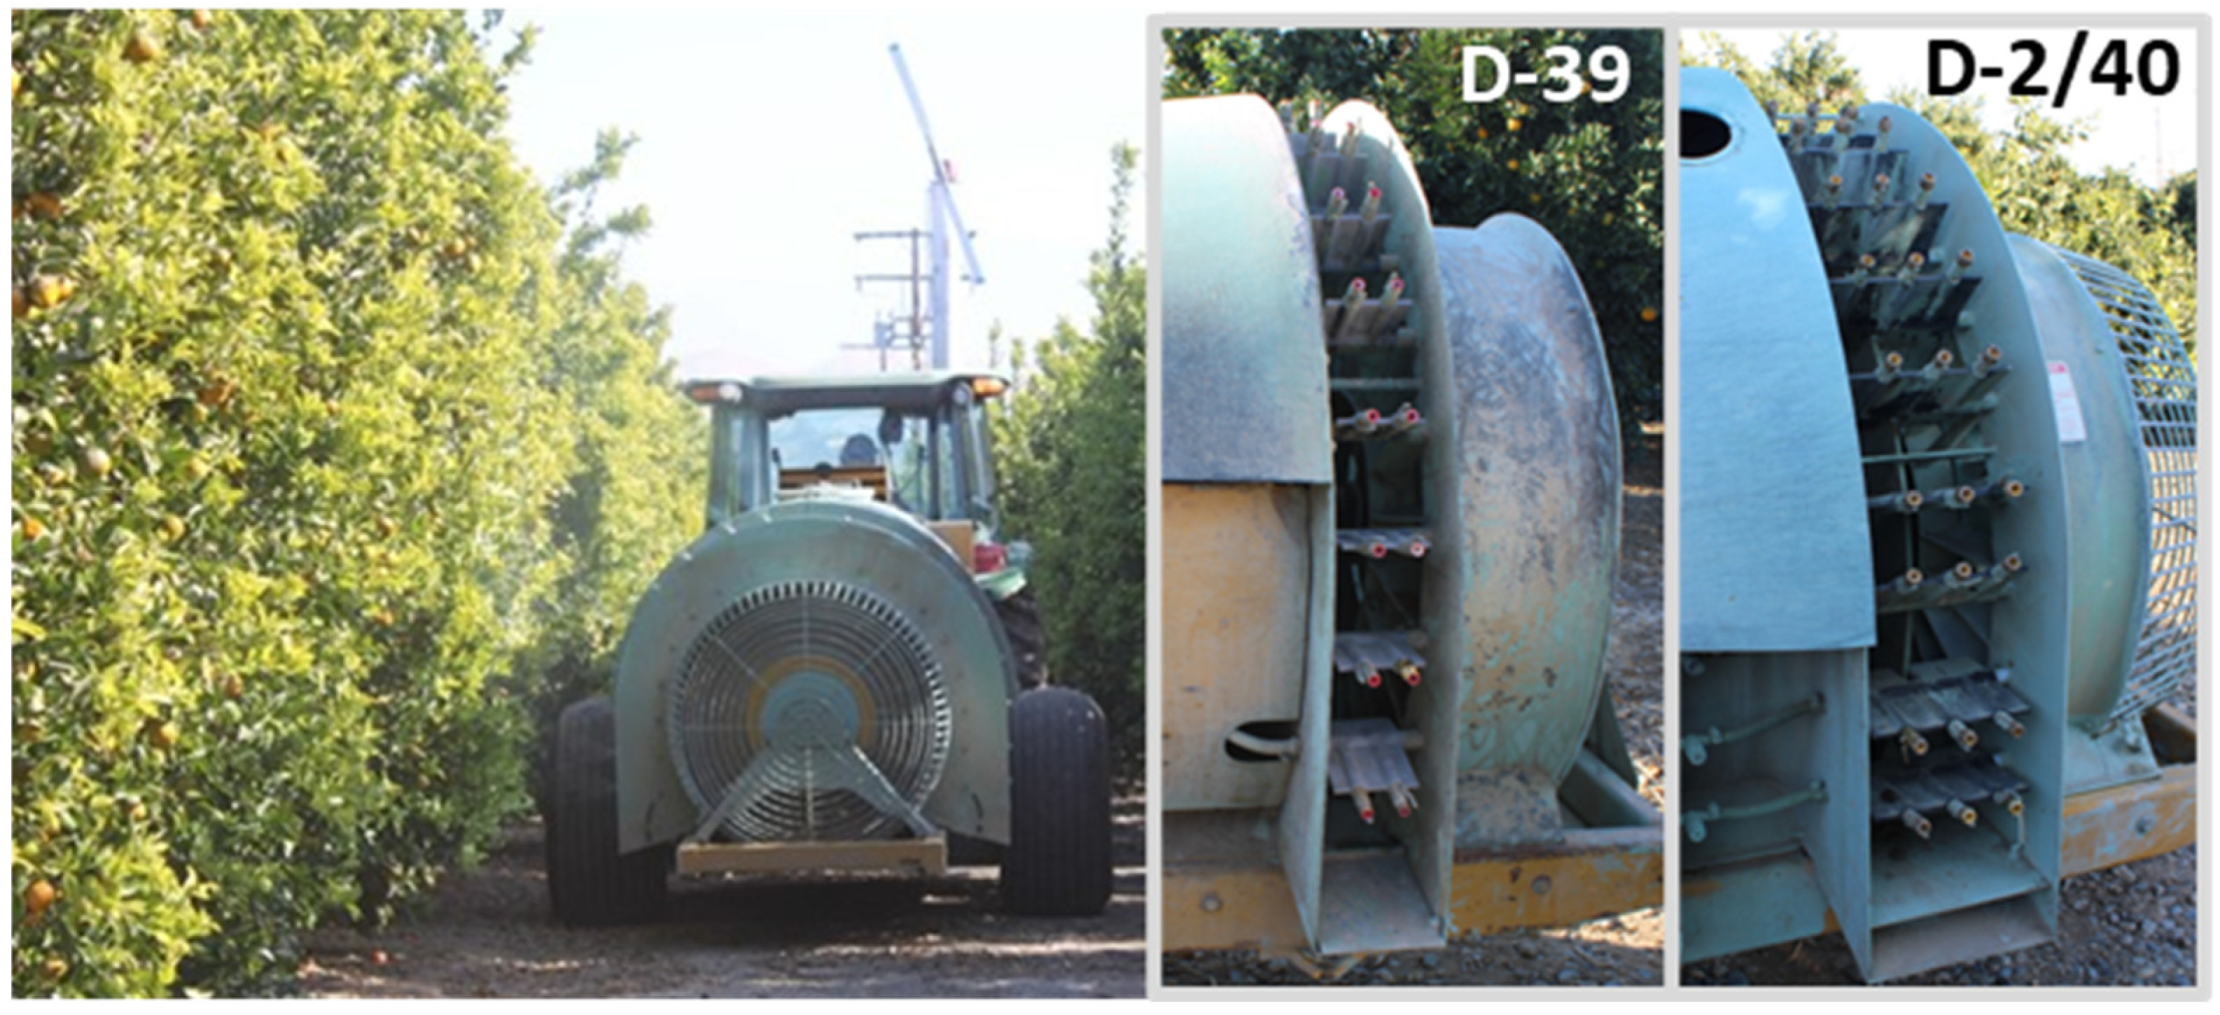
Figure 2.
Summary of spray treatments used in field spray experiment.
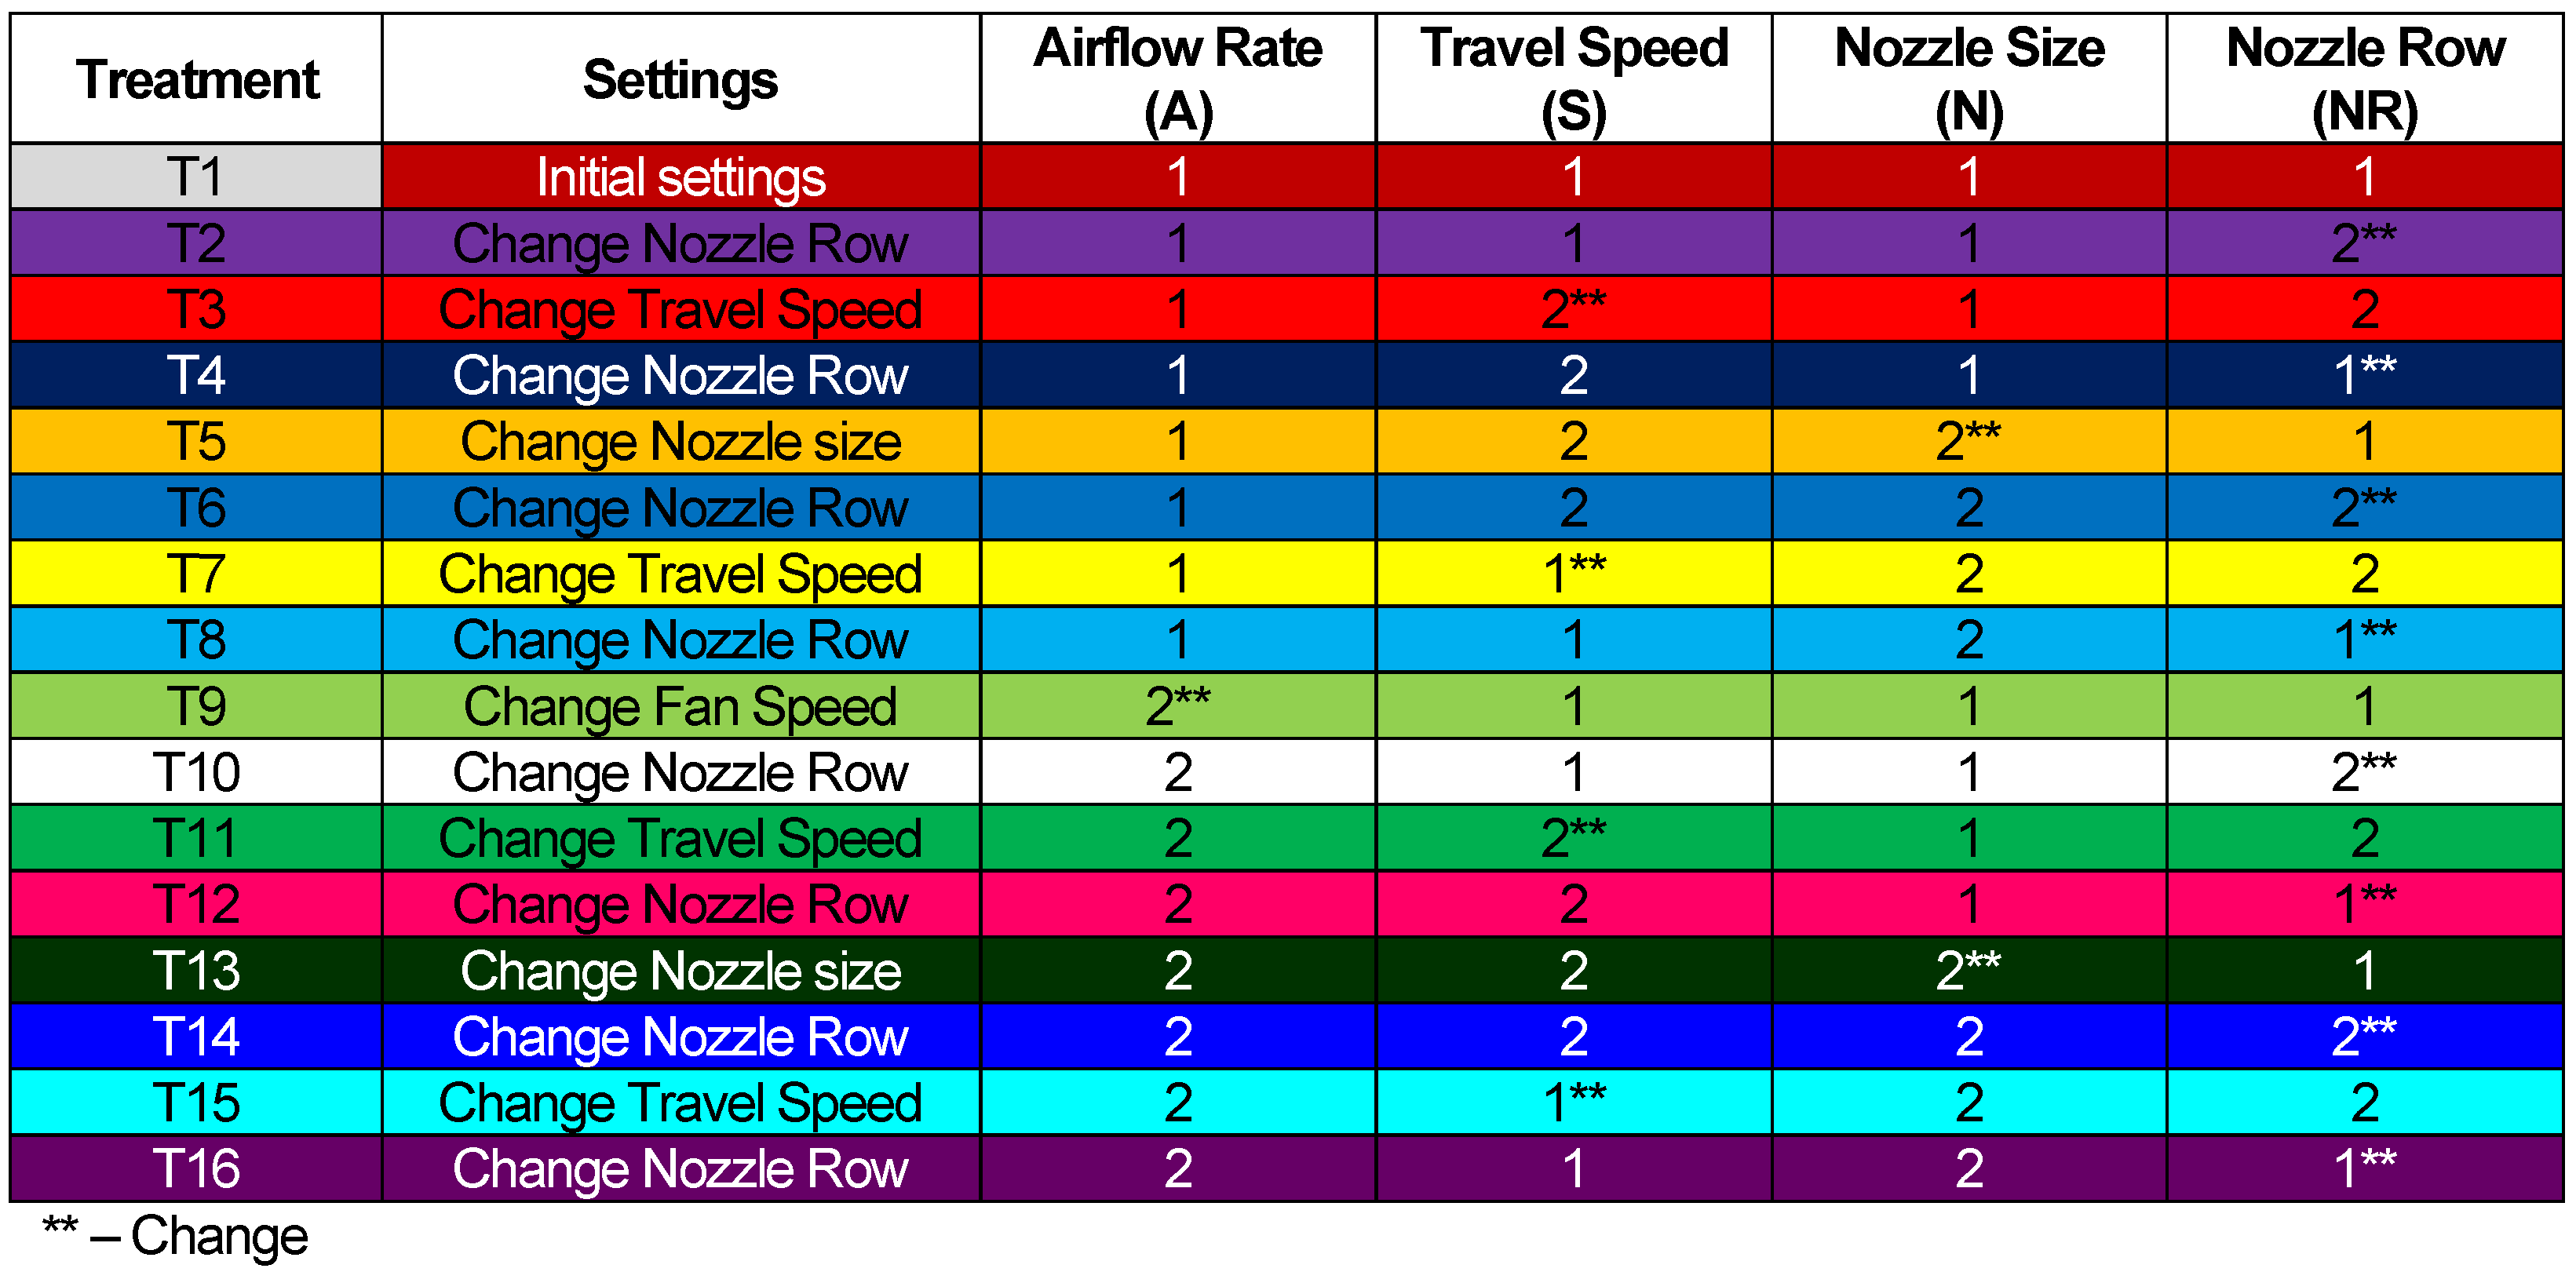
Figure 3.
Schematic of spray treatments applied in orchard.
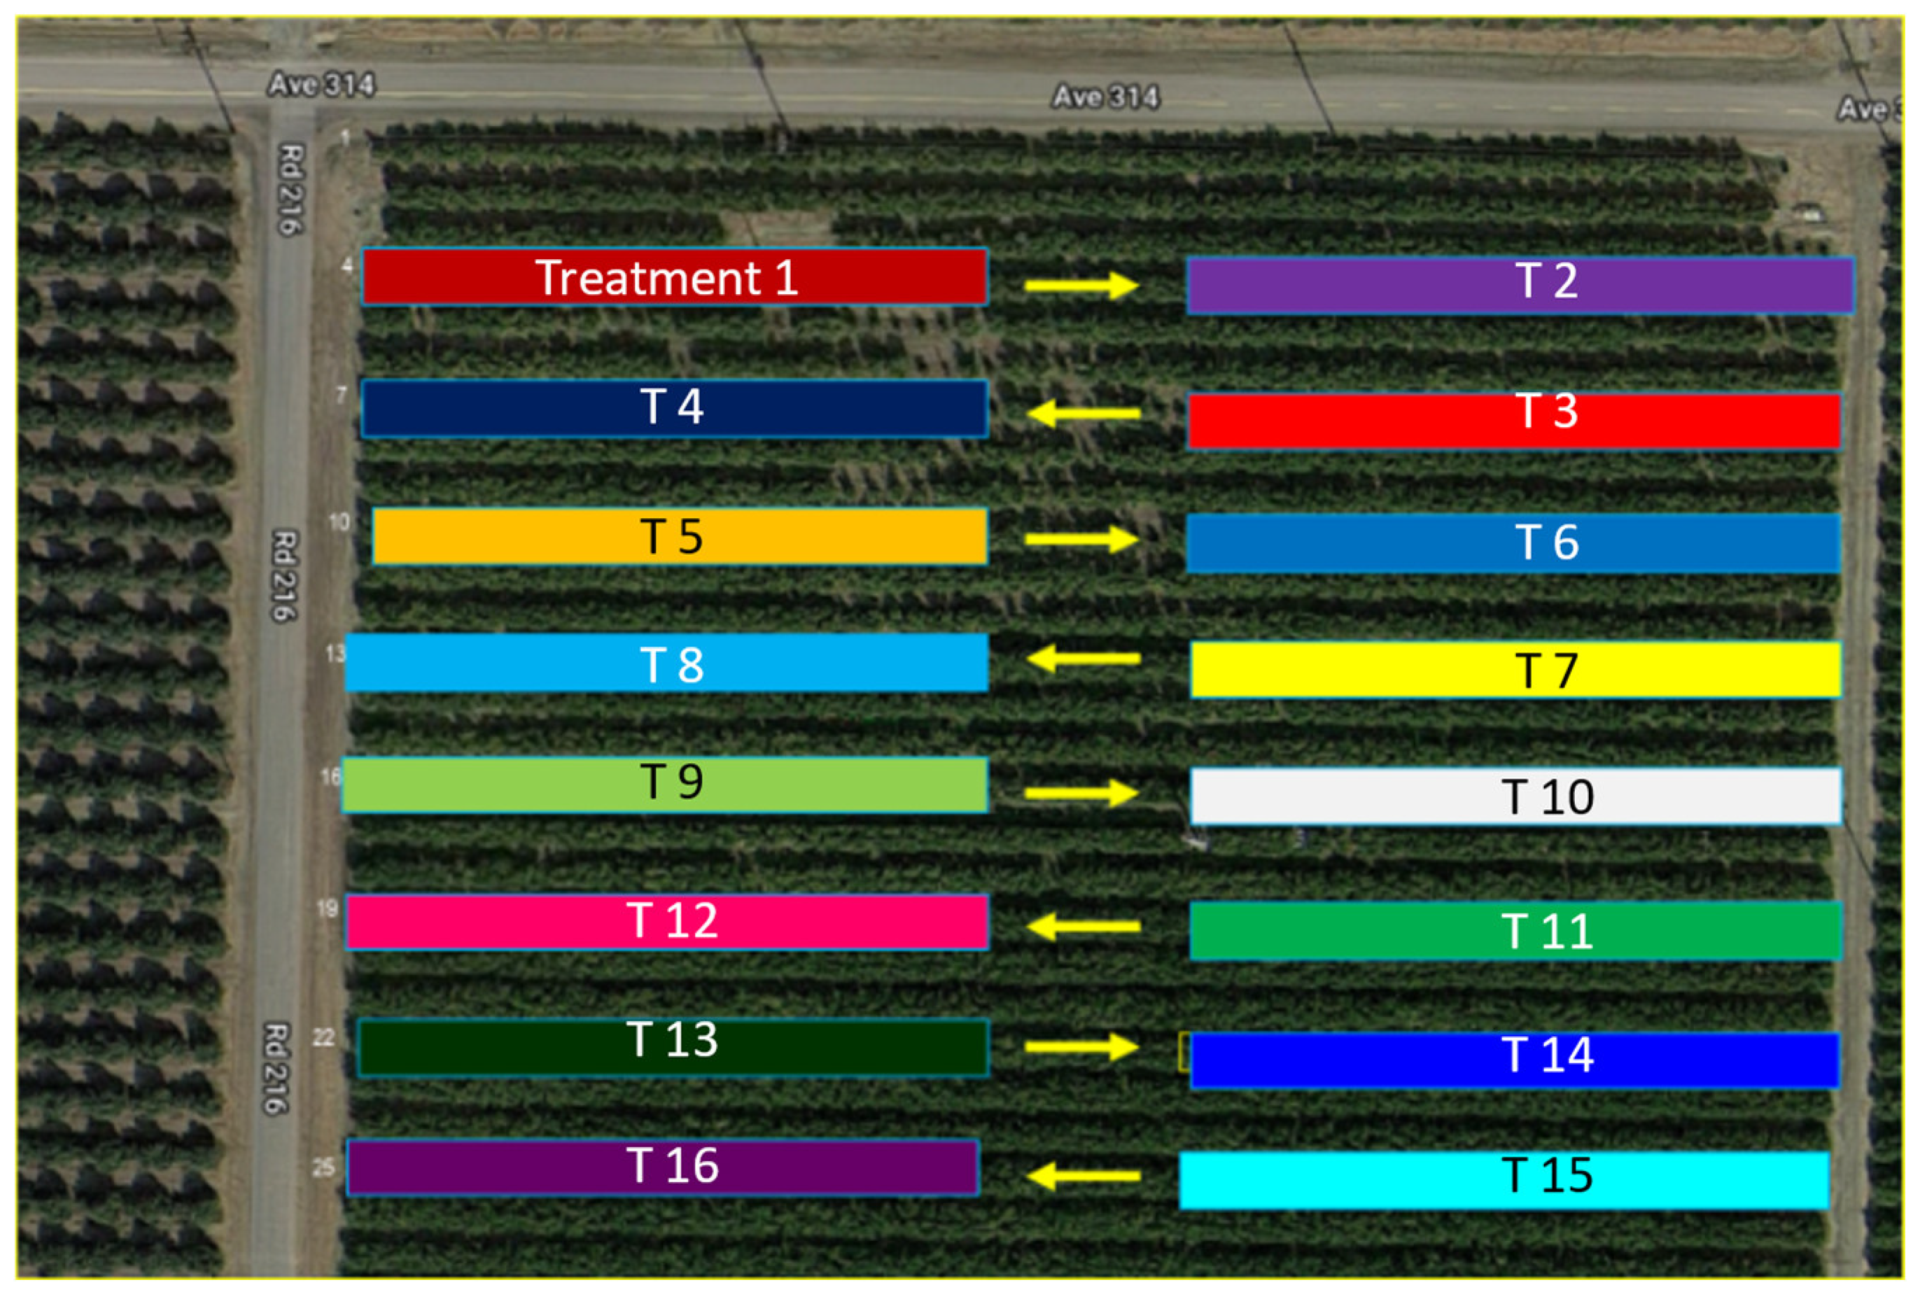
Figure 4.
Sprayed leaf sampling locations (H – height; D – depth) in target tree canopy used in study.
Figure 4.
Sprayed leaf sampling locations (H – height; D – depth) in target tree canopy used in study.
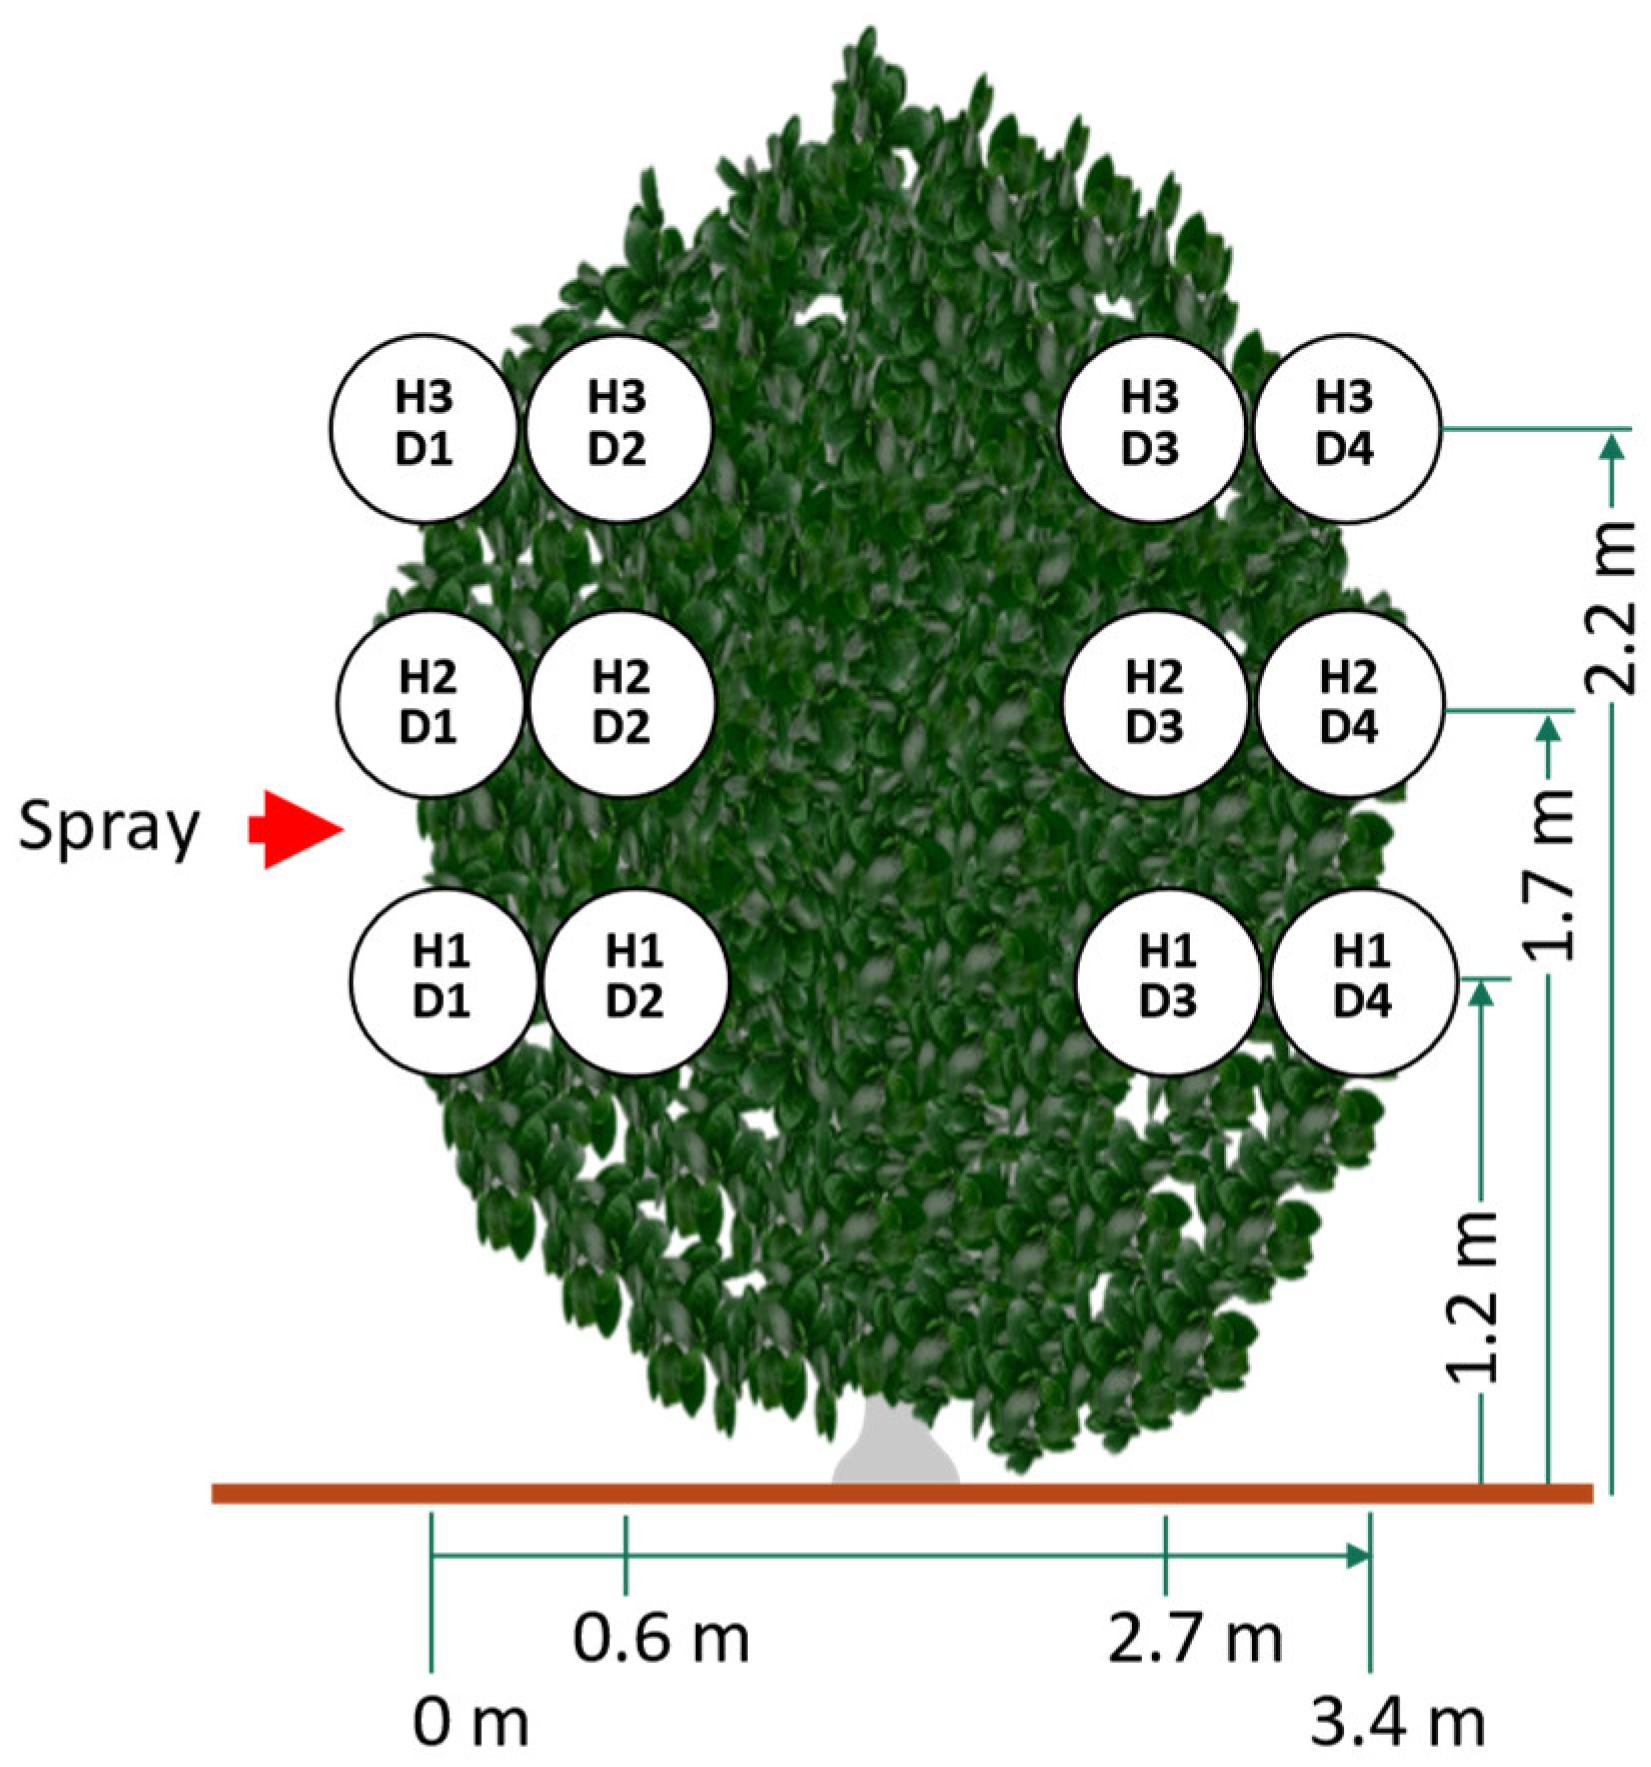
Figure 5.
Leaf area analysis: top – leaf samples; and bottom – instrument setup.
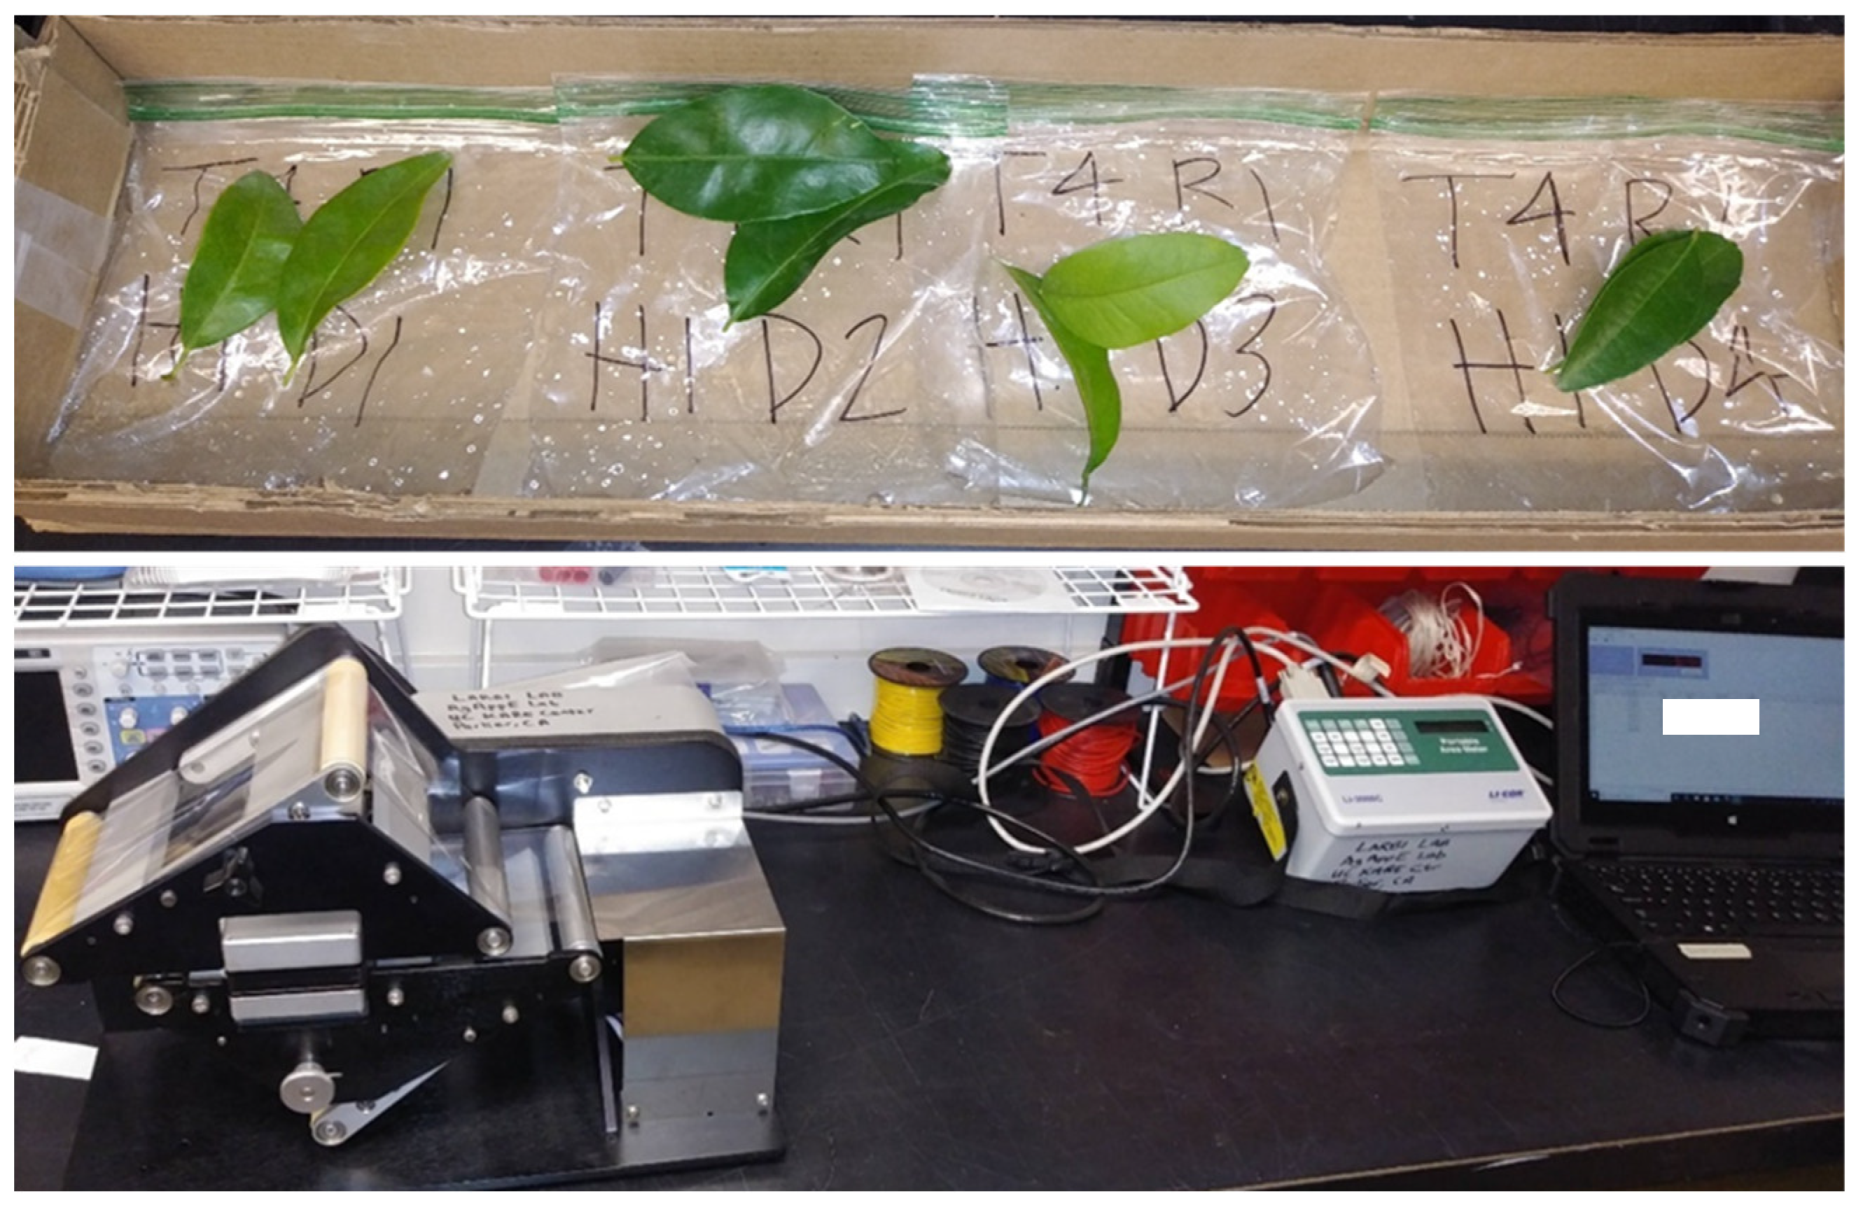
Figure 6.
Overall mean deposition for all treatments: (a) over canopy depth; and (b) over sampling height.
Figure 6.
Overall mean deposition for all treatments: (a) over canopy depth; and (b) over sampling height.
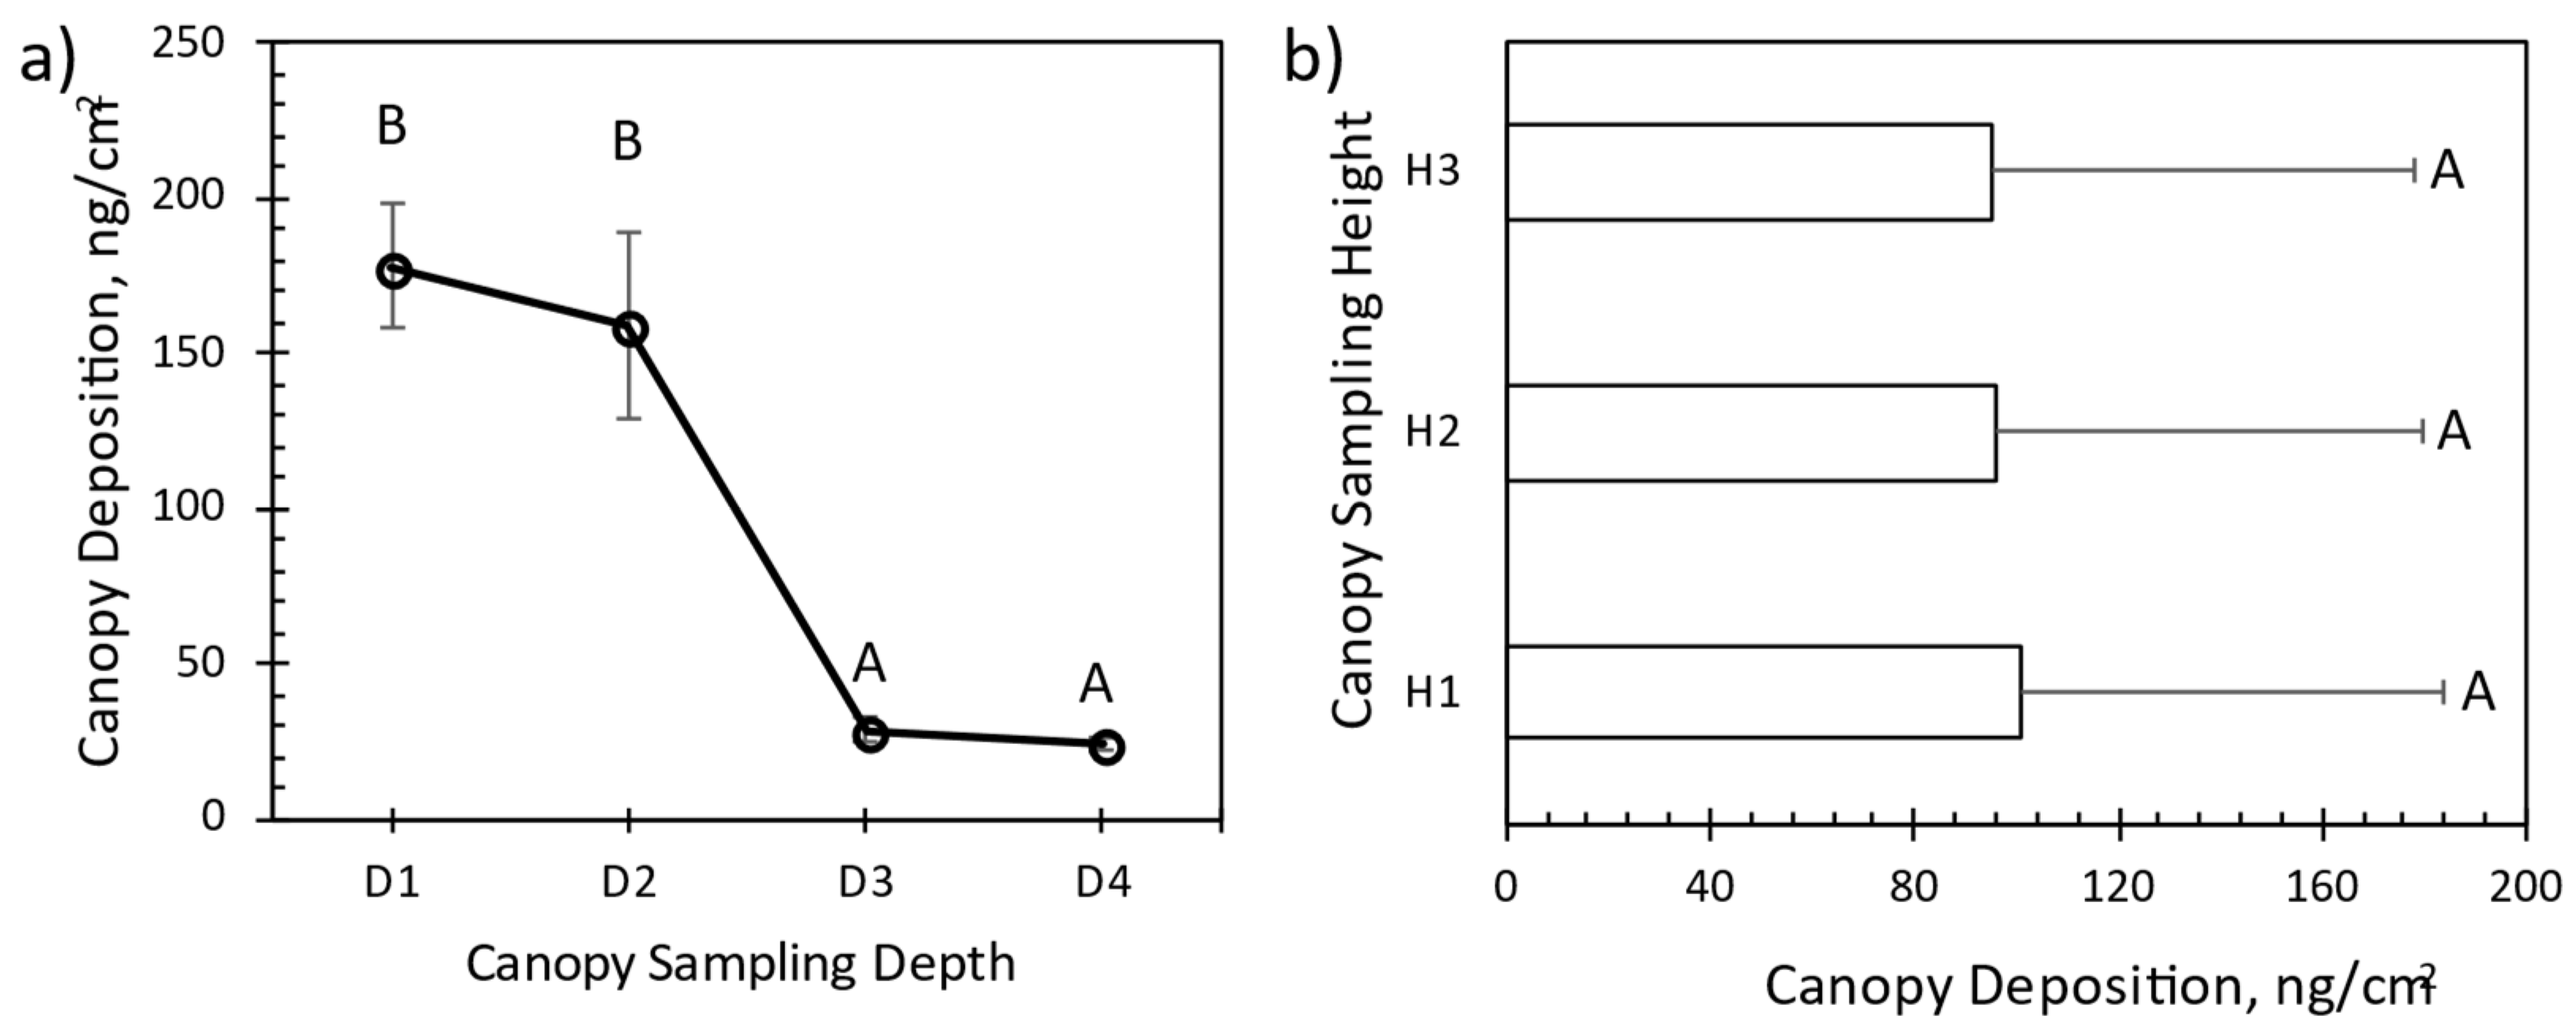
Figure 7.
Mean deposition for the two sprayers: (a) over canopy depth; and (b) over sampling height.
Figure 7.
Mean deposition for the two sprayers: (a) over canopy depth; and (b) over sampling height.
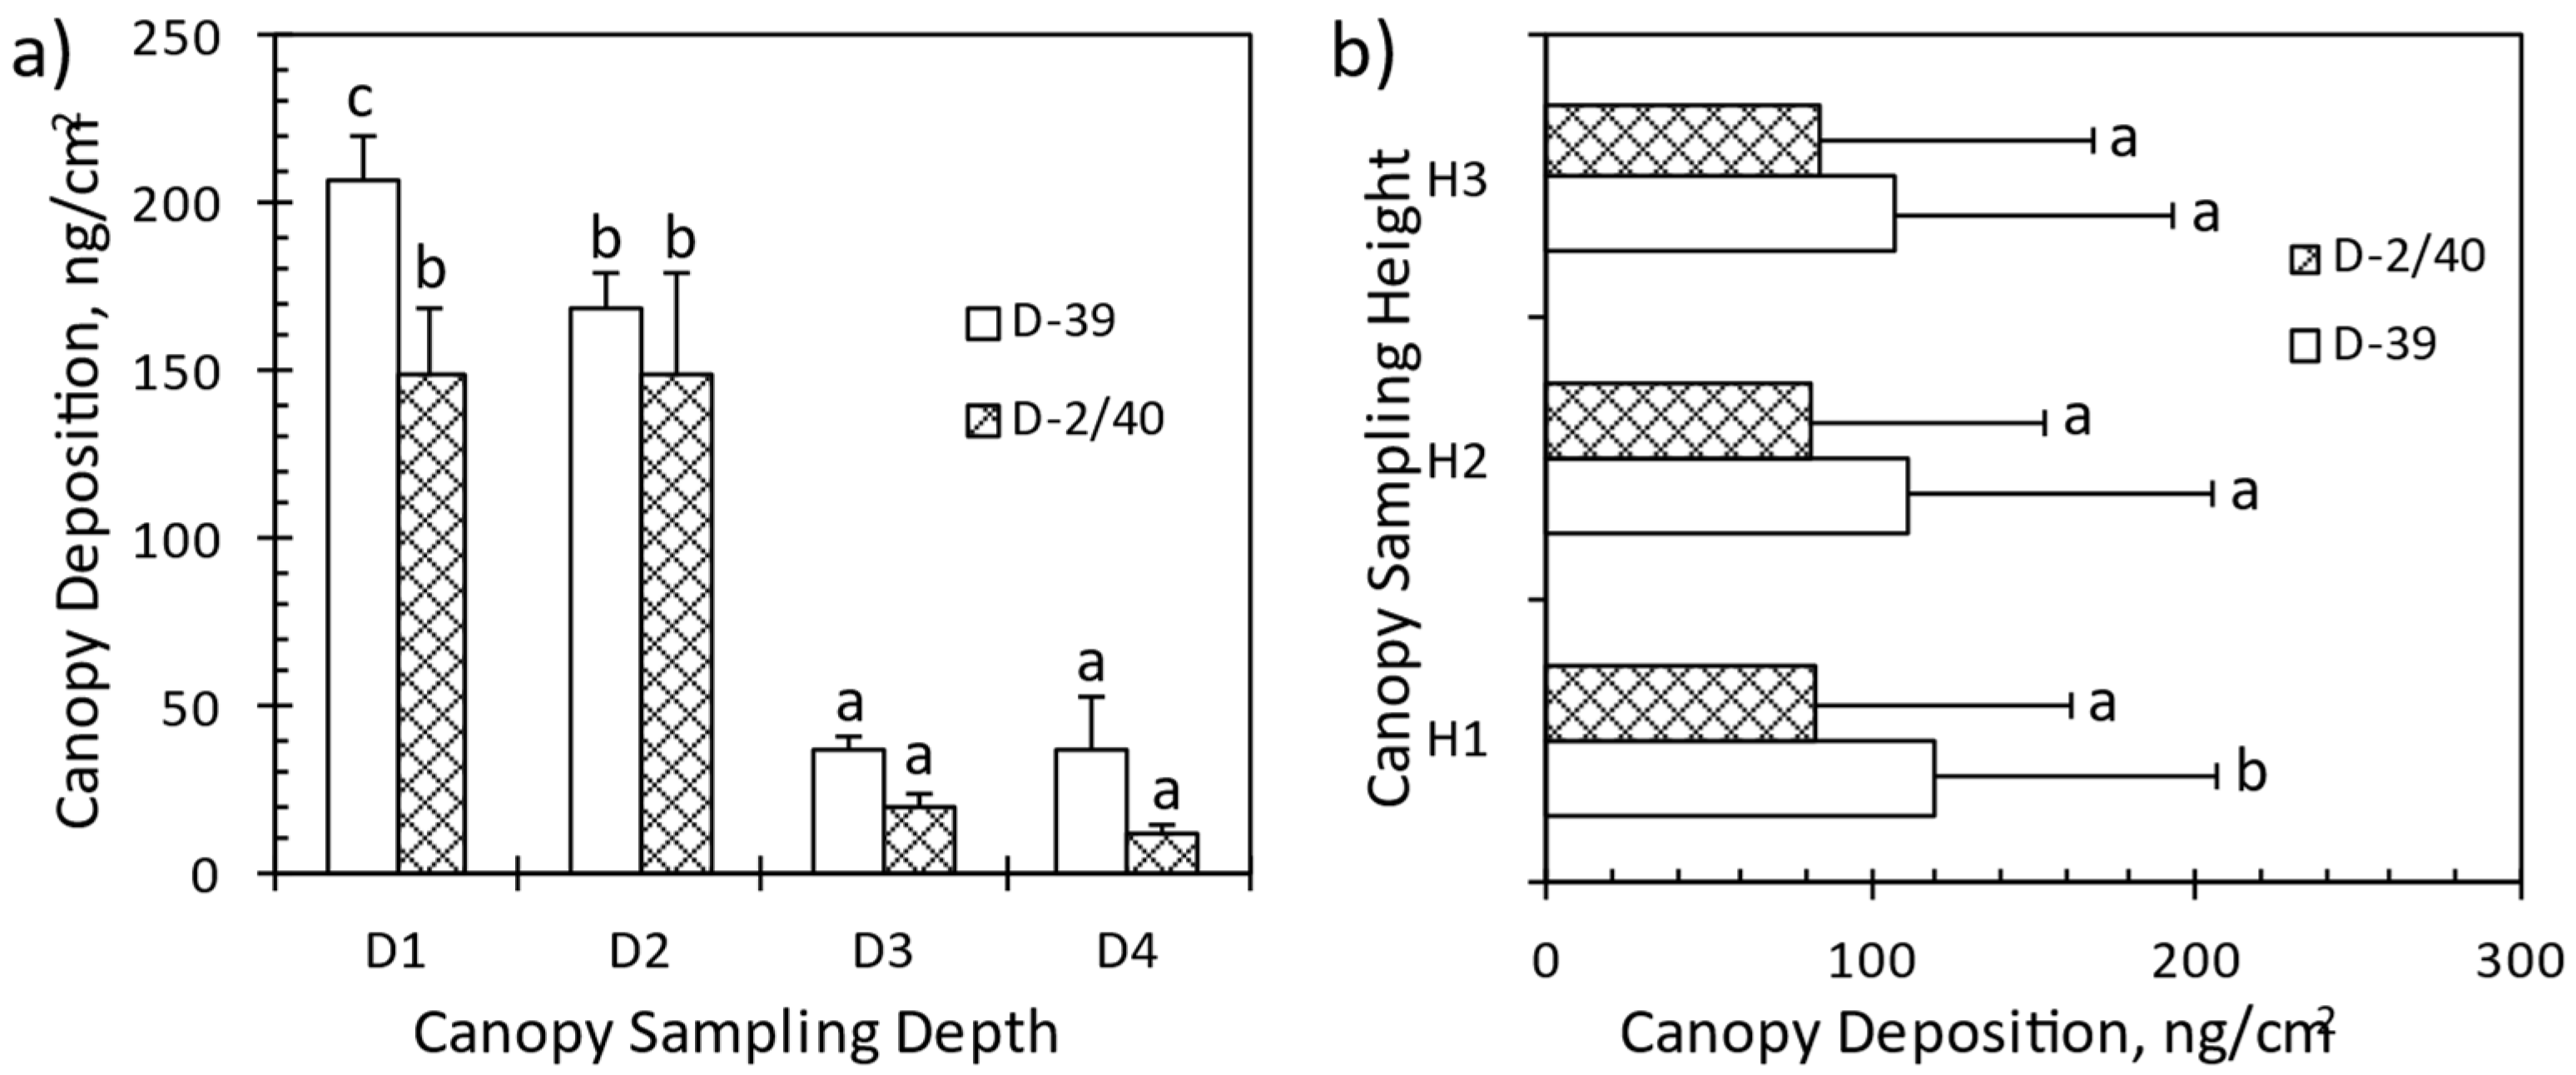
Figure 8.
Mean canopy deposition achieved with different spray application rates.
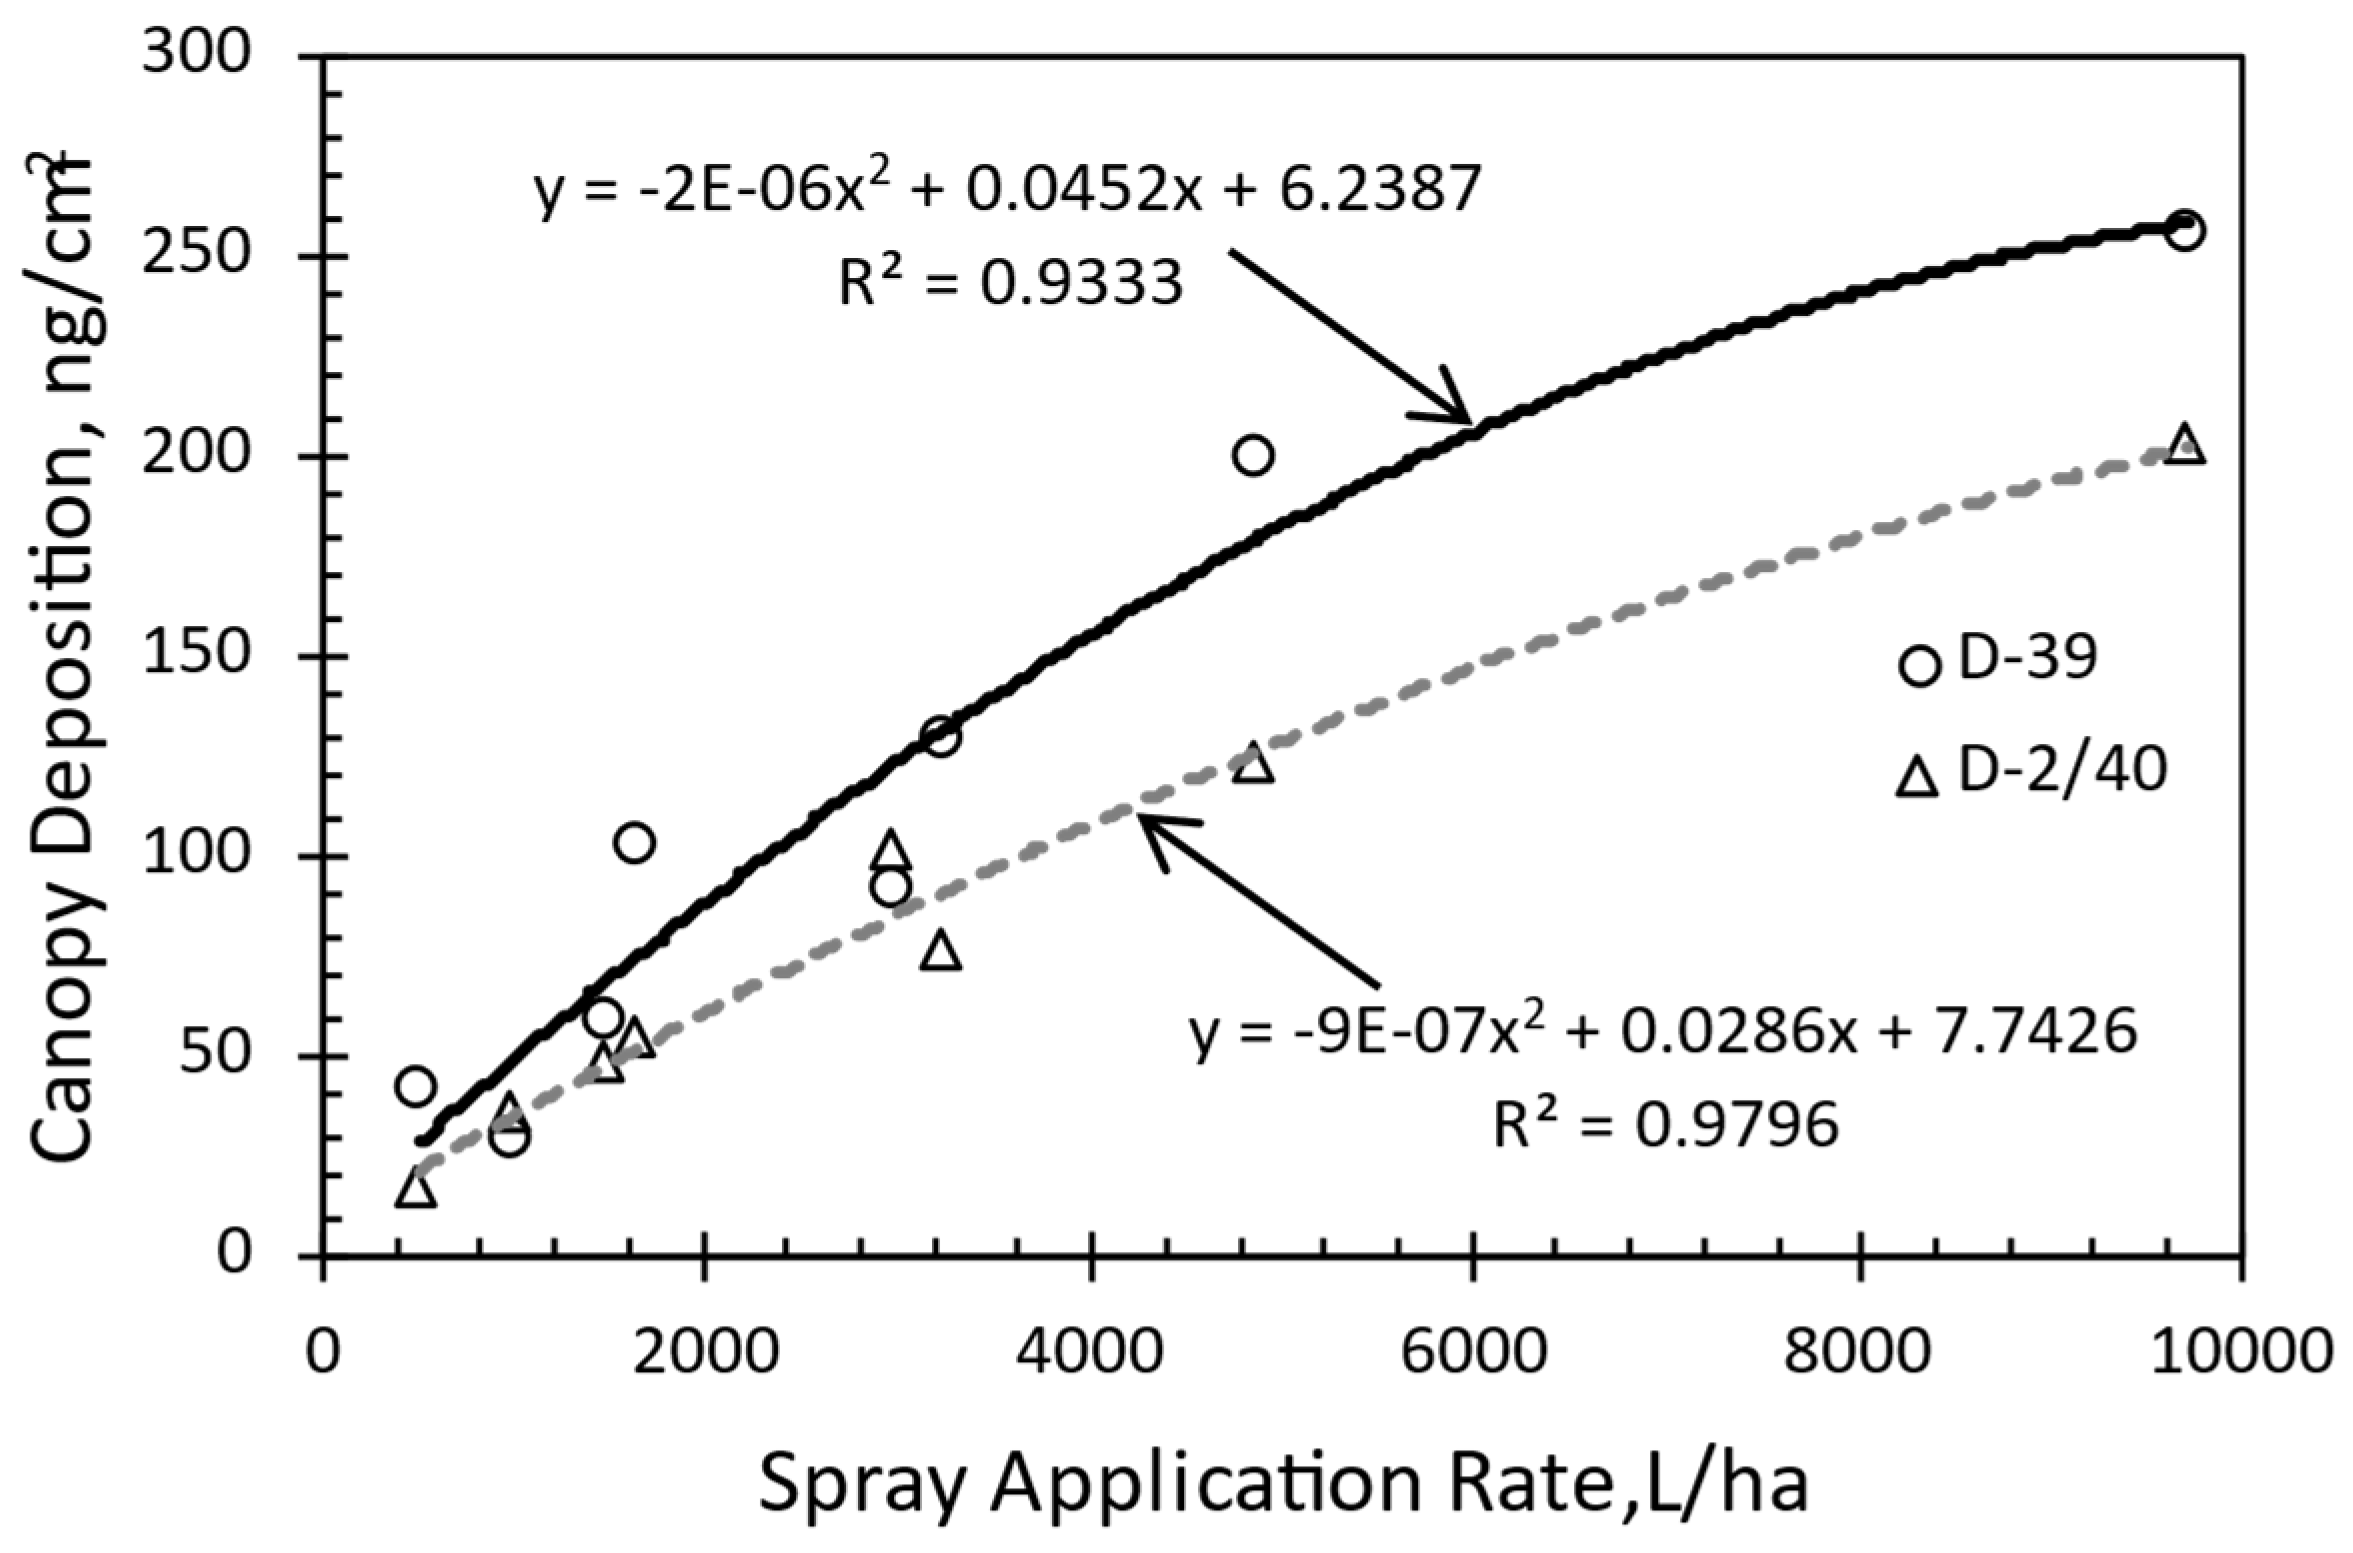
Figure 9.
Matrix of two-factor interaction graphs of spray application variables.
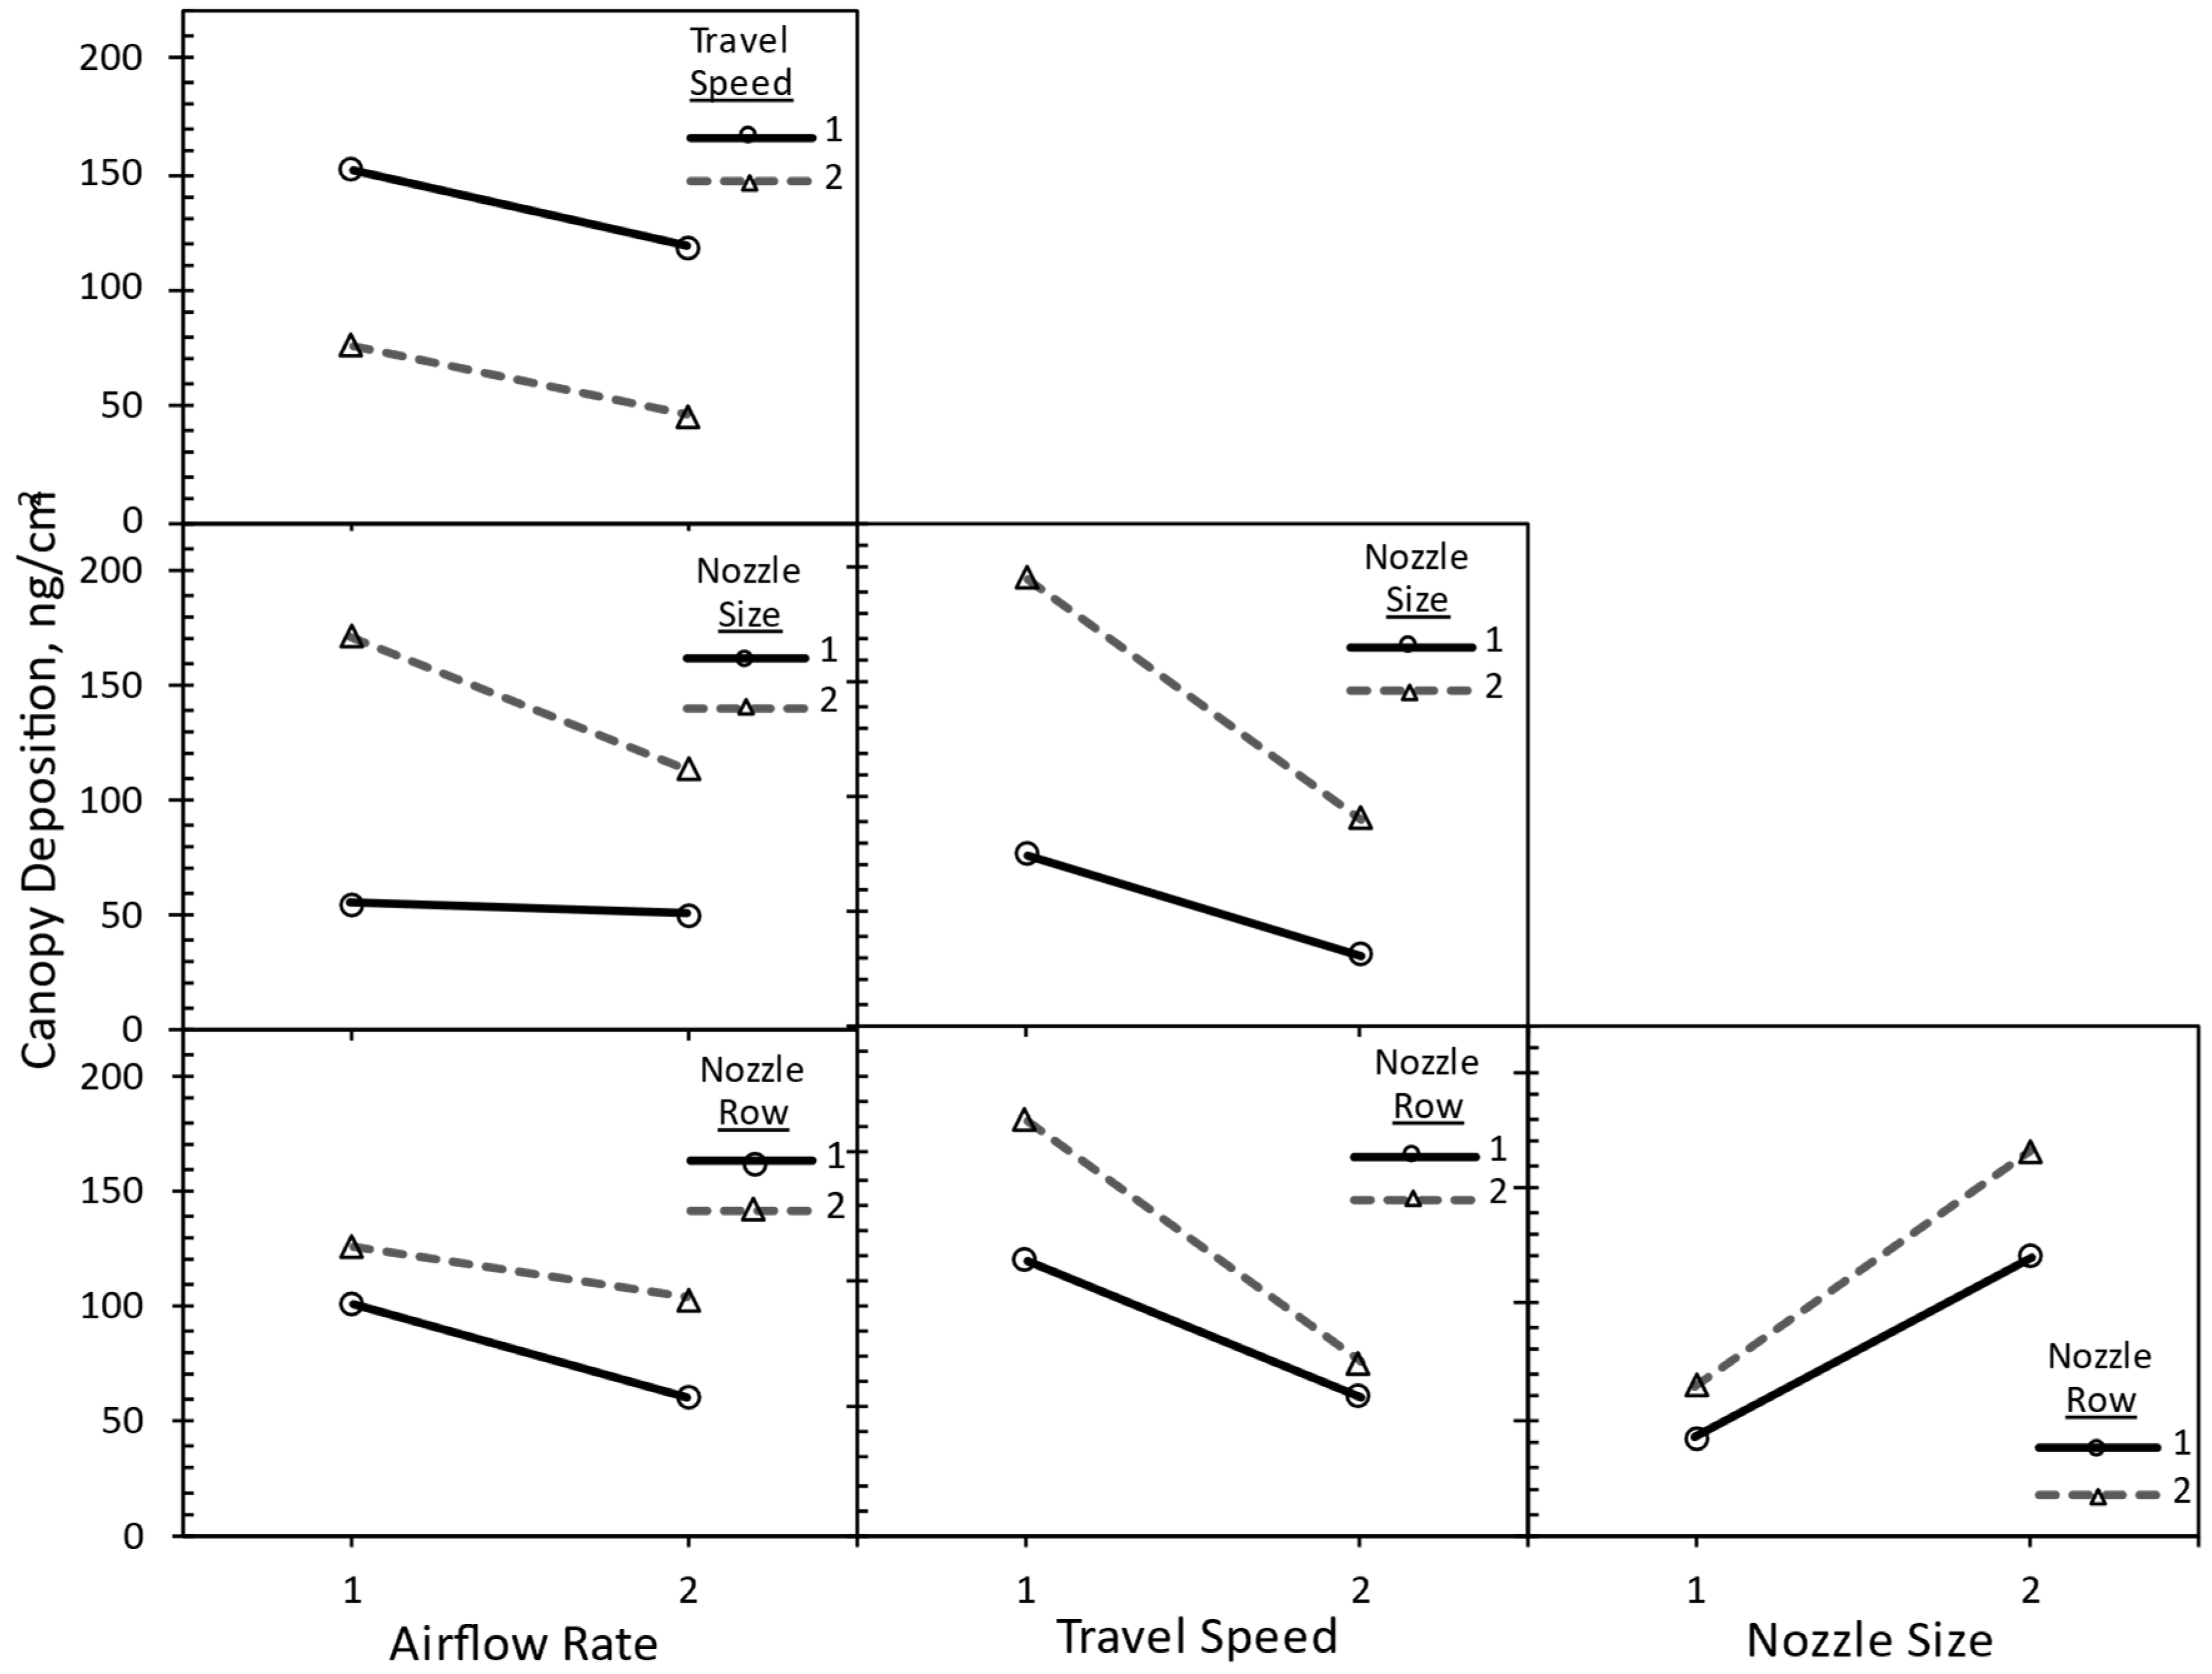
Figure 10.
Compass rose of wind speed and direction during the experiment: inside (left) and outside (right) orchard.
Figure 10.
Compass rose of wind speed and direction during the experiment: inside (left) and outside (right) orchard.
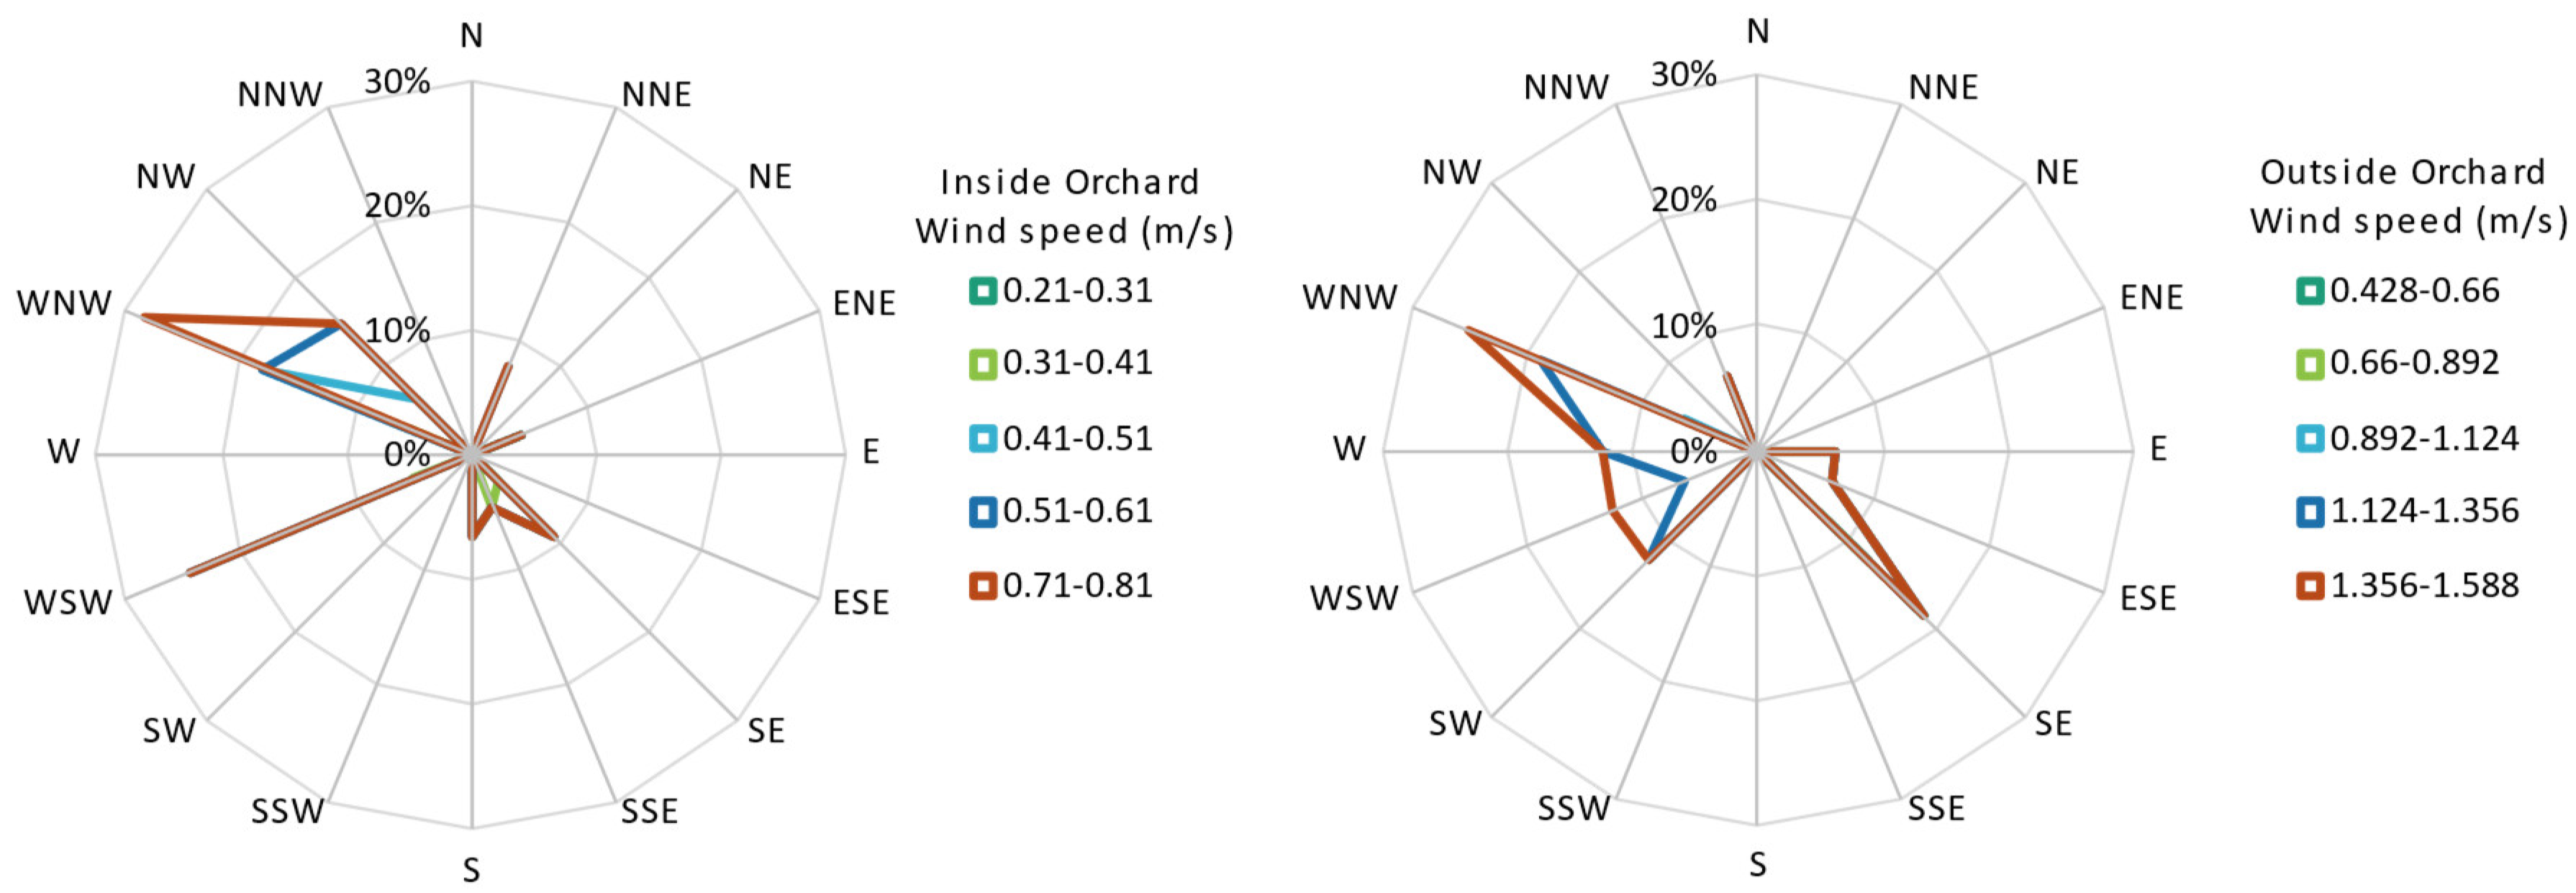

Table 1.
Summary of application rates achieved in different spray treatments used in the study.
| Spray Treatment 1 | Application Rate (L/ha) |
||
|---|---|---|---|
| Travel Speed (Km/h) |
TeeJet® Disc-Core Nozzle Size |
Number of Open Nozzles per Side | |
| 1.6 | D3-25 | 9 | 1478 |
| 1.6 | D3-25 | 18 | 2956 |
| 1.6 | D6-45 | 9 | 4864 |
| 1.6 | D6-45 | 18 | 9719 |
| 4.8 | D3-25 | 9 | 496 |
| 4.8 | D3-25 | 18 | 982 |
| 4.8 | D6-45 | 9 | 1618 |
| 4.8 | D6-45 | 18 | 3236 |
1 Treatments were replicated using an Air-O-Fan D-39 sprayer and a D-2/40 sprayer.
Table 2.
Summary weather data during the treatment trials based on ATMOS 41 all-in-one weather sensors installed at a height of 1.8 m inside (“In”) and outside (“Out”) of orchard.
Table 2.
Summary weather data during the treatment trials based on ATMOS 41 all-in-one weather sensors installed at a height of 1.8 m inside (“In”) and outside (“Out”) of orchard.
| Trial # | Solar Radiation W/m² |
Wind Direction |
Wind Speed m/s |
Air Temperature °C |
Atmospheric Pressure kPa |
Relative Humidity % |
||||||
|---|---|---|---|---|---|---|---|---|---|---|---|---|
| In | Out | In | Out | In | Out | In | Out | In | Out | In | Out | |
| T1 | 502.3 | 469.0 | WSW | WNW | 0.51 | 1.09 | 15.5 | 16.8 | 101.0 | 100.92 | 38.2 | 30.3 |
| T2 | 505.0 | 482.4 | SSE | SE | 0.31 | 0.75 | 15.4 | 17.0 | 101.0 | 100.91 | 38.1 | 29.6 |
| T3 | 505.7 | 482.3 | WNW | NNW | 0.42 | 1.09 | 15.8 | 17.0 | 101.0 | 100.89 | 36.6 | 30.0 |
| T4 | 506.0 | 483.3 | WSW | WNW | 0.43 | 1.35 | 15.8 | 17.1 | 101.0 | 100.88 | 36.3 | 29.1 |
| T5 | 513.7 | 490.7 | SE | W | 0.43 | 1.13 | 17.5 | 17.6 | 100.9 | 100.86 | 34.0 | 28.0 |
| T6 | 511.5 | 490.0 | NNE | WSW | 0.53 | 1.56 | 17.4 | 17.6 | 100.9 | 100.86 | 34.3 | 28.1 |
| T7 | 513.2 | 491.2 | NW | WNW | 0.42 | 1.59 | 17.6 | 17.6 | 100.9 | 100.85 | 34.1 | 27.7 |
| T8 | 513.8 | 489.8 | WNW | WNW | 0.48 | 1.15 | 17.5 | 18.1 | 100.9 | 100.85 | 33.1 | 26.9 |
| T9 | 500.4 | 475.8 | WSW | SE | 0.41 | 0.43 | 17.7 | 18.9 | 100.9 | 100.84 | 30.7 | 28.0 |
| T10 | 498.8 | 435.5 | S | E | 0.46 | 0.44 | 18.1 | 18.9 | 100.9 | 100.84 | 30.3 | 27.5 |
| T11 | 495.7 | 471.3 | WNW | SE | 0.72 | 0.63 | 17.9 | 19.2 | 100.9 | 100.84 | 32.2 | 26.8 |
| T12 | 494.0 | 469.0 | NW | SW | 0.60 | 1.01 | 17.8 | 18.9 | 100.9 | 100.84 | 32.6 | 26.2 |
| T13 | 455.3 | 436.7 | ENE | W | 0.31 | 1.14 | 18.4 | 19.5 | 100.9 | 100.79 | 31.3 | 25.5 |
| T14 | 449.8 | 429.3 | WNW | ESE | 0.36 | 0.95 | 18.3 | 19.6 | 100.9 | 100.79 | 30.3 | 24.8 |
| T15 | 319.0 | 423.3 | WSW | WSW | 0.35 | 1.13 | 18.5 | 19.5 | 100.9 | 100.78 | 30.3 | 24.7 |
| T16 | 152.5 | 408.3 | SE | SW | 0.21 | 0.89 | 19.2 | 19.7 | 100.9 | 100.79 | 28.7 | 24.2 |
Disclaimer/Publisher’s Note: The statements, opinions and data contained in all publications are solely those of the individual author(s) and contributor(s) and not of MDPI and/or the editor(s). MDPI and/or the editor(s) disclaim responsibility for any injury to people or property resulting from any ideas, methods, instructions or products referred to in the content. |
© 2024 by the authors. Licensee MDPI, Basel, Switzerland. This article is an open access article distributed under the terms and conditions of the Creative Commons Attribution (CC BY) license (http://creativecommons.org/licenses/by/4.0/).
Copyright: This open access article is published under a Creative Commons CC BY 4.0 license, which permit the free download, distribution, and reuse, provided that the author and preprint are cited in any reuse.


