Submitted:
28 May 2024
Posted:
29 May 2024
You are already at the latest version
Abstract
Using a sample of 103 surviving and non-surviving global bond funds over a long sample period of 1998 to 2022, we perform a comprehensive analysis of the funds under our modified Sharpe’s (1992) style analysis model. We find that dynamic style analysis is useful in explaining time-series and cross-sectional and in predicting future returns of global bond funds. The dynamic style analysis also allows us to examine asset allocation over time. The results show that, during 2001 to 2014, funds shift their allocations from intermediate-term bonds to world corporate bonds and from world corporate bonds to emerging market bonds in search of higher returns at the price of credit quality.
Keywords:
Style analysis
; global bond funds
; portfolio performance evaluation
1. Introduction
Sharpe (1992) proposed a style analysis model to evaluate mutual fund performance. Since then, the approach has become an industry standard among institutional investors. Various academic studies evaluate, use and modify Sharpe’s style analysis to analyze performance of equity and hedge funds (see Brown and Goetzman, 1997 and Chan, Chen, and Lakonishok, 2002 among others for equity funds, and Fung and Hsieh, 1997 and Aggrawal and Naik, 2000, for hedge funds, ). Style analysis study on bond mutual funds is, however, limited.1 Especially in the area of global bond mutual funds,2 there is almost no information on style analysis.
We argue that Sharpe’s style analysis provides a more robust application to bond funds than to equity funds for two reasons. First, Blake et al. (1993) assert that performance model of bond funds is simpler than the model of equity funds because only a few factors such as credit quality and maturity affect bond returns. Second, unlike performance of equity funds, performance of bond funds is less sensitive to the methods used to measure due to lower volatility. For these reasons, the style model is more accurate in determining investment policy of bond funds than that of equity funds (Blake et al., 1993). Because of its accuracy in determining a fund’s investment policy, the style model based on credit quality and maturity can provide a more meaningful analysis of the contribution of active management or of the fund investment policy. In addition, the style analysis can accurately capture asset reallocation and monitor investment behavior of bond fund managers.
To improve our understanding of investment styles on bond funds and in response to the paucity of studies on style analysis of bond funds, we propose to extend Sharpe’s (1992) model to analyze a sample of global bond mutual funds (henceforth global bond funds). It is reasonable to expect that fund investment styles evolve through time. Therefore, we employ rolling regressions to account for dynamic asset allocations of global bond funds. We argue that the dynamic style analysis is particularly an appropriate framework to evaluate fund investment behavior because it measures shift in asset allocations not captured by other methods such as portfolio holdings.
The main objectives of this paper are threefold. First, we provide a comprehensive evaluation of the usefulness of dynamic style analysis on global bond funds. We examine time-series and cross-sectional explanations of the style analysis. In addition, we analyze predictability of the style model. Second, after the accuracy of style analysis is established, we use the style analysis to evaluate bond fund performance and management behavior. By evaluating bond funds in relevant to their styles, this study will assist investors in evaluating bond funds more accurately. Third, we use the style analysis to investigate dynamic of asset allocation of the bond funds. The findings on the dynamic will enhance our understanding on how fund managers shift their assets over time. This study also contributes to the scarce literature in fixed income style analysis based on credit quality and maturity.
Our sample consists of 103 surviving and non-surviving global bond funds during the period of July 1998 to March 2022. We find that the style analysis is useful in explaining both time-series and cross-sectional variations of global bond fund returns and predicting future returns of global bond funds. Specifically, the dynamic seven-index model explains about 80% of the returns over time and 90-95% of the returns across funds. The model provides average prediction error of -0.13% per month, smaller than the prediction error found in prior studies. Because of high explanatory power and low prediction error, the style model is an appropriate approach for performance evaluation of global bond funds.
Using style-adjusted benchmark, we do not find evidence that fund managers’ skill contributes to higher returns. The global bond funds perform worse when evaluated under the style-adjusted benchmark than when evaluated under the broad-based benchmark. However, the underperformance of surviving funds is less than the average expense ratio while that of non-surviving funds is greater than the expense ratio. Using 12-month window, we find that the asset allocation of global bond funds is rather volatile during the period of 2001 to 2014. The funds mainly shift assets from intermediate-term bonds to world corporate bonds and from world corporate bonds to emerging market bonds. The shifts are to seek higher returns during the period of declining interest rates. Overall, Sharpe’s (1992) style analysis is shown to perform well in measuring and evaluating performance of global bond funds in our sample.
2. Literature Review
Style investing has been adopted among institutional investors since 1980 (Bernstein, 1995). It is undertaken to exploit market anomalies. In this section, we examine the development of investment style analysis through prior empirical studies.3 We categorize the studies into two topics: style identification and performance evaluation of equity funds based on style.
2.1. Style Identification
There are three major style classification schemes: (a) industry-based, (b) characteristic-based, and (c) return-based. The industry-based scheme relies on manager self-report investment strategies, philosophies, and portfolio characteristics. This scheme is simple and widely used among plan sponsors, investment management institutions, and data vendors such as Morningstar and Lipper (Christopherson, 1995). The characteristic-based approach uses actual asset holdings of a fund. Brown and Goetzman (1997) argue that this approach is the most accurate although it might be subject to window dressing, and the data might be hard to find. The return-based method depends on past returns and regression models. Sharpe (1992) proposes a linear 12-asset-class model for classifying style. His model has become standard among practitioners (Lobosco, 1999). In Sharpe’s model, the funds’ returns are regressed against the returns of 12 asset classes. The coefficients represent estimated portfolio holdings or factor loadings. Sharpe tests his model with a sample of 395 funds during the period of 1985 to 1989. He finds that the model provides high predictive power of future returns for both stock and bond funds.
Brown and Goetzman (1997) point out that a nonlinearity problem might exist for actively managed funds because asset weights change over time. They propose an algorithm called general style classification, which can capture nonlinearity strategies by allowing the factor loadings or weights to change on a month-by-month basis. The authors test the model with all funds from Morningstar during the period of 1976 to 1995. Their model does reasonably well in explaining cross-sectional variations of the out-of-sample fund returns (about 33%). Brown and Goetzman (1997) also test the return-based scheme using several return models against the industry-based scheme. They find that the latter has relatively little power in explaining differential fund performance.
Chan et al. (2002) compare the return-based approach using Carhart (1997)’s four-factor model to the characteristic-based approach. Their sample period is between 1983 and 1997. They find that although the characteristic-based approach provides higher predicting power, the portfolio holdings based on the return-based model are more consistent with the self-reported portfolio holdings. Overall, many prior studies suggest that the return-based method is superior to the industry-based approach in explaining time-series and cross-sectional funds’ returns. The disadvantage of the return-based method is that the factor loadings can be inaccurate due to co-linearity among assets’ returns.
2.2. Performance Measurement and Evaluation Based on Style
Extensive research on mutual fund performance finds that on average active management underperforms passive benchmarks (Jensen, 1968; Elton, Gruber, Das, and Hlavka, 1993; Grinblatt and Titman, 1989). Chan et al. (2002) argue that this underperformance “puzzle” can be attributed to benchmark selection. They find evidence suggesting that growth-oriented funds outperform their style benchmarks while value-oriented funds do not. The finding of outperformance of growth-oriented funds is in line with a common belief among practitioners that growth funds are more likely to outperform their style (Chan et al., 2002; Coggin and Trzcinka, 1997). Frahm, G. and Huber, F. (2019) argue that using differential returns when comparing a strategy with a given benchmark, their sample funds beat the benchmark.
Style adjusted performance evaluation is widely used among practitioners. Christopherson (1995) argues that the use of style analysis for plan sponsors ensures that managers do what is assigned to them. Lobosco (1999) finds that by using style adjusted measure, the magnitude of underperformance of mutual funds is reduced significantly. Bogle (1998), however, criticizes the use of style analysis on performance evaluation. He argues that style adjusted measure helps managers who consistently underperform the market.
3. Sample and Style Model
3.1. Sample
We define global bond funds as U.S.-based funds whose investment objectives are to invest in worldwide bond markets including the U.S. bond market. We use Lipper Objective Code from CRSP Mutual Fund Database to classify our sample. The code is based on funds’ policy objectives and available from July 1998. Therefore, our sample period starts July 1998 and ends March 2022. There are 769 funds with the global income classification code (GLI) over the period. We remove 342 funds whose classification codes change at least once over the sample period. We remove five exchanged-traded funds and 106 funds with fewer than 37 consecutive monthly returns during the period. The 37-month criterion is to ensure that funds have at least 36 monthly returns for style estimation and one monthly return for the predictability test. Of the remaining 316 funds, we select the oldest and/or largest share class in case of multiple share classes. Our final sample consists of 103 unique global bond funds during the period of July 1998 to March 2022. About 40% of the sample (42 funds) started before 2000, with the earliest inception in 1981. The remaining (61 funds) started on or after 2000, with the latest in 2019.
We obtain return data from CRSP Mutual Fund Database. The fund returns are monthly total returns in U.S. dollars, assuming reinvestment of income and capital gain distributions. The returns are gross returns before sales charges but after management, administrative and 12b-1 fees. Of the 103 final sample funds, 27 funds (26%) have 60 monthly returns or fewer, 20 funds (19%) have between 61 and 120 monthly returns, 36 funds (35%) have between 121 and 180 monthly returns and the remaining 20 funds (20%) have more than 180 monthly returns. There are 13 funds with the maximum of 285 monthly returns.
Panel A of Table 1 reports summary statistics of the sample. The average monthly return and return standard deviation during the sample period are 0.24% and 1.61%, respectively. The mean Sharpe ratio is 0.09. Panel A of Table 1 also reports fund characteristic data (obtained from CRSP Mutual Fund Database). Fund size, measured by net assets as of December 1998 or inception date, whichever is later, ranges from $0.1 million to $1.33 billion, with the average of $156.6 million. The average age of the funds is about 156 months or 13 years (as of March 2022). The average expense ratio is 0.84% of net assets. The max load ranges from zero to as high as 5.58%.
3.2. Style Model
We use Sharpe (1992)’s rolling regression approach to analyze investment styles of the sample. We employ Sharpe’s procedure for several reasons. First, it is the standard of the industry for performance evaluation (Lobosco, 1999). Second, the procedure is easier to use and understand than other procedures such as the procedures proposed by Brown and Goetzman (1997) and Chan et al. (2002). Third, the estimated coefficients from the Sharpe’s factor model can be interpreted as portfolio weights on investable indexes (Brown and Goetzman, 1997). Therefore, the estimated portfolio weights can be used to track a fund’s asset reallocation. Fourth, the model provides explanatory power for future returns as well as other models such as those of Brown and Goetzman (1997), Chan et al. (2002), and factor analysis.
We use seven indexes, six bond and one equity indexes, to analyze asset allocations of global bond funds.4 Blake et al. (1993) suggest that in general fixed-income styles are formed on two dimensions; namely maturity and credit quality. We use 3-month T-bills (T-bills) to represent cash and cash-equivalent assets and five bond indexes to capture maturity and credit quality of bonds in the model. The five indexes are FTSE World Government Bond Index 1-3 years (WGB 1-3), 5-7 years (WGB 5-7) and 10+ years (WGB 10+), FTSE World Corporate Bond Index (CORP) and Bloomberg Emerging Market Bond Index (EMG). WGB 1-3 represents short-term bonds while WGB 5-7 and WGB 10+ represent intermediate- and long-term bonds, respectively. T-bills and the three WGB capture high credit quality. CORP represents world corporate bonds and capture medium quality while EMG captures low credit quality. We also add MSCI World Equity Index (WEQ) for the possibility that some of the funds’ assets may be allocated to equity.
Our seven-index model can be expressed as:
where Ri,t = monthly total return of fund ith at month t;
Ri,t =βi,1I1,t +βi,2I2,t + … +βi,7I7,t +εi,t
I1,t ,…, I7,t = monthly returns of T-bills, WGB 1-3, WGB 5-7, WGB 10+, CORP, EMG, and WEQ at month t;
βi.1,…, βi,7 = slope coefficients of fund ith for Index 1,…, 7; and
εi,t = residual return of fund ith at month t.
In eq. (1), each factor represents the return of each asset class in which the factors are the only source of correlation among fund returns. The sensitivities (loadings) represent exposures or weights of a fund to asset classes or fund’s style. The residual represents style deviation or selection return contributed by the fund manager.
To estimate the coefficients in the model, we minimize the variance of the error term subject to two constraints; the sum of all portfolio weights must be equal to 1, and each weight must be between 0 and 1. Specifically, we solve the following equation:
subject to , and 0 ≤ βij ≤ 1 for all j.
To allow for dynamic shift of styles, we estimate the slope coefficients in eq. (2) using a rolling approach with 36-month window. An estimation period is rolled over by one month for each estimation. For example, the first set of the coefficients is estimated using the return data from July 1998 to June 2001 for the month of June 2001. The second set is estimated using the data from August 1998 to July 2001 for the month of July 2001, and so on. The entire estimation period from July 1998 to March 2022 (i.e., the sample period) yields the maximum of 250 sets of the weights from June 2001 to March 2022 (called evaluation period) for each fund. The coefficients are not estimated if the number of monthly returns for an estimation period is less than 36. Therefore, funds that start after July 1998 or those that do not survive until March 2022 do not have all 250 sets of the coefficients.
Funds often reallocate their assets over time. The typical activity of active reallocation is market timing. It is possible that the 36-month window might not detect asset reallocation of the funds especially the reallocation that is temporary. To allow for this possibility, we also estimate the slope coefficients using a shorter window of 12 months. For comparison purpose, we keep the evaluation period of both 12- and 36-month windows the same. The first set of the coefficients is estimated for June 2001 using the return data from July 2000 to June 2001. The last set of the coefficients is estimated for March 2022 using the data from April 2021 to March 2022. To reduce noise of the shorter window and to increase confidence in the results, we perform bootstrap with 200 repetitions for the 12-month window.
As mentioned above, the estimated slope coefficients from eq. (2) are used to identify styles. They represent the weights of assets allocated among asset classes or passive portfolios that best represent the funds’ styles (Sharpe, 1992). The coefficients are also used to calculate the policy return and active return. The policy return (PR; also called passive return) is the sum of returns from passive portfolios. The active return (AR; also called tracking error or selection return) is the difference between actual return and the policy return or . The policy return and active return can be written as:
where PRit = policy return of fund ith at month t;
ARi,t = Ri,t – PRi,t
= the slope coefficients estimated over the corresponding 36 months from month t to t–35 or 12 months from month t to t–11; and
ARit = active return of fund ith at month t.
PR and AR are calculated over the evaluation period of June 2001 to March 2022. We also calculate predicted return and prediction error similar to PR and AR, respectively except that the slope coefficients are estimated using the preceding 36 and 12 months. Specifically, the predicted return and prediction error for month t are calculated from the coefficients estimated from month t–1 to t–36 for 36-month window and from month t–1 to t–12 for 12-month window. Therefore, the analysis period for the predicted return and the prediction error is from July 2001 to March 2022 (called prediction period).
3.3. Indexes
As mentioned above, we use T-bills, WGB 1-3, WGB 5-7, WGB 10+, CORP, EMG, and WEQ as loading factors for style analysis. As a broad-based benchmark for performance evaluation, we use FTSE World Government Bond Index of all maturities (WGB). Panel B of Table 1 presents descriptive statistics of the indexes over the sample period of July 1998 to March 2022. The average monthly returns of WGB 1-3, WGB 5-7 and WGB 10+ are 0.21%, 0.35% and 0.46%, respectively. The largest return of WGB 10+ reflects maturity premium. The average return of WGB is 0.32%. The return for CORP is 0.41%, compared to 0.64% for EMG and 0.66% for WEQ.
4. Results
We use a sample of 103 surviving and non-surviving U.S.-based global bond funds during the sample period from July 1998 to March 2022 to examine three topics: (a) the usefulness of style in explaining the variability of returns across time and across funds, (b) the use of style analysis to evaluate performance of global bond funds, and (c) the use of the seven-index model to investigate the dynamic of asset allocation. This section presents empirical results of the three areas under the study.
4.1. The Usefulness of Style Analysis on Global Bond Funds
In assessing the usefulness of style analysis on global bond funds, we examine (a) the explanatory power of investment styles on time-series returns of the funds, (b) the explanatory power of different styles on returns across funds, and (c) the explanatory power of styles on future returns among funds.
4.1.1. The Explanatory Power of Investment Styles on Time-Series Returns
The usefulness of the style factor model is determined by the ability to explain the time-series variability in returns on the sample bond funds. We examine the adjusted R2 of the seven-index model obtained from estimating eq. (2) for every fund. Table 2 reports the adjusted R2 of the style factor model for 36- (Panel A) and 12- (Panel B) month windows.
In Panel A of Table 2, the mean adjusted R2 of the model for the 36-month window is 80%, ranging from 15.83% to 98.12%. The standard deviation of the R2 is 15.21%. There is only one fund with the R2 less than 40%. Six of the funds have the R2 between 40% and 50%, and the remaining (96 funds) have the R2 above 50%. Compared to the 36-month window, both mean and median R2 of the 12-month window in Panel B of Table 3 are similar. The mean R2 for the 12-month window is about 80%, with the highest of 98.93%. The median is 84.61% and the standard deviation of the R2 is 16.81%. The fund with the lowest R2 for the 36-month window also has the lowest R2 for the 12-month window; however, the R2 for the 12-month window is much higher (26.56% vs. 15.83%). About 60% of the funds have higher R2 from the 12-month window than from the 36-month window. These funds tend to operate longer. The average age for these funds is about 10 months older than the age of the remaining funds. Overall, these findings suggest that the seven-index model captures investment styles of global bond funds well. These findings also suggest that both estimation windows provide similarly high explanatory power of investment styles in general; however, for funds that survive longer, a shorter estimating time interval (i.e., 12-month window) detects styles of bond funds better.
Using non-rolling regression, we find the mean adjusted R2 of the seven-index model to be 81.94% with the median of 85.29% (results not tabulated). Although both mean and median of the R2 for the non-rolling approach are higher than those for the rolling approach, they are not significantly different from those of the rolling approach for both windows. Further analysis shows that the adjusted R2 for the non-rolling approach drops as funds operate longer. The average R2 for the non-rolling regression drops from 87.44% for the first quartile (i.e., with the lowest number of monthly returns) to 76.78% for the last quartile (i.e., with the highest number of monthly returns). The difference in the R2 between the non-rolling regression and the 36-month window is insignificant for the first quartile while the difference is significant at 1% level for the last quartile (t-statistics = -7.31). The results are similar for the 12-month window (t-statistics = -3.95). These findings are consistent with the results in Table 2 above. They indicate that rolling regression approach provides higher explanatory power for a long estimation period because it allows dynamic shift of asset allocation.
Compared to the ten-index model used in Detzler (1999) study on international/global bond funds, the explanatory power of our seven-index model is higher. Detzler (1999) reports the adjusted R2 of 72%. The difference in the R2 of Detzler (1999)’s model and ours can be contributed to different model specifications and estimation procedures. Detzler (1999) uses ten indexes while we use seven indexes. The coefficients of Detzler (1999)’s model are estimated using non-rolling regression without the restrictions of positive weights and weight sum. The higher of the R2 of the seven-index model suggests that as few as seven factors can provide high explanatory power for global bond funds. The higher explanatory power of the model also indicates that the restrictions of positive weights and weight sum do not decrease but increase the explanatory power of the model. Our findings are consistent with the findings of Brown and Goetzman (1997) who conclude that Sharpe’s asset class model explains the time-series returns on equity mutual funds in their samples well. The empirical results in this part suggest that Sharpe (1992)’s style factor model is shown to perform well and better than the ten-index model in explaining time-series returns of global bond funds in the sample.
Next, we examine the average investment styles that global bond funds undertake during the evaluation period of June 2001 to March 2022. According to Sharpe (1992), the funds’ factor loadings can be interpreted as implied weights or asset allocation of the funds. Panel A of Table 2 presents the factor loadings using 36-month window, and Panel B of Table 2 presents the loadings using 12-month window. In terms of maturity, Panel A of Table 2 shows that the average fund allocates about 24% of assets to cash or cash equivalent assets (T-bills), 10% to short-term (WGB 1-3), 14% to intermediate-term (WGB 5-7), and 14% to long-term bonds (WGB 10+). In terms of quality, the average fund allocates about 61% to high quality bonds (the sum of T-bills, WGB 1-3, WGB 5-7, WGB 10+), 15% to medium quality bonds (CORP) and 20% of the assets to low quality bonds (EMG). The average fund also allocates about 4% to equity (WEQ). Comparing to Panel A for 36-month window, Panel B for 12-month window shows slightly lower allocation to cash or cash equivalent assets (I1), intermediate-term (I3), long-term (I4) bonds and equity (I7) while allocation to other assets is slightly higher. Corporate bonds (I5) constitute the largest difference (3.8%) in the allocation between 36- and 12-month windows. The second and third largest differences are for long-term government bonds (2.2%) and intermediate-term government bonds (2.1%), respectively.
4.1.2. The Usefulness of Style in Explaining the Returns across Funds
To examine whether differences in investment styles can explain cross-sectional returns of global bond funds, we follow Ibbotson and Kaplan (1999) by regressing annualized total returns (ATR) of the funds against annualized policy returns (APR). ATR and APR are computed by compounding monthly actual total return (R) and policy return (PR) over the evaluation period of June 2001 to March 2022. Panel A and B of Table 3 present the regression results for 36 and 12-month windows, respectively. In Panel A of Table 3, the seven-index model explains 90% of the variation in returns across the sample funds. The adjusted R2 of the regression for 12-month window in Panel B of Table 4 is 95%, significantly higher than the R2 using 36-month window in Panel A. The higher R2 of the 12-month window supports the findings in the previous section and suggests that a shorter estimating time interval detects style investment of the funds better and therefore provides higher explanatory power on actual returns across the funds.
The adjusted R2 of the seven-index model in both panels are higher than the 35% R2 reported in Ibbotson and Kaplan (1999) on a sample of balanced funds and pension funds over a 120-month period. In a related study, Brown and Goetzman (1997), using different methods from this study, find that the average explanatory power of the Sharpe (1992) style model on the equity funds in their sample is about 35%. The results in this sub-section indicate that difference in bond fund styles estimated by our seven-index model explains cross-sectional returns of bond funds better than those of the sample of the equity, balanced, and pension funds reported in previous studies. This finding supports Blake et al. (1993)’s argument that modeling for bond funds is much simpler than that for equity funds because of fewer factors affecting bond funds. We argue that this is one of many important reasons why style analysis should be used to evaluate bond fund performance.
4.1.3. The Explanatory Power of Styles on Future Returns
In the previous two sections, we find that the seven-index model explains both time-series and cross-sectional returns of global bond funds well especially when compared to prior studies. In this section, we examine the predictive power of the model for the bond funds. We calculate the ratio of one plus predicted return to one plus total return.5 The ratio of one would indicate that a fund strictly follows its investment style. Thus, the style benchmark return explains 100% of its total return. If the ratio is smaller or greater than one, it would suggest that a fund does not strictly follow its style benchmark. Panel A.1 and B.1 of Table 4 present the results for 36- and 12-month windows. As shown in both panels, the ratios are close to one on average and for all four sub-periods. These results indicate that the style benchmark returns from both 36- and 12-month windows explain almost all of the total return in the bond funds.
In Panel A.2 and B.2 of Table 4, we report the prediction error and absolution prediction error sorted by the prediction error for 36- and 12-month windows. The prediction error is defined as the difference between total return and predicted return. In Panel A.2 for 36-month window, the average prediction error is –5.93 basis points per month, significant at the 1% level. The average absolute prediction error is 0.48% per month, significant at the 1% level. When partitioning the sample into quartile based on the prediction error, we find that the average prediction error for the first quartile is 0.12% and –0.27% for the last quartile. Using the 12-month window (Panel B.2 of Table 4), the average prediction error is –9.24 basis points per month, significantly lower than the prediction error of 36-month window (t-statistics = -2.16). The average absolute prediction error for 12-month window is 0.49% per month, insignificantly different from the absolute prediction error for 36-month. Compared to the characteristic-based style model in Chan et al. (2002), our style model yields much smaller prediction errors for both 36- and 12-month windows. Chan et al. (2002) report a mean error of 1.02% and a mean absolute error of 1.77% per month for growth-oriented funds, and a mean error of –1.07% and mean absolute error of 2.08% per month for value-oriented funds. The results in Table 4 indicate that bond fund styles explain the future returns reasonably well.
The results in this section lead to the conclusion that during the study period, Sharpe (1992)’s inspired style model is better than other multi-factor models, such as the ten-index-model in Detzler (1999), in explaining the variation of returns of global bond funds across time and across funds, as well as in predicting future returns of the funds. These findings also provide further evidence that style analysis is appropriate for performance evaluation of bond funds because the style model performs well when compared to other model specifications and performs better when applied to bond funds than when applied to equity funds.6 The results in this section further suggest that a shorter estimating time interval (i.e., 12 months) detects styles of bond funds better than a longer time interval (i.e., 36 months) because the shorter interval allows asset reallocation of funds. For brevity, we will discuss only the results of 12-month window for the remaining of the paper, and footnote the results of 36-month window if they are different from those of 12-month window.
4.2. Style-Adjusted Performance of Global Bond Funds
In this section, we use style analysis in constructing benchmarks to evaluate performance of global bond funds. We also compare performance of the funds using their policy returns to performance using WGB as the broad-based benchmark. Specifically, we calculate annual holding period returns of monthly active returns and holding period returns of monthly benchmark-adjusted returns. The active return (AR) is the difference between actual total return (R) and policy return from the seven-index model. The benchmark-adjusted return (R – WGB) is the difference between R and the broad-based benchmark index, WGB. Panel A of Table 5 reports the results of all funds.
According to style-adjusted performance evaluation, AR can be considered as a measurement of fund managers’ contribution. Managers who pursue a passive strategy might merely need to mimic the returns of their style benchmarks and to allocate fund assets accordingly. Thus, AR is expected to be minimal. On the other hand, managers who adopt an active strategy may seek to deviate from their styles to outperform the style benchmarks. Therefore, AR can be significant. In Row 1 of Panel A of Table 5, the average annual AR is about -0.6%, significant at the 1% level. This finding provides evidence against actively managed strategy. It indicates that managers are better off mimicking their style benchmarks instead of deviating from them. Considering that the average expense ratio of the funds is 0.84% per year, the performance of the 103 bond funds in our sample is better than the performance of average managed equity funds found in various studies.
Row 2 of Panel A of Table 5 reports the performance of bond funds relative to WGB. The average return of the funds relative to the broad-based benchmark is 0.12%, insignificantly different from zero. Adjusted for expense ratio of 0.84%, the average fund does not underperform the broad-based benchmark index but outperforms the index by 0.96% before expenses. Compared to the broad-based benchmark index, the underperformance relative to the style-adjusted return in Row 1 is significantly larger. The difference between the style-adjusted return and the WGB-adjusted return is -0.82% (last row). These findings suggest that using two different benchmarks, style and broad-based, provide different reading regarding performance of bond funds in our sample.
Because survivorship affects performance evaluation and our sample consists of both surviving and non-surviving funds, we partition the sample into two sub-samples; funds that survive until the end of sample period (March 2022) and those that do not survive. Panel B of Table 5 reports the results of the survivors and Panel C reports the results of the non-survivors. As expected, the survivors outperform the non-survivors based on both style and broad-based benchmarks. The style-adjusted return for the surviving funds in Panel B is -0.44%, compared to -0.85% for the non-surviving funds in Panel C. Similarly, the broad-based adjusted return is significantly positive (0.99%) for the survivors, but significantly negative (-1.25%) for the non-survivors. The difference between the style-adjusted performance and the broad-based adjusted performance for the survivors is much larger (-1.55%) than the difference between the two benchmarks for the non-survivors (0.34%). Overall, the results in Panel B and C support the results in Panel A that the style-adjusted and broad-based benchmarks provide different readings. The difference is more pronounced for survivors than non-survivors.
These findings are consistent with Chan et al. (2002) who suggest that performance evaluation is sensitive to benchmark selection. However, the degree of underperformance of the bond funds in our sample is greater when using style model than using broad-based benchmark while Chan et al. (2002) conjecture the opposite. Our results suggest that skills of bond fund managers do not contribute to higher returns for the funds. These results support the notion that taking investment style into account helps performance evaluation by giving a clearer picture of the manager’s skill (Chan et al., 2002).
4.3. How Stable Is the Style?
There are reasons to believe that active bond fund managers reallocate assets over time. The typical activity of active reallocation is market timing. We analyze the extent to which the reallocation might affect the fund styles. The investment styles are averaged across funds each month and reported in Figure 1. The vertical axis represents implied weights or asset allocation; the weights are summed to 100%. The horizontal axis represents the evaluation period from June 2001 to March 2022. Each horizontal segment on the graph represents the average weight of each investment style undertaken by the funds in the sample. There are seven horizontal segments representing seven asset classes from the seven-index model. For example, in June 2001, the average sample fund holds about 18% of the assets in cash (I1), 6% in short-term (I2), 30% in intermediate-term (I3), 21% in long-term (I4), 14% in world corporate bonds (I5), 8% in emerging market bonds (I6), and 2% in equity (I7).
Over the period, the asset allocation of the funds is rather volatile.7 In term of maturity, the allocation to short-term bonds (I2) is the least volatile while the volatility of other two maturity categories is similarly higher. The allocation to short-term bonds ranges from 2% to 19%. The allocations to intermediate-term bonds (I3) and long-term bonds (I4) range from 4% to 31% and from 5% to 31%, respectively. The allocation of cash (I1) is between 12% and 39%. In term of quality, the allocation to emerging market bonds (I6) is the most volatile when compared to the allocations to world corporate bonds (I5) and to the high-quality bonds. The allocation to low quality bonds (I6) ranges from 5% to 36%, with the average of 16%. The allocation to world corporate bonds (I5) ranges from 3% to 38%, with the average of 13%. The weight of equity is the most stable, ranging from 0.6% to 11%, with the average of 4%.
Comparing between the first sub-period (June 2001 to October 2011) and the second sub-period (November 2011 to March 2022), the allocations of cash (I1), short-term government bonds (I2), long-term government bonds (I4) and equity (I7) are relatively stable. However, the allocations of intermediate-term government bonds (I3), corporate bonds (I5) and emerging market bonds (I6) change over the periods. Specifically, funds shift allocations among intermediate-term, corporate and emerging market bonds. There are three major shifts: June 2001 to February 2007, February 2007 to February 2010, and May 2012 to June 2014. From June 2001 to February 2007, the shift was to intermediate-term bonds. The allocation to intermediate-term bonds was highest (20-30%) while the allocation emerging market bonds was low (5-15%). Since February 2007, the allocation to intermediate-term bonds dropped and stayed below 20% for almost all months. From February 2007 to February 2010, the shift was from intermediate-term bonds to corporate bonds. The allocation to corporate bonds increased from 2.5% in February 2007 to the peak of 38% in February 2010. The allocation of corporate bonds declined after that to the range of 5-15%. From May 2012 to June 2014, the shift was from intermediate-term and corporate bonds to emerging market bonds. The allocation to emerging market bonds rose from 7% in May 2012 to the highest of 34% in April 2012. Since May 2012, the allocation to emerging market bonds has been above 15%. The shifts from intermediate-term bonds to corporate bonds and to emerging market bonds for higher returns coincide with the period of declining interest rates that started in 2008.
The results in this section suggest that global bond fund managers reallocate assets over time. During the evaluation period of 2001 to 2022, the funds mainly shift from intermediate-term bonds to corporate bonds and from corporate bonds to emerging market bonds. These results confirm our earlier conclusion that dynamic style analysis is needed for performance evaluation of bond funds.
5. Conclusion
This study is the first to use a dynamic style analysis based on Sharpe (1992) to analyze various aspects of global bond funds during the sample period of July 1998 to March 2022. This study has two main objectives: (a) to examine the usefulness of style analysis on the global funds and (b) to evaluate the style-adjusted performance of global funds.
We find that the Sharpe’s (1992) style model is an appropriate approach for global bond funds performance evaluation because of its high explanatory power and low prediction errors. On time-series, both static and dynamic seven-index models provide higher adjusted R-squared than the models in prior studies such as Detzler 's (1999) 10-index model. On cross-sectional, the dynamic seven-index model performs much better than the models of equity funds. On predictive power of future returns, the prediction error of the seven-index model is lower than the prediction errors reported by prior studies such as Chan et al. (2002). Our results support the findings of Blake et al. (1993) and our earlier argument that the style model is more robust to use on bond funds.
The sample funds perform worse when evaluated under the style-adjusted benchmarks than when evaluated under the broad-based benchmark. However, the underperformance of surviving funds is less than the average expense ratio and the underperformance of non-surviving funds is much larger. Over the evaluation period of 2001 to 2022, the asset allocation of the sample funds is relatively volatile. The funds mainly shift from intermediate-term bonds to corporate bonds and then to emerging market bonds to seek higher returns since 2008.
Overall, Sharpe’s (1992) style analysis, notwithstanding its shortcomings, is shown to perform well in measuring and evaluating performance of global bond funds in our sample. Other developed procedures such as the Brown and Goetzman (1997) might be, in some aspects, superior to Sharpe’s procedure in identifying fund investment styles. The main benefits of Sharpe’s style analysis procedure rest in its simplicity and reasonable accuracy in grouping funds according to their investment behaviors. Investors and plan sponsors need a simple and accurate classification scheme to differentiate managers and mutual funds from the vast number of funds and managers and to evaluate them accordingly. As Sharpe (1992) puts it, amid an ocean of funds from which to choose, grouping managers/funds according to their styles helps us create “order out of chaos.” This study furthers the understanding of applying Sharpe’s style model to measuring and evaluating global bond funds.
References
- Aggrawal, V.; Naik, N. Generalized style analysis of hedge funds, Journal of Asset Management 2000, 1, 93–10. 2000; 1.
- Barberis, N.; Shleifer, A. Style Investing. Journal of Financial Economics 2003, 68, 161–99. [Google Scholar] [CrossRef]
- Bernstein, R. (1995). Style Investing. New York: Wiley.
- Blake, C.R.; Elton, E.J.; Gruber, M.J. The performance of bond mutual funds. Journal of Business 1993, 66, 371–403. [Google Scholar] [CrossRef]
- Bogle, J.C. The implication of style analysis for mutual fund performance evaluation. Journal of Portfolio Management 1998, 24, 34–42. [Google Scholar] [CrossRef]
- Brown, S.J.; Goetzman, W.N. Mutual fund styles. Journal of Financial Economics 1997, 43, 373–99. [Google Scholar] [CrossRef]
- Carhart, M.M. On persistence in mutual fund performance. Journal of Finance 1997, 52, 57–82. [Google Scholar] [CrossRef]
- Chan, L.K.; Chen, H.L.; Lakonishok, J. On mutual fund investment styles. Review of Financial Studies 2002, 15, 1407–37. [Google Scholar] [CrossRef]
- Christopherson, J.A. Equity style classification. Journal of Portfolio Management 1995, 21, 32–43. [Google Scholar] [CrossRef]
- Coggin, T.D.; Trzcinka, C. (1997). Analyzing the performance of equity managers: A note on value versus growth. In T. D. Coggin, F.J. Fabozzi & R. D. Arnott (Eds.), The handbook of equity style management, 2nd edition (pp. 167-70): Frank J. Fabozzi Associates.
- Cooper, M.J.; Gulen, H.; Rau, P.R. Changing names with style: Mutual fund name changes and their effects on fund flows. Journal of Finance 2005, 60, 2825–58. [Google Scholar] [CrossRef]
- Detzler, M.L. The Performance of Global Bond Mutual Funds. Journal of Banking & Finance 1999, 23, 1195–217. [Google Scholar]
- Elton, E.J.; Gruber, M.J.; Das, S.; Hlavka, M. Efficiency with costly information: A reinterpretation of evidence from managed portfolio. Review of Financial Studies 1993, 6, 1–22. [Google Scholar] [CrossRef]
- Ferson, W.; Henry, T.R. & Kisgen, D.J. Evaluating government bond fund performance with stochastic discount factors. Review of Financial Studies 2006, 19, 423–55. [Google Scholar]
- Frahm, G. & Huber, F. The outperformance probability of mutual fund. Journal of Risk and Financial Management 2019, 12, 108. [Google Scholar] [CrossRef]
- Fung, W.; Hsieh, D.A. Survivorship bias and investment style in the returns of CTAs. Journal of Portfolio Management 1997, 24, 30. [Google Scholar] [CrossRef]
- Grinblatt, M.; Titman, S. Mutual fund performance: An analysis of quarterly portfolio holdings. Journal of Business 1989, 62, 393–416. [Google Scholar] [CrossRef]
- Ibbotson, R.G.; Kaplan, P.D. Does asset allocation policy explain 40, 90 or 100 percent of performance? Financial Analysts Journal 1999, 56, 26–33. [Google Scholar] [CrossRef]
- Jensen, M.C. The performance of mutual funds in the period of 1945 - 1964. Journal of Finance 1968, 23, 389–416. [Google Scholar]
- Kahn, R.N. Bond managers need to take more risks. Journal of Portfolio Management 1998, 24, 70–6. [Google Scholar] [CrossRef]
- Lobosco, A. Style/risk-adjusted performance. Journal of Portfolio Management 1999, 25, 65–8. [Google Scholar] [CrossRef]
- Polwitoon, S.; Tawatnuntachai, O. Diversification Benefits and Persistence of U.S.-Based Global Bond Funds. Journal of Banking & Finance 2006, 30, 2767–86. [Google Scholar]
- Sharpe, W.F. Asset allocation management style and performance measurement. Journal of Portfolio Management 1992, 18, 7–19. [Google Scholar] [CrossRef]
- Toe, M.; Woo, S. Style effects in the cross-sectional returns. Journal of Financial Economics 2004, 74, 367–98. [Google Scholar]
- Tsolas, I.E. The Determinants of the Performance of Precious Metal Mutual Funds, Journal of Risk and Financial Management 2020, 13, 86. 13. [CrossRef]
- Wang, K.Q. Multifactor evaluation of style rotation. Journal of Financial and Quantitative Analysis 2005, 40, 349–72. [Google Scholar] [CrossRef]
| 1 | Blake, Elton, and Gruber (1993) and Kahn (1998) are among the very few studies that directly and indirectly address investment styles of bond funds by using different models including Sharpe’s (1992) to evaluate bond fund performance. |
| 2 | For the economic significance of global bond funds, see Polwitoon and Tawatnuntachai (2006). |
| 3 | For the more recent theoretical and empirical works on style investment, see Barberis and Shleifer (2003), Cooper, Gulen, and Rau (2005), Toe and Woo (2004), and Wang (2005). |
| 4 | In an earlier version, we use the eight-index model which consists of three factors for maturity, three factors for credit, and two factors for equity. The results of the eight-index model are qualitatively similar to those presented in the paper. However, the adjusted R-squared of the eight-index model is smaller than the R-squared of the seven-index model presented above |
| 5 | We calculate the ratio of one plus predicted return to one plus total return rather than the ratio of predicted return to total return to eliminate the problem of zero return. The average ratio of one plus predicted return to one plus total return can also be viewed as the ratio of average terminal wealth. |
| 6 | In our earlier version using 62 global funds during the period of 1993 to 1999, we reach the same conclusions as above. |
| 7 | The asset allocations using the 36-month estimating time interval are more stable especially when compared to the allocations of the 12-month estimating time interval. |
Figure 1.
Asset Allocation of Global Bond Funds. This figure shows implied weights or asset allocations of 103 global bond funds during the evaluation period of June 2001 to March 2022. The implied weights are estimated from the seven-index model using 12-month rolling regression. Each area represents average weight of the funds on a specific style. The seven indexes consist of 3-month T-bills (T-bills), representing cash and high quality, FTSE World Government Bond Index (WGBI) 1-3 years (WGB 1-3), representing short-term and high quality, WGBI 5-7 years (WGB 5-7), representing intermediate-term and high quality, WGBI 10+ years (WGB 10+), representing long-term and high quality, FTSE World Corporate Bond Index (CORP), representing medium quality, Bloomberg Emerging Market Bond Index (EMG), representing low quality, and MSCI World Equity Index (WEQ), representing equity.
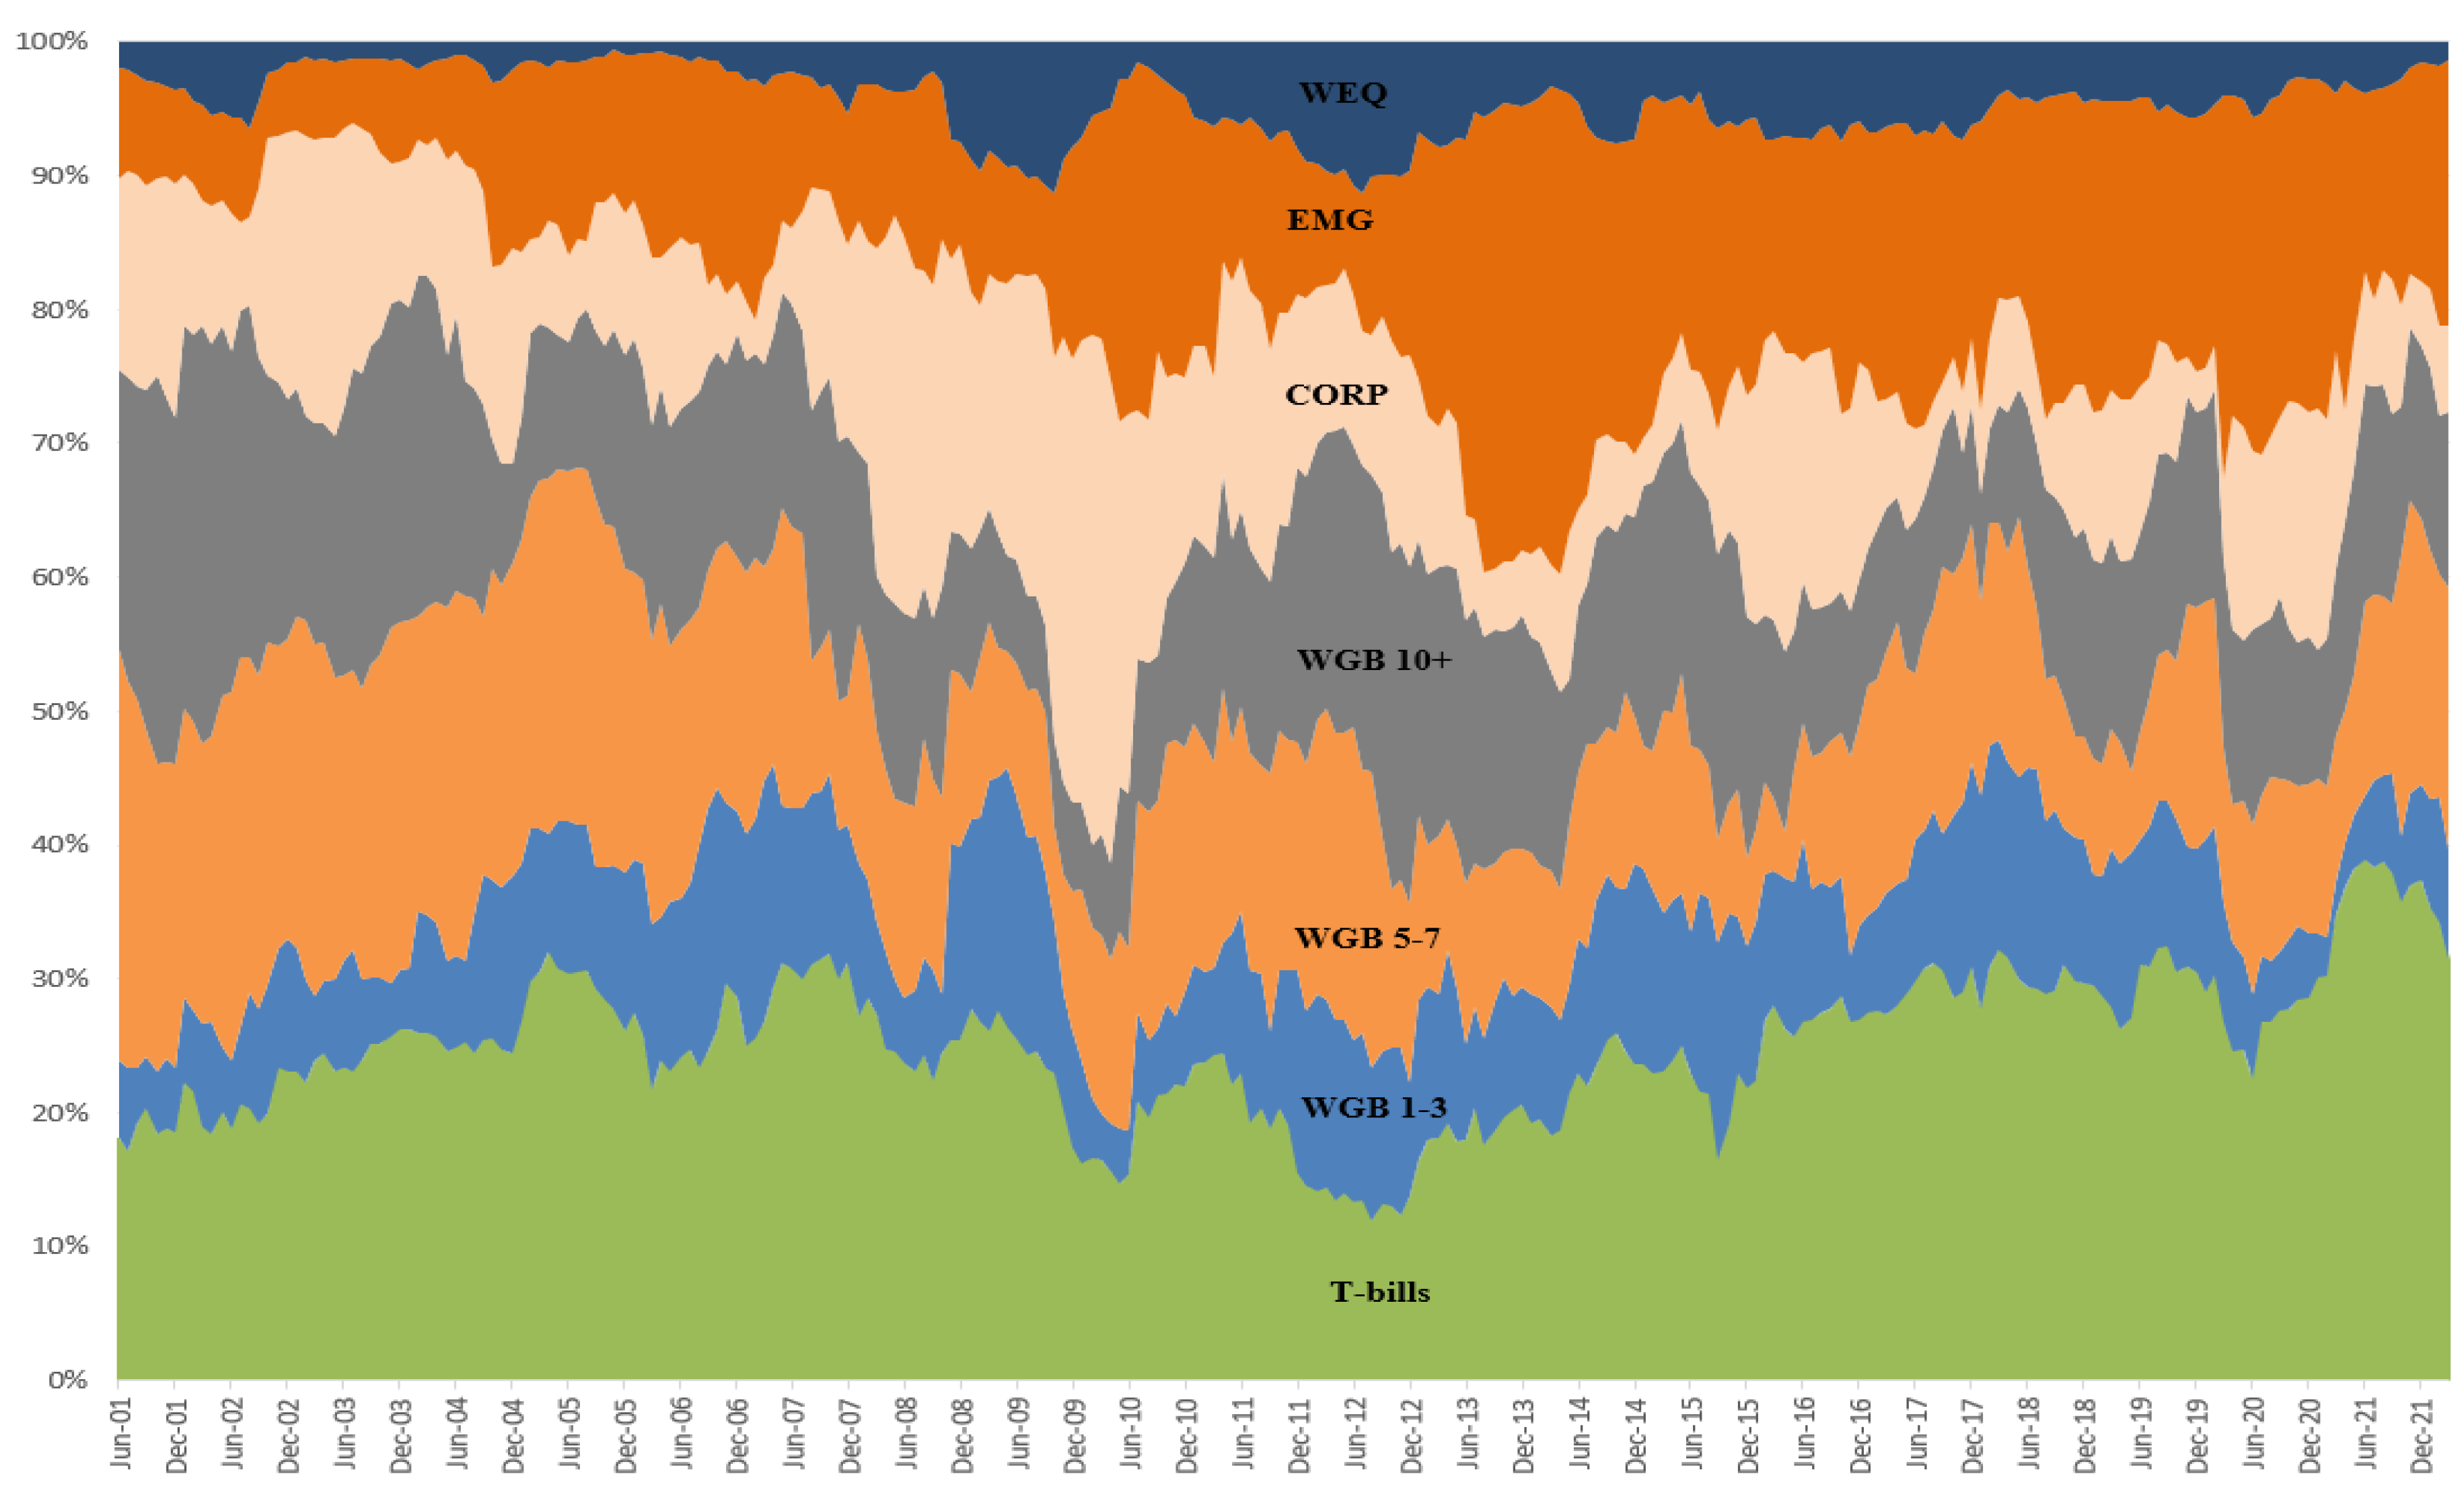

Table 1.
Descriptive Statistics of Global Bond Funds and Indexes. This table presents descriptive statistics of global bond funds and indexes. Global bond funds include 103 surviving and non-surviving funds that invest in both international and U.S. bond markets during the sample period of July 1998 to March 2022. Indexes consist of 3-month T-bills (T-bills), FTSE World Government Bond Index (WBGI) 1-3 years (WGB 1-3), WGBI 5-7 years (WGB 5-7), WGBI 10+ years (WGB 10+), FTSE World Corporate Bond Index (CORP), Bloomberg Emerging Market Bond Index (EMG), MSCI World Equity Index (WEQ), and WGBI all maturities (WGB). The return in both panels is monthly return, and standard deviation is standard deviation of monthly returns. Sharpe ratio is the monthly return in excess of T-bills divided by return standard deviation. Net assets are market values of assets under management as of December 1998 or inception date, whichever is later. Age is number of months that a fund has been in operation or until March 2022. Expense ratio is total annual expense including 12b-1 fee expressed as percent of net assets charged by a fund. Load is the maximum between front-load and back-end load, expressed as percent of offer price. In Panel A, the variables except the standard deviation are first averaged across the sample period for each fund, and then calculated across funds. N is the number of funds with available information.
| Panel A: Global Bond Funds | |||||||||
| Variables | N | Mean | SD | Min | Median | Max | |||
| Return (%) | 103 | 0.2371 | 0.1306 | -0.1194 | 0.2296 | 0.6067 | |||
| Standard Deviation (%) | 103 | 1.6142 | 0.4817 | 0.5053 | 1.6901 | 2.6259 | |||
| Sharpe Ratio | 103 | 0.0873 | 0.1071 | -0.2126 | 0.1030 | 0.3455 | |||
| Net Assets ($Million) | 103 | 156.6019 | 254.1281 | 0.1000 | 57.2000 | 1,327.2000 | |||
| Age (Months) | 103 | 156.1748 | 99.1854 | 38.0000 | 141.0000 | 428.0000 | |||
| Expense Ratio (%) | 71 | 0.8391 | 0.3417 | 0.1736 | 0.7529 | 1.9560 | |||
| Load (%) | 40 | 2.0207 | 1.8866 | 0.0000 | 1.0000 | 5.5833 | |||
| Panel B: Return of Indexes | |||||||||
| Index | Mean | SD | Min | Median | Max | ||||
| T-bills | 0.1435 | 0.1603 | -0.0065 | 0.0875 | 0.5949 | ||||
| WGB 1-3 | 0.2111 | 1.4441 | -3.8961 | 0.1587 | 5.4463 | ||||
| WGB 5-7 | 0.3456 | 1.9561 | -4.9540 | 0.2156 | 7.0334 | ||||
| WGB 10+ | 0.4604 | 2.5935 | -7.8288 | 0.3101 | 9.4802 | ||||
| CORP | 0.4109 | 1.8614 | -8.2989 | 0.4099 | 8.3243 | ||||
| EMG | 0.6426 | 3.0586 | -25.5636 | 0.8322 | 8.6914 | ||||
| WEQ | 0.6608 | 4.4852 | -18.9354 | 1.3466 | 12.8270 | ||||
| WGB | 0.3177 | 1.8871 | -5.0273 | 0.2081 | 7.1126 | ||||
Table 2.
Sharpe’s Implied Weights and Adjusted R-Squared of the Seven-Index Model. This table reports estimated asset allocation of 103 global bond funds over the evaluation period of June 2001 to March 2022, and adjusted R-squared of the seven-index model. The asset allocation is estimated from the dynamic, seven-index model using 36- and 12-month windows. The seven indexes include 3-month T-bills (T-bills), FTSE World Government Bond Index (WGBI) 1-3 years (WGB 1-3), WGBI 5-7 years (WGB 5-7), WGBI 10+ years (WGB 10+), FTSE World Corporate Bond Index (CORP), Bloomberg Emerging Market Bond Index (EMG), and MSCI World Equity Index (WEQ). T-bills represents cash, WGB 1-3 represents short-term/high quality, WGB 5-7 represents intermediate-term/high quality, WGB 10+ represents long-term/high quality, CORP represents medium quality, EMG represents low quality, and WEQ represents equity. The asset allocation at month t is estimated using 36 monthly returns from month t to t-35 in Panel A, and 12 monthly returns from month t to t-11 in Panel B. The estimated asset allocation and adjusted R-squared are first averaged across the estimation period for each fund, and then calculated across 103 funds.
| Panel A: 36-Month Window | ||||||
| Variables | Index | Mean | SD | Min | Median | Max |
| I1 | T-bills | 0.2389 | 0.2452 | 0.0000 | 0.1301 | 0.8107 |
| I2 | WGB 1-3 | 0.0965 | 0.1122 | 0.0000 | 0.0540 | 0.4180 |
| I3 | WGB 5-7 | 0.1351 | 0.1660 | 0.0000 | 0.0671 | 0.7824 |
| I4 | WGB 10+ | 0.1362 | 0.1050 | 0.0000 | 0.1293 | 0.4610 |
| I5 | CORP | 0.1545 | 0.1432 | 0.0000 | 0.1190 | 0.7600 |
| I6 | EMG | 0.1960 | 0.1525 | 0.0000 | 0.1632 | 0.7046 |
| I7 | WEQ | 0.0428 | 0.0661 | 0.0000 | 0.0203 | 0.5094 |
| Adj. R2 | 0.7996 | 0.1521 | 0.1583 | 0.8396 | 0.9812 | |
| Panel B: 12-Month Window | ||||||
| Variables | Index | Mean | SD | Min | Median | Max |
| I1 | T-bills | 0.2513 | 0.2247 | 0.0000 | 0.1905 | 0.7913 |
| I2 | WGB 1-3 | 0.0896 | 0.0832 | 0.0000 | 0.0722 | 0.3318 |
| I3 | WGB 5-7 | 0.1559 | 0.1655 | 0.0003 | 0.0862 | 0.6669 |
| I4 | WGB 10+ | 0.1583 | 0.1007 | 0.0000 | 0.1448 | 0.4806 |
| I5 | CORP | 0.1163 | 0.0874 | 0.0029 | 0.0934 | 0.4205 |
| I6 | EMG | 0.1764 | 0.1213 | 0.0037 | 0.1528 | 0.5361 |
| I7 | WEQ | 0.0522 | 0.0625 | 0.0005 | 0.0364 | 0.5003 |
| Adj. R2 | 0.7957 | 0.1681 | 0.2656 | 0.8461 | 0.9893 | |
Table 3.
Explanatory Power of Style on Cross-Sectional Returns. This table reports the regression results of the model ATRi = αi + βiAPRi + εi for 103 global bond funds. ATRi is the annual total return and APRi is the annual policy return of fund i. ATR and APR are computed by compounding monthly actual total return (R) and policy return (PR) over the evaluation period of June 2001 to March 2022. PR is the return estimated from the dynamic, seven-index model using 36- and 12-month windows. PR at month t is estimated using 36 monthly returns from month t to t-35 in Panel A, and using 12 monthly returns from month t to t-11 in Panel B.
| Panel A: 36-Month Window | |||
| Coefficient | t-statistic | p-value | |
| Intercept | -0.5490 | -2.5895 | 0.0110 |
| APR | 0.9884 | 29.8532 | <.0001 |
| F-statistic | p-value | ||
| Adj. R2 | 89.72% | 890.97 | <.0001 |
| Panel B: 12-Month Window | |||
| Coefficient | t-statistic | p-value | |
| Intercept | -0.6765 | -4.3898 | <.0001 |
| APR | 1.0173 | 42.2981 | <.0001 |
| F-statistic | p-value | ||
| Adj. R2 | 94.6% | 1,789.48 | <.0001 |
Table 4.
Predicting Ability of Styles on Future Returns. This table reports the predicting ability of styles on future returns over the prediction period of July 2001 to March 2022. The predicted return is the return predicted by the dynamic, seven-index model with 36- and 12-month windows. The predicted return at month t is estimated from the model using 36 monthly returns from month t-1 to t-36 in Panel A and using 12 monthly returns from month t-1 to t-12 in Panel B. In Panel A.1 and B.1, the ratio of predicted return to total return is the ratio of one plus monthly predicted return to one plus monthly actual total return. The ratio is first averaged across the entire period for each fund, and then calculated across funds. N is the number of funds. In Panel A.2 and B.2, prediction error is the difference between monthly total return and predicted return. Absolute error is absolute prediction error. The numbers in Panel A.2 and B.2 are mean monthly returns across funds i.e., the returns are first averaged across the evaluation period for each fund, and then across funds.
| Panel A: 36-Month Interval | ||||||||||
| Panel A.1: Ratio of Predicted Return to Total Return | ||||||||||
| Period | N | Mean | SD | Min | Median | Max | ||||
| 7/01-9/06 | 35 | 1.0004 | 0.0019 | 0.9944 | 1.0005 | 1.0047 | ||||
| 10/06-11/11 | 47 | 1.0004 | 0.0022 | 0.9954 | 1.0002 | 1.0082 | ||||
| 12/11-1/17 | 69 | 1.0010 | 0.0019 | 0.9964 | 1.0009 | 1.0096 | ||||
| 2/17-3/22 | 79 | 1.0004 | 0.0015 | 0.9961 | 1.0003 | 1.0061 | ||||
| Average | 103 | 1.0006 | 0.0017 | 0.9944 | 1.0005 | 1.0061 | ||||
| Panel A.2: Prediction Error | ||||||||||
| Quintile | Total Return | Predicted Return | Prediction Error | Absolute Error | ||||||
| Highest | 0.3384 | 0.2140 | 0.1244 | 0.5159 | ||||||
| 2 | 0.2291 | 0.2475 | -0.0183 | 0.4595 | ||||||
| 3 | 0.2256 | 0.3031 | -0.0775 | 0.3708 | ||||||
| Lowest | 0.1939 | 0.4679 | -0.2741 | 0.5921 | ||||||
| Average | 0.2473 | 0.3066 | -0.0593 | 0.4835 | ||||||
| Panel B: 12-Month Interval | ||||||||||
| Panel B.1: Ratio of Predicted Return to Total Return | ||||||||||
| Period | N | Mean | SD | Min | Median | Max | ||||
| 7/01-9/06 | 35 | 1.0009 | 0.0019 | 0.9959 | 1.0007 | 1.0065 | ||||
| 10/06-11/11 | 47 | 1.0012 | 0.0030 | 0.9953 | 1.0006 | 1.0095 | ||||
| 12/11-1/17 | 69 | 1.0009 | 0.0019 | 0.9970 | 1.0008 | 1.0112 | ||||
| 2/17-3/22 | 79 | 1.0008 | 0.0012 | 0.9968 | 1.0006 | 1.0038 | ||||
| Average | 103 | 1.0010 | 0.0015 | 0.9959 | 1.0007 | 1.0065 | ||||
| Panel B.2: Prediction Error | ||||||||||
| Quintile | Total Return | Predicted Return | Prediction Error | Absolute Error | ||||||
| Highest | 0.3299 | 0.2676 | 0.0623 | 0.5379 | ||||||
| 2 | 0.1000 | 0.1498 | -0.0498 | 0.4332 | ||||||
| 3 | 0.2847 | 0.3848 | -0.1001 | 0.3617 | ||||||
| Lowest | 0.2755 | 0.5650 | -0.2895 | 0.6370 | ||||||
| Average | 0.2473 | 0.3396 | -0.0924 | 0.4910 | ||||||
Table 5.
Annual Holding Period Returns of Global Bond Funds. This table reports annual style-adjusted and broad-based-adjusted holding period returns (HPR, %) of 103 global bond funds over the evaluation period of June 2001 to March 2022. The style-adjusted return (AR) is the difference between actual total return (R) and policy return (PR) estimated from the dynamic, seven-index model using 12-month window. The broad-based-adjusted return (R – WGB) is the difference between actual total return (R) and FTSE World Government Bond Index all maturities (WGB) used as a broad-based benchmark. The Difference in the last row is the difference between AR and (R – WGB). N is the number of funds. Panel B is for funds that survive until March 2022 and Panel C is for funds that were defunct prior to March 2022. a and b represent 1% and 5% significant levels.
| Panel A: All | ||||||
| HPR | N | Mean | SD | Min | Median | Max |
| AR | 103 | -0.6019a | 1.2963 | -5.8717 | -0.4528 | 2.9252 |
| R – WGB | 103 | 0.1206 | 2.6310 | -13.4732 | 0.6135 | 7.1523 |
| Difference | 103 | -0.8193a | 2.5075 | -5.5617 | -1.1478 | 17.1881 |
| Panel B: Survivors | ||||||
| HPR | N | Mean | SD | Min | Median | Max |
| AR | 63 | -0.4441a | 0.9101 | -3.1863 | -0.3261 | 1.7748 |
| R – WGB | 63 | 0.9915a | 1.2073 | -2.2825 | 0.9894 | 4.2450 |
| Difference | 63 | -1.5553a | 1.2269 | -5.5617 | -1.5476 | 0.6792 |
| Panel C: Non-survivors | ||||||
| HPR | N | Mean | SD | Min | Median | Max |
| AR | 40 | -0.8503a | 1.7247 | -5.8717 | -0.7944 | 2.9252 |
| R – WGB | 40 | -1.2511b | 3.5541 | -13.4732 | -0.9085 | 7.1523 |
| Difference | 40 | 0.3398 | 3.4349 | -3.9808 | 0.0407 | 17.1881 |
Disclaimer/Publisher’s Note: The statements, opinions and data contained in all publications are solely those of the individual author(s) and contributor(s) and not of MDPI and/or the editor(s). MDPI and/or the editor(s) disclaim responsibility for any injury to people or property resulting from any ideas, methods, instructions or products referred to in the content. |
© 2024 by the authors. Licensee MDPI, Basel, Switzerland. This article is an open access article distributed under the terms and conditions of the Creative Commons Attribution (CC BY) license (https://creativecommons.org/licenses/by/4.0/).
Copyright: This open access article is published under a Creative Commons CC BY 4.0 license, which permit the free download, distribution, and reuse, provided that the author and preprint are cited in any reuse.


